Embed Size (px)
Citation preview

Free and Total Plasma Cortisol Measured byImmunoassay and Mass Spectrometry FollowingACTH1–24 Stimulation in the Assessment of PituitaryPatients
Morton G. Burt, Brenda L. Mangelsdorf, Anne Rogers, Jui T. Ho, John G. Lewis,Warrick J. Inder, and Matthew P. Doogue
Southern Adelaide Diabetes and Endocrine Services (M.G.B., B.L.M., J.T.H., M.P.D.) and FlindersUniversity (M.G.B., A.R., J.T.H., M.P.D.), Adelaide, Australia 5041; Steroid and ImmunobiochemistryLaboratory (J.G.L.), Canterbury Health Laboratories, Christchurch, New Zealand 8140; and Departmentof Endocrinology and Diabetes (W.J.I.), St Vincent’s Hospital, Melbourne, Australia 3065
Context: Measurement of plasma cortisol by immunoassay after ACTH1–24 stimulation is used toassess the hypothalamic-pituitary-adrenal (HPA) axis. Liquid chromatography-tandem mass spec-trometry (LCMS) has greater analytical specificity than immunoassay and equilibrium dialysis al-lows measurement of free plasma cortisol.
Objective: We investigated the use of measuring total and free plasma cortisol by LCMS and totalcortisol by immunoassay during an ACTH1–24 stimulation test to define HPA status in pituitary patients.
Design and Setting: This was a case control study conducted in a clinical research facility.
Participants: We studied 60 controls and 21 patients with pituitary disease in whom HPA sufficiency(n � 8) or deficiency (n � 13) had been previously defined.
Intervention: Participants underwent 1 �g ACTH1–24 intravenous and 250 �g ACTH1–24 intramus-cular ACTH1–24 stimulation tests.
Main Outcome Measures: Concordance of ACTH1–24-stimulated total and free plasma cortisol withprevious HPA assessment.
Results: Total cortisol was 12% lower when measured by immunoassay than by LCMS. Female sexand older age were positively correlated with ACTH1–24-stimulated total and free cortisol, respec-tively. Measurements of total cortisol by immunoassay and LCMS and free cortisol 30 minutes after1 �g and 30 and 60 minutes after 250 �g ACTH1–24 were concordant with previous HPA axisassessment in most pituitary patients. However, free cortisol had greater separation from thediagnostic cutoff than total cortisol.
Conclusions: Categorization of HPA status by immunoassay and LCMS after ACTH1–24 stimulationwas concordant with previous assessment in most pituitary patients. Free cortisol may have greaterclinical use in patients near the diagnostic threshold. (J Clin Endocrinol Metab 98: 0000–0000, 2013)
Glucocorticoids regulate metabolic, developmental,and immune function and play a pivotal role in pre-
serving basal and stress-related homeostasis. Deficiency ofcortisol results in substantial morbidity and may be fatal
if untreated (1). Cortisol deficiency can be due to adrenal(primary) or hypothalamic-pituitary (secondary) dysfunc-tion. Although the diagnosis of primary adrenal failure isgenerally straightforward, evaluation of the hypothalam-
ISSN Print 0021-972X ISSN Online 1945-7197Printed in U.S.A.Copyright © 2013 by The Endocrine SocietyReceived October 9, 2012. Accepted March 6, 2013.
Abbreviations: BMI, body mass index; CBG, corticosteroid-binding globulin; CI, confidenceinterval; HPA, hypothalamic-pituitary-adrenal; IHT, insulin hypoglycemia test; LCMS, liquidchromatography-tandem mass spectrometry.
O R I G I N A L A R T I C L E
E n d o c r i n e C a r e
doi: 10.1210/jc.2012-3576 J Clin Endocrinol Metab jcem.endojournals.org 1
J Clin Endocrin Metab. First published ahead of print March 28, 2013 as doi:10.1210/jc.2012-3576
Copyright (C) 2013 by The Endocrine Society
ic-pituitary-adrenal (HPA) axis in patients at risk of sec-ondary adrenal dysfunction can be a diagnostic challenge.
Assessment for secondary adrenal dysfunction relies oninterpretation of basal cortisol concentration and changein cortisol concentration in response to physiological orpharmacological stimuli. The insulin hypoglycemia test(IHT) is considered the gold-standard test of the HPA axisin patients with pituitary disease (2, 3). However, the IHTis resource intensive, is unpleasant for patients, and carriesa small risk of seizure or loss of consciousness. This hascontributed to the common use of ACTH1–24 tests to as-sess HPA function in patients with pituitary disease (4, 5).The peak cortisol after ACTH1–24 stimulation providesimportant prognostic information regarding HPA func-tion in pituitary patients (6). However, it is primarily a testof adrenal (rather than pituitary) function. Furthermore,the sensitivity of ACTH1–24 stimulation testing to definesecondary adrenal failure is only 60% when comparedwith the IHT or metyrapone tests (7).
Current assessment of HPA function is based on themeasurement of total cortisol by immunoassay, often us-ing diagnostic thresholds derived from the literature.However, commercially available cortisol immunoassaysvary in their precision and may cross-react with other ste-roid hormones; hence, diagnostic thresholds should be as-say-specific (8). Furthermore, only about 5% of circulat-ing cortisol is free and in equilibrium with the cortisolreceptor, with approximately 80% bound to corticoste-roid-binding globulin (CBG) and the remainder to albu-min (9). Interindividual variability in CBG can result in adifference in the total (measured) cortisol concentrationwhen there isnodifference in the free (physiologic) cortisolconcentration (10). Additionally, the capacity of CBG tobind cortisol is saturable at physiological concentrations.Thus, at higher concentrations, a moderate increase intotal cortisol may be associated with a large increase in freecortisol (11).
Liquid chromatography-tandem mass spectrometry(LCMS) provides greater analytical specificity than im-munoassays (12). The costs of LCMS assays are decreas-ing and they are becoming increasingly available to mea-sure steroid hormones. Furthermore, LCMS has sufficientsensitivity in combination with equilibrium dialysis tomeasure plasma free cortisol accurately. However, the roleof LCMS during ACTH1–24 stimulation testing in pitu-itary patients is not known.
Other patient variables are often not considered wheninterpreting the results of ACTH1–24 stimulation tests.However, they may be important. For example, sex wasreported to influence ACTH1–24-stimulated total cortisolsecretion in some (13) but not all (14) studies. Further-more, age, body mass index (BMI), and sex influence ad-
renal sensitivity to endogenous ACTH pulses (15). Theeffect of these variables on ACTH1–24-stimulated totaland free cortisol secretion is worthy of investigation.
The primary aim of this study was to investigatewhether the measurement of total and free plasma cortisolby LCMS during the low- and high-dose ACTH1–24 stim-ulation tests better defines HPA status in pituitary patientsthan total cortisol measured by immunoassay. We alsoestablished a reference range for basal and ACTH1–24-stimulated plasma total and free cortisol measured byLCMS and assessed the relationship between age, BMI,and sex and ACTH1–24-stimulated total and free cortisolconcentrations.
Materials and Methods
This open cross-sectional study was undertaken within the En-docrine Research Unit, Repatriation General Hospital, Adelaide,Australia and the Department of Endocrinology, St Vincent’sHospital, Melbourne, Australia. The study was approved by theSouthern Adelaide Clinical Human Research Ethics Committee,Adelaide and the Human Research Ethics Committee, St Vin-cent’s Hospital, Melbourne. All subjects provided written in-formed consent in accordance with the Declaration of Helsinki.
SubjectsWe prospectively recruited 60 healthy volunteers aged 20 to
80 years from the general community who had no history ofpituitary or adrenal disease and were not taking oral glucocor-ticoids or estrogens and 21 patients with established pituitarydisease. Twelve pituitary patients had had nonfunctioning tu-mors, 4 acromegaly, 1 Cushing’s disease, 1 prolactinoma, 2 con-genital hypopituitarism, and 1 hypophysitis. Thirteen pituitarypatients were taking glucocorticoid replacement (8 subjects hy-drocortisone, 19 � 6 mg/d; 4 subjects cortisone acetate, 22 � 3mg/d; 1 subject prednisolone 5 mg/d), 11 thyroxine, 5 testoster-one, 1 oral estrogen, 1 transdermal estrogen, 3 GH, and 4 des-mopressin. Fifteen pituitary patients had undergone pituitarysurgery and 2 had received pituitary radiotherapy. In all pituitarypatients HPA sufficiency (n � 8) or deficiency (n � 13) had beendefined by IHT (glucose �2.2 mmol/L, cortisol cutoff 550nmol/L) or morning cortisol (deficient �100 nmol/L, sufficient�500 nmol/L).
Study designSubjects attended the Endocrine Research Unit, Repatriation
General Hospital, or the Department of Endocrinology, St Vin-cent’s Hospital at 9 AM after an overnight fast on 2 occasionsabout 7 days apart. For subjects taking glucocorticoids, the af-ternoon glucocorticoid dose was withheld the day beforeACTH1–24 testing, to ensure testing occurred more than 24 hoursafter last glucocorticoid administration. On the first visit, height,weight, waist and hip circumference, pulse, and blood pressurewere recorded. A cannula was inserted into an antecubital fossavein for blood sample collections. At each visit, subjects wereadministered either 1 �g ACTH1–24 (Synacthen; Novartis Phar-maceuticals, Sydney, Australia) IV or 250 �g ACTH1–24 IM, in
2 Burt et al Free Cortisol in Pituitary Patients J Clin Endocrinol Metab

random order. For the 1 �g ACTH1–24 stimulation test, 250 �gACTH1–24 was added to 99 mL 0.9% sodium chloride, produc-ing a solution with an ACTH1–24 concentration of 2.5 �g/mL.Following agitation for at least 2 minutes, 0.4 mL of the dilutedACTH1–24 solution was drawn up using a 50 U insulin syringeand injected as a bolus directly into the IV cannula, which wasthen flushed with normal saline. Blood samples were collected atbaseline, and 30 and 60 minutes after ACTH1–24 administration.
Laboratory analysisPlasma total cortisol was measured by immunoassay (Elecsys
2010; Roche Diagnostics, Mannheim, Germany; coefficient ofvariation � 3%) and by in-house LCMS assay as previouslydescribed (16). In brief, following the addition of an internalstandard d4-cortisol and extraction with tert-butylmethyl-ether,plasma total cortisol was measured by LCMS (API 3200 Q Trap;Applied Biosystems, Scoresby, Australia) with selective ion mon-itoring of mass-to-charge ratio 363-121 for cortisol and 367-121for d4-cortisol. The coefficient of variation was 3.4% to 6.2% atcortisol concentrations between 70 and 1000 nmol/L. Plasmafree cortisol was isolated at 37°C using a commercial equilibriumdialysis kit (Pierce, Rockford, Illinois) and measured by LCMS.Plasma free cortisol was calculated using the following equation:free cortisol � total cortisol dialysate cortisol/retentate cortisol.The Elecsys Cortisol CalSet calibrators were used for both theimmunoassay and the LCMS assays. Plasma CBG was measuredusing a 2-site noncompetitive monoclonal antibody–basedELISA assay, as previously described (17).
Statistical analysisMost data were analyzed using SPSS 20.0 for Windows (SPSS
Inc, Chicago, Illinois) with 95% confidence intervals (CI) cal-culated using Analyze-It for Microsoft Excel (version 2.26; Mi-crosoft Corp, Leeds, United Kingdom) and sensitivities and spec-ificities calculated at http://www.vassarstats.net/clin1.html.Results are reported as mean � SD with P � .05 consideredstatistically significant. �2 tests were used to assess categoricalvariables and unpaired and paired t tests were used to assessindependent and dependent continuous variables, respectively.The relationships between age and BMI with CBG and basal andmaximal ACTH1–24-stimulated (30-minute concentration dur-ing 1 �g test, 60-minute concentration during 250 �g test) totaland free cortisol concentrations were assessed by simple linearregression analyses. As the relationships for total cortisol by im-munoassay and LCMS were similar, only the LCMS results arereported. If more than one variable (sex, age, BMI) were signif-icantly related to CBG or cortisol in univariate analyses, thesewere then entered into a multivariate analysis. The sensitivityand specificity of each cortisol assay to predict ACTH deficiencyand concordance with previous HPA assessment at each timepoint were calculated based on the lower limits of the 95% CIderived from normal subjects, with the patients’ previous assess-ment of the HPA axis considered the gold standard.
Results
Subject characteristics (Table 1)Subjects with pituitary disease had a significantly
higher mean waist circumference and waist/hip ratio than
controls. In women, mean waist circumference was 13 cmgreater in pituitary patients than in normal subjects (P �.001). In men, mean waist circumference was 7 cm greaterin pituitary patients, but the difference was not statisticallysignificant (P � .26). The mean BMI of the pituitary pa-tients was 2.7 kg/m2 higher than controls; however, thisdifference was not statistically significant. There were noother significant differences in other demographic vari-ables between the 2 groups. In particular, mean CBG con-centration was not significantly different in the controlsand pituitary patients.
Relationship between sex, age, BMI, CBG, andcortisol in controls
Mean CBG concentration was significantly higher inwomen than in men (673 � 135 vs 530 � 123 nmol/L, P �.0001). Basal total (464 � 143 vs 419 � 93 nmol/L, P �.17) and free (14.6 � 7.4 vs 16.3 � 6.1 nmol/L, P � .34)cortisol concentrations were not significantly different inwomen and men. Thirty minutes after 1 �g ACTH1–24
mean total (814 � 111 vs 699 � 108 nmol/L, P � .0001),but not free (52.3 � 10.9 vs 53.1 � 16.3 nmol/L, P � .83),cortisol concentration was significantly higher in womenthan in men. Sixty minutes after 250 �g ACTH1–24 meantotal cortisol concentration was significantly higher(940 � 122 vs 840 � 116, P � .002) and mean free cortisolconcentration was significantly lower (72.9 � 12.5 vs81.3 � 19.4 nmol/L, P � .05) in women than in men.
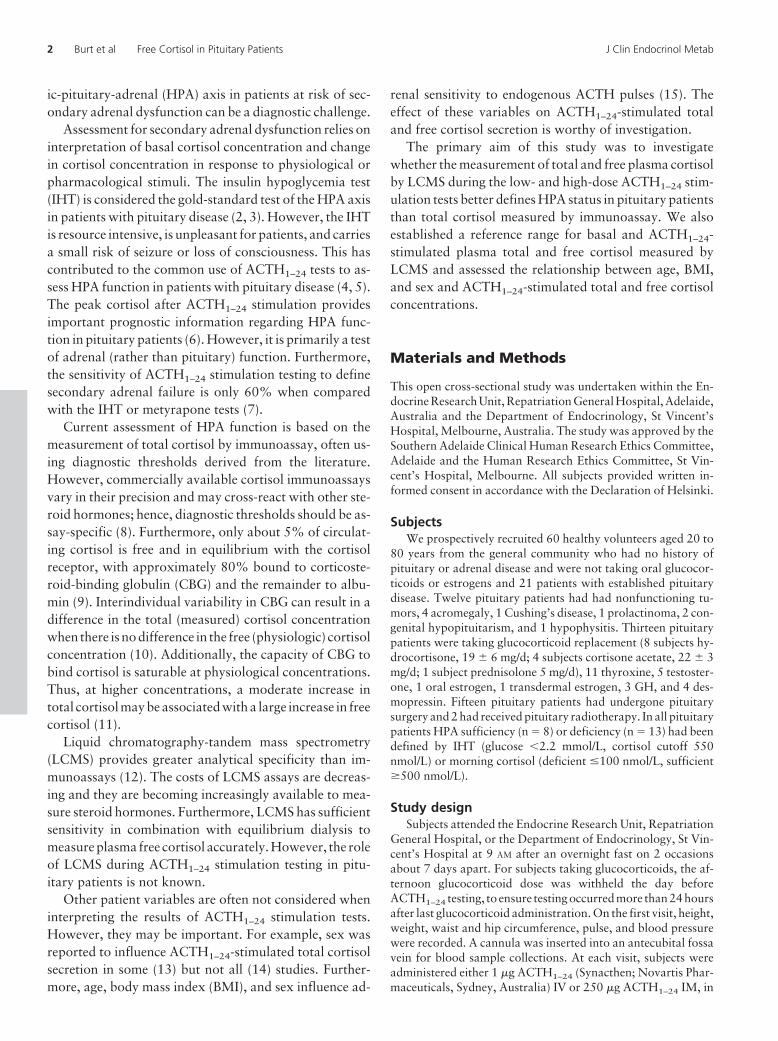
The concentrations of CBG (r � 0.05, P � .74), basaltotal cortisol (r � 0.19, P � .15), and basal free cortisol(r � 0.21, P � .11) were not significantly correlated withage. Similarly, total cortisol concentrations 30 minutesafter 1 �g ACTH1–24 (r � 0.15, P � .26) and 60 minutesafter 250 �g ACTH1–24 (r � 0.23, P � .07) were notsignificantly correlated with age. In contrast, free cortisolconcentrations 30 minutes after 1 �g ACTH1–24 (r � 0.38,P � .003) and 60 minutes after 250 �g ACTH1–24 (r �0.49, P � .0001; Figure 1) were both positively corre-
Table 1. Subject Characteristics of Controls andPituitary Patients
ControlsPituitaryPatients P Value
Number, n 60 21Sex (female/
male)34/26 14/7 .42
Age, ya 60.5 � 11.5 57.5 � 15.4 .34Weight, kga 80.6 � 19.1 87.9 � 18.7 .14Height, ma 1.70 � 0.09 1.70 � 0.06 .98BMI, kg/m2a 27.7 � 5.6 30.4 � 6.6 .08Waist, cma 92.9 � 14.0 102.8 � 14.2 .006Waist/hip ratioa 0.88 � 0.09 0.92 � 0.08 .046CBG, nmol/La 611 � 147 566 � 109 .21
a Mean � SD.
doi: 10.1210/jc.2012-3576 jcem.endojournals.org 3

lated with age. In a multiple regression analysis, freecortisol 60 minutes after 250 �g ACTH1–24 was signif-icantly independently related to age (P � .0001), but notto sex (P � .06).
CBG concentration was significantly and negativelycorrelated with BMI (r � �0.28, P � .03). However, in amultiple regression analysis CBG concentration was sig-nificantly independently related to sex (P � .0001), but notto BMI (P � .052). Basal and 1 �g and 250 �g ACTH1–24-stimulated total and free cortisol concentration were not signif-icantly correlated with BMI (data not shown).
CI and comparison with previous HPA assessmentThe lower limit of the 95% ACTH1–24-stimulated CI
for the immunoassay were 441 nmol/L 30 minutes after 1�g ACTH1–24, 492 nmol/L 30 minutes after 250 �gACTH1–24, and 606 nmol/L 60 minutes after 250 �gACTH1–24. Mean total cortisol measured by the immu-noassay was significantly lower than total cortisol mea-sured by LCMS at each time point (Table 2). The differ-ence in measured cortisol using the 2 methods was, onaverage, 12% across the range of cortisol concentrations(Figure 2). As such, the lower limits of basal and ACTH1–24-stimulated 95% CI for LCMS-measured cortisol were higherthan for the immunoassay (Table 2).
Free
cor
tisol
(nm
ol/li
ter)
Age (years)
0
20
40
60
80
100
120
140
30 40 50 60 70 80
r=0.49, p<0.0001
Figure 1. Relationship between age and free plasma cortisol measured byLCMS 60 minutes after 250 �g ACTH1–24 in 60 normal subjects.
Table 2. Mean � SD and 95% CI Derived From Controls, and Concordance with the Previously Defined HPAStatus and Sensitivity (95% CI) to Diagnose ACTH Deficiency in Pituitary Patients for Cortisol at 0, 30, and 60Minutes During the 1-�g Intravenous and 250-�g Intramuscular ACTH1–24 Stimulation Tests
0 min 30 min 60 min
1 �g ACTH1–24 stimulation testTotal cortisol by immunoassay
Mean, nmol/L 385 � 110 670 � 99 572 � 11895% CI, nmol/L 199–763 441–919 317–864Concordance, n, % 17 (81) 19 (90) 17 (81)Sensitivity, % 69 (39, 90) 85 (54–97) 69 (39, 90)
Total cortisol by LCMSMean � SD, nmol/L 445 � 139a 764 � 123a 644 � 151a
95% CI, nmol/L 213–933 497–1125 327–1067Concordance, n, % 16 (76) 19 (90) 16 (76)Sensitivity, % 62 (32, 85) 85 (54–97) 62 (32, 85)
Free cortisol by LCMSMean � SD, nmol/L 15.8 � 8.9 52.7 � 13.4 35.0 � 12.395% CI, nmol/L 4.0–45.8 31.6–94.6 15.3–62.5Concordance, n, % 16 (76) 20 (95) 18 (86)Sensitivity, % 62 (32, 85) 92 (62, 100) 77 (46, 94)
250 �g ACTH1–24 stimulation testTotal cortisol by immunoassay
Mean � SD, nmol/L 386 � 116 694 � 103 804 � 10195% CI, nmol/L 176–703 492–978 606–1025Concordance, n, % 16 (76) 20 (95) 20 (95)Sensitivity, % 62 (32, 85) 92 (62, 100) 92 (62, 100)
Total cortisol by LCMSMean � SD, nmol/L 443 � 141a 795 � 136a 897 � 128a
95% CI, nmol/L 192–824 524–1153 630–1233Concordance, n, % 16 (76) 19 (90) 19 (90)Sensitivity, % 62 (32, 85) 85 (54–97) 85 (54–97)
Free cortisol by LCMSMean � SD, nmol/L 14.8 � 7.6 57.2 � 15.3 76.5 � 16.395% CI, nmol/L 3.6–36.1 32.1–101.8 42.4–119.4Concordance, n, % 16 (76) 20 (95) 20 (95)Sensitivity, % 62 (32, 85) 92 (62, 100) 92 (62, 100)
a P � .0001 vs total cortisol by immunoassay at the same time point.
4 Burt et al Free Cortisol in Pituitary Patients J Clin Endocrinol Metab
Basal cortisol concentration correctly classified 16 of21 (day 1) or 17 of 21 (day 2) pituitary patients as ACTH-sufficient or -deficient (Table 2). Total cortisol 30 minutesafter 1 �g ACTH1–24 measured by immunoassay andLCMS correctly classified 19 pituitary patients (Table 2).Total cortisol 60 minutes after 250 �g ACTH1–24 mea-sured by immunoassay and LCMS correctly classified 20and 19 pituitary patients, respectively (Table 2). Free cor-tisol 30 minutes after 1 �g ACTH1–24 and 30 and 60 min-utes after 250 �g ACTH1–24 correctly classified 20 pitu-itary patients (Table 2).
Plasma cortisol was within the normal range for all 8pituitary patients with an intact HPA axis at each timepoint with each assay. As such, the specificity for all assaysat each time point was 100%. The 30-minute cortisol con-centration during the 1 �g ACTH1–24 stimulation test andthe 30- and 60-minute cortisols during the 250 �gACTH1–24 stimulation tests correctly classified 11 or 12 ofthe 13 patients with ACTH deficiency with each assay,resulting in a sensitivity of �85% (Table 2). However,measures of cortisol 60 minutes after 1 �g ACTH1–24 allhad a sensitivity below 80%.
Cortisol concentrations were also expressed as a per-centage of the lower CI for each assay (Figure 3). Two to4 pituitary patients had ACTH1–24-stimulated total cor-tisol concentrations between 80% and 120% of the lowerCI derived from the normal subjects with the immunoas-say and LCMS. Excluding one pituitary patient who wasconsidered HPA deficient on a previous IHT but not byeither ACTH1–24 stimulation test, all pituitary patientswith HPA deficiency were correctly classified by measure-ment of free plasma cortisol with the concentration lessthan 80% of the lower CI.
Discussion
In this study we measured basal and 1 �g IV and 250 �gIM ACTH1–24-stimulated plasma cortisol by immunoas-
say and LCMS in normal subjects and patients with pitu-itary disease. Measurements of total cortisol by immuno-assay were, on average, 12% lower than by LCMS,resulting in reference ranges for LCMS-measured totalcortisol that were higher than for the immunoassay. Innormal subjects, ACTH1–24-stimulated total cortisol wassignificantly higher in women than in men and ACTH1–24-stimulated free, but not total, cortisol was positively cor-related with age. Using the lower limit of the 95% CI as adiagnostic threshold, total cortisol measured by the im-munoassay and LCMS and free cortisol measured byLCMS correctly categorized the HPA status of most pa-tients with pituitary disease, although free cortisol con-centrations were better separated from the diagnosticthreshold. These findings provide insight into demo-graphic and laboratory factors that affect ACTH1–24-stimulated total and free cortisol secretion and the poten-tial role of LCMS-measured free cortisol in pituitarypatients.
The benefits of measuring total cortisol by LCMS inpatients with pituitary disease have not been fully clari-fied. In this study we found that ACTH1–24-stimulatedtotal cortisol measured by immunoassay correctly cate-gorized most pituitary patients, when an assay-definedreference range from the local population is used. Hencethe sensitivities of ACTH1–24-stimulated total cortisol byLCMS were comparable to the immunoassay. Althoughthe increased analytical specificity of LCMS may be usefulin some cases, we did not demonstrate diagnostic superi-ority with LCMS. The sensitivity of plasma free cortisolwas similar to total cortisol, but free cortisol concentra-tions showed greater separation from the lower 95% CI ofthe normal subjects (Figure 3). This suggests that plasma
-100-80-60-40-20
020406080
100
0 200 400 600 800 1000 1200 1400Total cortisol LCMS (nmol/liter)
Tota
l cor
tisol
(IA
–LC
MS)
/LC
MS
(%)
Figure 2. Bland-Altman plot of total plasma cortisol measured byLCMS vs percentage difference between total cortisol measured byimmunoassay (IA) and LCMS.
Total(IA)
Total(LCMS)
Free(LCMS)
Total(IA)
Total(LCMS)
Free(LCMS)
1 µg ACTH1-24
30 min cortisol
250 µg ACTH1-24
60 min cortisol
Cor
tisol
(% lo
wer
con
fiden
ce in
terv
al)
020406080
100120140160180200220240260
HPA deficient
HPA sufficient
Figure 3. Total and free plasma cortisol concentrations measured byimmunoassay (IA) and LCMS 30 minutes after 1 �g ACTH1–24 and 60minutes after 250 �g ACTH1–24 in 21 subjects previously classified asHPA-deficient (diamonds) or HPA-sufficient (triangles), expressed as apercentage of the lower CI derived from 60 normal subjects.
doi: 10.1210/jc.2012-3576 jcem.endojournals.org 5

free cortisol in pituitary patients may be better separatedfrom the lower limit of cortisol in normal subjects andhave clinical utility in patients with total cortisol concen-trations around this threshold.
The cost effectiveness of measurement of plasma totaland free cortisol by LCMS will vary depending on localfactors. The capital costs are considerable and, in contrastto immunoassays, measurement of steroid hormones byLCMS requires an extraction step (18). The combinationwith equilibrium dialysis entails an additional expense.However, consumable costs are generally less expensivethan for immunoassays, which offset other expenses forfrequently performed tests.
The pituitary patients in this study were not selectedbased on their CBG concentration. This may have led to anunderestimation of the benefit of measuring plasma freecortisol, as all pituitary patients had a CBG concentrationwithin the 95% CI derived from normal subjects. Mea-surement of free cortisol is likely to have greater benefitwhen CBG concentration is abnormal, as ACTH1–24-stim-ulated total cortisol concentration is affected by CBG con-centration (19). In critically ill (20, 21) or chronic liverdisease (22, 23) patients with reduced CBG concentra-tions, plasma or serum free cortisol provides better assess-ment of the HPA axis than total cortisol. Our patients wereassessed when they were stable and well, whereas clinicalassessment sometimes occurs when patients are unwellwith a low CBG. Conversely oral estrogen increases CBGconcentration, but only one pituitary patient was takingoral estrogen. Future studies should explore the role ofmeasuring ACTH1–24-stimulated free cortisol in pituitarypatients taking oral estrogen.
Our study extends previous findings in several ways.We have established the first reported reference ranges forACTH1–24-stimulated total and free cortisol measured si-multaneously by immunoassay and LCMS. Contrary towhat one might intuitively expect for a more specific assay,total cortisol measured by LCMS was, on average, 12%higher than with the Elecsys 2010 immunoassay across therange of cortisol concentrations. We previously dem-onstrated that measurement of cortisol by immunoas-say at room temperature underestimates total plasmacortisol (16, 24). These studies found that immunoas-say-measured cortisol concentrations matched LCMSvalues once matrix effects are accounted for (16, 24). Apossible explanation for the matrix effect is interferencewith the immunoassay antibody binding to cortisol dueto the high affinity of CBG to cortisol. The LCMS assayis less susceptible to matrix effects than an immunoas-say and was referenced to the Elecsys Cortisol CalSetcalibrators, which are traceable to IDMS referencematerials.
We have also produced the first comparisons of totaland free plasma cortisol measured by LCMS during 1 �gand 250 �g ACTH1–24 stimulation tests. A potential ad-vantage of the 1 �g ACTH1–24 stimulation test is that itmore closely approximates physiologic ACTH concentra-tions. A disadvantage is that ACTH1–24 dilution is re-quired to perform a 1 �g stimulation test, which couldintroducedosing errors if not rigorouslyperformed.Meta-analyses comparing 1 �g and 250 �g ACTH1–24 stimula-tion tests in pituitary patients using total cortisol measuredby immunoassay have produced discordant results, withone reporting greater sensitivity with the 1 �g test (25) andanother reporting that the 2 tests performed similarly (7).In our study, where ACTH1–24 stimulation tests were con-ducted by a single investigator, the performance of the 1�g and 250 �g ACTH1–24 stimulation tests was similar forboth the immunoassay and the LCMS, when appropriatereference ranges were used.
The time after ACTH1–24 administration of cortisol ismeasured lacks consistency in the literature, particularlyduring the 250 �g test (25). Some authors have concludedthat the 30-minute time point is superior to 60 minutes ascortisol concentration at the 30-minute time point betterreflects peak cortisol during an IHT (26). In our studyfollowing IV administration of 1 �g ACTH1–24, the cor-tisol peak occurs at 30 minutes in 57 of 60 (95%) normaland 20 of 21 (95%) pituitary subjects and the 60-minutetime point lacked sensitivity to determine HPA status. Incontrast, following 250 �g ACTH1–24 administered IM,the cortisol peak was at 60 minutes in all normal and 19of 21 (90%) pituitary subjects. In the 250 �g ACTH1–24
test, measurements of cortisol at 30 and 60 minutes per-formed similarly when time-appropriate diagnosticthresholds were used.
This study also provides insight into the relationshipbetween patient factors and ACTH1–24-stimulated corti-sol secretion. Consistent with some (13), but not all (14),studies, we found that peak total cortisol was higher inwomen than in men after ACTH1–24 stimulation. Thisfinding was due to sex differences in CBG concentration.In contrast, maximal free cortisol concentration was lowerin women after 250 �g, but not 1 �g, ACTH1–24. Ourresults suggest that optimal interpretation of ACTH1–24
stimulation tests using both total and free cortisol shouldbe based on sex-specific reference ranges.
Consistent with previous studies (13, 14, 27), we didnot find a significant relationship between age andACTH1–24-stimulated total cortisol concentrations. How-ever, we do report a positive correlation between age andmaximal ACTH1–24-stimulated free cortisol. This findingwas not explained by a change in CBG concentration,which was not significantly associated with age. Our data
6 Burt et al Free Cortisol in Pituitary Patients J Clin Endocrinol Metab

suggest that age-specific reference ranges may improveinterpretation of ACTH1–24-stimulated free cortisol con-centrations. Plasma free cortisol concentration followingACTH1–24 stimulation is dependent on cortisol secretion,the volume of distribution for free cortisol and free cortisolclearance. Our study does not provide insight into whichof these factors are affected by age. However, the findingis of interest, because if free cortisol concentration follow-ing ACTH stimulation increases with age, it may contrib-ute to the age-related increase in total and visceral fat massand reduction in lean body mass and bone mineral density,which parallel changes found in glucocorticoid excess(28–30). This could be a topic of further study.
We acknowledge our study is subject to limitations.Most importantly, the number of pituitary patients ismodest and limited our ability to compare assays, partic-ularly as the cortisol immunoassay correctly classifiedmost patients. However, our data suggest that at most 5%of pituitary patients may be correctly classified by freecortisol and not total cortisol. Another limitation is thatpituitary patients were categorized as HPA sufficient ordeficient based on previous (often 3–6 weeks postopera-tively) assessment and HPA status can change over time.In particular, one pituitary patient appeared HPA suffi-cient on basal, 1 �g, and 250 �g ACTH1–24-stimulatedcortisol concentrations despite unequivocally failing toachieve an adequate cortisol peak during an IHT 5 weeksafter transsphenoidal surgery (glucose nadir 1.2 mmol/L,cortisol peak 436 nmol/L). HPA function can recoversome months following pituitary surgery (31). This is thelikely scenario because this patient has subsequentlystopped hydrocortisone with no adverse effects. Finally,the diagnostic thresholds following ACTH1–24 stimu-lation were generated from 60 healthy volunteers, asample size that was insufficient to generate sex- andage-specific reference ranges. Nevertheless, the samplesize is not dissimilar to other studies of ACTH1–24 stim-ulation in normal subjects, who have defined referenceranges for cortisol immunoassays from 30 to 100 sub-jects (13, 14, 27, 32).
In summary, sex and age are important variables toconsider when assessing ACTH1–24-stimulated total andfree cortisol, respectively. Measurements of cortisol by theElecsys 2010 immunoassay are 12% lower than those at-tained using LCMS, supporting the need for assay-specificreference ranges. Although the sensitivities of total andfree plasma cortisol after ACTH1–24 stimulation are gen-erally similar, free plasma cortisol may provide greaterseparation from the diagnostic threshold. Future studiesshould examine the role of LCMS-measured free plasmacortisol after ACTH1–24 stimulation in a larger cohort of
pituitary patients close to the diagnostic threshold and inpatients taking oral estrogen.
Acknowledgments
We thank Malcolm Whiting for assistance with LCMS assaysand the participants who volunteered for this study. This studywas supported by a grant from the Faculty of Health Science,Flinders University, Adelaide, Australia.
Address all correspondence and requests for reprints to: DrMorton Burt, Southern Adelaide Diabetes and Endocrine Ser-vices, Repatriation General Hospital, Daw Park, Adelaide 5041,Australia. E-mail: [email protected].
Australian New Zealand Clinical Trials Registry no.ACTRN12609000541202.
Disclosure Summary: M.P.D. received grant support from theFaculty of Health Science, Flinders University to support thisstudy. M.G.B., B.L.M., A.R., J.T.H., J.G.L., and W.J.I. havenothing to declare.
References
1. Arlt W, Allolio B. Adrenal insufficiency. Lancet. 2003;361:1881–1893.
2. Inder WJ, Hunt PJ. Glucocorticoid replacement in pituitary surgery:guidelines for perioperative assessment and management. J Clin En-docrinol Metab. 2002;87:2745–2750.
3. Nieman LK. Dynamic evaluation of adrenal hypofunction. J Endo-crinol Invest. 2003;26:74–82.
4. Reynolds RM, Stewart PM, Seckl JR, Padfield PL. Assessing theHPA axis in patients with pituitary disease: a UK survey. Clin En-docrinol (Oxf). 2006;64:82–85.
5. Joseph SP, Ho JT, Doogue MP, Burt MG. Peri-operative manage-ment of the hypothalamic-pituitary-adrenal axis in patients withpituitary adenomas—an Australasian survey. Int Med J. 2012;42:1120–1124.
6. Agha A, Tomlinson JW, Clark PM, Holder G, Stewart PM. Thelong-term predictive accuracy of the short synacthen (corticotropin)stimulation test for assessment of the hypothalamic-pituitary-adre-nal axis. J Clin Endocrinol Metab. 2006;91:43–47.
7. Dorin RI, Qualls CR, Crapo LM. Diagnosis of adrenal insufficiency.Ann Intern Med. 2003;139:194–204.
8. Gatti R, Antonelli G, Prearo M, Spinella P, Cappellin E, De Palo EF.Cortisol assays and diagnostic laboratory procedures in human bi-ological fluids. Clin Biochem. 2009;42:1205–1217.
9. Keenan DM, Roelfsema F, Veldhuis JD. Endogenous ACTH con-centration-dependent drive of pulsatile cortisol secretion in the hu-man. Am J Physiol Endocrinol Metab. 2004;287:E652–E661.
10. Lewis JG, Mopert B, Shand BI, et al. Plasma variation of cortico-steroid-binding globulin and sex hormone-binding globulin. HormMetab Res. 2006;38:241–245.
11. Gozansky WS, Lynn JS, Laudenslager ML, Kohrt WM. Salivarycortisol determined by enzyme immunoassay is preferable to serumtotal cortisol for assessment of dynamic hypothalamic–pituitary–adrenal axis activity. Clin Endocrinol (Oxf). 2005;63:336–341.
12. Kushnir MM, Rockwood AL, Bergquist J. Liquid chromatography-tandem mass spectrometry applications in endocrinology. MassSpectrom Rev. 2010;29:480–502.
13. Clark PM, Neylon I, Raggatt PR, Sheppard MC, Stewart PM. De-fining the normal cortisol response to the short Synacthen test: im-
doi: 10.1210/jc.2012-3576 jcem.endojournals.org 7

plications for the investigation of hypothalamic-pituitary disorders.Clin Endocrinol (Oxf). 1998;49:287–292.
14. Endert E, Ouwehand A, Fliers E, Prummel MF, Wiersinga WM.Establishment of reference values for endocrine tests. Part IV: ad-renal insufficiency. Neth J Med. 2005;63:435–443.
15. Veldhuis JD, Iranmanesh A, Roelfsema F, et al. Tripartite control ofdynamic ACTH-cortisol dose responsiveness by age, body mass in-dex, and gender in 111 healthy adults. J Clin Endocrinol Metab.2011;96:2874–2881.
16. Jung C, Ho JT, Torpy DJ, et al. A longitudinal study of plasma andurinary cortisol in pregnancy and postpartum. J Clin EndocrinolMetab. 2011;96:1533–1540.
17. Lewis JG, Lewis MG, Elder PA. An enzyme-linked immunosorbentassay for corticosteroid-binding globulin using monoclonal andpolyclonal antibodies: decline in CBG following synthetic ACTH.Clin Chim Acta. 2003;328:121–128.
18. Wu AH, French D. Implementation of liquid chromatography/massspectrometry into the clinical laboratory [published online October22, 2012]. Clin Chim Acta. doi:10.1016/j.cca.2012.10.026.
19. Dhillo WS, Kong WM, Le Roux CW, et al. Cortisol-binding globulinis important in the interpretation of dynamic tests of the hypotha-lamic–pituitary–adrenal axis. Eur J Endocrinol. 2002;146:231–235.
20. Hamrahian AH, Oseni TS, Arafah BM. Measurements of serum freecortisol in critically ill patients. N Engl J Med. 2004;350:1629–1638.
21. Ho JT, Al-Musalhi H, Chapman MJ, et al. Septic shock and sepsis:a comparison of total and free plasma cortisol levels. J Clin Endo-crinol Metab. 2006;91:105–114.
22. Tan T, Chang L, Woodward A, et al. Characterising adrenal func-tion using directly measured plasma free cortisol in stable severe liverdisease. J Hepatol. 2010;53:841–848.
23. Thevenot T, Borot S, Remy-Martin A, et al. Assessment of adrenalfunction in cirrhotic patients using concentration of serum-free andsalivary cortisol. Liver Int. 2011;31:425–433.
24. Saleem M, Lewis JG, Florkowski CM, Mulligan GP, George PM,Hale P. A patient with pseudo-Addison’s disease and falsely elevatedthyroxine due to interference in serum cortisol and free thyroxineimmunoassays by two different mechanisms. Ann Clin Biochem.2009;46:172–175.
25. Kazlauskaite R, Evans AT, Villabona CV, et al. Corticotropin testsfor hypothalamic-pituitary- adrenal insufficiency: a metaanalysis.J Clin Endocrinol Metab. 2008;93:4245–4253.
26. Stewart PM, Corrie J, Seckl JR, Edwards CR, Padfield PL. A rationalapproach for assessing the hypothalamo-pituitary-adrenal axis.Lancet. 1988;1:1208–1210.
27. Gonzalbez J, Villabona C, Ramon J, Navarro MA, Gimenez O,Ricart W, Soler J. Establishment of reference values for standarddose short synacthen test (250 microgram), low dose short syn-acthen test (1 microgram) and insulin tolerance test for assessmentof the hypothalamo-pituitary-adrenal axis in normal subjects. ClinEndocrinol (Oxf). 2000;53:199–204.
28. Buffa R, Floris GU, Putzu PF, Marini E. Body composition varia-tions in ageing. Coll Antropol. 2011;35:259–265.
29. Mayo-Smith W, Hayes CW, Biller BM, Klibanski A, Rosenthal H,Rosenthal DI. Body fat distribution measured with CT: correlationsin healthy subjects, patients with anorexia nervosa, and patientswith Cushing syndrome. Radiology. 1989;170:515–518.
30. Burt MG, Gibney J, Ho KK. Characterization of the metabolic phe-notypes of Cushing’s syndrome and growth hormone deficiency: astudy of body composition and energy metabolism. Clin Endocrinol(Oxf). 2006;64:436–443.
31. Berg C, Meinel T, Lahner H, Mann K, Petersenn S. Recovery ofpituitary function in the late-postoperative phase after pituitary sur-gery: results of dynamic testing in patients with pituitary disease byinsulin tolerance test 3 and 12 months after surgery. Eur J Endo-crinol. 2010;162:853–859.
32. Mayenknecht J, Diederich S, Bahr V, Plockinger U, Oelkers W.Comparison of low and high dose corticotropin stimulation tests inpatients with pituitary disease. J Clin Endocrinol Metab. 1998;83:1558–1562.
8 Burt et al Free Cortisol in Pituitary Patients J Clin Endocrinol Metab


![Case Report An Ectopic ACTH Secreting Metastatic Parotid ...downloads.hindawi.com/journals/crie/2016/4852907.pdf · True CS can either be ACTH dependent or ACTH inde-pendent []. ACTH](https://img.pdfslide.us/doc/110x75/6081617cd3269750d158a9a3/case-report-an-ectopic-acth-secreting-metastatic-parotid-true-cs-can-either.jpg)