Embed Size (px)
Citation preview

Free-Air Blast Analysis Updated April 24, 2018
Joseph D. Renick
Consultant
The objective of this analysis was to assess the blast performance of different energetic sources evaluated by Brilliant Light Power1. Sources, referred to as “shots”, were prepared in the form of small pellets a few millimeters in diameter. These tests were performed in open air at atmosphere pressure. Upon initiation through high-current (22kA) low-voltage (<15 V) discharge from a commercial spot welder, each event demonstrated violent explosive formation of an intense plasma field, plasma-induced EMP effects and a blast wave. The analysis here is exploratory in nature with the objective of gaining an understanding of the general characteristics of the blast environments generated in these events and the parameters that affect those environments. More details are provided in Reference 1. Earlier formulations investigated by BrLP, in addition to demonstrating explosive formation of a plasma field, EMP and blast effects, also resulted in pitting to the copper electrodes which for repetitive continuous operation required for electrical power generation, resulted in damage and deterioration of the electrodes. BrLP then pursued development of compositions with lower reaction rates that produced lower source region pressures and thus were more suitable for continuous operation such as needed for electric power generation. These lower reaction rate compositions were the sources evaluated here. Test results were received from Dr. Mills for 10 shots consisting of 2 hydrated Ag shots, 6 Ti/H2O shots, 1 gunpowder shot and 1 NH4NO3 (AN) shot. Shot masses ranged from 20 to 115 mg. With the exception of the 2 hydrated Ag shots, sources were contained in sealed 75 mg aluminum DSC pans. Electrodes in all shots were tapered to reduce their confining effects on the blast environment. This modification was performed in an effort to achieve, to the extent practical, a free-air detonation event for a point source. Four of the 6 Ti/H2O shots were performed in which blast probes were located at different elevations and angles to confirm the basic sphericity of the blast wave which is implicit in the analysis methodology. Full TNT free-air analysis was not performed on these shots which were similar to Shot 3. Null shots on DSC pans alone produced no plasma field and no EMP or blast effects.
Experimental setup is described in Figures 1 and 2. Summary of experiments and their results are presented in Table 1. The analysis approach was to compare experimental results in terms of source mass, blast peak overpressure, range and time-of-arrival to the free-air standard for TNT2. The assumption of spherical geometry is reasonable, especially at large scaled ranges where the peak overpressure is less than a few psi. Standard atmospheric conditions were assumed for these experiments which, given the near seal-level location of the BrLP facilities, was judged to be reasonable. This judgement was confirmed through calculations based on of Sach’s scaling laws. The TNT standard was developed following WW II within the energetic materials community in terms of peak overpressure as a function of scaled range, and scaled time-of-arrival as a function of scaled range. Other parameters such as positive phase duration and impulse incorporated in the TNT standard were not considered in the present analysis. The spherical geometry of the blast dictates cube-root scaling for yield. The approach was to determine equivalent TNT mass that would replicate these experimental results in terms of peak overpressure and then compare actual measured blast wave arrival time with that predicted by the TNT free air curve for that scaled range. Correlation of peak overpressure and arrival time to scaled range provides some indication of the ideality of the blast waves produced in these experiments. TNT equivalencies are calculated based on both total shot mass and mass of H2O contained in the shot which is assumed to have supported hydrino kinetics. Results are shown in Figures 3 through 8. Nomenclature and methodology are summarized in two vu-graphs following Table 1. The sphericity of these events was judged to be adequate for establishing the general reliability of the analysis methods based on the TNT free-air blast standard. Complete analysis was performed only for Shots 1 through 6.
REFERENCES 1. Power Determination and Hydrino Product Characterization of Ultra-low Field Ignition of Hydrated Silver Shots R. Mills, et.al., Brilliant Light Power, Inc., 493 Old Trenton Road, Cranbury, NJ 08512, USA. 2. Kinney & Graham, Explosive Shocks in Air, Second Edition, Springer-Verlag, 1985
23 cm 38.1 cm
127
cm
PCB pressure probe 2 each on 90 deg radials
floor
Back wall Shot source
Spot welder bus bar
Copper Ignition electrode
Blast shockwave measurement set up (not to scale)
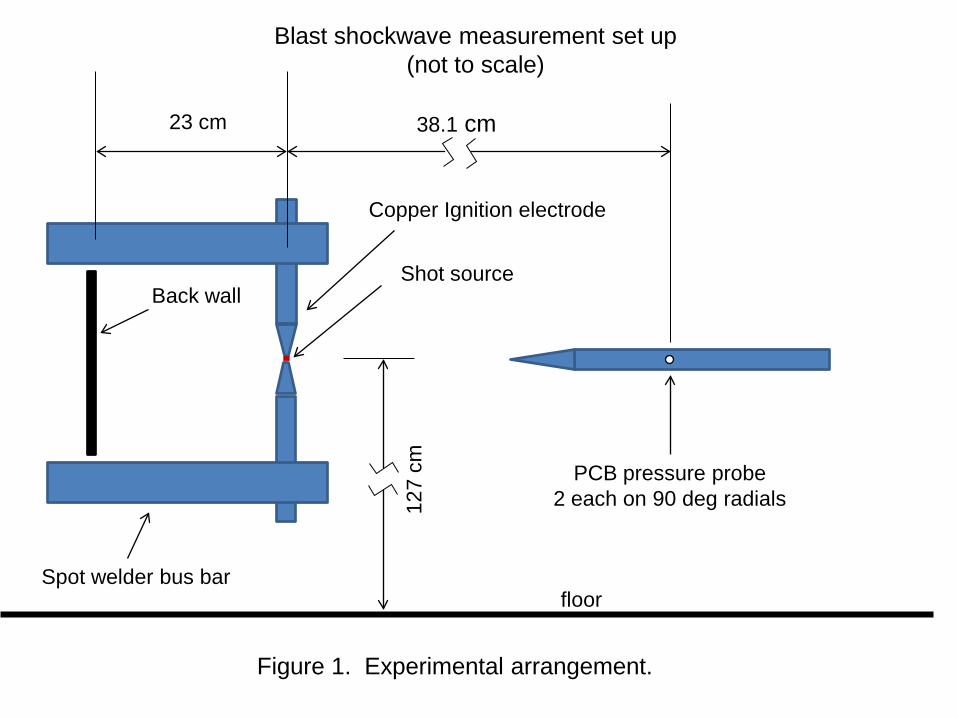
Figure 1. Experimental arrangement.

Ignition electrode
Figure 2. Experimental setup.

NOMENCLATURE
FAC Free-Air Curve P measured blast wave peak overpressure (psi) R measured range from blast source to pressure gage (m) W actual blast source mass (kg) Z scaled range, Z = R/Wx
1/3, from FAC, based on P Wx TNT equivalent mass based on Z, Wx = (R/Z)3 (kg TNT) Ex Equivalent TNT energy, J ta measured blast wave arrival time (ms) Tx from FAC, ideal scaled arrival time based on Z tx blast wave arrival time (ms) derived from FAC, tx = Tx x Wx
1/3

METHODOLOGY
MEASURED P blast wave peak overpressure (psi) ta blast wave arrival time (ms) R range from blast source to pressure gage (m) W actual blast source mass (kg) READ FROM TNT FREE-AIR-CURVE Z scaled range based on P, P(Z) Tx scaled arrival time based on Z, Tx(Z) CALCULATIONS Wx TNT equivalent mass based on blast yield, Wx = (R/Z)3 (kg TNT) tx calculated blast wave arrival time (ms) based on Tx, tx = Tx x Wx
1/3
TNT energy = 4600 J/g
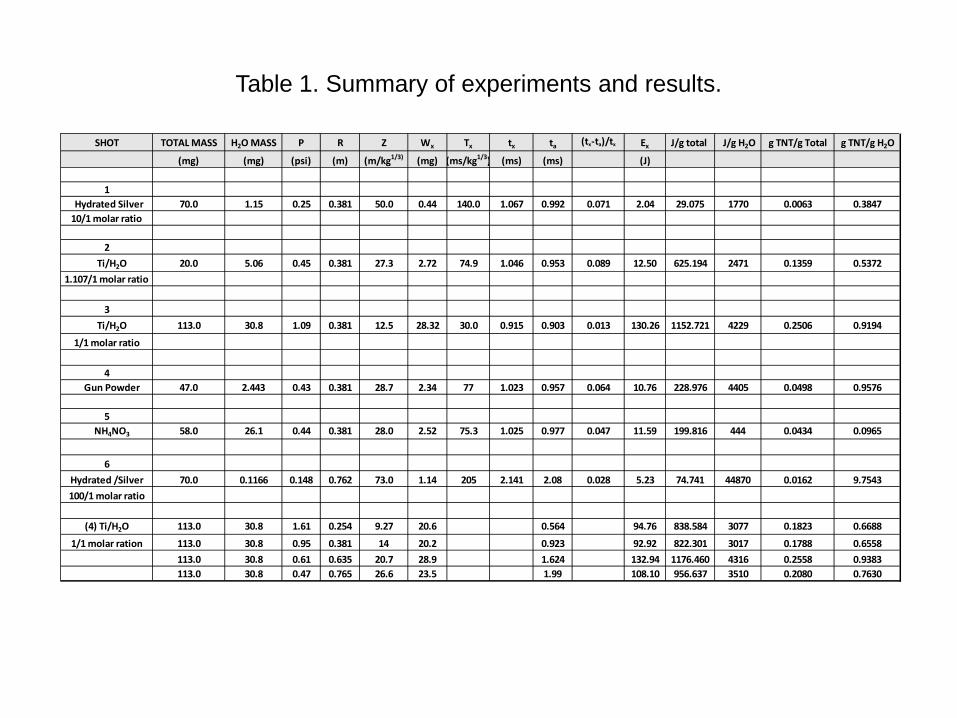
Table 1. Summary of experiments and results.
SHOT TOTAL MASS H2O MASS P R Z Wx Tx tx ta (tx-ta)/tx Ex J/g total J/g H2O g TNT/g Total g TNT/g H2O
(mg) (mg) (psi) (m) (m/kg1/3) (mg) (ms/kg1/3) (ms) (ms) (J)
1 Hydrated Silver 70.0 1.15 0.25 0.381 50.0 0.44 140.0 1.067 0.992 0.071 2.04 29.075 1770 0.0063 0.384710/1 molar ratio
2 Ti/H2O 20.0 5.06 0.45 0.381 27.3 2.72 74.9 1.046 0.953 0.089 12.50 625.194 2471 0.1359 0.5372
1.107/1 molar ratio
3 Ti/H2O 113.0 30.8 1.09 0.381 12.5 28.32 30.0 0.915 0.903 0.013 130.26 1152.721 4229 0.2506 0.9194
1/1 molar ratio
4 Gun Powder 47.0 2.443 0.43 0.381 28.7 2.34 77 1.023 0.957 0.064 10.76 228.976 4405 0.0498 0.9576
5 NH4NO3 58.0 26.1 0.44 0.381 28.0 2.52 75.3 1.025 0.977 0.047 11.59 199.816 444 0.0434 0.0965
6Hydrated /Silver 70.0 0.1166 0.148 0.762 73.0 1.14 205 2.141 2.08 0.028 5.23 74.741 44870 0.0162 9.7543100/1 molar ratio
(4) Ti/H2O 113.0 30.8 1.61 0.254 9.27 20.6 0.564 94.76 838.584 3077 0.1823 0.6688
1/1 molar ration 113.0 30.8 0.95 0.381 14 20.2 0.923 92.92 822.301 3017 0.1788 0.6558113.0 30.8 0.61 0.635 20.7 28.9 1.624 132.94 1176.460 4316 0.2558 0.9383113.0 30.8 0.47 0.765 26.6 23.5 1.99 108.10 956.637 3510 0.2080 0.7630
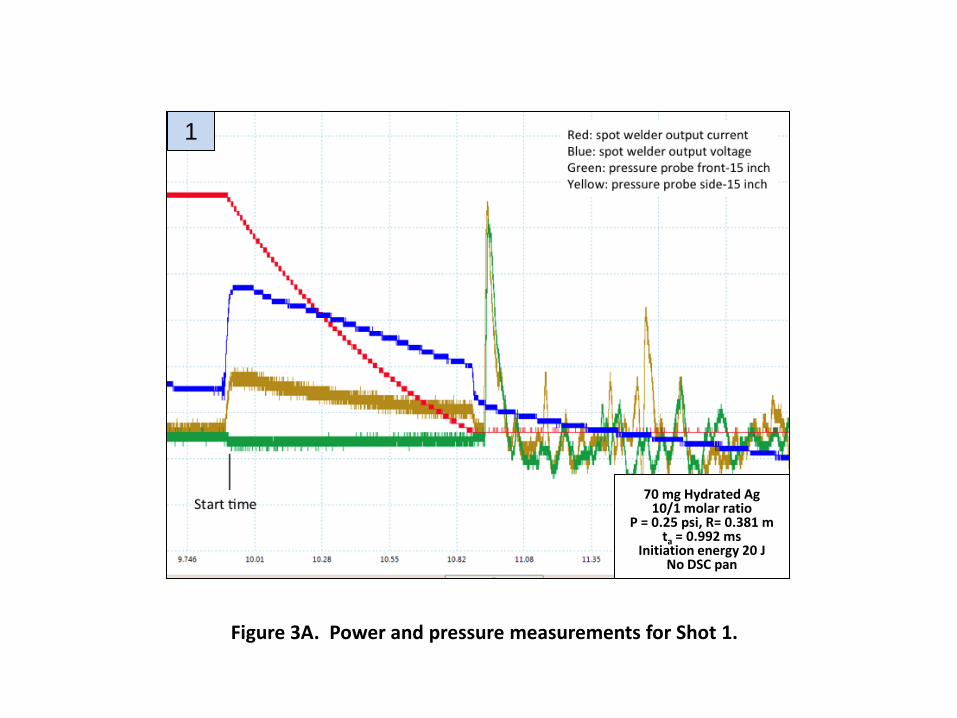
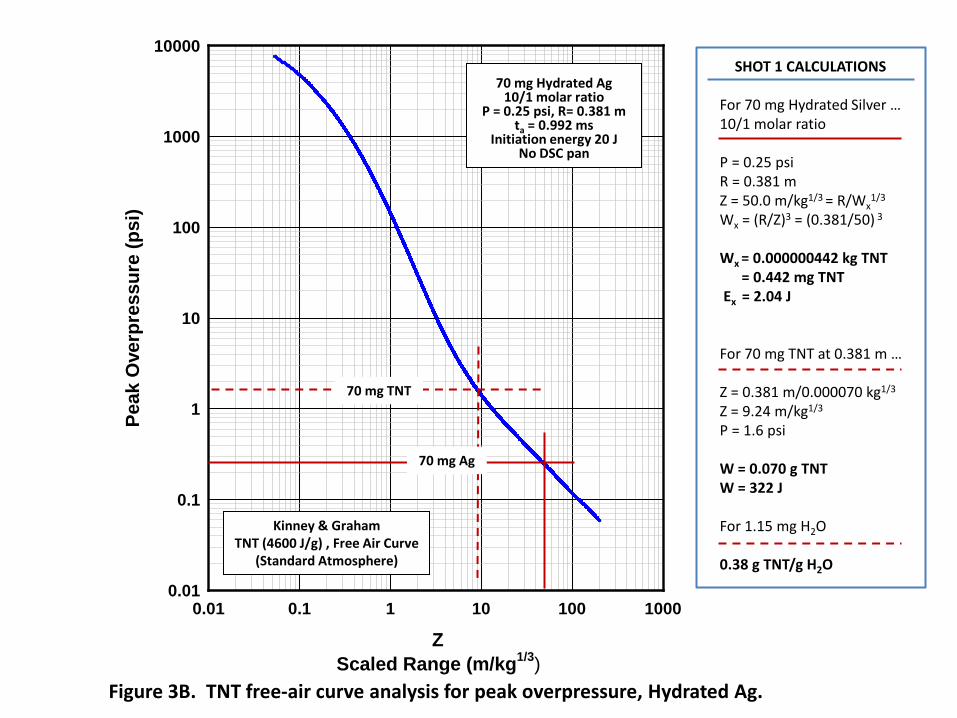
70 mg Hydrated Ag
10/1 molar ratio P = 0.25 psi, R= 0.381 m
ta = 0.992 ms Initiation energy 20 J
No DSC pan
1
Figure 3A. Power and pressure measurements for Shot 1.
Z Scaled Range (m/kg1/3)
0.01 0.1 1 10 100 1000
Peak
Ove
rpre
ssur
e (p
si)
0.01
0.1
1
10
100
1000
10000SHOT 1 CALCULATIONS
For 70 mg Hydrated Silver … 10/1 molar ratio P = 0.25 psi R = 0.381 m Z = 50.0 m/kg1/3 = R/Wx
1/3
Wx = (R/Z)3 = (0.381/50) 3 Wx = 0.000000442 kg TNT = 0.442 mg TNT Ex = 2.04 J For 70 mg TNT at 0.381 m … Z = 0.381 m/0.000070 kg1/3 Z = 9.24 m/kg1/3 P = 1.6 psi W = 0.070 g TNT W = 322 J For 1.15 mg H2O 0.38 g TNT/g H2O
70 mg TNT
70 mg Ag
Figure 3B. TNT free-air curve analysis for peak overpressure, Hydrated Ag.
70 mg Hydrated Ag
10/1 molar ratio P = 0.25 psi, R= 0.381 m
ta = 0.992 ms Initiation energy 20 J
No DSC pan
Kinney & Graham TNT (4600 J/g) , Free Air Curve
(Standard Atmosphere)

Z Scaled Range (m/kg1/3)
0.1 1 10 100 1000
Scal
ed T
ime-
of-A
rriv
al (m
s/kg
1/3 )
0.01
0.1
1
10
100
1000SHOT 1 CALCULATIONS
Z = 50.0 m/kg1/3 Tx = 140 ms/kg1/3 tx = Tx x Wx
1/3 tx = 140 ms x 0.000000442kg1/3 tx = 1.067 ms ta = 0.992 ms
Figure 3C. TNT free-air curve analysis for time-of-arrival, Hydrated Ag.
Kinney & Graham TNT (4600 J/g) , Free Air Curve
(Standard Atmosphere)
70 mg Hydrated Ag
10/1 molar ratio P = 0.25 psi, R= 0.381 m
ta = 0.992 ms Initiation energy 20 J
No DSC pan
140 ms/kg1/3
50.0
s/kg
1/3

20 mg Ti/H20
1.107 molar ratio P = 0.45 psi, R= 0.381 m
ta = 0.953 ms Initiation energy 20 J
DSC pan
2
Figure 4A. Power and pressure measurements for Shot 2.

Z Scaled Range (m/kg1/3)
0.01 0.1 1 10 100 1000
Peak
Ove
rpre
ssur
e (p
si)
0.01
0.1
1
10
100
1000
10000SHOT 2 CALCULATIONS
For 20 mg Ti/H20 @ 1.107/1 molar ratio P = 0.45 psi R = 0.381 m Z = 27.3 m/kg1/3 = R/Wx
1/3
Wx = (R/Z)3 = (0.381/27.3) 3 Wx = 0.00000272 kg TNT = 2.72 mg TNT Ex = 12.5 J For 20 mg TNT at 0.381 m … Z = 0.381 m/0.000020 kg1/3 Z = 14.0 m/kg1/3 P = 0.95 psi W = 0.020 g TNT W = 92 J For 5.06 mg H2O 0.54 g TNT/g H2O
20 mg TNT
20 mg Ti/H20
Figure 4B. TNT free-air curve analysis for peak overpressure, 20 mg Ti/H2O.
Kinney & Graham TNT, Free Air Curve
(Standard Atmosphere)
20 mg Ti/H20
1.107 molar ratio P = 0.45 psi, R= 0.381 m
ta = 0.953 ms Initiation energy 20 J
DSC pan

Z Scaled Range (m/kg1/3)
0.1 1 10 100 1000
Scal
ed T
ime-
of-A
rriv
al (m
s/kg
1/3 )
0.01
0.1
1
10
100
1000
74.9 ms/kg1/3
Figure 4C. TNT free-air curve analysis for time-of-arrival, 20 mg Ti/H2O.
Kinney & Graham TNT (4600 J/g) , Free Air Curve
(Standard Atmosphere)
20 mg Ti/H20
1.107 molar ratio P = 0.45 psi, R= 0.381 m
ta = 0.953 ms Initiation energy 20 J
DSC pan
SHOT 2 CALCULATIONS
Z = 28.0 m/kg1/3 Tx = 74.9 ms/kg1/3 tx = Tx x Wx
1/3 tx = 74.9 ms x 0.00000272kg1/3 tx = 1.046 ms ta = 0.953 ms
28.0
s/kg
1/3
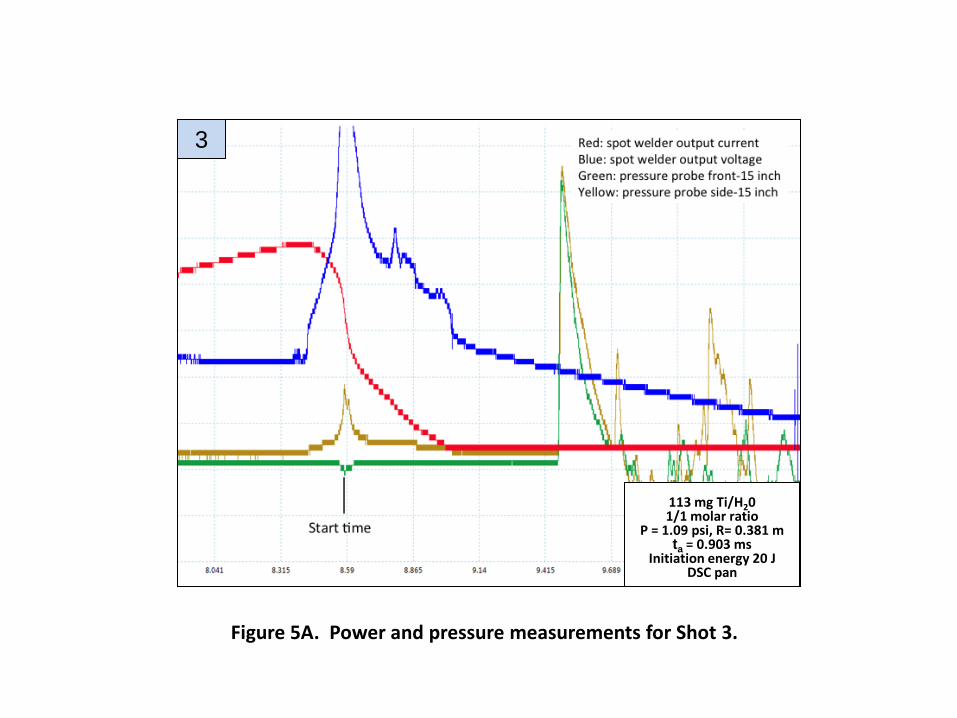
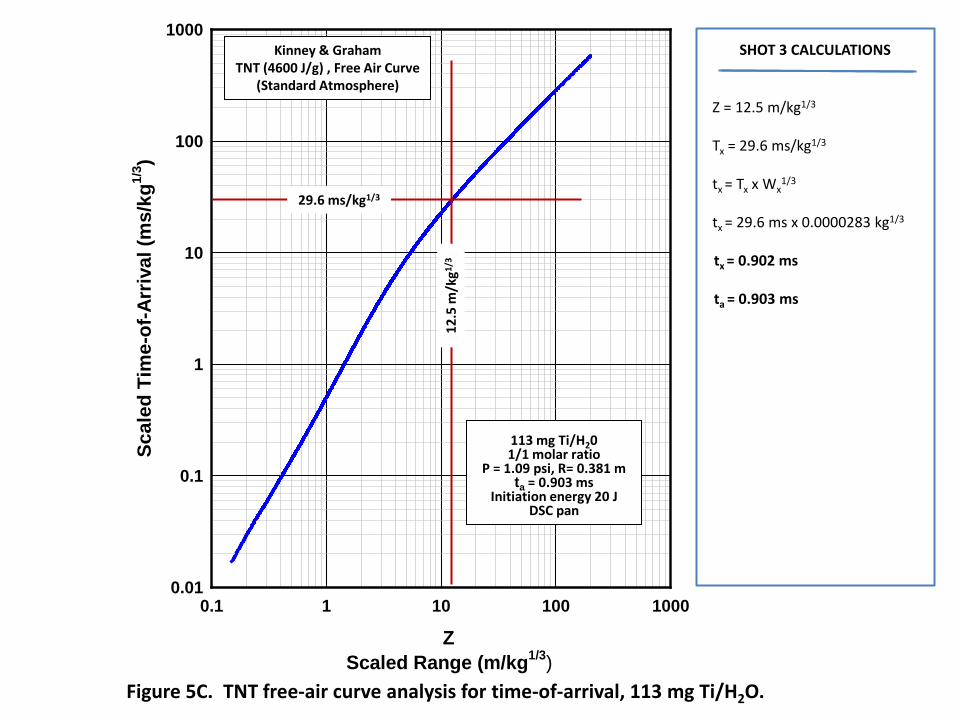
113 mg Ti/H20 1/1 molar ratio
P = 1.09 psi, R= 0.381 m ta = 0.903 ms
Initiation energy 20 J DSC pan
3
Figure 5A. Power and pressure measurements for Shot 3.

Z Scaled Range (m/kg1/3)
0.01 0.1 1 10 100 1000
Peak
Ove
rpre
ssur
e (p
si)
0.01
0.1
1
10
100
1000
10000SHOT 3 CALCULATIONS
For 113 mg Ti/H20 @ 1/1 molar ratio P = 1.09 psi R = 0.381 m Z = 12.5 m/kg1/3 = R/Wx
1/3
Wx = (R/Z)3 = (0.381/12.5) 3 Wx = 0.0000283 kg TNT = 28.3 mg TNT Ex = 130 J For 113 mg TNT at 0.381 m … Z = 0.381 m/0.000113 kg1/3 Z = 7.88 m/kg1/3 P = 2.00 psi W = 113 mg TNT W = 520 J For 30.8 mg H2O 0.92 g TNT/g H2O
113 mg TNT 113 mg Ti/H20
Figure 5B. TNT free-air curve analysis for peak overpressure, 113 mg Ti/H2O.
Kinney & Graham TNT, Free Air Curve
(Standard Atmosphere)
113 mg Ti/H20 1/1 molar ratio
P = 1.09 psi, R= 0.381 m ta = 0.903 ms
Initiation energy 20 J DSC pan
Z Scaled Range (m/kg1/3)
0.1 1 10 100 1000
Scal
ed T
ime-
of-A
rriv
al (m
s/kg
1/3 )
0.01
0.1
1
10
100
1000
Figure 5C. TNT free-air curve analysis for time-of-arrival, 113 mg Ti/H2O.
Kinney & Graham TNT (4600 J/g) , Free Air Curve
(Standard Atmosphere)
113 mg Ti/H20 1/1 molar ratio
P = 1.09 psi, R= 0.381 m ta = 0.903 ms
Initiation energy 20 J DSC pan
29.6 ms/kg1/3
SHOT 3 CALCULATIONS
Z = 12.5 m/kg1/3 Tx = 29.6 ms/kg1/3 tx = Tx x Wx
1/3 tx = 29.6 ms x 0.0000283 kg1/3 tx = 0.902 ms ta = 0.903 ms
12.5
m/k
g1/3
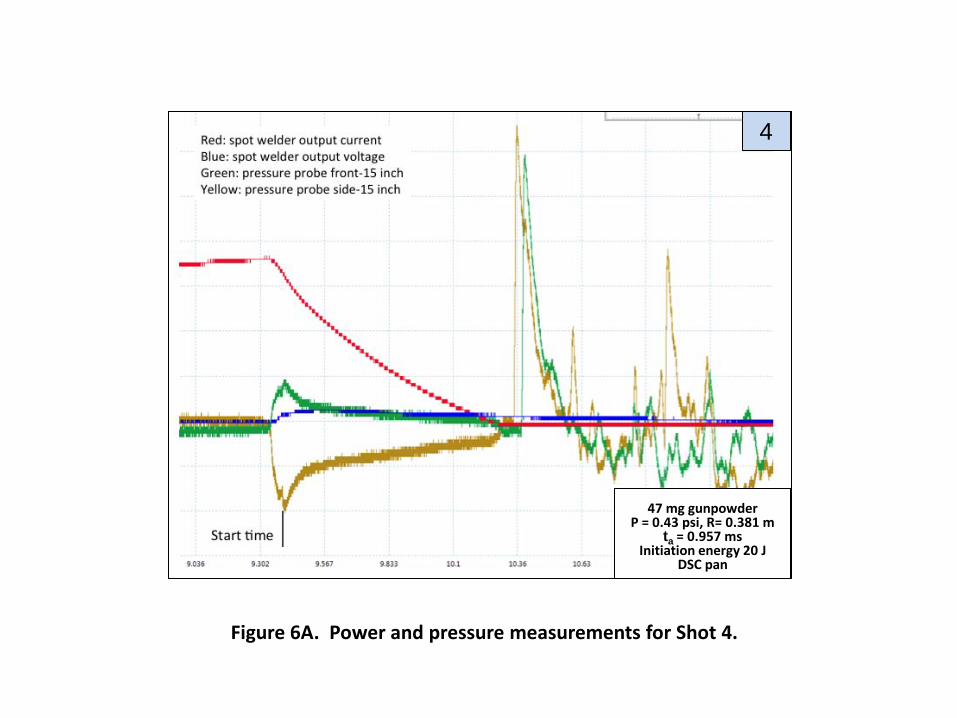
47 mg gunpowder
P = 0.43 psi, R= 0.381 m ta = 0.957 ms
Initiation energy 20 J DSC pan
4
Figure 6A. Power and pressure measurements for Shot 4.

Z Scaled Range (m/kg1/3)
0.01 0.1 1 10 100 1000
Peak
Ove
rpre
ssur
e (p
si)
0.01
0.1
1
10
100
1000
10000SHOT 4 CALCULATIONS
For 47 mg Gunpowder P = 0.43 psi R = 0.381 m Z = 28.7 m/kg1/3 = R/Wx
1/3
Wx = (R/Z)3 = (0.381/28.7) 3 Wx = 0.00000234 kg TNT = 2.34 mg TNT Ex = 10.8 J For 47 mg TNT at 0.381 m … Z = 0.381 m/0.000047 kg1/3 Z = 10.6 m/kg1/3 P = 1.33 psi W = 47 mg TNT W = 216 J For 2.44 mg H2O 0.96 g TNT/g H2O
47 mg TNT
47 mg Gunpowder
Figure 6B. TNT free-air curve analysis for peak overpressure, 47 mg Gunpowder.
Kinney & Graham TNT, Free Air Curve
(Standard Atmosphere)
47 mg gunpowder
P = 0.43 psi, R= 0.381 m ta = 0.957 ms
Initiation energy 20 J DSC pan
Z Scaled Range (m/kg1/3)
0.1 1 10 100 1000
Scal
ed T
ime-
of-A
rriv
al (m
s/kg
1/3 )
0.01
0.1
1
10
100
1000
77.0 ms/kg1/3
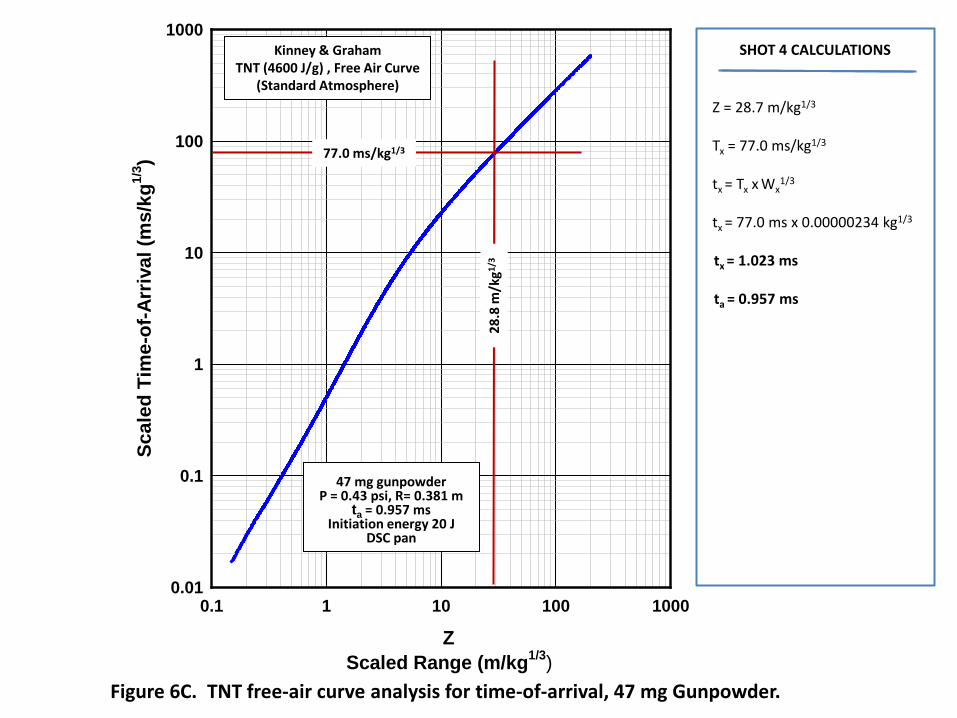
Figure 6C. TNT free-air curve analysis for time-of-arrival, 47 mg Gunpowder.
Kinney & Graham TNT (4600 J/g) , Free Air Curve
(Standard Atmosphere)
47 mg gunpowder
P = 0.43 psi, R= 0.381 m ta = 0.957 ms
Initiation energy 20 J DSC pan
SHOT 4 CALCULATIONS
Z = 28.7 m/kg1/3 Tx = 77.0 ms/kg1/3 tx = Tx x Wx
1/3 tx = 77.0 ms x 0.00000234 kg1/3 tx = 1.023 ms ta = 0.957 ms
28.8
m/k
g1/3

58 mg NH4NO3
P = 0.44 psi, R= 0.381 m ta = .977 ms
Initiation energy 20 J DSC pan
5
Figure 7A. Power and pressure measurements for Shot 5.

Z Scaled Range (m/kg1/3)
0.01 0.1 1 10 100 1000
Peak
Ove
rpre
ssur
e (p
si)
0.01
0.1
1
10
100
1000
10000SHOT 5 CALCULATIONS
For 58 mg NH4NO3 P = 0.44 psi R = 0.381 m Z = 28.0 m/kg1/3 = R/Wx
1/3
Wx = (R/Z)3 = (0.381/28.0) 3 Wx = 0.00000252 kg TNT = 2.52 mg TNT Ex = 11.6 J For 58 mg TNT at 0.381 m … Z = 0.381 m/0.000058 kg1/3 Z = 9.84 m/kg1/3 P = 1.5 psi W = 58 mg TNT W = 267 J For 26.1 mg H2O 0.0965 g TNT/g H2O
58 mg TNT
58 mg Ag
Figure 7B. TNT free-air curve analysis for peak overpressure, 58 mg NH4NO3.
Kinney & Graham TNT, Free Air Curve
(Standard Atmosphere)
58 mg NH4NO3
P = 0.44 psi, R= 0.381 m ta = .977 ms
Initiation energy 20 J DSC pan
Z Scaled Range (m/kg1/3)
0.1 1 10 100 1000
Scal
ed T
ime-
of-A
rriv
al (m
s/kg
1/3 )
0.01
0.1
1
10
100
1000
140 ms/kg1/3
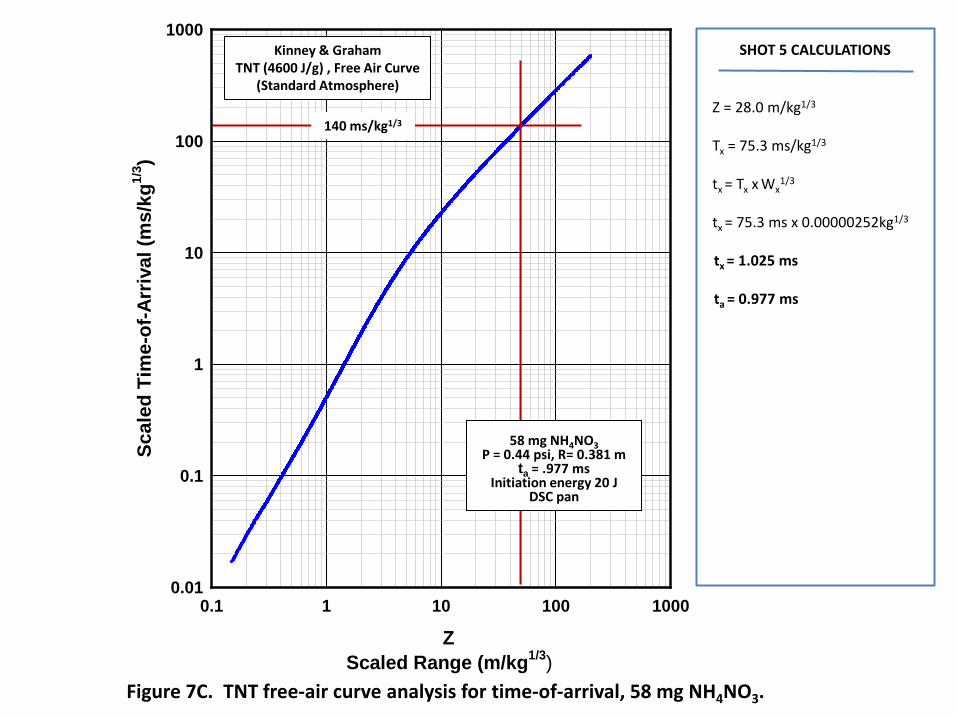
Figure 7C. TNT free-air curve analysis for time-of-arrival, 58 mg NH4NO3.
Kinney & Graham TNT (4600 J/g) , Free Air Curve
(Standard Atmosphere)
58 mg NH4NO3
P = 0.44 psi, R= 0.381 m ta = .977 ms
Initiation energy 20 J DSC pan
SHOT 5 CALCULATIONS
Z = 28.0 m/kg1/3 Tx = 75.3 ms/kg1/3 tx = Tx x Wx
1/3 tx = 75.3 ms x 0.00000252kg1/3 tx = 1.025 ms ta = 0.977 ms

Z Scaled Range (m/kg1/3)
0.01 0.1 1 10 100 1000
Peak
Ove
rpre
ssur
e (p
si)
0.01
0.1
1
10
100
1000
10000
70 mg TNT
70 mg Ag
Figure 4. TNT free-air curve analysis for peak overpressure, Hydrated Ag.
Kinney & Graham TNT, Free Air Curve
(Standard Atmosphere)
70 mg Hydrated Ag 100/1 molar ratio
P = 0.148 psi, R= 0.762 m ta = 2.08 ms
Initiation energy 20 J No DSC pan
SHOT 6 CALCULATIONS
For 70 mg hydrated Ag P = 0.148 psi R = 0.762 m Z = 81.4 m/kg1/3 = R/Wx
1/3
Wx = (R/Z)3 = (0.762/81.4) 3 Wx = 0.00000082 kg TNT = 0.82 mg TNT Ex = 3.8 J For 70 mg TNT at 0.762 m … Z = 0.762 m/0.000070 kg1/3 Z = 18.5 m/kg1/3 P = 0.70 psi W = 70 mg TNT W = 322 J For 0.1166 g H2O 9.75 g TNT/g H2O
Z Scaled Range (m/kg1/3)
0.1 1 10 100 1000
Scal
ed T
ime-
of-A
rriv
al (m
s/kg
1/3 )
0.01
0.1
1
10
100
1000
230 ms/kg1/3
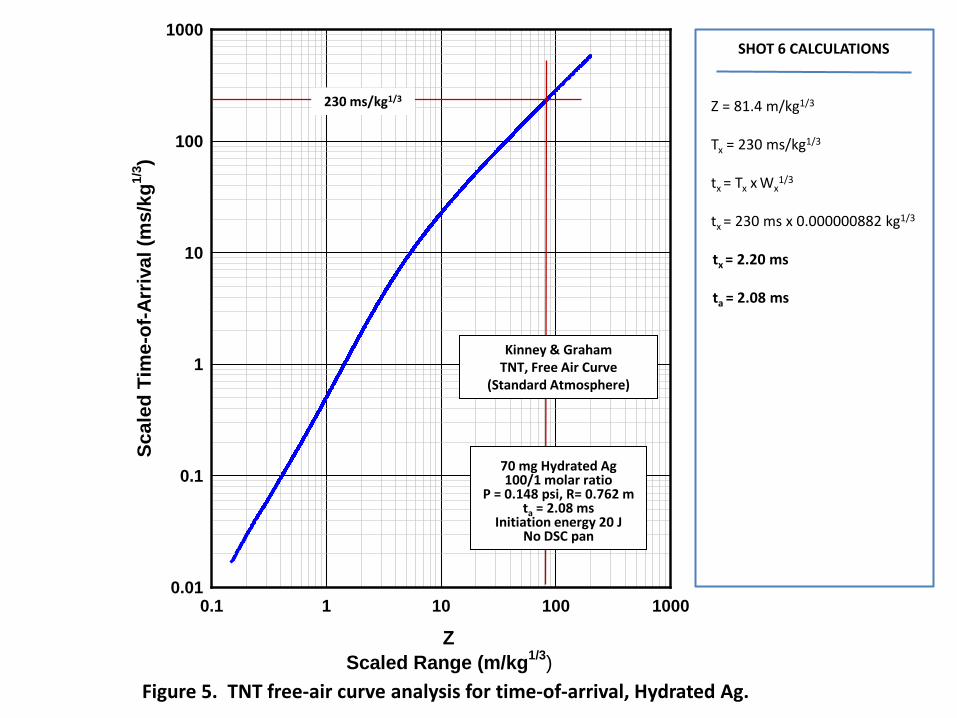
Figure 5. TNT free-air curve analysis for time-of-arrival, Hydrated Ag.
Kinney & Graham TNT, Free Air Curve
(Standard Atmosphere)
70 mg Hydrated Ag 100/1 molar ratio
P = 0.148 psi, R= 0.762 m ta = 2.08 ms
Initiation energy 20 J No DSC pan
SHOT 6 CALCULATIONS
Z = 81.4 m/kg1/3 Tx = 230 ms/kg1/3 tx = Tx x Wx
1/3 tx = 230 ms x 0.000000882 kg1/3 tx = 2.20 ms ta = 2.08 ms
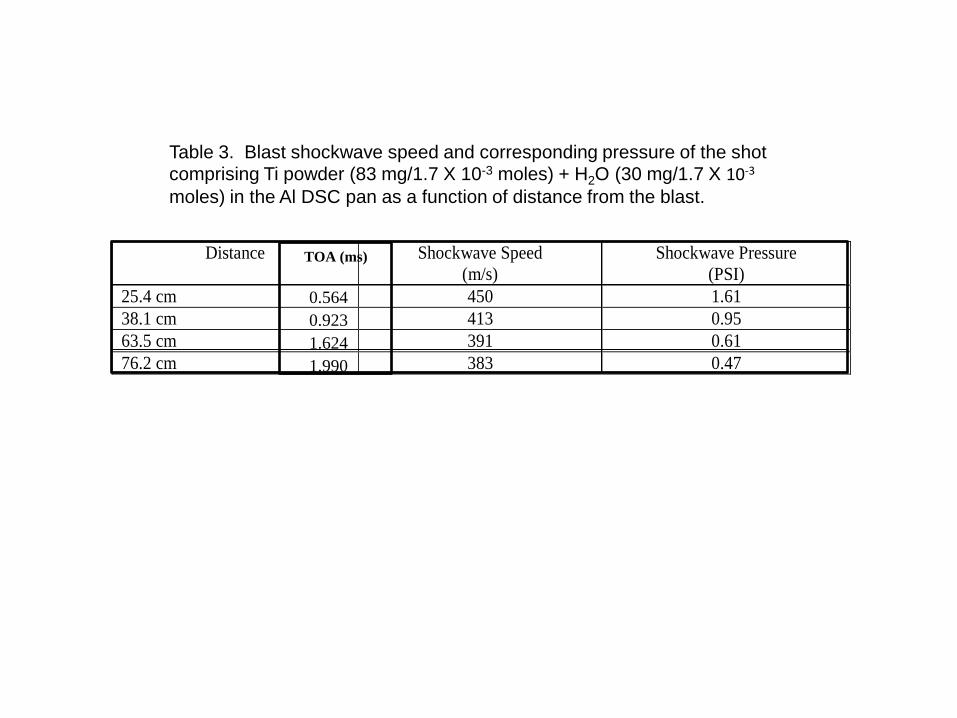
Table 3. Blast shockwave speed and corresponding pressure of the shot comprising Ti powder (83 mg/1.7 X 10-3 moles) + H2O (30 mg/1.7 X 10-3 moles) in the Al DSC pan as a function of distance from the blast.
Distance Shockwave Speed (m/s)
Shockwave Pressure (PSI)
25.4 cm 450 1.61 38.1 cm 413 0.95 63.5 cm 391 0.61 76.2 cm 383 0.47
TOA (ms)
0.564 0.923 1.624 1.990
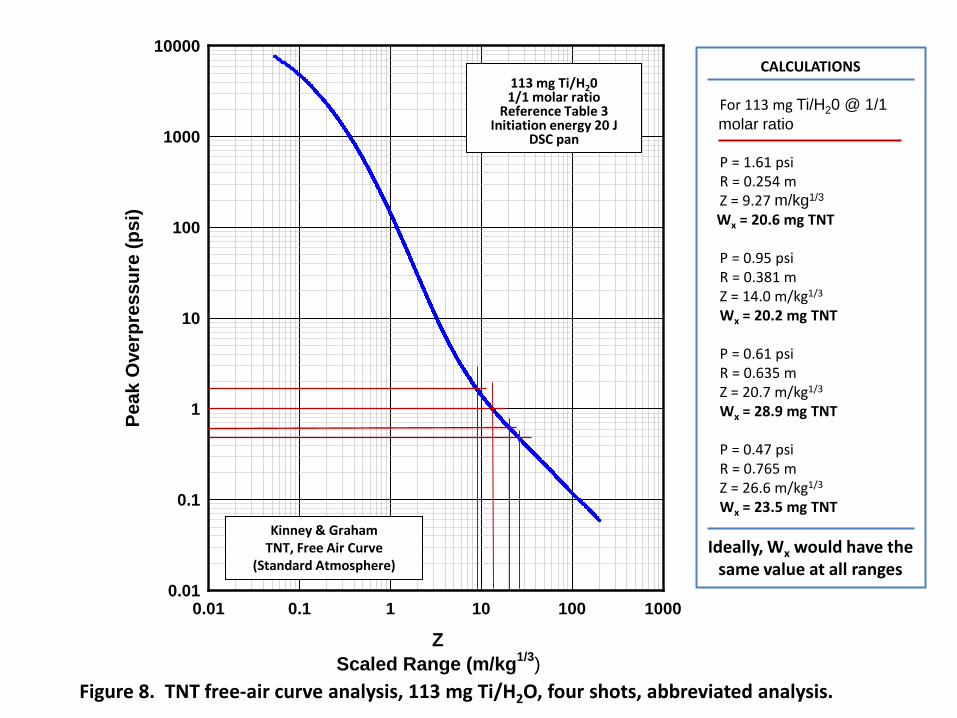
Z Scaled Range (m/kg1/3)
0.01 0.1 1 10 100 1000
Peak
Ove
rpre
ssur
e (p
si)
0.01
0.1
1
10
100
1000
10000CALCULATIONS
For 113 mg Ti/H20 @ 1/1 molar ratio P = 1.61 psi R = 0.254 m Z = 9.27 m/kg1/3
Wx = 20.6 mg TNT P = 0.95 psi R = 0.381 m Z = 14.0 m/kg1/3 Wx = 20.2 mg TNT P = 0.61 psi R = 0.635 m Z = 20.7 m/kg1/3 Wx = 28.9 mg TNT P = 0.47 psi R = 0.765 m Z = 26.6 m/kg1/3 Wx = 23.5 mg TNT Ideally, Wx would have the
same value at all ranges
Figure 8. TNT free-air curve analysis, 113 mg Ti/H2O, four shots, abbreviated analysis.
Kinney & Graham TNT, Free Air Curve
(Standard Atmosphere)
113 mg Ti/H20 1/1 molar ratio
Reference Table 3 Initiation energy 20 J
DSC pan

COMMENTS AND OBSERVATIONS
There is no known conventional chemistry that can take place between Ag and H2O (Shots 1 and 6) and very little if any in the 6 Ti/H2O shots. With respect to Shot 4 (gunpowder) and Shot 5 (AN), these compositions present the possibility of considerable energy release from conventional chemistry. However, as in the other events, we observe intense explosively formed plasma fields accompanied by EMP and blast effects where conventional chemistry could never achieve energy densities and temperatures (such as formed in nuclear detonations) sufficient to cause such effects at atmospheric pressure. There is a sound basis for concluding that it is the hydrogen transition reaction to H(1/4) catalyzed by HOH as predicted by Mills that accounts for the resulting explosively formed plasma field, EMP effects and blast wave in all of these events, including Shots 4 and 5. It is highly significant in the gunpowder and AN shots that under these initiation conditions, hydrino chemistry took precedence over conventional chemistry. Conventional chemistry may have taken place in Shots 4 and 5 but only after recombination following collapse of the plasma field and at late time (relatively) such that it could not possibly influence the blast wave. EUV diode measurements of the EUV emissions associated with the hydrino transition reaction suggests that hydrino chemistry in these events was active for nominally 400 microseconds. The AN shot performance was disappointing with respect to the blast energy considering the high H2O content of the AN molecule. This may have been due to the effect of reaction rate and inefficiency of hydrodynamic coupling into blast effects. AN is clearly an interesting molecule and should receive further study. All observations in these events are consistent with our conventional understanding of EUV, plasma, EMP and shock physics but there is no conventional explanation for the cause of it all. For that, you need Mills’ hydrino physics based on Classical Physics which explains it perfectly and completely.

COMMENTS AND OBSERVATIONS (continued)
It is convenient to make energy comparisons relative to TNT on the basis of both the total mass of each shot and the mass of H2O in each shot available to support hydrino formation, whether present in molecular form (H2O), as components is a complex molecule (NH4NO3) or as separate components in a mixture as in gunpowder. Result are presented in Table 1. Clearly, Shot 3 (Ti/H2O, 1/1 molar ratio) achieved an interesting level of blast energy equal to 25% of that of TNT in reference to total shot mass and 92% of that of TNT in reference to the mass of H2O. We believe that these energy levels based on shock wave analysis represents only a small fraction of the total energy. It is informative to compare the results of Shot 6 with calorimetry experiments reported in Reference 1, both of which had hydrated silver sources at 100/1 molar ratio and were initiated with high current low voltage discharges. In the calorimetry experiments net energy measured was nominally 2250 J/g total while the energy based on shock wave analysis was about 75 J/g total suggesting roughly 3.3 percent efficiency in hydrodynamic coupling, presumably due to the relatively slow reaction rate of the hydrated silver shots compared to typical molecular explosives. As shown in Table 1, the results of Shot 6, when presented in terms of the mass of H2O alone, shows an extraordinary energy of 44,870 J/g, almost 10 times that of TNT. These are extraordinary results but must be regarded as tentative and should be extensively verified before drawing any conclusions. It is worth noting that in regard to the hydrated silver shots at 100/1 molar ratio, while EUV emissions, thermal effects and reaction products data were collected previously for identical hydrated silver shots, in these tests mechanical effects in the form of blast waves resulting from the hydrino H(1/4) transition reaction, have for the first time been unequivocally demonstrated.

Additional calculations were performed to determine the maximum theoretical energy associated with forming H(1/4) hydrinos assuming that the HOH catalytic reaction occurs one time only. In this case (assumed to be conservative) it takes 3 H2O molecules to support 2 H(1/4) formation reactions. The result is 729,000 J/g H2O giving some indication of the extraordinary energy levels theoretically achievable (204 eV/H(1/4) formed. Given heat-of-formation value of H2O of 286,000 J/mole (15890 J/g), the ratio of theoretical hydrino energy based on H(1/4) formation relative to conventional combustion (H2 + ½ O2) energy is a factor of 45.9.
COMMENTS AND OBSERVATIONS (concluded)