Embed Size (px)
Citation preview
Canadian Venture Capital Review
Full Year 2017
Fred Thornhill, Reuters
Aaron Lynett, Reuters
Table of Contents
Canada’s VC Market in 2017 3
$ Invested and # Companies Financed 5
Top VC Deals 7
Top VC Investors 8
North American Rankings 10
Investor Type & Nationality 13
Canada by Sector & Stage 15
Canadian Dealmaking Abroad 18
VC Funds Raised 19
Public and M&A Exits 20
Venture Capital Returns 21
Explanatory Notes & Contacts 22
Canadian Venture Capital Market Activity in 2017
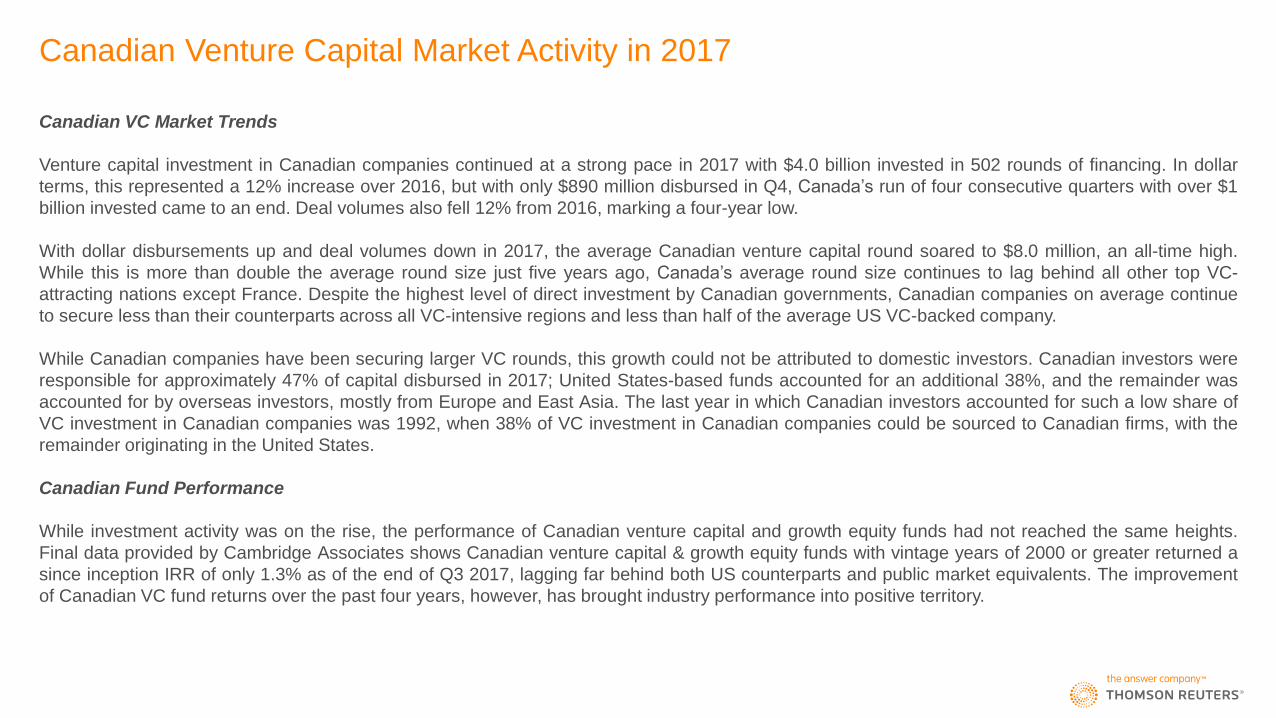
Canadian VC Market Trends
Venture capital investment in Canadian companies continued at a strong pace in 2017 with $4.0 billion invested in 502 rounds of financing. In dollar
terms, this represented a 12% increase over 2016, but with only $890 million disbursed in Q4, Canada’s run of four consecutive quarters with over $1
billion invested came to an end. Deal volumes also fell 12% from 2016, marking a four-year low.
With dollar disbursements up and deal volumes down in 2017, the average Canadian venture capital round soared to $8.0 million, an all-time high.
While this is more than double the average round size just five years ago, Canada’s average round size continues to lag behind all other top VC-
attracting nations except France. Despite the highest level of direct investment by Canadian governments, Canadian companies on average continue
to secure less than their counterparts across all VC-intensive regions and less than half of the average US VC-backed company.
While Canadian companies have been securing larger VC rounds, this growth could not be attributed to domestic investors. Canadian investors were
responsible for approximately 47% of capital disbursed in 2017; United States-based funds accounted for an additional 38%, and the remainder was
accounted for by overseas investors, mostly from Europe and East Asia. The last year in which Canadian investors accounted for such a low share of
VC investment in Canadian companies was 1992, when 38% of VC investment in Canadian companies could be sourced to Canadian firms, with the
remainder originating in the United States.
Canadian Fund Performance
While investment activity was on the rise, the performance of Canadian venture capital and growth equity funds had not reached the same heights.
Final data provided by Cambridge Associates shows Canadian venture capital & growth equity funds with vintage years of 2000 or greater returned a
since inception IRR of only 1.3% as of the end of Q3 2017, lagging far behind both US counterparts and public market equivalents. The improvement
of Canadian VC fund returns over the past four years, however, has brought industry performance into positive territory.
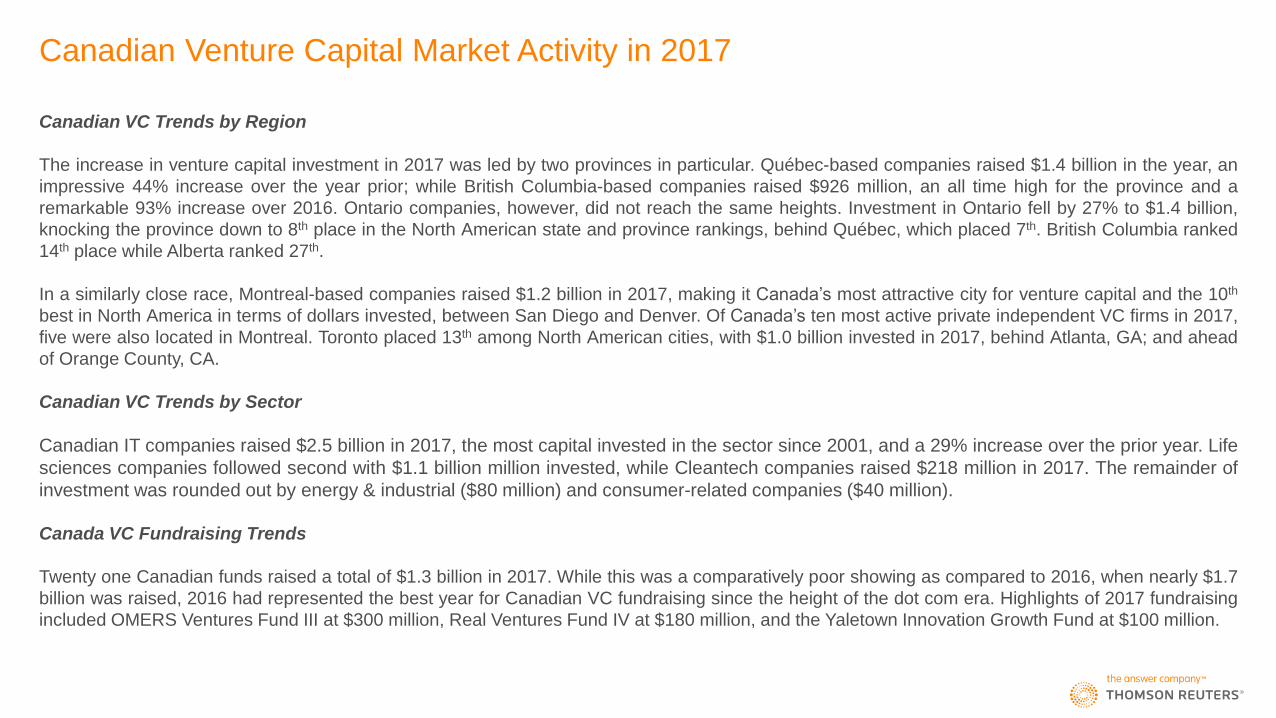
Canadian VC Trends by Region
The increase in venture capital investment in 2017 was led by two provinces in particular. Québec-based companies raised $1.4 billion in the year, an
impressive 44% increase over the year prior; while British Columbia-based companies raised $926 million, an all time high for the province and a
remarkable 93% increase over 2016. Ontario companies, however, did not reach the same heights. Investment in Ontario fell by 27% to $1.4 billion,
knocking the province down to 8th place in the North American state and province rankings, behind Québec, which placed 7th. British Columbia ranked
14th place while Alberta ranked 27th.
In a similarly close race, Montreal-based companies raised $1.2 billion in 2017, making it Canada’s most attractive city for venture capital and the 10th
best in North America in terms of dollars invested, between San Diego and Denver. Of Canada’s ten most active private independent VC firms in 2017,
five were also located in Montreal. Toronto placed 13th among North American cities, with $1.0 billion invested in 2017, behind Atlanta, GA; and ahead
of Orange County, CA.
Canadian VC Trends by Sector
Canadian IT companies raised $2.5 billion in 2017, the most capital invested in the sector since 2001, and a 29% increase over the prior year. Life
sciences companies followed second with $1.1 billion million invested, while Cleantech companies raised $218 million in 2017. The remainder of
investment was rounded out by energy & industrial ($80 million) and consumer-related companies ($40 million).
Canada VC Fundraising Trends
Twenty one Canadian funds raised a total of $1.3 billion in 2017. While this was a comparatively poor showing as compared to 2016, when nearly $1.7
billion was raised, 2016 had represented the best year for Canadian VC fundraising since the height of the dot com era. Highlights of 2017 fundraising
included OMERS Ventures Fund III at $300 million, Real Ventures Fund IV at $180 million, and the Yaletown Innovation Growth Fund at $100 million.
Canadian Venture Capital Market Activity in 2017
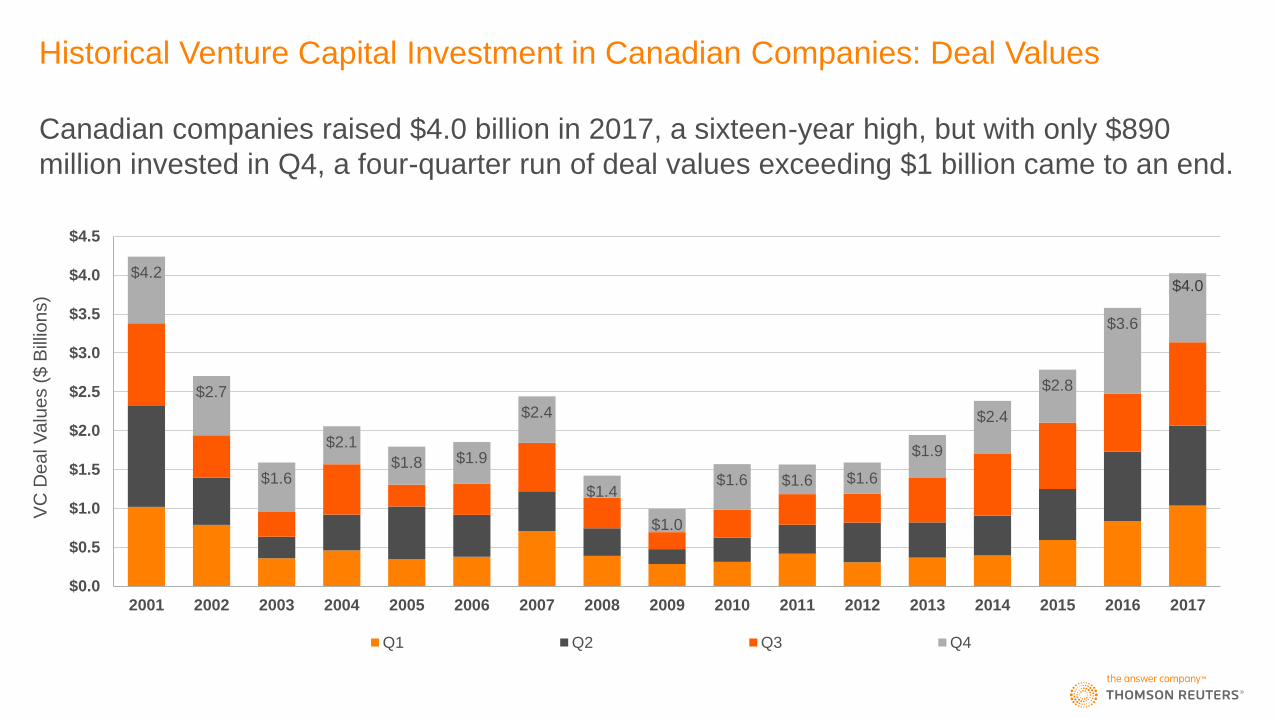
Historical Venture Capital Investment in Canadian Companies: Deal Values
Canadian companies raised $4.0 billion in 2017, a sixteen-year high, but with only $890
million invested in Q4, a four-quarter run of deal values exceeding $1 billion came to an end.
$4.0 $4.2
$2.7
$1.6
$2.1
$1.8 $1.9
$2.4
$1.4
$1.0
$1.6 $1.6 $1.6
$1.9
$2.4
$2.8
$3.6
$0.0
$0.5
$1.0
$1.5
$2.0
$2.5
$3.0
$3.5
$4.0
$4.5
2001 2002 2003 2004 2005 2006 2007 2008 2009 2010 2011 2012 2013 2014 2015 2016 2017
VC
De
al V
alu
es (
$ B
illio
ns)
Q1 Q2 Q3 Q4
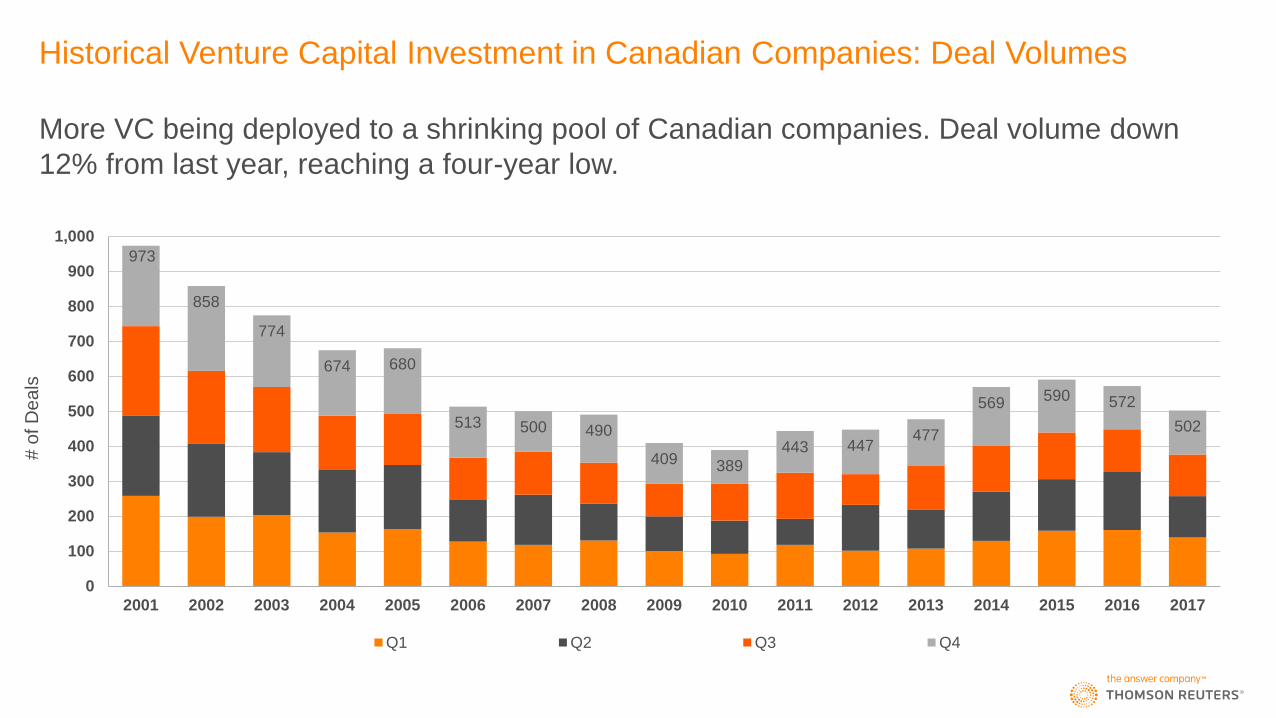
Historical Venture Capital Investment in Canadian Companies: Deal Volumes
More VC being deployed to a shrinking pool of Canadian companies. Deal volume down
12% from last year, reaching a four-year low.
973
858
774
674 680
513 500 490
409 389
443 447 477
569 590 572
502
0
100
200
300
400
500
600
700
800
900
1,000
2001 2002 2003 2004 2005 2006 2007 2008 2009 2010 2011 2012 2013 2014 2015 2016 2017
Q1 Q2 Q3 Q4
# o
f D
ea
ls
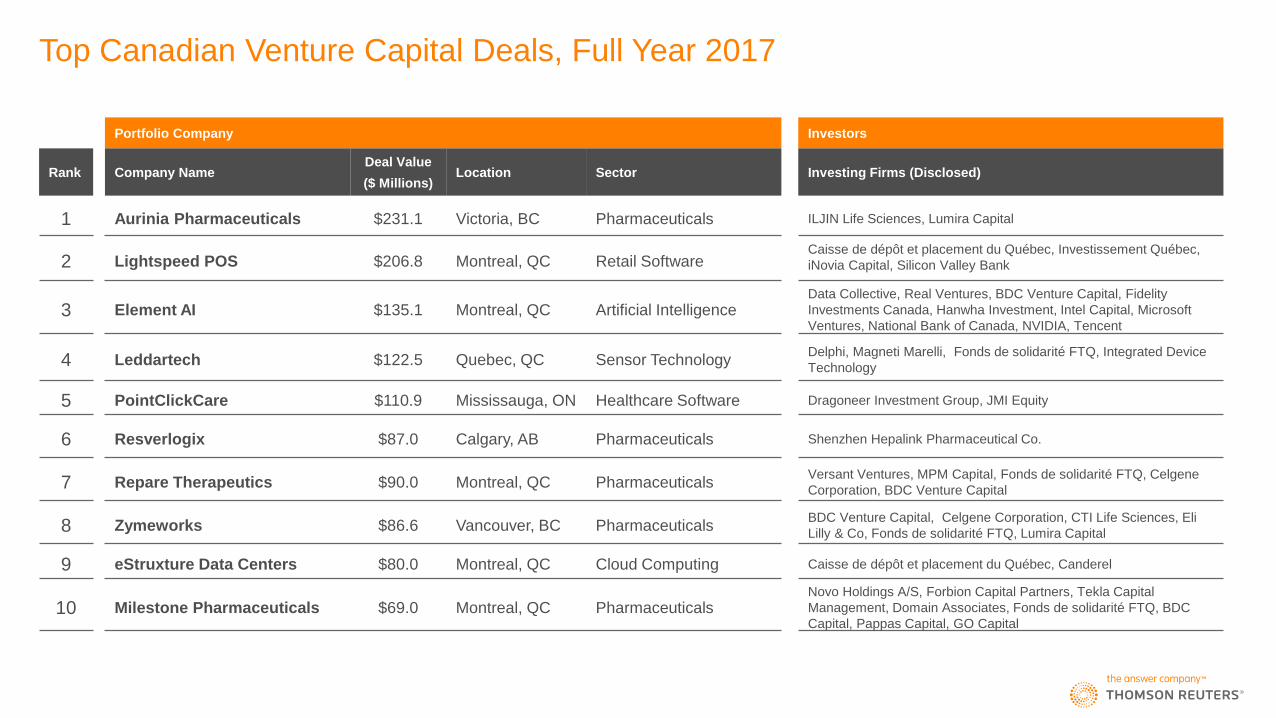
Top Canadian Venture Capital Deals, Full Year 2017
Portfolio Company Investors
Rank Company Name Deal Value
($ Millions) Location Sector Investing Firms (Disclosed)
1 Aurinia Pharmaceuticals $231.1 Victoria, BC Pharmaceuticals ILJIN Life Sciences, Lumira Capital
2 Lightspeed POS $206.8 Montreal, QC Retail Software Caisse de dépôt et placement du Québec, Investissement Québec,
iNovia Capital, Silicon Valley Bank
3 Element AI $135.1 Montreal, QC Artificial Intelligence Data Collective, Real Ventures, BDC Venture Capital, Fidelity
Investments Canada, Hanwha Investment, Intel Capital, Microsoft
Ventures, National Bank of Canada, NVIDIA, Tencent
4 Leddartech $122.5 Quebec, QC Sensor Technology Delphi, Magneti Marelli, Fonds de solidarité FTQ, Integrated Device
Technology
5 PointClickCare $110.9 Mississauga, ON Healthcare Software Dragoneer Investment Group, JMI Equity
6 Resverlogix $87.0 Calgary, AB Pharmaceuticals Shenzhen Hepalink Pharmaceutical Co.
7 Repare Therapeutics $90.0 Montreal, QC Pharmaceuticals Versant Ventures, MPM Capital, Fonds de solidarité FTQ, Celgene
Corporation, BDC Venture Capital
8 Zymeworks $86.6 Vancouver, BC Pharmaceuticals BDC Venture Capital, Celgene Corporation, CTI Life Sciences, Eli
Lilly & Co, Fonds de solidarité FTQ, Lumira Capital
9 eStruxture Data Centers $80.0 Montreal, QC Cloud Computing Caisse de dépôt et placement du Québec, Canderel
10 Milestone Pharmaceuticals $69.0 Montreal, QC Pharmaceuticals Novo Holdings A/S, Forbion Capital Partners, Tekla Capital
Management, Domain Associates, Fonds de solidarité FTQ, BDC
Capital, Pappas Capital, GO Capital
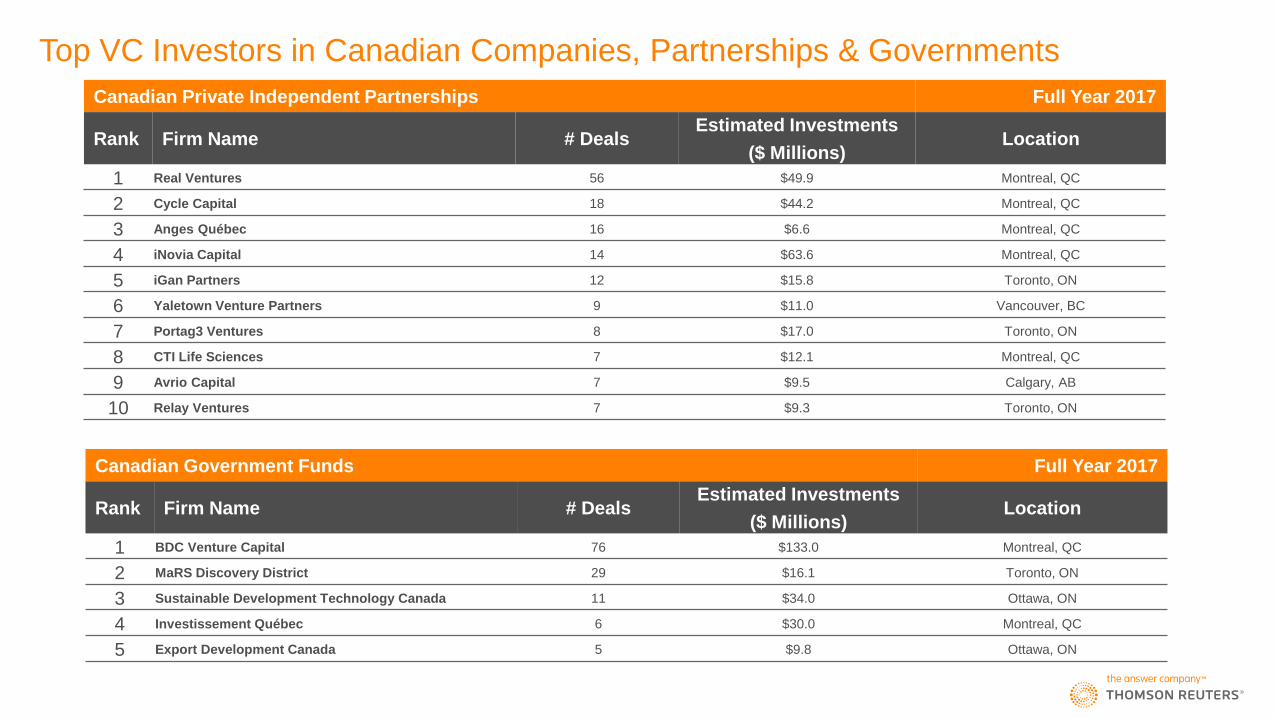
Top VC Investors in Canadian Companies, Partnerships & Governments
Canadian Government Funds Full Year 2017
Rank Firm Name # Deals Estimated Investments
($ Millions) Location
1 BDC Venture Capital 76 $133.0 Montreal, QC
2 MaRS Discovery District 29 $16.1 Toronto, ON
3 Sustainable Development Technology Canada 11 $34.0 Ottawa, ON
4 Investissement Québec 6 $30.0 Montreal, QC
5 Export Development Canada 5 $9.8 Ottawa, ON
Canadian Private Independent Partnerships Full Year 2017
Rank Firm Name # Deals Estimated Investments
($ Millions) Location
1 Real Ventures 56 $49.9 Montreal, QC
2 Cycle Capital 18 $44.2 Montreal, QC
3 Anges Québec 16 $6.6 Montreal, QC
4 iNovia Capital 14 $63.6 Montreal, QC
5 iGan Partners 12 $15.8 Toronto, ON
6 Yaletown Venture Partners 9 $11.0 Vancouver, BC
7 Portag3 Ventures 8 $17.0 Toronto, ON
8 CTI Life Sciences 7 $12.1 Montreal, QC
9 Avrio Capital 7 $9.5 Calgary, AB
10 Relay Ventures 7 $9.3 Toronto, ON
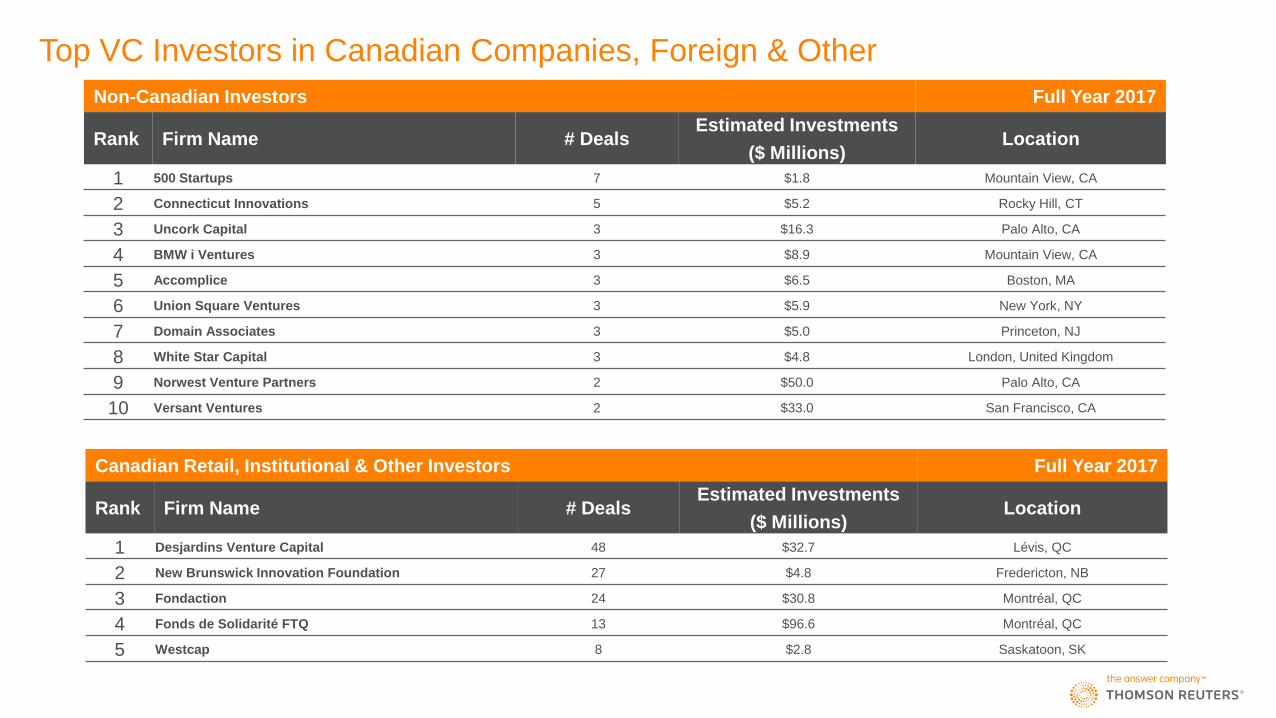
Top VC Investors in Canadian Companies, Foreign & Other
Canadian Retail, Institutional & Other Investors Full Year 2017
Rank Firm Name # Deals Estimated Investments
($ Millions) Location
1 Desjardins Venture Capital 48 $32.7 Lévis, QC
2 New Brunswick Innovation Foundation 27 $4.8 Fredericton, NB
3 Fondaction 24 $30.8 Montréal, QC
4 Fonds de Solidarité FTQ 13 $96.6 Montréal, QC
5 Westcap 8 $2.8 Saskatoon, SK
Non-Canadian Investors Full Year 2017
Rank Firm Name # Deals Estimated Investments
($ Millions) Location
1 500 Startups 7 $1.8 Mountain View, CA
2 Connecticut Innovations 5 $5.2 Rocky Hill, CT
3 Uncork Capital 3 $16.3 Palo Alto, CA
4 BMW i Ventures 3 $8.9 Mountain View, CA
5 Accomplice 3 $6.5 Boston, MA
6 Union Square Ventures 3 $5.9 New York, NY
7 Domain Associates 3 $5.0 Princeton, NJ
8 White Star Capital 3 $4.8 London, United Kingdom
9 Norwest Venture Partners 2 $50.0 Palo Alto, CA
10 Versant Ventures 2 $33.0 San Francisco, CA
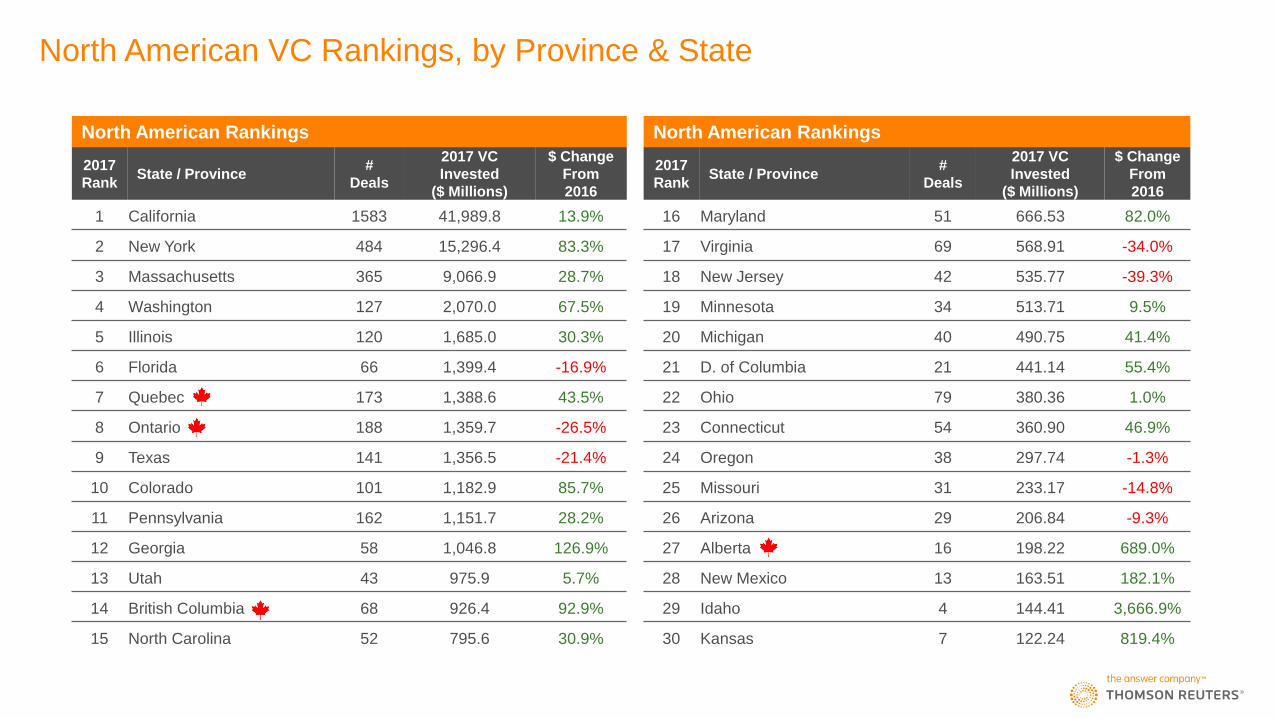
North American VC Rankings, by Province & State
North American Rankings North American Rankings
2017
Rank State / Province
#
Deals
2017 VC
Invested
($ Millions)
$ Change
From
2016
2017
Rank State / Province
#
Deals
2017 VC
Invested
($ Millions)
$ Change
From
2016
1 California 1583 41,989.8 13.9% 16 Maryland 51 666.53 82.0%
2 New York 484 15,296.4 83.3% 17 Virginia 69 568.91 -34.0%
3 Massachusetts 365 9,066.9 28.7% 18 New Jersey 42 535.77 -39.3%
4 Washington 127 2,070.0 67.5% 19 Minnesota 34 513.71 9.5%
5 Illinois 120 1,685.0 30.3% 20 Michigan 40 490.75 41.4%
6 Florida 66 1,399.4 -16.9% 21 D. of Columbia 21 441.14 55.4%
7 Quebec 173 1,388.6 43.5% 22 Ohio 79 380.36 1.0%
8 Ontario 188 1,359.7 -26.5% 23 Connecticut 54 360.90 46.9%
9 Texas 141 1,356.5 -21.4% 24 Oregon 38 297.74 -1.3%
10 Colorado 101 1,182.9 85.7% 25 Missouri 31 233.17 -14.8%
11 Pennsylvania 162 1,151.7 28.2% 26 Arizona 29 206.84 -9.3%
12 Georgia 58 1,046.8 126.9% 27 Alberta 16 198.22 689.0%
13 Utah 43 975.9 5.7% 28 New Mexico 13 163.51 182.1%
14 British Columbia 68 926.4 92.9% 29 Idaho 4 144.41 3,666.9%
15 North Carolina 52 795.6 30.9% 30 Kansas 7 122.24 819.4%
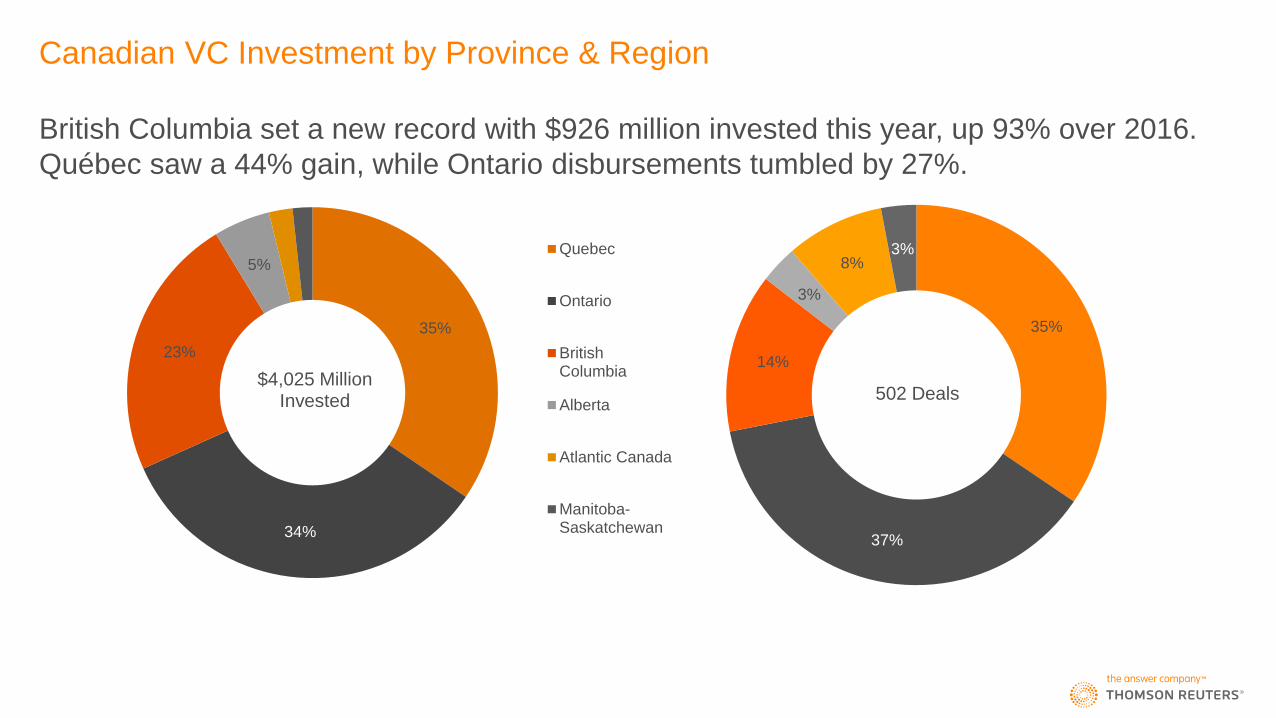
Canadian VC Investment by Province & Region
British Columbia set a new record with $926 million invested this year, up 93% over 2016.
Québec saw a 44% gain, while Ontario disbursements tumbled by 27%.
35%
34%
23%
5%
$4,025 Million Invested
Quebec
Ontario
BritishColumbia
Alberta
Atlantic Canada
Manitoba-Saskatchewan
35%
37%
14%
3%
8% 3%
502 Deals
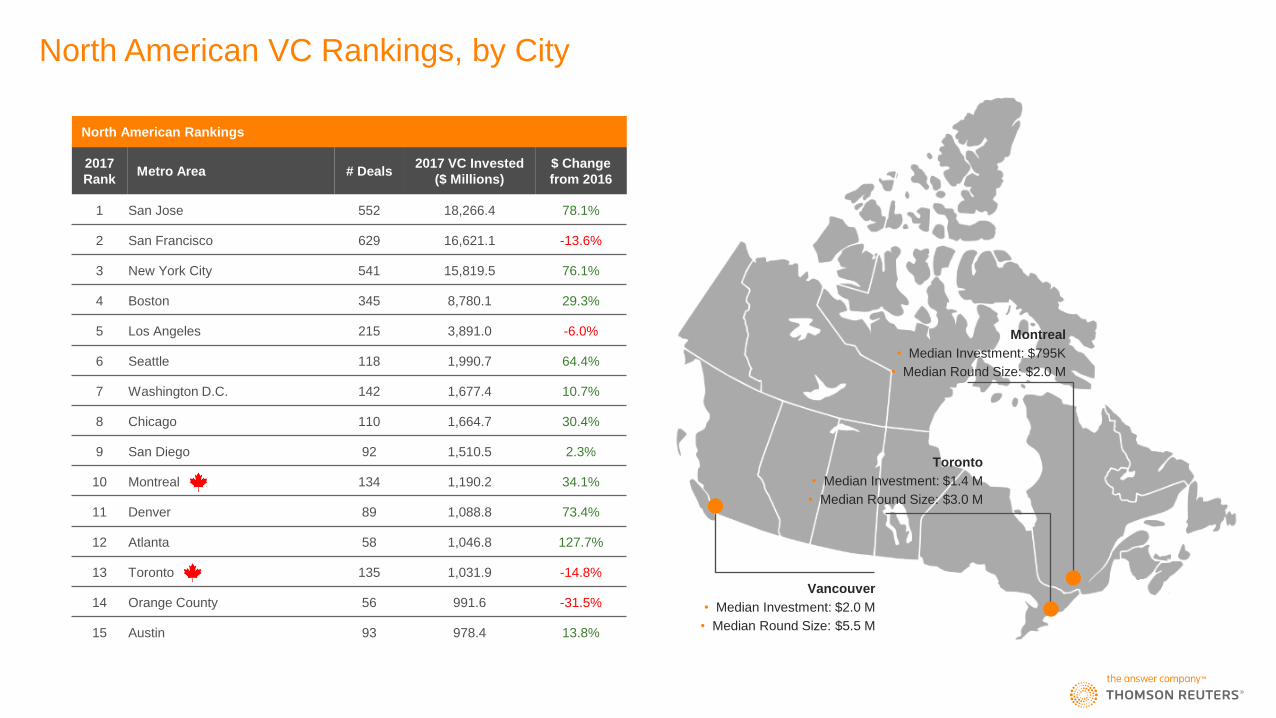
North American VC Rankings, by City
North American Rankings
2017
Rank Metro Area # Deals
2017 VC Invested
($ Millions)
$ Change
from 2016
1 San Jose 552 18,266.4 78.1%
2 San Francisco 629 16,621.1 -13.6%
3 New York City 541 15,819.5 76.1%
4 Boston 345 8,780.1 29.3%
5 Los Angeles 215 3,891.0 -6.0%
6 Seattle 118 1,990.7 64.4%
7 Washington D.C. 142 1,677.4 10.7%
8 Chicago 110 1,664.7 30.4%
9 San Diego 92 1,510.5 2.3%
10 Montreal 134 1,190.2 34.1%
11 Denver 89 1,088.8 73.4%
12 Atlanta 58 1,046.8 127.7%
13 Toronto 135 1,031.9 -14.8%
14 Orange County 56 991.6 -31.5%
15 Austin 93 978.4 13.8%
Vancouver
• Median Investment: $2.0 M
• Median Round Size: $5.5 M
Toronto
• Median Investment: $1.4 M
• Median Round Size: $3.0 M
Montreal
• Median Investment: $795K
• Median Round Size: $2.0 M
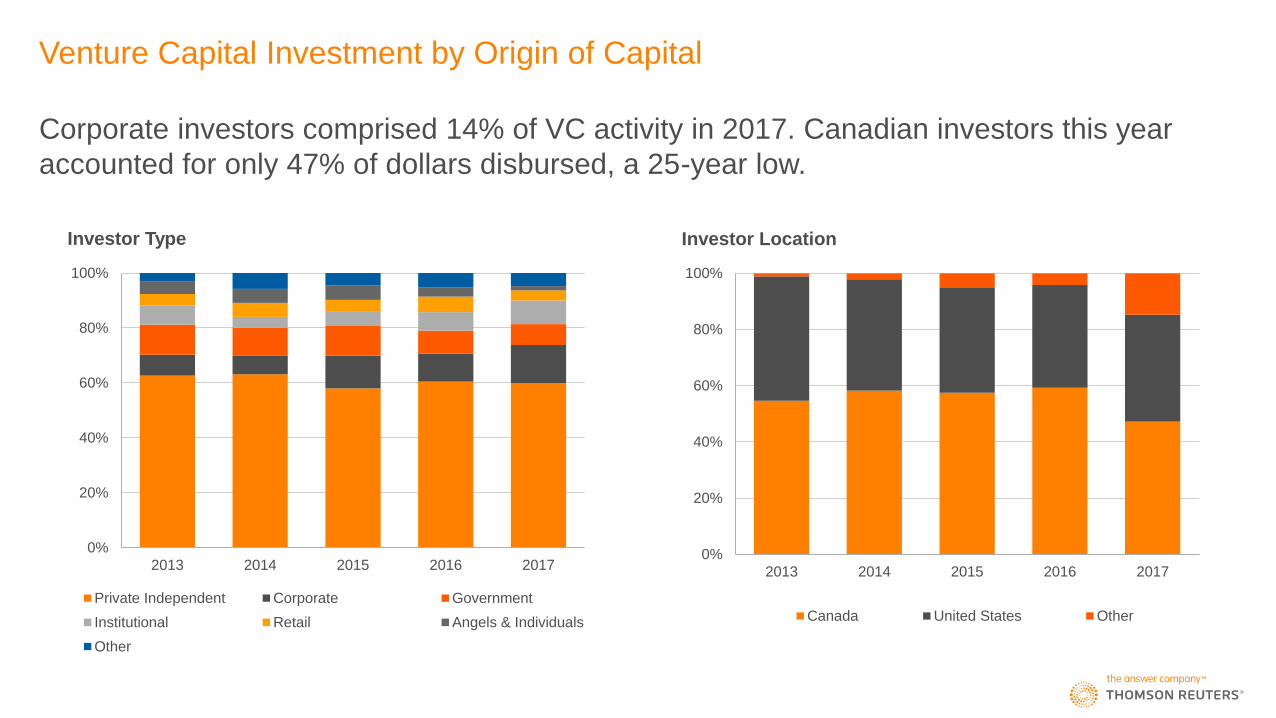
Venture Capital Investment by Origin of Capital
Corporate investors comprised 14% of VC activity in 2017. Canadian investors this year
accounted for only 47% of dollars disbursed, a 25-year low.
0%
20%
40%
60%
80%
100%
2013 2014 2015 2016 2017
Investor Type
Private Independent Corporate Government
Institutional Retail Angels & Individuals
Other
0%
20%
40%
60%
80%
100%
2013 2014 2015 2016 2017
Investor Location
Canada United States Other
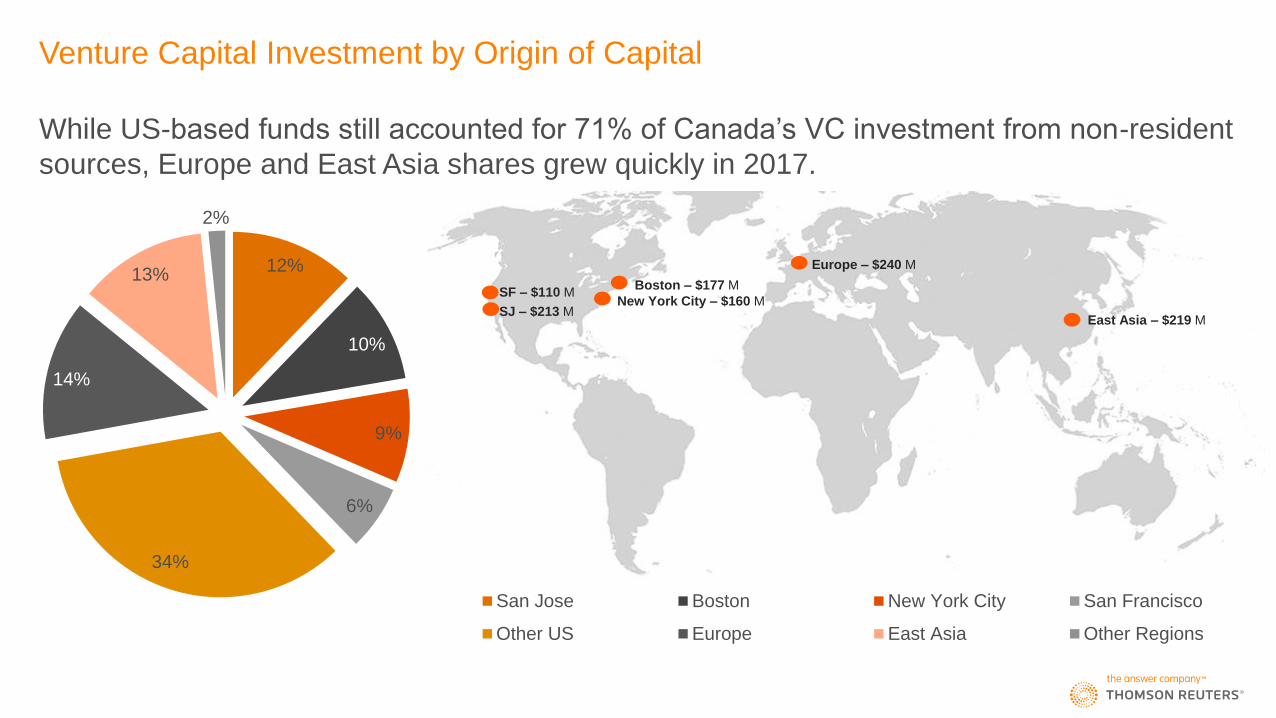
While US-based funds still accounted for 71% of Canada’s VC investment from non-resident
sources, Europe and East Asia shares grew quickly in 2017.
12%
10%
9%
6%
34%
14%
13%
2%
San Jose Boston New York City San Francisco
Other US Europe East Asia Other Regions
Venture Capital Investment by Origin of Capital
SJ – $213 M
SF – $110 M Boston – $177 M
New York City – $160 M
Europe – $240 M
East Asia – $219 M
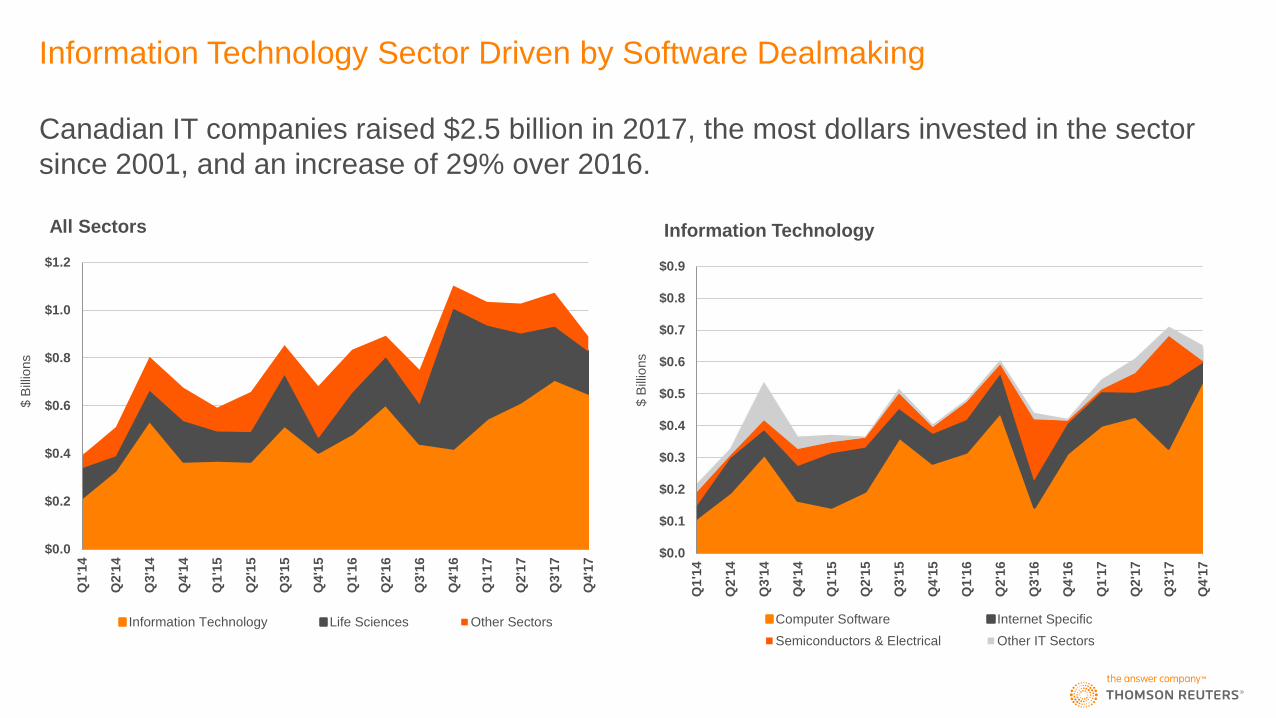
Information Technology Sector Driven by Software Dealmaking
Canadian IT companies raised $2.5 billion in 2017, the most dollars invested in the sector
since 2001, and an increase of 29% over 2016.
$0.0
$0.2
$0.4
$0.6
$0.8
$1.0
$1.2
Q1'1
4
Q2'1
4
Q3'1
4
Q4'1
4
Q1'1
5
Q2'1
5
Q3'1
5
Q4'1
5
Q1'1
6
Q2'1
6
Q3'1
6
Q4'1
6
Q1'1
7
Q2'1
7
Q3'1
7
Q4'1
7
Th
ou
san
ds
All Sectors
Information Technology Life Sciences Other Sectors
$0.0
$0.1
$0.2
$0.3
$0.4
$0.5
$0.6
$0.7
$0.8
$0.9
Q1'1
4
Q2'1
4
Q3'1
4
Q4'1
4
Q1'1
5
Q2'1
5
Q3'1
5
Q4'1
5
Q1'1
6
Q2'1
6
Q3'1
6
Q4'1
6
Q1'1
7
Q2'1
7
Q3'1
7
Q4'1
7
Th
ou
san
ds
Information Technology
Computer Software Internet Specific
Semiconductors & Electrical Other IT Sectors
$ B
illio
ns
$ B
illio
ns
$0.00
$0.10
$0.20
$0.30
$0.40
$0.50
$0.60
Q1'1
4
Q2'1
4
Q3'1
4
Q4'1
4
Q1'1
5
Q2'1
5
Q3'1
5
Q4'1
5
Q1'1
6
Q2'1
6
Q3'1
6
Q4'1
6
Q1'1
7
Q2'1
7
Q3'1
7
Q4'1
7
Th
ou
san
ds
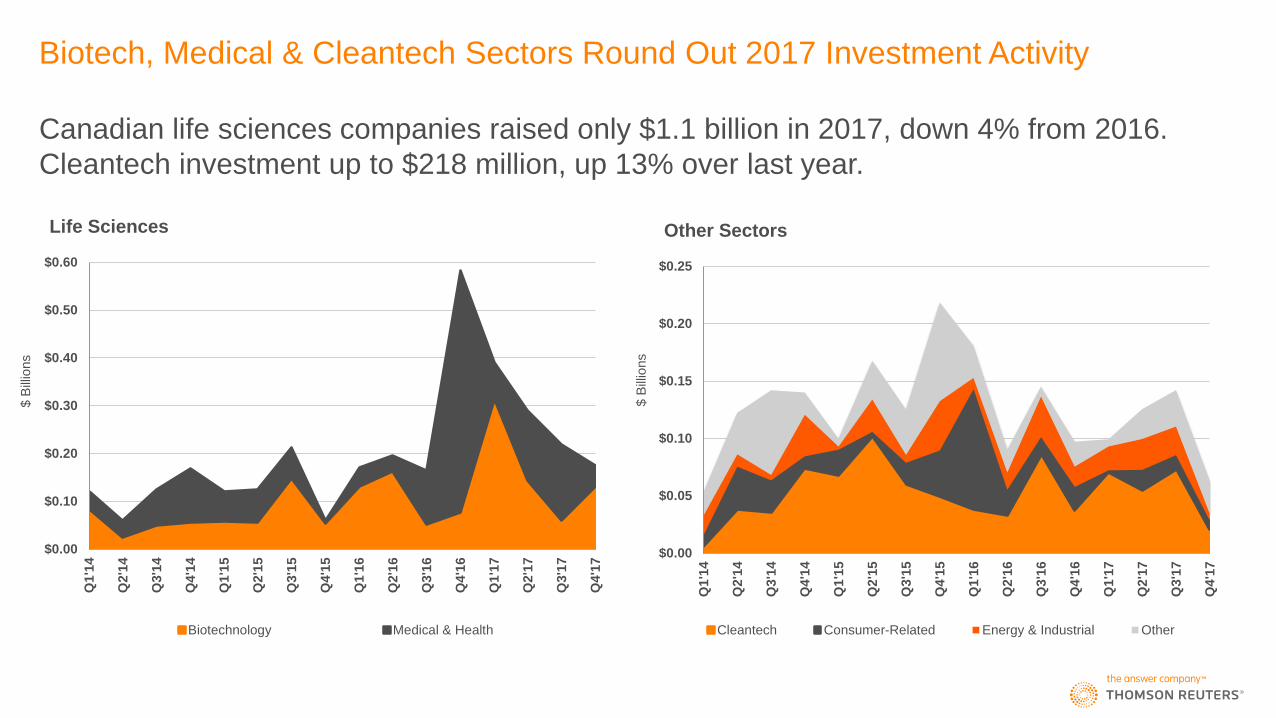
Life Sciences
Biotechnology Medical & Health
$0.00
$0.05
$0.10
$0.15
$0.20
$0.25
Q1'1
4
Q2'1
4
Q3'1
4
Q4'1
4
Q1'1
5
Q2'1
5
Q3'1
5
Q4'1
5
Q1'1
6
Q2'1
6
Q3'1
6
Q4'1
6
Q1'1
7
Q2'1
7
Q3'1
7
Q4'1
7
Th
ou
san
ds
Other Sectors
Cleantech Consumer-Related Energy & Industrial Other
$ B
illio
ns
$ B
illio
ns
Biotech, Medical & Cleantech Sectors Round Out 2017 Investment Activity
Canadian life sciences companies raised only $1.1 billion in 2017, down 4% from 2016.
Cleantech investment up to $218 million, up 13% over last year.
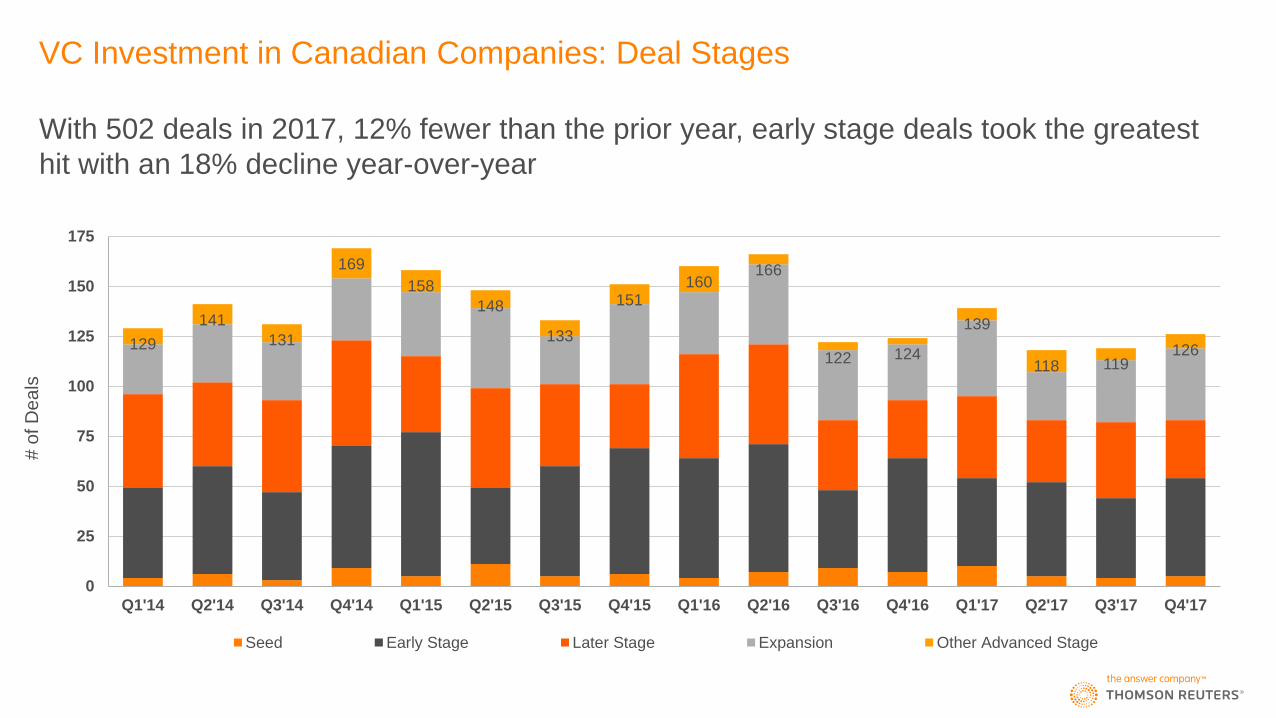
VC Investment in Canadian Companies: Deal Stages
With 502 deals in 2017, 12% fewer than the prior year, early stage deals took the greatest
hit with an 18% decline year-over-year
129
141
131
169
158
148
133
151 160
166
122 124
139
118 119 126
0
25
50
75
100
125
150
175
Q1'14 Q2'14 Q3'14 Q4'14 Q1'15 Q2'15 Q3'15 Q4'15 Q1'16 Q2'16 Q3'16 Q4'16 Q1'17 Q2'17 Q3'17 Q4'17
Seed Early Stage Later Stage Expansion Other Advanced Stage
# o
f D
ea
ls
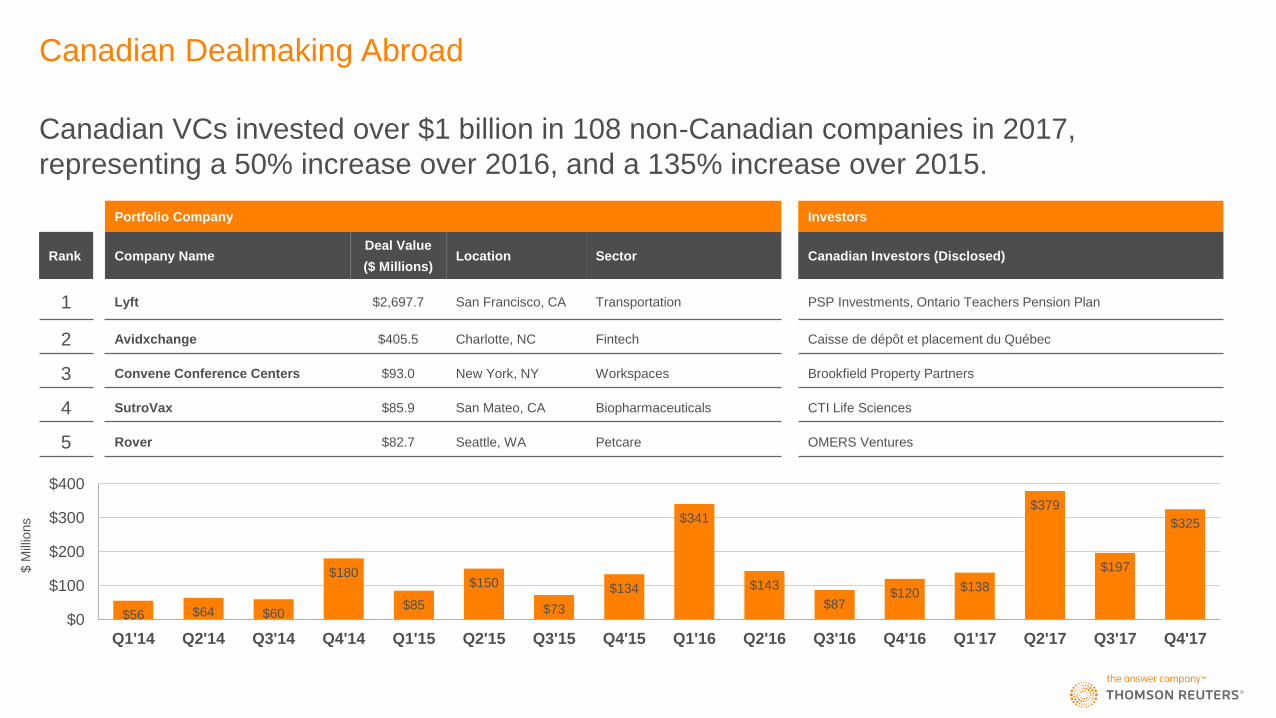
Canadian Dealmaking Abroad
Portfolio Company Investors
Rank Company Name Deal Value
($ Millions) Location Sector Canadian Investors (Disclosed)
1 Lyft $2,697.7 San Francisco, CA Transportation PSP Investments, Ontario Teachers Pension Plan
2 Avidxchange $405.5 Charlotte, NC Fintech Caisse de dépôt et placement du Québec
3 Convene Conference Centers $93.0 New York, NY Workspaces Brookfield Property Partners
4 SutroVax $85.9 San Mateo, CA Biopharmaceuticals CTI Life Sciences
5 Rover $82.7 Seattle, WA Petcare OMERS Ventures
Canadian VCs invested over $1 billion in 108 non-Canadian companies in 2017,
representing a 50% increase over 2016, and a 135% increase over 2015.
$56 $64 $60
$180
$85
$150
$73
$134
$341
$143
$87 $120 $138
$379
$197
$325
$0
$100
$200
$300
$400
Q1'14 Q2'14 Q3'14 Q4'14 Q1'15 Q2'15 Q3'15 Q4'15 Q1'16 Q2'16 Q3'16 Q4'16 Q1'17 Q2'17 Q3'17 Q4'17
$ M
illio
ns
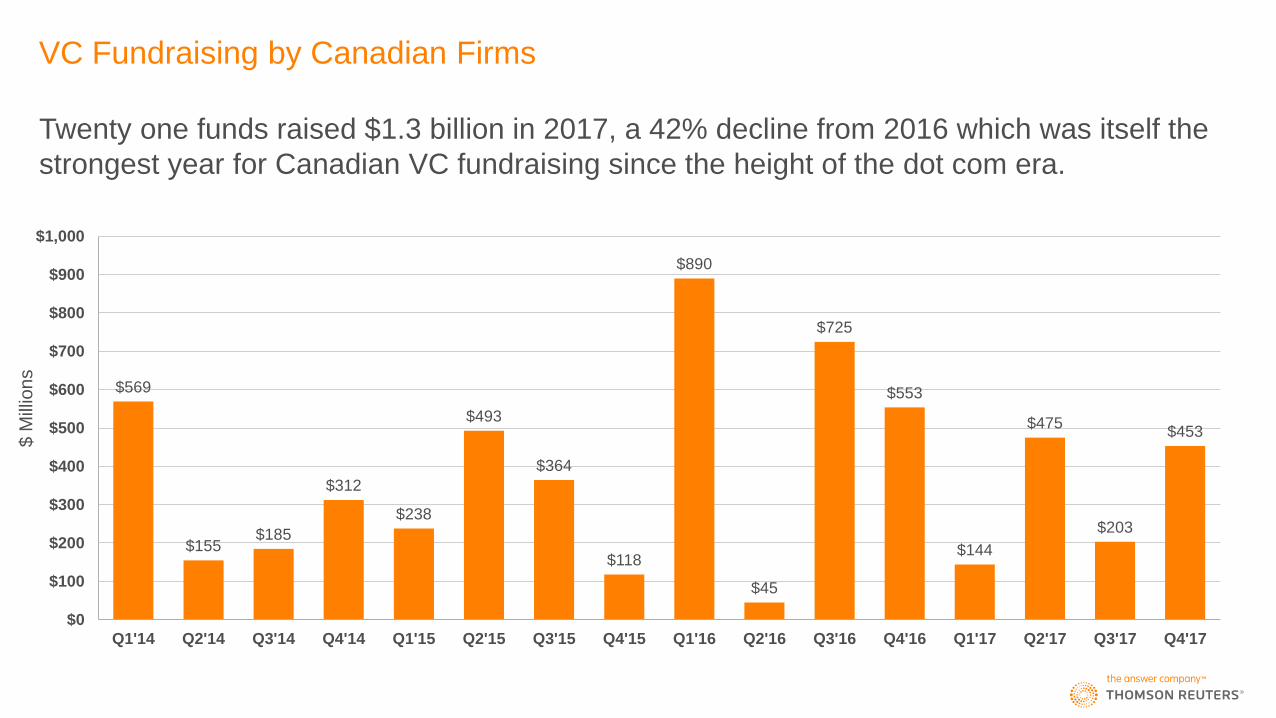
VC Fundraising by Canadian Firms
Twenty one funds raised $1.3 billion in 2017, a 42% decline from 2016 which was itself the
strongest year for Canadian VC fundraising since the height of the dot com era.
$569
$155 $185
$312
$238
$493
$364
$118
$890
$45
$725
$553
$144
$475
$203
$453
$0
$100
$200
$300
$400
$500
$600
$700
$800
$900
$1,000
Q1'14 Q2'14 Q3'14 Q4'14 Q1'15 Q2'15 Q3'15 Q4'15 Q1'16 Q2'16 Q3'16 Q4'16 Q1'17 Q2'17 Q3'17 Q4'17
$ M
illio
ns
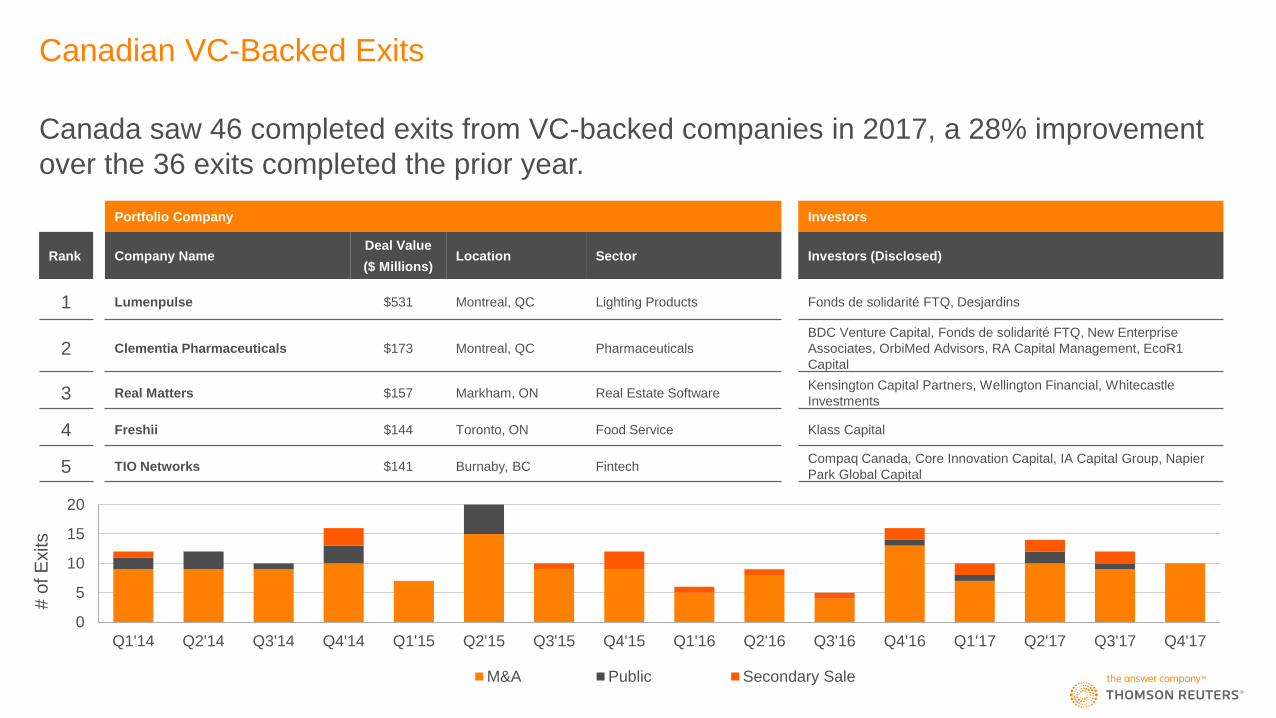
Canadian VC-Backed Exits
Portfolio Company Investors
Rank Company Name Deal Value
($ Millions) Location Sector Investors (Disclosed)
1 Lumenpulse $531 Montreal, QC Lighting Products Fonds de solidarité FTQ, Desjardins
2 Clementia Pharmaceuticals $173 Montreal, QC Pharmaceuticals
BDC Venture Capital, Fonds de solidarité FTQ, New Enterprise
Associates, OrbiMed Advisors, RA Capital Management, EcoR1
Capital
3 Real Matters $157 Markham, ON Real Estate Software Kensington Capital Partners, Wellington Financial, Whitecastle
Investments
4 Freshii $144 Toronto, ON Food Service Klass Capital
5 TIO Networks $141 Burnaby, BC Fintech Compaq Canada, Core Innovation Capital, IA Capital Group, Napier
Park Global Capital
Canada saw 46 completed exits from VC-backed companies in 2017, a 28% improvement
over the 36 exits completed the prior year.
0
5
10
15
20
Q1'14 Q2'14 Q3'14 Q4'14 Q1'15 Q2'15 Q3'15 Q4'15 Q1'16 Q2'16 Q3'16 Q4'16 Q1'17 Q2'17 Q3'17 Q4'17
M&A Public Secondary Sale
# o
f E
xits
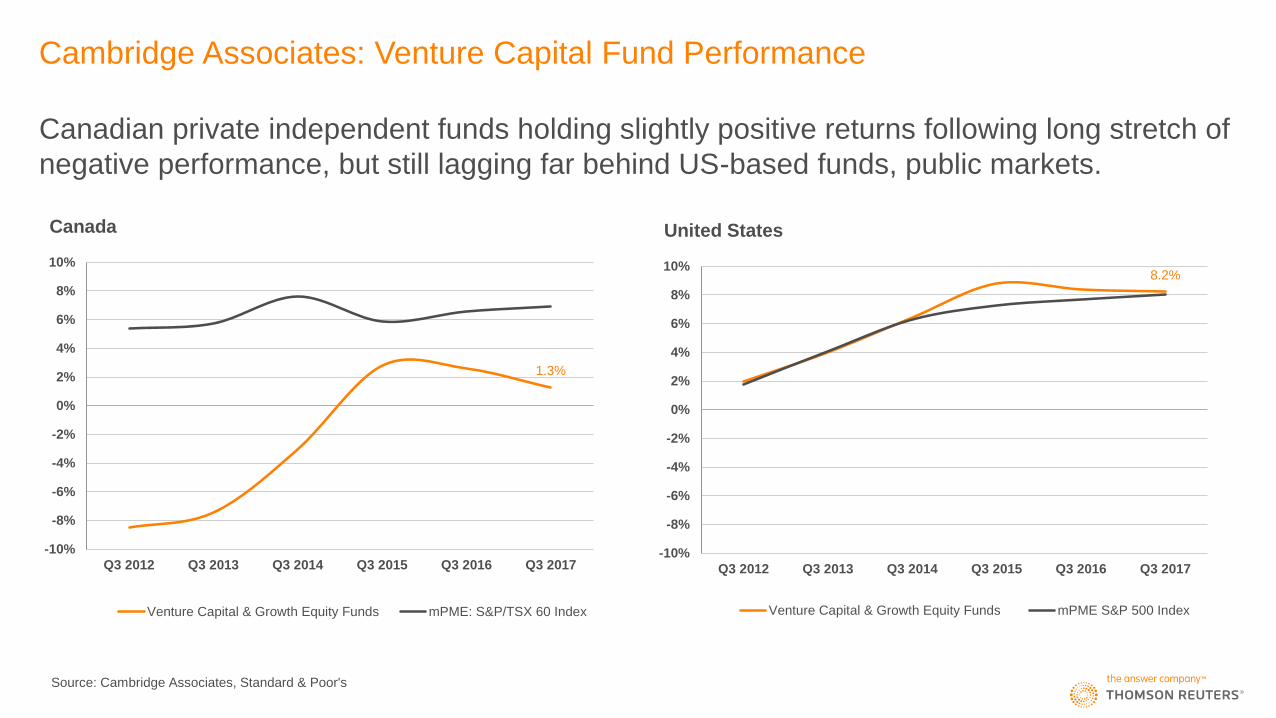
Cambridge Associates: Venture Capital Fund Performance
Canadian private independent funds holding slightly positive returns following long stretch of
negative performance, but still lagging far behind US-based funds, public markets.
1.3%
-10%
-8%
-6%
-4%
-2%
0%
2%
4%
6%
8%
10%
Q3 2012 Q3 2013 Q3 2014 Q3 2015 Q3 2016 Q3 2017
Canada
Venture Capital & Growth Equity Funds mPME: S&P/TSX 60 Index
8.2%
-10%
-8%
-6%
-4%
-2%
0%
2%
4%
6%
8%
10%
Q3 2012 Q3 2013 Q3 2014 Q3 2015 Q3 2016 Q3 2017
United States
Venture Capital & Growth Equity Funds mPME S&P 500 Index
Source: Cambridge Associates, Standard & Poor's
Explanatory Notes
1. Data collected and analyzed by Thomson Reuters for this statistical report were drawn from a variety of sources including Thomson Reuters M&A databases, regulatory filings, press releases, and proprietary reports from Canadian and non-resident
venture capital firms, private equity firms, law firms, and other service providers.
2. The Thomson Reuters Canadian venture capital report measures cash for equity and quasi-equity investments by the professional venture capital community in emerging companies in Canada. These transactions are referred to as
VCReporter Deals on Thomson Reuters databases.
3. The report includes the investment activity of professional venture capital firms, whether Canadian-based or not, including private independent funds, retail funds (LSVCCs and PVCCs), venture arms of corporations, institutions,
government funds, angel funds, and similar entities whose primary activity is financial investing. Where there are additional participants such as angels, corporations, governments, or company officers in a qualified and verified
financing round, the entire amount of the round is included.
4. The report excludes venture debt, buyouts, recapitalizations, secondary purchases, IPO exits, and other forms of private equity that do not involve cash such as services-in-kind. Investments in capital pool companies (CPCs & JCPs)
are not eligible. Companies whose primary activity is the extraction of natural resources (agriculture, forestry, mining, and oil & gas exploration) without a specific focus on technology are not eligible.
5. Rounds are tracked based on investment location. This predominantly includes Canadian-headquartered companies, but companies headquartered outside of Canada with Canadian research & development facilities are also eligible.
6. Rankings of top VC investors include only investment activity made in Canadian portfolio companies. Estimated investment activity is based on the actual syndicate breakdown, where available, and is split equally among disclosed
investors where actual breakdowns are not available. Private independent, government, and other funds are independently ranked in their respective categories. Rankings capture the twelve-month period from January 1st, 2017 to
December 31st, 2017.
7. Fund performance data and public market equivalents are produced via the Cambridge Associates Benchmark Calculator, available through Thomson Reuters Eikon. Returns are for Canadian and US venture capital and growth equity funds with
vintage years of 2000 or greater, on a first cash flow basis, in Canadian dollars, from inception to the end of the indicated quarter, under published data mode Q3 2017. Pooled internal rates of return are net of fees, expenses and carried interest.
CA Modified Public Market Equivalent (mPME) replicates private investment performance under public market conditions. The public index’s shares are purchased and sold according to the private fund cash flow schedule, with distributions
calculated in the same proportion as the private fund, and mPME NAV is a function of mPME cash flows and public index returns.
8. All current and previous years data is as of Friday, January 26th, 2018. Data is continuously updated and is therefore subject to change. All figures are in Canadian dollars unless otherwise noted.
For further information on Thomson Reuters venture capital and private equity offerings, please visit us at:
• https://financial.thomsonreuters.com/en/products/tools-applications/trading-investment-tools/eikon-trading-software/private-equity-data.html
For further reports on private equity, venture capital, and other asset classes, please visit us at:
• http://dmi.thomsonreuters.com/DealsIntelligence/QuarterlyReviews
Contributors to this analysis are provided with additional packages of data. If you would like to participate in the submission process, receive quarterly press releases, or have questions about our venture capital criteria, please contact us at:
Gavin Penny Greg Beaman
E-mail: [email protected] E-mail: [email protected]
Tel: 416-687-7577 Tel: 416-687-7510