Embed Size (px)
Citation preview

Fred GaultUNU-MERIT / TUT-IERI
The Ninth Annual Re$earch Money Conference, Ottawa, March 25, 2010

The big picture – where Canada fits Slowly moving variables◦Can they be influenced?
Variables that are moving, but not quickly◦How are they being influenced?
Fast moving variable◦What does it mean?
Questions for discussion
A talk about R&D. It is not a talk about innovation

GERD (2007) $29, 170 million GERD/GDP (2007) 1.90 % Performance as a percentage of GERD by Business 54 Higher Education 35 Governments 10Sources: Statistics Canada 88-202 and OECD(2010), MSTI 2009/2 Tables
Statistics Canada Summary Tables, www.statcan.gc.ca


BERD as per cent of GDP for 15 OECD CountriesYear
2007 2006 2005 2004 2003 1995Japan 2.68 2.63 2.54 2.38 2.40 1.90Sweden 2.66 2.79 2.62 2.67 2.86 2.43Finland 2.51 2.46 2.47 2.42 2.42 1.43Korea 2.18 2.29 2.49 2.65 2.00 1.75United States 1.93 1.89 1.83 1.79 1.84 1.77
Austria 1.81 1.73 1.70 1.53Germany 1.77 1.77 1.72 1.74 1.45Denmark 1.66 1.66 1.68 1.69 1.78 1.04Iceland 1.50 1.59 1.43 1.46 0.49Luxembourg 1.36 1.43 1.35 1.43 1.47
France 1.31 1.32 1.30 1.36 1.36 1.39Belgium 1.29 1.30 1.25 1.29 1.31 1.19Australia 1.15 1.07 0.97 0.92 0.84United Kingdom 1.15 1.08 1.06 1.06 1.13 1.24Canada 1.05 1.11 1.15 1.19 1.16 0.99
OECD 1.59 1.56 1.51 1.48 1.51 1.37
Source: Statistics Canada 88-202/OECD

How does BERD relate to a country’s GDP? BERD = a*(GDP)**b ln(BERD) = A + b*ln(GDP) What does the relationship look like? What about structural differences? Two cases◦Available data for 2006◦Available data for 2006, and BERD/GDP >= 0.5
Countries with BERD/GDP < 0.5 are likely to be developing economies


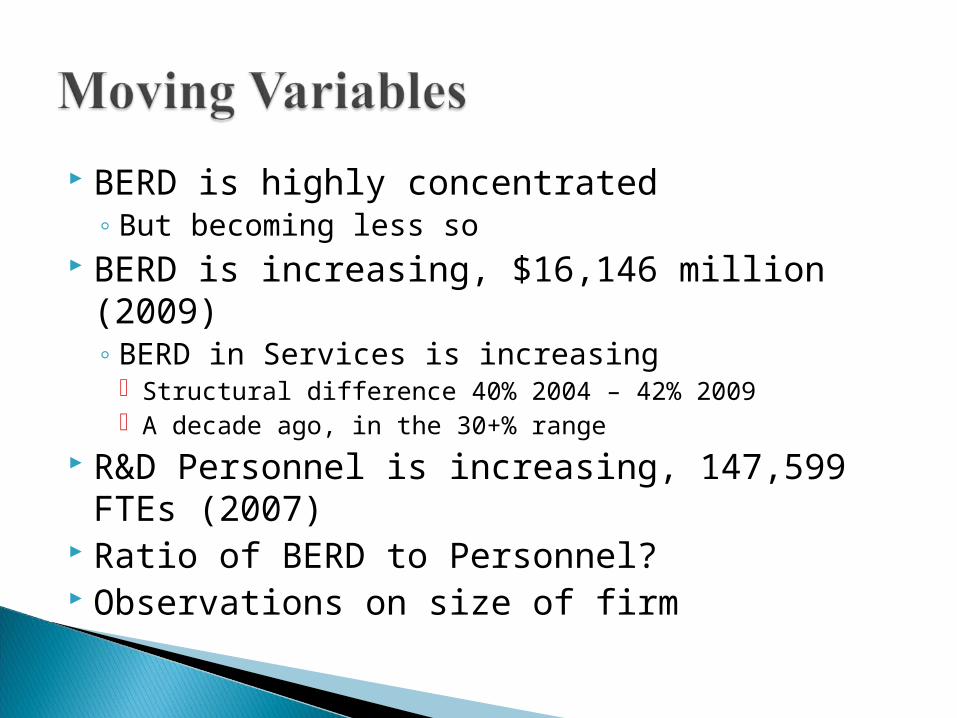
BERD is highly concentrated ◦But becoming less so
BERD is increasing, $16,146 million (2009)◦BERD in Services is increasing
Structural difference 40% 2004 – 42% 2009 A decade ago, in the 30+% range
R&D Personnel is increasing, 147,599 FTEs (2007) Ratio of BERD to Personnel? Observations on size of firm


BERD by Size ClassFirms with fewer than 50
employeesFirms with 50 to 249
employeesFirms with fewer than 250
employessJapan 0.0 6.4 6.4Germany (2005) 2.4 7.5 9.8United States (2006) 5.9 9.0 15.0France (2006) 6.7 11.2 17.8United Kingdom 6.3 11.9 18.2Sweden 6.5 11.8 18.3Finland 9.7 10.3 20.0Switzerland (2004) 8.0 12.4 20.5Italy (2006) 7.3 15.0 22.3Korea 10.7 12.2 22.8Slovenia (2006) 9.1 17.6 26.7Netherlands (2005) 9.0 18.1 27.1Luxembourg (2005) 10.3 17.9 28.2Austria (2006) 9.3 18.9 28.2Denmark (2005) 15.0 14.0 29.0Hungary 18.3 10.8 29.1Czech Republic 9.6 22.5 32.1Australia (2006) 18.7 13.9 32.6Poland 5.3 27.9 33.3Canada (2006) 18.5 17.6 36.1Portugal 12.3 26.2 38.5Belgium (2006) 16.0 22.7 38.7Ireland (2006) 20.4 25.8 46.2Spain (2006) 21.2 27.7 48.8Norway 18.8 30.8 49.6Slovak Republic 11.2 45.5 56.8Greece (2005) 33.8 26.0 59.7New Zealand (2005) 45.9 27.3 73.3
Source OECD STI Scoreboard 2009 Fewer than 50 employees: For the U.S., 5-49 employees; for Luxembourg, the Netherlands and Sweden, 10-49 employees;50 to 249 employees: For Japan, fewer than 299 employees.


For BERD◦ Money for research
SR&ED ICT tax credits Strategic Aerospace and Defence Initiative (SADI)
◦ Money and advice for research IRAP
For Business◦Business Development Bank (will help with SR&ED)◦Export Development Canada◦Provincial and municipal programmes

Environment◦Water: health; energy; and security◦Cleaner methods of extracting, processes and utilizing
hydrocarbon fuels, including reduced consumption of these fuels
Natural Resources and Energy◦Energy production in the oils sands◦Arctic: resource production; climate change adaptation;
monitoring◦Biofuels, fuel cells and nuclear energy

Health and Life Sciences◦Regenerative medicine◦Neuroscience◦Health in an aging population◦Biomedical engineering and medical technologies
Information and Communication Technologies◦New media, animation and games◦Wireless networks and services◦Broadband networks◦Telecom equipment

Direct and indirect government funding of Business R&D and tax incentives for R&D
OECD STI Outlook 2008
Costs of fiscal incentives
Direct government funding of BERD
2005 or last year available
% GDP % GDPUnited States 0.04 0.18France 0.05 0.12United Kingdom 0.05 0.09Spain 0.03 0.08Norway 0.06 0.07
Belgium 0.10 0.07Australia 0.05 0.04Ireland 0.04 0.03Netherlands 0.07 0.03Japan 0.12 0.03Canada 0.21 0.02Portugal 0.03 0.02Mexico 0.04 0.01
Source: OECD, based on national estimates, (NESTI R&D tax incentives questionnaire), some of which may be preliminary.

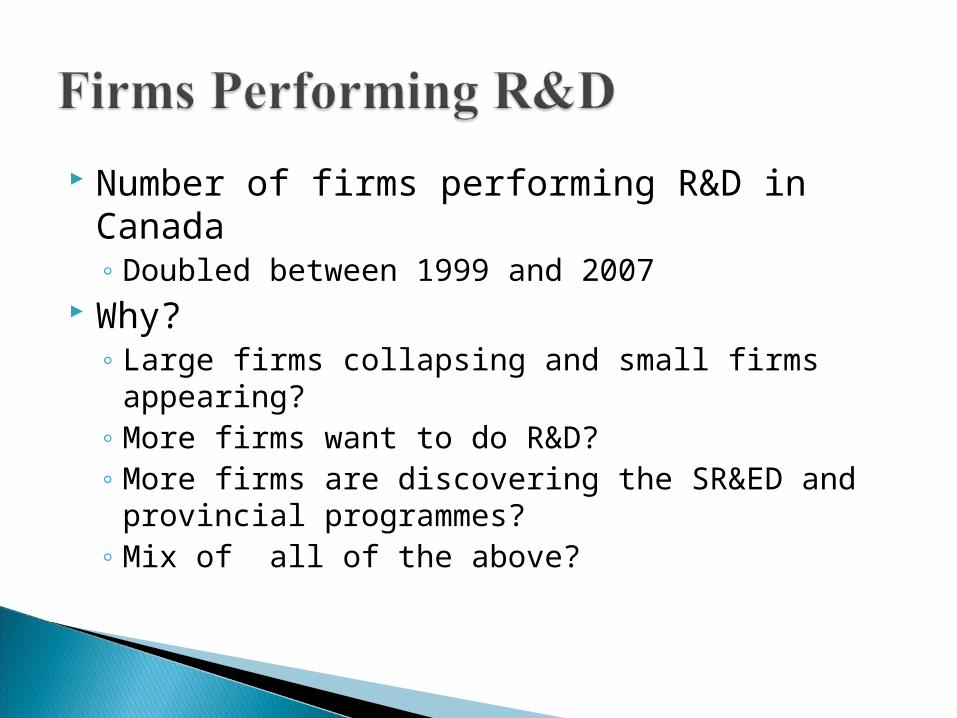
Number of firms performing R&D in Canada◦Doubled between 1999 and 2007
Why?◦ Large firms collapsing and small firms appearing?◦More firms want to do R&D?◦More firms are discovering the SR&ED and provincial
programmes?◦Mix of all of the above?


Is Canada really lagging? Does Canada need more business R&D in◦ STIC priorities◦Or?
Is Canada taking advantage of the global economy?◦R&D in niche markets◦Value chain participation

Gault, Fred (2010), Innovation Strategies for a Global Economy, Development, Implementation, Measurement and Management, Edward Elgar and IDRC
Lynch, Kevin (2010), ‘Canada’s Innovation Deficit’, Policy Options, March 2010, 30-33. OECD
◦ (2010), Main Science and Technology Indicators, 2009/2◦ (2009), OECD Science, Technology and Industry Scoreboard 2009◦ (2009), Innovation in Firms, A Microeconomic Perspective◦ (2008), OECD Science, Technology and Industry Outlook 2008
The Impact Group (2005),The Demographics of Industrial Research in Canada: 1994-2000, Toronto: The Impact Group
Statistics Canada◦ (2010), Industrial Research and Development: Intentions, 88-202◦ Schellings, Robert and Fred Gault (2006), Size and Persistence of R&D Performance in Canadian
Firms, 1994 to 2002, Catalogue no. 88F0006XIE-No. 008, Ottawa: Statistics Canada. ◦ www.statcan.gc.ca


![[Matt Gault] Marketing, Engajamento e Lucratividade - CONAREC](https://img.pdfslide.us/doc/110x75/547b4107b479598a098b4d62/matt-gault-marketing-engajamento-e-lucratividade-conarec.jpg)