Embed Size (px)
Citation preview
FINAL PROJECT REPORT #00042134-04
GRANT: DTRT13-G-UTC45 Project Period: 1/1/2014 – 12/31/16
FRCM and FRP Composites for the
Repair of Damaged PC Girders
Participating Consortium Member: University of Miami
Authors:
Vanessa Pino. P.E. Ph.D. Candidate
Dept. of Civil, Arch. & Environ. Engineering University of Miami
Antonio Nanni, Ph.D., P.E. Professor and Chair
Dept. of Civil, Arch. & Environ. Engineering University of Miami
RE-CAST: Research on Concrete Applications for Sustainable Transportation Tier 1 University Transportation Center

DISCLAIMER
The contents of this report reflect the views of the authors, who are responsible for the facts and
the accuracy of the information presented herein. This document is disseminated under the
sponsorship of the U.S. Department of Transportation's University Transportation Centers
Program, in the interest of information exchange. The U.S. Government assumes no liability for
the contents or use thereof.

II
TECHNICAL REPORT DOCUMENTATION PAGE
Report No. 2. Government Accession No. 3. Recipient's Catalog No.
RECAST UTC #00042134-04 4. Title and Subtitle 5. Report Date FRCM and FRP Composites for the Repair of Damaged PC Girders
July 1, 2016 6. Performing Organization Code:
7. Author(s) V. Pino, and A. Nanni
8. Performing Organization Report No.Project #00042134-04
9. Performing Organization Name and Address 10. Work Unit No. RE-CAST - University of Miami 1251 Memorial Drive, Room 325 Coral Gables, FL 33146-0630
11. Contract or Grant No. USDOT: DTRT13-G-UTC45
12. Sponsoring Agency Name and Address Office of the Assistant Secretary for Research and Technology U.S. Department of Transportation 1200 New Jersey Avenue, SE Washington, DC 20590
13. Type of Report and Period Covered: Final Report Period: 1/1/2014 – 06/30/15 14. Sponsoring Agency Code:
15. Supplementary Notes The investigation was conducted in cooperation with the U. S. Department of Transportation. 16. Abstract Fabric-reinforced-cementitious-matrix (FRCM) and fiber-reinforced polymer (FRP) composites have emerged as novel strengthening technologies. FRCM is a composite material consisting of a sequence of one or more layers of cement-based matrix reinforced with dry-fiber fabric(s). Conversely, FRP consists of a sequence of one or more plies of unidirectional fibers embedded in organic resin. The primary objective of this project was an extensive material characterization of two pre-selected FRCM and FRP systems in order to investigate their basic constitutive behavior and durability. Material characterization is performed in compliance with established Acceptance Criteria (AC434 and AC125). Results from the characterization yield material properties that are considered in determining experimental, theoretical, and design ultimate capacities of strengthened members. FRCM and FRP were used for the strengthening of intentionally damaged AASHTO Type III prestressed concrete girders taken from I-81 overpass near Arcadia, VA. Experimental and theoretical analyses were performed to demonstrate the ability of these two repair methods to restore moment capacity compromised by the loss of four and eight 9.5-mm (3/8-in.) diameter prestressing tendons. All experimental work was conducted at Virginia Tech and reported in details elsewhere. This document presents some of the experimental findings and shows additional and original analytical considerations on the performance of the repaired girders. In particular, it offers a comparisonbetween theoretical results according to AASHTO LRFD Bridge Design Specifications (2010) and experimental tests. Finally, design methodology including ACI 318 (2011), ACI 549.4R (2013) and ACI 440.2R (2008) are used to calculate design values that are compared to experimental values. 17. Key Words 18. Distribution Statement Composites, prestressed concrete, bridges, impact damage, FRCM, FRP
No restrictions. This document is available to the public.
19. Security Classification (of this report)Unclassified
20. Security Classification (of this page) Unclassified
21. No of Pages 88
Form DOT F 1700.7 (8-72) Reproduction of form and completed page is authorized.

III
FRCM AND FRP COMPOSITES FOR THE REPAIR OF DAMAGED PC GIRDERS
PREPARED FOR THE
UNIVERSITY TRANSPORTATION CENTER
IN COOPERATION WITH THE
VIRGINIA CENTER FOR TRANSPORTATION INNOVATION AND RESEARCH
VIRGINIA POLYTECHNIC INSTITUTE AND STATE UNIVERSITY
Written By:
Vanessa Pino, PhD Candidate
Antonio Nanni, Professor and Chair Department of Civil, Arch. and Environ. Engineering
UNIVERSITY OF MIAMI RE-CAST
Submitted July 1, 2015
.

IV
FRCM AND FRP COMPOSITES FOR THE REPAIR OF DAMAGED PC GIRDERS
EXECUTIVE SUMMARY
Fabric-reinforced-cementitious-matrix (FRCM) and fiber-reinforced polymer (FRP)
composites have emerged as novel strengthening technologies. FRCM is a composite material consisting of a sequence of one or more layers of cement-based matrix reinforced with dry-fiber fabric(s). Conversely, FRP consists of a sequence of one or more plies of unidirectional fibers embedded in organic resin.
The primary objective of this project was an extensive material characterization of two pre-selected FRCM and FRP systems in order to investigate their basic constitutive behavior and durability. Material characterization is performed in compliance with established Acceptance Criteria (AC434 and AC125). Results from the characterization yield material properties that are considered in determining experimental, theoretical, and design ultimate capacities of strengthened members.
FRCM and FRP were used for the strengthening of intentionally damaged AASHTO Type III prestressed concrete (PC) girders taken from I-81 overpass near Arcadia, VA. Experimental and theoretical analyses were performed to demonstrate the ability of these two repair methods to restore moment capacity compromised by the loss of four and eight 9.5-mm (3/8-in.) diameter prestressing tendons. All experimental tests on PC girders were conducted at Virginia Tech and reported in details elsewhere. This document presents some of the experimental findings and shows additional and original analytical considerations on the performance of the repaired girders. In particular, it offers a comparison between theoretical results according to AASTHO LRFD Bridge Design Specifications (2010) and experimental tests. Finally, design methodology including ACI 318 (2011), ACI 549.4R (2013) and ACI 440.2R (2008) are used to calculate factored resistance design values that are compared to experimental values.

V
ACKNOWLEDGMENTS The project was made possible with the financial support received from the University Transportation Center and Virginia Center for Transportation Innovation and Research via a subcontract with Virginia Polytechnic Institute and State University. The authors gratefully acknowledge the extensive experimental work conducted at Virginia Tech by students, staff and faculty under the guidance of Drs. Carin Wollmann, and Thomas Cousins. The opinions in this report are those of the authors and not necessarily those of the sponsors or collaborators.

VI
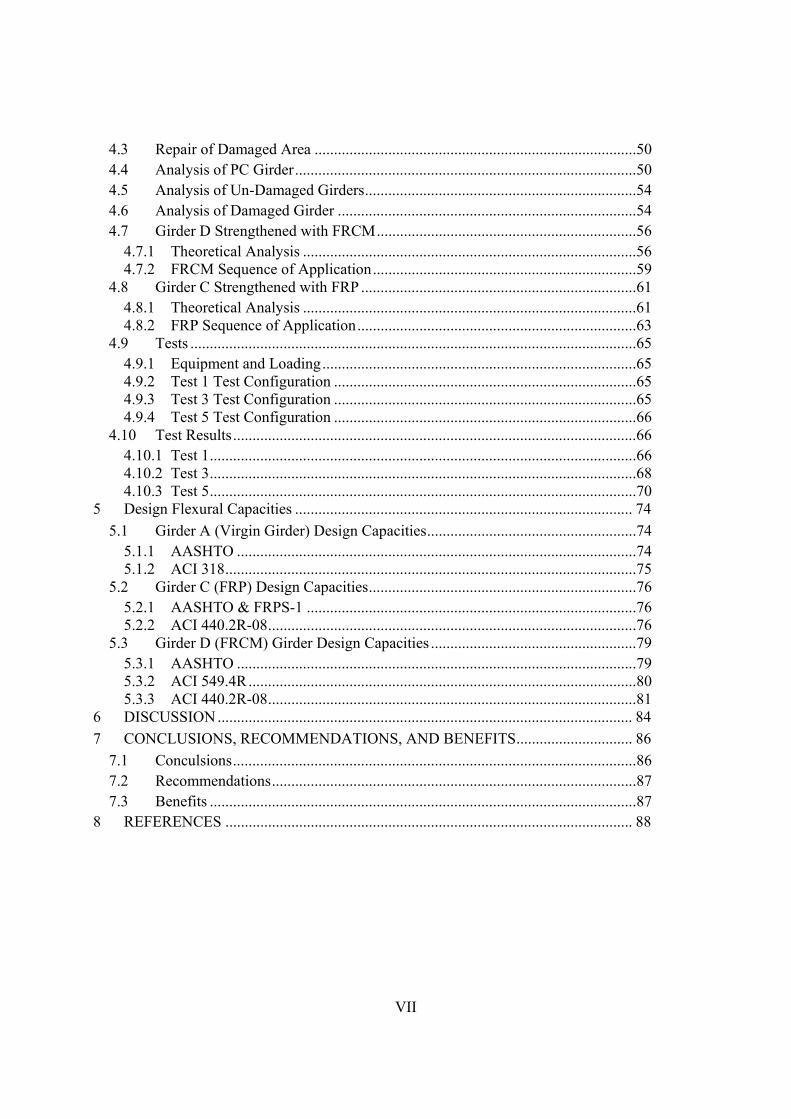
TABLE OF CONTENTS
TABLE OF CONTENTS .................................................................................................. VI
LIST OF FIGURES ....................................................................................................... VIII
LIST OF TABLES ............................................................................................................ XI
1 INTRODUCTION ...................................................................................................... 1
1.1 Background ..........................................................................................................1 1.1.1 Fabric Reinforced Cementitious Matrix (FRCM) Composites ........................1 1.1.2 Fiber Reinforced Polymer (FRP) Composites .................................................2 1.1.3 Structural Repair using Novel Materials in Transportation Infrastructure ......2
1.2 Objectives ............................................................................................................3 2 FRCM MATERIAL CHARACTERIZATION .......................................................... 4
2.1 Materials ..............................................................................................................4 2.1.1 Fabric Reinforced Cementitions Matrix (FRCM) ............................................4
2.2 FRCM Preparation and Installation .....................................................................4 2.2.1 Mixing Method ................................................................................................4 2.2.2 Specimen Preparation ......................................................................................4
2.3 Test Matrix ...........................................................................................................5 2.4 Test Data and Results...........................................................................................6
2.4.1 Compression of Matrix Mortar ........................................................................6 2.4.2 Compression of Repair Mortar ........................................................................7 2.4.3 FRCM Direct Tension......................................................................................9 2.4.4 Interlaminar Shear Strength ...........................................................................15 2.4.5 FRCM Bond over Repair Mortar ...................................................................17 2.4.6 FRCM Bond/Durability of FRCM Bond .......................................................20 2.4.7 FRCM Early Age Testing ..............................................................................21
2.5 Conclusion .........................................................................................................26 3 FRP MATERIAL CHARACTERIZATION ............................................................ 27
3.1 Fiber Reinforced Polymers (FRP) .....................................................................27 3.2 FRP Preparation and Installation .......................................................................27
3.2.1 Mixing Method ..............................................................................................27 3.2.2 Product Installation ........................................................................................27
3.3 Test Matrix .........................................................................................................30 3.4 Test Data and Results.........................................................................................30
3.4.1 FRP Direct Tension........................................................................................30 3.4.2 FRP Interlaminar Shear..................................................................................37 3.4.3 FRP Tensile Bond/Durability of FRP Tensile Bond ......................................39 3.4.4 Glass Transition Temperature (Tg) Test ........................................................43
4 PC GIRDER STRENGHTENING ........................................................................... 45
4.1 PC Girders ..........................................................................................................45 4.2 Simulated Impact Damage .................................................................................47
VII
4.3 Repair of Damaged Area ...................................................................................50 4.4 Analysis of PC Girder ........................................................................................50 4.5 Analysis of Un-Damaged Girders ......................................................................54 4.6 Analysis of Damaged Girder .............................................................................54 4.7 Girder D Strengthened with FRCM ...................................................................56
4.7.1 Theoretical Analysis ......................................................................................56 4.7.2 FRCM Sequence of Application ....................................................................59
4.8 Girder C Strengthened with FRP .......................................................................61 4.8.1 Theoretical Analysis ......................................................................................61 4.8.2 FRP Sequence of Application ........................................................................63
4.9 Tests ...................................................................................................................65 4.9.1 Equipment and Loading .................................................................................65 4.9.2 Test 1 Test Configuration ..............................................................................65 4.9.3 Test 3 Test Configuration ..............................................................................65 4.9.4 Test 5 Test Configuration ..............................................................................66
4.10 Test Results ........................................................................................................66 4.10.1 Test 1 ..............................................................................................................66 4.10.2 Test 3 ..............................................................................................................68 4.10.3 Test 5 ..............................................................................................................70
5 Design Flexural Capacities ....................................................................................... 74
5.1 Girder A (Virgin Girder) Design Capacities ......................................................74 5.1.1 AASHTO .......................................................................................................74 5.1.2 ACI 318 ..........................................................................................................75
5.2 Girder C (FRP) Design Capacities .....................................................................76 5.2.1 AASHTO & FRPS-1 .....................................................................................76 5.2.2 ACI 440.2R-08 ...............................................................................................76
5.3 Girder D (FRCM) Girder Design Capacities .....................................................79 5.3.1 AASHTO .......................................................................................................79 5.3.2 ACI 549.4R ....................................................................................................80 5.3.3 ACI 440.2R-08 ...............................................................................................81
6 DISCUSSION ........................................................................................................... 84
7 CONCLUSIONS, RECOMMENDATIONS, AND BENEFITS .............................. 86
7.1 Conculsions ........................................................................................................86 7.2 Recommendations ..............................................................................................87 7.3 Benefits ..............................................................................................................87
8 REFERENCES ......................................................................................................... 88

VIII
LIST OF FIGURES
Figure 1-1 – Schematic Representation of FRCM for Strengthening Concrete Structures ............ 1 Figure 2-1 – FRCM Material Constituents a) GOLD Fabric Roll b) GOLD Fabric Grid c) M750 4 Figure 2-2 –Specimen Preparation a) First Layer of Mortar b) Placing Mesh c) Layer of Mortar
(Sandwich) .............................................................................................................................. 5 Figure 2-3 –Multiple Layers of FRCM ........................................................................................... 5 Figure 2-4 –Cubes in Limewater Conditioning .............................................................................. 6 Figure 2-5 –Cube Compression Test .............................................................................................. 6 Figure 2-6 –Cubes in Limewater Conditioning .............................................................................. 7 Figure 2-7 –Repair Mortar Cube Failure Mode .............................................................................. 8 Figure 2-8 –Coupon Preparation a) Cure for 28 days b) Cut Coupons c) Final Product ................ 9 Figure 2-9 –Single Ply Coupon a) Continuous b) Lap Splice (1 in.=25.4 mm) ........................... 10 Figure 2-10 – Tab Installation....................................................................................................... 10 Figure 2-11 - Specimen Test Setup with Clevis Grips and Extensometer .................................... 10 Figure 2-12 – Stress vs. Strain Behavior of One Ply Direct Tension Tests (1 ksi = 6.895 MPa) . 12 Figure 2-13 – Stress vs. Strain Behavior of Two Ply Direct Tension Tests (1 ksi = 6.895 MPa) 12 Figure 2-14 – Stress vs. Strain Behavior of Single Ply Lap Direct Tension Tests (1 ksi = 6.895
MPa) ...................................................................................................................................... 13 Figure 2-15 –Interlaminar Shear Specimen .................................................................................. 15 Figure 2-16 –Interlaminar Shear Test Set-up ................................................................................ 16 Figure 2-17 – Repair Mortar Application ..................................................................................... 17 Figure 2-18 – FRCM Application Over Repair Mortar ................................................................ 18 Figure 2-19 –Pull off Test a) Drilling Instrumentation b) Circular Embedded Cut c) Attached
Steel Disk .............................................................................................................................. 18 Figure 2-20 –Pull off Test Instrumentation a) James Bond Test b) Test Configuration c) Test Set
up........................................................................................................................................... 19 Figure 2-21 – Bond Test Failure Mode Types .............................................................................. 19 Figure 2-22 –Bond Strength Over Repair Mortar Primary Failure Mode .................................... 20 Figure 2-23 – FRCM Application a) Pre-Drilled Beams b) Pre-Cut Fabric c) FRCM Application
............................................................................................................................................... 22 Figure 2-24 – FRCM Application to a) Regular Beams b) Pre-Drilled Beams ............................ 23 Figure 2-25 –Bond Strength Over Repair Mortar Primary Failure Mode .................................... 24 Figure 2-26 –Early Age Bond Strength Development Curve (1 ksi = 6.895 MPa) ...................... 25 Figure 2-27 –Early Age Matrix Compression Strength Development Curve (1 ksi = 6.895 MPa)
............................................................................................................................................... 26 Figure 3-1 – FRP Material Constituents a) V-Wrap C200H b) V-Wrap C400H ......................... 27 Figure 3-2 – Cutting Fiber Sheet .................................................................................................. 28 Figure 3-3 – Fiber Impregnation ................................................................................................... 28 Figure 3-4 – FRP Panel Fabrication.............................................................................................. 29 Figure 3-5 – Concrete Specimens Before (Left) and After (Right) Sandblasting ........................ 29 Figure 3-6 – FRP Application to Concrete Specimens ................................................................. 29 Figure 3-7 - Tensile Test Set-up ................................................................................................... 31 Figure 3-8 – Interlaminar Shear Test Set-up ................................................................................. 37 Figure 3-9 - Tensile Bond Specimen Layout (ASTM D7234) ..................................................... 40

IX
Figure 3-10 –Pull off Test Instrumentation a) James Bond Test b) Test Configuration c) Test Set up........................................................................................................................................... 41
Figure 3-11 - Typical Failure of Performed Tension Bond Strength Test. ................................... 41 Figure 3-12 – Tg Test Set-up ......................................................................................................... 43 Figure 3-13 – Typical Results for Tg V-Wrap770 test .................................................................. 44 Figure 4-1 –Prestressing Details of AASHTO Type III (1 ft = 30.48 cm) ................................... 45 Figure 4-2 – Girder Dimensions and Prestressing Details of AASHTO Type III (1 in. = 2.54 cm)
............................................................................................................................................... 46 Figure 4-3 – Hydraulic Breaker Damaging Strands ..................................................................... 47 Figure 4-4 – Damaged Prestressing Strands ................................................................................. 48 Figure 4-5 – a) Formwork for Repair Mortar b) Pouring of Repair Concrete c) Repaired Area .. 50 Figure 4-6 – Stresses Applied to Girder Cross Section (Un-Damaged Girder) ............................ 51 Figure 4-7 – Force Equilibrium for Ultimate Flexural Strength ................................................... 51 Figure 4-8 – Force Equilibrium for Nominal Flexural Strength (Un-damaged Girder) ............... 53 Figure 4-9 – Theoretical Moment Capacity of Un-Damaged Girders (1 kip-ft = 1.356 kN-m; 1 ft
= 0.305 m) ............................................................................................................................. 54 Figure 4-10 – Theoretical Nominal Capacity of Damaged Girder C (1 kip-ft = 1.356 kN-m; 1 ft =
0.305 m) ................................................................................................................................ 55 Figure 4-11 – Theoretical Nominal Capacity of Damaged Girder D (1 kip-ft = 1.356 kN-m; 1 ft =
0.305 m) ................................................................................................................................ 55 Figure 4-12 – Force Equilibrium for Nominal Strength with FRCM Strengthening ................... 56 Figure 4-13 – Girder D Initial Conditions Prior to FRCM Strengthening .................................... 58 Figure 4-14 – Nominal Flexural Capacity Analysis of Girder D Strengthened with FRCM ....... 58 Figure 4-15 – FRCM Sequence of Application ............................................................................ 59 Figure 4-16 – FRCM Sequence of Application – Elevation View ............................................... 60 Figure 4-17 – FRCM Sequence of Application a) First Layer of Mortar b) Fabric Impregnation 60 Figure 4-18 – Force Equilibrium for Nominal Strength with FRP Strengthening ....................... 61 Figure 4-19 – Girder C Initial Conditions Prior to FRP Strengthening ........................................ 62 Figure 4-20 – Nominal Flexural Capacity Analysis of Girder C Strengthened with FRP ........... 63 Figure 4-21 – FRP Sequence of Application ................................................................................ 63 Figure 4-22 – FRP Sequence of Application a) Steps 1 b) Step2 c) Step 3 d) Completed Repair 64 Figure 4-23 – FRP Strengthened Girder ....................................................................................... 64 Figure 4-24 –Test 1 Test Configuration........................................................................................ 65 Figure 4-25 – Test 3 Test Configuration a) Initial Test b) Re-Test .............................................. 66 Figure 4-26 –Test 5 Test Configuration........................................................................................ 66 Figure 4-27 – Moment Diagrams for Test 1 ................................................................................. 67 Figure 4-28 – Test 1 – Initial Test Load vs. Deflection at Both Loading Points .......................... 67 Figure 4-29 – Test 1 – Second Test Load vs. Deflection at Both Loading Points........................ 68 Figure 4-30 – Moment Diagrams for Test 3 – 48 ft Configuration .............................................. 69 Figure 4-31 – Moment Diagrams for Test 3 – 53 ft Configuration .............................................. 69 Figure 4-32 – Test 3 (48 ft) – Load vs. Deflection at Center of Load .......................................... 70 Figure 4-33 – Re-Test 3 (53 ft) – Load vs. Deflection at Center of Load .................................... 70 Figure 4-34 – Moment Diagrams for Test 5 ................................................................................. 71 Figure 4-35 – Test 5 Load vs. Deflection at Center of Load ........................................................ 72 Figure 4-36 – Test 5 – Horizontal Shear Cracking and Crack Propagation at Gap ...................... 72 Figure 5-1 – Girder A Moment Diagrams .................................................................................... 74

X
Figure 5-2 – Girder A – ACI 318 Design Nominal Capacity without Reduction Factor ............. 75 Figure 5-3 – Girder A Moment Diagrams .................................................................................... 76 Figure 5-4 – Girder C Moment Diagrams ..................................................................................... 77 Figure 5-5 – Environmental Reduction Factor (Table 9.1 ACI 440-08) ...................................... 77 Figure 5-6 – Girder C – ACI 440.2R Design Nominal Capacity without Reduction Factor ........ 78 Figure 5-7 – Girder C Moment Diagrams ..................................................................................... 79 Figure 5-8 – Girder D Moment Diagrams .................................................................................... 80 Figure 5-9 – Girder D – ACI 549.4R Design Nominal Capacity without Reduction Factor ....... 81 Figure 5-10 – Girder D Moment Diagrams .................................................................................. 82 Figure 5-11 – Girder D – ACI 440.2R Design Nominal Capacity without Reduction Factor ..... 82 Figure 5-12 – Girder D ACI Moment Diagrams .......................................................................... 83
XI
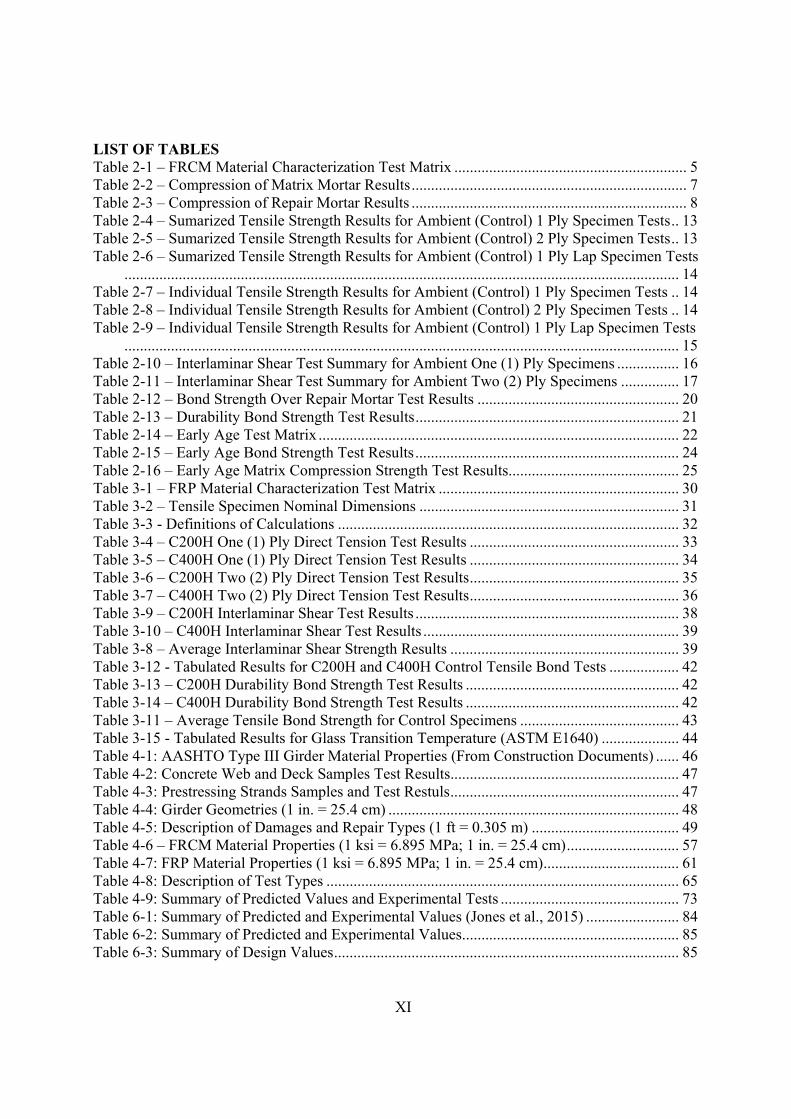
LIST OF TABLES Table 2-1 – FRCM Material Characterization Test Matrix ............................................................ 5 Table 2-2 – Compression of Matrix Mortar Results ....................................................................... 7 Table 2-3 – Compression of Repair Mortar Results ....................................................................... 8 Table 2-4 – Sumarized Tensile Strength Results for Ambient (Control) 1 Ply Specimen Tests .. 13 Table 2-5 – Sumarized Tensile Strength Results for Ambient (Control) 2 Ply Specimen Tests .. 13 Table 2-6 – Sumarized Tensile Strength Results for Ambient (Control) 1 Ply Lap Specimen Tests
............................................................................................................................................... 14 Table 2-7 – Individual Tensile Strength Results for Ambient (Control) 1 Ply Specimen Tests .. 14 Table 2-8 – Individual Tensile Strength Results for Ambient (Control) 2 Ply Specimen Tests .. 14 Table 2-9 – Individual Tensile Strength Results for Ambient (Control) 1 Ply Lap Specimen Tests
............................................................................................................................................... 15 Table 2-10 – Interlaminar Shear Test Summary for Ambient One (1) Ply Specimens ................ 16 Table 2-11 – Interlaminar Shear Test Summary for Ambient Two (2) Ply Specimens ............... 17 Table 2-12 – Bond Strength Over Repair Mortar Test Results .................................................... 20 Table 2-13 – Durability Bond Strength Test Results .................................................................... 21 Table 2-14 – Early Age Test Matrix ............................................................................................. 22 Table 2-15 – Early Age Bond Strength Test Results .................................................................... 24 Table 2-16 – Early Age Matrix Compression Strength Test Results ............................................ 25 Table 3-1 – FRP Material Characterization Test Matrix .............................................................. 30 Table 3-2 – Tensile Specimen Nominal Dimensions ................................................................... 31 Table 3-3 - Definitions of Calculations ........................................................................................ 32 Table 3-4 – C200H One (1) Ply Direct Tension Test Results ...................................................... 33 Table 3-5 – C400H One (1) Ply Direct Tension Test Results ...................................................... 34 Table 3-6 – C200H Two (2) Ply Direct Tension Test Results ...................................................... 35 Table 3-7 – C400H Two (2) Ply Direct Tension Test Results ...................................................... 36 Table 3-9 – C200H Interlaminar Shear Test Results .................................................................... 38 Table 3-10 – C400H Interlaminar Shear Test Results .................................................................. 39 Table 3-8 – Average Interlaminar Shear Strength Results ........................................................... 39 Table 3-12 - Tabulated Results for C200H and C400H Control Tensile Bond Tests .................. 42 Table 3-13 – C200H Durability Bond Strength Test Results ....................................................... 42 Table 3-14 – C400H Durability Bond Strength Test Results ....................................................... 42 Table 3-11 – Average Tensile Bond Strength for Control Specimens ......................................... 43 Table 3-15 - Tabulated Results for Glass Transition Temperature (ASTM E1640) .................... 44 Table 4-1: AASHTO Type III Girder Material Properties (From Construction Documents) ...... 46 Table 4-2: Concrete Web and Deck Samples Test Results ........................................................... 47 Table 4-3: Prestressing Strands Samples and Test Restuls ........................................................... 47 Table 4-4: Girder Geometries (1 in. = 25.4 cm) ........................................................................... 48 Table 4-5: Description of Damages and Repair Types (1 ft = 0.305 m) ...................................... 49 Table 4-6 – FRCM Material Properties (1 ksi = 6.895 MPa; 1 in. = 25.4 cm) ............................. 57 Table 4-7: FRP Material Properties (1 ksi = 6.895 MPa; 1 in. = 25.4 cm) ................................... 61 Table 4-8: Description of Test Types ........................................................................................... 65 Table 4-9: Summary of Predicted Values and Experimental Tests .............................................. 73 Table 6-1: Summary of Predicted and Experimental Values (Jones et al., 2015) ........................ 84 Table 6-2: Summary of Predicted and Experimental Values ........................................................ 85 Table 6-3: Summary of Design Values ......................................................................................... 85

1
1 INTRODUCTION
1.1 Background
1.1.1 Fabric Reinforced Cementitious Matrix (FRCM) Composites
Fabric-reinforced cementitious mortar (FRCM) recently emerged as an additional strengthening technology due to its inherent heat resistance and compatibility with the substrate (i.e., can be applied on a wet surface and allow vapor permeability). FRCM systems consist of one or more layers of dry fabrics made of Carbon, Glass, Aramid, or Polyparaphenylene benzobisoxazole (PBO) fabrics that are sandwiched between layers of cementitious mortars (Figure 1-1). Dry fabrics imply that the fibers are not fully impregnated by the matrix, contrary to FRP systems. Fabrics are produced with various window sizes and the lightweight, high tensile strength, and ease of application makes the system appealing. The cement based matrix exhibits high compressive strength but low tensile strength as well as protecting and transferring the load to the fibers. Therefore, the fibers are the primary tensile load carrying mechanism. FRCM systems ensure the endurance of the rehabilitation process and consequently the sustainability of the strengthened structure. Even though some interesting field applications have been reported that justify FRCM potential as a strengthening technology (Nanni 2012), experimental and theoretical research is still needed to fully characterize FRCM and quantify its mechanical effectiveness
The current criteria used to evaluate, characterize, and approve FRCM composite systems for strengthening existing masonry and concrete structures was developed by the International Code Council Evaluation Service (ICC-ES). This document is titled: AC434-2013 - “Acceptance Criteria for Masonry and Concrete Strengthening Using Fabric-Reinforced Cementitious Matrix (FRCM) Composite Systems”, and it states the guidelines for all standards and test procedures required to evaluate products for code compliance. Similarly, the current design and construction guidelines for FRCM systems was developed by the American Concrete Institute (ACI) and is titled: ACI 549.4R-13 “Guide to Design and Construction of Externally Bonded Fabric Reinforced Cementitious Matrix (FRCM) Systems for Repair and Strengthening Concrete and Masonry Structures” (ACI 549.4R 2013). This document also contains all necessary tools for an effective design and construction of FRCM systems: material properties, system qualifications, installation guidelines, design considerations for both reinforced concrete and masonry, reinforcement details, and design examples.
Concrete
Upper layer of mortar
Fabric
Bottom layer of mortar
FRCM)
Figure 1-1 – Schematic Representation of FRCM for Strengthening Concrete Structures

2
1.1.2 Fiber Reinforced Polymer (FRP) Composites
FRP materials are a novel repair material that has been proven to be a viable alternative to traditional repair methods for reinforced concrete, masonry, and prestressed concrete structural elements. FRP is comprised of fibers embedded into a polymeric resin matrix. The FRP matrix is comprised of a polymer, or resin that serves as a binder to the reinforcing fibers. As a system, the resin protects and transfers the load to the fibers. Typical fibers used in structural applications and research are made from Glass, Carbon, and Aramid where the purpose of the fibers is to carry the load and give the system high tensile strength and rigidity in the longitudinal direction. FRP composites exhibit excellent tensile strength in the direction of the fibers and relatively low strength in the transverse direction of the fibers which demonstrates an isotropic behavior of the system. FRP composite systems exhibit elastic behavior up to failure and do not experience yielding. Material properties include low to high modulus of elasticity values as well as low compressive strength. FRP materials are resistant to corrosion and exhibit a good weathering durability performance compared to other construction materials.
FRP technology tailored to RC repair was first introduced in the early 90’s (Nanni 1995, Nanni 1997) and since then has had an increasing momentum due to the many studies that have been conducted and reported, in order to understand the properties of FRP systems and their optimal uses. FRP as a repair technique has been proven to be structurally efficient in restoring stiffness and strength to damaged bridge girders (Di Ludovico et al. 2006). The great success of using FRP composites in repair and rehabilitation of concrete structures was driven by their high strength to weight ratio (lightweight), high tensile strength, and anti-corrosive properties. Current design criteria established as a tool for engineers in practice to utilize for the design and construction of externally bonded FRP systems specifically for concrete is ACI 440.2R-08, “Guide for the Design and Construction of Externally Bonded FRP Systems for Strengthening Concrete Structures” (ACI 440.2R 2008). The document provides all necessary components required for effective FRP design and construction applications: material properties, recommended construction requirements, design recommendations, and design examples. Recently, the American Association of State Highway and Transportation Officials (AASHTO) published guidelines for the strengthening repair of reinforced concrete structures and components using FRP Composites. This document is titled “Guide Specifications for Design of Bonded FRP Systems for Repair and Strengthening of Concrete Bridge Elements” (FRPS-1). This document was published in 2012 and is built from ACI 440.2R-08. The significance of the AASHTO FRPS-1 document is of great importance and is a breakthrough for bridge strengthening and repair using composites.
1.1.3 Structural Repair using Novel Materials in Transportation Infrastructure
Bridges in the Commonwealth of Virginia and other states are often damaged by impact with over-height vehicles. The impact damage may be relatively superficial or quite extensive. For precast, prestressed concrete girders, superficial damage may be repaired with cosmetic methods such as shotcrete or patching with repair grouts. Other repair methods that have been proven to be partially satisfactory are: internal strand splices, strengthening with steel plates, and external post-tensioning, as they are unable to restore complete ultimate capacity of the damaged member. Accordingly, the evolution of FRCM and FRP composites have recently become favorable alternative methods of repair.
Many studies and field applications have been done using externally bonded FRP systems but there is currently very limited research on damage assessment and repair of full-scale PC bridge girders specifically subject to vehicular impact (Di Ludovico 2005, Nanni 1997). Di Ludovico et al.
3
2005 conducted experimental investigation of full-scale damaged PC girders with externally bonded CFRP laminates. Flexural tests were performed for three girders: control and two intentionally damaged girders, cutting two and four strands respectively, were strengthened with CFRP laminates. The strands were damaged on one side of the girder to simulate a vehicular impact. Experimental results indicate the primary mode of failure is due to CFRP delamination. There was also a loss of ductility in the system, partly due to failure controlled by the brittle behavior of FRP delamination. All experimental ultimate moment capacities were greater than or within 0.5% of the theoretical values. Results indicate experimental evidence of the validation of FRP as a strengthening technique, but further research is still necessary to deem FRP a viable repair alternative to traditional methods. Accordingly, FRCM is a “younger” technology compared to FRP systems and although FRCM possess significantly different material constituents and structural behavior, its evolution in research and design exhibits an analogous trend to that of FRP. The technique surmounts the epoxy-bonded FRP systems that lack fire resistance as the embedded fabric is shielded between the mortar layers thus minimizing its vulnerability hazard as the organic matrix is no longer present. In addition, there is high compatibility between mortar and concrete substrate since both materials have cement as a common “base”. Some interesting field applications have been reported that justify FRCM potential as a strengthening technology (Nanni 2012). Currently no studies or field applications have been done using externally bonded FRCM systems applied to damaged PC girders but based on previous research, there are very clear indications that prove FRCM to be an excellent alternative for the rehabilitation and long-term sustainability of concrete structures.
In the United States, all bridges under federal funding must meet the requirements and design guidelines given in the American Association of State Highway and Transportation Officials (AAASHTO) LRFD Bridge Design Specifications (AASHTO 2010). Mandated by the Federal Highway Administration (FHWA), this document is considered the “law of the land” for bridge evaluation, design, and rehabilitation. As the development of composite materials has successfully evolved into design and construction applications, a guideline to assist in the evaluation of the severity of the damage, and to recommend composite repair techniques appropriate for various levels of damage is needed to consistently, efficiently and economically address impact damage. As stated in Section 1.1.2 AASHTO has recently published FRPS-1 document for FRP design and repair of concrete bridge elements that is built from ACI440.2R-08. Accordingly, ACI 440.2R-08 includes provisions for the design and construction of externally bonded FRP systems to prestressed concrete (PC) structures, which make up a significant part of our bridge infrastructure, whereas FRPS-1 does not include any provisions for the repair of prestressed concrete structures. Also, FRPS-1 only establishes bridge repair and strengthening guidelines specific to FRP composites and there is currently no policy in place for the evaluation and repair of impact-damaged girders using FRCM as a strengthening technique.
1.2 Objectives
The overall objective of this research including the research conducted and reported by Virginia Tech is to evaluate two methods of repair (FRCM and FRP) of impact-damaged precast, prestressed bridge girders, and develop guidelines for the best methods for evaluation and repair. The purpose is not to identify a “better” method, but rather to evaluate the two systems separately in order to validate performance and ultimately increase the number of tools available to State Departments of Transportation for emergency repairs. Material characterization of FRCM and FRP technologies is performed to observe the mechanical properties of each system. Results from material characterization are used for the investigation of the two strengthening technologies.

4
2 FRCM MATERIAL CHARACTERIZATION
2.1 Materials
2.1.1 Fabric Reinforced Cementitions Matrix (FRCM)
The FRCM system proposed for this project consists of two main elements X Mesh Gold (GOLD) and X Mortar 750 (M750). GOLD is comprised of polyparaphenylene benzobisoxazole (PBO) fiber fabric with an unbalanced network made of 10 and 20 mm (0.4 and 0.8 in.) spaced fiber rovings. The free space between rovings is roughly 5 and 15 mm (0.2 and 0.6 in.), respectively, and the nominal thickness in the two fibers directions is 0.046 mm (0.0018 in.) in the primary direction and 0.01 mm (0.0004 in.) in the secondary direction, refer to Figure 2-1. M750 is a stabilized inorganic cementitious matrix used for concrete flexural and shearing stress reinforcement.
a) b) c)
Figure 2-1 – FRCM Material Constituents a) GOLD Fabric Roll b) GOLD Fabric Grid c) M750
2.2 FRCM Preparation and Installation
2.2.1 Mixing Method
The inorganic matrix product is prepared by mechanical mixing, since hand mixing is not suggested by the manufacturer. The preparation initiates by adding the dry powder cementitious matrix to 90% of the water needed for the mix. Mixing continues for at least 3 minutes until creating a homogeneous matrix paste. If necessary, the remaining 10% water is mixed for an additional 2 minutes. Upon completion the mortar rests for 2 minutes before being applied to the substrate surface. The matrix to water ratio used for the preparation of the product was 1.59 gal (6.0 liters) of water to 55.12 lbs. (25 kg) material for M750.
2.2.2 Specimen Preparation
The step-by-step application procedure is as follows: Step 1: Apply the first layer of matrix with a trowel on the structure surface with a thickness
of 3 to 4 mm (0.118 to 0.157 in.). Figure 2-2 (a) Step 2: Lay the pre-cut fiber mesh with the appropriate fiber orientation on top of the first
matrix layer and press lightly with bottom of trowel to embed the fabric in the matrix. Figure 2-2 (b)
Step 3: Add a second layer of the matrix with the trowel to cover the fiber mesh with a thickness of 3 to 4 mm (0.118 to 0.157 in.) to create a sandwich. Figure 2-2 (c)
Step 4: For multiple layers, repeat steps 2 and 3 until desired number of layers is reached. (Figure 2-3)
Primary Direction →

5
Also, there are 2 additional application requirements. An overlap of 120 mm (4.72 in.) was used when joining fiber meshes together when applicable. The product must be applied at an environmental temperature range between 5 and 35 ºC (41 to 95ºF) as specified by the manufacturer.
a) b) c)
Figure 2-2 –Specimen Preparation a) First Layer of Mortar b) Placing Mesh c) Layer of Mortar (Sandwich)
Figure 2-3 –Multiple Layers of FRCM
2.3 Test Matrix Table 2-1 – FRCM Material Characterization Test Matrix
Test Reinforcement Conditioning
Replicates Specification Grid Plies Environment Length
Compression of Matrix Mortar
None n/a Lime water
7 days 5 ASTM C109 28 days 5 ASTM C109
Compression of Repair Mortar
7 days 5 ASTM C109 28 days 5 ASTM C109
FRCM Direct Tension
Continuous One Ambient n/a 5 AC434 Annex A Continuous Two Ambient n/a 5 AC434 Annex A
Lap One Ambient n/a 5 AC434 Annex A FRCM Interlaminar
Shear Continuous
One Ambient n/a 5 ASTM D2344 Two Ambient n/a 5 ASTM D2344
FRCM bond over Repair Mortar
Continuous One Ambient n/a 5 ASTM C1583
FRCM Bond Continuous One Ambient n/a 5 ASTM C1583
FRCM Bond Continuous One Saltwater 1000 hrs 5 ASTM C1583 3000 hrs** 5 ASTM D1141
FRCM Bond Continuous One Water vapor 1000 hrs 5 ASTM C1583 3000 hrs** 5 ASTM D2247
FRCM Bond Continuous One Alkaline 1000 hrs 5 ASTM C1583 3000 hrs** 5 ASTM C581
** Post Testing
6
2.4 Test Data and Results
2.4.1 Compression of Matrix Mortar
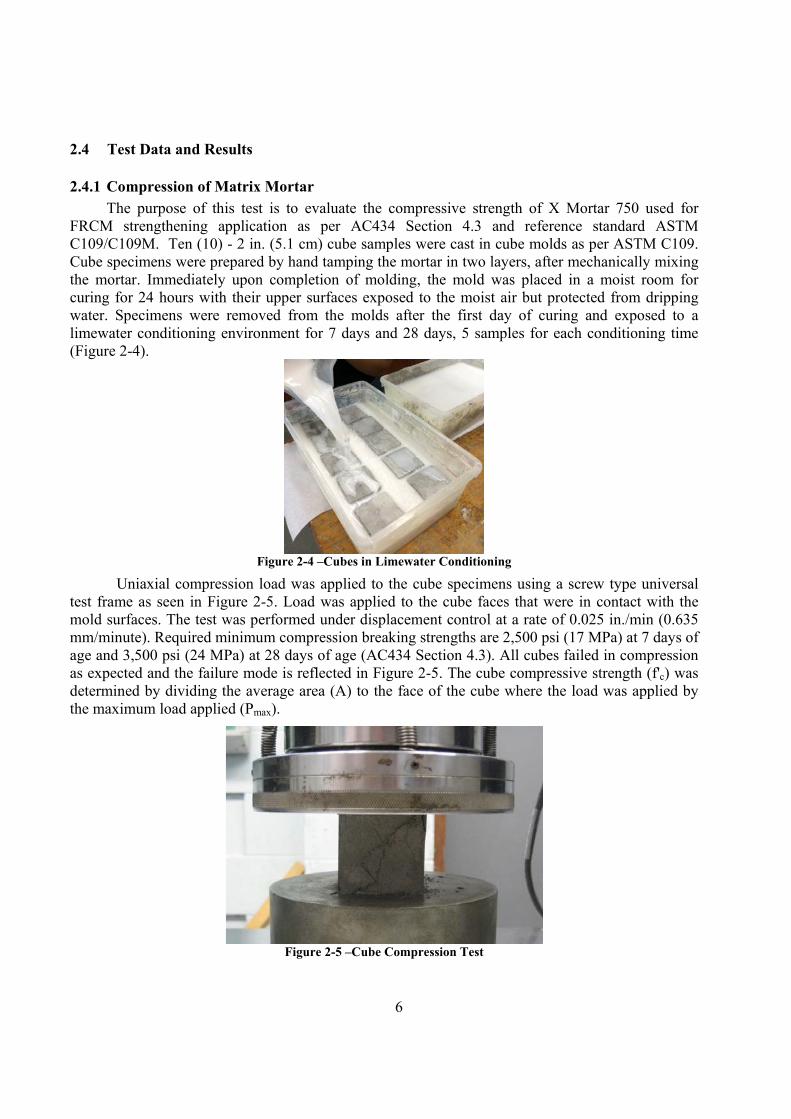
The purpose of this test is to evaluate the compressive strength of X Mortar 750 used for FRCM strengthening application as per AC434 Section 4.3 and reference standard ASTM C109/C109M. Ten (10) - 2 in. (5.1 cm) cube samples were cast in cube molds as per ASTM C109. Cube specimens were prepared by hand tamping the mortar in two layers, after mechanically mixing the mortar. Immediately upon completion of molding, the mold was placed in a moist room for curing for 24 hours with their upper surfaces exposed to the moist air but protected from dripping water. Specimens were removed from the molds after the first day of curing and exposed to a limewater conditioning environment for 7 days and 28 days, 5 samples for each conditioning time (Figure 2-4).
Figure 2-4 –Cubes in Limewater Conditioning
Uniaxial compression load was applied to the cube specimens using a screw type universal test frame as seen in Figure 2-5. Load was applied to the cube faces that were in contact with the mold surfaces. The test was performed under displacement control at a rate of 0.025 in./min (0.635 mm/minute). Required minimum compression breaking strengths are 2,500 psi (17 MPa) at 7 days of age and 3,500 psi (24 MPa) at 28 days of age (AC434 Section 4.3). All cubes failed in compression as expected and the failure mode is reflected in Figure 2-5. The cube compressive strength (f'c) was determined by dividing the average area (A) to the face of the cube where the load was applied by the maximum load applied (Pmax).
Figure 2-5 –Cube Compression Test

7
Table 2-2 – Compression of Matrix Mortar Results
SPECIMEN ID
Ave. Area Peak Load Compressive
Strength in2 cm2 lb N psi MPa
7 Day
M750-7-1 4 25.8 11,230 49,954 2,808 19.36
M750-7-2 4 25.8 12,180 54,179 3,045 20.99
M750-7-3 4 25.8 11,580 51,510 2,895 19.96
M750-7-4 4 25.8 12,470 55,469 3,118 21.49
M750-7-5 4 25.8 13,500 60,051 3,375 23.27
Average 12,192 54,233 3,048 21.02 Std. Dev. 879 3,909 220 1.51
C.O.V. (%) 7 7 7 7
28 Day
M750-28-1 4 25.8 17,080 75,976 4,270 29.44
M750-28-2 4 25.8 13,080 58,183 3,270 22.55
M750-28-3 4 25.8 12,960 57,649 3,240 22.34
M750-28-4 4 25.8 14,640 65,122 3,660 25.23
M750-28-5 4 25.8 15,440 68,681 3,860 26.61
Average 14,640 65,122 3,660 25.23 Std. Dev. 1,721 7,656 430 2.97
C.O.V. (%) 12 12 12 12
2.4.2 Compression of Repair Mortar
The purpose of this test is to evaluate the compressive strength of Exocem FP Repair Mortar used for concrete substrate repair prior to application of FRCM strengthening systems. Tests are performed as per AC434 Section 4.3 and reference standard ASTM C109/C109M. Ten (10) - 2 in. (5.1 cm) cube samples were cast in cube molds as per ASTM C109. Cube specimens were prepared by hand tamping the mortar in two layers, after mechanically mixing the mortar. Immediately upon completion of molding, the mold was placed in a moist room for curing for 24 hours with their upper surfaces exposed to the moist air but protected from dripping water.
Figure 2-6 –Cubes in Limewater Conditioning

8
Specimens were removed from the molds after the first day of curing and exposed to a limewater conditioning environment for 7 days and 28 days, five samples for each conditioning time (Figure 2-6). Uniaxial compression load was applied to the cube specimens using a screw type universal test frame as seen in Figure 2-5. Similar to the Matrix Mortar Compression test, the load was applied to the cube faces that were in contact with the mold surfaces. The test was performed under displacement control at a rate of 0.025 in./min (0.635 mm/minute). Required minimum compression breaking strengths are 2,500 psi (17 MPa) at 7 days of age and 3,500 psi (24 MPa) at 28 days of age (AC434 Section 4.3). All cubes failed in compression as expected and reflected in Figure 2-7. The cube compressive strength (f'c) was determined by dividing the average area (A) to the face of the cube where the load was applied by the maximum load applied (Pmax).
Figure 2-7 –Repair Mortar Cube Failure Mode
Table 2-3 – Compression of Repair Mortar Results
SPECIMEN ID
Ave. Area Peak Load Compressive
Strength in2 cm2 lb N psi MPa
7 Day
M750-7-1 4 25.8 19,010 84,561 4,753 32.77
M750-7-2 4 25.8 18,650 82,959 4,663 32.15
M750-7-3 4 25.8 18,960 84,338 4,740 32.68
M750-7-4 4 25.8 17,760 79,000 4,440 30.61
M750-7-5 4 25.8 19,080 84,872 4,770 32.89
Average 18,692 83,146 4,673 32.22 Std. Dev. 546 2,430 137 0.94
C.O.V. (%) 3 3 3 3
28 Day
M750-28-1 4 25.8 21,080 93,769 5,270 36.34
M750-28-2 4 25.8 21,000 93,413 5,250 36.2
M750-28-3 4 25.8 20,640 91,811 5,160 35.58
M750-28-4 4 25.8 20,570 91,500 5,143 35.46
M750-28-5 4 25.8 20,370 90,610 5,093 35.11
Average 20,732 92,221 5,183 35.74 Std. Dev. 299 1,332 75 0.52
C.O.V. (%) 1 1 1 1

9
2.4.3 FRCM Direct Tension
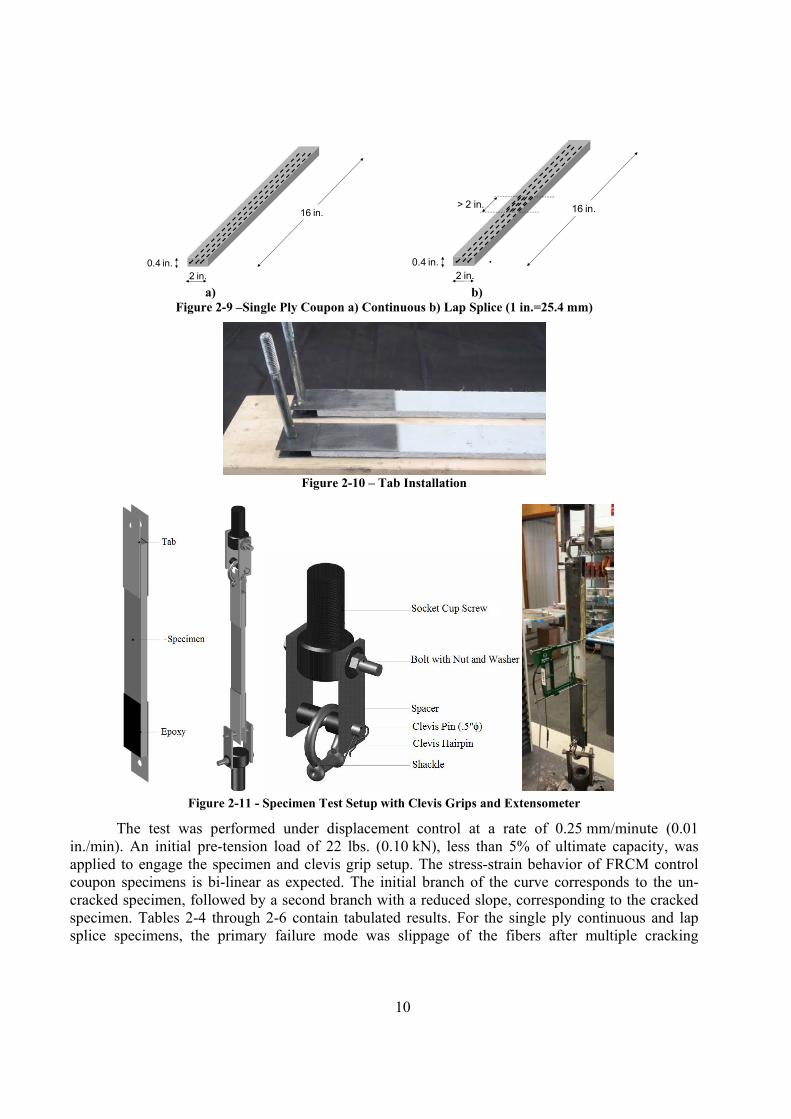
The purpose of this test is to determine tensile strength, elongation, and modulus of elasticity of the FRCM strengthening composite system using coupons tested under ambient conditions. Tensile coupons were tested according to AC434 Section 4.2.3 for Tensile Strength and Annex A Tensile Testing of FRCM Composite Specimens (AC434 2013).In total fifteen (15) coupons were prepared: five continuous one ply samples, five continuous two ply samples, and five lapped one ply samples. Panels were made using a flat mold with non-adhesive surface surrounded by rectangular aluminum rods to control the overall thickness of the panel. FRCM installation followed the description provided in Section 2.2 of this report. Panels were left to cure for 28 days before coupons were extracted with a circular diamond blade saw (Figure 2-8) from larger FRCM material panels. The saw was equipped with a rigging fixture to ensure coupons were secured and cut to the specified dimensions. Continuous and lap nominal single ply rectangular coupons were prepared with 16 x 2 x .4 in. (410 x 560 mm x 10 mm) length x width x thickness, respectively. Continuous two ply rectangular coupons were prepared with 16 x 2 x .55 in. (410 x 560 mm x 14 mm) length x width x thickness, respectively. Fiber alignment was set in the 0° direction along the length of the coupon. Lap Tensile Strength coupon specimens were made following the same methodology, with the difference being a nominal mesh overlap length of 4.72 in (120 mm). Steel metal tabs with clevis openings were bonded to each end of the specimen with Loctite PL Premium Polyurethane Construction Adhesive. The tab lengths were 6 in. (150mm) for one and two ply continuous tensile coupons and 4 in (100 mm) for the single ply lap tensile coupons. The glue cured for at least 24 hours prior to testing. During gluing, coupons were set on a frame to ensure tab alignment and location of the clevis openings as seen in Figure 2-10.
a) b) c)
Figure 2-8 –Coupon Preparation a) Cure for 28 days b) Cut Coupons c) Final Product
All specimens were conditioned prior testing under laboratory ambient conditions at room temperature 73 ± 6°F (23 ± 3°C) and 60 ±5% relative humidity, for at least 28 days. Uniaxial tension load was applied to the tensile coupons. Testing was performed using a screw driven Instron Universal Test Frame with a maximum capacity of 30 kip (130 kN). Axial deformation was measured using a clip on extensometer with a 4 in (100 mm) gauge length, placed mid-length of the specimen. The gripping mechanism is a clevis-type connection on one end and a double clevis connection on the other end (Figure 2-11). This ensures boundary conditions that maximize the degrees of freedom, minimize bending, and simulate actual conditions in the field. All data was gathered using Instron’s Bluehill software and data acquisition system.
10
16 in.
0.4 in.2 in. 2 in.
16 in.
0.4 in.
> 2 in.
a) b)
Figure 2-9 –Single Ply Coupon a) Continuous b) Lap Splice (1 in.=25.4 mm)
Figure 2-10 – Tab Installation
Figure 2-11 - Specimen Test Setup with Clevis Grips and Extensometer
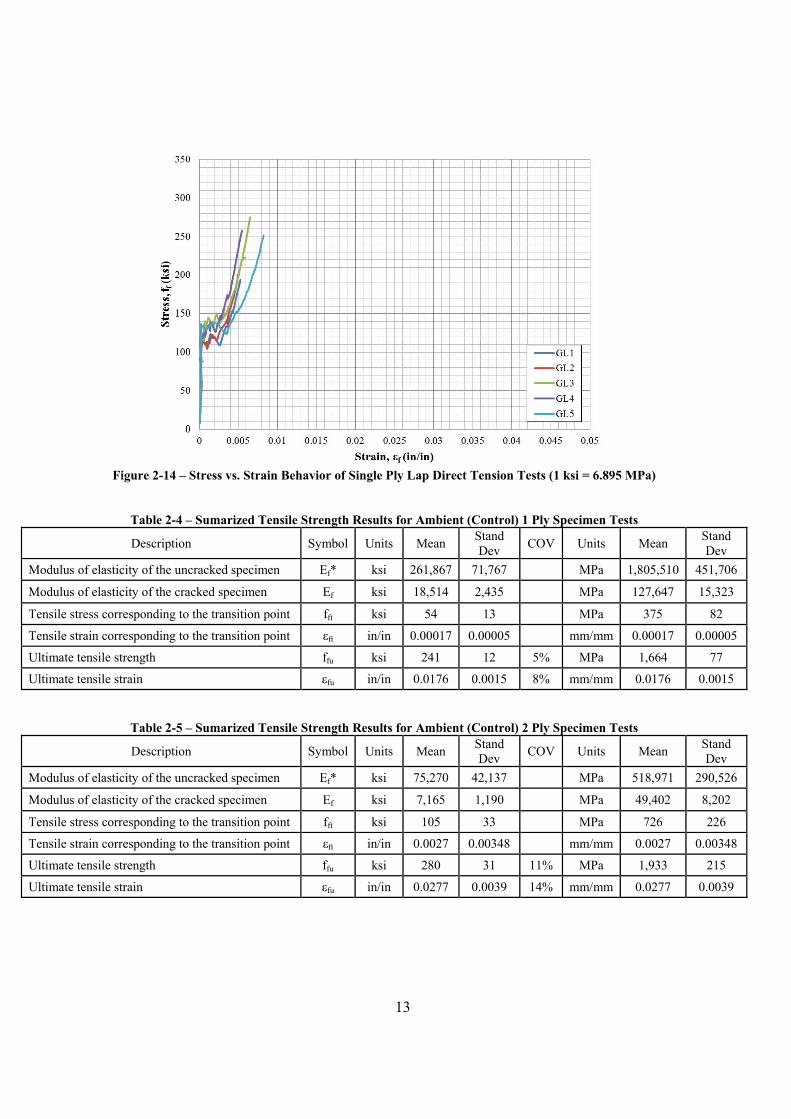
The test was performed under displacement control at a rate of 0.25 mm/minute (0.01 in./min). An initial pre-tension load of 22 lbs. (0.10 kN), less than 5% of ultimate capacity, was applied to engage the specimen and clevis grip setup. The stress-strain behavior of FRCM control coupon specimens is bi-linear as expected. The initial branch of the curve corresponds to the un-cracked specimen, followed by a second branch with a reduced slope, corresponding to the cracked specimen. Tables 2-4 through 2-6 contain tabulated results. For the single ply continuous and lap splice specimens, the primary failure mode was slippage of the fibers after multiple cracking

11
throughout the length of the specimen, perpendicular to the direction of the load. A secondary de-bonding failure mode located at the tab ends was observed in some cases. For the two ply continuous specimens, the primary failure mode is also slippage of the fibers after multiple cracking, but the crack damage progression varied due to the additional layer of fabric. Cracking begins where a crack spans the entire width of the specimen, then the crack begins to propagate through the thickness, but instead of propagating through the entire thickness, the crack propagates through the first layer, and then propagates parallel to the length of the specimen. This increase in fiber volume causes the crack to propagate in a different direction. The modulus of the cracked and un-cracked specimen is determined as follows:
Modulus of the cracked specimen: On the segment of the response curve corresponding to cracked behavior after the transition as defined in AC434 A7.2, two points are selected on the experimental curve at a stress level equal to 0.90ffu and 0.60ffu. The slope of the line that connects these two points represents the tensile modulus of elasticity at that region: Ef = Δf / Δε = (0.90 ffu - 0.60 ffu) / (ε[email protected] ffu - ε[email protected] ffu) Modulus of the un-cracked specimen: It is calculated using the slope between two points. The first point is the origin. The second point is the intersection of the linear trend of the first portion of the experimental curve and the linear trend of the second portion of the experimental curve. This section also presents the axial tensile coupon behavior by plotting the stress versus strain results. The section contains three graphs: the first graph (Figure 2-12) corresponds to the single ply continuous tensile strength test results; the second graph (Figure 2-13) corresponds to the double ply continuous tensile strength test results; the third graph (Figure 2-14) corresponds to the single ply lap test results. Each graph contains one experimental curve for each specimen replicate.
Table 2-4, Table 2-5, and Table 2-6 contain the average tabulated stress, strain and elastic modulus results with average, standard deviation (Std. Dev.) and coefficient of variance (C.O.V) values for the single ply and two ply direct tensile tests and lap-tension tests, where the following nomenclature (as specified in AC434) was used:
Ef* Modulus of elasticity of the un-cracked specimen; Ef Modulus of elasticity of the cracked specimen; fft Tensile stress corresponding to the transition point; εft Tensile strain corresponding to the transition point; ffu Ultimate tensile strength; and εfu Ultimate tensile strain.
Table 2-7, and Table 2-8, and Table 2-9 contain the individual tabulated values of the previously mentioned variables for each tension test.

12
Figure 2-12 – Stress vs. Strain Behavior of One Ply Direct Tension Tests (1 ksi = 6.895 MPa)
Figure 2-13 – Stress vs. Strain Behavior of Two Ply Direct Tension Tests (1 ksi = 6.895 MPa)
13
Figure 2-14 – Stress vs. Strain Behavior of Single Ply Lap Direct Tension Tests (1 ksi = 6.895 MPa)
Table 2-4 – Sumarized Tensile Strength Results for Ambient (Control) 1 Ply Specimen Tests
Description Symbol Units Mean Stand Dev
COV Units Mean Stand Dev
Modulus of elasticity of the uncracked specimen Ef* ksi 261,867 71,767 MPa 1,805,510 451,706
Modulus of elasticity of the cracked specimen Ef ksi 18,514 2,435 MPa 127,647 15,323
Tensile stress corresponding to the transition point fft ksi 54 13 MPa 375 82
Tensile strain corresponding to the transition point εft in/in 0.00017 0.00005 mm/mm 0.00017 0.00005
Ultimate tensile strength ffu ksi 241 12 5% MPa 1,664 77
Ultimate tensile strain εfu in/in 0.0176 0.0015 8% mm/mm 0.0176 0.0015
Table 2-5 – Sumarized Tensile Strength Results for Ambient (Control) 2 Ply Specimen Tests
Description Symbol Units Mean Stand Dev
COV Units Mean Stand Dev
Modulus of elasticity of the uncracked specimen Ef* ksi 75,270 42,137 MPa 518,971 290,526
Modulus of elasticity of the cracked specimen Ef ksi 7,165 1,190 MPa 49,402 8,202
Tensile stress corresponding to the transition point fft ksi 105 33 MPa 726 226
Tensile strain corresponding to the transition point εft in/in 0.0027 0.00348 mm/mm 0.0027 0.00348
Ultimate tensile strength ffu ksi 280 31 11% MPa 1,933 215
Ultimate tensile strain εfu in/in 0.0277 0.0039 14% mm/mm 0.0277 0.0039
14
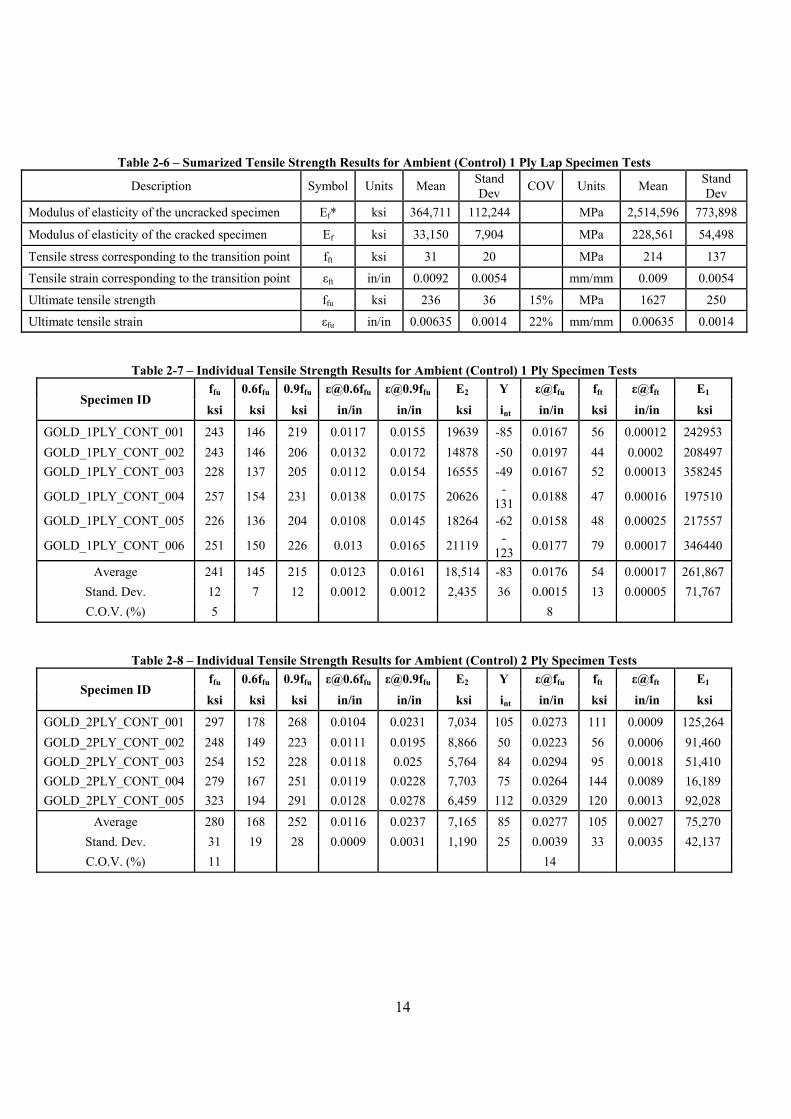
Table 2-6 – Sumarized Tensile Strength Results for Ambient (Control) 1 Ply Lap Specimen Tests
Description Symbol Units Mean Stand Dev
COV Units Mean Stand Dev
Modulus of elasticity of the uncracked specimen Ef* ksi 364,711 112,244 MPa 2,514,596 773,898
Modulus of elasticity of the cracked specimen Ef ksi 33,150 7,904 MPa 228,561 54,498
Tensile stress corresponding to the transition point fft ksi 31 20 MPa 214 137
Tensile strain corresponding to the transition point εft in/in 0.0092 0.0054 mm/mm 0.009 0.0054
Ultimate tensile strength ffu ksi 236 36 15% MPa 1627 250
Ultimate tensile strain εfu in/in 0.00635 0.0014 22% mm/mm 0.00635 0.0014
Table 2-7 – Individual Tensile Strength Results for Ambient (Control) 1 Ply Specimen Tests
Specimen ID ffu 0.6ffu 0.9ffu ε@0.6ffu ε@0.9ffu E2 Y ε@ffu fft ε@fft E1
ksi ksi ksi in/in in/in ksi int in/in ksi in/in ksi
GOLD_1PLY_CONT_001 243 146 219 0.0117 0.0155 19639 -85 0.0167 56 0.00012 242953
GOLD_1PLY_CONT_002 243 146 206 0.0132 0.0172 14878 -50 0.0197 44 0.0002 208497
GOLD_1PLY_CONT_003 228 137 205 0.0112 0.0154 16555 -49 0.0167 52 0.00013 358245
GOLD_1PLY_CONT_004 257 154 231 0.0138 0.0175 20626 -
1310.0188 47 0.00016 197510
GOLD_1PLY_CONT_005 226 136 204 0.0108 0.0145 18264 -62 0.0158 48 0.00025 217557
GOLD_1PLY_CONT_006 251 150 226 0.013 0.0165 21119 -
123 0.0177 79 0.00017 346440
Average 241 145 215 0.0123 0.0161 18,514 -83 0.0176 54 0.00017 261,867
Stand. Dev. 12 7 12 0.0012 0.0012 2,435 36 0.0015 13 0.00005 71,767
C.O.V. (%) 5 8
Table 2-8 – Individual Tensile Strength Results for Ambient (Control) 2 Ply Specimen Tests
Specimen ID ffu 0.6ffu 0.9ffu ε@0.6ffu ε@0.9ffu E2 Y ε@ffu fft ε@fft E1
ksi ksi ksi in/in in/in ksi int in/in ksi in/in ksi
GOLD_2PLY_CONT_001 297 178 268 0.0104 0.0231 7,034 105 0.0273 111 0.0009 125,264
GOLD_2PLY_CONT_002 248 149 223 0.0111 0.0195 8,866 50 0.0223 56 0.0006 91,460
GOLD_2PLY_CONT_003 254 152 228 0.0118 0.025 5,764 84 0.0294 95 0.0018 51,410
GOLD_2PLY_CONT_004 279 167 251 0.0119 0.0228 7,703 75 0.0264 144 0.0089 16,189
GOLD_2PLY_CONT_005 323 194 291 0.0128 0.0278 6,459 112 0.0329 120 0.0013 92,028
Average 280 168 252 0.0116 0.0237 7,165 85 0.0277 105 0.0027 75,270
Stand. Dev. 31 19 28 0.0009 0.0031 1,190 25 0.0039 33 0.0035 42,137
C.O.V. (%) 11 14

15
Table 2-9 – Individual Tensile Strength Results for Ambient (Control) 1 Ply Lap Specimen Tests
Specimen ID ffu 0.6ffu 0.9ffu ε@0.6ffu ε@0.9ffu E2 Y ε@ffu fft ε@fft E1
ksi ksi ksi in/in in/in ksi int in/in ksi in/in ksi
GOLD_1PLY_LAP_001 194 116 175 0.00288 0.00482 30,005 30 0.00547 32 0.007 435,113
GOLD_1PLY_LAP_002 201 121 181 0.00242 0.00462 27,406 54 0.00535 58 0.012 462,308
GOLD_1PLY_ LAP_003 275 165 248 0.004 0.00603 40,669 2 0.00671 3 0.001 441,419
GOLD_1PLY_ LAP_004 258 155 232 0.00315 0.00497 42,482 21 0.00558 25 0.011 235,686
GOLD_1PLY_ LAP_005 252 151 227 0.00467 0.00767 25,188 33 0.00867 37 0.015 249,030
Average 236 142 212 0.0034 0.0056 33,150 28 0.0064 31 0.0092 364,711
Stand. Dev. 36 22 33 0.0009 0.0013 7,904 19 0.0014 20 0.0054 112,244
C.O.V. (%) 15 22
2.4.4 Interlaminar Shear Strength
The purpose of this test is to evaluate the interlaminar shear strength of the FRCM composite system under control ambient conditions. Tests are performed as per AC434 Section 4.2.4 for Composite interlaminar shear strength and reference standard ASTM D2344/D2344M-00 (2006) Standard Test Method for Short-Beam Strength of Polymer Matrix Composite Materials and Their Laminates. Ten (10) - 2.5 in. x 1 in. (63.5 mm x 25.4 mm)specimens were prepared as per AC434 Section 8.3.3 Figure 2-15; five one ply samples and five two ply samples
Figure 2-15 –Interlaminar Shear Specimen
A three point bending fixture per ASTM D2344 specifications was used to test the specimen
(Figure 2-16). A flexural load was applied using a screw driven Instron Universal Test Frame with a maximum capacity of 30 kip (130 kN). Deflection was measured from the cross-head displacement. All data was gathered using Instron’s Bluehill software and data acquisition system. The test was performed under displacement control at a rate of 0.05 in./min (1.0 mm/minute).

16
Figure 2-16 –Interlaminar Shear Test Set-up
The average short beam strength for single ply interlaminar shear is 182 psi and for two ply interlaminar shear is 476 psi. Refer to Table 2-10 and Table 2-11. The primary failure mode of the FRCM short beam specimens was by matrix cracking in the tension side, and less often by a combination of cracking and interlaminar shear. The short beam strength is calculated as follows:
bh
PF msbs 75.0
Where: Fsbs is the short beam strength, psi; Pm is the maximum load obtained during the test, lbs; b is the measured specimen width, in; h is the measured specimen thickness, in.
Table 2-10 and Table 2-11 contain tabulated specimen dimensions, maximum load, and short beam strength results with average, standard deviation (Std. Dev.) and coefficient of variance (C.O.V) values.
Table 2-10 – Interlaminar Shear Test Summary for Ambient One (1) Ply Specimens
SPECIMEN ID Width Thickness Span Max Load Beam Strength
in cm in cm in cm lbf N psi MPa
GOLD_1PLY_IS_001 0.98 25.0 0.41 10.4 1.64 41.7 84.8 377.1 158.4 1.09
GOLD_1PLY_IS_002 0.99 25.2 0.42 10.7 1.68 42.7 103.8 461.8 186.7 1.29
GOLD_1PLY_IS_003 1.03 26.1 0.38 9.8 1.54 39.1 86.1 383.1 163.8 1.13
GOLD_1PLY_IS_004 1.04 26.4 0.42 10.6 1.66 42.2 141.1 627.4 244.5 1.69
GOLD_1PLY_IS_005 1.02 25.8 0.38 9.6 1.52 38.6 79.7 354.6 155.0 1.07
Average 1.01 25.7 0.40 10.2 n/a n/a 99.1 440.8 181.7 1.25
Std. Dev. 0.02 0.6 0.02 0.5 25.2 111.9 37.2 0.26
C.O.V. (%) 2 2 5 5 25 25 21 21

17
Table 2-11 – Interlaminar Shear Test Summary for Ambient Two (2) Ply Specimens
SPECIMEN ID Width Thickness Span Max Load Beam Strength
in cm in cm in cm lbf N psi MPa
GOLD_2PLY_IS_001 1.06 26.9 0.35 9.0 2.44 61.9 187 831 375 2.58
GOLD_2PLY_IS_002 1.01 25.7 0.36 9.3 2.41 61.2 246 1,093 500 3.45
GOLD_2PLY_IS_003 1.06 27.0 0.32 8.2 2.38 60.4 267 1,188 584 4.03
GOLD_2PLY_IS_004 1.00 25.4 0.32 8.0 2.48 63.0 203 901 481 3.32
GOLD_2PLY_IS_005 1.03 26.1 0.32 8.1 2.46 62.6 190 844 437 3.01
Average 1.03 26.2 0.33 8.5 n/a n/a 218 972 476 3.28
Std. Dev. 0.03 0.7 0.02 0.6 36 160 77.6 0.54
C.O.V. (%) 3 3 7 7 16 16 16 16
2.4.5 FRCM Bond over Repair Mortar
The purpose of this test is to determine the bond strength (i.e., pull off resistance) of the FRCM system, based on the application of the composite systems under control ambient conditions. Tests are performed as per AC434 Section 4.8 and reference standard ASTM C1583/C1583M-04. Five (5) bond specimens were tested under ambient laboratory conditions. Exocem FP Repair Mortar was applied to a portion of 6 in. x 12 in. x 72 in. (HxWxL–15.2 cm x 30.5 cm x 12.8 cm) concrete slab as seen in Figure 2-17. The concrete surface was saturated surface dry prior to the application of repair mortar.
Figure 2-17 – Repair Mortar Application
The repair mortar was cured for 48 hours before the FRCM system was applied (Figure 2-18). The slab was then strengthened with a single ply of FRCM as per Section 2.2. Tests were conducted 28 days after installation and curing of the FRCM systems.

18
Figure 2-18 – FRCM Application Over Repair Mortar
The bond tests were performed following ASTM C1583/C1583M 04, where a circular cut
was made on the cured FRCM system using a core drill, to a depth of 0.5 in. (12.7mm) into the substrate. A disk of steel was attached with the epoxy to the FRCM surface as a means to pull of the circular area. The adhesive was left to cure for 24 hours before performing the pull off test (Figure 2-19). Uniaxial tensile load was applied perpendicular to the test surface using a pull-off test machine (James Bond Tester). Figure 2-20 shows the test set-up. The ultimate load was recorded using the integrated dial gauge of the test machine.
(a) (b) (c)
Figure 2-19 –Pull off Test a) Drilling Instrumentation b) Circular Embedded Cut c) Attached Steel Disk
The load was applied manually using the screw system of the test machine connected to a hydraulic piston. The test was performed under load control at a constant rate so that the tensile stress increased at a rate of 5 ± 2 psi/s (35 ± 15 kPa/s).

19
(a) (b) (c)
Figure 2-20 –Pull off Test Instrumentation a) James Bond Test b) Test Configuration c) Test Set up
The ultimate bond or tensile strength was determined to be 207 psi (1.43 MPa). Table 2-12 presents the tabulated results. The primary failure mode of the bond tests occurred within the FRCM composite system, at the interface between the FRCM mortar and fiber mesh, herein referred to as failure type “C” (Figure 2-22). Figure 2-21 shows the different possible failure modes during the bond test as per AC434. The ultimate bond or tensile strength was calculated based on the type of failure, following the guidelines provided by AC434 by dividing the recorded tensile load at failure by area, where the area depends on the failure mode (net area or matrix area) of the test specimen. Table 2-12 contains the tabulated bond (tensile strength) results with average, standard deviation (Std. Dev.) and coefficient of variance (C.O.V) values, where the following nomenclature was used:
D Diameter of test specimen (steel disk); A Area of test specimen (steel disk); Pult Ultimate failure; and Sult Ultimate bond or tensile strength
Figure 2-21 – Bond Test Failure Mode Types

20
Figure 2-22 –Bond Strength Over Repair Mortar Primary Failure Mode
Table 2-12 – Bond Strength Over Repair Mortar Test Results
SPECIMEN ID Diameter Area Max Load Ultimate Stress Failure
Mode in mm in2 mm2 lbf N psi MPa
G-S-RMControl-1 1.93 49 1.1 707 775 3,449 247 1.7 C
G-S-RMControl-2 1.93 49 1.1 707 550 2,448 175 1.21 C
G-S-RMControl-3 1.93 49 1.1 707 700 3,115 223 1.54 C
G-S-RMControl-4 1.93 49 1.1 707 580 2,581 185 1.27 C
Average 651 2,898 207 1.43 Std. Dev. 105 467 33 0.23
C.O.V. (%) 16% 16% 16% 16%
2.4.6 FRCM Bond/Durability of FRCM Bond
The purpose of this test is to determine the bond strength (i.e., pull off resistance) of the FRCM system under evaluation, based on the application of the composite systems under control ambient conditions and after prescribed environmental exposure conditions. Tests are performed as per AC434 Section 4.8 and reference standard ASTM C1583/C1583M-04.
Thirty five (35) pull-out test samples were prepared to investigate the effect of six environmental conditioning cycles on the bond strength of the FRCM system and concrete surface interface. Five of these pull-out tests samples were kept in ambient conditions and serve as the control specimens. Nominal concrete slabs sizes of 18.0 x 12.0 x 4.0 in (450 x 300 x 100 mm) were used as substrate materials to the FRCM composite systems. Specimens were strengthened with a single ply of FRCM composite system as described in Section 2.2 of this report. Note that before installing the reinforcement specimens were left in a moisture room for 24hrs in order to saturate the surface voids as means to prepare it. Any excess water was removed with compressed air. Specimens were placed in the respective conditioning environments 28 days after installation and curing of the FRCM systems.
21
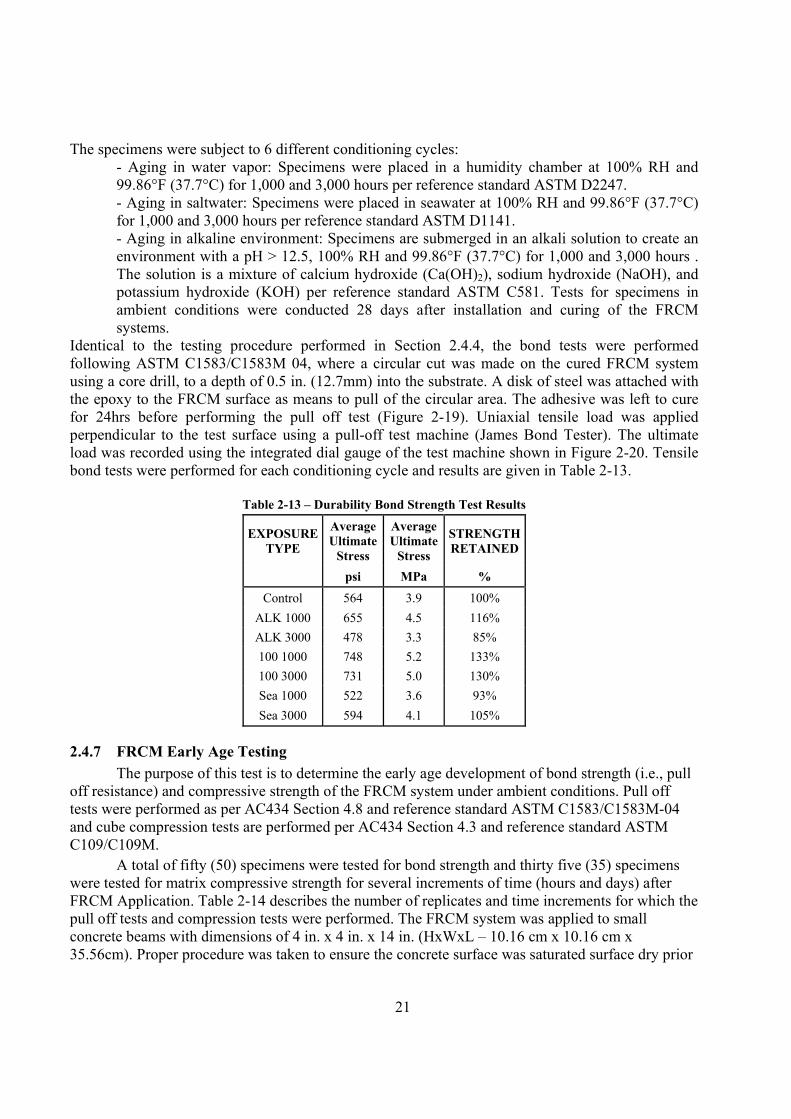
The specimens were subject to 6 different conditioning cycles: - Aging in water vapor: Specimens were placed in a humidity chamber at 100% RH and 99.86°F (37.7°C) for 1,000 and 3,000 hours per reference standard ASTM D2247. - Aging in saltwater: Specimens were placed in seawater at 100% RH and 99.86°F (37.7°C) for 1,000 and 3,000 hours per reference standard ASTM D1141. - Aging in alkaline environment: Specimens are submerged in an alkali solution to create an environment with a pH > 12.5, 100% RH and 99.86°F (37.7°C) for 1,000 and 3,000 hours . The solution is a mixture of calcium hydroxide (Ca(OH)2), sodium hydroxide (NaOH), and potassium hydroxide (KOH) per reference standard ASTM C581. Tests for specimens in ambient conditions were conducted 28 days after installation and curing of the FRCM systems.
Identical to the testing procedure performed in Section 2.4.4, the bond tests were performed following ASTM C1583/C1583M 04, where a circular cut was made on the cured FRCM system using a core drill, to a depth of 0.5 in. (12.7mm) into the substrate. A disk of steel was attached with the epoxy to the FRCM surface as means to pull of the circular area. The adhesive was left to cure for 24hrs before performing the pull off test (Figure 2-19). Uniaxial tensile load was applied perpendicular to the test surface using a pull-off test machine (James Bond Tester). The ultimate load was recorded using the integrated dial gauge of the test machine shown in Figure 2-20. Tensile bond tests were performed for each conditioning cycle and results are given in Table 2-13.
Table 2-13 – Durability Bond Strength Test Results
EXPOSURE TYPE
Average Ultimate
Stress
Average Ultimate
Stress
STRENGTH RETAINED
psi MPa %
Control 564 3.9 100%
ALK 1000 655 4.5 116%
ALK 3000 478 3.3 85%
100 1000 748 5.2 133%
100 3000 731 5.0 130%
Sea 1000 522 3.6 93%
Sea 3000 594 4.1 105%
2.4.7 FRCM Early Age Testing
The purpose of this test is to determine the early age development of bond strength (i.e., pull off resistance) and compressive strength of the FRCM system under ambient conditions. Pull off tests were performed as per AC434 Section 4.8 and reference standard ASTM C1583/C1583M-04 and cube compression tests are performed per AC434 Section 4.3 and reference standard ASTM C109/C109M.
A total of fifty (50) specimens were tested for bond strength and thirty five (35) specimens were tested for matrix compressive strength for several increments of time (hours and days) after FRCM Application. Table 2-14 describes the number of replicates and time increments for which the pull off tests and compression tests were performed. The FRCM system was applied to small concrete beams with dimensions of 4 in. x 4 in. x 14 in. (HxWxL – 10.16 cm x 10.16 cm x 35.56cm). Proper procedure was taken to ensure the concrete surface was saturated surface dry prior

22
to the FRCM application. Seven (7) small beams were pre-drilled prior to the FRCM application. This was done because previous attempts to drill holes in the FRCM system within 24 hours of application resulted in damaged inflicted to the system. Accordingly, the fabric was pre-cut into 2 inch diameter circles and applied to the pre-drilled holes. All stages prior to and during application can be seen in Figure 2-23.
Table 2-14 – Early Age Test Matrix
Time
Test Type
Bond TestCompression of Mortar Cubes
3 hours 5 - 7 hours 5 -
10 hours 5 - 1 day 5 5 2 days 5 5 3 days 5 5 7 days 5 5
14 days 5 5 21 days 5 5 28 days 5 5
a)
b) c)
Figure 2-23 – FRCM Application a) Pre-Drilled Beams b) Pre-Cut Fabric c) FRCM Application

23
The remaining concrete beams were strengthened with one ply of FRCM as per Section
2.2.2. Final installation for both application types is shown in Figure 2-24. All matrix mortar cubes were cast per ASTM C109. Tests were conducted after each respective time increment per ASTM C1583/C1583M 04 for bond tests where a circular cut was made on the cured FRCM system using a core drill, to a depth of 0.5 in. (12.7mm) into the substrate. Pre-drilled beams with FRCM were not drilled. A disk of steel was attached with quick set epoxy to the FRCM surface as a means to pull of the circular area. Uniaxial tensile load was applied perpendicular to the test surface using a pull-off test machine (James Bond Tester) shown previously in Figure 2-20.
The load was applied manually using the screw system of the test machine connected to a hydraulic piston. The test was performed under load control at a constant rate so that the tensile stress increased at a rate of 5 ± 2 psi/s (35 ± 15 kPa/s). The ultimate load was recorded using the integrated dial gauge of the test machine. All replicates were tested after each respective time increment.
Uniaxial tensile load was applied perpendicular to the test surface using a pull-off test machine (James Bond Tester) shown previously in Figure 2-20. The load was applied manually using the screw system of the test machine connected to a hydraulic piston. The test was performed under load control at a constant rate so that the tensile stress increased at a rate of 5 ± 2 psi/s (35 ± 15 kPa/s). The ultimate load was recorded using the integrated dial gauge of the test machine. All replicates were tested after each respective time increment.
Tests for compression of mortar were performed per ASTM C109 where a uniaxial compression load was applied to the cube specimens using a screw type universal test frame as seen in Figure 2-5. Load was applied to the cube faces that were in contact with the mold surfaces. The test was performed under displacement control at a rate of 0.025 in./min (0.635 mm/minute). The primary failure mode of the bond tests occurred within the FRCM composite system, at the interface between the FRCM mortar and fiber mesh, herein referred to as failure type “C” (Figure 2-21 & Figure 2-25).
a) b)
Figure 2-24 – FRCM Application to a) Regular Beams b) Pre-Drilled Beams
The ultimate bond or tensile strength was calculated based on the type of failure, following the guidelines provided by AC434 by dividing the recorded tensile load at failure by area, where the area depends on the failure mode (net area or matrix area) of the test specimen. Table 2-15 contains

24
the tabulated bond (tensile strength) results and Table 2-16 contains the tabulated matrix compression test results with average, standard deviation (Std. Dev.) and coefficient of variance (C.O.V) values. Figure 2-26 and Figure 2-27 show the early age strength development curves for bond strength and cube compressive strength, respectively. Based on the results, it is clear that most of the bond strength and matrix compressive strength has developed after 3 days and almost full strength at 7 days.
Figure 2-25 –Bond Strength Over Repair Mortar Primary Failure Mode
Table 2-15 – Early Age Bond Strength Test Results
Time Average Load St. Dev
C.O.V (%)
Average Stress St. Dev
C.O.V (%) Hours Days lbf N psi MPa
3 0.13 8 36 1 16 7 0.05 1 16
7 0.29 13 58 3 22 12 0.08 3 22
10 0.42 23 102 4 16 21 0.14 3 16
24 1 119 529 32 27 108 0.74 29 27
48 2 120 534 57 48 109 0.75 52 48
72 3 413 1,837 95 23 375 2.59 86 23
168 7 474 2,108 103 22 431 2.97 94 22
336 14 412 1,833 102 25 375 2.59 93 25
504 21 509 2,264 87 17 463 3.19 79 17
672 28 507 2,255 187 37 461 3.18 170 37
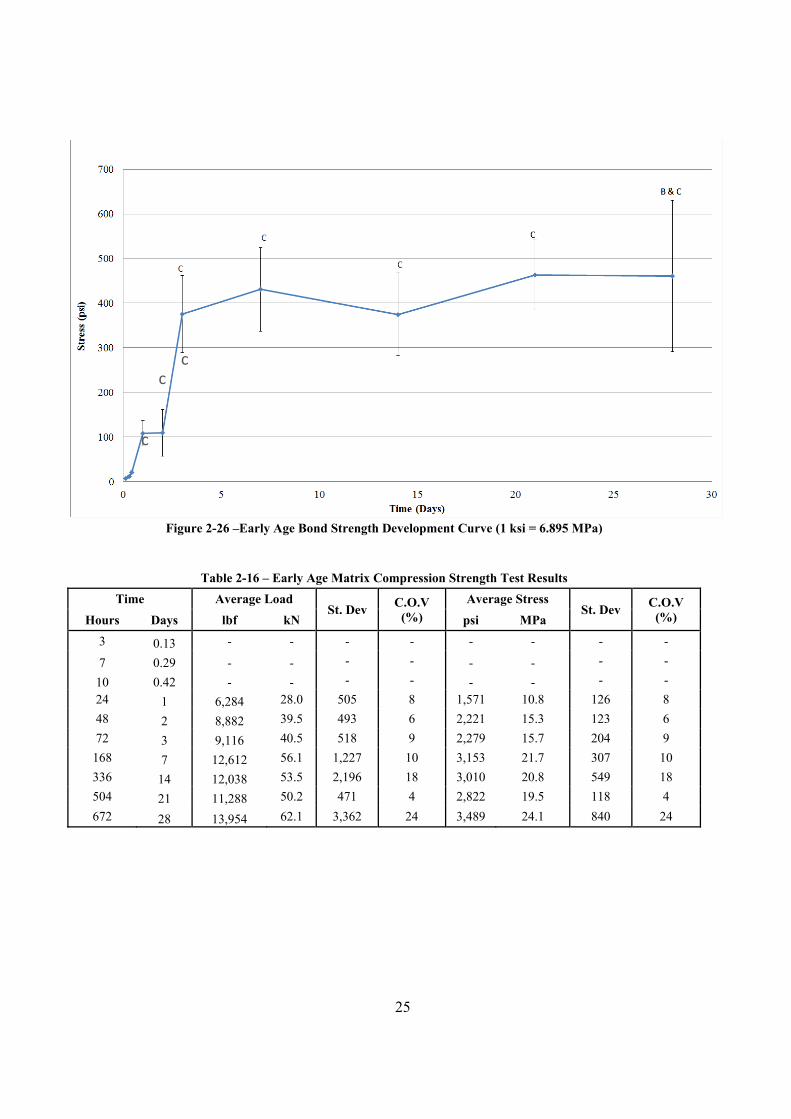
25
Figure 2-26 –Early Age Bond Strength Development Curve (1 ksi = 6.895 MPa)
Table 2-16 – Early Age Matrix Compression Strength Test Results
Time Average Load St. Dev
C.O.V (%)
Average Stress St. Dev
C.O.V (%) Hours Days lbf kN psi MPa
3 0.13 - - - - - - - -
7 0.29 - - - - - - - -
10 0.42 - - - - - - - -
24 1 6,284 28.0 505 8 1,571 10.8 126 8
48 2 8,882 39.5 493 6 2,221 15.3 123 6
72 3 9,116 40.5 518 9 2,279 15.7 204 9
168 7 12,612 56.1 1,227 10 3,153 21.7 307 10
336 14 12,038 53.5 2,196 18 3,010 20.8 549 18
504 21 11,288 50.2 471 4 2,822 19.5 118 4
672 28 13,954 62.1 3,362 24 3,489 24.1 840 24
c c
c

26
Figure 2-27 –Early Age Matrix Compression Strength Development Curve (1 ksi = 6.895 MPa)
2.5 Conclusion
The experimental data are obtained according to the provisions of AC434. AC434 Table 2 states the required percent retention for specimens undergoing durability conditioning is 85% for 1,000 hours and 80% for 3,000 hours. Based on this criteria, the FRCM materials are acceptable from a durability perspective. Also, FRCM test curves show bilinear behavior that is consistent with the hypothesized stress-strain behavior given in AC434 Annex A. Increasing from 1 ply to 2 plies FRCM results in a change in crack damage progression to failure as well as an increase in ultimate strength and ultimate strain with a decrease in ductility. Early age FRCM bond tests indicate that substantial strength is developed after 7 days of application.
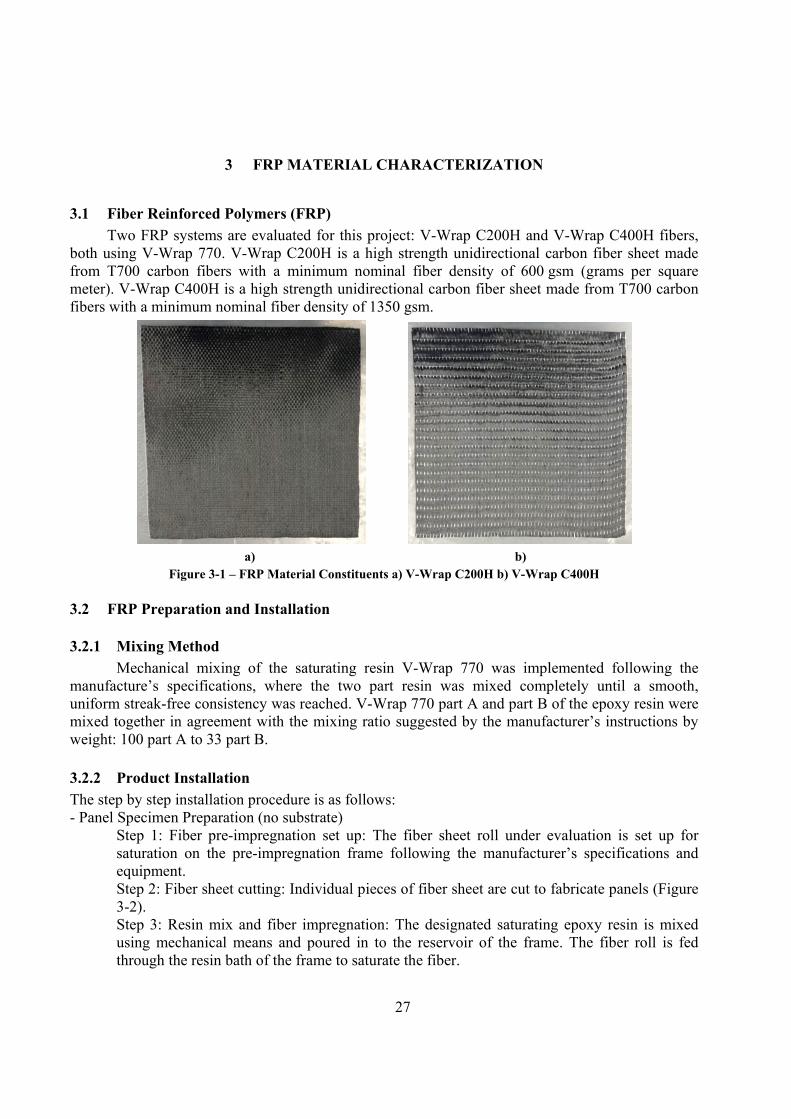
27
3 FRP MATERIAL CHARACTERIZATION
3.1 Fiber Reinforced Polymers (FRP)
Two FRP systems are evaluated for this project: V-Wrap C200H and V-Wrap C400H fibers, both using V-Wrap 770. V-Wrap C200H is a high strength unidirectional carbon fiber sheet made from T700 carbon fibers with a minimum nominal fiber density of 600 gsm (grams per square meter). V-Wrap C400H is a high strength unidirectional carbon fiber sheet made from T700 carbon fibers with a minimum nominal fiber density of 1350 gsm.
a) b)
Figure 3-1 – FRP Material Constituents a) V-Wrap C200H b) V-Wrap C400H
3.2 FRP Preparation and Installation
3.2.1 Mixing Method
Mechanical mixing of the saturating resin V-Wrap 770 was implemented following the manufacture’s specifications, where the two part resin was mixed completely until a smooth, uniform streak-free consistency was reached. V-Wrap 770 part A and part B of the epoxy resin were mixed together in agreement with the mixing ratio suggested by the manufacturer’s instructions by weight: 100 part A to 33 part B.
3.2.2 Product Installation
The step by step installation procedure is as follows: - Panel Specimen Preparation (no substrate)
Step 1: Fiber pre-impregnation set up: The fiber sheet roll under evaluation is set up for saturation on the pre-impregnation frame following the manufacturer’s specifications and equipment. Step 2: Fiber sheet cutting: Individual pieces of fiber sheet are cut to fabricate panels (Figure 3-2). Step 3: Resin mix and fiber impregnation: The designated saturating epoxy resin is mixed using mechanical means and poured in to the reservoir of the frame. The fiber roll is fed through the resin bath of the frame to saturate the fiber.

28
Figure 3-2 – Cutting Fiber Sheet
Step 4: Resin mix and fiber impregnation: The designated saturating epoxy resin is mixed using mechanical means and poured in to the reservoir of the frame. The fiber roll is fed through the resin bath of the frame to saturate the fiber (Figure 3-3). Step 5: CFRP Panel fabrication: Discrete pieces of the fiber sheet are placed on non-stick sheets on a flat surface. Another non-stick sheet is used to sandwich the CFRP panel ensuring a flat panel is produced. A plastic trowel is then used to remove excess resin (Figure 3-4). Panels were left to cure for a minimum of 24 hours before removing the non-stick sheets and 72 hours prior any testing.
- FRP Installation Procedure (Substrate) The procedure to install the FRP strengthening systems under evaluation for tests considering a concrete substrate, followed the same impregnation process as described before. Surface Preparation: Before the installation of the FRP strengthening system, the concrete substrate surface was prepared to ensure proper surface roughness. The concrete surface profile shown in Figure 3-5 was achieved.
Figure 3-3 – Fiber Impregnation
Step 1: The prepared concrete surface was primed using the V-Wrap 770 resin. Thickened epoxy was then applied on the substrate surface to fill in holes in the concrete and in order to properly attach the FRP strengthening system under evaluation. The thickened epoxy consisted of V-Wrap 770 resin mixed with fumed silica. Step 2: The impregnated fiber sheet was then installed on the prepared and primed substrate.

29
Step 3: The FRP was then rolled with a ribbed roller and allowed to cure for 72 hours prior any testing (Figure 3-6).
Figure 3-4 – FRP Panel Fabrication
Figure 3-5 – Concrete Specimens Before (Left) and After (Right) Sandblasting
Figure 3-6 – FRP Application to Concrete Specimens

30
3.3 Test Matrix Table 3-1 – FRP Material Characterization Test Matrix
Test Reinforcement Conditioning
Replicates Specification Grid Plies Environment Length
FRP Direct TensionA Continuous One Ambient n/a 5
AASHTO5 2.2.4.2 ASTM D3039
AC125,5.8 Table 2
Continuous Two Ambient n/a 5 AASHTO 2.2.4.2
ASTM D3039 FRP Interlaminar
Shear Continuous t = L/6* Ambient n/a 5
ASTM D2344 AC125,5.8 Table 2
FRP Tensile Bond Continuous One Ambient n/a 5 ASTM C1583 ASTM 7234
AASHTO 2.2.6.2
FRP Tensile Bond Continuous One Saltwater 1000 hrs 3000 hrs**
5 5
ASTM C1583 ASTM 7234
ASTM D1141 AASHTO 2.2.6.2
AC125,5.11 Table 3
FRP Tensile Bond Continuous One Water vapor 1000 hrs 3000 hrs**
5 5
ASTM C1583 ASTM 7234
ASTM D2247 AASHTO 2.2.6.2 AASHTO 2.2.4.4B
AC125,5.11 Table 3
FRP Tensile Bond Continuous One Alkaline 1000 hrs 3000 hrs**
5 5
ASTM C1583 ASTM 7234 ASTM C581
AASHTO 2.2.6.2 AASHTO 2.2.4.4C
AC125,5.11 Table 3
Tg Continuous One Ambient n/a 5 AASHTO 2.2.4.1
AC125,5.8 Table 2
* Number of plies equivalent to thickness, t = length of beam, L divided by 6 A Lap tensile strength not applicable to FRP wet lay up systems B Duration only for 1,000 & 3,000 hours exposed to 100 % relative humidity C Duration only for 1,000 & 3,000 hours
3.4 Test Data and Results
3.4.1 FRP Direct Tension
The purpose of this test is to determine the tensile properties in the fiber direction for the FRP systems as a benchmark (without any aging or environmental exposure). Average properties include experimental tensile chord modulus of elasticity, ultimate tensile stress and ultimate tensile strain (elongation). Tensile coupons were tested according to AC125 Section 5.8 Table 2 for Physical and Mechanical Properties of FRP Composite Materials (AC125 2013) and reference standard ASTM D3039/D3039M – 08, Standard test method for Tensile Properties of Polymer Matrix Composite Materials. In total twenty (20) coupons were prepared: five continuous one ply C200H samples, five continuous one ply C400H samples, five continuous two ply C200H samples, and five continuous two ply C400H samples. Nominal specimen dimensions are summarized in Table 3-2, including length (l), width (w) and thickness (t).

31
Table 3-2 – Tensile Specimen Nominal Dimensions
Specimen l w t
ID in mm in mm in mm
1 PLY_C200H 10 254 1 25.4 0.04 1.01
1 PLY_C400H 10 254 1 25.4 0.08 2.02 2 PLY_C200H 10 254 1 25.4 0.08 2.02 2 PLY_C400H 10 254 1 25.4 0.16 4.04
Specimens were obtained from 12 in. (305 mm) square FRP panels. The specimens were cut to the prescribed dimensions using a high precision diamond blade saw from different randomly selected panels, as prepared and referenced in Section 3.2. Tabs were installed as indicated in ASTM D3039 after sanding the ends of the coupon specimens. All specimens were conditioned under laboratory ambient conditions at room temperature 73 ± 3°F (23 ± 1°C) and 60 ± 5% relative humidity, for at least 24 hours prior testing. Uniaxial tensile load was applied to all specimens. Testing for the specimens was performed using a hydraulic type universal test frame with a maximum capacity of 55 kip (240 kN). Tensile load was measured with the internal load cell of each frame in compliance with ASTM E4-10 (Standard Practice for Force Verification of Testing Machines), while the extension (elongation) of the specimen was measured using a Class B-2 clip on extensometer with a 2.0 in (50 mm) gauge length, placed at mid-length of the coupon specimen. The extensometer was removed half way during the test to avoid damage of the instrument. Specimens were gripped with hydraulic wedge type grips at a pressure of 3000 psi (20.7 MPa) and 5000 psi (34.5 MPa) for FRP specimens with V-Wrap C200H and V-Wrap C400H, respectively. The test set up is shown in Figure 3-7. All data was gathered using a National Instruments data acquisition system at a data sampling rate of 100 Hz.
Figure 3-7 - Tensile Test Set-up
Load was applied in displacement control to effect a near constant strain rate in the gauge section until failure at a constant frame head displacement of 0.05 in./min (1.3 mm/min). The load rate produced failure within 1 to 10 minutes, as per ASTM D3039 requirements. All specimens behaved linear elastically until failure. The primary mode of failure was by tensile rupture of the test coupons equivalent to code XGM (eXplosive, Gage, Middle) and SGM (Splitting, Gage, Middle) of

32
ASTM D3039, signifying a sudden explosive, gauge middle failure and long splitting gauge middle failure respectively. Individual specimen failure modes are reported in Table 3-4, Table 3-5, Table 3-6, and Table 3-7. The results reported herein have been computed as per ASTM D3039 and the description of the calculations is summarized in Table 3-3. Note that the results have been calculated using the computed area based on average of three specimen width measurements and nominal thickness measurements.
Table 3-3 - Definitions of Calculations
Symbol Parameter Description
Pmax Maximum force at failure Peak load recorded during test.
A Average cross-section area Cross-section area as reported in Table 3-4, Table 3-5, Table 3-6, and Table 3-7, based on nominal thickness.
Ftu Ultimate tensile strength
Ftu=Pmax/A
εu Computed ultimate strain, based on extensometer measurement
Strain based on the intersection of the computed chord modulus and ultimate tensile strength, equating to the ratio between the ultimate tensile strength and the tensile chord modulus
Echord Tensile chord modulus of elasticity, based on strain gauge measurement
Difference in applied tensile stress between the
1000 and 3000 µε points (Δσ); divided by the difference between the two strain points, nominally 0.002 (Δε) as measured
Echord=Δσ/Δε
Table 3-4, Table 3-5, Table 3-6 and Table 3-7 contain the tabulated summary results for all tested specimens. The tables include: average measured cross-sectional area of each specimen (A); maximum tensile force (Pmax); ultimate tensile strength (Ftu); chord modulus of elasticity (Echord), computed ultimate tensile strain (εu), and failure mode as per ASTM D3039. Average, standard deviation and coefficient of variance (C.O.V.) values are also reported, based on the complete set of specimens under evaluation for each product.
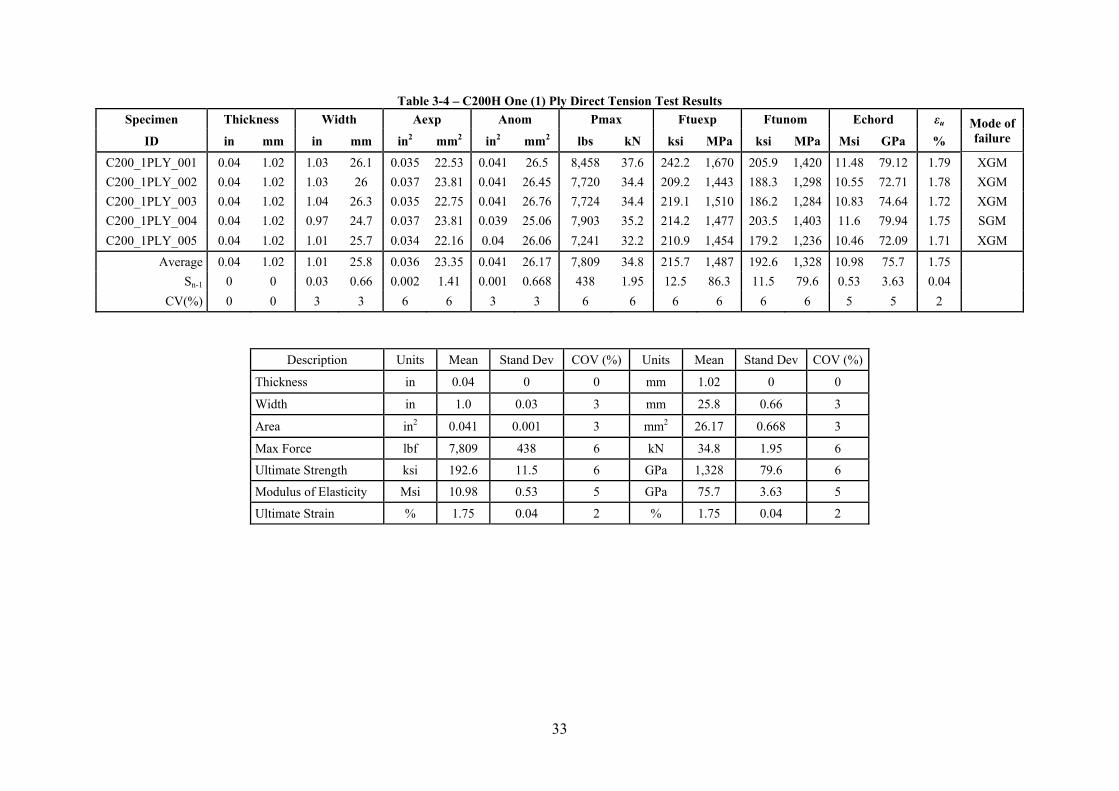
33
Table 3-4 – C200H One (1) Ply Direct Tension Test Results
Specimen Thickness Width Aexp Anom Pmax Ftuexp Ftunom Echord εu Mode of failure ID in mm in mm in2 mm2 in2 mm2 lbs kN ksi MPa ksi MPa Msi GPa %
C200_1PLY_001 0.04 1.02 1.03 26.1 0.035 22.53 0.041 26.5 8,458 37.6 242.2 1,670 205.9 1,420 11.48 79.12 1.79 XGM
C200_1PLY_002 0.04 1.02 1.03 26 0.037 23.81 0.041 26.45 7,720 34.4 209.2 1,443 188.3 1,298 10.55 72.71 1.78 XGM
C200_1PLY_003 0.04 1.02 1.04 26.3 0.035 22.75 0.041 26.76 7,724 34.4 219.1 1,510 186.2 1,284 10.83 74.64 1.72 XGM
C200_1PLY_004 0.04 1.02 0.97 24.7 0.037 23.81 0.039 25.06 7,903 35.2 214.2 1,477 203.5 1,403 11.6 79.94 1.75 SGM
C200_1PLY_005 0.04 1.02 1.01 25.7 0.034 22.16 0.04 26.06 7,241 32.2 210.9 1,454 179.2 1,236 10.46 72.09 1.71 XGM
Average 0.04 1.02 1.01 25.8 0.036 23.35 0.041 26.17 7,809 34.8 215.7 1,487 192.6 1,328 10.98 75.7 1.75
Sn-1 0 0 0.03 0.66 0.002 1.41 0.001 0.668 438 1.95 12.5 86.3 11.5 79.6 0.53 3.63 0.04
CV(%) 0 0 3 3 6 6 3 3 6 6 6 6 6 6 5 5 2
Description Units Mean Stand Dev COV (%) Units Mean Stand Dev COV (%)
Thickness in 0.04 0 0 mm 1.02 0 0
Width in 1.0 0.03 3 mm 25.8 0.66 3
Area in2 0.041 0.001 3 mm2 26.17 0.668 3
Max Force lbf 7,809 438 6 kN 34.8 1.95 6
Ultimate Strength ksi 192.6 11.5 6 GPa 1,328 79.6 6
Modulus of Elasticity Msi 10.98 0.53 5 GPa 75.7 3.63 5
Ultimate Strain % 1.75 0.04 2 % 1.75 0.04 2

34
Table 3-5 – C400H One (1) Ply Direct Tension Test Results
Specimen Thickness Width Aexp Anom Pmax Ftuexp Ftunom Echord εu Mode of failure ID in mm in mm in2 mm2 in2 mm2 lbs kN ksi MPa ksi MPa Msi GPa %
C400_1PLY_001 0.08 2.03 0.97 24.7 0.069 44.62 0.078 50.27 14,446 64.3 208.9 1,440 185.4 1,278 11.13 76.71 1.67 XGM
C400_1PLY_002 0.08 2.03 0.95 24.2 0.076 49.19 0.076 49.19 14,950 66.5 196.1 1,352 196.1 1,352 10.99 75.74 1.78 XGM
C400_1PLY_003 0.08 2.03 0.95 24.2 0.071 45.55 0.076 49.24 13,606 60.6 192.7 1,329 178.3 1,229 11.01 75.88 1.62 SGM
C400_1PLY_004 0.08 2.03 0.92 23.4 0.076 48.72 0.074 47.54 13,814 61.5 182.9 1,261 187.5 1,293 10.66 73.47 1.76 XGM
C400_1PLY_005 0.08 2.03 0.94 24 0.071 45.68 0.076 48.72 14,410 64.1 203.5 1,403 190.8 1,316 11.43 78.77 1.67 SGT
Average 0.08 2.03 0.95 24.1 0.074 47.47 0.076 48.99 14,245 63.4 191 1,317 187.6 1,294 11.04 76.11 1.7
Sn-1 0 0 0.02 0.49 0.004 2.26 0.002 0.99 538 2.4 11.2 77.7 6.6 45.5 0.28 1.91 0.07
CV(%) 0 0 2 2 5 5 2 2 4 4 6 6 4 4 3 3 4
Description Units Mean Stand Dev COV (%) Units Mean Stand Dev COV (%)
Thickness in 0.08 0 0 mm 2.03 0 0
Width in 0.95 0.02 2 mm 24.1 0.49 2
Area in2 0.076 0.002 2 mm2 48.99 0.99 2
Max Force lbf 14,245 538 4 kN 63.4 2.4 4
Ultimate Strength ksi 187.6 6.6 4 GPa 1,294 45.5 4
Modulus of Elasticity Msi 11.04 0.28 3 GPa 76.11 1.91 3
Ultimate Strain % 1.7 0.07 4 % 1.7 0.07 4

35
Table 3-6 – C200H Two (2) Ply Direct Tension Test Results
Specimen Thickness Width Aexp Anom Pmax Ftuexp Ftunom Echord εu Mode of failure ID in mm in mm in2 mm2 in2 mm2 lbs kN ksi MPa ksi MPa Msi GPa %
C200_2PLY_001 0.08 2.03 1.04 26.4 0.085 54.84 0.083 53.57 16,324 72.6 193 1,331 196.6 1,355 15.56 107.24 1.26 SGM
C200_2PLY_002 0.08 2.03 1.01 25.6 0.08 51.61 0.081 52.08 15,665 69.7 211.3 1,457 194.1 1,338 13.16 90.7 1.47 SGM
C200_2PLY_003 0.08 2.03 1.02 25.9 0.08 51.61 0.081 52.54 16,084 71.6 203 1,400 197.5 1,362 12.9 88.9 1.53 SGM
C200_2PLY_004 0.08 2.03 1.06 26.8 0.08 51.61 0.085 54.56 15,924 70.9 189.1 1,304 188.3 1,298 12.98 89.46 1.45 SGM
C200_2PLY_005 0.08 2.03 0.97 24.6 0.08 51.61 0.077 49.96 15,526 69.1 207.3 1,430 200.5 1,382 14.81 102.07 1.35 SGM
Average 0.08 2.03 1.02 25.9 0.036 23.35 0.081 52.54 15,905 70.8 215.7 1,487 195.4 1,347 13.88 95.67 1.41
Sn-1 0 0 0.03 0.85 0.002 1.41 0.003 1.73 320 1.4 12.5 86.3 4.6 31.5 1.22 8.42 0.11
CV(%) 0 0 3 3 6 6 3 3 2 2 6 6 2 2 9 9 8
Description Units Mean Stand Dev COV (%) Units Mean Stand Dev COV (%)
Thickness in 0.08 0 0 mm 2.03 0 0
Width in 1.02 0.03 3 mm 25.9 0.85 3
Area in2 0.081 0.003 3 mm2 52.54 1.73 3
Max Force lbf 15,905 320 2 kN 70.8 1.4 2
Ultimate Strength ksi 195.4 4.6 2 GPa 1,347 31.5 2
Modulus of Elasticity Msi 13.88 1.22 9 GPa 95.67 8.42 9
Ultimate Strain % 1.41 0.11 8 % 1.41 0.11 8

36
Table 3-7 – C400H Two (2) Ply Direct Tension Test Results
Specimen Thickness Width Aexp Anom Pmax Ftuexp Ftunom Echord εu Mode of failure ID in mm in mm in2 mm2 in2 mm2 lbs kN ksi MPa ksi MPa Msi GPa %
C400_2PLY_001 0.16 4.06 1.04 26.5 0.146 94.19 0.167 107.7 23,405 104.2 160.3 1,106 140.3 967 11.98 82.56 1.17 SGM
C400_2PLY_002 0.16 4.06 1.04 26.5 0.154 99.36 0.167 107.7 22,609 100.6 147 1,014 135.5 934 12.04 82.98 1.13 SGM
C400_2PLY_003 0.16 4.06 1.05 26.6 0.137 88.39 0.168 108.3 22,298 99.2 162.5 1,121 132.9 916 12.94 89.18 1.03 SGM
C400_2PLY_004 0.16 4.06 1.04 26.5 0.146 94.19 0.167 107.6 21,942 97.6 150.7 1,039 131.6 907 12.82 88.35 1.03 SGM
C400_2PLY_005 0.16 4.06 1.03 26.1 0.156 100.65 0.164 106.1 22,685 101 145.9 1,006 137.9 951 10.82 74.57 1.27 SGM
Average 0.16 4.06 1.04 26.4 0.036 23.35 0.167 107.5 22,588 100.5 215.7 1,487 135.6 935 12.12 83.53 1.12
Sn-1 0 0 0.01 0.2 0.002 1.41 0.001 0.8 543 2.4 12.5 86.3 3.6 24.5 0.85 5.85 0.1
CV(%) 0 0 1 1 6 6 1 1 2 2 6 6 3 3 7 7 9
Description Units Mean Stand Dev COV (%) Units Mean Stand Dev COV (%)
Thickness in 0.16 0 0 mm 4.06 0 0
Width in 1.04 0.01 1 mm 26.4 0.20 1
Area in2 0.167 0.001 1 mm2 107.5 0.8 1
Max Force lbf 22,588 543 2 kN 100.5 2.4 2
Ultimate Strength ksi 135.6 3.6 3 GPa 935 24.5 3
Modulus of Elasticity Msi 12.12 0.85 7 GPa 83.53 5.85 7
Ultimate Strain % 1.12 0.1 9 % 1.12 0.1 9

37
3.4.2 FRP Interlaminar Shear
The interest of this test is to evaluate the interlaminar short beam strength of the FRP composite systems under evaluation under control ambient conditions. Tests were performed as per AC125 Section Section 5.8, and reference standard ASTM D2344/D2344M-00 (2006) Standard Test Method for Short-Beam Strength of Polymer Matrix Composite Materials and Their Laminates.
Ten (10) specimens with .6 in. x .3 in. (W x T – 15.24 mm x 7.62 mm) nominal dimensions, where the length of each specimen were 6 times the thickness, were prepared per ASTM D2344. Five replicates were prepared for C200H (7 plies) and five replicates were prepared for C400H (5 plies). The specimens were cut to the prescribed dimensions using a high precision diamond blade saw from different panels randomly selected and prepared as referenced in Section 3.2.2. All specimens were conditioned under laboratory ambient conditions at room temperature 73 ± 3°F (23 ± 1°C) and 60 ± 5% relative humidity, for at least 24 hrs prior testing.
The specimen was loaded in three-point bending. Testing was performed using a screw driven Instron Universal Test Frame with a maximum capacity of 30 kip (130 kN). The load was measured with the internal load cell of the frame in compliance with ASTM E4-10 (Standard Practice for Force Verification of Testing Machines). The test set-up is shown is Figure 3-8. Load and crosshead displacement were recorded throughout the test using Instron’s Bluehill software and data acquisition system. Load was applied in displacement control at a constant frame head displacement of 0.05 in./min (1.0 mm/min) as per ASTM D2344 requirements.
Figure 3-8 – Interlaminar Shear Test Set-up
Based on the experimental tests presented herein the average short-beam strength (Fsbs) of the materials under evaluation without any aging or exposure conditioning was found to be 6.42 ksi (44.3 MPa) for C200H and 5.49 ksi (37.9 MPa) for C400H as summarized in Table 3-10. The primary mode of failure was by interlaminar shear of the test coupons equivalent to FIG. 7.1 of ASTM D2344.

38
The short beam strength is calculated as follows:
bh
PF msbs 75.0
Where: Fsbs is the short beam strength, psi; Pm is the maximum load obtained during the test, lbf; b is the measured specimen width, in; h is the measured specimen thickness, in.
Table 3-8 and Table 3-9 contain the tabulated summary, including: average measured width (b) and thickness (h) of each specimen; maximum tensile force (Pmax); ultimate strength (Fsbs) as per ASTM D2344. Average, standard deviation and coefficient of variance (C.O.V.) values are also reported.
Table 3-8 – C200H Interlaminar Shear Test Results
Specimen Width Thickness Pmax Fsbs Mode of failure
ID in mm in mm lbs kN ksi MPa
C200_IS_001 15.77 0.62 6.83 0.27 6.23 1401 43.38 6.29 Interlaminar Shear
C200_IS_002 15.85 0.62 8.41 0.33 8.41 1890 47.39 6.87 Interlaminar Shear
C200_IS_003 15.16 0.60 6.25 0.25 5.55 1247 44.00 6.38 Interlaminar Shear
C200_IS_004 15.60 0.61 7.06 0.28 6.80 1529 46.36 6.72 Interlaminar Shear
C200_IS_005 15.39 0.61 7.01 0.28 5.81 1306 40.29 5.84 Interlaminar Shear
Average 15.55 0.61 7.11 0.28 6.56 1475 44.29 6.42
Sn-1 0.28 0.01 0.79 0.03 1.14 256 2.78 0.4
CV( (%) 2 2 11 11 17 17 6 6
Summarized Results
Description Units Mean Stand Dev
COV (%) Units Mean Stand Dev
COV (%)
Width in 15.55 0 2 mm 0.61 0.01 2
Thickness in 7.11 0.79 11 mm 0.28 0.03 11
Max Force lbf 6.56 1.14 17 kN 1475 256 17
Fsbs ksi 44.29 2.78 6 MPa 6.42 0.4 6

39
Table 3-9 – C400H Interlaminar Shear Test Results
Specimen ID Width Thickness Pmax Fsbs
Mode of failure in mm in mm lbs kN ksi MPa
C200_IS_001 0.76 19.18 0.34 8.51 1886 8.39 5.59 38.55 Interlaminar Shear
C200_IS_002 0.75 19.02 0.36 9.12 1918 8.54 5.35 36.89 Interlaminar Shear
C200_IS_003 0.77 19.61 0.34 8.71 1950 8.68 5.53 38.13 Interlaminar Shear
C200_IS_004 0.76 19.35 0.34 8.69 1887 8.4 5.43 37.42 Interlaminar Shear
C200_IS_005 0.78 19.69 0.34 8.51 1924 8.56 5.56 38.32 Interlaminar Shear
Average 0.76 19.37 0.34 8.71 1913 8.51 5.49 37.86
Sn-1 0.01 0.28 0.01 0.25 27 0.12 0.1 0.69
CV( (%) 1 1 3 3 1 1 2 2
Summarized Results
Description Units Mean Stand Dev
COV (%) Units Mean Stand Dev
COV (%)
Width in 0.76 0.01 1 mm 19.37 0.28 1
Thickness in 0.34 0.01 3 mm 8.71 0.25 3
Max Force lbf 1913 27 1 kN 8.51 0.12 1
Fsbs ksi 5.49 0.1 2 MPa 37.86 0.69 2
Table 3-10 – Average Interlaminar Shear Strength Results
Specimen ID Fsbs
ksi MPa
C200H 6.42 44.3
C400H 5.49 37.9
3.4.3 FRP Tensile Bond/Durability of FRP Tensile Bond
The purpose of this test is to determine the tensile bond strength between the substrate and the FRP system based on the application under control ambient conditions and after prescribed environmental exposure conditions. Tests are performed as per AC125 Section 5.17 for bond strength and reference standard ASTM D7234.
Seventy (70) pull-out test samples were prepared to investigate the effect of six environmental conditioning cycles on the bond strength of the FRP system and concrete surface interface. Ten (10) of these pull-out tests samples were kept in ambient conditions and serve as the control specimens, five samples for C200H and five samples for C400H. Control specimens were conditioned under laboratory ambient conditions at room temperature 73 ± 3°F (23 ± 1°C) and 60 ± 5% relative humidity, for at least 24 hours prior testing.
Nominal concrete slabs sizes of 18.0 in. x 12.0 in. x 4.0 in. (450 x 300 x 100 mm) were used as substrate materials to the FRP composite systems conditioning exposure. Nominal concrete slabs sizes of 12.0 in. x 6.0 in. x 3.0 in. (305 x 150 x 75 mm) were used as substrate materials to the FRP ambient conditions specimens. All concrete slabs were strengthened with a

40
single layer of C200H and C400H composite system as described in Section 3.2.2 of this report. After the curing process, the specimens were placed in the respective conditioning environments. The specimens were subject to 6 different conditioning cycles:
- Aging in water vapor: All specimens were conditioned to be aged in an environmental test chamber under a water resistance environment at a temperature of 100 ± 4°F (38 ± 2°C) and 100% relative humidity, for two different duration periods of 1000, and 3000 hours, per reference standard ASTM D2247, prior to testing. The objective is to determine the average experimental percentage retention of tensile bond strength after ageing exposure to water resistant environment. - Aging in saltwater: All specimens were conditioned to be aged in a submerged salt water tank chamber at a temperature of 73 ± 2°F (23 ± 2°C), for two different duration periods of 1000, and 3000 hours prior to testing. Salt water was prepared using inorganic salts in proportions and concentrations representative of ocean water, as per ASTM D1141. The objective is to determine the average experimental percentage retention of tensile bond strength after ageing exposure to salt water environment. - Aging in alkaline environment: Specimens are submerged in an alkali solution to create an environment with a pH > 12.5, 100% RH and 99.86°F (37.7°C) for two different duration periods of 1,000 and 3,000 hours prior to testing. The solution is a mixture of calcium hydroxide (Ca(OH)2), sodium hydroxide (NaOH), and potassium hydroxide (KOH) per reference standard ASTM C581. The objective is to determine the average experimental percentage retention of tensile bond strength after ageing exposure to an alkaline water environment.
After the conditioning cycles, a circular cut was made perpendicular to the surface using a diamond coring drill to score the surface of the FRP layer as indicated in ASTM D7234. The test specimen was left intact, attached to the substrate. Any standing water was removed; the surface was cleaned from any debris from the drilling operation and was allowed to dry. A steel disk was then attached to the top FRP surface using adhesive epoxy. The disk was centered with the test specimen Figure 3-10.
Figure 3-9 - Tensile Bond Specimen Layout (ASTM D7234)
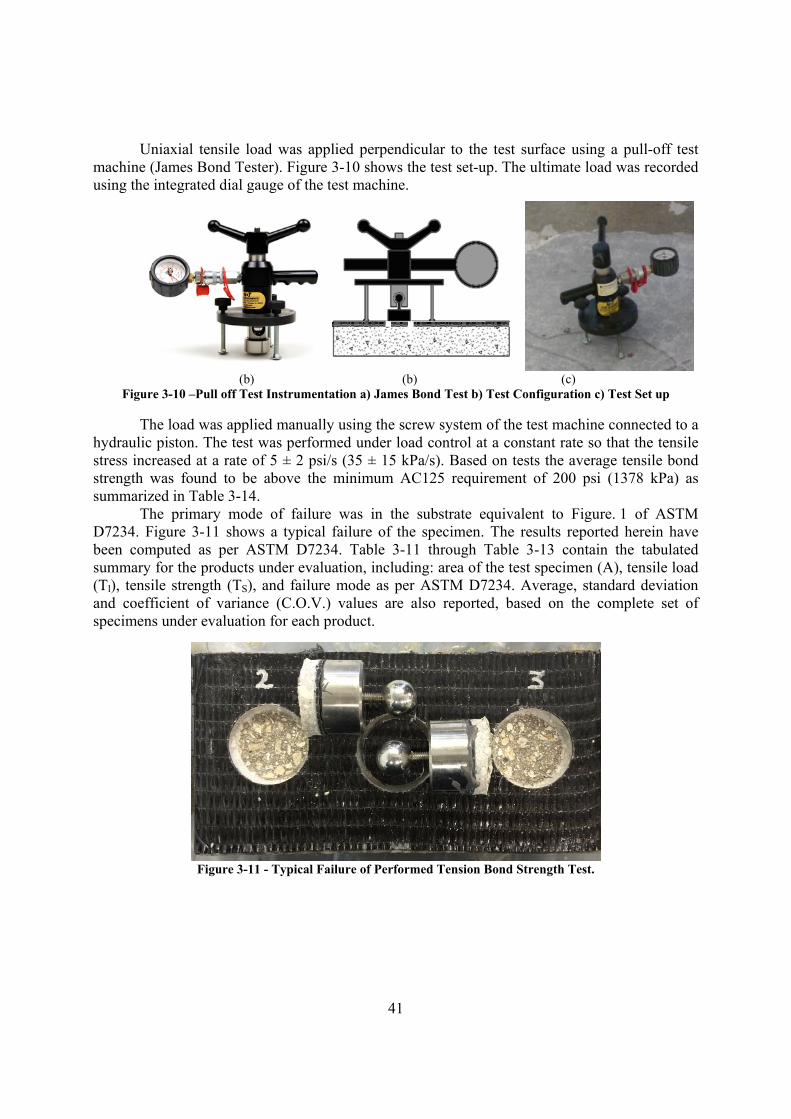
41
Uniaxial tensile load was applied perpendicular to the test surface using a pull-off test machine (James Bond Tester). Figure 3-10 shows the test set-up. The ultimate load was recorded using the integrated dial gauge of the test machine.
(b) (b) (c)
Figure 3-10 –Pull off Test Instrumentation a) James Bond Test b) Test Configuration c) Test Set up
The load was applied manually using the screw system of the test machine connected to a hydraulic piston. The test was performed under load control at a constant rate so that the tensile stress increased at a rate of 5 ± 2 psi/s (35 ± 15 kPa/s). Based on tests the average tensile bond strength was found to be above the minimum AC125 requirement of 200 psi (1378 kPa) as summarized in Table 3-14.
The primary mode of failure was in the substrate equivalent to Figure. 1 of ASTM D7234. Figure 3-11 shows a typical failure of the specimen. The results reported herein have been computed as per ASTM D7234. Table 3-11 through Table 3-13 contain the tabulated summary for the products under evaluation, including: area of the test specimen (A), tensile load (Tl), tensile strength (TS), and failure mode as per ASTM D7234. Average, standard deviation and coefficient of variance (C.O.V.) values are also reported, based on the complete set of specimens under evaluation for each product.
Figure 3-11 - Typical Failure of Performed Tension Bond Strength Test.

42
Table 3-11 - Tabulated Results for C200H and C400H Control Tensile Bond Tests
Specimen ID Time Area Tl TS*
Failure Mode sec in2 mm2 lbf N psi MPa
C200_Control_001 105 3.14 2,026 2,000 8,900 637 4.39 A
C200_Control_002 99 3.14 2,026 1,900 8,455 605 4.17 A
C200_Control_003 87 3.14 2,026 1,900 8,455 605 4.17 A
C200_Control_004 115 3.14 2,026 2,000 8,900 637 4.39 A
C200_Control_005 103 3.14 2,026 1,800 8,010 573 3.95 A
Average 102 3.14 2,026 1,920 8,544 611 4.22 Sn-1 10 84 372 27 0.18
CV( (%) 10 4 4 4 4
C400_Control_001 95 3.14 2,026 1,800 8,010 573 3.95 A
C400_Control_002 94 3.14 2,026 2,100 9,345 669 4.61 A
C400_Control_003 97 3.14 2,026 1,700 7,565 541 3.73 A
C400_Control_004 110 3.14 2,026 2,000 8,900 637 4.39 A
C400_Control_005 77 3.14 2,026 1,900 8,455 605 4.17 A
Average 95 3.14 2,026 1,900 8,455 605 4.17
Sn-1 12 158 704 50 0.35
CV( (%) 12 8 8 8 8
*Condition of acceptance is equivalent to τs > 200psi
Table 3-12 – C200H Durability Bond Strength Test Results
Exposure Type
Average Ultimate Stress
psi MPa
Control 611 4.22
ALK 1000 501 3.45
ALK 3000 753 5.19
100 1000 499 3.44
100 3000 535 3.69
Sea 1000 445 3.07
Sea 3000 726 5.01
Table 3-13 – C400H Durability Bond Strength Test Results
Exposure Type
Average Ultimate Stress
psi MPa
Control 605 4.17
ALK 1000 560 3.86
ALK 3000 718 4.95
100 1000 570 3.93
100 3000 628 4.33
Sea 1000 534 3.68
Sea 3000 762 5.26

43
Table 3-14 – Average Tensile Bond Strength for Control Specimens
ID Average Tensile
Strength
psi MPa
C200_Control 611 4.22
C400_Control 605 4.17
3.4.4 Glass Transition Temperature (Tg) Test
The interest of this test is to determine the glass transition temperature (Tg) of the saturating resin under evaluation based on dynamic mechanical analysis. The glass transition temperature is the temperature at which the polymer becomes soft and is no longer a hard material. Tests are performed as per AC125 Section 5.8 for Physical and Mechanical Properties of FRP Composite Materials, and Table 2 and reference standard ASTM E1640 – 13.
Nominal specimen dimensions of 0.8 in. (20 mm) span length, 0.2 in. (5 mm) width, and .04 in. (1 mm) thickness, were prepared as per ASTM E1640. Panels of resin were batched on silicon based molds at the desired thickness. The specimens were then cut to the prescribed dimensions using a high precision saw band. All specimens were conditioned under laboratory ambient conditions at room temperature 73 ± 3°F (23 ± 1°C) and 60 ± 5% relative humidity, for at least 24 hrs. prior testing.
A Dynamic Mechanical Analyzer (DMA) was used with a flexural set up to apply a forced oscillation with constant amplitude at a fixed frequency. The change of the loss modulus with the increasing temperature is obtained by the analysis of the flexural mechanical response and plotted in a graph to determine the Tg. The test set-up is shown is Figure 3-12. A heating rate of 1°C/min (1°F/min) and a frequency of 1 Hz was applied.
Figure 3-12 – Tg Test Set-up
Based on the experimental tests presented herein the average Tg of the materials under evaluation without any aging or exposure conditioning is 186.8°F (86°C) and meets the conditions of acceptance of AC125 being higher than 140°F (60°C). The Tg is determined by the extrapolated onset to the sigmoidal change in the loss modulus observed in going from the hard,

44
brittle region to the soft, rubbery region of the material under evaluation. Figure 3-13 show typical results for the determination of Tg. Table 3-15 contains the tabulated summary results for the products under evaluation, including: glass transition temperature (Tg). Average, standard deviation and coefficient of variance (C.O.V.) values are also reported.
Figure 3-13 – Typical Results for Tg V-Wrap770 test
Table 3-15 - Tabulated Results for Glass Transition Temperature (ASTM E1640)
Specimen ID Tg
°F °C STe_770_TG_CC_00_001 194.0 90 STe_770_TG_CC_00_002 185.0 85 STe_770_TG_CC_00_003 190.4 88 STe_770_TG_CC_00_004 185.0 85 STe_770_TG_CC_00_005 190.4 88 STe_770_TG_CC_00_006 186.8 86 STe_770_TG_CC_00_007 186.8 86 STe_770_TG_CC_00_008 185.0 85 STe_770_TG_CC_00_009 185.0 85 STe_770_TG_CC_00_010 186.8 86 STe_770_TG_CC_00_011 183.2 84 STe_770_TG_CC_00_012 186.8 86 STe_770_TG_CC_00_013 192.2 89 STe_770_TG_CC_00_014 185.0 85 STe_770_TG_CC_00_015 185.0 85 STe_770_TG_CC_00_016 186.8 86 STe_770_TG_CC_00_017 188.6 87 STe_770_TG_CC_00_018 183.2 84 STe_770_TG_CC_00_019 186.8 86 STe_770_TG_CC_00_020 183.2 84
Average 186.8 86 St. Dev. 3 1.7
C.O.V. (%) 1.6 1.9
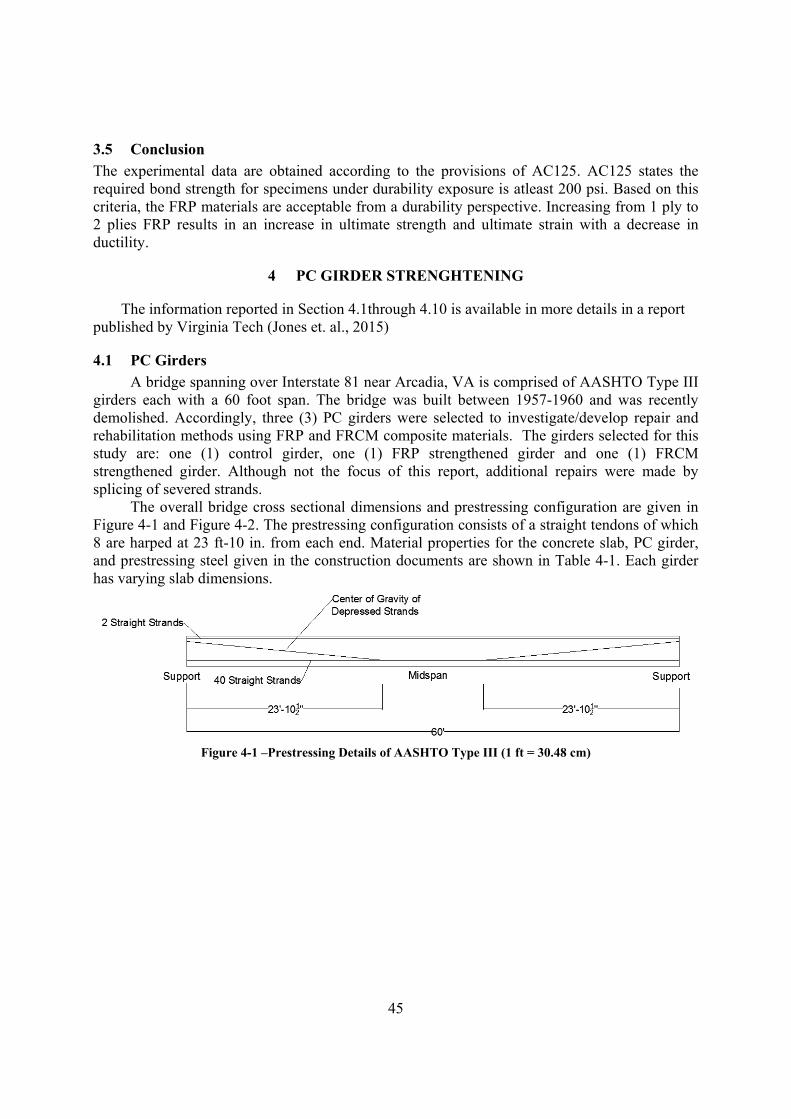
45
3.5 Conclusion
The experimental data are obtained according to the provisions of AC125. AC125 states the required bond strength for specimens under durability exposure is atleast 200 psi. Based on this criteria, the FRP materials are acceptable from a durability perspective. Increasing from 1 ply to 2 plies FRP results in an increase in ultimate strength and ultimate strain with a decrease in ductility.
4 PC GIRDER STRENGHTENING
The information reported in Section 4.1through 4.10 is available in more details in a report published by Virginia Tech (Jones et. al., 2015)
4.1 PC Girders
A bridge spanning over Interstate 81 near Arcadia, VA is comprised of AASHTO Type III girders each with a 60 foot span. The bridge was built between 1957-1960 and was recently demolished. Accordingly, three (3) PC girders were selected to investigate/develop repair and rehabilitation methods using FRP and FRCM composite materials. The girders selected for this study are: one (1) control girder, one (1) FRP strengthened girder and one (1) FRCM strengthened girder. Although not the focus of this report, additional repairs were made by splicing of severed strands.
The overall bridge cross sectional dimensions and prestressing configuration are given in Figure 4-1 and Figure 4-2. The prestressing configuration consists of a straight tendons of which 8 are harped at 23 ft-10 in. from each end. Material properties for the concrete slab, PC girder, and prestressing steel given in the construction documents are shown in Table 4-1. Each girder has varying slab dimensions.
Figure 4-1 –Prestressing Details of AASHTO Type III (1 ft = 30.48 cm)

46
Figure 4-2 – Girder Dimensions and Prestressing Details of AASHTO Type III (1 in. = 2.54 cm)
Table 4-1: AASHTO Type III Girder Material Properties (From Construction Documents)
Girder Material Properties
Slab Symbol
Compressive Stress f`c 4 ksi 27.58 MPa
Girder
Compressive Stress f`c 5 ksi 34.47 MPa
Prestressing Steel
Ultimate Stress fpu 250 ksi 1.72 GPa
Yield Stress fpy 206.5 ksi 1.42 GPa
Modulus of Elasticity
Es 27,000 ksi 186.16 GPa
Initial Prestressing Pi 14 kips 62.28 kN
Concrete deck and slab samples as well as prestressing strand samples were taken and tested to determine actual material properties. All samples and tests were taken and performed by Virginia Tech personnel. Results are shown in Table 4-2 and Table 4-3. The average compressive strength of the girder and deck are very close to the design compressive strength values of 6,500 and 6,000 psi, respectively. The average yield and ultimate stresses were larger than the design values, which allows for conservative design assumptions.
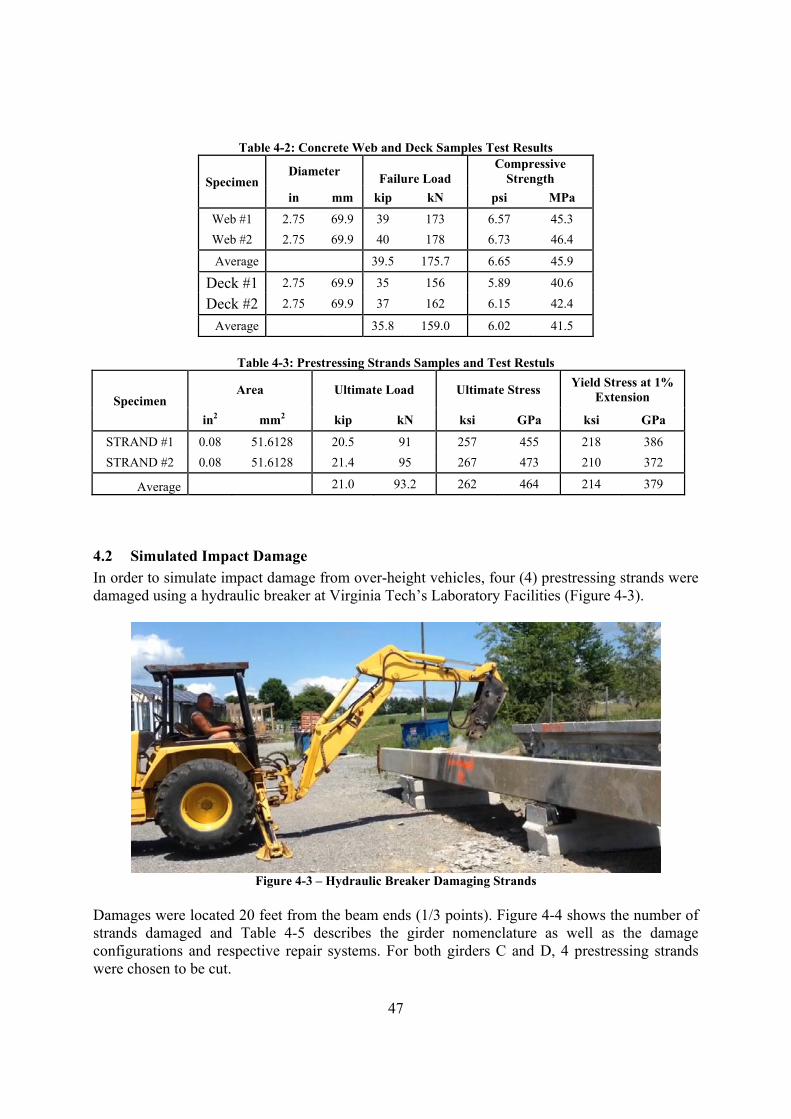
47
Table 4-2: Concrete Web and Deck Samples Test Results
Specimen Diameter
Failure Load Compressive
Strength
in mm kip kN psi MPa
Web #1 2.75 69.9 39 173 6.57 45.3
Web #2 2.75 69.9 40 178 6.73 46.4
Average 39.5 175.7 6.65 45.9
Deck #1 2.75 69.9 35 156 5.89 40.6
Deck #2 2.75 69.9 37 162 6.15 42.4
Average 35.8 159.0 6.02 41.5
Table 4-3: Prestressing Strands Samples and Test Restuls
Specimen Area Ultimate Load Ultimate Stress
Yield Stress at 1% Extension
in2 mm2 kip kN ksi GPa ksi GPa
STRAND #1 0.08 51.6128 20.5 91 257 455 218 386
STRAND #2 0.08 51.6128 21.4 95 267 473 210 372
Average 21.0 93.2 262 464 214 379
4.2 Simulated Impact Damage
In order to simulate impact damage from over-height vehicles, four (4) prestressing strands were damaged using a hydraulic breaker at Virginia Tech’s Laboratory Facilities (Figure 4-3).
Figure 4-3 – Hydraulic Breaker Damaging Strands
Damages were located 20 feet from the beam ends (1/3 points). Figure 4-4 shows the number of strands damaged and Table 4-5 describes the girder nomenclature as well as the damage configurations and respective repair systems. For both girders C and D, 4 prestressing strands were chosen to be cut.

48
Figure 4-4 – Damaged Prestressing Strands
Table 4-4: Girder Geometries (1 in. = 25.4 cm)
Property Girder A Girder C Girder D
Slab
Thickness 10 in 9.25 in 9.5in
Width 24 in 16 in 15 in
Girder
Depth 45 in 45 in 45 in
Top Flange Width 16 in 16 in 16 in
Top Flange Thickness 7 in 7 in 7 in
Web Thickness 7 in 7 in 7 in
Bottom Flange Width 22 in 22 in 22 in Bottom Flange Thickness 7 in 7 in 7 in
Prestressing Steel
Type Stress Relieved Stress Relieved Stress Relieved
Quantity 50 46 46
Diameter .375 in .375 in .375 in

49
Table 4-5: Description of Damages and Repair Types (1 ft = 0.305 m)
Girder Test No.
Repair Type
Strands Cut
Girder Length
ft
Damage Location
Damage Length
ft Testing Notes
A 1 None 0 44 - - Girder A was loaded until 353 kips, until the actuator malfunctioned. The test was resumed until the limit of the actuator was reached (400 kips)
C 3 FRP 4 60 1/3 Point 4
Girder C was loaded to 312 kips with a 48 ft span. The test was stopped due to damaged that began to occur at another damage location on the same girder. The load configuration was changed to 53 ft span and the test was re-done where a load of 265 kips was reached
D 5 FRCM 4 60 1/3 Point 4 Girder D was loaded until 175 kips, until the actuator malfunctioned and damage began to occur at another damage location on the same girder. A second test was performed where a load of 222 kips was reached.

50
4.3 Repair of Damaged Area
After the strands were damaged, the repair area was saw cut to 1 in. (2.54 cm) deep in order to create a well defined edge. The loose and or weakened concrete was chipped from around the exposed strands and the repair area was sandblasted, and then pressure washed in order to allow for the repair mortar to penetrate between and around the strands. Wood formwork was placed around the repair area and the repair mortar was placed where the final form of the concrete takes the same original shape of the girder. See Figure 4-5 for repair details (Jones et al., 2015).
a) b)
c)
Figure 4-5 – a) Formwork for Repair Mortar b) Pouring of Repair Concrete c) Repaired Area
4.4 Analysis of PC Girder
It is necessary to perform a theoretical analysis of the undamaged girder in order to predict the experimental nominal flexural capacity. Current design methodology that most Departments of Transportation (DOTs) follow, including VDOT and FDOT, are the AASHTO: LRFD Bridge Design Specifications (AASHTO 2010). These specifications are used for the design, evaluation and rehabilitation of bridge structures and accordingly are used for the theoretical analysis of all undamaged girders. The analysis follows the LRFD guidelines with the following assumptions:
1. The strain distribution is linear along the depth of the section 2. Force equilibrium is satisfied 3. Strain compatibility is used to determine the strains in the prestressing steel, FRCM and
FRP 4. Perfect bond exists between the prestressing steel and the concrete 5. Maximum compressive strain in the concrete is 0.003

51
6. Concrete tensile stress is neglected 7. Strength reduction factors and design stresses are only used to determine design flexural
capacity values. These include 28-day compressive strength of the concrete deck and girder, yield stress and nominal stress of prestressing steel. Results from the tested analysis of each girder.
The forces applied to the concrete section are represented in Figure 4-6 showing the axial, bending, dead, and live load force effects acting on the girder cross section.
Figure 4-6 – Stresses Applied to Girder Cross Section (Un-Damaged Girder)
The corresponding strain behavior on the cross section due to each stage of load application until failure is shown in Figure 4-7, where Pe is the effective prestressing force.
Figure 4-7 – Force Equilibrium for Ultimate Flexural Strength
The theoretical analysis of the nominal flexural capacity for each girder was performed using a program developed in Mathcad. All material and geometric properties given in Section 4.1 and 4.2 were used for the analysis. The non-composite, composite, non-transformed, and transformed
Neutral Axis
Axial Stress due to Prestressing
Bending Stress due to Prestressing
Bending Stress due to Dead and Live Load
Neutral Axis at Failure
Uncracked Concrete Centroid
Decompression at level of steel
Dead Load Live Load
Pe alone

52
section properties including: area, moment of inertia, section modulus, prestressing steel, eccentricity, and dead loads were determined. Dead loads include the self weight of the girder and weight of deck. Prestressing losses can be approximated using LRFD Section 5.9.5.3 Approximate Estimate of Time Dependent Losses Method. For this analysis, the effective prestress from the tests is used and is equal to 132 ksi (910.1 MPa). The flexural design was performed in accordance with LRFD Section 5.7.3 by satisfying force equilibrium (Figure 4-8).
Force Equilibrium: The force equilibrium equation is as follows: 0 pkcp FCF
where: pF is the tensile force in the Prestressing (kip)
cC Is the compressive force in the concrete (kip)
p
puppk d
fckAF is the additional force component given in LRFD 5.7.3.1 due to the
assumption that the tensile reinforcement is lumped at the location of Prestressing centroid (kip) c is the distance from extreme compression fiber to the neutral axis (in.) k is a factor that accounts for the assumption that the tensile reinforcement is lumped at
the location of Prestressing centroid and defined as
pu
py
f
fk 04.12
pA is the area of Prestressing (in.2)
puf is the ultimate stress in the Prestressing steel (ksi)
pyf is the yield stress in the Prestressing steel (ksi)
pd is the distance from extreme compression fiber to the centroid of Prestressing steel
(in.) Tension In Prestressing Steel: The tensile force in the Prestressing steel pF is defined as
ppp fAF
where: pf is the stress at nominal capacity given that pupe ff 5.0 and can be determined by
ppup d
ckff 1
Compression In Concrete: The compressive force in the concrete, cC , is defined as
ccc AfC '1 if c equals 0.003
Where 1 is taken as .85
cf ' is the 28 day concrete compressive strength (psi)

53
cA is the area of concrete in compression (in.2) (above the neutral axis)
c is the strain in the concrete at the extreme compression fiber (in./in.)
if the strain in the concrete is less than 0.003, then Todeschini’s model is used:
2
0
0
1
''2
)(
c
c
c
cc
cc
where:
c
cc E
f '71.10
cc f '9.0''
cE is the modulus of elasticity of the concrete
Figure 4-8 – Force Equilibrium for Nominal Flexural Strength (Un-damaged Girder)
Strain Compatibility Strain is assumed to be linear along the depth of the section and strain compatibility is used to determine the strain in the steel, FRP and FRCM. The strain in the concrete is determined by the failure mode type and the strain in the prestressing steel εps is determined by summing the strains due to: effective prestress ε1, decompression of the concrete at the level of steel centroid ε2, dead load ε3, and the overload to failure ε4: εps = ε1 + ε2 + ε3+ ε4 where:
s
pe
E
f1
2
2
2 1r
e
EA
P cg
cc
e
pkc FC
pF
c
pd

54
S
MM deckdl 3
cd
c
pc
4
where: pef is the effective Prestressing stress (ksi)
sE is the modulus of elasticity of the steel (ksi)
eP is the effective Prestressing force (with losses) (kip)
sE is the distance from the neutral axis to the centroid of the Prestressing steel (in.)
r is the radius of gyration of the composite section (in.) dlM is the deal load moment due to the weight of the girder (kip-in.)
deckM Is the superimposed dead load due to the weight of the deck (kip-in.)
S is the section modulus of the girder (in.3)
4.5 Analysis of Un-Damaged Girders
The nominal flexural capacities of all un-damaged girders are given in Figure 4-9. Girder A was damaged, therefore it has a length about 44 feet, while the remaining Girders C and D were intact with the full 60 ft (1 ft = .305 m) length. The difference in capacities is due to the varying deck widths and thicknesses for each girder. Specific dimensions for each girder can be found in Table 4-4.
Figure 4-9 – Theoretical Moment Capacity of Un-Damaged Girders (1 kip-ft = 1.356 kN-m; 1 ft = 0.305 m)
4.6 Analysis of Damaged Girder
Once the nominal flexural capacity is determined, the capacity is then determined for each damaged girder when four (4) strands are cut. The four (4) damaged strands result in the
Girder A
Girder D
Girder C

55
reduction of prestressing force and therefore, a reduction in flexural capacity. The same properties and assumptions given in section 4.4 are also used, with the exception of number of prestressing strands that is reduced to 46 strands. The reduction of strands will correspond a tensile force equal and opposite to the prestressing force previously given applied by those specific strands. This tensile force is applied at the centroid of the cut strands. One additional step performed during the analysis: this tensile force is applied to the composite section (deck and girder) and there is an added stress and strain distribution in the cross section. This added stress and strain in the cross section affects the initial stress and strain conditions in the girder when the composite strengthening system is applied. This concept is addressed further in sections 4.7 and 4.7. The results for the nominal strength of the damaged girders are given in Figure 4-10 and Figure 4-11 where both damaged and un-damaged girder capacities are given.
Figure 4-10 – Theoretical Nominal Capacity of Damaged Girder C (1 kip-ft = 1.356 kN-m; 1 ft = 0.305 m)
Figure 4-11 – Theoretical Nominal Capacity of Damaged Girder D (1 kip-ft = 1.356 kN-m; 1 ft = 0.305 m)

56
In order to understand the loss of capacity due to the damaged strands, the un-damaged flexural capacity is also graphed. Therefore, the composite repair system is required to provide the difference in flexural strength between the undamaged girder and damaged girder in order to restore the girder to its original capacity.
4.7 Girder D Strengthened with FRCM
4.7.1 Theoretical Analysis
The same analysis approach given in Section 4.6 is used for the computation of the nominal flexural capacity. The damaged girder D is to be strengthened with the composite FRCM material, therefore there is an additional tensile force that provides flexural resistance to the cross section. The system force equilibrium now has an additional component, as shown in Figure 4-12. Note that when the 4 strands were damaged, the center of prestressing shifted laterally to the right and vertically upward, thus resulting in a unsymmetrical eccentricity with respect to the girder centerline. This lateral eccentricity can result in a twisting effect. The effect of twisting is outside of the scope of this report and has been disregarded. Therefore, only the vertical change in eccentricity has been used in the analysis and no lateral eccentricity is shown in Figure 4-12.
Figure 4-12 – Force Equilibrium for Nominal Strength with FRCM Strengthening
The force equilibrium equation now becomes 0 pkcfrcmp FCFF
where frcmF is the tensile force in the FRCM . The tensile resistance provided by the
FRCM is also defined by the mechanical properties determined by the material characterization direct tension tests summarized in Table 4-6 on the following page. To satisfy strain linearity and strain compatibility, the strain in the FRCM is based on ACI 549.4R-13 provisions where the design strain, εfd, controls as the failure mechanism. The design
pkc FC
pF
frcmF
c
pd
FRCM
C.G. Prestressing Strands (shifts upward due to strand damage)

57
strain is taken to be the average ultimate strain from the experimental results. The strain level in the FRCM is known as the effective strain, εfe
012.0 fdfe (ACI 549.4R-13 Eq. 11.1a)
The same approach that was taken for the effective strain in the FRP is also taken for FRCM
fdbif
cufe c
cd
where f’c is the 28-day compressive strength, εbi is the initial strain in the concrete at level of FRCM, c is the distance to the neutral axis, and df is the distance to the FRCM reinforcement. All other variables are defined in Table 4-6.
Table 4-6 – FRCM Material Properties (1 ksi = 6.895 MPa; 1 in. = 25.4 cm)
Description Symbol Value Units
Modulus of elasticity from characterization Ef 18,000 ksi
Ultimate tensile strain from characterization (also known as the design strain εfd)
εfu (εfd) 0.017565 in/in
Standard Deviation of Ultimate Strain σεfu 0.001338 in/in
Number of Plies n 4 -
Area of FRCM by unit weight Af.unit 0.0018 in2/in
Note that the FRCM area is the net fabric area. The initial strain at the level of FRCM is taken as the strain in the bottom of the girder. The cutting of 4 strands has an effect on the strain in the cross section. Figure 4-13, which is taken from in the Mathcad program, shows the initial strain conditions of the damaged girder at the damage location, prior to the application of FRCM. where: ditg .. is the strain at the top of the girder
dlayerps .1. is the strain in the top layer of prestressing steel
dips .. is the strain at the level of prestressing centroid
dlayerps .6. is the strain in the bottom layer of prestressing steel
dibg .. is the strain at the bottom of the girder
Negetive values indicuate tension, and positive values indicate compression. For the prediction of experimental results, no reduction factors were adopted and average properties were used, in order to simulate actual composite behavior. The results for the analysis of Girder D are given in Figure 4-14. The strengthened flexural (moment) capacity is compared to the damaged and un-damaged capacities. As shown in the graph, the FRCM practically restores the original strength of the girder. Previous studies on the flexural strengthening of reinforced concrete beams with the same FRCM system demonstrates that for a 4 ply configuration, the failure mode of the system is due to delamination from the concrete (Babaeidarabad 2009). Therefore, the maximum of four plies was selected. Figure 4-14 shows the FRCM restores the damaged girder with an increase of about 190 kip-ft, and with about 46 kip-ft (1.5% of target value) remaining in order to restore to its original strength.

58
Figure 4-13 – Girder D Initial Conditions Prior to FRCM Strengthening
Figure 4-14 – Nominal Flexural Capacity Analysis of Girder D Strengthened with FRCM
FRCM

59
4.7.2 FRCM Sequence of Application
Due to the geometry of fabric which is 1 meter (39 in.) in width, the four fabric plies were divided into several strips and applied in a specific order ( Figure 4-15). Also, in order to prevent end delamination, each layer of FRCM was of a different length to provide a tapering effect from midspan to the ends of the repair, as shown in Figure 4-16.
Figure 4-15 – FRCM Sequence of Application

60
Figure 4-16 – FRCM Sequence of Application – Elevation View
Prior to FRCM installation, the substrate was prepared by sanding and smoothing rough edges. The concrete surface was wetted in order to create saturated surface dry conditions prior to application. (Jones et al., 2015)
a) b)
c)
Figure 4-17 – FRCM Sequence of Application a) First Layer of Mortar b) Fabric Impregnation c) Second Layer of Mortar

61
4.8 Girder C Strengthened with FRP
4.8.1 Theoretical Analysis
The same analysis approach given in Section 4.6 is used for the computation of the nominal flexural capacity. The damaged girder is to be strengthened with the composite FRP material, therefore there is an additional tensile force that provides flexural resistance to the cross section. The force equilibrium now has an additional component, as seen in Figure 4-18. Note that when the 4 strands were damaged, the center of prestressing shifted laterally to the right and vertically upward, thus resulting in a unsymmetrical eccentricity with respect to the girder centerline. This lateral eccentricity can result in a twisting effect. The effect of twisting is outside of the scope of this report and has been disregarded. Therefore, only the vertical change in eccentricity has been used in the analysis and no lateral eccentricity is shown in Figure 4-18.
Figure 4-18 – Force Equilibrium for Nominal Strength with FRP Strengthening
The force equilibrium equation now becomes 0 pkcfrpp FCFF
where: frpF is the tensile force in the FRP.
The additional tensile resistance provided by the FRP is defined by the mechanical properties determined by the material characterization direct tension tests summarized in Table 4-7. The area of FRP is the total composite area including the fibers plus resin. To satisfy strain linearity and strain compatibility, the FRP strain is based on ACI440.2R-08 provisions where the strain due to debonding, εfd controls as the failure mechanism. The strain level in the FRP is known as the effective strain, εfe. Both strains are defined in the following equations:
fuff
cfd tnE
f 9.0
'083.0 (ACI 440.2R-08 Eq. 10-2)
Table 4-7: FRP Material Properties (1 ksi = 6.895 MPa; 1 in. = 25.4 cm)
pkc FC
pF
frpF
c
pd
C.G. Prestressing Strands (shifts upward due to strand damage)
FRP

62
Description Symbol Value Units
Modulus of Elasticity fom Characterization Ef 11,000 ksi
Ultimate Tensile Strain from Characterization εfu 0.017 in/in
Standard Deviation of Ultimate Strain σεfu 0.0007 in/in
Ultimate Tensile Stress from Characterization ftu 187.6 ksi
Standard Deviation of Ultimate Stress σftu 6.6 ksi
Number of Plies n 2 -
Thickness of FRP tf 0.08 in
fdbif
cufe c
cd
(ACI 440.2R-08 Eq. 10-3)
where f’c is the 28-day compressive strength, εbi is the initial strain in the concrete at level of FRP, c is the distance to the neutral axis, and df is the distance to the FRP reinforcement. All other variables are defined in Table 4-7. The initial strain at the level of FRP is taken as the strain in the bottom of the girder. As stated previously, the cutting of 4 strands has an effect on the strain in the cross section. Figure 4-19, which is taken from in the Mathcad program, shows the initial strain conditions of the damaged girder at the damage location, prior to the application of FRP where all values are defined in Section 4.7.1. Negetive values indicuate tension, and positive values indicate compression.
Figure 4-19 – Girder C Initial Conditions Prior to FRP Strengthening

63
For the prediction of experimental results, no reduction factors were adopted and average properties were used, in order to simulate actual composite behavior. The results for the analysis of Girder C are given in Figure 4-20. The strengthened flexural (moment) capacity is compared to the damaged and un-damaged capacities. As shown, the FRP successfully restores the damaged girder to more than its original capacity with an average increase of about 430 kip-ft from the virgin capacity.
Figure 4-20 – Nominal Flexural Capacity Analysis of Girder C Strengthened with FRP
4.8.2 FRP Sequence of Application
Figure 4-21 shows the sequence of application for 2 plies longitudinal with 1 transverse ply to confine the 2 layers and help to prevent delamination. Figure 4-22 and Figure 4-23 show the FRP application and final strengthening configuration.
Figure 4-21 – FRP Sequence of Application
FRP
First Long. Ply
Second Long. Ply
Transverse Ply

64
Prior to FRP installation, the substrate surface was prepared by grinding in order to create roughness, which increases the bond between the two materials. Also, edges and corners were rounded to a minimum of 0.5 in.(12.7 mm) radius in order to avoid stress concentration. After surface preparation, the FRP is applied to the girder. (Jones et. al., 2015)
a) b)
c) d)
Figure 4-22 – FRP Sequence of Application a) Steps 1 b) Step2 c) Step 3 d) Completed Repair
Figure 4-23 – FRP Strengthened Girder

65
4.9 Tests
Testing of all girders was conducted at Virgina Tech Structures Laboratory in Blacksburg, Virginia where all test data is analyzed and provided by Virginia Tech. Table 4-8 clearly indicates the test number associated to the respective girder. The same coding is used in this report for ease of reference with the Virginia Tech report (Jones et. al., 2015)
Table 4-8: Description of Test Types
Girder Test Repair Type
Test Span (ft)
Test Failure Re-Tests Re-Test Span (ft)
Test Failure
A 1 None 35 No Failure - Actuator Malfunction 1 35 No Failure - Actuator Limit Reached
C 3 FRP 48 No Failure - Test Interrupted Due to Cracking at Other Location
1 53 Flexural Compression Cracking
D 5 FRCM 52 No Failure - Actuator Malfunction 1 52 Horizontal Crack and Deck Crack Propagation
4.9.1 Equipment and Loading
A 400 kip load actuator is used to apply the loading where a spreader beam is used to distribute the load from the actuator to rubber pads located four feet apart. The load was applied off midspan to allow two tests per girder. The girder was supported by pin and roller supports that were in turn supported by W21x101 steel cross sections. In order to prevent any movement or tipping of the girder, two horizontal steel members were used as bracing frames along the length of the girder. In addition, the instrumentation used included: wire pots to measure deflection and strain transducers to measure strain (Jones et al., 2015)
4.9.2 Test 1 Test Configuration
During demolition, the control Girder A was broken into two pieces and the overall remaining length of the girder is about 44 ft. There is only about 36 ft of undamaged beam, therefore the span used for testing is 35 ft as shown in Figure 4-24.
Figure 4-24 –Test 1 Test Configuration
4.9.3 Test 3 Test Configuration
The initial test configuration for Girder C strengthened with FRP using a 48 ft span is shown in Figure 4-25 a). This testing configuration could not load the repaired beam to failure, therefore
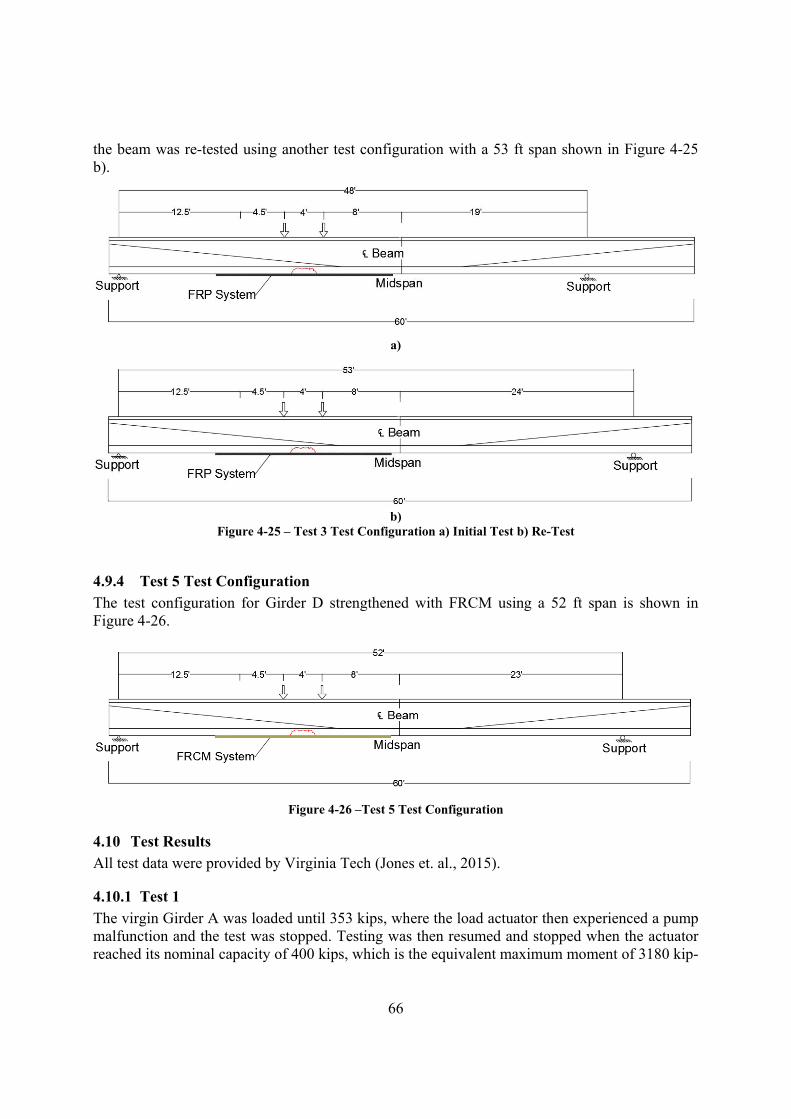
66
the beam was re-tested using another test configuration with a 53 ft span shown in Figure 4-25 b).
a)
b)
Figure 4-25 – Test 3 Test Configuration a) Initial Test b) Re-Test
4.9.4 Test 5 Test Configuration
The test configuration for Girder D strengthened with FRCM using a 52 ft span is shown in Figure 4-26.
Figure 4-26 –Test 5 Test Configuration
4.10 Test Results
All test data were provided by Virginia Tech (Jones et. al., 2015).
4.10.1 Test 1
The virgin Girder A was loaded until 353 kips, where the load actuator then experienced a pump malfunction and the test was stopped. Testing was then resumed and stopped when the actuator reached its nominal capacity of 400 kips, which is the equivalent maximum moment of 3180 kip-

67
ft at 17.5 ft along the length of the girder. Calculations predicted the failure load to be 430 kips equal to a flexural capacity of 3408 kip-ft (Figure 4-27). Although the capacity of the actuator was reached, the girder exhibited crack patterns that were indicative of an impending flexural failure while sustaining 93% of the predicted failure load.
Figure 4-27 – Moment Diagrams for Test 1
The load versus deflection curves are given for each test at both load points in Figure 4-28 and Figure 4-29.
Figure 4-28 – Test 1 – Initial Test Load vs. Deflection at Both Loading Points
Actuator Malfunction

68
Figure 4-29 – Test 1 – Second Test Load vs. Deflection at Both Loading Points
4.10.2 Test 3
Girder C strengthened with FRP was first tested with a 48-ft span and then re-tested using a 53-ft span. Figure 4-30 shows the the 48 foot span test reached a load of 312 kips which induced a maximum moment of 3524 kip-ft at 22 feet along the length of the girder. At this load, the test was interrupted due to the presence of flexural cracks occurring at another repair location in the same beam. Shear cracks also formed in the girder web at locations of minimal shear reinforcement. Therefore, in order to prevent damage to the other repair location, the test was stopped at 312 kips (Jones et al., 2015). The predicted failure load for the 48-ft load configuration is 322 kips, corresponding to a moment of 3623 kip-ft. And although failure was not attained during the test, the girder also sustained 97% of the predicted failure load. Also, considering that the predicted flexural capacity of the un-damaged girder is 3194 kip-ft which corresponds to a load of 282 kips, this shows that the FRP as a strengthening method successfully restores the damaged girder to its original capacity. The repair of the other beam end was tested. Since the repair method is tendon splicing, it is not reported in this document (Jones et. al., 2015) After the other repair area was tested, the re-test was performed using a 53-ft span. This test is shown in Figure 4-31 where a maximum load of 265 kips was reached and induced a maximum moment of 3282 kip-ft at 22 feet along the length of the girder. For a 53-ft span configuration, the predicted failure load was 295 kips or 3623 kip-ft. During this test, the actuator began to slip and a frame was introduced to prevent slippage. Flexural compression cracks developed between the two loading points in the area of constant moment, and these cracks were representative of a flexural compressive failure so the test was stopped (Jones et al., 2015). The re-test fell slightly short of the predicted value possibly due to the excessive deflection damage caused by the first test. But it did sustain 90% of the predicted nominal load, and identical to the previous test, the maximum capacity of 3282 kip-ft was larger than the predicted capacity of 3194 kip-ft of the un-damaged girder. Therefore, this successfully shows that the FRP as a strengthening method successfully restores the damaged girder to its original capacity.
Actuator Limit

69
Figure 4-30 – Moment Diagrams for Test 3 – 48 ft Configuration
Figure 4-31 – Moment Diagrams for Test 3 – 53 ft Configuration

70
The load versus deflection curves are given for each test at the center of loading in Figure 4-32 and Figure 4-33.
Figure 4-32 – Test 3 (48 ft) – Load vs. Deflection at Center of Load
Figure 4-33 – Re-Test 3 (53 ft) – Load vs. Deflection at Center of Load
4.10.3 Test 5
Girder D strengthened with FRCM was initially tested with a 52-ft span and the test was stopped at a loading of 175 kips due to an actuator malfunction. Because this same girder is intended for
Interrupted due to cracking at other location
Flexural compression
cracks
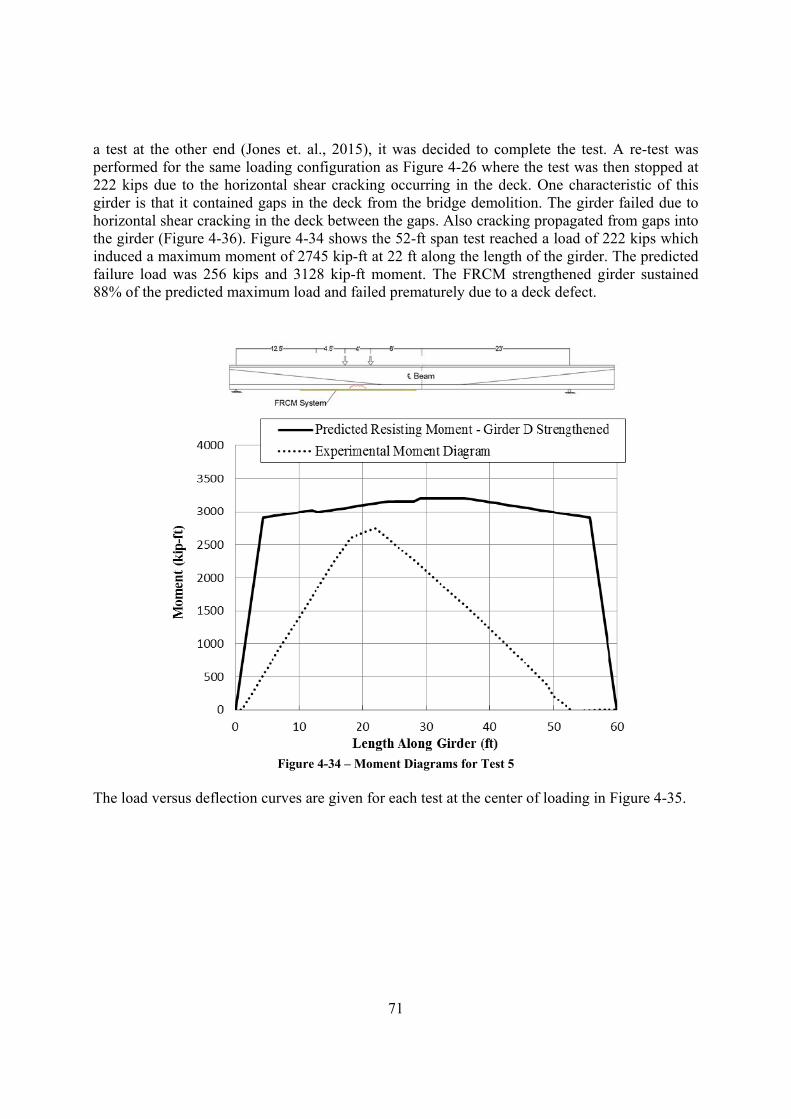
71
a test at the other end (Jones et. al., 2015), it was decided to complete the test. A re-test was performed for the same loading configuration as Figure 4-26 where the test was then stopped at 222 kips due to the horizontal shear cracking occurring in the deck. One characteristic of this girder is that it contained gaps in the deck from the bridge demolition. The girder failed due to horizontal shear cracking in the deck between the gaps. Also cracking propagated from gaps into the girder (Figure 4-36). Figure 4-34 shows the 52-ft span test reached a load of 222 kips which induced a maximum moment of 2745 kip-ft at 22 ft along the length of the girder. The predicted failure load was 256 kips and 3128 kip-ft moment. The FRCM strengthened girder sustained 88% of the predicted maximum load and failed prematurely due to a deck defect.
Figure 4-34 – Moment Diagrams for Test 5
The load versus deflection curves are given for each test at the center of loading in Figure 4-35.

72
Figure 4-35 – Test 5 Load vs. Deflection at Center of Load
Figure 4-36 – Test 5 – Horizontal Shear Cracking and Crack Propagation at Gap
Table 4-9 includes a summary of all predicted and experimental values as well as descriptions of each test.
Horizontal crack and deck crack
propagation Actuator malfunction
Test Re-Test
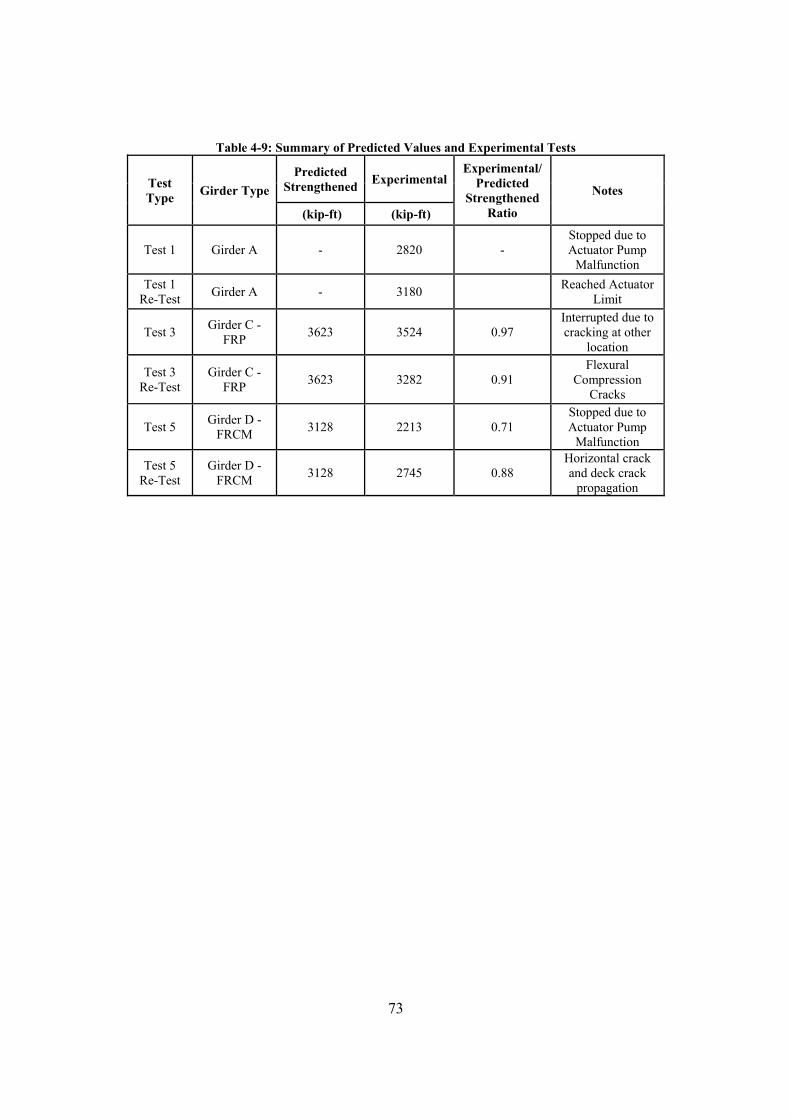
73
Table 4-9: Summary of Predicted Values and Experimental Tests
Test Type
Girder Type
Predicted Strengthened
ExperimentalExperimental/
Predicted Strengthened
Ratio
Notes
(kip-ft) (kip-ft)
Test 1 Girder A - 2820 - Stopped due to Actuator Pump
Malfunction
Test 1 Re-Test
Girder A - 3180 Reached Actuator
Limit
Test 3 Girder C -
FRP 3623 3524 0.97
Interrupted due to cracking at other
location
Test 3 Re-Test
Girder C - FRP
3623 3282 0.91 Flexural
Compression Cracks
Test 5 Girder D -
FRCM 3128 2213 0.71
Stopped due to Actuator Pump
Malfunction
Test 5 Re-Test
Girder D - FRCM
3128 2745 0.88 Horizontal crack and deck crack
propagation
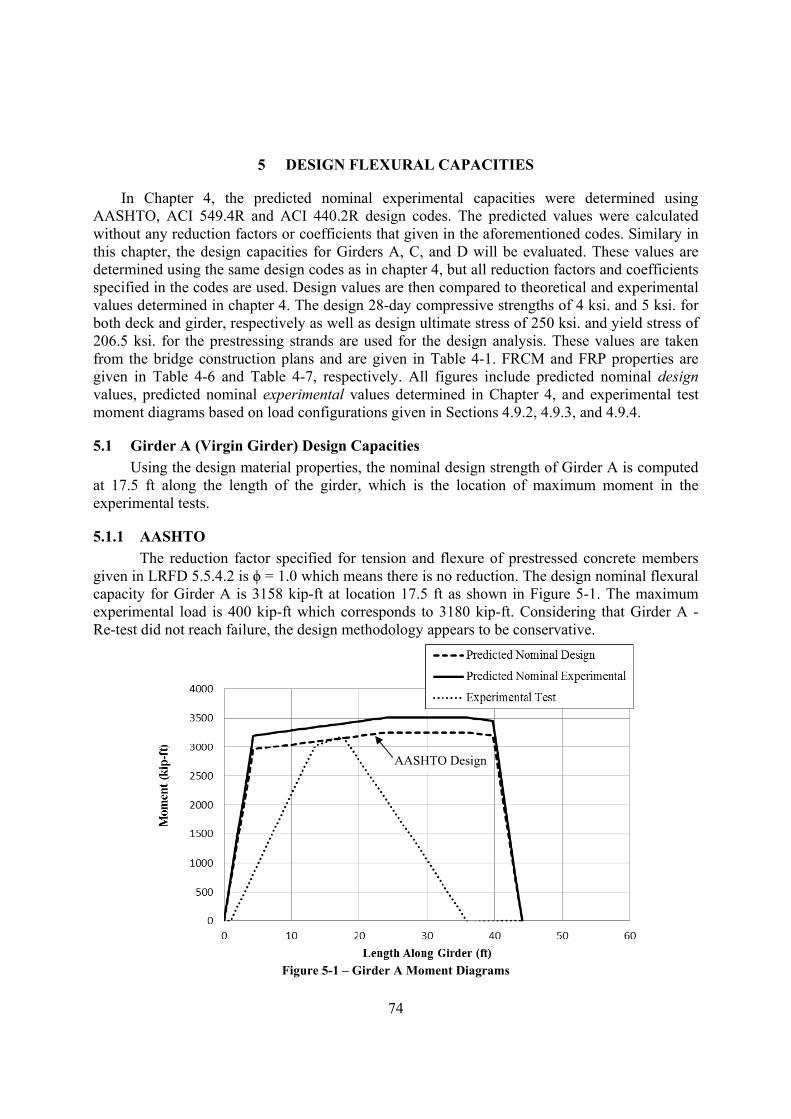
74
5 DESIGN FLEXURAL CAPACITIES
In Chapter 4, the predicted nominal experimental capacities were determined using AASHTO, ACI 549.4R and ACI 440.2R design codes. The predicted values were calculated without any reduction factors or coefficients that given in the aforementioned codes. Similary in this chapter, the design capacities for Girders A, C, and D will be evaluated. These values are determined using the same design codes as in chapter 4, but all reduction factors and coefficients specified in the codes are used. Design values are then compared to theoretical and experimental values determined in chapter 4. The design 28-day compressive strengths of 4 ksi. and 5 ksi. for both deck and girder, respectively as well as design ultimate stress of 250 ksi. and yield stress of 206.5 ksi. for the prestressing strands are used for the design analysis. These values are taken from the bridge construction plans and are given in Table 4-1. FRCM and FRP properties are given in Table 4-6 and Table 4-7, respectively. All figures include predicted nominal design values, predicted nominal experimental values determined in Chapter 4, and experimental test moment diagrams based on load configurations given in Sections 4.9.2, 4.9.3, and 4.9.4.
5.1 Girder A (Virgin Girder) Design Capacities
Using the design material properties, the nominal design strength of Girder A is computed at 17.5 ft along the length of the girder, which is the location of maximum moment in the experimental tests.
5.1.1 AASHTO
The reduction factor specified for tension and flexure of prestressed concrete members given in LRFD 5.5.4.2 is ϕ = 1.0 which means there is no reduction. The design nominal flexural capacity for Girder A is 3158 kip-ft at location 17.5 ft as shown in Figure 5-1. The maximum experimental load is 400 kip-ft which corresponds to 3180 kip-ft. Considering that Girder A - Re-test did not reach failure, the design methodology appears to be conservative.
Figure 5-1 – Girder A Moment Diagrams
AASHTO Design
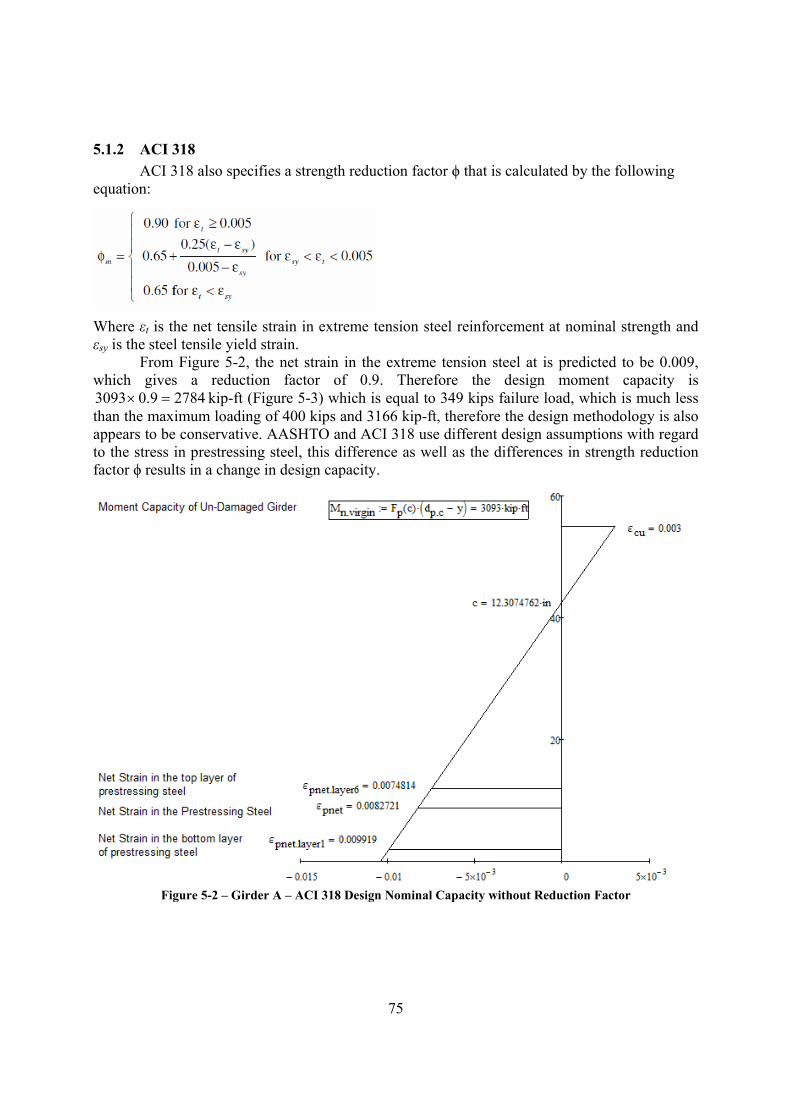
75
5.1.2 ACI 318
ACI 318 also specifies a strength reduction factor ϕ that is calculated by the following equation:
Where εt is the net tensile strain in extreme tension steel reinforcement at nominal strength and εsy is the steel tensile yield strain.
From Figure 5-2, the net strain in the extreme tension steel at is predicted to be 0.009, which gives a reduction factor of 0.9. Therefore the design moment capacity is
27849.03093 kip-ft (Figure 5-3) which is equal to 349 kips failure load, which is much less than the maximum loading of 400 kips and 3166 kip-ft, therefore the design methodology is also appears to be conservative. AASHTO and ACI 318 use different design assumptions with regard to the stress in prestressing steel, this difference as well as the differences in strength reduction factor ϕ results in a change in design capacity.
Figure 5-2 – Girder A – ACI 318 Design Nominal Capacity without Reduction Factor

76
Figure 5-3 – Girder A Moment Diagrams
5.2 Girder C (FRP) Design Capacities
Using the same design values given in Section 5.0, the nominal design strength of Girder C is predicted at 22 ft along the length of the girder, which is the same critical location as the experimental tests.
5.2.1 AASHTO & FRPS-1
The same equation used in section 5.1.1 to determine the strength reduction factor is used for Girder C. The design nominal moment is 3263 kip-ft is given in Figure 5-4 which is equal to a load of 288 kips using the same test configuration given in Figure 4-25. The maximum experimental moment is given in as 3524 kip-ft which is greater than the predicted design moment. Considering that Girder C did not fail during Test 3, the design methodology is determined to be conservative.
5.2.2 ACI 440.2R-08
The design of FRP strengthened Girder C is based on the stress strain limitations given in ACI440.2R-08 that specify the ultimate stress as
3* fufu ff (ACI 440.2R-08)
where:
fuf is the mean ultimate tensile strength given by the manufacturer and σ is the
corresponding standard deviation (ksi.)
ACI318 Design

77
Figure 5-4 – Girder C Moment Diagrams
Then, the design ultimate tensile strength is determined as follows: *fuEfu fCf (ACI 440.2R-08)
where CE is the environmental factor and is given for various FRP systems subject to different exposure conditions (Figure 5-5).
Figure 5-5 – Environmental Reduction Factor (Table 9.1 ACI 440-08)
For this study, an environmental factor of CE = 0.85 will be used for the PC bridge
girders. The design rupture strain is then determined using the modulus of elasticity.
f
fufu E
f
Once these design parameters are defined, the following equations that are also given in Section 4.8.1 can be used to determine the strain at debonding as well as the effective strain.
AASHTO &FRPS-1 Design

78
fuff
cfd tnE
f 9.0
'083.0 (ACI 440.2R-08 Eq. 10-2)
fdbif
cufe c
cd
(ACI 440.2R-08 Eq. 10-3)
The computed design value of 0.9εfu is much larger than εfd which means there is no change in debonding strain as well as effective strain in the FRP. ACI 440.2R-08 also specifies a strength reduction factor ϕ that is calculated by the following equation
Where εps is the total strain level in the prestressing steel. From Figure 5-6 the strain in the prestressing steel is predicted to be 0.00902, which gives a reduction factor of 0.65.
Figure 5-6 – Girder C – ACI 440.2R Design Nominal Capacity without Reduction Factor
The reason the strain in the steel is low is because the FRP delamination strain controls
the failure mode. Therefore the design moment capacity is 214665.03302 kip-ft which is

79
equal to 184 kips failure load, which is much less than the maximum loading of 312 kips and 3510 kip-ft moment. This value is dramatically less than the original capacity and is deemed overly conservative. Comparison of both experimental and design values are given in Figure 5-7. The equation for ϕ seems to be unreasonably conservative because the delamination strain of FRP is so low that it is unlikely to reach a high enough strain that will yield a reduction factor close to 0.9. This defeats the purpose of strengthening. In Section 5.1.2, ACI 318 establishes a strain reduction factor that is a function of lower net strain values. Thus if this criteria is used for a net strain value in the steel of 0.004, the reduction factor is 0.78, which yields a moment of
257678.03302 kip-ft and maintains a conservative design while avoiding a dramatic decrease in capacity.
Figure 5-7 – Girder C Moment Diagrams
5.3 Girder D (FRCM) Girder Design Capacities
Using the same design values given in Section 5, the nominal strength of Girder D is predicted at 22 ft along the length of the girder, which is the same critical location as the experimental tests. Due to the fact that ACI 549.4R does not address the strengthening design of prestressed concrete, design capacities will be evaluated using ACI 549.4R, AASHTO, and ACI 440.2R design criteria.
5.3.1 AASHTO
The same equation used in section 5.1.1 to determine the strength reduction factor is used. The design nominal moment is 2852 kip-ft which is equal to a load of 232 kips as shown in Figure 5-8 using the same test configuration as given in Figure 4-26. The maximum experimental moment is 2745 which is 96% of the predicted design load.
ACI 440.2R Design

80
Figure 5-8 – Girder D Moment Diagrams
5.3.2 ACI 549.4R
ACI 549.4R is not intended to be for prestressed concrete, but will be used as if it were applicable to prestressed concrete. Thus, the design of FRCM strengthened Girder D is based on the stress-strain limitations given in ACI 549.4R-13 that specify the ultimate stress and strain values, respectively as
fufd ff (ACI 549.4R-13. 10.4)
where:
fuf is the mean ultimate tensile strength given by the manufacturer and σ is the
corresponding standard deviation (ksi.)
The design strain is then determined using the modulus of elasticity.
f
fdfd E
f
The design strain is now used to determine the effective strain in the FRCM using the following criteria:
012.0 fdfe (ACI 549.4R-13 Eq. 11.1a)
For this study, the computed design value of εfd is larger than 0.012 which means there is no change in design strain as well as effective strain in the FRCM for design purposes. ACI 549.4R currently uses the same strength reduction factor equation as that given in ACI 318:
AASHTO Design

81
Where εt is the net tensile strain in extreme tension steel reinforcement at nominal strength and εsy is the steel tensile yield strain. From Figure 5-9, the net strain in the extreme tension steel at failure is predicted to be 0.0059, which yields a reduction factor of 0.9. Therefore the design moment capacity is 24899.02765 kip-ft as shown in Figure 5-10, which is less than the maximum moment of 2732 kip-ft. Therefore the design methodology appears conservative. Also, the same assumptions given in ACI 318 are used to determine stress in the prestressing steel, therefore the design capacity for ACI 549.4R is also equal to ACI 318 design capacity.
Figure 5-9 – Girder D – ACI 549.4R Design Nominal Capacity without Reduction Factor
5.3.3 ACI 440.2R-08
Considering that FRCM technology is closely following the footsteps of FRP technology, the same reduction factor given in ACI 440.2R-08 is recommended for ACI 549.4R-13 specifically for the flexural strengthening of Prestressed Concrete members. This reduction factor is determined based on the strain level in the prestressing steel and is defined as:

82
Where εps is the strain level in the prestressing steel. From Figure 5-11 the strain in the prestressing steel is predicted to be 0.010, which gives a reduction factor of 0.65.
Figure 5-10 – Girder D Moment Diagrams
Figure 5-11 – Girder D – ACI 440.2R Design Nominal Capacity without Reduction Factor
ACI 318 & ACI 549.4R Design

83
The analysis determined the failure mode to be controlled by concrete crushing. Therefore the design moment capacity is 190665.02932 kip-ft which (Figure 5-12), which one third less than 2732 kip-ft experimental moment. The design methodology is consistent with Section 5.2.2 and appears to be overly conservative. Using the strength reduction factor given in ACI 440.2R defeats the purpose of strengthening.
Figure 5-12 – Girder D ACI Moment Diagrams
ACI 440.2R Design
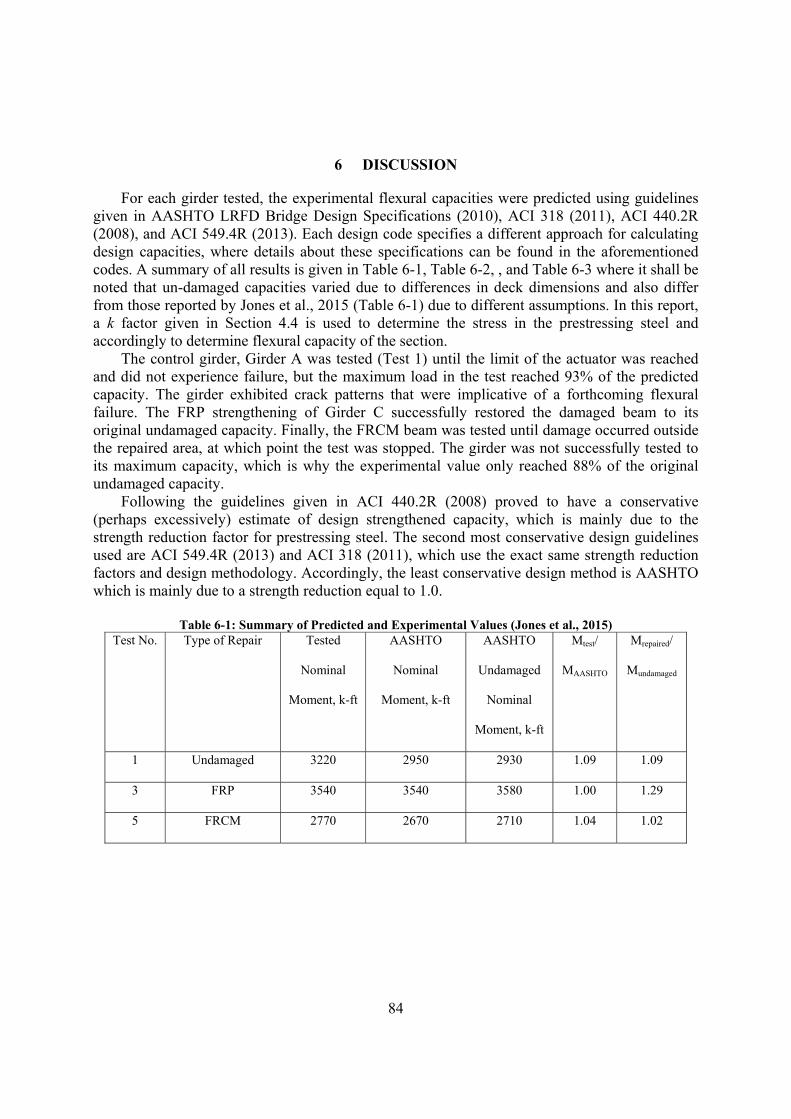
84
6 DISCUSSION
For each girder tested, the experimental flexural capacities were predicted using guidelines given in AASHTO LRFD Bridge Design Specifications (2010), ACI 318 (2011), ACI 440.2R (2008), and ACI 549.4R (2013). Each design code specifies a different approach for calculating design capacities, where details about these specifications can be found in the aforementioned codes. A summary of all results is given in Table 6-1, Table 6-2, , and Table 6-3 where it shall be noted that un-damaged capacities varied due to differences in deck dimensions and also differ from those reported by Jones et al., 2015 (Table 6-1) due to different assumptions. In this report, a k factor given in Section 4.4 is used to determine the stress in the prestressing steel and accordingly to determine flexural capacity of the section.
The control girder, Girder A was tested (Test 1) until the limit of the actuator was reached and did not experience failure, but the maximum load in the test reached 93% of the predicted capacity. The girder exhibited crack patterns that were implicative of a forthcoming flexural failure. The FRP strengthening of Girder C successfully restored the damaged beam to its original undamaged capacity. Finally, the FRCM beam was tested until damage occurred outside the repaired area, at which point the test was stopped. The girder was not successfully tested to its maximum capacity, which is why the experimental value only reached 88% of the original undamaged capacity.
Following the guidelines given in ACI 440.2R (2008) proved to have a conservative (perhaps excessively) estimate of design strengthened capacity, which is mainly due to the strength reduction factor for prestressing steel. The second most conservative design guidelines used are ACI 549.4R (2013) and ACI 318 (2011), which use the exact same strength reduction factors and design methodology. Accordingly, the least conservative design method is AASHTO which is mainly due to a strength reduction equal to 1.0.
Table 6-1: Summary of Predicted and Experimental Values (Jones et al., 2015) Test No. Type of Repair Tested
Nominal
Moment, k-ft
AASHTO
Nominal
Moment, k-ft
AASHTO
Undamaged
Nominal
Moment, k-ft
Mtest/
MAASHTO
Mrepaired/
Mundamaged
1 Undamaged 3220 2950 2930 1.09 1.09
3 FRP 3540 3540 3580 1.00 1.29
5 FRCM 2770 2670 2710 1.04 1.02

85
Table 6-2: Summary of Predicted and Experimental Values
Test Type Girder Type
Predicted Flexural Capacity using AASHTO Experimental
Experimental/Predicted
StrengthenedRatio
Experimental/ Predicted
Un-Damaged Ratio
Strengthened/ Predicted
Un-Damaged Ratio
Notes Un-Damaged Damaged Strengthened
(kip-ft) (kip-ft) (kip-ft) (kip-ft)
Test 1 Girder A 3408 - - 2820 - 0.83 - Stopped due to Actuator Pump
Malfunction
Test 1 Re-Test Girder A 3408 - - 3180 0.93 Reached Actuator
Limit
Test 3 Girder C - FRP 3194 2954 3623 3524 0.97 1.10 1.13 Interrupted due to cracking at other
location
Test 3 Re-Test Girder C - FRP 3194 2954 3623 3282 0.91 1.03 1.13 Flexural Compression
Cracks
Test 5 Girder D - FRCM 3175 2954 3128 2213 0.71 0.70 0.99 Stopped due to Actuator Pump
Malfunction
Test 5 Re-Test Girder D - FRCM 3175 2954 3128 2745 0.88 0.86 0.99 Horizontal crack and
deck crack propagation
Table 6-3: Summary of Design Values
Girder Type
Predicted AASHTO Design
Predicted ACI 318 Design
Predicted ACI 440.2R Design
Predicted ACI 549.4R Design
Flexural Capacity φMn
(kip-ft)
Experimental/Design Ratio
Flexural Capacity φMn
(kip-ft)
Experimental/Design Ratio
Flexural Capacity φMn
(kip-ft)
Experimental/Design Ratio
Flexural Capacity φMn
(kip-ft)
Experimental/Design Ratio
Girder 1 3158 1.01 2784 1.14 - - - -
Girder 2 - FRP (48 FT) 3263 1.08 2576 1.37 2146 1.64 - -
Girder 3 - FRCM 2852 0.96 2489 1.10 1906 1.44 2489 1.10

86
7 CONCLUSIONS, RECOMMENDATIONS, AND BENEFITS
7.1 Conculsions
Results from material characterization, design guidelines, and experimental tests are used to predict and evaluate the flexural capacity of three girders: one control girder, one FRP strengthened girder and one FRCM strengthened girder. Theoretical, experimental, and design capacities are given in Table 6-2 and Table 6-3. Based on the results of the material characterization, theoretical analysis, experimental tests, and design analysis performed on each girder, the following observations and conclusions can be determined: Material:
Experimental data are obtained according to the provisions of AC125 and AC434. FRCM materials are acceptable from a durability perspective under accelerated
conditions. FRP materials are acceptable from a durability perspective under accelerated conditions. FRCM test curves show bilinear behavior that is consistent with the hypothesized stress-
strain behavior given in AC434 Annex Increasing from 1 ply to 2 plies for both FRCM and FRP results in an increase in ultimate
strength and ultimate strain with a decrease in ductility. Early age FRCM bond tests indicate that substantial strength is developed after 7 days of
application. Structural:
FRP technology successfully restores strength to original capacity FRCM technology restored strength to 88% of original capacity, but optimal performance
of the FRCM technology was not observed due to the fact that the FRCM strengthened girder was not successfully tested to its maximum capacity.
Using design guidelines ACI 318, ACI 440.2R-08, ACI 549.4R-13 to predict design strengths proved to be conservative with respect to experimental test results.
Although ACI 549.4R only addresses to reinforced concrete, it is also applicable to prestressed concrete.
Constructability: The FRCM repair has been demonstrated to be very feasible from a constructability stand
point (Jones et al., 2015) FRCM and FRP repairs take similar levels of effort to install, but the FRCM cementitious
matrix is more familiar to construction workers and requires less personal protective gear. (Jones et al., 2015). Further conclusions are given in Jones et al., 2015.

87
7.2 Recommendations
The following is a list of recommendations for technical organizations, owners, and researchers: The reduction factor given in ACI440.2R proves to be overly conservative in predicting
design capacity for FRP strengthened PC girders. The guidelines for this reduction factor should be revisited and less conservative guidelines should be established for repairs of broken PC tendons using FRP.
Provisions should be added to ACI 549.4R that allow for the design of repairs of PC girders with externally bonded FRCM systems.
The same reduction factor given in ACI 318 for prestressed concrete members is recommended for ACI 549.4R.
For hand calculations of original and repaired strength, VDOT Structure and Bridge Division and District Engineers should use ACI440.2R for the added strength from the FRP, and ACI549.4R for the added strength of the FRCM along with the AASHTO LRFD method for flexural strength (Jones et al., 2015).
The concrete patch material will very likely crack under the combination of shrinkage and service loadings. FRP or FRCM over the repair concrete not only provides added strength but also protects the patch concrete and prestressing steel from deterioration related to this cracking, ensuing ingress of water and salts and possible corrosion of strands (Jones et al., 2015).
FRCM is a relatively new repair material and has yet to be applied to bridge structures in the U.S. Further research and studies are recommended in order to address long-term fatigue performance.
7.3 Benefits
Material characterization shows that FRP and FRCM exhibit excellent material properties that can be used to design and predict the strengthened capacity of PC girders. In addition, both FRP and FRCM systems show acceptable results from a durability perspective under accelerated conditions in the laboratory. It has been shown that FRP can successfully restore original strength to damaged PC beams and proves to be very practical in terms of its ease and speed of repair. Based on this study and previous studies performed on the FRP strengthening of PC girders, FRP has been proven to be a viable repair alternative to other traditional methods of repair. FRCM repair is recommended to be used for low-risk bridge applications until the long-term fatigue performance has been evaluated. At this time, FRCM should not be used as a repair alternative to bridges with a considerable level of damage and/or high traffic volume (Jones et al., 2015)
88
8 REFERENCES
American Association of State Highway and Transportation Officials. (2010). AASHTO LRFD
bridge design specifications: Customary U.S. units: special P.E. exam edition. Washington, D.C: American Association of State Highway and Transportation Officials.
American Association of State Highway and Transportation Officials. (2012). Guide specifications for design of bonded FRP systems for repair and strengthening of concrete bridge elements. Washington, D.C: American Association of State Highway and Transportation Officials.
American Concrete Institute (ACI). (2013). “Design and Construction Guide of Externally Bonded FRCM Systems for Concrete and Masonry Repair and Strengthening.” ACI 549.4R-13, Farmington Hills, MI.
American Concrete Institute (ACI). (2011). “Guide for the Design and Construction of Externally Bonded FRP Systems for Strengthening Concrete Structures.” ACI 440.2R-08, Farmington Hills, MI.
ASTM C109/C109M-13 Standard Test Method for Compressive Strength of Hydraulic Cement Mortars (Using 2-in. or [50-mm] Cube Specimens)
ASTM C1583/C1583M-04 Standard Test Method for Tensile Strength of Concrete Surfaces and the Bond Strength or Tensile Strength of Concrete Repair and Overlay Materials by Direct Tension (Pull-off Method)
ASTM D2344/D2344M-00 (2006) Standard Test Method for Short-Beam Strength of Polymer Matrix Composite Materials and Their Laminates
AC125 (2013), “Acceptance Criteria for Concrete and Reinforced and Unreinforced Masonry Strengthening Using Externally Bonded Fiber-Reinforced Polymer (FRP) Composite Systems,” ICC-Evaluation Service.
AC434 (2013), “Acceptance Criteria for Masonry and Concrete Strengthening Using Fabric-reinforced Cementitious Matrix (FRCM) Composite Systems,” ICC-Evaluation Service.
Babaeidarabad, S., Loreto, G., and Nanni, A. (2014). ”Flexural Strengthening of RC Beams with an Externally Bonded Fabric-Reinforced Cementitious Matrix.” Journal of Composites for Construction, 18(5), 04014009.
Di Ludovico, M., Nanni, A., Prota, A., & Cosenza, E. (2005). “Repair of bridge girders with composites: Experimental and analytical validation.” ACI Structural Journal, 102(5), 639-648.
Jones, M. Gangi, M., Leisen, J., et al. (2015). “Evaluation of Repair Techniques for Impact Damaged Prestressed Beams,” FHWA/VTRC Report, June 2015.
Nanni, A. (2012), “FRCM Strengthening – A New Tool in the Concrete and Masonry Repair Toolbox,” Concrete International: Design and Construction, April.
Nanni, A. (1997), “Carbon FRP Strengthening: New Technology Becomes Mainstream,” Concrete International: Design and Construction, 19(6), June, 19-23.