Embed Size (px)
Citation preview
Project Report
“Fraud Detection in Financial Statements using Evolutionary
Computation Based Rule Miners”
By
Kaushik Nandan
Third Year Undergraduate Student
Department of Computer Science & Engineering
Indian Institute Of Technology, Patna
Under the Supervision of
Dr. VADLAMANI RAVI
Center of Excellence in CRM and Analytics
And
Dr. B.L. Deekshatulu
Distinguished Fellow
Executed During
Summer Internship Programme
At
Institute for Development and Research in Banking Technology,
Hyderabad-500057 , India.
Institute for Development & Research in Banking Technology
Hyderabad - 500057 _________________________________________________
CERTIFICATE
Certified that this is a bonafide record of the summer internship
project work entitled
Fraud Detection in Financial Statements using Evolutionary
Computation Based Rule Miners
Done by
Kaushik Nandan
of Department of Computer Science and Engineering, IIT-Patna during May-
July 2014.
Dr. V. Ravi
(Project Guide)
Dr. B.L. Deekshatulu
(Project Guide)

Acknowledgement
I am extremely grateful to my project guides Dr.
Vadlamani Ravi and Dr. B.L. Deekshatulu for giving
their valuable time and constructive guidance in
completing the Project. And also I would like to thank
Mr. Pradeep Ganghishetti for his continuous support. It
would have not been possible to complete this project in
this short period of time without their encouragement
and valuable guidance.
Date: Signature
Name of the Student
(Kaushik Nandan)
INDEX
1. Abstract 5 2. Introduction 5 3. Literature Review 7 4. Proposed Methodology
4.1. Improved FF miner 10
4.2 FFTA Miner 10
4.3 TA Miner 13
5. Dataset Description and Experiment Methodology 14
5.1 Rule Encoding 14
6. Results and Discussion 15 7. Conclusion 17 8. References 18
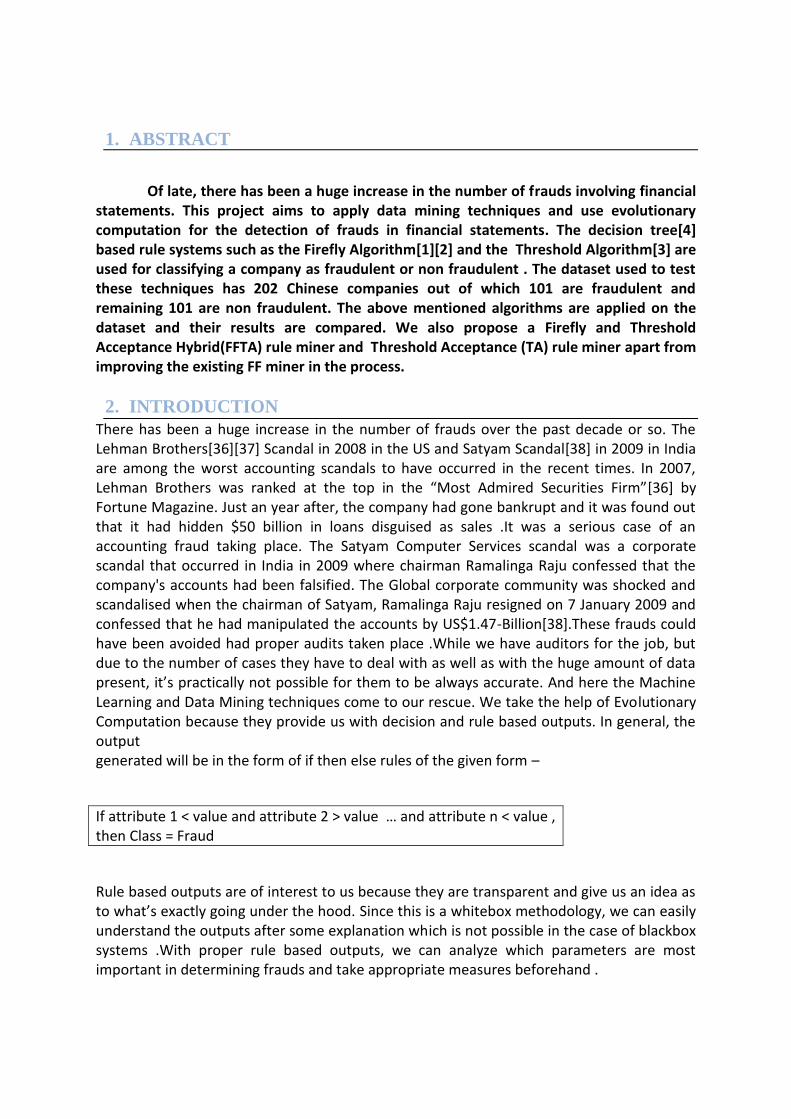
1. ABSTRACT
Of late, there has been a huge increase in the number of frauds involving financial
statements. This project aims to apply data mining techniques and use evolutionary computation for the detection of frauds in financial statements. The decision tree[4] based rule systems such as the Firefly Algorithm[1][2] and the Threshold Algorithm[3] are used for classifying a company as fraudulent or non fraudulent . The dataset used to test these techniques has 202 Chinese companies out of which 101 are fraudulent and remaining 101 are non fraudulent. The above mentioned algorithms are applied on the dataset and their results are compared. We also propose a Firefly and Threshold Acceptance Hybrid(FFTA) rule miner and Threshold Acceptance (TA) rule miner apart from improving the existing FF miner in the process.
2. INTRODUCTION
There has been a huge increase in the number of frauds over the past decade or so. The Lehman Brothers[36][37] Scandal in 2008 in the US and Satyam Scandal[38] in 2009 in India are among the worst accounting scandals to have occurred in the recent times. In 2007, Lehman Brothers was ranked at the top in the “Most Admired Securities Firm”[36] by Fortune Magazine. Just an year after, the company had gone bankrupt and it was found out that it had hidden $50 billion in loans disguised as sales .It was a serious case of an accounting fraud taking place. The Satyam Computer Services scandal was a corporate scandal that occurred in India in 2009 where chairman Ramalinga Raju confessed that the company's accounts had been falsified. The Global corporate community was shocked and scandalised when the chairman of Satyam, Ramalinga Raju resigned on 7 January 2009 and confessed that he had manipulated the accounts by US$1.47-Billion[38].These frauds could have been avoided had proper audits taken place .While we have auditors for the job, but due to the number of cases they have to deal with as well as with the huge amount of data present, it’s practically not possible for them to be always accurate. And here the Machine Learning and Data Mining techniques come to our rescue. We take the help of Evolutionary Computation because they provide us with decision and rule based outputs. In general, the output generated will be in the form of if then else rules of the given form –
If attribute 1 < value and attribute 2 > value … and attribute n < value , then Class = Fraud
Rule based outputs are of interest to us because they are transparent and give us an idea as to what’s exactly going under the hood. Since this is a whitebox methodology, we can easily understand the outputs after some explanation which is not possible in the case of blackbox systems .With proper rule based outputs, we can analyze which parameters are most important in determining frauds and take appropriate measures beforehand .
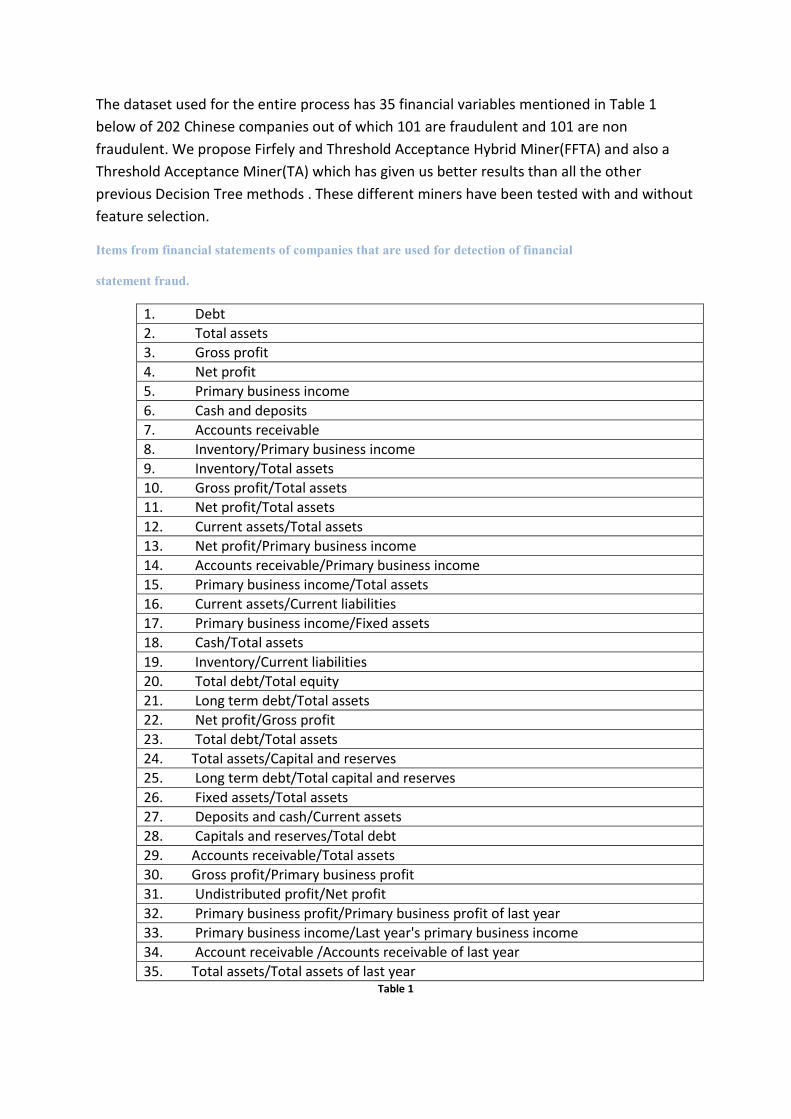
The dataset used for the entire process has 35 financial variables mentioned in Table 1
below of 202 Chinese companies out of which 101 are fraudulent and 101 are non
fraudulent. We propose Firfely and Threshold Acceptance Hybrid Miner(FFTA) and also a
Threshold Acceptance Miner(TA) which has given us better results than all the other
previous Decision Tree methods . These different miners have been tested with and without
feature selection.
Items from financial statements of companies that are used for detection of financial
statement fraud.
1. Debt
2. Total assets
3. Gross profit
4. Net profit
5. Primary business income
6. Cash and deposits
7. Accounts receivable
8. Inventory/Primary business income
9. Inventory/Total assets
10. Gross profit/Total assets
11. Net profit/Total assets
12. Current assets/Total assets
13. Net profit/Primary business income
14. Accounts receivable/Primary business income
15. Primary business income/Total assets
16. Current assets/Current liabilities
17. Primary business income/Fixed assets
18. Cash/Total assets
19. Inventory/Current liabilities
20. Total debt/Total equity
21. Long term debt/Total assets
22. Net profit/Gross profit
23. Total debt/Total assets
24. Total assets/Capital and reserves
25. Long term debt/Total capital and reserves
26. Fixed assets/Total assets
27. Deposits and cash/Current assets
28. Capitals and reserves/Total debt
29. Accounts receivable/Total assets
30. Gross profit/Primary business profit
31. Undistributed profit/Net profit
32. Primary business profit/Primary business profit of last year
33. Primary business income/Last year's primary business income
34. Account receivable /Accounts receivable of last year
35. Total assets/Total assets of last year Table 1
3. LITERATURE REVIEW
There has been a minor research in the field of financial statement fraud detection using
data mining techniques .The techniques to have been used include case based reasoning,
decision tree methods, text mining, logistic regression, neural networks etc
According to Kirkos et al.[26], some estimates stated that fraud cost US business more than
$400 billion annually. Spathis et al.[34] compared multi-criteria decision aids with statistical
techniques such as logit and discriminant analysis in detecting fraudulent financial
statements. A novel financial kernel for the detection of management fraud is developed
using support vector machines on financial data by
Cecchini et al.[19] Huang et al.[24] developed an innovative fraud detection mechanism on
the basis of Zipf's Law. The purpose of this technique is to assist auditors in reviewing the
overwhelming volumes of datasets and identifying any potential fraud records. Kirkos et
al.[26] used the ID3 decision tree and Bayesian belief network to detect financial statement
fraud successfully. Sohl and Venkatachalam[33] used back-propagation NN for the
prediction of financial statement fraud. There are other researchers who used different NN
algorithms to detect financial reporting fraud. Cerullo and Cerullo[20] explained the nature
of fraud and financial statement fraud along with the characteristics of NN and their
applications. They illustrated how NN packages could be utilized by various firms to predict
the occurrence of fraud. Calderon and Cheh[18] examined the efficacy of NN as a potential
enabler of business risk based auditing. They employed different methods using NN as a tool
for research in the auditing and risk assessment domain. Further, they identified several
opportunities for future research that include methodological issues related to NN modeling
as well as specific issues related to the application of NN for business risk assessment.
Koskivaara[27] investigated the impact of various preprocessing models on the forecast
capability of NN when auditing financial accounts. Further, Koskivaara[28] proposed NN
based support systems as a possible tool for use in auditing. He demonstrated that the main
application areas of NN were detection of material errors, and management fraud.
Busta and Weinberg[17] used NN to distinguish between ‘normal’ and ‘manipulated’
financial data. They examined the digit distribution of the numbers in the underlying
financial information. The data analysis is based on Benford’s law, which demonstrated that
the digits of naturally occurring numbers are distributed on a predictable and specific
pattern. They tested six NN designs to determine the most effective model. In each design,
the inputs to the NN were the different subsets of the 34 variables. The results showed that
NN were able to correctly classify 70.8% of thedata on an average.
Feroz et al.[23] observed that the relative success of the NN models was due to their ability
to ‘learn’ what were important. The perpetrators of financial reporting frauds had incentives
to appear prosperous as evidenced by high profitability. In contrast to conventional
statistical models replete with assumptions, the NN used adaptive learning processes to
determine what were important in predicting targets. Thus, the NN approach was less likely
to be affected by accounting manipulations. The NN approach was well suited to predicting
the possible fraudsters because the NN ‘learnt’ the characteristics of reporting violators
despite managers’ intent to obfuscate misrepresentations. Brooks[16] also applied various
NN models to detect financial statement fraud with great success. Fanning and Cogger[22]
used NN (AutoNet) for detecting management fraud. The study offered an in-depth
examination of important publicly available predictors of fraudulent financial statements.
The study reinforced the efficiency of AutoNet in providing empirical evidence regarding the
merits of suggested red flags for fraudulent financial statements. Ramamoorti et al.[32]
provided an overview of the multilayer perceptron architecture and compared it with a
Delphi study.
They found that internal auditors could benefit from using NN for assessing risk. Zhang et
al.[35] conducted a review of the published papers that reported the use of NN in
forecasting during the time period 1988–98.
Aamodt and Plaza[15] and Kotsiantis et al.[29] used case based reasoning to identify the
fraudulent companies. Further, Deshmukh and Talluru[21] demonstrated the construction
of a rule-based fuzzy reasoning system to assess the risk of management fraud and
proposed an early warning system by finding out 15 rules related to the probability of
management fraud. Pacheco et al.[31] developed a hybrid intelligent system consisting of
NN and a fuzzy expert system to diagnose financial problems. Further, Magnusson et al.[30]
used text mining and demonstrated that the language of quarterly reports provided an
indication of the change in the company's financial status. A rule-based system that
consisted of too many if–then statements made it difficult for marketing researchers to
understand key drivers of consumer behaviour[25]. Variable selection was used in order to
choose a subset of the original predictive variables by eliminating variables that were either
redundant or possessed little predictive information.
Many researchers proposed rule extraction algorithms based on global optimization techniques like Genetic Algorithms (GA), Particle Swarm Optimization (PSO), Ant Colony optimization (ACO) and Differential Evolution (DE). Firstly, Mahfoud and Mani[5] used GA and extracted rules to predict the performance of individual stocks. Shin and Lee[6] extracted rules from GA for predicting bankruptcy of firms. Then, Parpinelli et al. [7] proposed Ant-Miner, which uses ACO for extracting classification rules. Later, Kim and Han[8] used GA in discovering the rules for predicting bankruptcy of firms. Sousa et al.[9] proposed Constricted PSO (CPSO) for rule mining. Thereafter, Liu et al.[10] proposed PSO based rule extraction method, where they proposed fitness function different from[9]. Ji et al.[11] improved the Ant-miner proposed[7]. Later, Zhao et al.[12] proposed Fuzzy-PSO, where the binary PSO generates fuzzy rules. Then, Holden and Freitas[13] hybridized PSO and ACO for discovering classification rules. Most recently, Su et al.[14] employed DE for rule extraction . Ravisankar et al.[40] used Classification and Regression Trees(C & RT) along with other techniques for determining fraud companies in the same Chinese Bank dataset . Naveen et al.[41] worked on Rule Extraction using firefly optimization and its applications to Banking .
4. PROPOSED METHODOLOGY
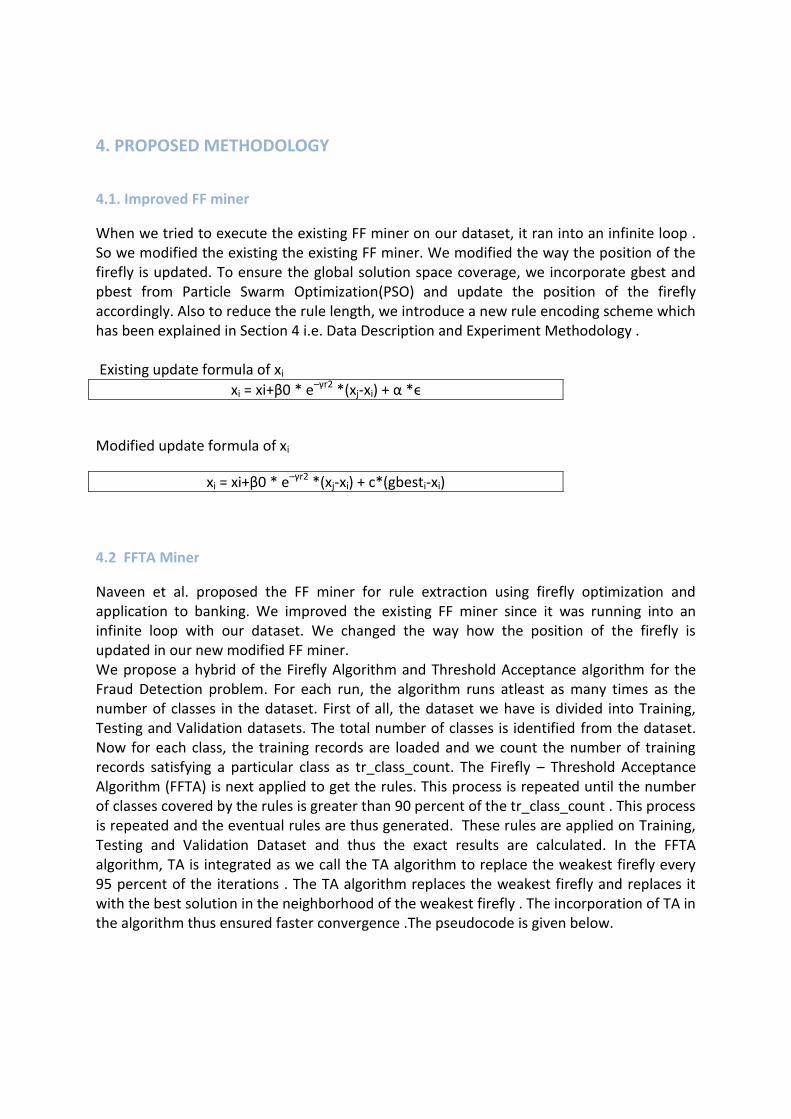
4.1. Improved FF miner
When we tried to execute the existing FF miner on our dataset, it ran into an infinite loop . So we modified the existing the existing FF miner. We modified the way the position of the firefly is updated. To ensure the global solution space coverage, we incorporate gbest and pbest from Particle Swarm Optimization(PSO) and update the position of the firefly accordingly. Also to reduce the rule length, we introduce a new rule encoding scheme which has been explained in Section 4 i.e. Data Description and Experiment Methodology . Existing update formula of xi
xi = xi+β0 * e–γr2 *(xj-xi) + α *ϵ
Modified update formula of xi
xi = xi+β0 * e–γr2 *(xj-xi) + c*(gbesti-xi)
4.2 FFTA Miner
Naveen et al. proposed the FF miner for rule extraction using firefly optimization and application to banking. We improved the existing FF miner since it was running into an infinite loop with our dataset. We changed the way how the position of the firefly is updated in our new modified FF miner. We propose a hybrid of the Firefly Algorithm and Threshold Acceptance algorithm for the Fraud Detection problem. For each run, the algorithm runs atleast as many times as the number of classes in the dataset. First of all, the dataset we have is divided into Training, Testing and Validation datasets. The total number of classes is identified from the dataset. Now for each class, the training records are loaded and we count the number of training records satisfying a particular class as tr_class_count. The Firefly – Threshold Acceptance Algorithm (FFTA) is next applied to get the rules. This process is repeated until the number of classes covered by the rules is greater than 90 percent of the tr_class_count . This process is repeated and the eventual rules are thus generated. These rules are applied on Training, Testing and Validation Dataset and thus the exact results are calculated. In the FFTA algorithm, TA is integrated as we call the TA algorithm to replace the weakest firefly every 95 percent of the iterations . The TA algorithm replaces the weakest firefly and replaces it with the best solution in the neighborhood of the weakest firefly . The incorporation of TA in the algorithm thus ensured faster convergence .The pseudocode is given below.
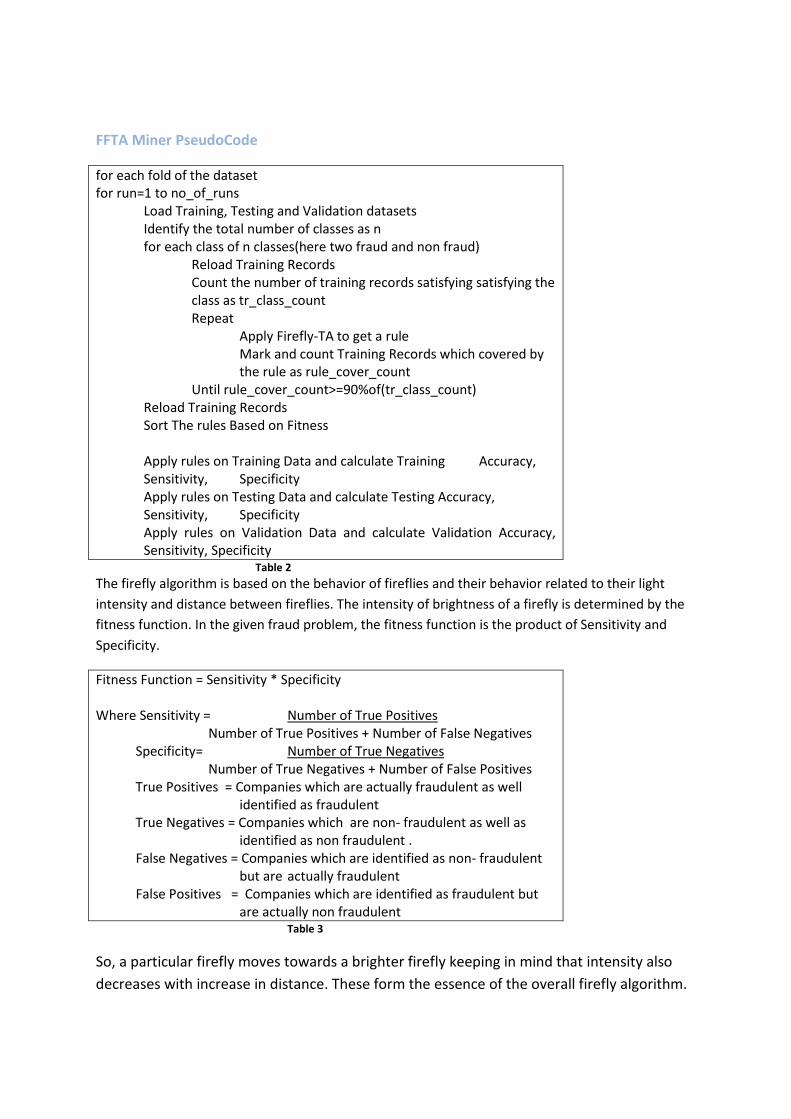
FFTA Miner PseudoCode
for each fold of the dataset for run=1 to no_of_runs Load Training, Testing and Validation datasets Identify the total number of classes as n for each class of n classes(here two fraud and non fraud) Reload Training Records Count the number of training records satisfying satisfying the class as tr_class_count Repeat Apply Firefly-TA to get a rule Mark and count Training Records which covered by the rule as rule_cover_count Until rule_cover_count>=90%of(tr_class_count) Reload Training Records Sort The rules Based on Fitness Apply rules on Training Data and calculate Training Accuracy, Sensitivity, Specificity Apply rules on Testing Data and calculate Testing Accuracy, Sensitivity, Specificity Apply rules on Validation Data and calculate Validation Accuracy, Sensitivity, Specificity Table 2
The firefly algorithm is based on the behavior of fireflies and their behavior related to their light
intensity and distance between fireflies. The intensity of brightness of a firefly is determined by the
fitness function. In the given fraud problem, the fitness function is the product of Sensitivity and
Specificity.
Fitness Function = Sensitivity * Specificity Where Sensitivity = Number of True Positives Number of True Positives + Number of False Negatives Specificity= Number of True Negatives Number of True Negatives + Number of False Positives True Positives = Companies which are actually fraudulent as well identified as fraudulent True Negatives = Companies which are non- fraudulent as well as identified as non fraudulent . False Negatives = Companies which are identified as non- fraudulent but are actually fraudulent False Positives = Companies which are identified as fraudulent but are actually non fraudulent Table 3
So, a particular firefly moves towards a brighter firefly keeping in mind that intensity also
decreases with increase in distance. These form the essence of the overall firefly algorithm.
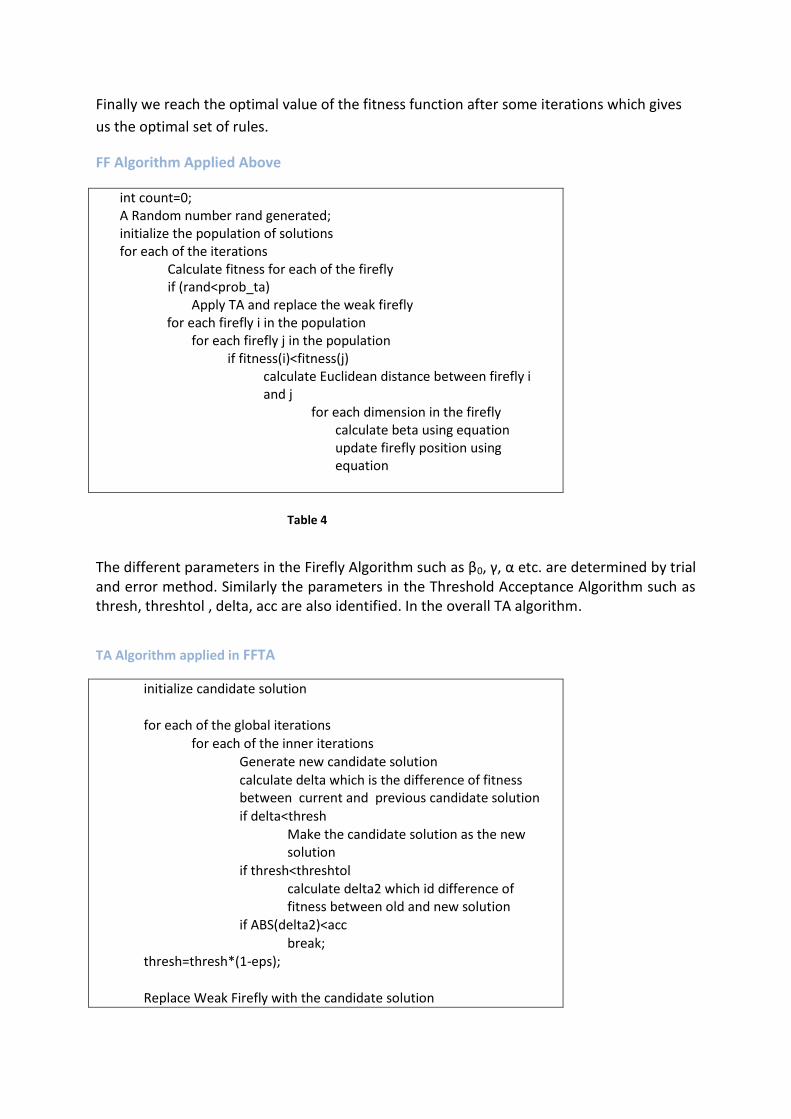
Finally we reach the optimal value of the fitness function after some iterations which gives
us the optimal set of rules.
FF Algorithm Applied Above
int count=0; A Random number rand generated; initialize the population of solutions for each of the iterations
Calculate fitness for each of the firefly if (rand<prob_ta)
Apply TA and replace the weak firefly for each firefly i in the population
for each firefly j in the population if fitness(i)<fitness(j)
calculate Euclidean distance between firefly i and j
for each dimension in the firefly calculate beta using equation update firefly position using equation
Table 4
The different parameters in the Firefly Algorithm such as β0, γ, α etc. are determined by trial and error method. Similarly the parameters in the Threshold Acceptance Algorithm such as thresh, threshtol , delta, acc are also identified. In the overall TA algorithm.
TA Algorithm applied in FFTA
initialize candidate solution for each of the global iterations
for each of the inner iterations Generate new candidate solution calculate delta which is the difference of fitness between current and previous candidate solution if delta<thresh Make the candidate solution as the new solution
if thresh<threshtol calculate delta2 which id difference of fitness between old and new solution
if ABS(delta2)<acc
break; thresh=thresh*(1-eps);
Replace Weak Firefly with the candidate solution
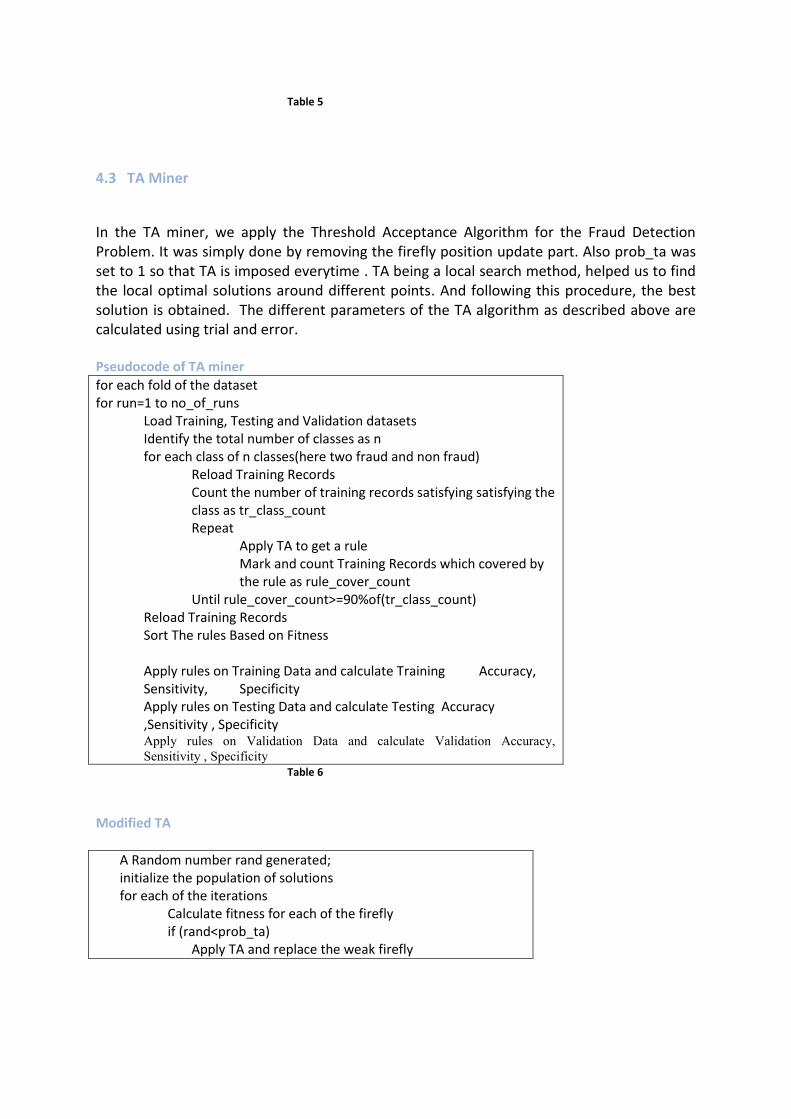
Table 5
4.3 TA Miner
In the TA miner, we apply the Threshold Acceptance Algorithm for the Fraud Detection Problem. It was simply done by removing the firefly position update part. Also prob_ta was set to 1 so that TA is imposed everytime . TA being a local search method, helped us to find the local optimal solutions around different points. And following this procedure, the best solution is obtained. The different parameters of the TA algorithm as described above are calculated using trial and error.
Pseudocode of TA miner
for each fold of the dataset for run=1 to no_of_runs Load Training, Testing and Validation datasets Identify the total number of classes as n for each class of n classes(here two fraud and non fraud) Reload Training Records Count the number of training records satisfying satisfying the class as tr_class_count Repeat Apply TA to get a rule Mark and count Training Records which covered by the rule as rule_cover_count Until rule_cover_count>=90%of(tr_class_count) Reload Training Records Sort The rules Based on Fitness Apply rules on Training Data and calculate Training Accuracy, Sensitivity, Specificity Apply rules on Testing Data and calculate Testing Accuracy ,Sensitivity , Specificity Apply rules on Validation Data and calculate Validation Accuracy,
Sensitivity , Specificity
Table 6
Modified TA
A Random number rand generated; initialize the population of solutions for each of the iterations
Calculate fitness for each of the firefly if (rand<prob_ta)
Apply TA and replace the weak firefly
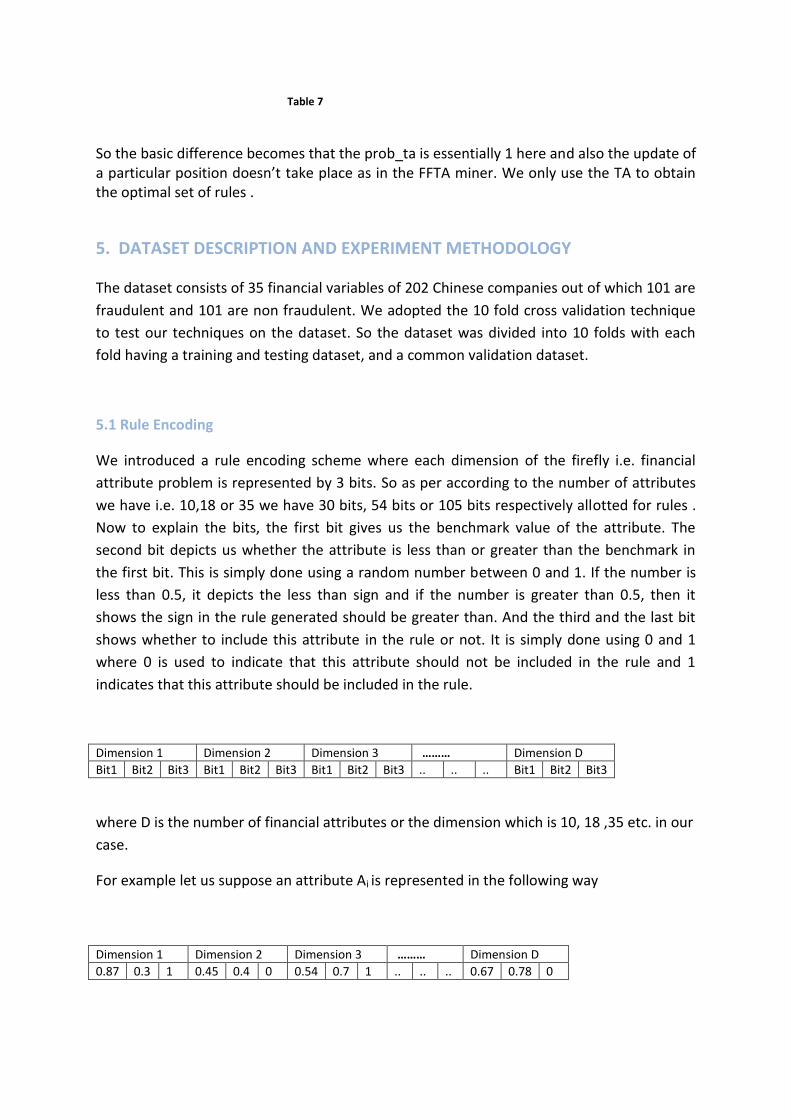
Table 7
So the basic difference becomes that the prob_ta is essentially 1 here and also the update of a particular position doesn’t take place as in the FFTA miner. We only use the TA to obtain the optimal set of rules .
5. DATASET DESCRIPTION AND EXPERIMENT METHODOLOGY
The dataset consists of 35 financial variables of 202 Chinese companies out of which 101 are
fraudulent and 101 are non fraudulent. We adopted the 10 fold cross validation technique
to test our techniques on the dataset. So the dataset was divided into 10 folds with each
fold having a training and testing dataset, and a common validation dataset.
5.1 Rule Encoding
We introduced a rule encoding scheme where each dimension of the firefly i.e. financial
attribute problem is represented by 3 bits. So as per according to the number of attributes
we have i.e. 10,18 or 35 we have 30 bits, 54 bits or 105 bits respectively allotted for rules .
Now to explain the bits, the first bit gives us the benchmark value of the attribute. The
second bit depicts us whether the attribute is less than or greater than the benchmark in
the first bit. This is simply done using a random number between 0 and 1. If the number is
less than 0.5, it depicts the less than sign and if the number is greater than 0.5, then it
shows the sign in the rule generated should be greater than. And the third and the last bit
shows whether to include this attribute in the rule or not. It is simply done using 0 and 1
where 0 is used to indicate that this attribute should not be included in the rule and 1
indicates that this attribute should be included in the rule.
Dimension 1 Dimension 2 Dimension 3 ……… Dimension D
Bit1 Bit2 Bit3 Bit1 Bit2 Bit3 Bit1 Bit2 Bit3 .. .. .. Bit1 Bit2 Bit3
where D is the number of financial attributes or the dimension which is 10, 18 ,35 etc. in our
case.
For example let us suppose an attribute Ai is represented in the following way
Dimension 1 Dimension 2 Dimension 3 ……… Dimension D
0.87 0.3 1 0.45 0.4 0 0.54 0.7 1 .. .. .. 0.67 0.78 0
This means that the corresponding part in the rule with this attribute is
If Attribute 1 < 0.87 and Attribute 3 > 0.57 then belong to a particular class
The dataset involves the Firefly and Threshold Acceptance Algorithms which are
probabilistic and thus involve a random seed. Due to this randomness, the results might
vary slightly for different runs of the algorithm .So, to get a better idea out of the results ,
we have 20 runs for each fold of the dataset and the average is calculated with these results
. So we have 20*10 i.e. 200 runs of each algorithm to get the complete details of the effect
of our algorithm on a particular dataset. Also we started with 35 features initially. However
to check our algorithm on a less feature dataset, we applied t-statistic method and found
out the top 18 and the top 10 features out of the given 35 features. So, finally, the 3
algorithms (FF, FFTA and TA) were run on the dataset with 35, 18 and 10 features.
6 RESULTS AND DISCUSSION
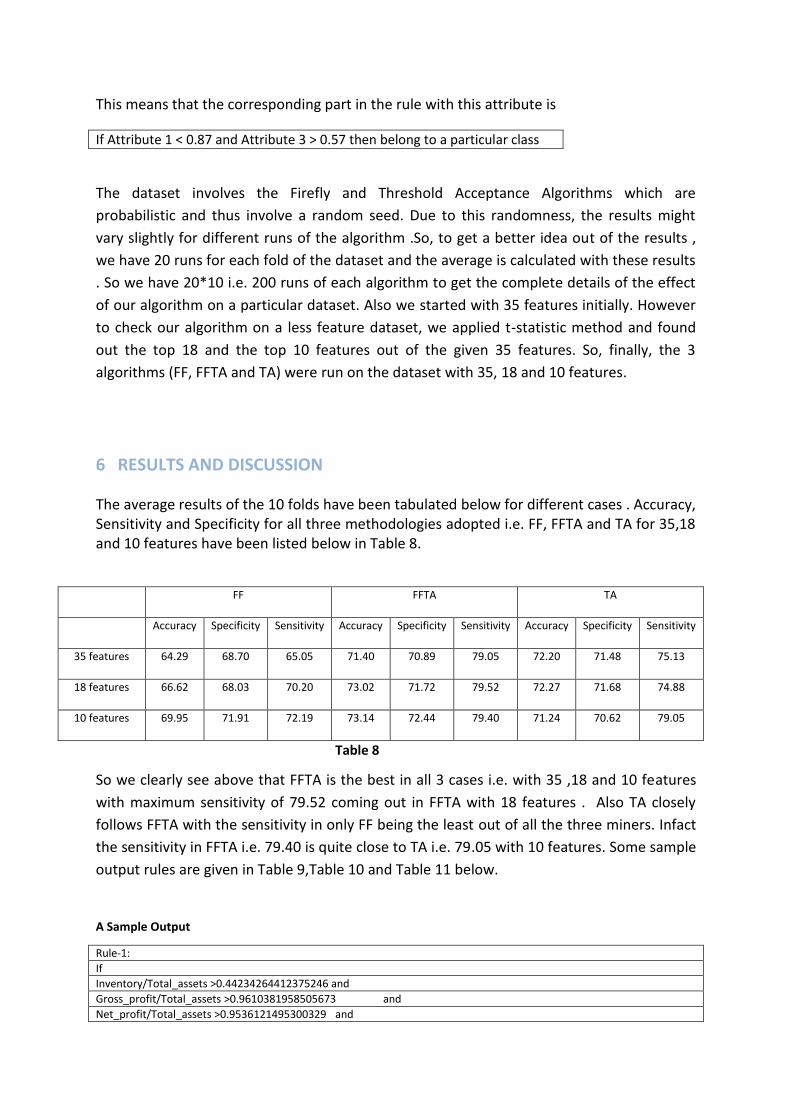
The average results of the 10 folds have been tabulated below for different cases . Accuracy, Sensitivity and Specificity for all three methodologies adopted i.e. FF, FFTA and TA for 35,18 and 10 features have been listed below in Table 8.
FF FFTA TA
Accuracy Specificity Sensitivity Accuracy Specificity Sensitivity Accuracy Specificity Sensitivity
35 features 64.29 68.70 65.05 71.40 70.89 79.05 72.20 71.48 75.13
18 features 66.62 68.03 70.20 73.02 71.72 79.52 72.27 71.68 74.88
10 features 69.95 71.91 72.19 73.14 72.44 79.40 71.24 70.62 79.05
Table 8
So we clearly see above that FFTA is the best in all 3 cases i.e. with 35 ,18 and 10 features
with maximum sensitivity of 79.52 coming out in FFTA with 18 features . Also TA closely
follows FFTA with the sensitivity in only FF being the least out of all the three miners. Infact
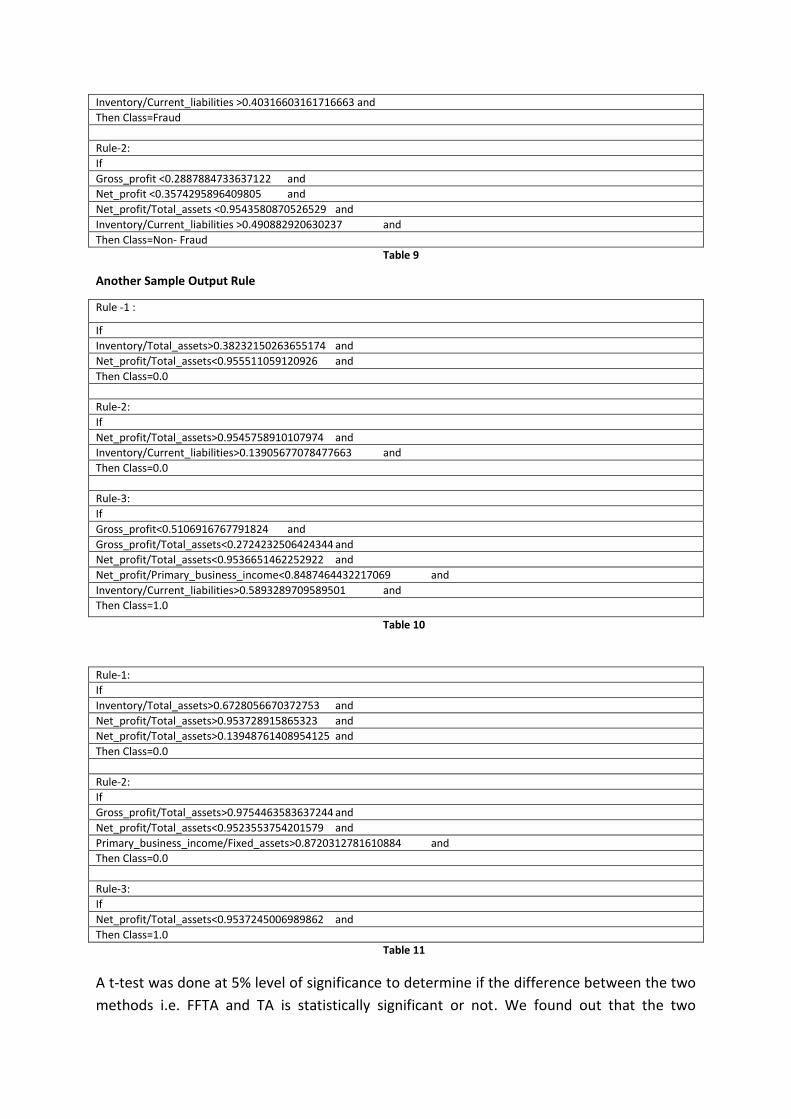
the sensitivity in FFTA i.e. 79.40 is quite close to TA i.e. 79.05 with 10 features. Some sample
output rules are given in Table 9,Table 10 and Table 11 below.
A Sample Output
Rule-1:
If
Inventory/Total_assets >0.44234264412375246 and
Gross_profit/Total_assets >0.9610381958505673 and
Net_profit/Total_assets >0.9536121495300329 and
Inventory/Current_liabilities >0.40316603161716663 and
Then Class=Fraud
Rule-2:
If
Gross_profit <0.2887884733637122 and
Net_profit <0.3574295896409805 and
Net_profit/Total_assets <0.9543580870526529 and
Inventory/Current_liabilities >0.490882920630237 and
Then Class=Non- Fraud
Table 9
Another Sample Output Rule
Rule -1 :
If
Inventory/Total_assets>0.38232150263655174 and
Net_profit/Total_assets<0.955511059120926 and
Then Class=0.0
Rule-2:
If
Net_profit/Total_assets>0.9545758910107974 and
Inventory/Current_liabilities>0.13905677078477663 and
Then Class=0.0
Rule-3:
If
Gross_profit<0.5106916767791824 and
Gross_profit/Total_assets<0.2724232506424344 and
Net_profit/Total_assets<0.9536651462252922 and
Net_profit/Primary_business_income<0.8487464432217069 and
Inventory/Current_liabilities>0.5893289709589501 and
Then Class=1.0
Table 10
Rule-1:
If
Inventory/Total_assets>0.6728056670372753 and
Net_profit/Total_assets>0.953728915865323 and
Net_profit/Total_assets>0.13948761408954125 and
Then Class=0.0
Rule-2:
If
Gross_profit/Total_assets>0.9754463583637244 and
Net_profit/Total_assets<0.9523553754201579 and
Primary_business_income/Fixed_assets>0.8720312781610884 and
Then Class=0.0
Rule-3:
If
Net_profit/Total_assets<0.9537245006989862 and
Then Class=1.0
Table 11
A t-test was done at 5% level of significance to determine if the difference between the two
methods i.e. FFTA and TA is statistically significant or not. We found out that the two
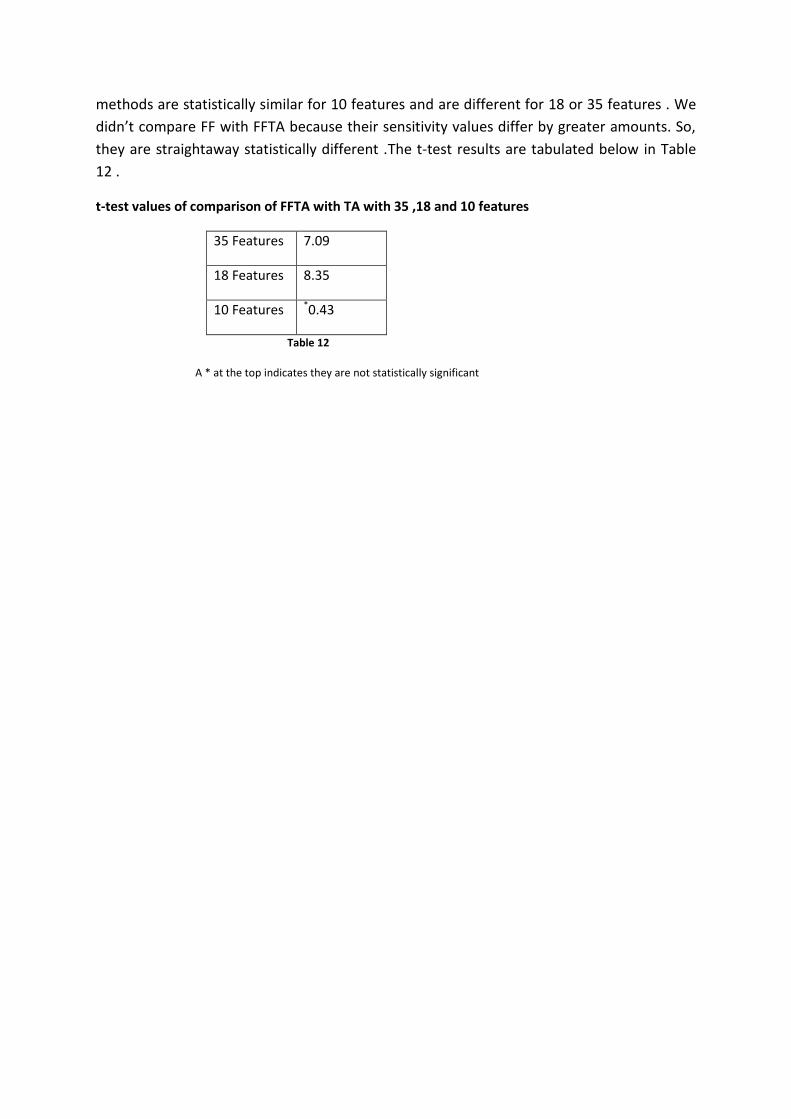
methods are statistically similar for 10 features and are different for 18 or 35 features . We
didn’t compare FF with FFTA because their sensitivity values differ by greater amounts. So,
they are straightaway statistically different .The t-test results are tabulated below in Table
12 .
t-test values of comparison of FFTA with TA with 35 ,18 and 10 features
35 Features 7.09
18 Features 8.35
10 Features *0.43
Table 12
A * at the top indicates they are not statistically significant
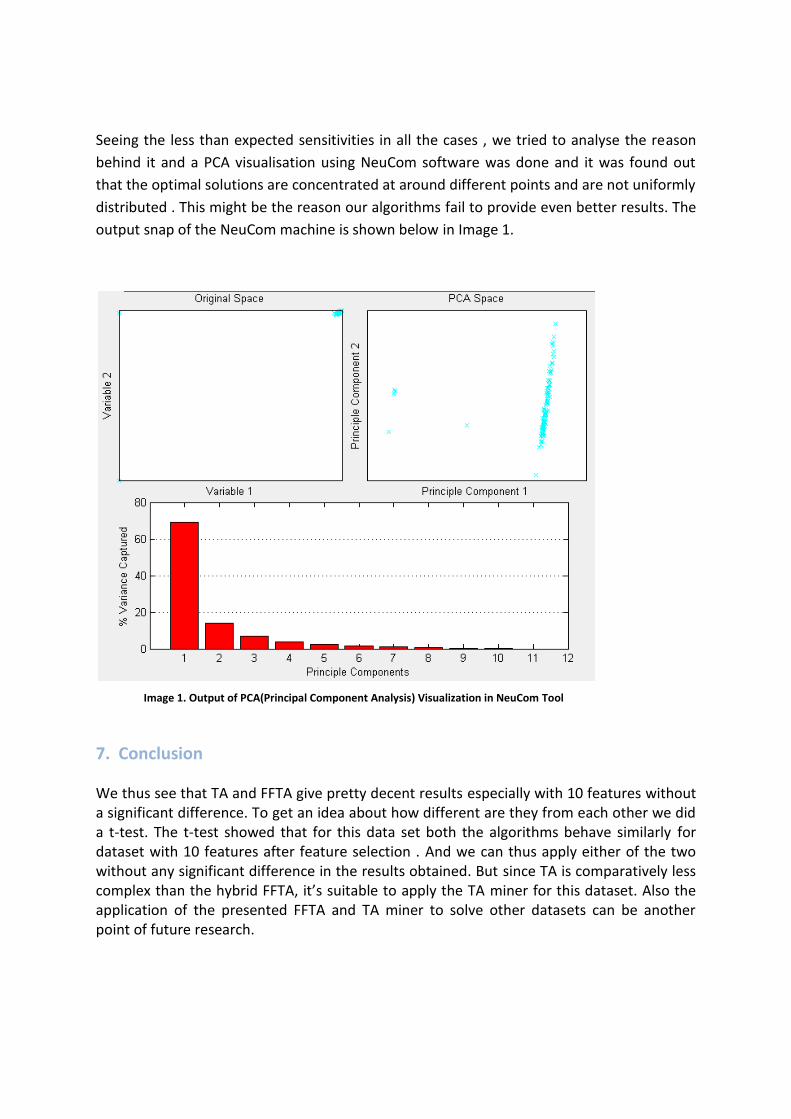
Seeing the less than expected sensitivities in all the cases , we tried to analyse the reason
behind it and a PCA visualisation using NeuCom software was done and it was found out
that the optimal solutions are concentrated at around different points and are not uniformly
distributed . This might be the reason our algorithms fail to provide even better results. The
output snap of the NeuCom machine is shown below in Image 1.
Image 1. Output of PCA(Principal Component Analysis) Visualization in NeuCom Tool
7. Conclusion
We thus see that TA and FFTA give pretty decent results especially with 10 features without a significant difference. To get an idea about how different are they from each other we did a t-test. The t-test showed that for this data set both the algorithms behave similarly for dataset with 10 features after feature selection . And we can thus apply either of the two without any significant difference in the results obtained. But since TA is comparatively less complex than the hybrid FFTA, it’s suitable to apply the TA miner for this dataset. Also the application of the presented FFTA and TA miner to solve other datasets can be another point of future research.
8 REFERENCES
[1] X-S. Yang, “Firefly algorithms for multimodal optimization”, In Proceedings of the 5th international conference on Stochastic algorithms: foundations and applications (SAGA'09), Osamu Watanabe and Thomas Zeugmann (Eds.). Springer-Verlag, Berlin, Heidelberg, 169-178, 2009.
[2] X-S. Yang, “Firefly Algorithm, Stochastic test functions and design optimization”, International Journal of Bio-Inspired Computation, Vol.2, No.2, pp.78-84, 2010.
[3] Dueck G., Scheur T.: Threshold Accepting: A General Purpose Optimization Algorithm appearing
Superior to Simulated Annealing. Journal of Computational Physics, 1990, 90, pp. 161–175.
[4] J. R. Quinlan, “Induction of decision trees”, Machine Learning, Vol.1, pp.81–106, 1986.
[5] S. Mahfoud and G. Mani, “Financial forecasting using genetic algorithms”, Applied Artificial Intelligence, Vol.10 pp.543- 565, 1996.
[6] K-S. Shin, Y-J. Lee, (2002) “A genetic algorithm application in bankruptcy prediction modeling”, Expert Systems with Applications, Vol.23, No.3, pp.321–328, 2002.
[7] R. S. Parpinelli, H. S. Lopes and A. A. Frietas, “Data Mining with an Ant Colony Optimization Algorithm”, in IEEE trans. on evol. Comp., vol. 6, no.4, pp.321-332, 2002.
[8] M-J. Kim and I. Han, “The discovery of experts’ decision rules from qualitative bankruptcy data using genetic algorithms”, Expert Systems with Applications, Vol. 25, pp.637–646, 2003.
[9] T. Sousa, A. Neves, and A. Silva, “A particle swarm data miner”, 11th Portuguese Conf. Artificial Intelligence, Workshop on Artificial Life and Evolutionary Algorithms, pp.43–53, 2003.
[10] Y. Liu, Z. Qin, Z. Shi and J. Chen, “Rule discovery with particle swarm optimization”, Advanced Workshop on Content Computing, vol. 3309, pp. 291–296, 2004.
[11] J. Ji, N. Zhang, C. Liu and N. Zhong, “An ant colony optimization algorithm for learning classification rules”, in Proc. IEEE/WIC , pp. 1034–1037, 2006.
[12] X. Zhao, J. Zeng, Y. Gao and Y. Yang, “Particle swarm algorithm for classification rules generation”, Proc. of the Intelligent Systems Design and Applications, IEEE, pp. 957–962, 2006.
[13] N. Holden and A. A. Frietas “A Hybrid PSO/ACO Algorithm for Classification”, in Proc. Genetic and evol. computation conf., pp. 2745–2750, 2007.
[14] H. Su, Y. Yang and L. Zha ,“Classification rule discovery with DE/QDE algorithm”, Expert Systems with Applications, vol.37, No.2, 2010.
[15] Aamodt, E. Plaza, Case-based reasoning: foundational issues, methodological variations, and system approaches, Artificial Intelligence Communications 7 (1)
(1994) 39–59. [16] R.C. Brooks, Neural networks: a new technology, The CPA Journal Online, http://
www.nysscpa.org/cpajournal/old/15328449.htm1994. [17] B. Busta, R. Weinberg, Using Benford's law and neural networks as a review
procedure, Managerial Auditing Journal 13 (6) (1998) 356–366. [18] T.G. Calderon, J.J. Cheh, A roadmap for future neural networks research in auditing
and risk assessment, International Journal of Accounting Information Systems 3 (4) (2002) 203–236.
[19] M. Cecchini, H. Aytug, G.J. Koehler, and P. Pathak. Detecting Management Fraud in Public Companies. http://warrington.ufl.edu/isom/docs/papers/ DetectingManagementFraudInPublicCompanies.pdf
[20] M.J. Cerullo, V. Cerullo, Using neural networks to predict financial reporting fraud: Part 1, Computer Fraud & Security 5 (1999) 14–17.
[21] A. Deshmukh, L. Talluru, A rule-based fuzzy reasoning system for assessing the risk of management fraud, International Journal of Intelligent Systems in Accounting, Finance & Management 7 (4) (1998) 223–241.
[22] K.M. Fanning, K.O. Cogger, Neural network detection of management fraud using published financial data, International Journal of Intelligent Systems in Accounting, Finance, and Management 7 (1) (1998) 21–41
[23] E.H. Feroz, T.M. Kwon, V. Pastena, K.J. Park, The efficacy of red flags in predicting
the SEC's targets: an artificial neural networks approach, International Journal of Intelligent Systems in Accounting, Finance, and Management 9 (3) (2000) 145–157.
[24] S.-M. Huang, D.C. Yen, L.-W. Yang, J.-S. Hua, An investigation of Zipf's Law for fraud detection, Decision Support Systems 46 (1) (2008) 70–83.
[25] Y. Kim, Toward a successful CRM: variable selection, sampling, and ensemble, Decision Support Systems 41 (2) (2006) 542–553.
[26] E. Kirkos, C. Spathis, Y. Manolopoulos, Data mining techniques for the detection of fraudulent financial statement, Expert Systems with Applications 32 (2007) 995–1003.
[27] E. Koskivaara, Different pre-processing models for financial accounts when using neural networks for auditing, Proceedings of the 8th European Conference on Information Systems, vol. 1, 2000, pp. 326–3328, Vienna, Austria.
[28] E. Koskivaara, Artificial neural networks in auditing: state of the art, The ICFAI Journal of Audit Practice 1 (4) (2004) 12–33.
[29] S. Kotsiantis, E. Koumanakos, D. Tzelepis, V. Tampakas, Forecasting fraudulent financial statements using data mining, International Journal of Computational Intelligence 3 (2) (2006) 104–110.
[30] C. Magnusson, A. Arppe, T. Eklund, B. Back, H. Vanharanta, A. Visa, The language of quarterly reports as an indicator of change in the company's financial status, Information & Management 42 (4) (2005) 561–574.
[31] R. Pacheco, A. Martins, R.M. Barcia, S. Khator, A hybrid intelligent system applied to financial statement analysis, Proceedings of the 5th IEEE conference on Fuzzy Systems, vol. 2, 1996, pp. 1007–10128, New Orleans, LA, USA.
[32] S. Ramamoorti, A.D. Bailey Jr., R.O. Traver, Risk assessment in internal auditing: a neural network approach, International Journal of Intelligent Systems in Accounting, Finance & Management 8 (3) (1999) 159–180.
[33] J.E. Sohl, A.R. Venkatachalam, A neural network approach to forecasting model selection, Information & Management 29 (6) (1995) 297–303.
[34] C. Spathis, M. Doumpos, C. Zopounidis, Detecting falsified financial statements: a comparative study using multicriteria analysis and multivariate statistical techniques, European Accounting Review 11 (3) (2002) 509–535.
[35] G. Zhang, B.E. Patuwo, M.Y. Hu, Forecasting with artificial neural networks: the state of the art, International Journal of Forecasting 14 (1) (1998) 35–62.
[36] http://www.accounting-degree.org/scandals/
[37] http://en.wikipedia.org/wiki/Accounting_scandals
[38] http://en.wikipedia.org/wiki/Satyam_scandal
[39] Neucom, http://www.aut.ac.nz/research/research-institutes/kedri/research-centres/ centre-for-data-mining-and-decision-support-systems/neucom-project-homepage# download.
[40] P. Ravisankar , V. Ravi , G. Raghava Rao, I. Bose,Detection of financial statement fraud and feature selection using data mining techniques, Decision Support Systems(2010)
[41] Nekuri Naveen, V. Ravi, C. Raghavendra Rao, K. N. V. D. Sarath , Rule Extraction Using Firefly Optimization: Application to Banking