Embed Size (px)
Citation preview
FRASERINST I TUTE
2018
Ashley Stedman and Kenneth P. Green
Fraser Institute Annual
SURVEY OF MINING COMPANIES 2017
ii • Fraser Institute Annual Survey of Mining Companies 2017
fraserinstitute.org
fraserinstitute.org
Table of Contents
Survey information iv
Executive Summary—2017 Mining Survey 1
Survey Methodology 3
Summary Indexes 8
Global Survey Rankings 23
Global Results 25
Overview 48
Acknowledgments 65
About the Authors 66
Publishing Information 67
Supporting the Fraser Institute 68
Purpose, Funding, and Independence 68
About the Fraser Institute 69
Editorial Advisory Board 70
fraserinstitute.org
Survey Information
The Fraser Institute Annual Survey of Mining Companies was sent to approximately 2,700 exploration, development, and other mining-related companies around the world. The survey was conducted from August 22nd to November 10th, 2017. The companies that participated in the survey reported exploration spending of US$2.3 billion in 2017 and US$1.9 billion in 2016.
fraserinstitute.org
Executive Summary
2017 Mining Survey
This report presents the results of the Fraser Institute’s 2017 annual survey of mining and exploration companies. The survey is an attempt to assess how mineral endowments and public policy factors such as taxation and regulatory uncertainty affect exploration investment. The survey was circulated electronically to approximately 2,700 individuals between August 22nd and November 10th, 2017. Survey responses have been tallied to rank provinces, states, and countries according to the extent that public policy factors encourage or discourage mining investment.
We received a total of 360 responses for the survey, providing sufficient data to evaluate 91 jurisdictions. By way of comparison, 104 jurisdictions were evaluated in 2016, 109 in 2015, 122 in 2014, and 112 in 2013. The number of jurisdictions that can be included in the study tends to wax and wane as the mining sector grows or shrinks due to commodity prices and sectoral factors.
The Investment Attractiveness Index takes both mineral and policy perception into consideration
An overall Investment Attractiveness Index is constructed by combining the Best Practices Mineral Potential index, which rates regions based on their geologic attractiveness, and the Policy Perception Index, a composite index that measures the effects of government policy on attitudes toward exploration investment. While it is useful to measure the attractiveness of a jurisdiction based on policy factors such as onerous regulations, taxation levels, the quality of infrastructure, and the other policy related questions that respondents answered, the Policy Perception Index alone does not recognize the fact that investment decisions are often sizably based on the pure mineral potential of a jurisdiction. Indeed, as discussed below, respondents consistently indicate that approximately 40 percent of their investment decision is determined by policy factors.
The top
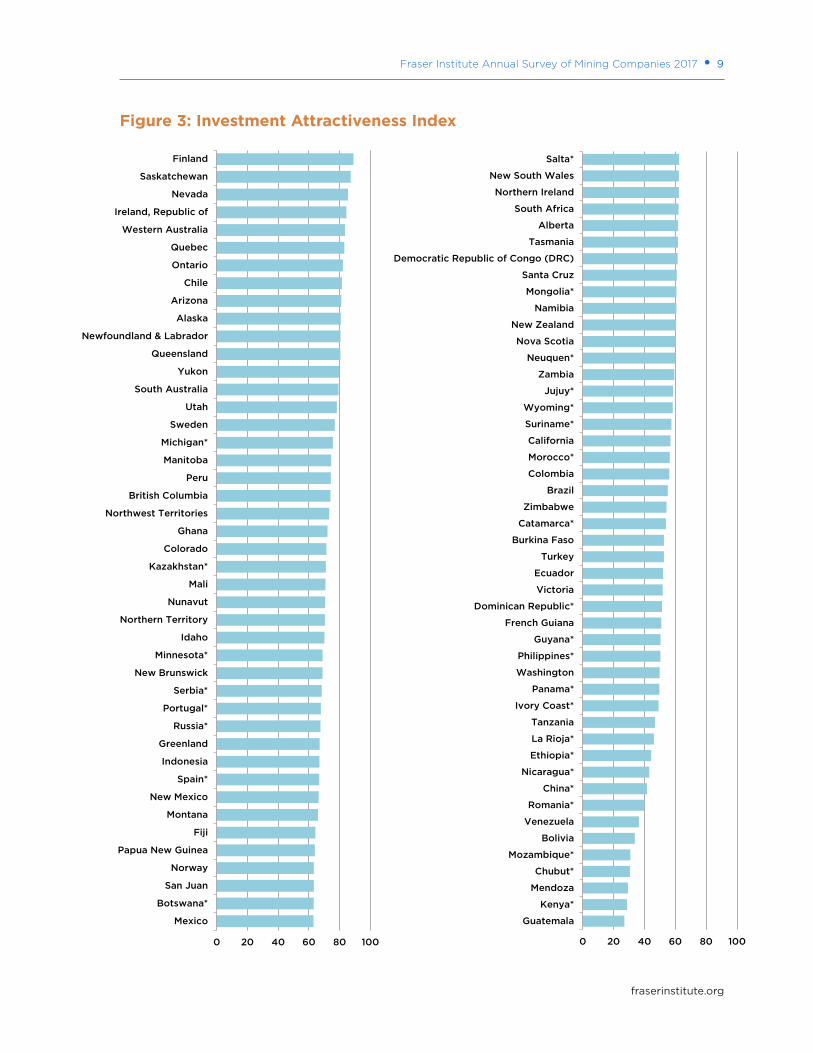
The top jurisdiction in the world for investment based on the Investment Attractiveness Index is Finland, which moved up from 5th place in 2016. Saskatchewan experienced a slight drop in its score
2 • Fraser Institute Annual Survey of Mining Companies 2017
fraserinstitute.org
in 2017 so dropped into second place after ranking first in the previous year. Nevada moved up from 4th in 2016 to 3rd in 2017. The Republic of Ireland ranked 4th this year, and Western Australia dropped from 3rd in 2016 to 5th in 2017. Rounding out the top 10 are Quebec, Ontario, Chile, Arizona, and Alaska.
The bottom
When considering both policy and mineral potential in the Investment Attractiveness Index, Guatemala ranks as the least attractive jurisdiction in the world for investment. This year, Guatemala replaced the Argentinian province of Jujuy as the least attractive jurisdiction in the world. Also in the bottom 10 (beginning with the worst) are Kenya, Mendoza, Chubut, Mozambique, Bolivia, Venezuela, Romania, China, and Nicaragua.
Policy Perception Index: A “report card” to governments on the attractiveness of their mining policies
While geologic and economic considerations are important factors in mineral exploration, a region’s policy climate is also an important investment consideration. The Policy Perception Index (PPI), is a composite index that measures the overall policy attractiveness of the 91 jurisdictions in the survey. The index is composed of survey responses to policy factors that affect investment decisions. Policy factors examined include uncertainty concerning the administration of current regulations, environmental regulations, regulatory duplication, the legal system and taxation regime, uncertainty concerning protected areas and disputed land claims, infrastructure, socioeconomic and community development conditions, trade barriers, political stability, labor regulations, quality of the geological database, security, and labor and skills availability.
The top
For the fifth year in a row, the Republic of Ireland had the highest PPI score of 100. Ireland was followed by Finland in second, which moved up from 4th in the previous year. Along with Ireland and Finland the top 10 ranked jurisdictions are Saskatchewan, Sweden, Nevada, Northern Ireland, Michigan, Wyoming, Quebec, and Newfoundland and Labrador.
The bottom
The 10 least attractive jurisdictions for investment based on the PPI rankings are (starting with the worst) Venezuela, Chubut, Zimbabwe, Guatemala, Democratic Republic of Congo (DRC), China, Philippines, Indonesia, Bolivia, and Ecuador. Venezuela, Chubut, Zimbabwe, Philippines, Indonesia, and Ecuador were all in the bottom 10 jurisdictions last year.
fraserinstitute.org
Survey Methodology
Survey background
The mining industry is an important contributor both to Canada’s economy and to economies around the world. It provides not only materials essential for all sectors of the economy, but also employment and government revenues. Mining contributes to economic growth worldwide and Canadian mining companies operate in jurisdictions around the world. While mineral potential is obviously a very important consideration in encouraging or dissuading mining investment, the impact of government policies can also be significant in encouraging or discouraging investment in this important area of economic activity. Moreover, many regions around the world have attractive geology and competitive policies, allowing exploration investment to be shifted away from jurisdictions with unattractive policies.
Since 1997, the Fraser Institute has conducted an annual survey of mining and exploration companies to assess how mineral endowments and public policy factors such as taxation and regulation affect exploration investment. Our purpose is to create a “report card” that governments can use to improve their mining-related public policy in order to attract investment in their mining sector to better their economic productivity and employment. Others in the mining sector, investment sector, academia, and the media also may find the survey useful for evaluating potential investment decisions, or for assessing various risk factors in jurisdictions of interest.1
This year the survey includes 91 jurisdictions from all continents except Antarctica. The 2017 questionnaire included a number of jurisdictions that had insufficient responses to enable them to be included in the report. The minimum threshold for inclusion this year was five responses. Jurisdictions with between 5 and 9 responses were included, but have been noted accordingly. Any jurisdiction with fewer than 5 responses was dropped. This year’s dropped jurisdictions include Afghanistan, Albania, Angola, Argentina: Rio Negro, Armenia, Belarus, Bulgaria, Burundi, Cambodia, Central African Republic, Egypt, Eritrea, Estonia, France, Gabon, Greece, Guinea (Conakry), Honduras, Hungary, India, Iraq, Israel, Jordan, Kyrgyzstan, Laos, Lesotho, Liberia, Madagascar,
1 While we would prefer to directly measure the impacts of specific mining policy changes on investment in the sector, there are many barriers to doing so. The effects of policy on deterring exploration investment may not be immediately apparent due to the lag time between when policy changes are implemented and when economic activity is impeded and job losses occur.
4 • Fraser Institute Annual Survey of Mining Companies 2017
fraserinstitute.org
Malawi, Malaysia, Mauritania, Myanmar, New Caledonia, Niger, Nigeria, Oman, Pakistan, Poland, Republic of the Congo (Brazzaville), Saudi Arabia, Senegal, Sierra Leone, Slovakia, Solomon Islands, South Sudan, Sudan, Swaziland, Tajikistan, Thailand, Tunisia, Uganda, Uruguay, and Vietnam.
Jurisdictions are added to the survey based on interest from survey respondents, and their inclusion fluctuates based on a variety of factors such as industry turnover, industry downturns, and the movement of mining investment into jurisdictions seen as more attractive. This survey is published annually and the results are available and accessible to an increasingly global audience. In the past, detailed tables were included in an appendix showing the breakdown of scores on each question for each individual jurisdiction. Those tables are now available online at https://www.fraserinstitute.org/categories/mining.
The Fraser Institute’s mining survey is an informal survey that attempts to assess the perceptions of mining company executives about various optimal and sub-optimal public policies that might affect the hospitality of a jurisdiction to mining investment. Given the survey’s very broad circulation, its extensive press coverage, and the positive feedback we receive from miners, investors, and policymakers about its usefulness, we believe that the survey broadly captures the perceptions of those involved in both mining and the regulation of mining for the jurisdictions included.
Sample design
The survey is designed to identify the provinces, states, and countries that have the most attractive policies for encouraging investment in mining exploration. Jurisdictions that investors assess as relatively unattractive may therefore be prompted to consider reforms that would improve their ranking. Presumably mining companies use the information provided to corroborate their own assessments and to identify jurisdictions where the business conditions and regulatory environment are most attractive for investment. The survey results are also a useful source of information for the media, providing independent information as to how particular jurisdictions compare.
The 2017 survey was distributed to approximately 2,700 managers and executives around the world in companies involved in mining exploration, development, and other related activities. The names of potential respondents were compiled from commercially available lists, publicly available membership lists of trade associations, and other sources. Several mining associations also helped publicize the survey.
The survey was conducted from August 22nd to November 10th, 2017. We received a total of 360 responses from individuals, of whom 318 completed the full survey and 42 completed part of the survey. As figure 1 illustrates, over half of the respondents (55 percent) are either the company president or vice-president, and a further 25 percent are either managers or senior managers. The companies that participated in the survey reported exploration spending of US$2.3 billion in 2017

Fraser Institute Annual Survey of Mining Companies 2017 • 5
fraserinstitute.org
Figure 1: The Position Survey Respondents Hold in Their Company, 2017
Figure 2: Company Focus as Indicated by Respondents, 2017
Company president39%
Vice president16%
Manager17%
Other Senior Management8%
Consultant9%
Other 11%
An exploration company47%
A producer company with less than US$50M
9%
A producer company with more than US$50M
20%
A consulting company15%
Other 9%
6 • Fraser Institute Annual Survey of Mining Companies 2017
fraserinstitute.org
and US$1.9 billion in 2016. This represents a decrease from the 2016 Survey of Mining Companies, which reported exploration spending of US$2.7 billion in 2016 and US$3.2 billion in 2015, and is likely due to persistently low commodity prices and ongoing challenges in attracting investment to the sector.
Figure 2 shows that just under half of the 2017 survey respondents represent an exploration company. Twenty-nine percent of the respondents represent producer companies, and the final 24 percent is made up of consulting and other companies.
Survey questionnaire
The survey is designed to capture the opinions of managers and executives about the level of investment barriers in jurisdictions with which their companies are familiar. Respondents are asked to indicate how each of the 15 policy factors below influenced company decisions to invest in various jurisdictions.
1 Uncertainty concerning the administration, interpretation, or enforcement of existing regulations;
2 Uncertainty concerning environmental regulations (stability of regulations, consistency and timeliness of regulatory process , regulations not based on science);
3 Regulatory duplication and inconsistencies (includes federal/provincial, federal/state, inter-departmental overlap, etc.);
4 Legal system (legal processes that are fair, transparent, non-corrupt, timely, efficiently administered, etc.)
5 Taxation regime (includes personal, corporate, payroll, capital, and other taxes, and complexity of tax compliance);
6 Uncertainty concerning disputed land claims;
7 Uncertainty concerning what areas will be protected as wilderness, parks, or archeological sites, etc.;
8 Infrastructure (includes access to roads, power availability, etc.);
9 Socioeconomic agreements/community development conditions (includes local purchasing or processing requirements, or supplying social infrastructure such as schools or hospitals, etc.);
10 Trade barriers (tariff and non-tariff barriers, restrictions on profit repatriation, currency restrictions, etc.);
11 Political stability;
Fraser Institute Annual Survey of Mining Companies 2017 • 7
fraserinstitute.org
12 Labor regulations/employment agreements and labor militancy/work disruptions;
13 Quality of the geological database (includes quality and scale of maps, ease of access to information, etc.);
14 Level of security (includes physical security due to the threat of attack by terrorists, criminals, guerrilla groups, etc.);
15 Availability of labor/skills.
Respondents were asked to score only jurisdictions with which they were familiar and only on those policy factors with which they were familiar. The 15 policy questions were unchanged from the 2013 survey. However, two questions that had been included—on the level of corruption (or honesty) and on growing (or lessening) uncertainty in mining policy and implementation—were dropped in 2013 in response to complaints from previous years’ respondents that the survey had become onerously lengthy. Also, those questions were seen to be redundant, or overlap heavily with other questions. For each of the 15 factors, respondents were asked to select one of the following five responses that best described each jurisdiction with which they were familiar:
1 Encourages exploration investment
2 Not a deterrent to exploration investment
3 Is a mild deterrent to exploration investment
4 Is a strong deterrent to exploration investment
5 Would not pursue exploration investment in this region due to this factor
The survey also included questions about the respondents and the type of company they represented, regulatory “horror stories,” examples of “exemplary policy,” mineral potential assuming current regulation and land use restrictions, mineral potential assuming a “best practices” regulatory environment, the weighting of mineral versus policy factors in investment decisions, and investment spending.
fraserinstitute.org
Summary Indicies
Investment Attractiveness Index
The Investment Attractiveness Index (table 1and figure 3) is a composite index that combines both the Policy Perception Index (PPI) and results from the Best Practices Mineral Potential Index.2 While it is useful to measure the attractiveness of a jurisdiction based on policy factors such as onerous regulations, taxation levels, the quality of infrastructure, and the other policy related questions that respondents answered, the Policy Perception Index alone does not recognize the fact that investment decisions are often sizably based on the pure mineral potential of a jurisdiction. Indeed, as will be discussed below, respondents consistently indicate that while 40 percent of their investment decision is determined by policy factors, 60 percent is based on their assessment of a jurisdiction’s mineral potential. To get a true sense of which global jurisdictions are attracting investment, both mineral potential and policy perception must be considered.
This year, as in other years, the index was weighted 40 percent by policy and 60 percent by mineral potential. These ratios are determined from a survey question that asks respondents to rate the relative importance of each factor. In most years, the split is nearly exactly 60 percent mineral and 40 percent policy. This year, the answer was 58.06 percent mineral potential and 41.94 percent policy. We maintain a 60/40 ratio in calculating this index to allow comparability with other years.
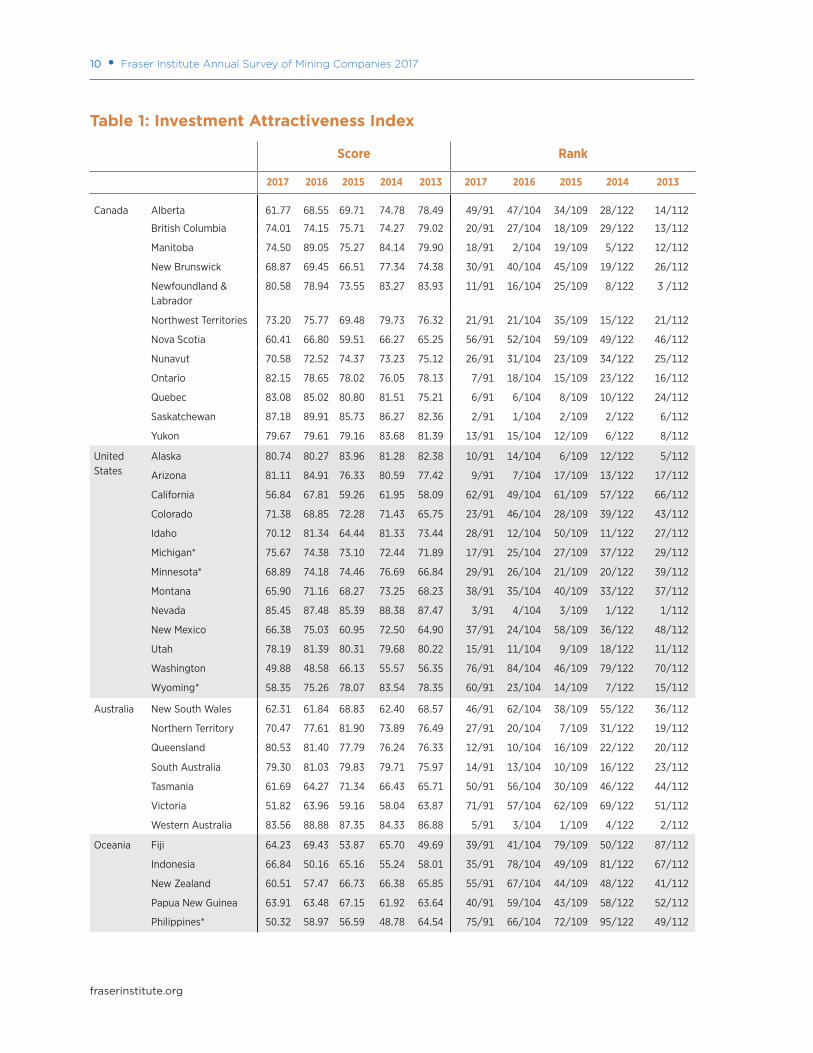
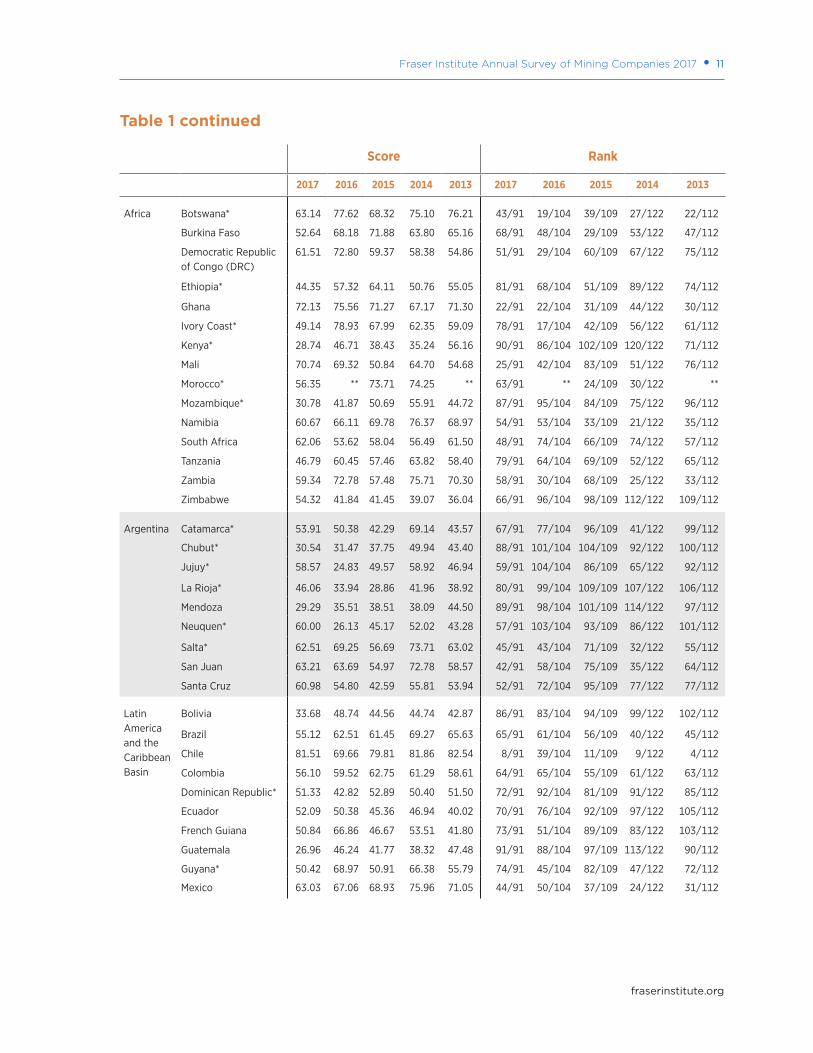
The PPI (table 2 and figure 4) provides the data on policy perception of (see below for explanation on how the index is calculated), while the rankings from the Best Practices Mineral Index (table 3 and figure 5), based on the percentage of responses for “Encourages Investment” and a half-weighting of the responses for “Not a Deterrent to Investment,” provides the data on mineral potential. Table 1 details the relative trends observed over the last five years for the performance of each of the jurisdictions on the Investment Attractiveness Index.
One limitation of this index is that it may not provide an accurate measure of the investment attractiveness of a jurisdiction at extremes, or where the 60/40 weighting is unlikely to be stable. For example, extremely bad policy that would virtually confiscate all potential profits, or an environment that would expose workers and managers to high personal risk, would discourage mining activity
2 A best practice environment is one which contains a world class regulatory environment, highly competitive taxation, no political risk or uncertainty, and a fully stable mining regime.
Fraser Institute Annual Survey of Mining Companies 2017 • 9
fraserinstitute.org
Figure 3: Investment Attractiveness Index
0 20 40 60 80 100
Mexico
Botswana*
San Juan
Norway
Papua New Guinea
Fiji
Montana
New Mexico
Spain*
Indonesia
Greenland
Russia*
Portugal*
Serbia*
New Brunswick
Minnesota*
Idaho
Northern Territory
Nunavut
Mali
Kazakhstan*
Colorado
Ghana
Northwest Territories
British Columbia
Peru
Manitoba
Michigan*
Sweden
Utah
South Australia
Yukon
Queensland
Newfoundland & Labrador
Alaska
Arizona
Chile
Ontario
Quebec
Western Australia
Ireland, Republic of
Nevada
Saskatchewan
Finland
0 20 40 60 80 100
Guatemala
Kenya*
Mendoza
Chubut*
Mozambique*
Bolivia
Venezuela
Romania*
China*
Nicaragua*
Ethiopia*
La Rioja*
Tanzania
Ivory Coast*
Panama*
Washington
Philippines*
Guyana*
French Guiana
Dominican Republic*
Victoria
Ecuador
Turkey
Burkina Faso
Catamarca*
Zimbabwe
Brazil
Colombia
Morocco*
California
Suriname*
Wyoming*
Jujuy*
Zambia
Neuquen*
Nova Scotia
New Zealand
Namibia
Mongolia*
Santa Cruz
Democratic Republic of Congo (DRC)
Tasmania
Alberta
South Africa
Northern Ireland
New South Wales
Salta*
10 • Fraser Institute Annual Survey of Mining Companies 2017
fraserinstitute.org
Table 1: Investment Attractiveness Index
Score Rank
2017 2016 2015 2014 2013 2017 2016 2015 2014 2013
Canada Alberta 61.77 68.55 69.71 74.78 78.49 49/91 47/104 34/109 28/122 14/112
British Columbia 74.01 74.15 75.71 74.27 79.02 20/91 27/104 18/109 29/122 13/112
Manitoba 74.50 89.05 75.27 84.14 79.90 18/91 2/104 19/109 5/122 12/112
New Brunswick 68.87 69.45 66.51 77.34 74.38 30/91 40/104 45/109 19/122 26/112
Newfoundland & Labrador
80.58 78.94 73.55 83.27 83.93 11/91 16/104 25/109 8/122 3 /112
Northwest Territories 73.20 75.77 69.48 79.73 76.32 21/91 21/104 35/109 15/122 21/112
Nova Scotia 60.41 66.80 59.51 66.27 65.25 56/91 52/104 59/109 49/122 46/112
Nunavut 70.58 72.52 74.37 73.23 75.12 26/91 31/104 23/109 34/122 25/112
Ontario 82.15 78.65 78.02 76.05 78.13 7/91 18/104 15/109 23/122 16/112
Quebec 83.08 85.02 80.80 81.51 75.21 6/91 6/104 8/109 10/122 24/112
Saskatchewan 87.18 89.91 85.73 86.27 82.36 2/91 1/104 2/109 2/122 6/112
Yukon 79.67 79.61 79.16 83.68 81.39 13/91 15/104 12/109 6/122 8/112
United States
Alaska 80.74 80.27 83.96 81.28 82.38 10/91 14/104 6/109 12/122 5/112
Arizona 81.11 84.91 76.33 80.59 77.42 9/91 7/104 17/109 13/122 17/112
California 56.84 67.81 59.26 61.95 58.09 62/91 49/104 61/109 57/122 66/112
Colorado 71.38 68.85 72.28 71.43 65.75 23/91 46/104 28/109 39/122 43/112
Idaho 70.12 81.34 64.44 81.33 73.44 28/91 12/104 50/109 11/122 27/112
Michigan* 75.67 74.38 73.10 72.44 71.89 17/91 25/104 27/109 37/122 29/112
Minnesota* 68.89 74.18 74.46 76.69 66.84 29/91 26/104 21/109 20/122 39/112
Montana 65.90 71.16 68.27 73.25 68.23 38/91 35/104 40/109 33/122 37/112
Nevada 85.45 87.48 85.39 88.38 87.47 3/91 4/104 3/109 1/122 1/112
New Mexico 66.38 75.03 60.95 72.50 64.90 37/91 24/104 58/109 36/122 48/112
Utah 78.19 81.39 80.31 79.68 80.22 15/91 11/104 9/109 18/122 11/112
Washington 49.88 48.58 66.13 55.57 56.35 76/91 84/104 46/109 79/122 70/112
Wyoming* 58.35 75.26 78.07 83.54 78.35 60/91 23/104 14/109 7/122 15/112
Australia New South Wales 62.31 61.84 68.83 62.40 68.57 46/91 62/104 38/109 55/122 36/112
Northern Territory 70.47 77.61 81.90 73.89 76.49 27/91 20/104 7/109 31/122 19/112
Queensland 80.53 81.40 77.79 76.24 76.33 12/91 10/104 16/109 22/122 20/112
South Australia 79.30 81.03 79.83 79.71 75.97 14/91 13/104 10/109 16/122 23/112
Tasmania 61.69 64.27 71.34 66.43 65.71 50/91 56/104 30/109 46/122 44/112
Victoria 51.82 63.96 59.16 58.04 63.87 71/91 57/104 62/109 69/122 51/112
Western Australia 83.56 88.88 87.35 84.33 86.88 5/91 3/104 1/109 4/122 2/112
Oceania Fiji 64.23 69.43 53.87 65.70 49.69 39/91 41/104 79/109 50/122 87/112
Indonesia 66.84 50.16 65.16 55.24 58.01 35/91 78/104 49/109 81/122 67/112
New Zealand 60.51 57.47 66.73 66.38 65.85 55/91 67/104 44/109 48/122 41/112
Papua New Guinea 63.91 63.48 67.15 61.92 63.64 40/91 59/104 43/109 58/122 52/112
Philippines* 50.32 58.97 56.59 48.78 64.54 75/91 66/104 72/109 95/122 49/112
Fraser Institute Annual Survey of Mining Companies 2017 • 11
fraserinstitute.org
Table 1 continued
Score Rank
2017 2016 2015 2014 2013 2017 2016 2015 2014 2013
Africa Botswana* 63.14 77.62 68.32 75.10 76.21 43/91 19/104 39/109 27/122 22/112
Burkina Faso 52.64 68.18 71.88 63.80 65.16 68/91 48/104 29/109 53/122 47/112
Democratic Republic of Congo (DRC)
61.51 72.80 59.37 58.38 54.86 51/91 29/104 60/109 67/122 75/112
Ethiopia* 44.35 57.32 64.11 50.76 55.05 81/91 68/104 51/109 89/122 74/112
Ghana 72.13 75.56 71.27 67.17 71.30 22/91 22/104 31/109 44/122 30/112
Ivory Coast* 49.14 78.93 67.99 62.35 59.09 78/91 17/104 42/109 56/122 61/112
Kenya* 28.74 46.71 38.43 35.24 56.16 90/91 86/104 102/109 120/122 71/112
Mali 70.74 69.32 50.84 64.70 54.68 25/91 42/104 83/109 51/122 76/112
Morocco* 56.35 ** 73.71 74.25 ** 63/91 ** 24/109 30/122 **
Mozambique* 30.78 41.87 50.69 55.91 44.72 87/91 95/104 84/109 75/122 96/112
Namibia 60.67 66.11 69.78 76.37 68.97 54/91 53/104 33/109 21/122 35/112
South Africa 62.06 53.62 58.04 56.49 61.50 48/91 74/104 66/109 74/122 57/112
Tanzania 46.79 60.45 57.46 63.82 58.40 79/91 64/104 69/109 52/122 65/112
Zambia 59.34 72.78 57.48 75.71 70.30 58/91 30/104 68/109 25/122 33/112
Zimbabwe 54.32 41.84 41.45 39.07 36.04 66/91 96/104 98/109 112/122 109/112
Argentina Catamarca* 53.91 50.38 42.29 69.14 43.57 67/91 77/104 96/109 41/122 99/112
Chubut* 30.54 31.47 37.75 49.94 43.40 88/91 101/104 104/109 92/122 100/112
Jujuy* 58.57 24.83 49.57 58.92 46.94 59/91 104/104 86/109 65/122 92/112
La Rioja* 46.06 33.94 28.86 41.96 38.92 80/91 99/104 109/109 107/122 106/112
Mendoza 29.29 35.51 38.51 38.09 44.50 89/91 98/104 101/109 114/122 97/112
Neuquen* 60.00 26.13 45.17 52.02 43.28 57/91 103/104 93/109 86/122 101/112
Salta* 62.51 69.25 56.69 73.71 63.02 45/91 43/104 71/109 32/122 55/112
San Juan 63.21 63.69 54.97 72.78 58.57 42/91 58/104 75/109 35/122 64/112
Santa Cruz 60.98 54.80 42.59 55.81 53.94 52/91 72/104 95/109 77/122 77/112
Latin America and the Caribbean Basin
Bolivia 33.68 48.74 44.56 44.74 42.87 86/91 83/104 94/109 99/122 102/112
Brazil 55.12 62.51 61.45 69.27 65.63 65/91 61/104 56/109 40/122 45/112
Chile 81.51 69.66 79.81 81.86 82.54 8/91 39/104 11/109 9/122 4/112
Colombia 56.10 59.52 62.75 61.29 58.61 64/91 65/104 55/109 61/122 63/112
Dominican Republic* 51.33 42.82 52.89 50.40 51.50 72/91 92/104 81/109 91/122 85/112
Ecuador 52.09 50.38 45.36 46.94 40.02 70/91 76/104 92/109 97/122 105/112
French Guiana 50.84 66.86 46.67 53.51 41.80 73/91 51/104 89/109 83/122 103/112
Guatemala 26.96 46.24 41.77 38.32 47.48 91/91 88/104 97/109 113/122 90/112
Guyana* 50.42 68.97 50.91 66.38 55.79 74/91 45/104 82/109 47/122 72/112
Mexico 63.03 67.06 68.93 75.96 71.05 44/91 50/104 37/109 24/122 31/112
12 • Fraser Institute Annual Survey of Mining Companies 2017
fraserinstitute.org
Table 1 continued
Score Rank
2017 2016 2015 2014 2013 2017 2016 2015 2014 2013
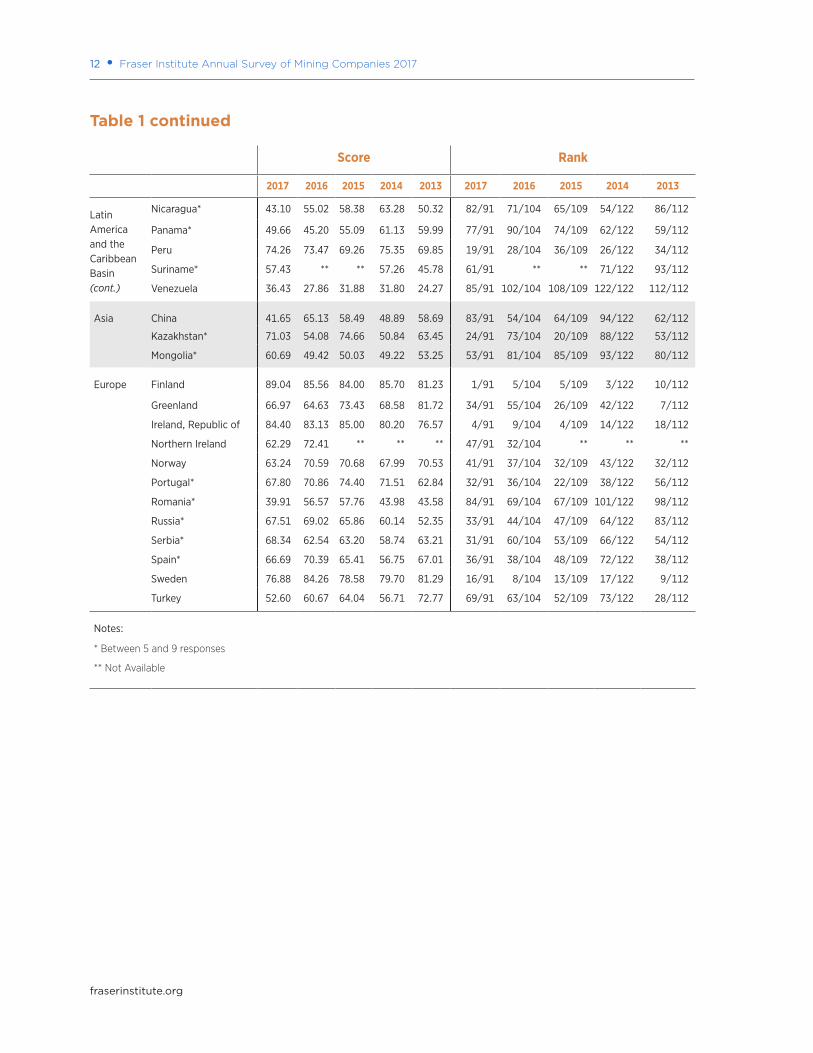
Latin America and the Caribbean Basin (cont.)
Nicaragua* 43.10 55.02 58.38 63.28 50.32 82/91 71/104 65/109 54/122 86/112
Panama* 49.66 45.20 55.09 61.13 59.99 77/91 90/104 74/109 62/122 59/112
Peru 74.26 73.47 69.26 75.35 69.85 19/91 28/104 36/109 26/122 34/112
Suriname* 57.43 ** ** 57.26 45.78 61/91 ** ** 71/122 93/112
Venezuela 36.43 27.86 31.88 31.80 24.27 85/91 102/104 108/109 122/122 112/112
Asia China 41.65 65.13 58.49 48.89 58.69 83/91 54/104 64/109 94/122 62/112
Kazakhstan* 71.03 54.08 74.66 50.84 63.45 24/91 73/104 20/109 88/122 53/112
Mongolia* 60.69 49.42 50.03 49.22 53.25 53/91 81/104 85/109 93/122 80/112
Europe Finland 89.04 85.56 84.00 85.70 81.23 1/91 5/104 5/109 3/122 10/112
Greenland 66.97 64.63 73.43 68.58 81.72 34/91 55/104 26/109 42/122 7/112
Ireland, Republic of 84.40 83.13 85.00 80.20 76.57 4/91 9/104 4/109 14/122 18/112
Northern Ireland 62.29 72.41 ** ** ** 47/91 32/104 ** ** **
Norway 63.24 70.59 70.68 67.99 70.53 41/91 37/104 32/109 43/122 32/112
Portugal* 67.80 70.86 74.40 71.51 62.84 32/91 36/104 22/109 38/122 56/112
Romania* 39.91 56.57 57.76 43.98 43.58 84/91 69/104 67/109 101/122 98/112
Russia* 67.51 69.02 65.86 60.14 52.35 33/91 44/104 47/109 64/122 83/112
Serbia* 68.34 62.54 63.20 58.74 63.21 31/91 60/104 53/109 66/122 54/112
Spain* 66.69 70.39 65.41 56.75 67.01 36/91 38/104 48/109 72/122 38/112
Sweden 76.88 84.26 78.58 79.70 81.29 16/91 8/104 13/109 17/122 9/112
Turkey 52.60 60.67 64.04 56.71 72.77 69/91 63/104 52/109 73/122 28/112
Notes:
* Between 5 and 9 responses
** Not Available
Fraser Institute Annual Survey of Mining Companies 2017 • 13
fraserinstitute.org
regardless of mineral potential. In this case, mineral potential—far from having a 60 percent weight—might carry very little weight. There is also an issue when poor policies lead to a reduction in the knowledge of mineral potential, thereby affecting the responses of potential investors.
Policy Perception Index (PPI): An assessment of the attractiveness of mining policies
While geologic and economic evaluations are always requirements for exploration, in today’s globally competitive economy where mining companies may be examining properties located on different continents, a region’s policy climate has taken on increased importance in attracting and winning investment. The Policy Perception Index, or PPI (see table 2 and figure 4), provides a comprehensive assessment of the attractiveness of mining policies in a jurisdiction, and can serve as a report card to governments on how attractive their policies are from the point of view of an exploration manager. In previous survey years, we have referred to this index as the Policy Potential Index. However, we feel that Policy Perception Index more accurately reflects the nature of this index.
The Policy Perception Index is a composite index that captures the opinions of managers and executives on the effects of policies in jurisdictions with which they are familiar. All survey policy questions (i.e., uncertainty concerning the administration, interpretation, and enforcement of existing regulations; environmental regulations; regulatory duplication and inconsistencies; taxation; uncertainty concerning disputed land claims and protected areas; infrastructure; socioeconomic agreements; political stability; labor issues; geological database; and security) are included in its calculation.
This year we continued the use of the methodology first used to calculate the PPI in 2015. The methodology differs from that of previous years in that it considers answers in all five response categories,3 as well as how far a jurisdiction’s score is from the average. To calculate the PPI, a score for each jurisdiction is estimated for all 15 policy factors by calculating each jurisdiction’s average response. This score is then standardized using a common technique, where the average response is subtracted from each jurisdiction’s score on each of the policy factors and then divided by the standard deviation. A jurisdiction’s scores on each of the 15 policy variables are then added up to generate a final, standardized PPI score. That score is then normalized using the formula
The jurisdiction with the most attractive policies receives a score of 100 and the jurisdiction with the policies that pose the greatest barriers to investment receives a score of 0.
3 The methodology used previously only considered responses in the “encourages investment” category..
Vmax – Vi x 100 Vmax – Vmin
14 • Fraser Institute Annual Survey of Mining Companies 2017
fraserinstitute.org
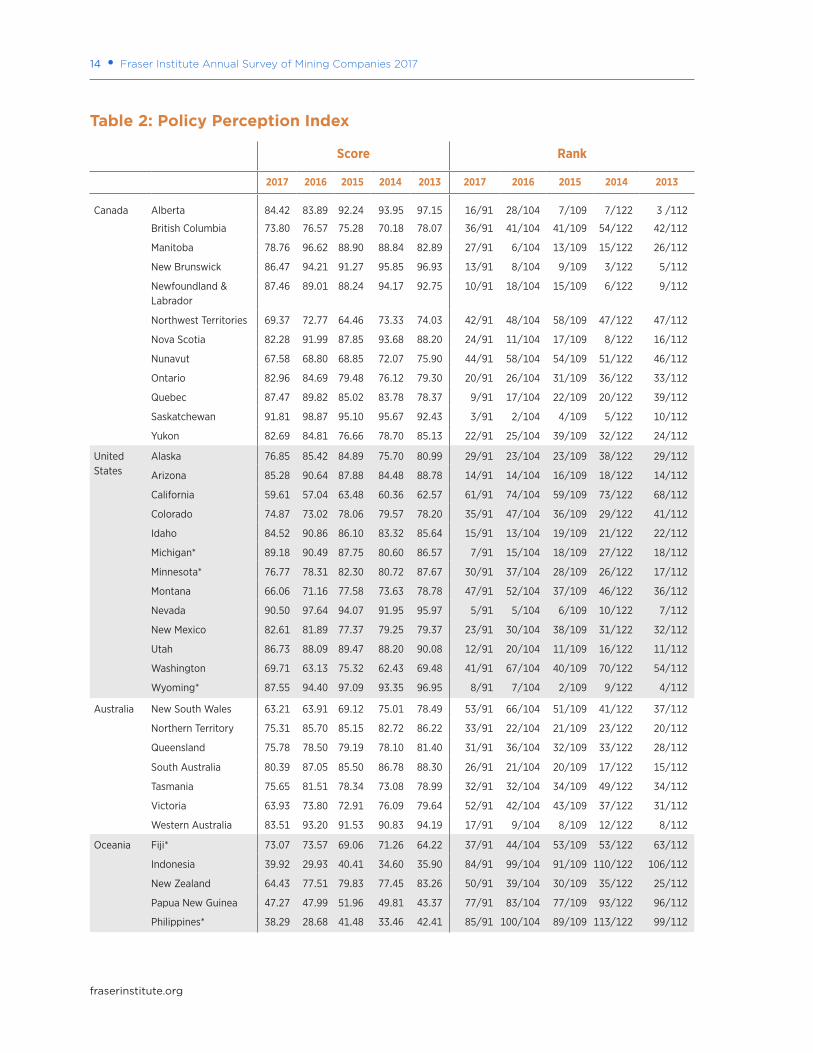
Table 2: Policy Perception Index
Score Rank
2017 2016 2015 2014 2013 2017 2016 2015 2014 2013
Canada Alberta 84.42 83.89 92.24 93.95 97.15 16/91 28/104 7/109 7/122 3 /112
British Columbia 73.80 76.57 75.28 70.18 78.07 36/91 41/104 41/109 54/122 42/112
Manitoba 78.76 96.62 88.90 88.84 82.89 27/91 6/104 13/109 15/122 26/112
New Brunswick 86.47 94.21 91.27 95.85 96.93 13/91 8/104 9/109 3/122 5/112
Newfoundland & Labrador
87.46 89.01 88.24 94.17 92.75 10/91 18/104 15/109 6/122 9/112
Northwest Territories 69.37 72.77 64.46 73.33 74.03 42/91 48/104 58/109 47/122 47/112
Nova Scotia 82.28 91.99 87.85 93.68 88.20 24/91 11/104 17/109 8/122 16/112
Nunavut 67.58 68.80 68.85 72.07 75.90 44/91 58/104 54/109 51/122 46/112
Ontario 82.96 84.69 79.48 76.12 79.30 20/91 26/104 31/109 36/122 33/112
Quebec 87.47 89.82 85.02 83.78 78.37 9/91 17/104 22/109 20/122 39/112
Saskatchewan 91.81 98.87 95.10 95.67 92.43 3/91 2/104 4/109 5/122 10/112
Yukon 82.69 84.81 76.66 78.70 85.13 22/91 25/104 39/109 32/122 24/112
United States
Alaska 76.85 85.42 84.89 75.70 80.99 29/91 23/104 23/109 38/122 29/112
Arizona 85.28 90.64 87.88 84.48 88.78 14/91 14/104 16/109 18/122 14/112
California 59.61 57.04 63.48 60.36 62.57 61/91 74/104 59/109 73/122 68/112
Colorado 74.87 73.02 78.06 79.57 78.20 35/91 47/104 36/109 29/122 41/112
Idaho 84.52 90.86 86.10 83.32 85.64 15/91 13/104 19/109 21/122 22/112
Michigan* 89.18 90.49 87.75 80.60 86.57 7/91 15/104 18/109 27/122 18/112
Minnesota* 76.77 78.31 82.30 80.72 87.67 30/91 37/104 28/109 26/122 17/112
Montana 66.06 71.16 77.58 73.63 78.78 47/91 52/104 37/109 46/122 36/112
Nevada 90.50 97.64 94.07 91.95 95.97 5/91 5/104 6/109 10/122 7/112
New Mexico 82.61 81.89 77.37 79.25 79.37 23/91 30/104 38/109 31/122 32/112
Utah 86.73 88.09 89.47 88.20 90.08 12/91 20/104 11/109 16/122 11/112
Washington 69.71 63.13 75.32 62.43 69.48 41/91 67/104 40/109 70/122 54/112
Wyoming* 87.55 94.40 97.09 93.35 96.95 8/91 7/104 2/109 9/122 4/112
Australia New South Wales 63.21 63.91 69.12 75.01 78.49 53/91 66/104 51/109 41/122 37/112
Northern Territory 75.31 85.70 85.15 82.72 86.22 33/91 22/104 21/109 23/122 20/112
Queensland 75.78 78.50 79.19 78.10 81.40 31/91 36/104 32/109 33/122 28/112
South Australia 80.39 87.05 85.50 86.78 88.30 26/91 21/104 20/109 17/122 15/112
Tasmania 75.65 81.51 78.34 73.08 78.99 32/91 32/104 34/109 49/122 34/112
Victoria 63.93 73.80 72.91 76.09 79.64 52/91 42/104 43/109 37/122 31/112
Western Australia 83.51 93.20 91.53 90.83 94.19 17/91 9/104 8/109 12/122 8/112
Oceania Fiji* 73.07 73.57 69.06 71.26 64.22 37/91 44/104 53/109 53/122 63/112
Indonesia 39.92 29.93 40.41 34.60 35.90 84/91 99/104 91/109 110/122 106/112
New Zealand 64.43 77.51 79.83 77.45 83.26 50/91 39/104 30/109 35/122 25/112
Papua New Guinea 47.27 47.99 51.96 49.81 43.37 77/91 83/104 77/109 93/122 96/112
Philippines* 38.29 28.68 41.48 33.46 42.41 85/91 100/104 89/109 113/122 99/112
Fraser Institute Annual Survey of Mining Companies 2017 • 15
fraserinstitute.org
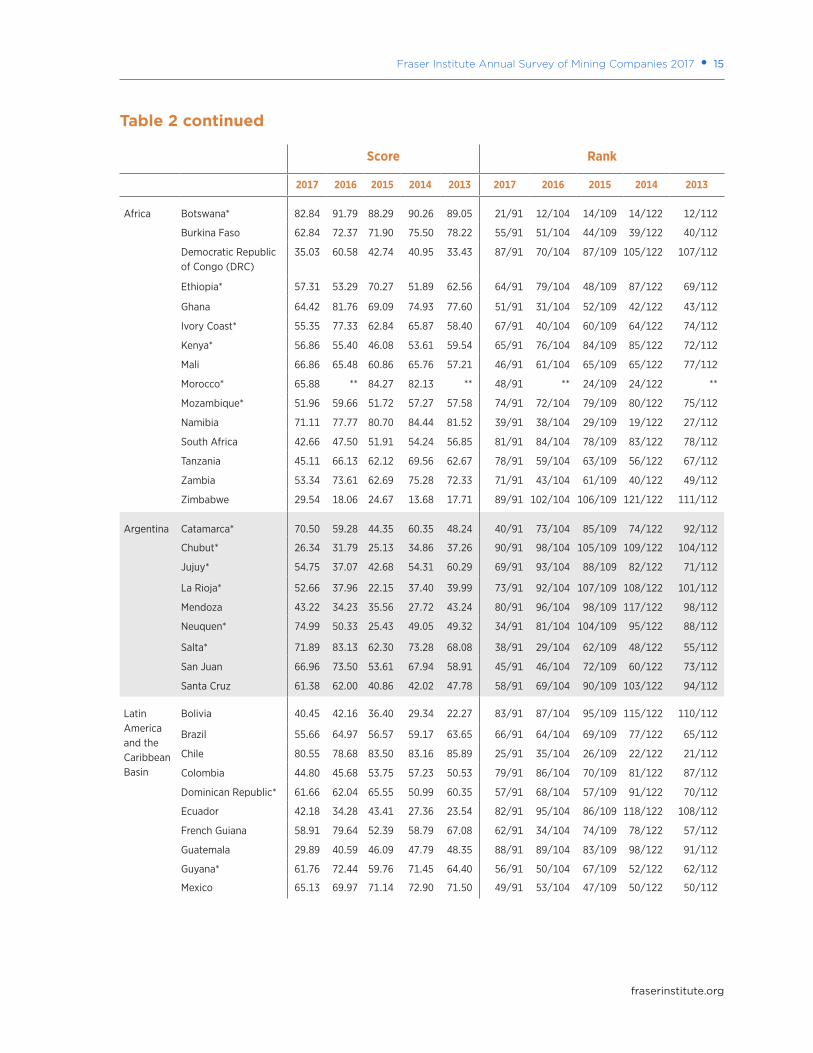
Table 2 continued
Score Rank
2017 2016 2015 2014 2013 2017 2016 2015 2014 2013
Africa Botswana* 82.84 91.79 88.29 90.26 89.05 21/91 12/104 14/109 14/122 12/112
Burkina Faso 62.84 72.37 71.90 75.50 78.22 55/91 51/104 44/109 39/122 40/112
Democratic Republic of Congo (DRC)
35.03 60.58 42.74 40.95 33.43 87/91 70/104 87/109 105/122 107/112
Ethiopia* 57.31 53.29 70.27 51.89 62.56 64/91 79/104 48/109 87/122 69/112
Ghana 64.42 81.76 69.09 74.93 77.60 51/91 31/104 52/109 42/122 43/112
Ivory Coast* 55.35 77.33 62.84 65.87 58.40 67/91 40/104 60/109 64/122 74/112
Kenya* 56.86 55.40 46.08 53.61 59.54 65/91 76/104 84/109 85/122 72/112
Mali 66.86 65.48 60.86 65.76 57.21 46/91 61/104 65/109 65/122 77/112
Morocco* 65.88 ** 84.27 82.13 ** 48/91 ** 24/109 24/122 **
Mozambique* 51.96 59.66 51.72 57.27 57.58 74/91 72/104 79/109 80/122 75/112
Namibia 71.11 77.77 80.70 84.44 81.52 39/91 38/104 29/109 19/122 27/112
South Africa 42.66 47.50 51.91 54.24 56.85 81/91 84/104 78/109 83/122 78/112
Tanzania 45.11 66.13 62.12 69.56 62.67 78/91 59/104 63/109 56/122 67/112
Zambia 53.34 73.61 62.69 75.28 72.33 71/91 43/104 61/109 40/122 49/112
Zimbabwe 29.54 18.06 24.67 13.68 17.71 89/91 102/104 106/109 121/122 111/112
Argentina Catamarca* 70.50 59.28 44.35 60.35 48.24 40/91 73/104 85/109 74/122 92/112
Chubut* 26.34 31.79 25.13 34.86 37.26 90/91 98/104 105/109 109/122 104/112
Jujuy* 54.75 37.07 42.68 54.31 60.29 69/91 93/104 88/109 82/122 71/112
La Rioja* 52.66 37.96 22.15 37.40 39.99 73/91 92/104 107/109 108/122 101/112
Mendoza 43.22 34.23 35.56 27.72 43.24 80/91 96/104 98/109 117/122 98/112
Neuquen* 74.99 50.33 25.43 49.05 49.32 34/91 81/104 104/109 95/122 88/112
Salta* 71.89 83.13 62.30 73.28 68.08 38/91 29/104 62/109 48/122 55/112
San Juan 66.96 73.50 53.61 67.94 58.91 45/91 46/104 72/109 60/122 73/112
Santa Cruz 61.38 62.00 40.86 42.02 47.78 58/91 69/104 90/109 103/122 94/112
Latin America and the Caribbean Basin
Bolivia 40.45 42.16 36.40 29.34 22.27 83/91 87/104 95/109 115/122 110/112
Brazil 55.66 64.97 56.57 59.17 63.65 66/91 64/104 69/109 77/122 65/112
Chile 80.55 78.68 83.50 83.16 85.89 25/91 35/104 26/109 22/122 21/112
Colombia 44.80 45.68 53.75 57.23 50.53 79/91 86/104 70/109 81/122 87/112
Dominican Republic* 61.66 62.04 65.55 50.99 60.35 57/91 68/104 57/109 91/122 70/112
Ecuador 42.18 34.28 43.41 27.36 23.54 82/91 95/104 86/109 118/122 108/112
French Guiana 58.91 79.64 52.39 58.79 67.08 62/91 34/104 74/109 78/122 57/112
Guatemala 29.89 40.59 46.09 47.79 48.35 88/91 89/104 83/109 98/122 91/112
Guyana* 61.76 72.44 59.76 71.45 64.40 56/91 50/104 67/109 52/122 62/112
Mexico 65.13 69.97 71.14 72.90 71.50 49/91 53/104 47/109 50/122 50/112
16 • Fraser Institute Annual Survey of Mining Companies 2017
fraserinstitute.org
Table 2 continued
Score Rank
2017 2016 2015 2014 2013 2017 2016 2015 2014 2013
Latin America and the Caribbean Basin (cont.)
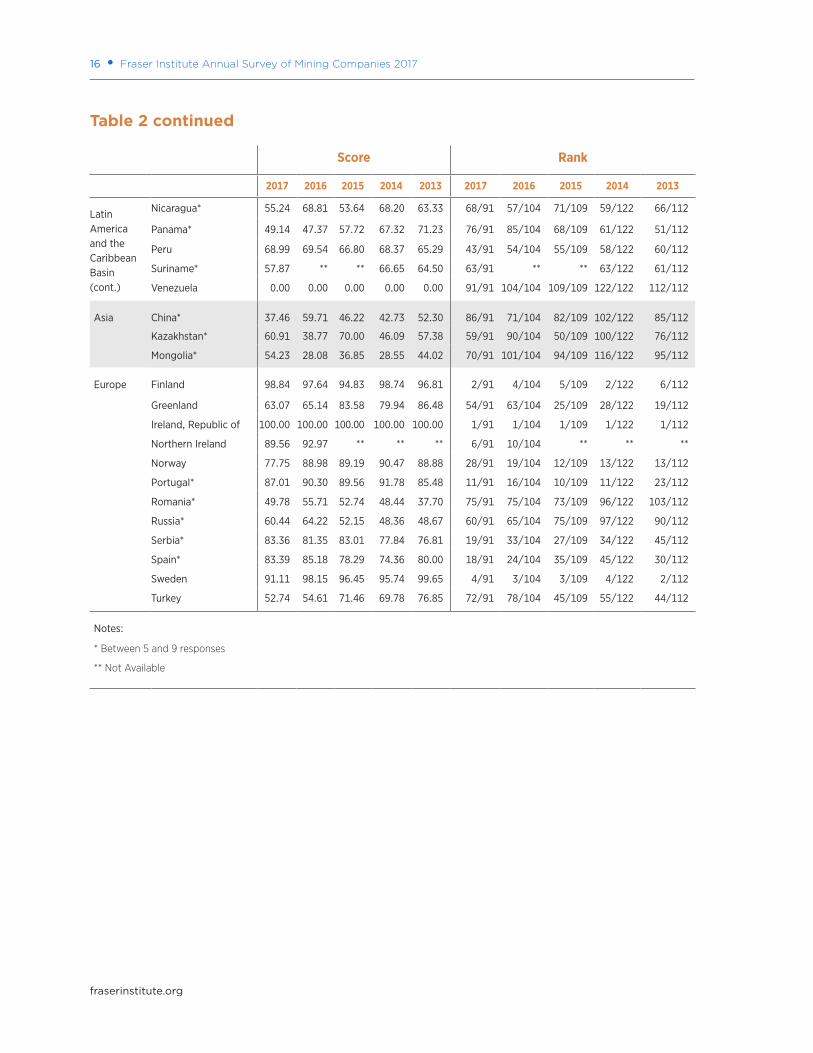
Nicaragua* 55.24 68.81 53.64 68.20 63.33 68/91 57/104 71/109 59/122 66/112
Panama* 49.14 47.37 57.72 67.32 71.23 76/91 85/104 68/109 61/122 51/112
Peru 68.99 69.54 66.80 68.37 65.29 43/91 54/104 55/109 58/122 60/112
Suriname* 57.87 ** ** 66.65 64.50 63/91 ** ** 63/122 61/112
Venezuela 0.00 0.00 0.00 0.00 0.00 91/91 104/104 109/109 122/122 112/112
Asia China* 37.46 59.71 46.22 42.73 52.30 86/91 71/104 82/109 102/122 85/112
Kazakhstan* 60.91 38.77 70.00 46.09 57.38 59/91 90/104 50/109 100/122 76/112
Mongolia* 54.23 28.08 36.85 28.55 44.02 70/91 101/104 94/109 116/122 95/112
Europe Finland 98.84 97.64 94.83 98.74 96.81 2/91 4/104 5/109 2/122 6/112
Greenland 63.07 65.14 83.58 79.94 86.48 54/91 63/104 25/109 28/122 19/112
Ireland, Republic of 100.00 100.00 100.00 100.00 100.00 1/91 1/104 1/109 1/122 1/112
Northern Ireland 89.56 92.97 ** ** ** 6/91 10/104 ** ** **
Norway 77.75 88.98 89.19 90.47 88.88 28/91 19/104 12/109 13/122 13/112
Portugal* 87.01 90.30 89.56 91.78 85.48 11/91 16/104 10/109 11/122 23/112
Romania* 49.78 55.71 52.74 48.44 37.70 75/91 75/104 73/109 96/122 103/112
Russia* 60.44 64.22 52.15 48.36 48.67 60/91 65/104 75/109 97/122 90/112
Serbia* 83.36 81.35 83.01 77.84 76.81 19/91 33/104 27/109 34/122 45/112
Spain* 83.39 85.18 78.29 74.36 80.00 18/91 24/104 35/109 45/122 30/112
Sweden 91.11 98.15 96.45 95.74 99.65 4/91 3/104 3/109 4/122 2/112
Turkey 52.74 54.61 71.46 69.78 76.85 72/91 78/104 45/109 55/122 44/112
Notes:
* Between 5 and 9 responses
** Not Available
Fraser Institute Annual Survey of Mining Companies 2017 • 17
fraserinstitute.org
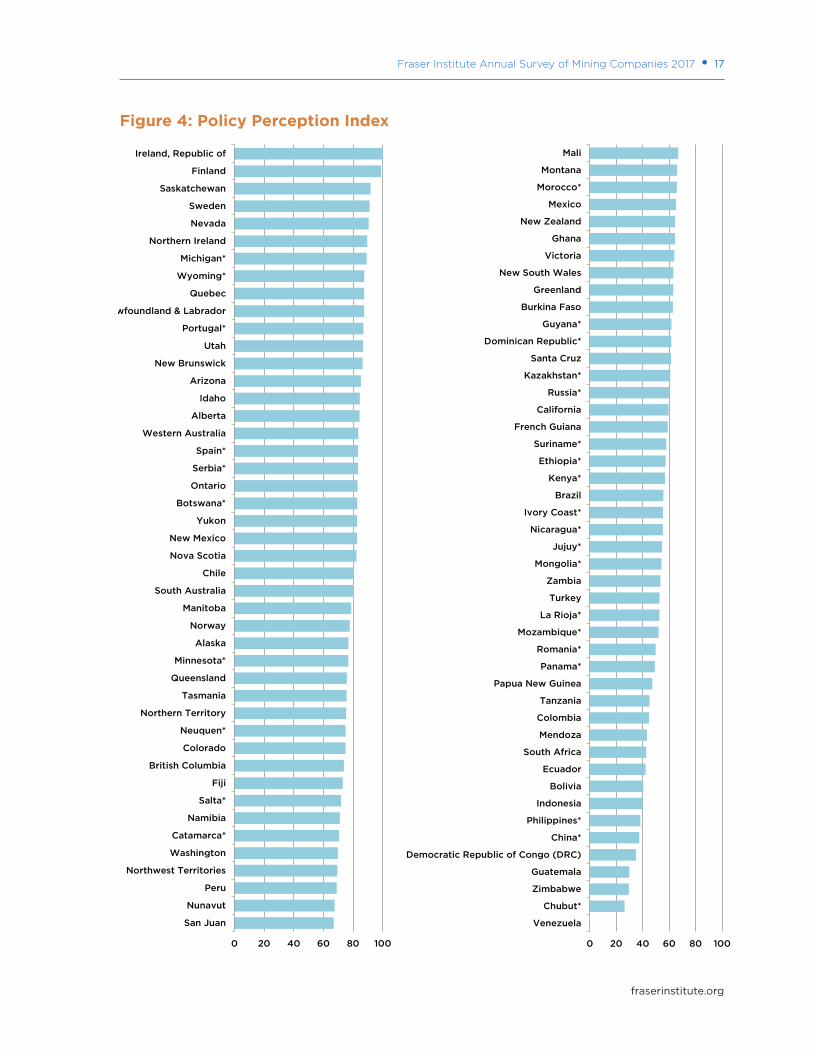
Figure 4: Policy Perception Index
0 20 40 60 80 100
San Juan
Nunavut
Peru
Northwest Territories
Washington
Catamarca*
Namibia
Salta*
Fiji
British Columbia
Colorado
Neuquen*
Northern Territory
Tasmania
Queensland
Minnesota*
Alaska
Norway
Manitoba
South Australia
Chile
Nova Scotia
New Mexico
Yukon
Botswana*
Ontario
Serbia*
Spain*
Western Australia
Alberta
Idaho
Arizona
New Brunswick
Utah
Portugal*
Newfoundland & Labrador
Quebec
Wyoming*
Michigan*
Northern Ireland
Nevada
Sweden
Saskatchewan
Finland
Ireland, Republic of
0 20 40 60 80 100
Venezuela
Chubut*
Zimbabwe
Guatemala
Democratic Republic of Congo (DRC)
China*
Philippines*
Indonesia
Bolivia
Ecuador
South Africa
Mendoza
Colombia
Tanzania
Papua New Guinea
Panama*
Romania*
Mozambique*
La Rioja*
Turkey
Zambia
Mongolia*
Jujuy*
Nicaragua*
Ivory Coast*
Brazil
Kenya*
Ethiopia*
Suriname*
French Guiana
California
Russia*
Kazakhstan*
Santa Cruz
Dominican Republic*
Guyana*
Burkina Faso
Greenland
New South Wales
Victoria
Ghana
New Zealand
Mexico
Morocco*
Montana
Mali
18 • Fraser Institute Annual Survey of Mining Companies 2017
fraserinstitute.org
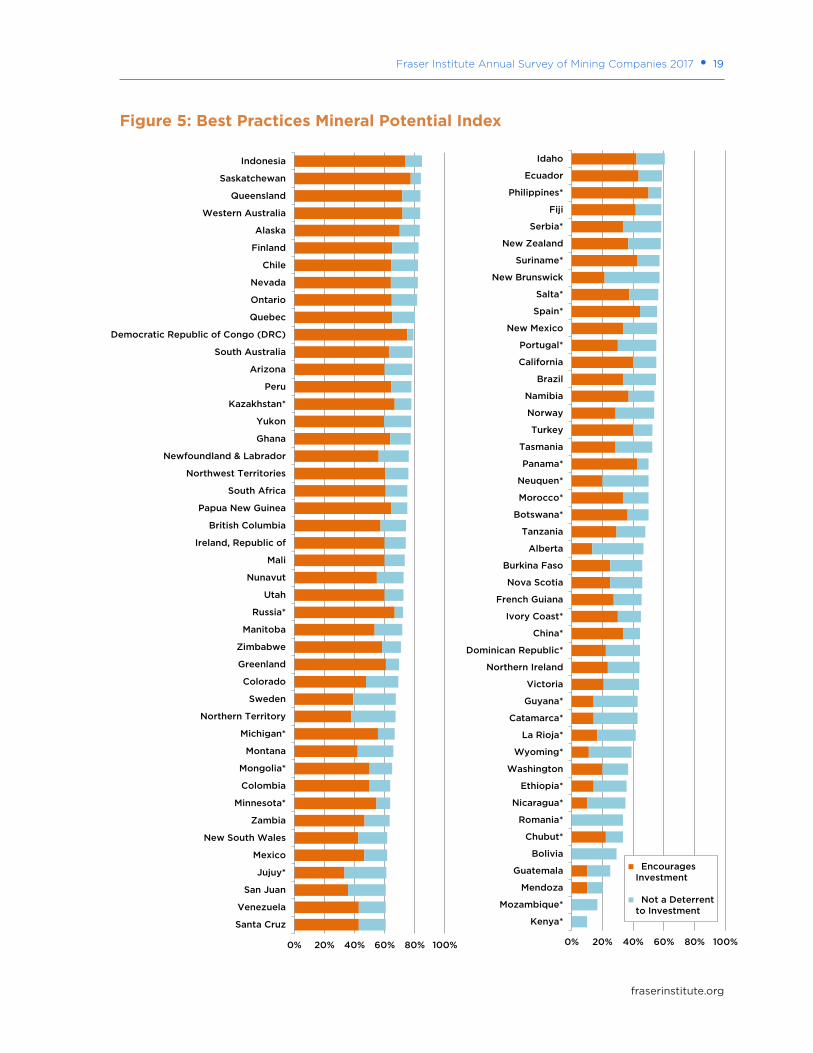
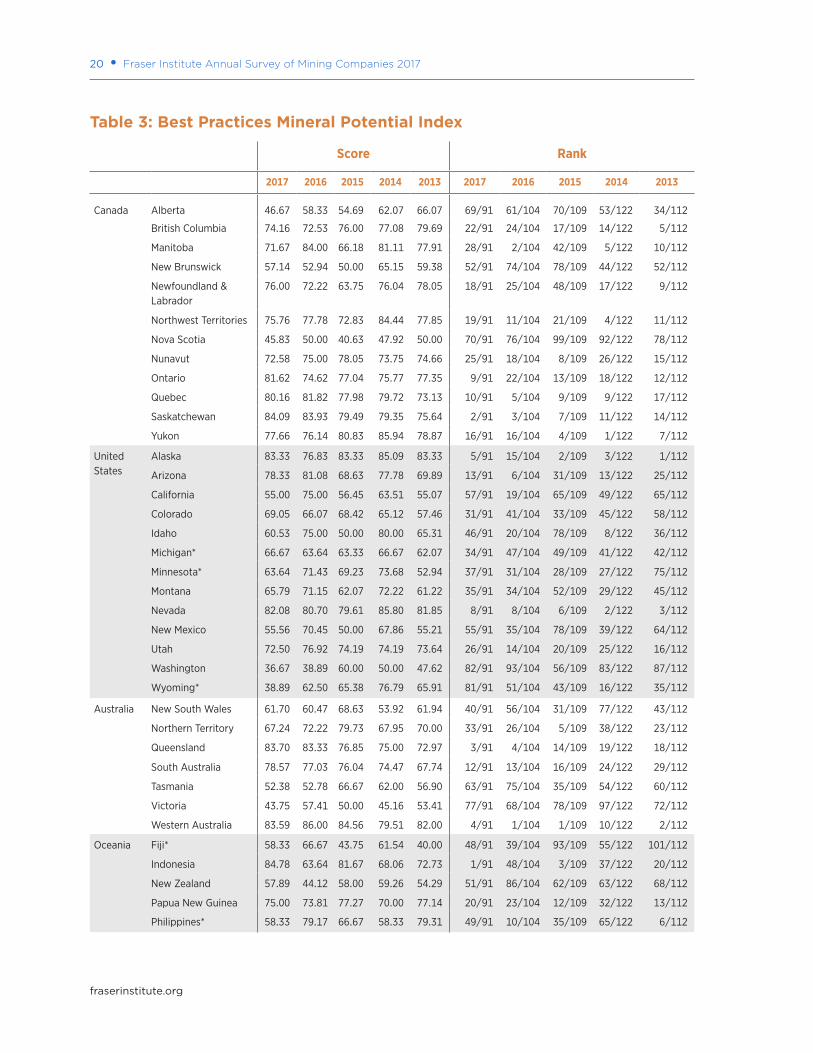
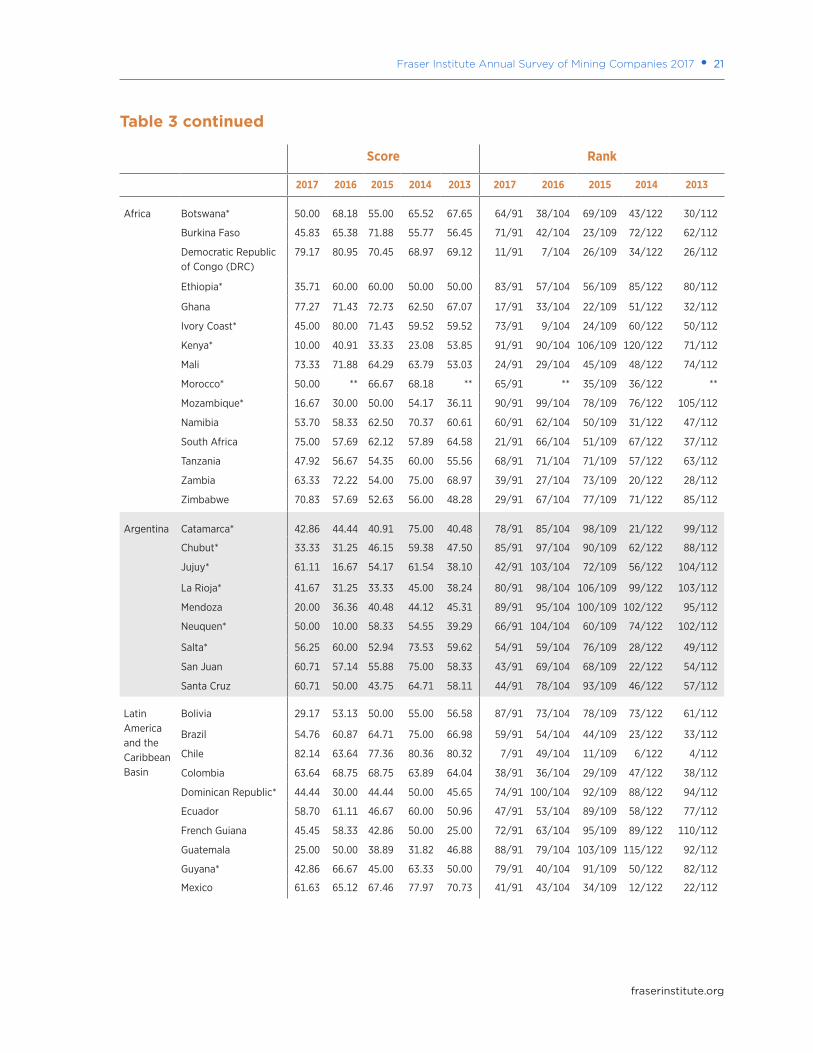
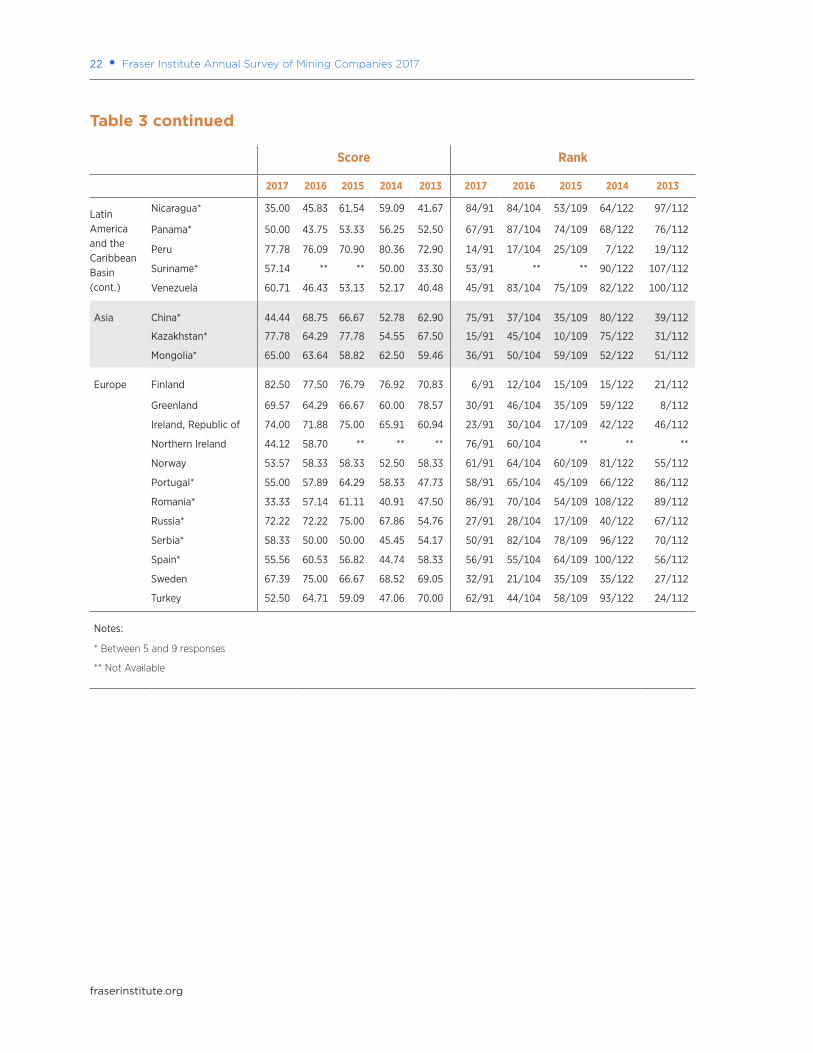
Best Practices Mineral Potential Index
Table 3 and figure 5 show the mineral potential of jurisdictions, assuming their policies are based on “best practices” (i.e., world class regulatory environment, highly competitive taxation, no political risk or uncertainty, and a fully stable mining regime). In other words, this figure represents, in a sense, a jurisdiction’s “pure” mineral potential, since it assumes a “best practices” policy regime.
The “Best Practices Mineral Potential” index ranks the jurisdictions based on which region’s geology “encourages exploration investment” or is “not a deterrent to investment.” Since the “Encourages” response expresses a much more positive attitude to investment than “Not a Deterrent,” in calculating these indexes we give “Not a Deterrent” half the weight of “Encourages.” For example, the “Best Practices Mineral Potential” for Norway was calculated by adding the percent of respondents who rated Norway’s mineral potential as “Encourages Investment” (29 percent) with the 50 percent who responded “Not a Deterrent to Investment,” which was half weighted at 25 percent. Thus, for 2017 Norway has a score of 54, taking into account rounding. Table 3 provides more precise information and the recent historical record.
A caveat
This survey captures both general and specific knowledge of respondents. A respondent may give an otherwise high-scoring jurisdiction a low mark because of his or her individual experience with a problem there. We do not believe this detracts from the value of the survey. In fact, we have made a particular point of highlighting such differing views in the survey comments and the “What miners are saying” quotes.
It is also important to note that different segments of the mining industry (exploration and development companies, say) face different challenges. Yet many of the challenges the different segments face are similar. This survey is intended to capture the overall view.
Fraser Institute Annual Survey of Mining Companies 2017 • 19
fraserinstitute.org
Figure 5: Best Practices Mineral Potential Index
0% 20% 40% 60% 80% 100%
Santa Cruz
Venezuela
San Juan
Jujuy*
Mexico
New South Wales
Zambia
Minnesota*
Colombia
Mongolia*
Montana
Michigan*
Northern Territory
Sweden
Colorado
Greenland
Zimbabwe
Manitoba
Russia*
Utah
Nunavut
Mali
Ireland, Republic of
British Columbia
Papua New Guinea
South Africa
Northwest Territories
Newfoundland & Labrador
Ghana
Yukon
Kazakhstan*
Peru
Arizona
South Australia
Democratic Republic of Congo (DRC)
Quebec
Ontario
Nevada
Chile
Finland
Alaska
Western Australia
Queensland
Saskatchewan
Indonesia
0% 20% 40% 60% 80% 100%
Kenya*
Mozambique*
Mendoza
Guatemala
Bolivia
Chubut*
Romania*
Nicaragua*
Ethiopia*
Washington
Wyoming*
La Rioja*
Catamarca*
Guyana*
Victoria
Northern Ireland
Dominican Republic*
China*
Ivory Coast*
French Guiana
Nova Scotia
Burkina Faso
Alberta
Tanzania
Botswana*
Morocco*
Neuquen*
Panama*
Tasmania
Turkey
Norway
Namibia
Brazil
California
Portugal*
New Mexico
Spain*
Salta*
New Brunswick
Suriname*
New Zealand
Serbia*
Fiji
Philippines*
Ecuador
Idaho
EncouragesInvestment
Not a Deterrentto Investment
20 • Fraser Institute Annual Survey of Mining Companies 2017
fraserinstitute.org
Table 3: Best Practices Mineral Potential Index
Score Rank
2017 2016 2015 2014 2013 2017 2016 2015 2014 2013
Canada Alberta 46.67 58.33 54.69 62.07 66.07 69/91 61/104 70/109 53/122 34/112
British Columbia 74.16 72.53 76.00 77.08 79.69 22/91 24/104 17/109 14/122 5/112
Manitoba 71.67 84.00 66.18 81.11 77.91 28/91 2/104 42/109 5/122 10/112
New Brunswick 57.14 52.94 50.00 65.15 59.38 52/91 74/104 78/109 44/122 52/112
Newfoundland & Labrador
76.00 72.22 63.75 76.04 78.05 18/91 25/104 48/109 17/122 9/112
Northwest Territories 75.76 77.78 72.83 84.44 77.85 19/91 11/104 21/109 4/122 11/112
Nova Scotia 45.83 50.00 40.63 47.92 50.00 70/91 76/104 99/109 92/122 78/112
Nunavut 72.58 75.00 78.05 73.75 74.66 25/91 18/104 8/109 26/122 15/112
Ontario 81.62 74.62 77.04 75.77 77.35 9/91 22/104 13/109 18/122 12/112
Quebec 80.16 81.82 77.98 79.72 73.13 10/91 5/104 9/109 9/122 17/112
Saskatchewan 84.09 83.93 79.49 79.35 75.64 2/91 3/104 7/109 11/122 14/112
Yukon 77.66 76.14 80.83 85.94 78.87 16/91 16/104 4/109 1/122 7/112
United States
Alaska 83.33 76.83 83.33 85.09 83.33 5/91 15/104 2/109 3/122 1/112
Arizona 78.33 81.08 68.63 77.78 69.89 13/91 6/104 31/109 13/122 25/112
California 55.00 75.00 56.45 63.51 55.07 57/91 19/104 65/109 49/122 65/112
Colorado 69.05 66.07 68.42 65.12 57.46 31/91 41/104 33/109 45/122 58/112
Idaho 60.53 75.00 50.00 80.00 65.31 46/91 20/104 78/109 8/122 36/112
Michigan* 66.67 63.64 63.33 66.67 62.07 34/91 47/104 49/109 41/122 42/112
Minnesota* 63.64 71.43 69.23 73.68 52.94 37/91 31/104 28/109 27/122 75/112
Montana 65.79 71.15 62.07 72.22 61.22 35/91 34/104 52/109 29/122 45/112
Nevada 82.08 80.70 79.61 85.80 81.85 8/91 8/104 6/109 2/122 3/112
New Mexico 55.56 70.45 50.00 67.86 55.21 55/91 35/104 78/109 39/122 64/112
Utah 72.50 76.92 74.19 74.19 73.64 26/91 14/104 20/109 25/122 16/112
Washington 36.67 38.89 60.00 50.00 47.62 82/91 93/104 56/109 83/122 87/112
Wyoming* 38.89 62.50 65.38 76.79 65.91 81/91 51/104 43/109 16/122 35/112
Australia New South Wales 61.70 60.47 68.63 53.92 61.94 40/91 56/104 31/109 77/122 43/112
Northern Territory 67.24 72.22 79.73 67.95 70.00 33/91 26/104 5/109 38/122 23/112
Queensland 83.70 83.33 76.85 75.00 72.97 3/91 4/104 14/109 19/122 18/112
South Australia 78.57 77.03 76.04 74.47 67.74 12/91 13/104 16/109 24/122 29/112
Tasmania 52.38 52.78 66.67 62.00 56.90 63/91 75/104 35/109 54/122 60/112
Victoria 43.75 57.41 50.00 45.16 53.41 77/91 68/104 78/109 97/122 72/112
Western Australia 83.59 86.00 84.56 79.51 82.00 4/91 1/104 1/109 10/122 2/112
Oceania Fiji* 58.33 66.67 43.75 61.54 40.00 48/91 39/104 93/109 55/122 101/112
Indonesia 84.78 63.64 81.67 68.06 72.73 1/91 48/104 3/109 37/122 20/112
New Zealand 57.89 44.12 58.00 59.26 54.29 51/91 86/104 62/109 63/122 68/112
Papua New Guinea 75.00 73.81 77.27 70.00 77.14 20/91 23/104 12/109 32/122 13/112
Philippines* 58.33 79.17 66.67 58.33 79.31 49/91 10/104 35/109 65/122 6/112
Fraser Institute Annual Survey of Mining Companies 2017 • 21
fraserinstitute.org
Table 3 continued
Score Rank
2017 2016 2015 2014 2013 2017 2016 2015 2014 2013
Africa Botswana* 50.00 68.18 55.00 65.52 67.65 64/91 38/104 69/109 43/122 30/112
Burkina Faso 45.83 65.38 71.88 55.77 56.45 71/91 42/104 23/109 72/122 62/112
Democratic Republic of Congo (DRC)
79.17 80.95 70.45 68.97 69.12 11/91 7/104 26/109 34/122 26/112
Ethiopia* 35.71 60.00 60.00 50.00 50.00 83/91 57/104 56/109 85/122 80/112
Ghana 77.27 71.43 72.73 62.50 67.07 17/91 33/104 22/109 51/122 32/112
Ivory Coast* 45.00 80.00 71.43 59.52 59.52 73/91 9/104 24/109 60/122 50/112
Kenya* 10.00 40.91 33.33 23.08 53.85 91/91 90/104 106/109 120/122 71/112
Mali 73.33 71.88 64.29 63.79 53.03 24/91 29/104 45/109 48/122 74/112
Morocco* 50.00 ** 66.67 68.18 ** 65/91 ** 35/109 36/122 **
Mozambique* 16.67 30.00 50.00 54.17 36.11 90/91 99/104 78/109 76/122 105/112
Namibia 53.70 58.33 62.50 70.37 60.61 60/91 62/104 50/109 31/122 47/112
South Africa 75.00 57.69 62.12 57.89 64.58 21/91 66/104 51/109 67/122 37/112
Tanzania 47.92 56.67 54.35 60.00 55.56 68/91 71/104 71/109 57/122 63/112
Zambia 63.33 72.22 54.00 75.00 68.97 39/91 27/104 73/109 20/122 28/112
Zimbabwe 70.83 57.69 52.63 56.00 48.28 29/91 67/104 77/109 71/122 85/112
Argentina Catamarca* 42.86 44.44 40.91 75.00 40.48 78/91 85/104 98/109 21/122 99/112
Chubut* 33.33 31.25 46.15 59.38 47.50 85/91 97/104 90/109 62/122 88/112
Jujuy* 61.11 16.67 54.17 61.54 38.10 42/91 103/104 72/109 56/122 104/112
La Rioja* 41.67 31.25 33.33 45.00 38.24 80/91 98/104 106/109 99/122 103/112
Mendoza 20.00 36.36 40.48 44.12 45.31 89/91 95/104 100/109 102/122 95/112
Neuquen* 50.00 10.00 58.33 54.55 39.29 66/91 104/104 60/109 74/122 102/112
Salta* 56.25 60.00 52.94 73.53 59.62 54/91 59/104 76/109 28/122 49/112
San Juan 60.71 57.14 55.88 75.00 58.33 43/91 69/104 68/109 22/122 54/112
Santa Cruz 60.71 50.00 43.75 64.71 58.11 44/91 78/104 93/109 46/122 57/112
Latin America and the Caribbean Basin
Bolivia 29.17 53.13 50.00 55.00 56.58 87/91 73/104 78/109 73/122 61/112
Brazil 54.76 60.87 64.71 75.00 66.98 59/91 54/104 44/109 23/122 33/112
Chile 82.14 63.64 77.36 80.36 80.32 7/91 49/104 11/109 6/122 4/112
Colombia 63.64 68.75 68.75 63.89 64.04 38/91 36/104 29/109 47/122 38/112
Dominican Republic* 44.44 30.00 44.44 50.00 45.65 74/91 100/104 92/109 88/122 94/112
Ecuador 58.70 61.11 46.67 60.00 50.96 47/91 53/104 89/109 58/122 77/112
French Guiana 45.45 58.33 42.86 50.00 25.00 72/91 63/104 95/109 89/122 110/112
Guatemala 25.00 50.00 38.89 31.82 46.88 88/91 79/104 103/109 115/122 92/112
Guyana* 42.86 66.67 45.00 63.33 50.00 79/91 40/104 91/109 50/122 82/112
Mexico 61.63 65.12 67.46 77.97 70.73 41/91 43/104 34/109 12/122 22/112
22 • Fraser Institute Annual Survey of Mining Companies 2017
fraserinstitute.org
Table 3 continued
Score Rank
2017 2016 2015 2014 2013 2017 2016 2015 2014 2013
Latin America and the Caribbean Basin (cont.)
Nicaragua* 35.00 45.83 61.54 59.09 41.67 84/91 84/104 53/109 64/122 97/112
Panama* 50.00 43.75 53.33 56.25 52.50 67/91 87/104 74/109 68/122 76/112
Peru 77.78 76.09 70.90 80.36 72.90 14/91 17/104 25/109 7/122 19/112
Suriname* 57.14 ** ** 50.00 33.30 53/91 ** ** 90/122 107/112
Venezuela 60.71 46.43 53.13 52.17 40.48 45/91 83/104 75/109 82/122 100/112
Asia China* 44.44 68.75 66.67 52.78 62.90 75/91 37/104 35/109 80/122 39/112
Kazakhstan* 77.78 64.29 77.78 54.55 67.50 15/91 45/104 10/109 75/122 31/112
Mongolia* 65.00 63.64 58.82 62.50 59.46 36/91 50/104 59/109 52/122 51/112
Europe Finland 82.50 77.50 76.79 76.92 70.83 6/91 12/104 15/109 15/122 21/112
Greenland 69.57 64.29 66.67 60.00 78.57 30/91 46/104 35/109 59/122 8/112
Ireland, Republic of 74.00 71.88 75.00 65.91 60.94 23/91 30/104 17/109 42/122 46/112
Northern Ireland 44.12 58.70 ** ** ** 76/91 60/104 ** ** **
Norway 53.57 58.33 58.33 52.50 58.33 61/91 64/104 60/109 81/122 55/112
Portugal* 55.00 57.89 64.29 58.33 47.73 58/91 65/104 45/109 66/122 86/112
Romania* 33.33 57.14 61.11 40.91 47.50 86/91 70/104 54/109 108/122 89/112
Russia* 72.22 72.22 75.00 67.86 54.76 27/91 28/104 17/109 40/122 67/112
Serbia* 58.33 50.00 50.00 45.45 54.17 50/91 82/104 78/109 96/122 70/112
Spain* 55.56 60.53 56.82 44.74 58.33 56/91 55/104 64/109 100/122 56/112
Sweden 67.39 75.00 66.67 68.52 69.05 32/91 21/104 35/109 35/122 27/112
Turkey 52.50 64.71 59.09 47.06 70.00 62/91 44/104 58/109 93/122 24/112
Notes:
* Between 5 and 9 responses
** Not Available
fraserinstitute.org
Global Survey Rankings
The top
The top jurisdiction in the world for investment based on the Investment Attractiveness Index is Finland, which moved up from 5th place in 2016 (see table 1). Saskatchewan dropped into 2nd place after ranking 1st in the previous year, as this province experienced a slight drop in its score in 2017. Nevada moved up from 4th in 2016 to 3rd in 2017. The Republic of Ireland ranked 4th this year, and Western Australia dropped from 3rd in 2016 to 5th in 2017. Rounding out the top 10 are Quebec, Ontario, Chile, Arizona, and Alaska. Three jurisdictions—Ontario, Chile, and Alaska—were outside of the top 10 in the previous year.
For the fifth year in a row, the Republic of Ireland had the highest PPI score of 100. Ireland was followed by Finland in 2nd, which moved up from 4th the previous year. Along with Ireland and Finland the top 10 ranked jurisdictions are Saskatchewan, Sweden, Nevada, Northern Ireland, Michigan, Wyoming, Quebec, and Newfoundland and Labrador.
All were in the top 10 last year except for Michigan, Quebec, and Newfoundland & Labrador. Michigan increased in the rankings from 15th in 2016 to rank 7th in 2017, while Quebec moved up from 17th last year to 9th this year. Displaced from the top 10 were Manitoba, New Brunswick, and Western Australia.
Finland, the Republic of Ireland, Nevada, Saskatchewan, Sweden, and Wyoming have ranked consistently in the top 10 over the last six surveys. Table 2 illustrates in greater detail the shifts in the relative ranking of the policy perceptions of the jurisdictions surveyed.
The bottom
When considering both policy and mineral potential in the Investment Attractiveness Index, Guatemala ranks as the least attractive jurisdiction in the world for investment. This year, Guatemala replaced the Argentinian province of Jujuy as the least attractive jurisdiction in the world. Also in the bottom 10 (beginning with the worst) are Kenya, Argentina: Mendoza, Argentina: Chubut, Mozambique, Bolivia, Venezuela, Romania, China, and Nicaragua.
24 • Fraser Institute Annual Survey of Mining Companies 2017
fraserinstitute.org
The 10 least attractive jurisdictions for investment based on the PPI rankings are (starting with the worst) Venezuela, Argentina: Chubut, Zimbabwe, Guatemala, Democratic Republic of Congo (DRC), China, Philippines, Indonesia, Bolivia, and Ecuador. Venezuela, Chubut, Zimbabwe, Philippines, Indonesia, and Ecuador were all in the bottom 10 jurisdictions last year. Displaced from the bottom 10 in 2017 were Afghanistan, Argentina: Mendoza, Mongolia, and South Sudan. Afghanistan and South Sudan were not ranked this year.
fraserinstitute.org
Global Results
Canada
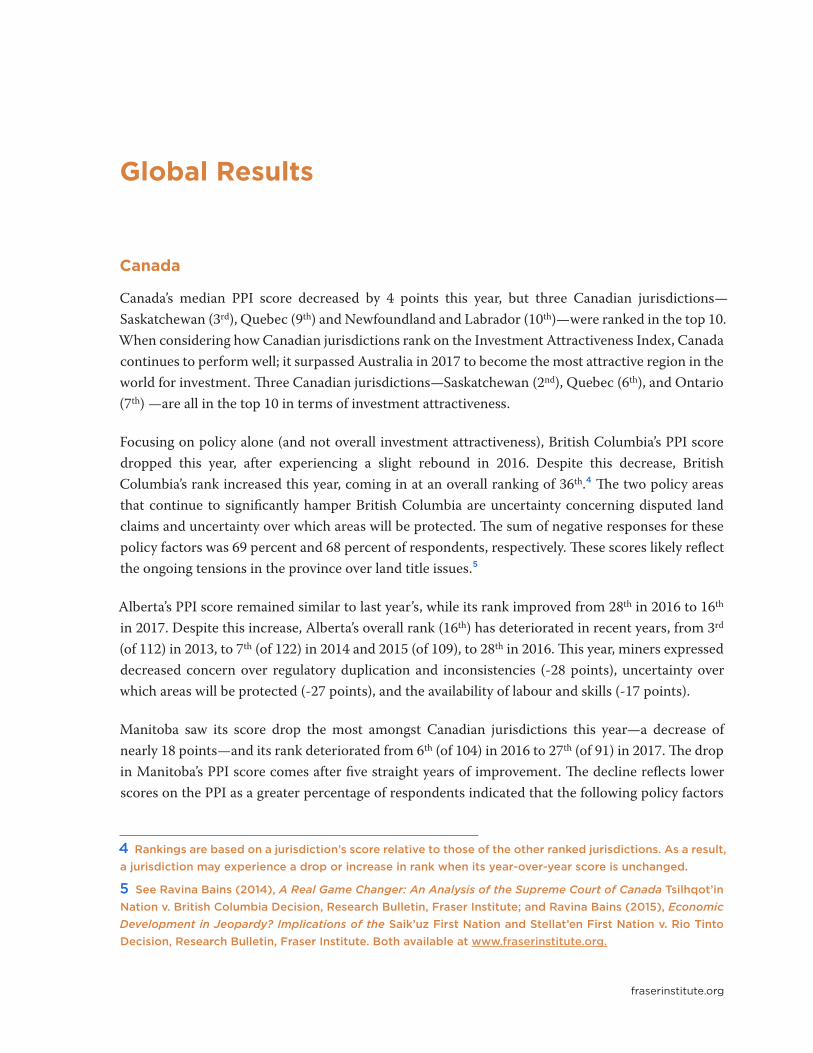
Canada’s median PPI score decreased by 4 points this year, but three Canadian jurisdictions— Saskatchewan (3rd), Quebec (9th) and Newfoundland and Labrador (10th)—were ranked in the top 10. When considering how Canadian jurisdictions rank on the Investment Attractiveness Index, Canada continues to perform well; it surpassed Australia in 2017 to become the most attractive region in the world for investment. Three Canadian jurisdictions—Saskatchewan (2nd), Quebec (6th), and Ontario (7th) —are all in the top 10 in terms of investment attractiveness.
Focusing on policy alone (and not overall investment attractiveness), British Columbia’s PPI score dropped this year, after experiencing a slight rebound in 2016. Despite this decrease, British Columbia’s rank increased this year, coming in at an overall ranking of 36th.4 The two policy areas that continue to significantly hamper British Columbia are uncertainty concerning disputed land claims and uncertainty over which areas will be protected. The sum of negative responses for these policy factors was 69 percent and 68 percent of respondents, respectively. These scores likely reflect the ongoing tensions in the province over land title issues.5
Alberta’s PPI score remained similar to last year’s, while its rank improved from 28th in 2016 to 16th in 2017. Despite this increase, Alberta’s overall rank (16th) has deteriorated in recent years, from 3rd (of 112) in 2013, to 7th (of 122) in 2014 and 2015 (of 109), to 28th in 2016. This year, miners expressed decreased concern over regulatory duplication and inconsistencies (-28 points), uncertainty over which areas will be protected (-27 points), and the availability of labour and skills (-17 points).
Manitoba saw its score drop the most amongst Canadian jurisdictions this year—a decrease of nearly 18 points—and its rank deteriorated from 6th (of 104) in 2016 to 27th (of 91) in 2017. The drop in Manitoba’s PPI score comes after five straight years of improvement. The decline reflects lower scores on the PPI as a greater percentage of respondents indicated that the following policy factors
4 Rankings are based on a jurisdiction’s score relative to those of the other ranked jurisdictions. As a result, a jurisdiction may experience a drop or increase in rank when its year-over-year score is unchanged.
5 See Ravina Bains (2014), A Real Game Changer: An Analysis of the Supreme Court of Canada Tsilhqot’in Nation v. British Columbia Decision, Research Bulletin, Fraser Institute; and Ravina Bains (2015), Economic Development in Jeopardy? Implications of the Saik’uz First Nation and Stellat’en First Nation v. Rio Tinto Decision, Research Bulletin, Fraser Institute. Both available at www.fraserinstitute.org.
26 • Fraser Institute Annual Survey of Mining Companies 2017
fraserinstitute.org
in Manitoba were “deterring investment”: political stability (an increase of 23 percentage points)6, taxation regime (+19 points), and socioeconomic agreements/community development conditions (+17 points), among others.
Ontario’s PPI score remained similar to last year’s, while its rank rose from 26th in 2016 to 20th in 2017. This year, miners expressed decreased concern over uncertainty concerning disputed land claims (-9 points), uncertainty over which areas will be protected (-8 points), and socioeconomic agreements/community development conditions (-5 points).
Quebec’s PPI score decreased slightly this year, while its overall rank improved from 17th in 2016 to 9th in 2017, due to its score relative to those of the other ranked jurisdictions. This year miners expressed decreased concern over regulatory duplication and inconsistencies (-15 points), labour regulations and employment agreements (-9 points), and socioeconomic agreements/community development conditions (-8 points).
Nova Scotia also saw its PPI score decline significantly this year, dropping by nearly 10 points, and its rank decline from 11th in 2016 to 24th in 2017. Miners expressed increased concern over uncertainty regarding the administration, interpretation, or enforcement of existing regulations (+17 points), the legal system (+17 points), and political stability (+11 points).
6 The numbers in brackets show the difference between the total percentage of respondents that rate a particular policy factor as either a mild deterrent to investment, a strong deterrent to investment, or that they would not pursue investment due to this factor from 2016 to 2017 (i.e., the change in percentage points).
Figure 6: Investment Attractiveness Index—Canada
0 10 20 30 40 50 60 70 80 90 100
Nova Scotia
Alberta
New Brunswick
Nunavut
Northwest Territories
British Columbia
Manitoba
Yukon
Newfoundland & Labrador
Ontario
Quebec
Saskatchewan
Fraser Institute Annual Survey of Mining Companies 2017 • 27
fraserinstitute.org
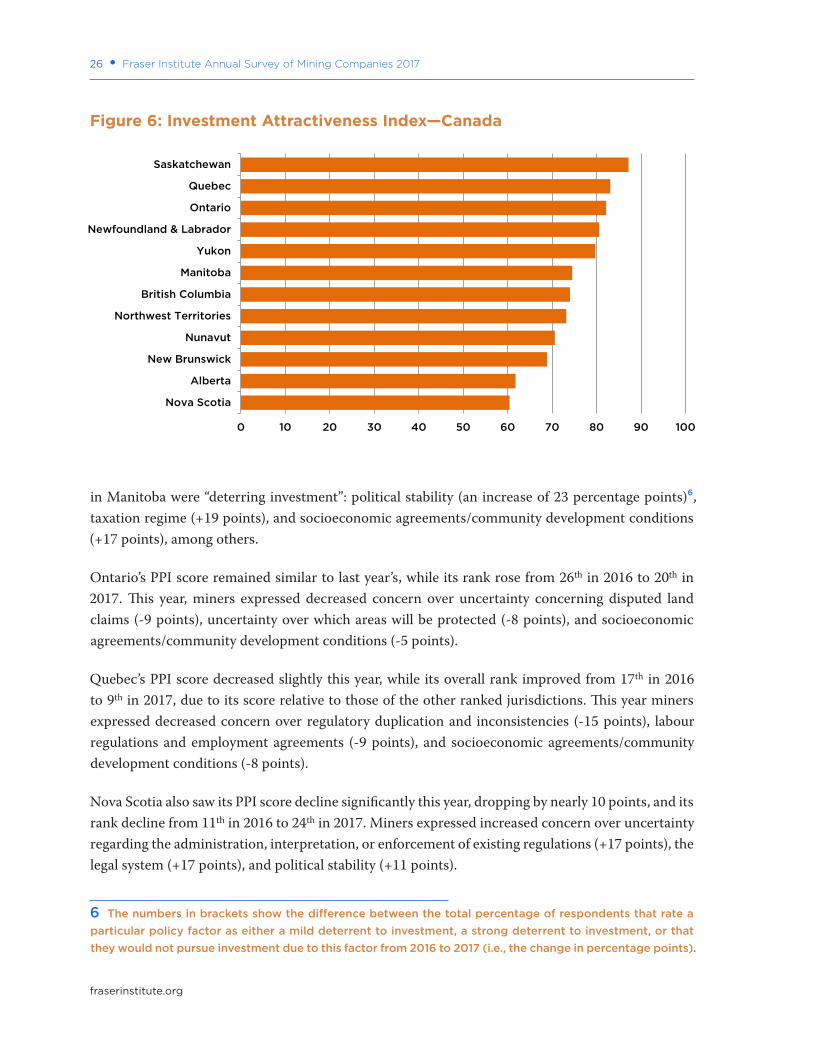
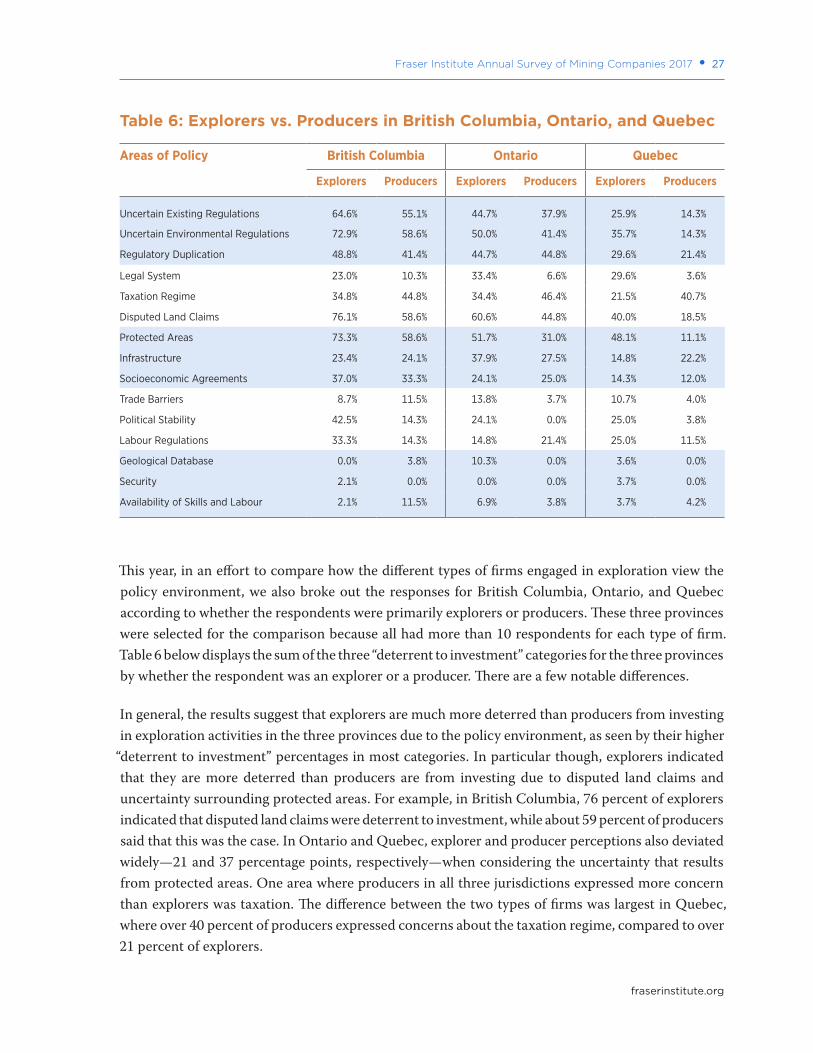
This year, in an effort to compare how the different types of firms engaged in exploration view the policy environment, we also broke out the responses for British Columbia, Ontario, and Quebec according to whether the respondents were primarily explorers or producers. These three provinces were selected for the comparison because all had more than 10 respondents for each type of firm. Table 6 below displays the sum of the three “deterrent to investment” categories for the three provinces by whether the respondent was an explorer or a producer. There are a few notable differences.
In general, the results suggest that explorers are much more deterred than producers from investing in exploration activities in the three provinces due to the policy environment, as seen by their higher
“deterrent to investment” percentages in most categories. In particular though, explorers indicated that they are more deterred than producers are from investing due to disputed land claims and uncertainty surrounding protected areas. For example, in British Columbia, 76 percent of explorers indicated that disputed land claims were deterrent to investment, while about 59 percent of producers said that this was the case. In Ontario and Quebec, explorer and producer perceptions also deviated widely—21 and 37 percentage points, respectively—when considering the uncertainty that results from protected areas. One area where producers in all three jurisdictions expressed more concern than explorers was taxation. The difference between the two types of firms was largest in Quebec, where over 40 percent of producers expressed concerns about the taxation regime, compared to over 21 percent of explorers.
Table 6: Explorers vs. Producers in British Columbia, Ontario, and Quebec
Areas of Policy British Columbia Ontario Quebec
Explorers Producers Explorers Producers Explorers Producers
Uncertain Existing Regulations 64.6% 55.1% 44.7% 37.9% 25.9% 14.3%
Uncertain Environmental Regulations 72.9% 58.6% 50.0% 41.4% 35.7% 14.3%
Regulatory Duplication 48.8% 41.4% 44.7% 44.8% 29.6% 21.4%
Legal System 23.0% 10.3% 33.4% 6.6% 29.6% 3.6%
Taxation Regime 34.8% 44.8% 34.4% 46.4% 21.5% 40.7%
Disputed Land Claims 76.1% 58.6% 60.6% 44.8% 40.0% 18.5%
Protected Areas 73.3% 58.6% 51.7% 31.0% 48.1% 11.1%
Infrastructure 23.4% 24.1% 37.9% 27.5% 14.8% 22.2%
Socioeconomic Agreements 37.0% 33.3% 24.1% 25.0% 14.3% 12.0%
Trade Barriers 8.7% 11.5% 13.8% 3.7% 10.7% 4.0%
Political Stability 42.5% 14.3% 24.1% 0.0% 25.0% 3.8%
Labour Regulations 33.3% 14.3% 14.8% 21.4% 25.0% 11.5%
Geological Database 0.0% 3.8% 10.3% 0.0% 3.6% 0.0%
Security 2.1% 0.0% 0.0% 0.0% 3.7% 0.0%
Availability of Skills and Labour 2.1% 11.5% 6.9% 3.8% 3.7% 4.2%
28 • Fraser Institute Annual Survey of Mining Companies 2017
fraserinstitute.org
Comments: Canada
The comments in the following section have been edited for length, grammar and spelling, to retain confidentiality, and to clarify meanings.
British Columbia
There is a lack of consistency in the application of regulations. Some regions have one set of expectations, particularly environmental, while others are very different. Every time the BC government tries to “simplify” its application process, it actually becomes more complicated.
—A consulting company, Consultant
Excessive permit delays deter investment and hinder British Columbia’s investment climate.
—An exploration company, Company president
Legal decisions and regulatory uncertainty are strong deterrents to investment. Such uncertainty limits resource development.
—An exploration company, Vice-president
The online exploration claim process is easy and quick. The geological survey has an excellent database of what is currently available in British Columbia.
—A consulting company, Consultant
Manitoba
Permitting processes are lengthy and ultimately deter investment. —A consulting company, Company president
Manitoba’s Duty to Consult Framework is unclear and requires revisions. —A consulting company, Consultant
Manitoba has a Mines Branch that keeps up-to-date claim maps and mining disposition status; this is helpful. The system of writing and filing mining claims was changed a few years ago. This new system is actually very useful.
—An exploration company, Company president
Northwest Territories
Ongoing disputes over land claims and protected areas create uncertainty for investors. —An exploration company, Company president
Fraser Institute Annual Survey of Mining Companies 2017 • 29
fraserinstitute.org
Nunavut
Land use permits are being granted and then put on hold due to changing mandates on land use and access related to the Draft Nunavut Land Use Plan. This plan has become very political within Nunavut. There is a significant disconnect between regional organizations and the various levels of government.
—An exploration company, Vice-president
Ontario
Ontario’s high electricity rates are a deterrent to investing in the province. —An exploration company, Consultant
Ontario’s Ring of Fire delays create uncertainty for investors and ultimately deter investment.
—A producer company with more than US$50M, Company president
Quebec
The uranium moratorium is a step in the wrong direction. Such actions will drive investment away from the province.
—A producer company with more than US $50M, Vice-president
Quebec’s low electricity rates make the province attractive for investment. —An exploration company, Consultant
Saskatchewan
This province has a great permitting process that meets time lines and provides certainty for investors.
—An exploration company, Company president
Saskatchewan’s mineral leasing system is excellent compared to other jurisdictions. —A consulting company, Consultant
Yukon
There is constant friction between various levels of government and this creates uncertainty for investors.
—An exploration company, Manager

30 • Fraser Institute Annual Survey of Mining Companies 2017
fraserinstitute.org
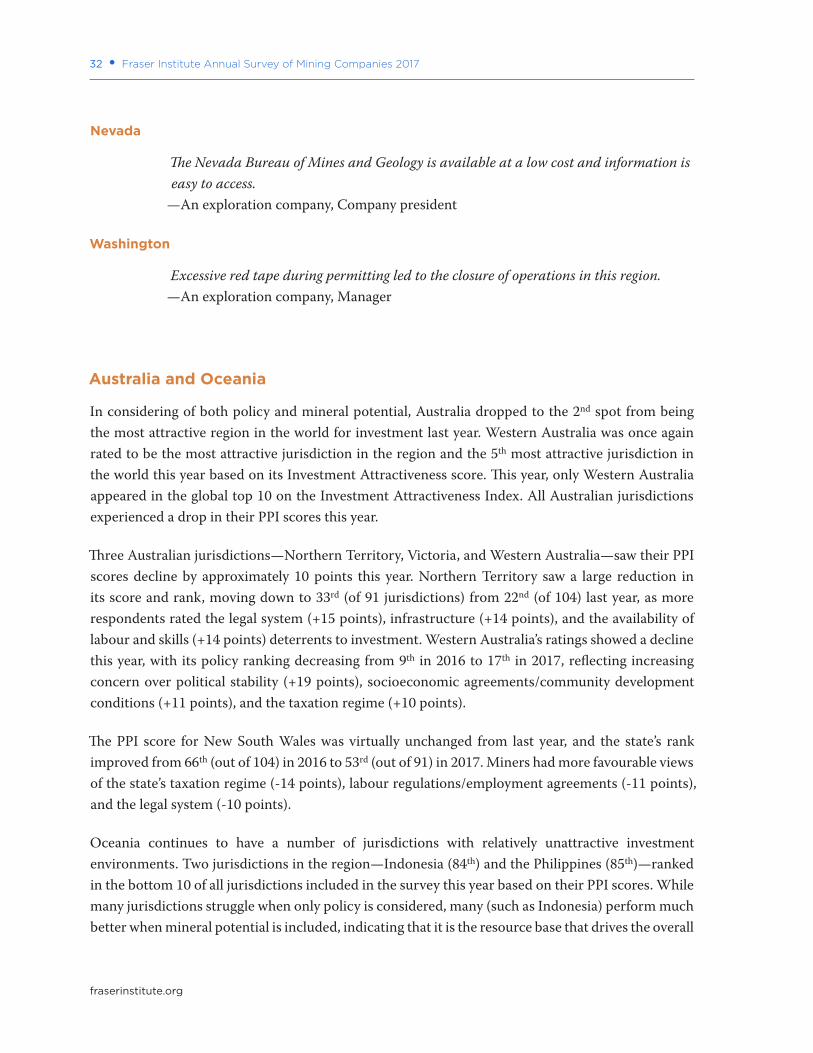
The United States
The United States’ median investment attractiveness score dropped this year. Based on policy factors and mineral potential, the most attractive state to pursue exploration investment is Nevada, which this year ranked as the third most attractive jurisdiction in the world.
Based on the region’s median investment attractiveness score, the United States is the third most attractive region in the world for investment, only slightly behind Canada and Australia. The median PPI score for the United States decreased slightly in 2017. The state with the most attractive policy environment alone is Nevada, which ranked 5th in the world. This year, three US jurisdictions—Nevada (5th), Michigan (7th), and Wyoming (8th)—ranked in the global top 10.
Michigan’s PPI score was similar to last year’s, and its rank increased from 15th (out of 104) in 2016 to 7th (out of 91) in 2017. This year, miners expressed decreased concern in the areas of political stability (-33 points), regulatory duplication and inconsistencies (-24 points), and labour regulations and employment agreements (-22 points).
Amongst US jurisdictions, Washington state saw the greatest improvement in its PPI score this year. Washington’s rank improved from 67th last year to 41st this year. The three areas where Washington experienced the most improvement were: uncertainty concerning environmental regulations (-26 points), socioeconomic agreements/community development conditions (-20 points), and political stability (-19 points).
California is the least attractive jurisdiction in the US based on policy, ranking 61st in 2017. This year, miners expressed greater concern in the areas of uncertainty concerning disputed land claims (+26 points), labour regulations and employment agreements (+11 points), and the availability of labour and skills (+4 points).
Comments: United States
The comments in the following section have been edited for length, grammar and spelling, to retain confidentiality, and to clarify meanings.
Alaska
Alaska has incredible mineral potential and a favorable permitting regime, but regulatory processes remain unclear. In particular, ballot initiatives are creating uncertainty for investors.
—A producer company with more than US $50M, Company president
Fraser Institute Annual Survey of Mining Companies 2017 • 31
fraserinstitute.org
Permit application processes are often stuck in legal limbo. Such legal disputes are time sensitive and excessive delays deter investment.
—A consulting company, Consultant
Arizona
The amount of time it takes to get a drilling permit is excessive and discouraging. —An exploration company, Senior management
Idaho
Legal roadblocks make it impossible to launch a significant project especially in National Forest lands.
—An exploration company, Company president
Minnesota
The US Bureau of Land Management (BLM) announced it would not renew leases as it has before, creating uncertainty for investors.
—An exploration company, Senior management
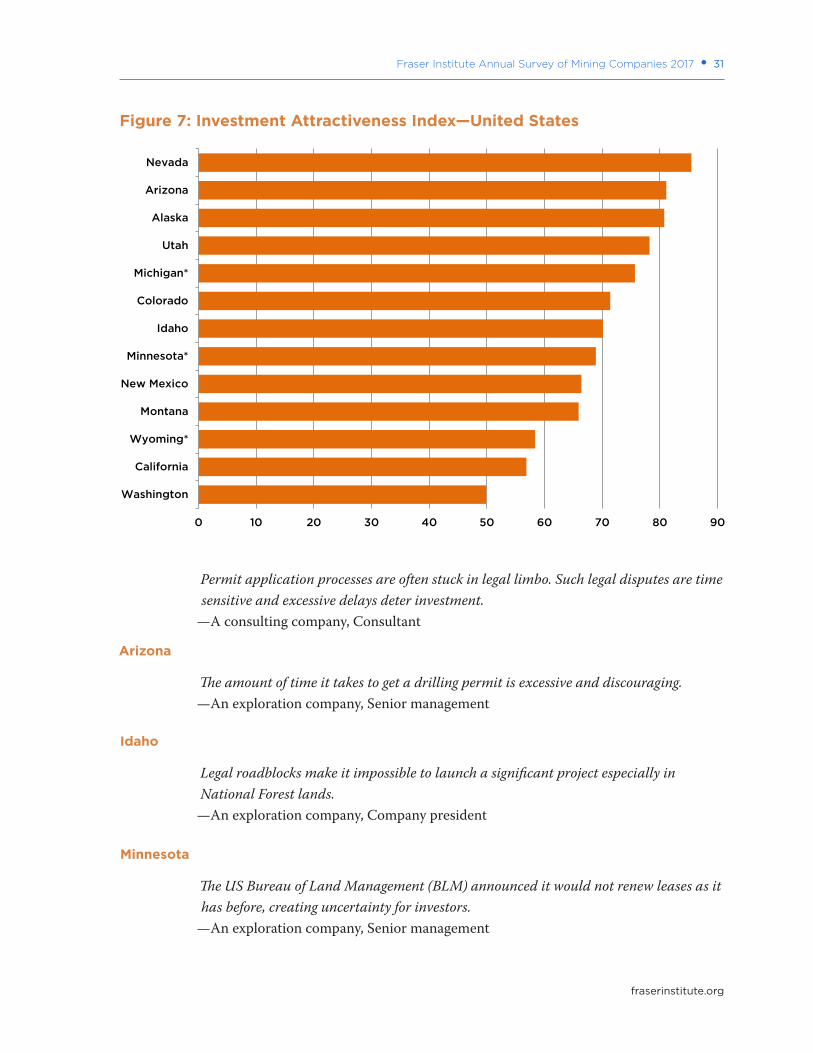
Figure 7: Investment Attractiveness Index—United States
0 10 20 30 40 50 60 70 80 90
Washington
California
Wyoming*
Montana
New Mexico
Minnesota*
Idaho
Colorado
Michigan*
Utah
Alaska
Arizona
Nevada
32 • Fraser Institute Annual Survey of Mining Companies 2017
fraserinstitute.org
Nevada
The Nevada Bureau of Mines and Geology is available at a low cost and information is easy to access.
—An exploration company, Company president
Washington
Excessive red tape during permitting led to the closure of operations in this region. —An exploration company, Manager
Australia and Oceania
In considering of both policy and mineral potential, Australia dropped to the 2nd spot from being the most attractive region in the world for investment last year. Western Australia was once again rated to be the most attractive jurisdiction in the region and the 5th most attractive jurisdiction in the world this year based on its Investment Attractiveness score. This year, only Western Australia appeared in the global top 10 on the Investment Attractiveness Index. All Australian jurisdictions experienced a drop in their PPI scores this year.
Three Australian jurisdictions—Northern Territory, Victoria, and Western Australia—saw their PPI scores decline by approximately 10 points this year. Northern Territory saw a large reduction in its score and rank, moving down to 33rd (of 91 jurisdictions) from 22nd (of 104) last year, as more respondents rated the legal system (+15 points), infrastructure (+14 points), and the availability of labour and skills (+14 points) deterrents to investment. Western Australia’s ratings showed a decline this year, with its policy ranking decreasing from 9th in 2016 to 17th in 2017, reflecting increasing concern over political stability (+19 points), socioeconomic agreements/community development conditions (+11 points), and the taxation regime (+10 points).
The PPI score for New South Wales was virtually unchanged from last year, and the state’s rank improved from 66th (out of 104) in 2016 to 53rd (out of 91) in 2017. Miners had more favourable views of the state’s taxation regime (-14 points), labour regulations/employment agreements (-11 points), and the legal system (-10 points).
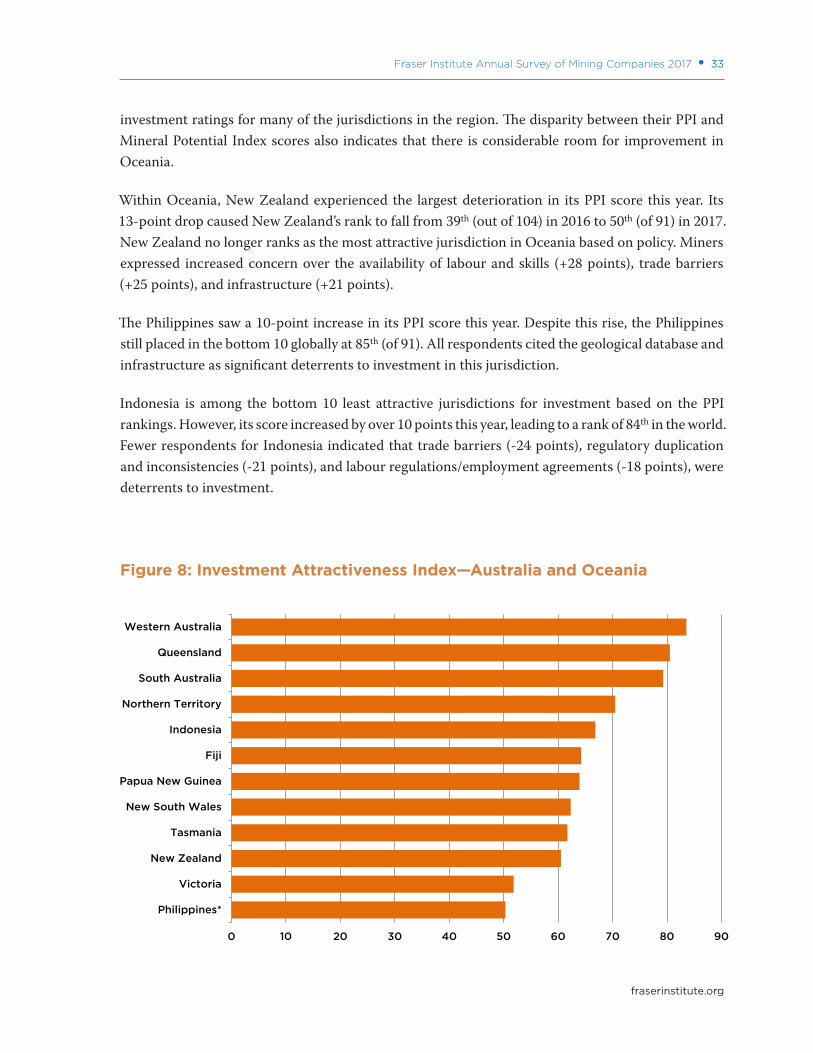
Oceania continues to have a number of jurisdictions with relatively unattractive investment environments. Two jurisdictions in the region—Indonesia (84th) and the Philippines (85th)—ranked in the bottom 10 of all jurisdictions included in the survey this year based on their PPI scores. While many jurisdictions struggle when only policy is considered, many (such as Indonesia) perform much better when mineral potential is included, indicating that it is the resource base that drives the overall
Fraser Institute Annual Survey of Mining Companies 2017 • 33
fraserinstitute.org
investment ratings for many of the jurisdictions in the region. The disparity between their PPI and Mineral Potential Index scores also indicates that there is considerable room for improvement in Oceania.
Within Oceania, New Zealand experienced the largest deterioration in its PPI score this year. Its 13-point drop caused New Zealand’s rank to fall from 39th (out of 104) in 2016 to 50th (of 91) in 2017. New Zealand no longer ranks as the most attractive jurisdiction in Oceania based on policy. Miners expressed increased concern over the availability of labour and skills (+28 points), trade barriers (+25 points), and infrastructure (+21 points).
The Philippines saw a 10-point increase in its PPI score this year. Despite this rise, the Philippines still placed in the bottom 10 globally at 85th (of 91). All respondents cited the geological database and infrastructure as significant deterrents to investment in this jurisdiction.
Indonesia is among the bottom 10 least attractive jurisdictions for investment based on the PPI rankings. However, its score increased by over 10 points this year, leading to a rank of 84th in the world. Fewer respondents for Indonesia indicated that trade barriers (-24 points), regulatory duplication and inconsistencies (-21 points), and labour regulations/employment agreements (-18 points), were deterrents to investment.
Figure 8: Investment Attractiveness Index—Australia and Oceania
0 10 20 30 40 50 60 70 80 90
Philippines*
Victoria
New Zealand
Tasmania
New South Wales
Papua New Guinea
Fiji
Indonesia
Northern Territory
South Australia
Queensland
Western Australia
34 • Fraser Institute Annual Survey of Mining Companies 2017
fraserinstitute.org
Comments: Australia and Oceania
The comments in the following section have been edited for length, grammar and spelling, to retain confidentiality, and to clarify meanings.
Northern Territory
This region’s moratorium on fracking and mandatory land access agreements are deterrents for investors.
—An exploration company, Manager
South Australia
South Australia’s rigorous pursuit of renewable energy sources, without proper transitional arrangements, has created investor concerns about access to reliable power.
—A consulting company, Company president
South Australia has serious inconsistencies between its legislation and departmental policies/guidelines, which creates uncertainty for investors.
—Other, General manager
Western Australia
Excellent and transparent access to a comprehensive geological database. —A consulting company, Consultant
Indonesia
The permitting process in Indonesia is unpredictable. Companies experience unnecessary delays and corruption is apparent.
—A producer company with more than US$50M, Senior management
The government’s forced nationalization of mining properties, insistence on building smelters and other downstream processing facilities are deterrents for investors.
—A producer company with more than US$50M, Vice-president
Papua New Guinea
Land rights issues plague this region, creating investor uncertainty. —An exploration company, Manager
Fraser Institute Annual Survey of Mining Companies 2017 • 35
fraserinstitute.org
Philippines
Lack of physical security and political unpredictability are deterrents to investment in the country.
—A producer company with less than US$50M, Company president
Africa
The median score for Africa on policy factors (PPI) showed a decline this year. This was also the case for the region’s median investment attractiveness score. In terms of overall investment attractiveness, as a region, Africa ranks as the second least attractive jurisdiction for investment.
Two African countries—Zimbabwe (89th) and the Democratic Republic of Congo (87th)—ranked in the bottom 10 of the survey rankings this year based on policy. Zimbabwe was also amongst the bottom 10 in the previous five years. Kenya and Mozambique were the only two African jurisdictions in the global bottom 10 based on their overall investment attractiveness.
Botswana is again the highest ranked jurisdiction in Africa on policy factors, ranking 21st (of 91) in 2017, after ranking 12th (of 104) in 2016. Botswana’s decline in its PPI score this year reflects increased concerns over uncertainty concerning protected areas (+32 points), political stability (+14 points), and infrastructure (+10 points). Namibia is the second most attractive jurisdiction when only policies are considered, ranking 39th (of 91) this year.
Four African countries this year—Democratic Republic of Congo (DRC), Ivory Coast, Tanzania, and Zambia—experienced declines in their PPI scores of over 20 points. The DRC experienced the largest decline in Africa based on the perceptions miners have of policy. The DRC’s decrease of over 25 points resulted in this country dropping from 70th (of 104) last year to 87th (of 91) this year. Investors displayed increased concern this year over trade barriers (+38 points), uncertainty concerning disputed land claims (+37 points), and socioeconomic agreements/community development conditions (+37 points). The Ivory Coast also experienced a large decline of nearly 22 points in its PPI score, resulting in it dropping in the global rankings from 40th (of 104) in 2016 to 67th (of 91) this year. Investors indicated that trade barriers (+70 points), uncertainty regarding the administration, interpretation, or enforcement of existing regulations (+56 points), political instability, and labour regulations and employment agreements (both +40 points) were acting as deterrents to investment this year.
Tanzania’s score and rank also deteriorated this year, dropping from 59th (of 104) last year to 78th (of 91) this year. This year miners expressed increased concern over uncertainty regarding the
36 • Fraser Institute Annual Survey of Mining Companies 2017
fraserinstitute.org
administration, interpretation, or enforcement of existing regulations (+55 points), trade barriers (+50 points), and security (+47 points). Zambia (71st) saw its PPI score decline this year as well, removing this African country from the top 50 countries after ranking 43rd (of 104) last year. Zambia experienced increased concern over the taxation regime (+32 points), geological database (+30 points), and political instability (+30 points).
Comments: Africa
The comments in the following section have been edited for length, grammar and spelling, to retain confidentiality, and to clarify meanings.
Democratic Republic of Congo
Tax bills have been levied at random, revealing unclear laws and instances of corruption.
—An exploration company, Director
Licenses can be removed and re-issued to other parties without reason or an explanation.
—A producer company with more than US$50M, Vice-president
Namibia
The government has issued licenses ahead of its own legislated rules and approval processes. This has caused years of delays and court cases where the government acknowledged fault but still took almost two years to rectify the situation. This delay comes at a high cost for mining companies and further damages a region that is so desperate for employment and economic activity.
—An exploration company, Vice-president
Laws are difficult to navigate. Corruption and nepotism dominate licensing processes. —Other, Geologist
South Africa
The Department of Mineral Resources is corrupt and incapable of administering licenses in an efficient manner. Politically connected people receive special treatment on a regular basis.
—Other, Executive director
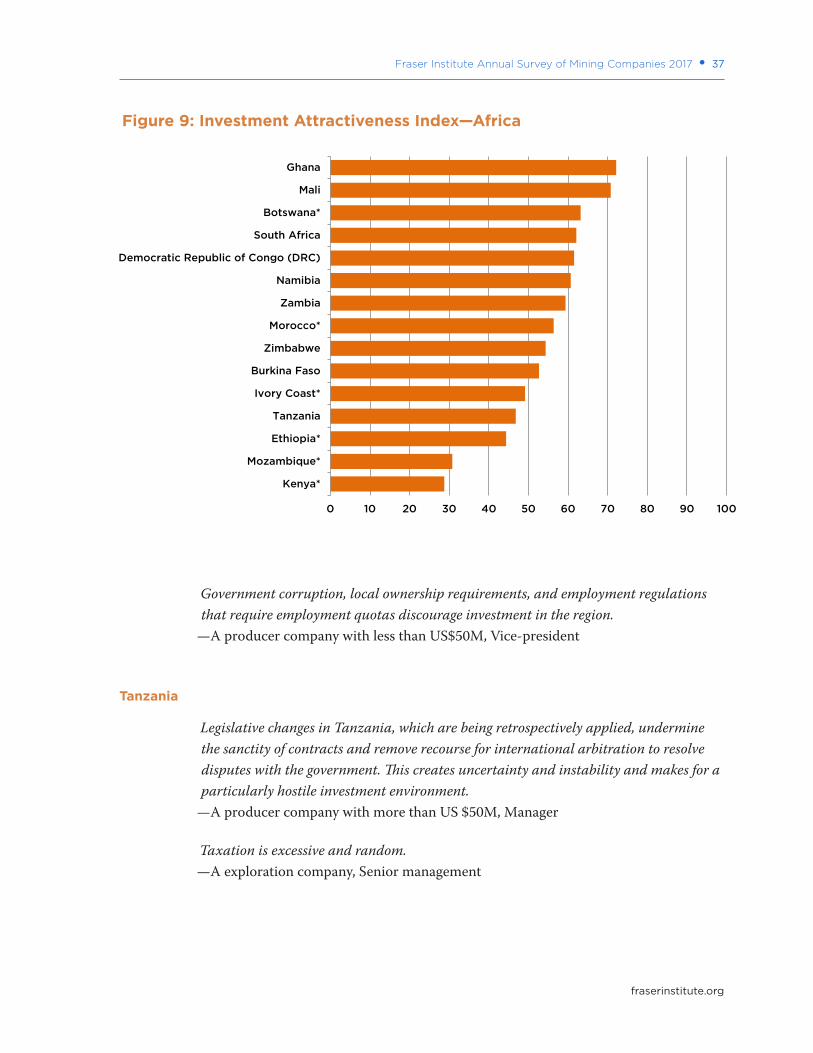
Fraser Institute Annual Survey of Mining Companies 2017 • 37
fraserinstitute.org
Government corruption, local ownership requirements, and employment regulations that require employment quotas discourage investment in the region.
—A producer company with less than US$50M, Vice-president
Tanzania
Legislative changes in Tanzania, which are being retrospectively applied, undermine the sanctity of contracts and remove recourse for international arbitration to resolve disputes with the government. This creates uncertainty and instability and makes for a particularly hostile investment environment.
—A producer company with more than US $50M, Manager
Taxation is excessive and random. —A exploration company, Senior management
Figure 9: Investment Attractiveness Index—Africa
0 10 20 30 40 50 60 70 80 90 100
Kenya*
Mozambique*
Ethiopia*
Tanzania
Ivory Coast*
Burkina Faso
Zimbabwe
Morocco*
Zambia
Namibia
Democratic Republic of Congo (DRC)
South Africa
Botswana*
Mali
Ghana
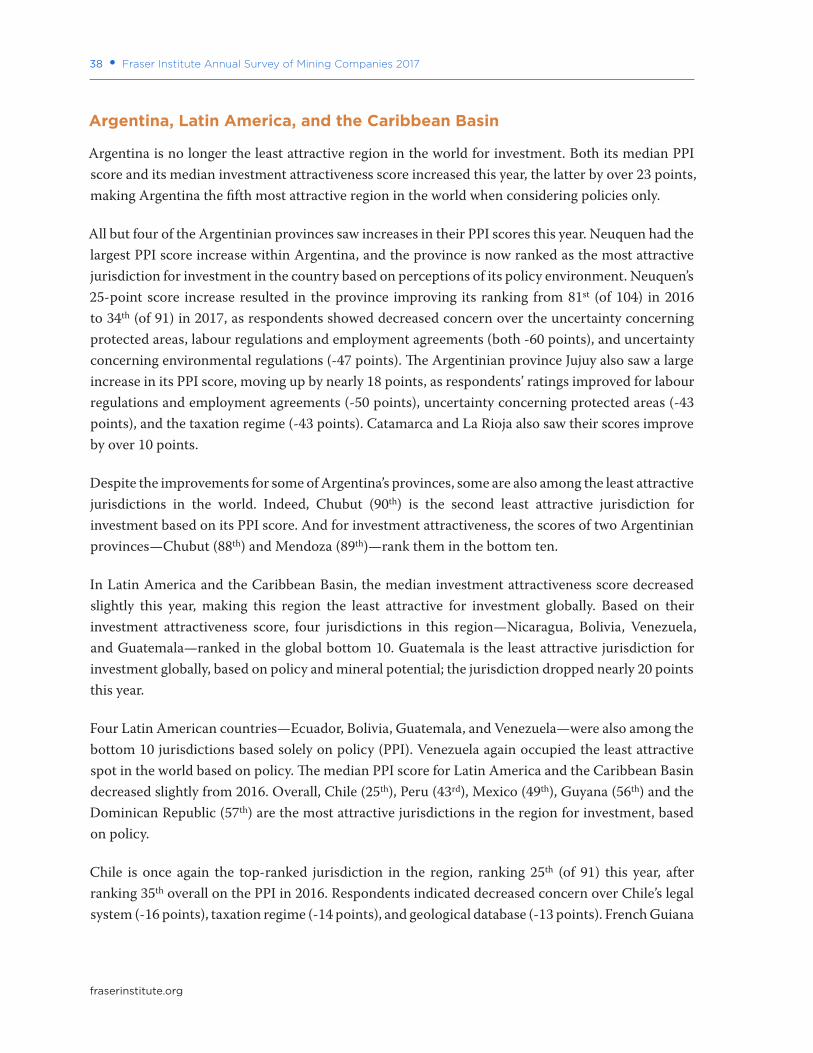
38 • Fraser Institute Annual Survey of Mining Companies 2017
fraserinstitute.org
Argentina, Latin America, and the Caribbean Basin
Argentina is no longer the least attractive region in the world for investment. Both its median PPI score and its median investment attractiveness score increased this year, the latter by over 23 points, making Argentina the fifth most attractive region in the world when considering policies only.
All but four of the Argentinian provinces saw increases in their PPI scores this year. Neuquen had the largest PPI score increase within Argentina, and the province is now ranked as the most attractive jurisdiction for investment in the country based on perceptions of its policy environment. Neuquen’s 25-point score increase resulted in the province improving its ranking from 81st (of 104) in 2016 to 34th (of 91) in 2017, as respondents showed decreased concern over the uncertainty concerning protected areas, labour regulations and employment agreements (both -60 points), and uncertainty concerning environmental regulations (-47 points). The Argentinian province Jujuy also saw a large increase in its PPI score, moving up by nearly 18 points, as respondents’ ratings improved for labour regulations and employment agreements (-50 points), uncertainty concerning protected areas (-43 points), and the taxation regime (-43 points). Catamarca and La Rioja also saw their scores improve by over 10 points.
Despite the improvements for some of Argentina’s provinces, some are also among the least attractive jurisdictions in the world. Indeed, Chubut (90th) is the second least attractive jurisdiction for investment based on its PPI score. And for investment attractiveness, the scores of two Argentinian provinces—Chubut (88th) and Mendoza (89th)—rank them in the bottom ten.
In Latin America and the Caribbean Basin, the median investment attractiveness score decreased slightly this year, making this region the least attractive for investment globally. Based on their investment attractiveness score, four jurisdictions in this region—Nicaragua, Bolivia, Venezuela, and Guatemala—ranked in the global bottom 10. Guatemala is the least attractive jurisdiction for investment globally, based on policy and mineral potential; the jurisdiction dropped nearly 20 points this year.
Four Latin American countries—Ecuador, Bolivia, Guatemala, and Venezuela—were also among the bottom 10 jurisdictions based solely on policy (PPI). Venezuela again occupied the least attractive spot in the world based on policy. The median PPI score for Latin America and the Caribbean Basin decreased slightly from 2016. Overall, Chile (25th), Peru (43rd), Mexico (49th), Guyana (56th) and the Dominican Republic (57th) are the most attractive jurisdictions in the region for investment, based on policy.
Chile is once again the top-ranked jurisdiction in the region, ranking 25th (of 91) this year, after ranking 35th overall on the PPI in 2016. Respondents indicated decreased concern over Chile’s legal system (-16 points), taxation regime (-14 points), and geological database (-13 points). French Guiana
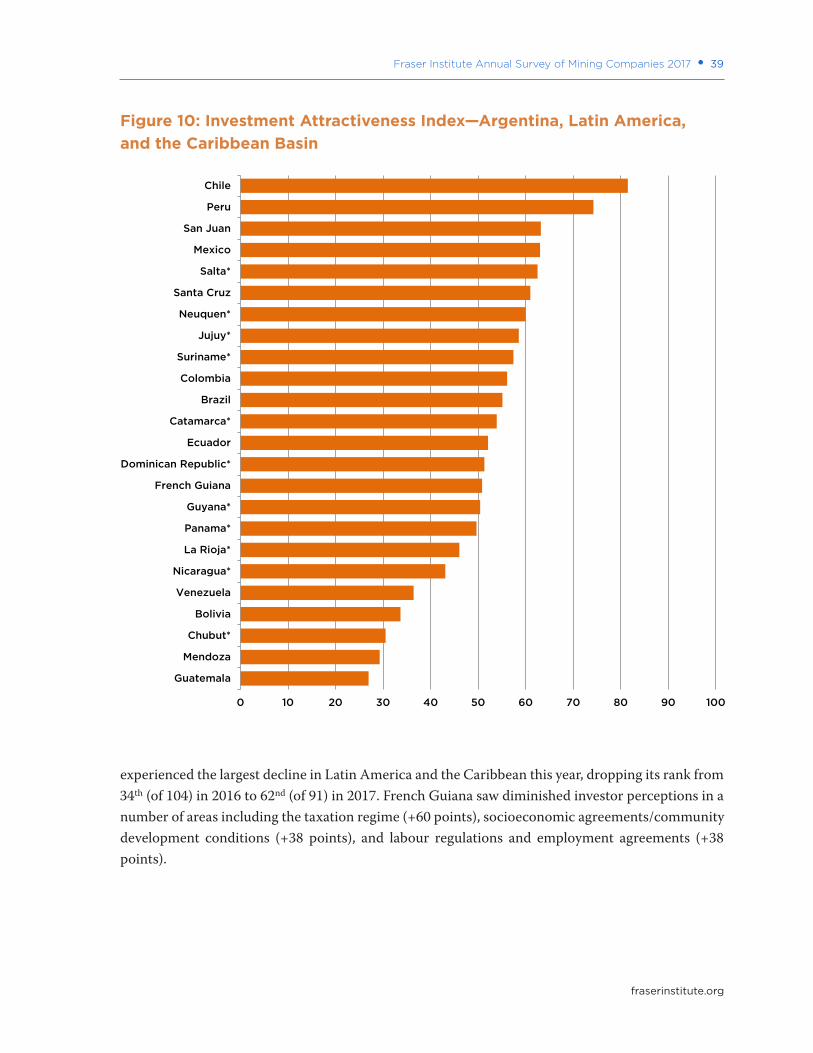
Fraser Institute Annual Survey of Mining Companies 2017 • 39
fraserinstitute.org
experienced the largest decline in Latin America and the Caribbean this year, dropping its rank from 34th (of 104) in 2016 to 62nd (of 91) in 2017. French Guiana saw diminished investor perceptions in a number of areas including the taxation regime (+60 points), socioeconomic agreements/community development conditions (+38 points), and labour regulations and employment agreements (+38 points).
Figure 10: Investment Attractiveness Index—Argentina, Latin America, and the Caribbean Basin
0 10 20 30 40 50 60 70 80 90 100
Guatemala
Mendoza
Chubut*
Bolivia
Venezuela
Nicaragua*
La Rioja*
Panama*
Guyana*
French Guiana
Dominican Republic*
Ecuador
Catamarca*
Brazil
Colombia
Suriname*
Jujuy*
Neuquen*
Santa Cruz
Salta*
Mexico
San Juan
Peru
Chile
40 • Fraser Institute Annual Survey of Mining Companies 2017
fraserinstitute.org
Comments on Argentina, Latin America, and the Caribbean Basin
The comments in the following section have been edited for length, grammar and spelling, to retain confidentiality, and to clarify meanings.
Catamarca
Border disputes resulted in questionable behavior from local authorities. Corruption in this region led to a misallocation of exploitation permits.
—A consulting company, Company president
Chubut
The ban on open pit mining is a disaster and the proposed high-royalty “solution” a total nightmare.
—An exploration company, Company president
Mendoza
Mendoza has a ban on open pit mining and cyanide use. Such policies are unfavorable for investment in exploration and mining.
—An exploration company, Company president
Salta
Permit discrepancies and inconsistencies between provinces are concerning for investors.
—A consulting company, Company president
Bolivia
The government has significantly increased their tax take from mining operations, which is a deterrent to investing in the country.
—A consulting company, Company president
Brazil
The granting of exploration licenses has been suspended in most states. This drastic action is a major deterrent for investors.
—A consulting company, Manager
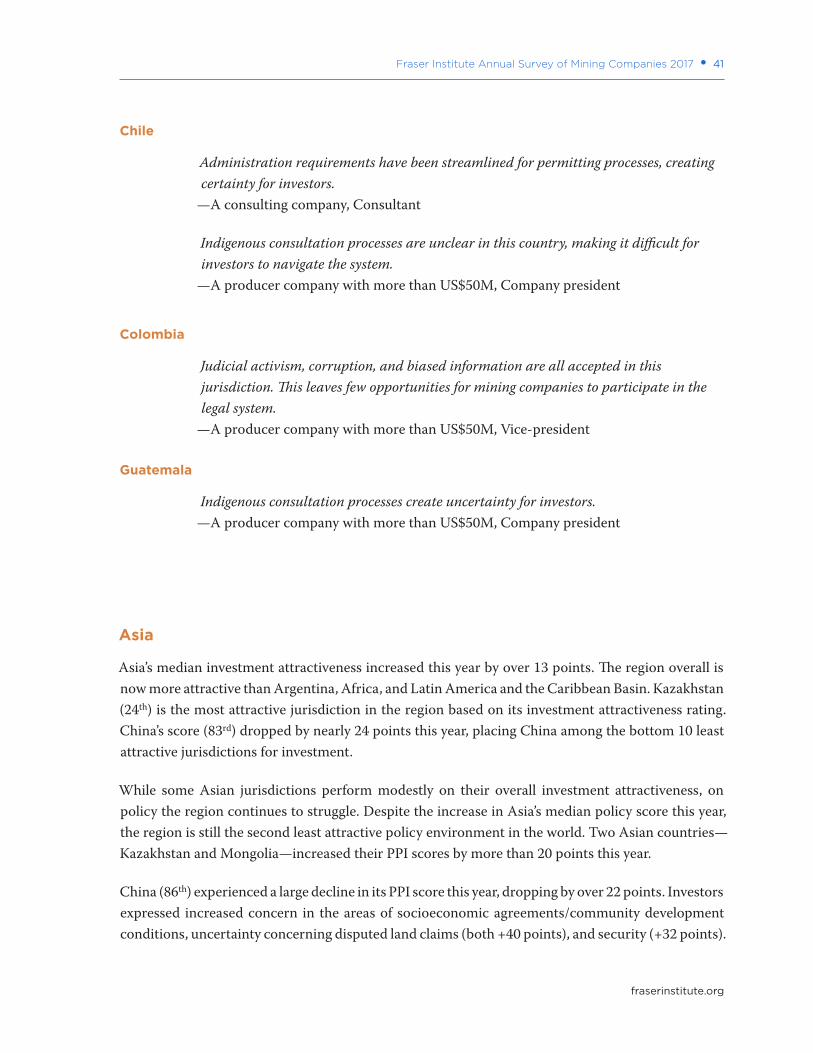
Fraser Institute Annual Survey of Mining Companies 2017 • 41
fraserinstitute.org
Chile
Administration requirements have been streamlined for permitting processes, creating certainty for investors.
—A consulting company, Consultant
Indigenous consultation processes are unclear in this country, making it difficult for investors to navigate the system.
—A producer company with more than US$50M, Company president
Colombia
Judicial activism, corruption, and biased information are all accepted in this jurisdiction. This leaves few opportunities for mining companies to participate in the legal system.
—A producer company with more than US$50M, Vice-president
Guatemala
Indigenous consultation processes create uncertainty for investors. —A producer company with more than US$50M, Company president
Asia
Asia’s median investment attractiveness increased this year by over 13 points. The region overall is now more attractive than Argentina, Africa, and Latin America and the Caribbean Basin. Kazakhstan (24th) is the most attractive jurisdiction in the region based on its investment attractiveness rating. China’s score (83rd) dropped by nearly 24 points this year, placing China among the bottom 10 least attractive jurisdictions for investment.
While some Asian jurisdictions perform modestly on their overall investment attractiveness, on policy the region continues to struggle. Despite the increase in Asia’s median policy score this year, the region is still the second least attractive policy environment in the world. Two Asian countries—Kazakhstan and Mongolia—increased their PPI scores by more than 20 points this year.
China (86th) experienced a large decline in its PPI score this year, dropping by over 22 points. Investors expressed increased concern in the areas of socioeconomic agreements/community development conditions, uncertainty concerning disputed land claims (both +40 points), and security (+32 points).
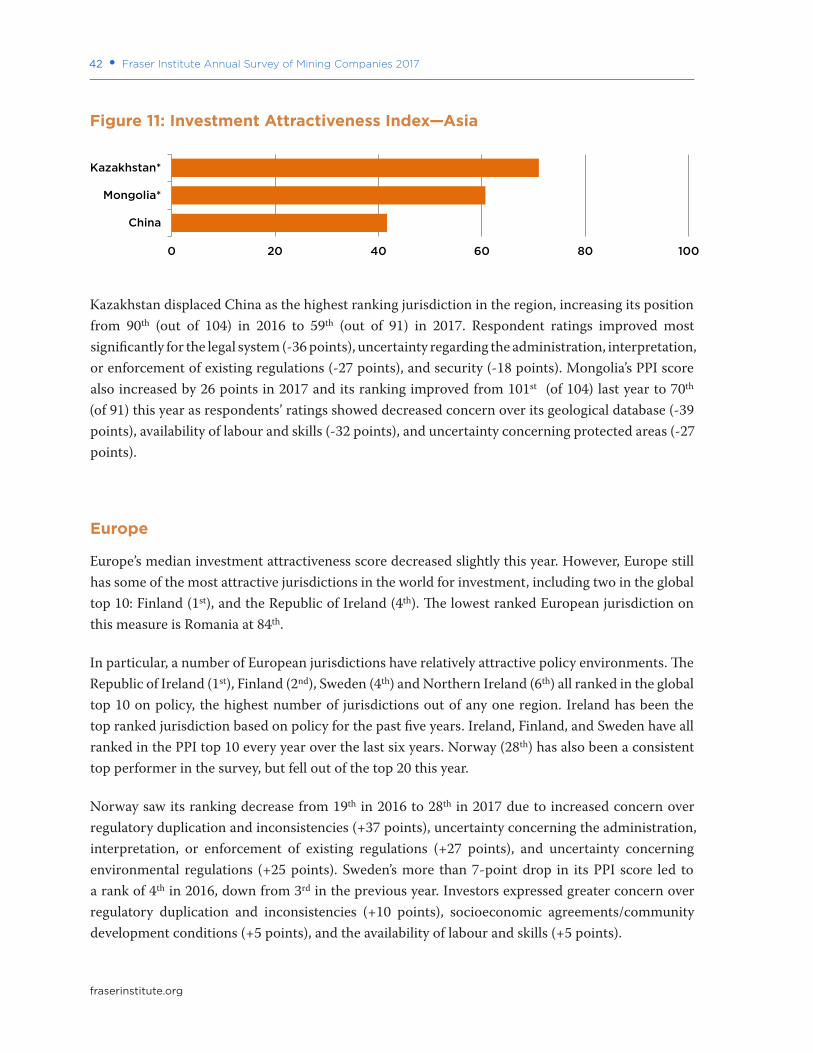
42 • Fraser Institute Annual Survey of Mining Companies 2017
fraserinstitute.org
Kazakhstan displaced China as the highest ranking jurisdiction in the region, increasing its position from 90th (out of 104) in 2016 to 59th (out of 91) in 2017. Respondent ratings improved most significantly for the legal system (-36 points), uncertainty regarding the administration, interpretation, or enforcement of existing regulations (-27 points), and security (-18 points). Mongolia’s PPI score also increased by 26 points in 2017 and its ranking improved from 101st (of 104) last year to 70th
(of 91) this year as respondents’ ratings showed decreased concern over its geological database (-39 points), availability of labour and skills (-32 points), and uncertainty concerning protected areas (-27 points).
Europe
Europe’s median investment attractiveness score decreased slightly this year. However, Europe still has some of the most attractive jurisdictions in the world for investment, including two in the global top 10: Finland (1st), and the Republic of Ireland (4th). The lowest ranked European jurisdiction on this measure is Romania at 84th.
In particular, a number of European jurisdictions have relatively attractive policy environments. The Republic of Ireland (1st), Finland (2nd), Sweden (4th) and Northern Ireland (6th) all ranked in the global top 10 on policy, the highest number of jurisdictions out of any one region. Ireland has been the top ranked jurisdiction based on policy for the past five years. Ireland, Finland, and Sweden have all ranked in the PPI top 10 every year over the last six years. Norway (28th) has also been a consistent top performer in the survey, but fell out of the top 20 this year.
Norway saw its ranking decrease from 19th in 2016 to 28th in 2017 due to increased concern over regulatory duplication and inconsistencies (+37 points), uncertainty concerning the administration, interpretation, or enforcement of existing regulations (+27 points), and uncertainty concerning environmental regulations (+25 points). Sweden’s more than 7-point drop in its PPI score led to a rank of 4th in 2016, down from 3rd in the previous year. Investors expressed greater concern over regulatory duplication and inconsistencies (+10 points), socioeconomic agreements/community development conditions (+5 points), and the availability of labour and skills (+5 points).
Figure 11: Investment Attractiveness Index—Asia
0 20 40 60 80 100
China
Mongolia*
Kazakhstan*
Fraser Institute Annual Survey of Mining Companies 2017 • 43
fraserinstitute.org
Serbia moved up from 33rd last year to 19th this year. Its higher PPI score is reflective of improved perceptions by respondents of the uncertainty concerning environmental regulations (-42 points), regulatory duplication and inconsistencies (-31 points), and the taxation regime (-30 points).
Comments on Europe
The comments in the following section have been edited for length, grammar and spelling, to retain confidentiality, and to clarify meanings.
Finland
Finland is a very transparent system, with excellent access to data and information. —A consulting company, Manager
Northern Ireland
The availability of geoscientific data in Northern Ireland is superb. —A producer company with more than US$50M, Manager
Figure 12: Investment Attractiveness Index—Europe
0 10 20 30 40 50 60 70 80 90 100
Romania*
Turkey
Northern Ireland
Norway
Spain*
Greenland
Russia*
Portugal*
Serbia*
Sweden
Ireland, Republic of
Finland
44 • Fraser Institute Annual Survey of Mining Companies 2017
fraserinstitute.org
Norway
Norway is plagued by inconsistent and unclear laws and regulations. Administrative errors unnecessarily stall exploration licensing processes.
—An exploration company, Company president
Republic of Ireland
The Republic of Ireland is a jurisdiction where they do as they say, constantly, and in a transparent manner. Officials have a can-do attitude that follows the laws of the land, which is a refreshing change.
—An exploration company, Company president
This jurisdiction processes license approvals in a timely manner (normally 1–2 months) and permissions to drill can be issued within weeks. Ireland’s efficient administrative processes ultimately encourage investment.
—An exploration company, Senior management
Sweden
Sweden is a stable system; however, there is still room for improvement. Investors have concerns over permit delays, lengthy legal disputes, and inconsistent environmental regulations.
—An exploration company, Other
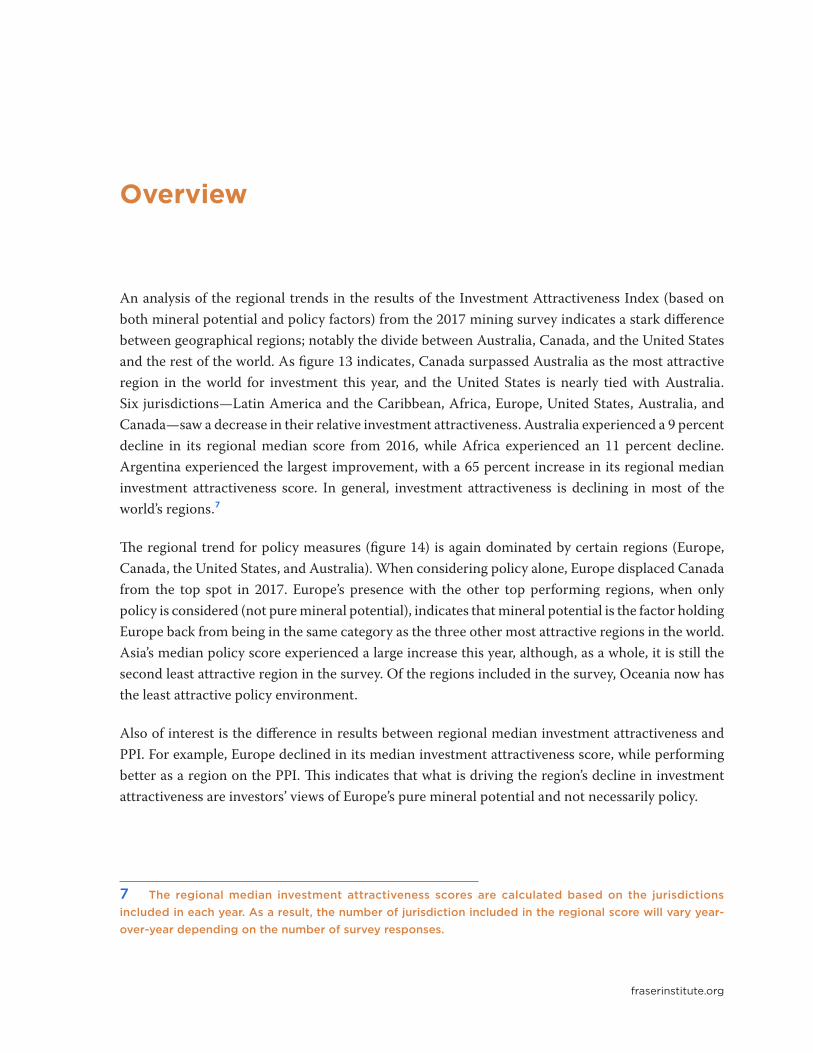
fraserinstitute.org
Overview
An analysis of the regional trends in the results of the Investment Attractiveness Index (based on both mineral potential and policy factors) from the 2017 mining survey indicates a stark difference between geographical regions; notably the divide between Australia, Canada, and the United States and the rest of the world. As figure 13 indicates, Canada surpassed Australia as the most attractive region in the world for investment this year, and the United States is nearly tied with Australia. Six jurisdictions—Latin America and the Caribbean, Africa, Europe, United States, Australia, and Canada—saw a decrease in their relative investment attractiveness. Australia experienced a 9 percent decline in its regional median score from 2016, while Africa experienced an 11 percent decline. Argentina experienced the largest improvement, with a 65 percent increase in its regional median investment attractiveness score. In general, investment attractiveness is declining in most of the world’s regions.7
The regional trend for policy measures (figure 14) is again dominated by certain regions (Europe, Canada, the United States, and Australia). When considering policy alone, Europe displaced Canada from the top spot in 2017. Europe’s presence with the other top performing regions, when only policy is considered (not pure mineral potential), indicates that mineral potential is the factor holding Europe back from being in the same category as the three other most attractive regions in the world. Asia’s median policy score experienced a large increase this year, although, as a whole, it is still the second least attractive region in the survey. Of the regions included in the survey, Oceania now has the least attractive policy environment.
Also of interest is the difference in results between regional median investment attractiveness and PPI. For example, Europe declined in its median investment attractiveness score, while performing better as a region on the PPI. This indicates that what is driving the region’s decline in investment attractiveness are investors’ views of Europe’s pure mineral potential and not necessarily policy.
7 The regional median investment attractiveness scores are calculated based on the jurisdictions included in each year. As a result, the number of jurisdiction included in the regional score will vary year-over-year depending on the number of survey responses.
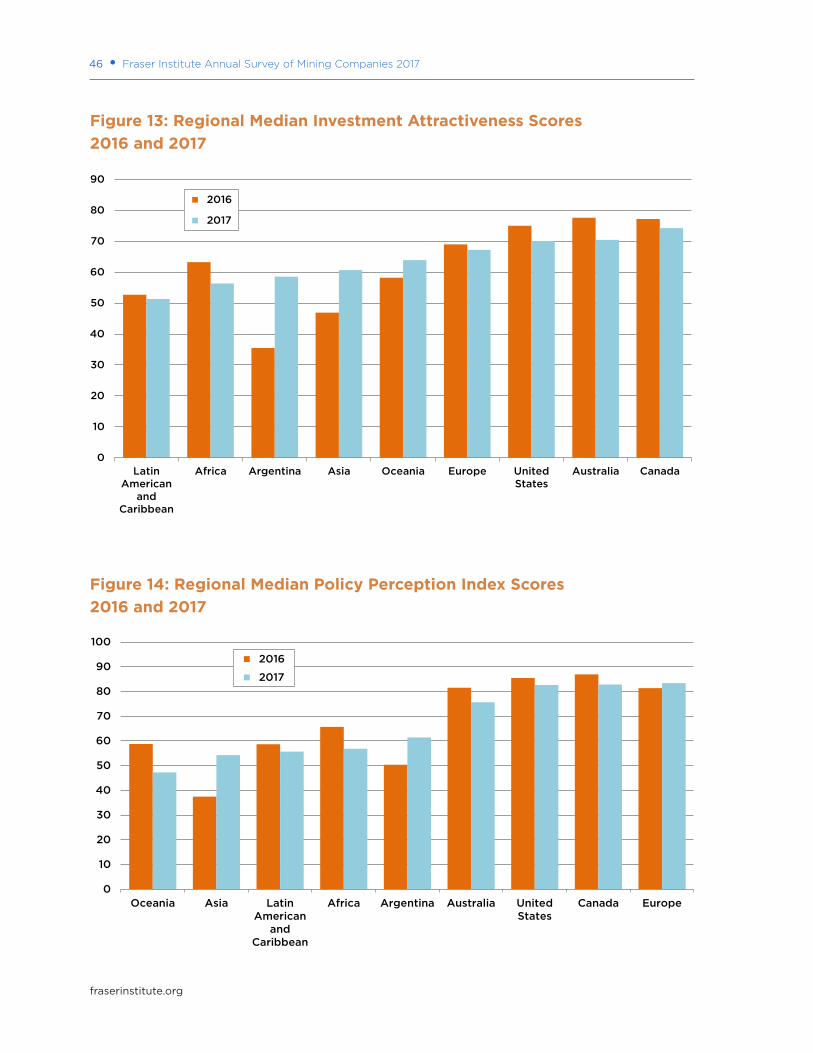
46 • Fraser Institute Annual Survey of Mining Companies 2017
fraserinstitute.org
Figure 14: Regional Median Policy Perception Index Scores 2016 and 2017
Figure 13: Regional Median Investment Attractiveness Scores 2016 and 2017
0
10
20
30
40
50
60
70
80
90
100
Oceania Asia LatinAmerican
andCaribbean
Africa Argentina Australia UnitedStates
Canada Europe
2016
2017
0
10
20
30
40
50
60
70
80
90
LatinAmerican
andCaribbean
Africa Argentina Asia Oceania Europe UnitedStates
Australia Canada
2016
2017
fraserinstitute.org
Explanation of the figures
Figures 15 through 29 show the percentage of respondents who rate each policy factor as “encouraging investment” or “not a deterrent to investment: (a “1” or “2” on the scale). Readers will find a breakdown of both negative and positive responses for all areas online at fraserinstitute.org. (Note that any jurisdictions shown with a * received between 5 and 9 responses from survey participants.)
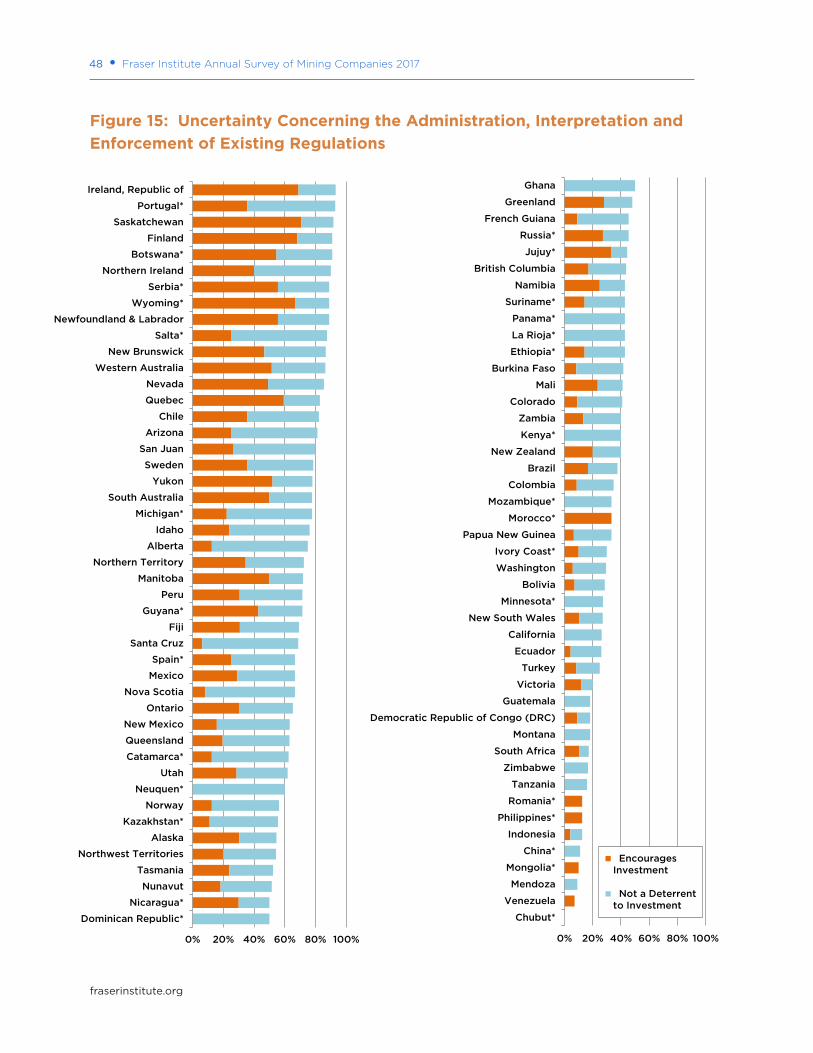
48 • Fraser Institute Annual Survey of Mining Companies 2017
fraserinstitute.org
Figure 15: Uncertainty Concerning the Administration, Interpretation and Enforcement of Existing Regulations
0% 20% 40% 60% 80% 100%
Dominican Republic*
Nicaragua*
Nunavut
Tasmania
Northwest Territories
Alaska
Kazakhstan*
Norway
Neuquen*
Utah
Catamarca*
Queensland
New Mexico
Ontario
Nova Scotia
Mexico
Spain*
Santa Cruz
Fiji
Guyana*
Peru
Manitoba
Northern Territory
Alberta
Idaho
Michigan*
South Australia
Yukon
Sweden
San Juan
Arizona
Chile
Quebec
Nevada
Western Australia
New Brunswick
Salta*
Newfoundland & Labrador
Wyoming*
Serbia*
Northern Ireland
Botswana*
Finland
Saskatchewan
Portugal*
Ireland, Republic of
0% 20% 40% 60% 80% 100%
Chubut*
Venezuela
Mendoza
Mongolia*
China*
Indonesia
Philippines*
Romania*
Tanzania
Zimbabwe
South Africa
Montana
Democratic Republic of Congo (DRC)
Guatemala
Victoria
Turkey
Ecuador
California
New South Wales
Minnesota*
Bolivia
Washington
Ivory Coast*
Papua New Guinea
Morocco*
Mozambique*
Colombia
Brazil
New Zealand
Kenya*
Zambia
Colorado
Mali
Burkina Faso
Ethiopia*
La Rioja*
Panama*
Suriname*
Namibia
British Columbia
Jujuy*
Russia*
French Guiana
Greenland
Ghana
EncouragesInvestment
Not a Deterrentto Investment
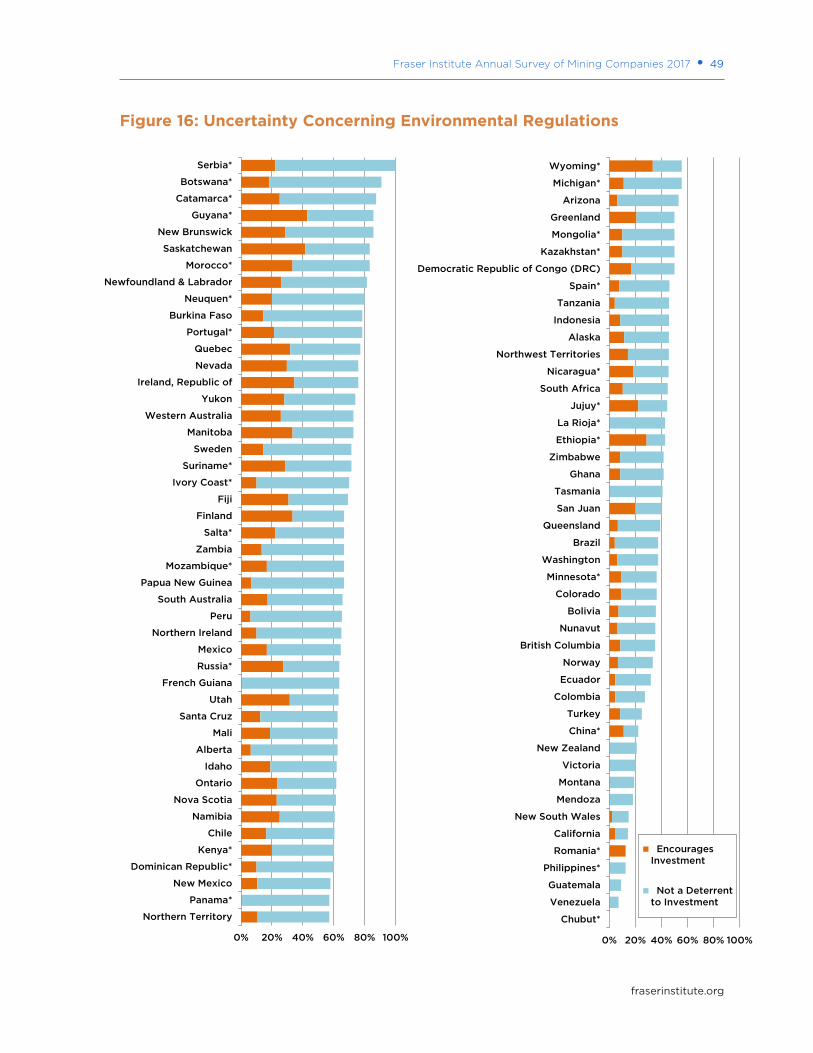
Fraser Institute Annual Survey of Mining Companies 2017 • 49
fraserinstitute.org
Figure 16: Uncertainty Concerning Environmental Regulations
0% 20% 40% 60% 80% 100%
Northern Territory
Panama*
New Mexico
Dominican Republic*
Kenya*
Chile
Namibia
Nova Scotia
Ontario
Idaho
Alberta
Mali
Santa Cruz
Utah
French Guiana
Russia*
Mexico
Northern Ireland
Peru
South Australia
Papua New Guinea
Mozambique*
Zambia
Salta*
Finland
Fiji
Ivory Coast*
Suriname*
Sweden
Manitoba
Western Australia
Yukon
Ireland, Republic of
Nevada
Quebec
Portugal*
Burkina Faso
Neuquen*
Newfoundland & Labrador
Morocco*
Saskatchewan
New Brunswick
Guyana*
Catamarca*
Botswana*
Serbia*
0% 20% 40% 60% 80% 100%
Chubut*
Venezuela
Guatemala
Philippines*
Romania*
California
New South Wales
Mendoza
Montana
Victoria
New Zealand
China*
Turkey
Colombia
Ecuador
Norway
British Columbia
Nunavut
Bolivia
Colorado
Minnesota*
Washington
Brazil
Queensland
San Juan
Tasmania
Ghana
Zimbabwe
Ethiopia*
La Rioja*
Jujuy*
South Africa
Nicaragua*
Northwest Territories
Alaska
Indonesia
Tanzania
Spain*
Democratic Republic of Congo (DRC)
Kazakhstan*
Mongolia*
Greenland
Arizona
Michigan*
Wyoming*
EncouragesInvestment
Not a Deterrentto Investment
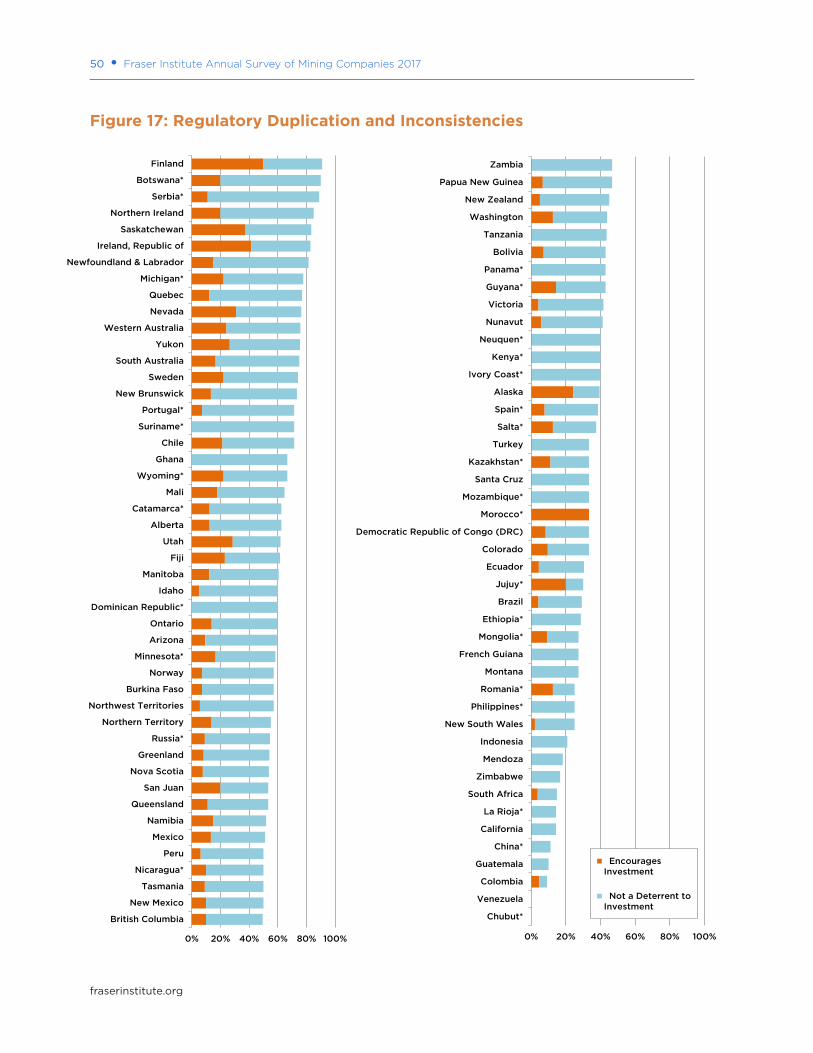
50 • Fraser Institute Annual Survey of Mining Companies 2017
fraserinstitute.org
Figure 17: Regulatory Duplication and Inconsistencies
0% 20% 40% 60% 80% 100%
British Columbia
New Mexico
Tasmania
Nicaragua*
Peru
Mexico
Namibia
Queensland
San Juan
Nova Scotia
Greenland
Russia*
Northern Territory
Northwest Territories
Burkina Faso
Norway
Minnesota*
Arizona
Ontario
Dominican Republic*
Idaho
Manitoba
Fiji
Utah
Alberta
Catamarca*
Mali
Wyoming*
Ghana
Chile
Suriname*
Portugal*
New Brunswick
Sweden
South Australia
Yukon
Western Australia
Nevada
Quebec
Michigan*
Newfoundland & Labrador
Ireland, Republic of
Saskatchewan
Northern Ireland
Serbia*
Botswana*
Finland
0% 20% 40% 60% 80% 100%
Chubut*
Venezuela
Colombia
Guatemala
China*
California
La Rioja*
South Africa
Zimbabwe
Mendoza
Indonesia
New South Wales
Philippines*
Romania*
Montana
French Guiana
Mongolia*
Ethiopia*
Brazil
Jujuy*
Ecuador
Colorado
Democratic Republic of Congo (DRC)
Morocco*
Mozambique*
Santa Cruz
Kazakhstan*
Turkey
Salta*
Spain*
Alaska
Ivory Coast*
Kenya*
Neuquen*
Nunavut
Victoria
Guyana*
Panama*
Bolivia
Tanzania
Washington
New Zealand
Papua New Guinea
Zambia
EncouragesInvestment
Not a Deterrent toInvestment
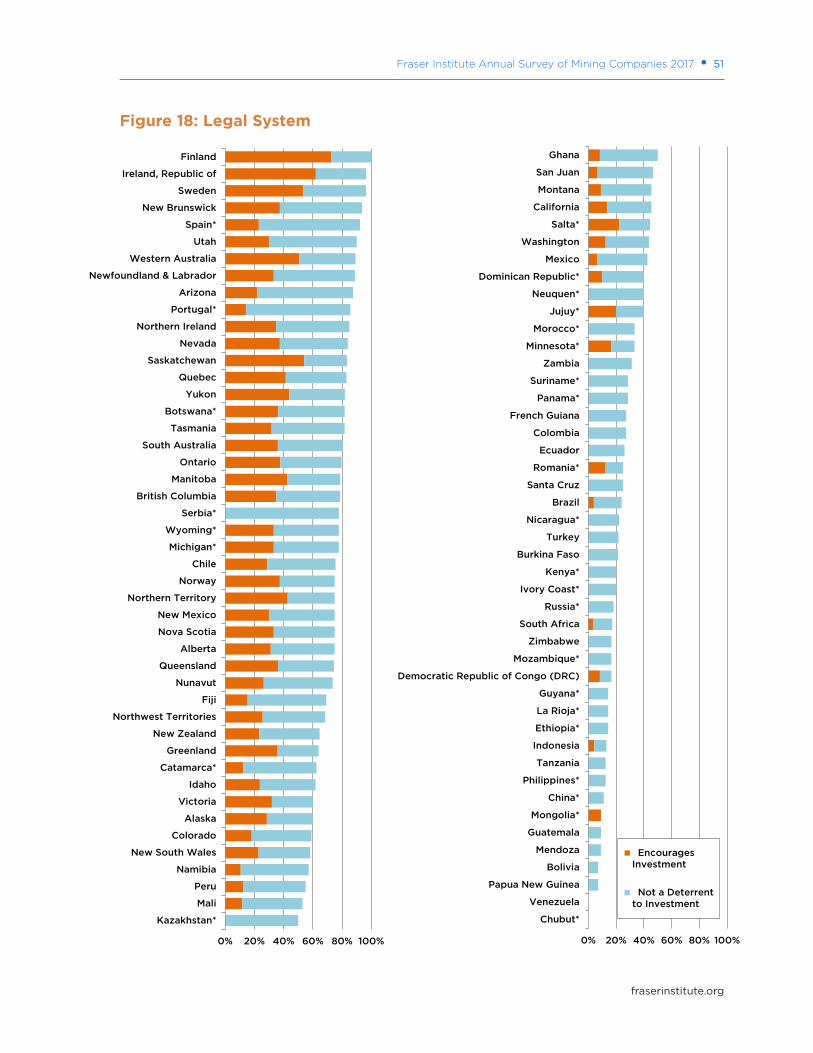
Fraser Institute Annual Survey of Mining Companies 2017 • 51
fraserinstitute.org
Figure 18: Legal System
0% 20% 40% 60% 80% 100%
Kazakhstan*
Mali
Peru
Namibia
New South Wales
Colorado
Alaska
Victoria
Idaho
Catamarca*
Greenland
New Zealand
Northwest Territories
Fiji
Nunavut
Queensland
Alberta
Nova Scotia
New Mexico
Northern Territory
Norway
Chile
Michigan*
Wyoming*
Serbia*
British Columbia
Manitoba
Ontario
South Australia
Tasmania
Botswana*
Yukon
Quebec
Saskatchewan
Nevada
Northern Ireland
Portugal*
Arizona
Newfoundland & Labrador
Western Australia
Utah
Spain*
New Brunswick
Sweden
Ireland, Republic of
Finland
0% 20% 40% 60% 80% 100%
Chubut*
Venezuela
Papua New Guinea
Bolivia
Mendoza
Guatemala
Mongolia*
China*
Philippines*
Tanzania
Indonesia
Ethiopia*
La Rioja*
Guyana*
Democratic Republic of Congo (DRC)
Mozambique*
Zimbabwe
South Africa
Russia*
Ivory Coast*
Kenya*
Burkina Faso
Turkey
Nicaragua*
Brazil
Santa Cruz
Romania*
Ecuador
Colombia
French Guiana
Panama*
Suriname*
Zambia
Minnesota*
Morocco*
Jujuy*
Neuquen*
Dominican Republic*
Mexico
Washington
Salta*
California
Montana
San Juan
Ghana
EncouragesInvestment
Not a Deterrentto Investment
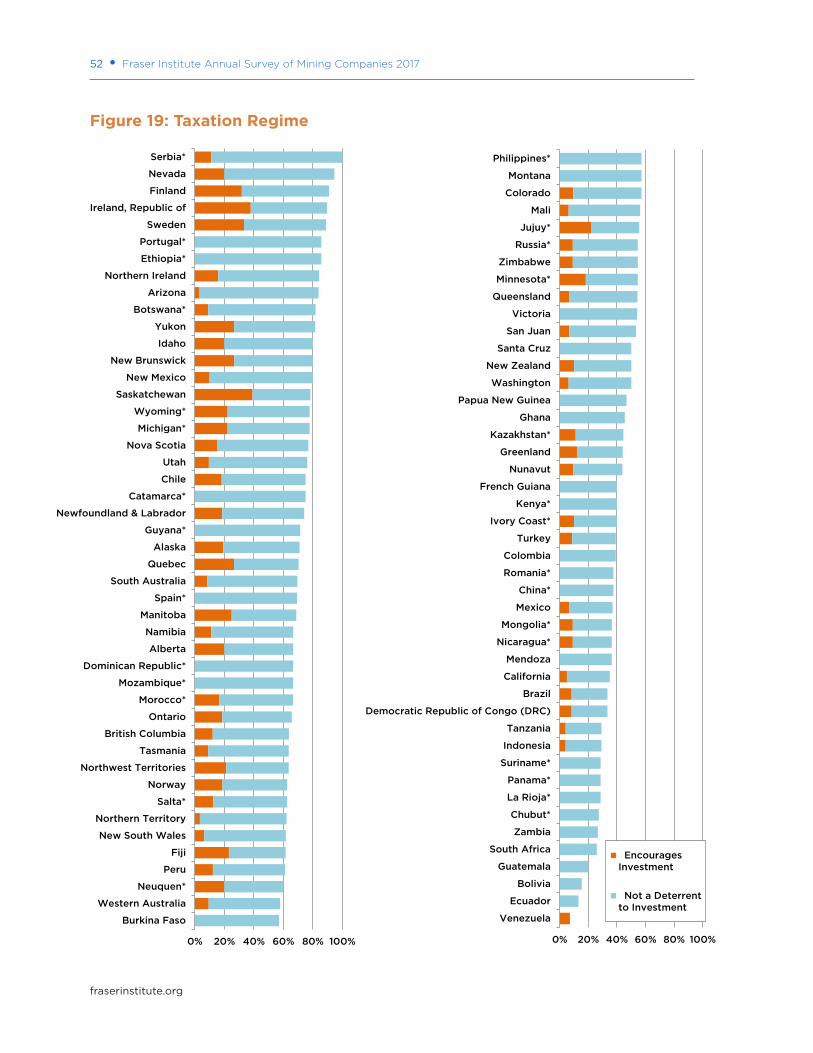
52 • Fraser Institute Annual Survey of Mining Companies 2017
fraserinstitute.org
Figure 19: Taxation Regime
0% 20% 40% 60% 80% 100%
Burkina Faso
Western Australia
Neuquen*
Peru
Fiji
New South Wales
Northern Territory
Salta*
Norway
Northwest Territories
Tasmania
British Columbia
Ontario
Morocco*
Mozambique*
Dominican Republic*
Alberta
Namibia
Manitoba
Spain*
South Australia
Quebec
Alaska
Guyana*
Newfoundland & Labrador
Catamarca*
Chile
Utah
Nova Scotia
Michigan*
Wyoming*
Saskatchewan
New Mexico
New Brunswick
Idaho
Yukon
Botswana*
Arizona
Northern Ireland
Ethiopia*
Portugal*
Sweden
Ireland, Republic of
Finland
Nevada
Serbia*
0% 20% 40% 60% 80% 100%
Venezuela
Ecuador
Bolivia
Guatemala
South Africa
Zambia
Chubut*
La Rioja*
Panama*
Suriname*
Indonesia
Tanzania
Democratic Republic of Congo (DRC)
Brazil
California
Mendoza
Nicaragua*
Mongolia*
Mexico
China*
Romania*
Colombia
Turkey
Ivory Coast*
Kenya*
French Guiana
Nunavut
Greenland
Kazakhstan*
Ghana
Papua New Guinea
Washington
New Zealand
Santa Cruz
San Juan
Victoria
Queensland
Minnesota*
Zimbabwe
Russia*
Jujuy*
Mali
Colorado
Montana
Philippines*
EncouragesInvestment
Not a Deterrentto Investment
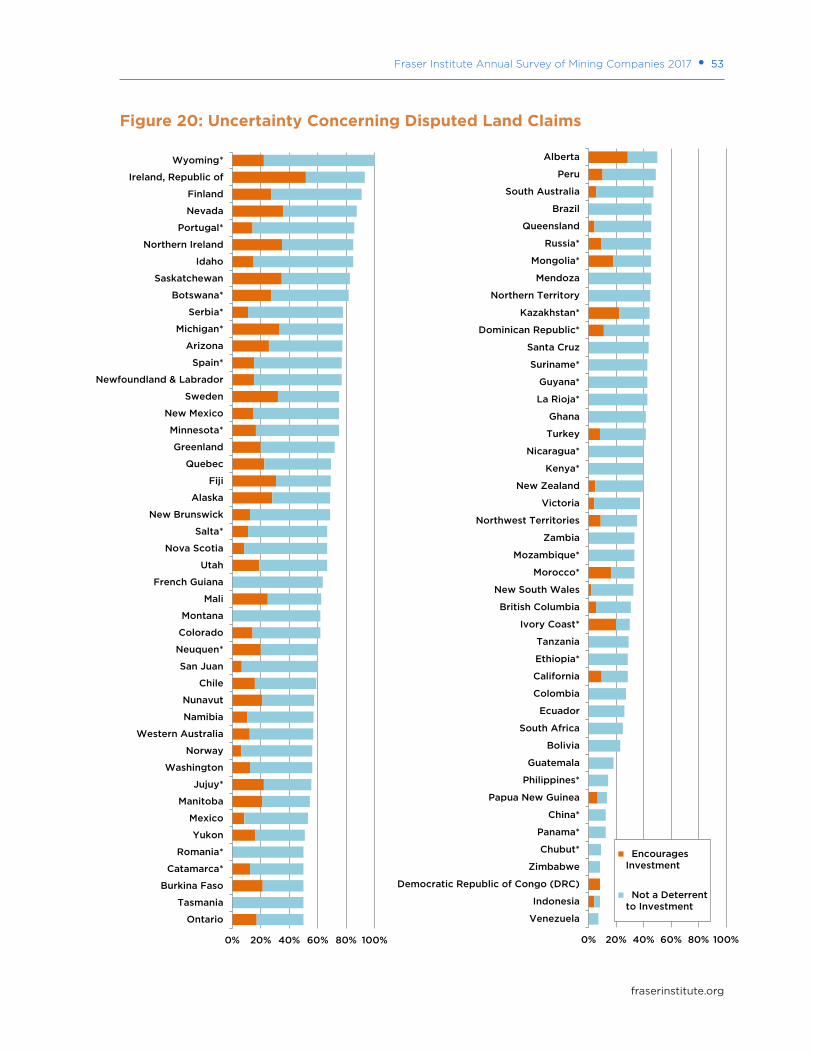
Fraser Institute Annual Survey of Mining Companies 2017 • 53
fraserinstitute.org
Figure 20: Uncertainty Concerning Disputed Land Claims
0% 20% 40% 60% 80% 100%
Ontario
Tasmania
Burkina Faso
Catamarca*
Romania*
Yukon
Mexico
Manitoba
Jujuy*
Washington
Norway
Western Australia
Namibia
Nunavut
Chile
San Juan
Neuquen*
Colorado
Montana
Mali
French Guiana
Utah
Nova Scotia
Salta*
New Brunswick
Alaska
Fiji
Quebec
Greenland
Minnesota*
New Mexico
Sweden
Newfoundland & Labrador
Spain*
Arizona
Michigan*
Serbia*
Botswana*
Saskatchewan
Idaho
Northern Ireland
Portugal*
Nevada
Finland
Ireland, Republic of
Wyoming*
0% 20% 40% 60% 80% 100%
Venezuela
Indonesia
Democratic Republic of Congo (DRC)
Zimbabwe
Chubut*
Panama*
China*
Papua New Guinea
Philippines*
Guatemala
Bolivia
South Africa
Ecuador
Colombia
California
Ethiopia*
Tanzania
Ivory Coast*
British Columbia
New South Wales
Morocco*
Mozambique*
Zambia
Northwest Territories
Victoria
New Zealand
Kenya*
Nicaragua*
Turkey
Ghana
La Rioja*
Guyana*
Suriname*
Santa Cruz
Dominican Republic*
Kazakhstan*
Northern Territory
Mendoza
Mongolia*
Russia*
Queensland
Brazil
South Australia
Peru
Alberta
EncouragesInvestment
Not a Deterrentto Investment
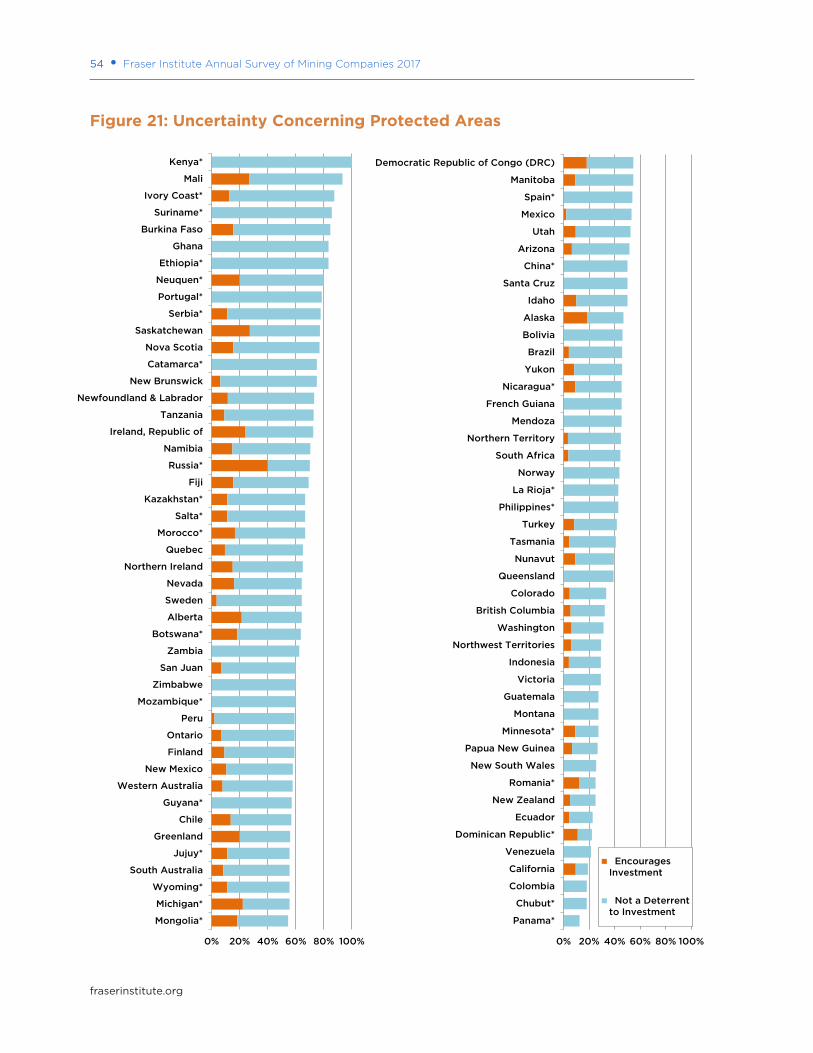
54 • Fraser Institute Annual Survey of Mining Companies 2017
fraserinstitute.org
Figure 21: Uncertainty Concerning Protected Areas
0% 20% 40% 60% 80% 100%
Mongolia*
Michigan*
Wyoming*
South Australia
Jujuy*
Greenland
Chile
Guyana*
Western Australia
New Mexico
Finland
Ontario
Peru
Mozambique*
Zimbabwe
San Juan
Zambia
Botswana*
Alberta
Sweden
Nevada
Northern Ireland
Quebec
Morocco*
Salta*
Kazakhstan*
Fiji
Russia*
Namibia
Ireland, Republic of
Tanzania
Newfoundland & Labrador
New Brunswick
Catamarca*
Nova Scotia
Saskatchewan
Serbia*
Portugal*
Neuquen*
Ethiopia*
Ghana
Burkina Faso
Suriname*
Ivory Coast*
Mali
Kenya*
0% 20% 40% 60% 80% 100%
Panama*
Chubut*
Colombia
California
Venezuela
Dominican Republic*
Ecuador
New Zealand
Romania*
New South Wales
Papua New Guinea
Minnesota*
Montana
Guatemala
Victoria
Indonesia
Northwest Territories
Washington
British Columbia
Colorado
Queensland
Nunavut
Tasmania
Turkey
Philippines*
La Rioja*
Norway
South Africa
Northern Territory
Mendoza
French Guiana
Nicaragua*
Yukon
Brazil
Bolivia
Alaska
Idaho
Santa Cruz
China*
Arizona
Utah
Mexico
Spain*
Manitoba
Democratic Republic of Congo (DRC)
EncouragesInvestment
Not a Deterrentto Investment
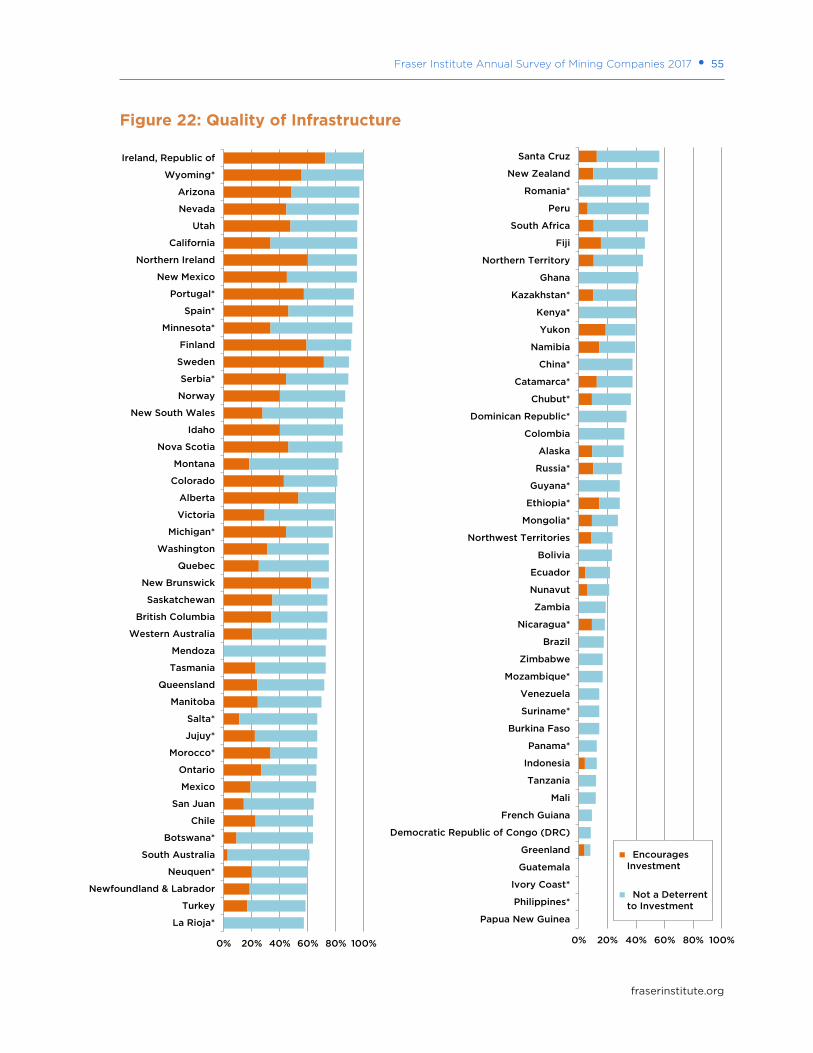
Fraser Institute Annual Survey of Mining Companies 2017 • 55
fraserinstitute.org
Figure 22: Quality of Infrastructure
0% 20% 40% 60% 80% 100%
La Rioja*
Turkey
Newfoundland & Labrador
Neuquen*
South Australia
Botswana*
Chile
San Juan
Mexico
Ontario
Morocco*
Jujuy*
Salta*
Manitoba
Queensland
Tasmania
Mendoza
Western Australia
British Columbia
Saskatchewan
New Brunswick
Quebec
Washington
Michigan*
Victoria
Alberta
Colorado
Montana
Nova Scotia
Idaho
New South Wales
Norway
Serbia*
Sweden
Finland
Minnesota*
Spain*
Portugal*
New Mexico
Northern Ireland
California
Utah
Nevada
Arizona
Wyoming*
Ireland, Republic of
0% 20% 40% 60% 80% 100%
Papua New Guinea
Philippines*
Ivory Coast*
Guatemala
Greenland
Democratic Republic of Congo (DRC)
French Guiana
Mali
Tanzania
Indonesia
Panama*
Burkina Faso
Suriname*
Venezuela
Mozambique*
Zimbabwe
Brazil
Nicaragua*
Zambia
Nunavut
Ecuador
Bolivia
Northwest Territories
Mongolia*
Ethiopia*
Guyana*
Russia*
Alaska
Colombia
Dominican Republic*
Chubut*
Catamarca*
China*
Namibia
Yukon
Kenya*
Kazakhstan*
Ghana
Northern Territory
Fiji
South Africa
Peru
Romania*
New Zealand
Santa Cruz
EncouragesInvestment
Not a Deterrentto Investment
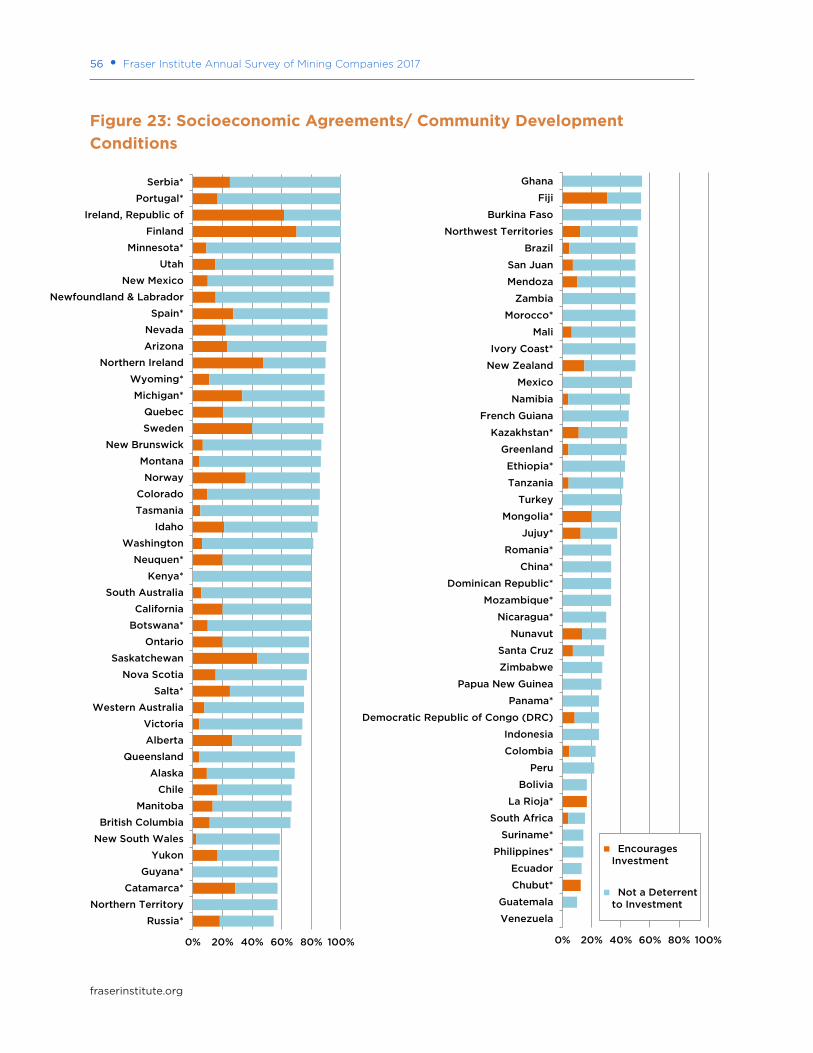
56 • Fraser Institute Annual Survey of Mining Companies 2017
fraserinstitute.org
Figure 23: Socioeconomic Agreements/ Community Development Conditions
0% 20% 40% 60% 80% 100%
Russia*
Northern Territory
Catamarca*
Guyana*
Yukon
New South Wales
British Columbia
Manitoba
Chile
Alaska
Queensland
Alberta
Victoria
Western Australia
Salta*
Nova Scotia
Saskatchewan
Ontario
Botswana*
California
South Australia
Kenya*
Neuquen*
Washington
Idaho
Tasmania
Colorado
Norway
Montana
New Brunswick
Sweden
Quebec
Michigan*
Wyoming*
Northern Ireland
Arizona
Nevada
Spain*
Newfoundland & Labrador
New Mexico
Utah
Minnesota*
Finland
Ireland, Republic of
Portugal*
Serbia*
0% 20% 40% 60% 80% 100%
Venezuela
Guatemala
Chubut*
Ecuador
Philippines*
Suriname*
South Africa
La Rioja*
Bolivia
Peru
Colombia
Indonesia
Democratic Republic of Congo (DRC)
Panama*
Papua New Guinea
Zimbabwe
Santa Cruz
Nunavut
Nicaragua*
Mozambique*
Dominican Republic*
China*
Romania*
Jujuy*
Mongolia*
Turkey
Tanzania
Ethiopia*
Greenland
Kazakhstan*
French Guiana
Namibia
Mexico
New Zealand
Ivory Coast*
Mali
Morocco*
Zambia
Mendoza
San Juan
Brazil
Northwest Territories
Burkina Faso
Fiji
Ghana
EncouragesInvestment
Not a Deterrentto Investment
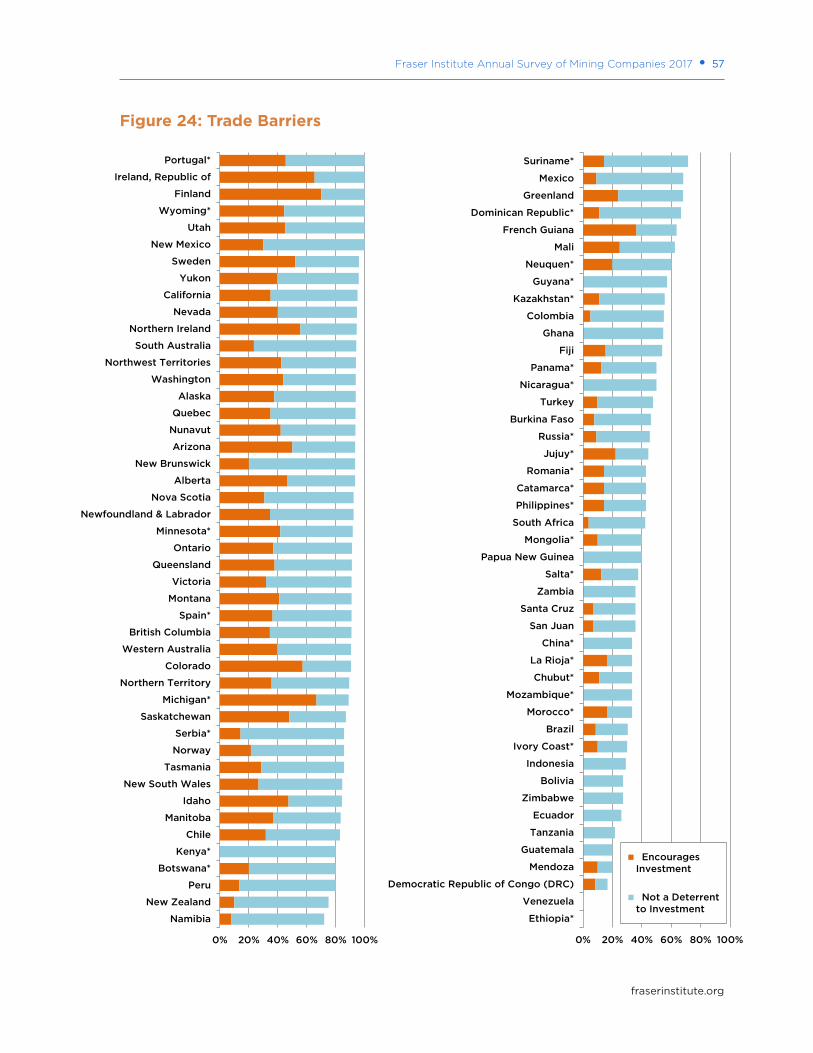
Fraser Institute Annual Survey of Mining Companies 2017 • 57
fraserinstitute.org
Figure 24: Trade Barriers
0% 20% 40% 60% 80% 100%
Namibia
New Zealand
Peru
Botswana*
Kenya*
Chile
Manitoba
Idaho
New South Wales
Tasmania
Norway
Serbia*
Saskatchewan
Michigan*
Northern Territory
Colorado
Western Australia
British Columbia
Spain*
Montana
Victoria
Queensland
Ontario
Minnesota*
Newfoundland & Labrador
Nova Scotia
Alberta
New Brunswick
Arizona
Nunavut
Quebec
Alaska
Washington
Northwest Territories
South Australia
Northern Ireland
Nevada
California
Yukon
Sweden
New Mexico
Utah
Wyoming*
Finland
Ireland, Republic of
Portugal*
0% 20% 40% 60% 80% 100%
Ethiopia*
Venezuela
Democratic Republic of Congo (DRC)
Mendoza
Guatemala
Tanzania
Ecuador
Zimbabwe
Bolivia
Indonesia
Ivory Coast*
Brazil
Morocco*
Mozambique*
Chubut*
La Rioja*
China*
San Juan
Santa Cruz
Zambia
Salta*
Papua New Guinea
Mongolia*
South Africa
Philippines*
Catamarca*
Romania*
Jujuy*
Russia*
Burkina Faso
Turkey
Nicaragua*
Panama*
Fiji
Ghana
Colombia
Kazakhstan*
Guyana*
Neuquen*
Mali
French Guiana
Dominican Republic*
Greenland
Mexico
Suriname*
EncouragesInvestment
Not a Deterrentto Investment
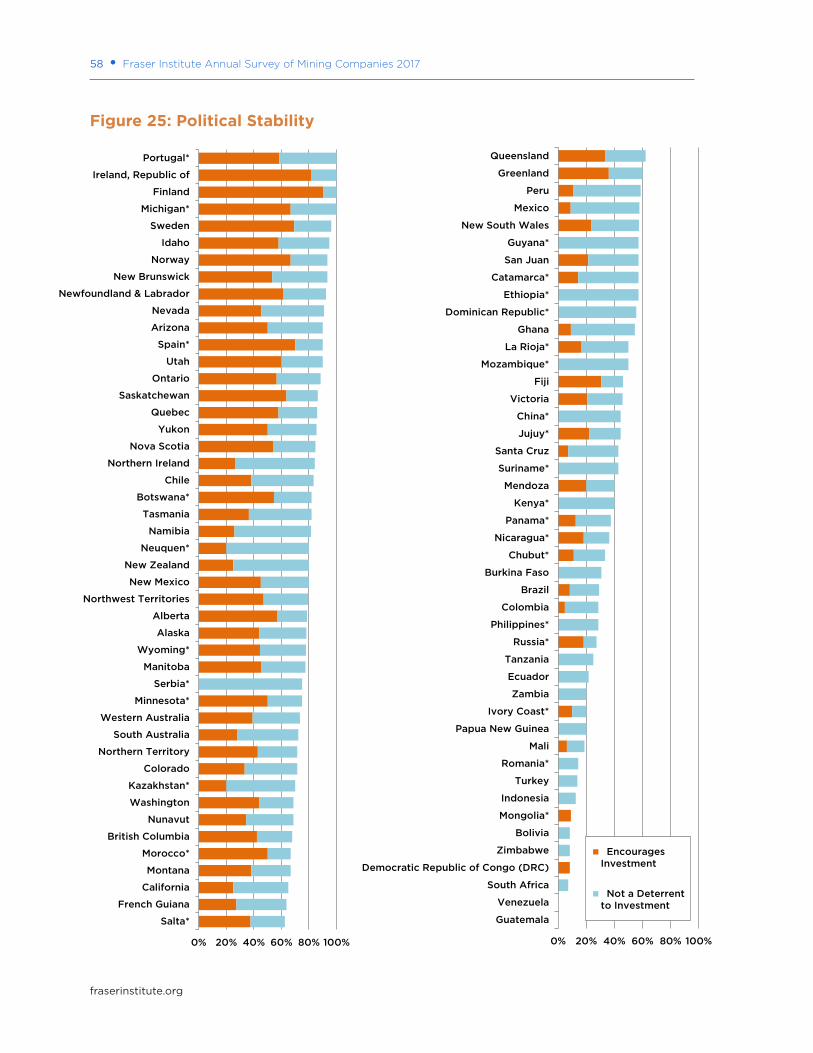
58 • Fraser Institute Annual Survey of Mining Companies 2017
fraserinstitute.org
Figure 25: Political Stability
0% 20% 40% 60% 80% 100%
Salta*
French Guiana
California
Montana
Morocco*
British Columbia
Nunavut
Washington
Kazakhstan*
Colorado
Northern Territory
South Australia
Western Australia
Minnesota*
Serbia*
Manitoba
Wyoming*
Alaska
Alberta
Northwest Territories
New Mexico
New Zealand
Neuquen*
Namibia
Tasmania
Botswana*
Chile
Northern Ireland
Nova Scotia
Yukon
Quebec
Saskatchewan
Ontario
Utah
Spain*
Arizona
Nevada
Newfoundland & Labrador
New Brunswick
Norway
Idaho
Sweden
Michigan*
Finland
Ireland, Republic of
Portugal*
0% 20% 40% 60% 80% 100%
Guatemala
Venezuela
South Africa
Democratic Republic of Congo (DRC)
Zimbabwe
Bolivia
Mongolia*
Indonesia
Turkey
Romania*
Mali
Papua New Guinea
Ivory Coast*
Zambia
Ecuador
Tanzania
Russia*
Philippines*
Colombia
Brazil
Burkina Faso
Chubut*
Nicaragua*
Panama*
Kenya*
Mendoza
Suriname*
Santa Cruz
Jujuy*
China*
Victoria
Fiji
Mozambique*
La Rioja*
Ghana
Dominican Republic*
Ethiopia*
Catamarca*
San Juan
Guyana*
New South Wales
Mexico
Peru
Greenland
Queensland
EncouragesInvestment
Not a Deterrentto Investment
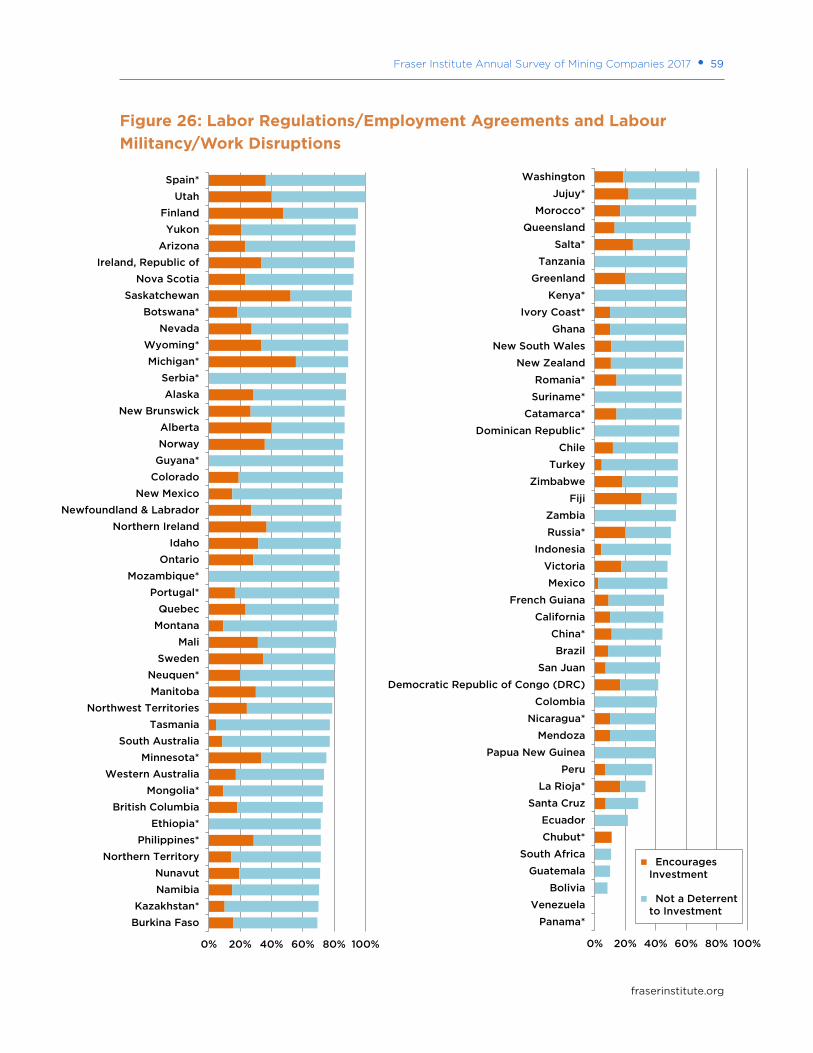
Fraser Institute Annual Survey of Mining Companies 2017 • 59
fraserinstitute.org
Figure 26: Labor Regulations/Employment Agreements and Labour Militancy/Work Disruptions
0% 20% 40% 60% 80% 100%
Burkina FasoKazakhstan*
NamibiaNunavut
Northern TerritoryPhilippines*
Ethiopia*British Columbia
Mongolia*Western Australia
Minnesota*South Australia
TasmaniaNorthwest Territories
ManitobaNeuquen*
SwedenMali
MontanaQuebec
Portugal*Mozambique*
OntarioIdaho
Northern IrelandNewfoundland & Labrador
New MexicoColoradoGuyana*NorwayAlberta
New BrunswickAlaskaSerbia*
Michigan*Wyoming*
NevadaBotswana*
SaskatchewanNova Scotia
Ireland, Republic ofArizona
YukonFinland
UtahSpain*
0% 20% 40% 60% 80% 100%
Panama*
Venezuela
Bolivia
Guatemala
South Africa
Chubut*
Ecuador
Santa Cruz
La Rioja*
Peru
Papua New Guinea
Mendoza
Nicaragua*
Colombia
Democratic Republic of Congo (DRC)
San Juan
Brazil
China*
California
French Guiana
Mexico
Victoria
Indonesia
Russia*
Zambia
Fiji
Zimbabwe
Turkey
Chile
Dominican Republic*
Catamarca*
Suriname*
Romania*
New Zealand
New South Wales
Ghana
Ivory Coast*
Kenya*
Greenland
Tanzania
Salta*
Queensland
Morocco*
Jujuy*
Washington
EncouragesInvestment
Not a Deterrentto Investment
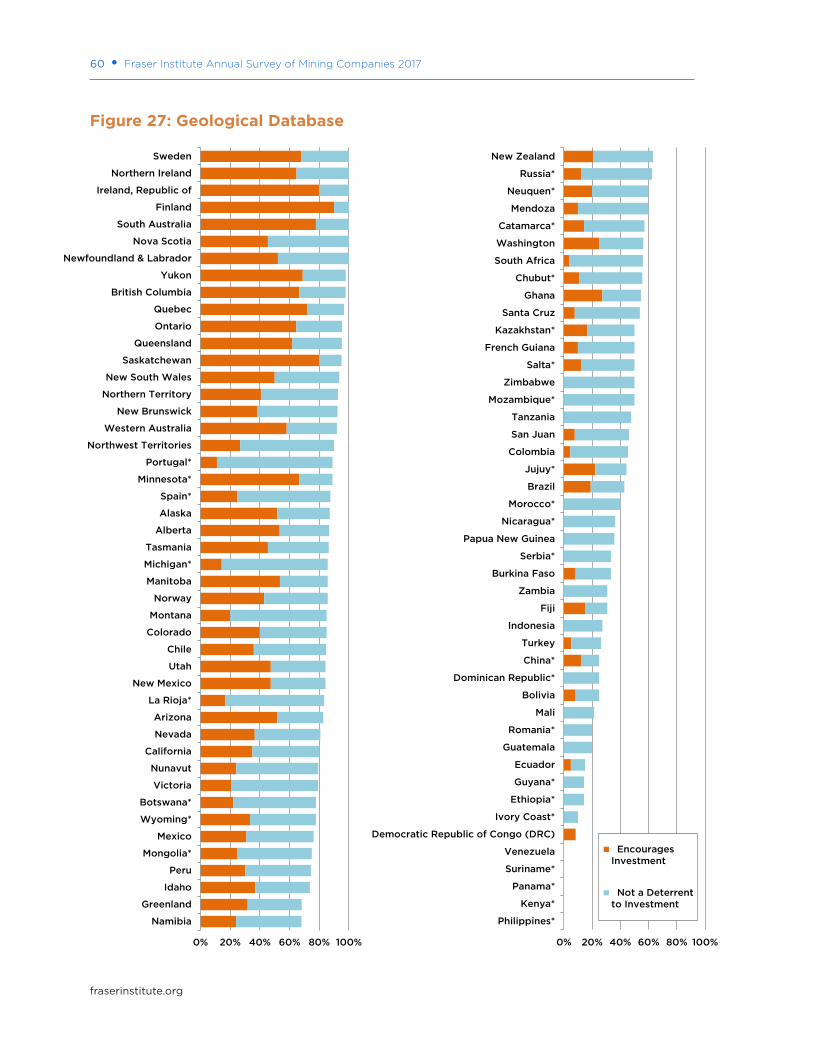
60 • Fraser Institute Annual Survey of Mining Companies 2017
fraserinstitute.org
Figure 27: Geological Database
0% 20% 40% 60% 80% 100%
Namibia
Greenland
Idaho
Peru
Mongolia*
Mexico
Wyoming*
Botswana*
Victoria
Nunavut
California
Nevada
Arizona
La Rioja*
New Mexico
Utah
Chile
Colorado
Montana
Norway
Manitoba
Michigan*
Tasmania
Alberta
Alaska
Spain*
Minnesota*
Portugal*
Northwest Territories
Western Australia
New Brunswick
Northern Territory
New South Wales
Saskatchewan
Queensland
Ontario
Quebec
British Columbia
Yukon
Newfoundland & Labrador
Nova Scotia
South Australia
Finland
Ireland, Republic of
Northern Ireland
Sweden
0% 20% 40% 60% 80% 100%
Philippines*
Kenya*
Panama*
Suriname*
Venezuela
Democratic Republic of Congo (DRC)
Ivory Coast*
Ethiopia*
Guyana*
Ecuador
Guatemala
Romania*
Mali
Bolivia
Dominican Republic*
China*
Turkey
Indonesia
Fiji
Zambia
Burkina Faso
Serbia*
Papua New Guinea
Nicaragua*
Morocco*
Brazil
Jujuy*
Colombia
San Juan
Tanzania
Mozambique*
Zimbabwe
Salta*
French Guiana
Kazakhstan*
Santa Cruz
Ghana
Chubut*
South Africa
Washington
Catamarca*
Mendoza
Neuquen*
Russia*
New Zealand
EncouragesInvestment
Not a Deterrentto Investment
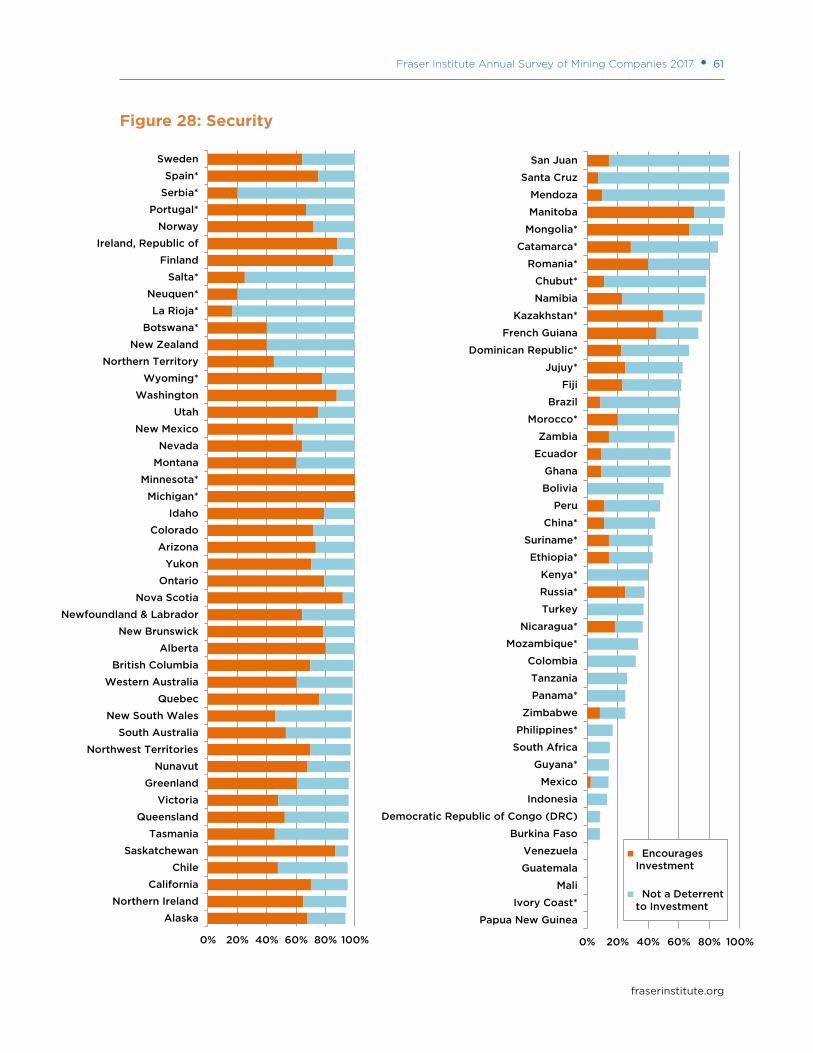
Fraser Institute Annual Survey of Mining Companies 2017 • 61
fraserinstitute.org
Figure 28: Security
0% 20% 40% 60% 80% 100%
Alaska
Northern Ireland
California
Chile
Saskatchewan
Tasmania
Queensland
Victoria
Greenland
Nunavut
Northwest Territories
South Australia
New South Wales
Quebec
Western Australia
British Columbia
Alberta
New Brunswick
Newfoundland & Labrador
Nova Scotia
Ontario
Yukon
Arizona
Colorado
Idaho
Michigan*
Minnesota*
Montana
Nevada
New Mexico
Utah
Washington
Wyoming*
Northern Territory
New Zealand
Botswana*
La Rioja*
Neuquen*
Salta*
Finland
Ireland, Republic of
Norway
Portugal*
Serbia*
Spain*
Sweden
0% 20% 40% 60% 80% 100%
Papua New Guinea
Ivory Coast*
Mali
Guatemala
Venezuela
Burkina Faso
Democratic Republic of Congo (DRC)
Indonesia
Mexico
Guyana*
South Africa
Philippines*
Zimbabwe
Panama*
Tanzania
Colombia
Mozambique*
Nicaragua*
Turkey
Russia*
Kenya*
Ethiopia*
Suriname*
China*
Peru
Bolivia
Ghana
Ecuador
Zambia
Morocco*
Brazil
Fiji
Jujuy*
Dominican Republic*
French Guiana
Kazakhstan*
Namibia
Chubut*
Romania*
Catamarca*
Mongolia*
Manitoba
Mendoza
Santa Cruz
San Juan
EncouragesInvestment
Not a Deterrentto Investment
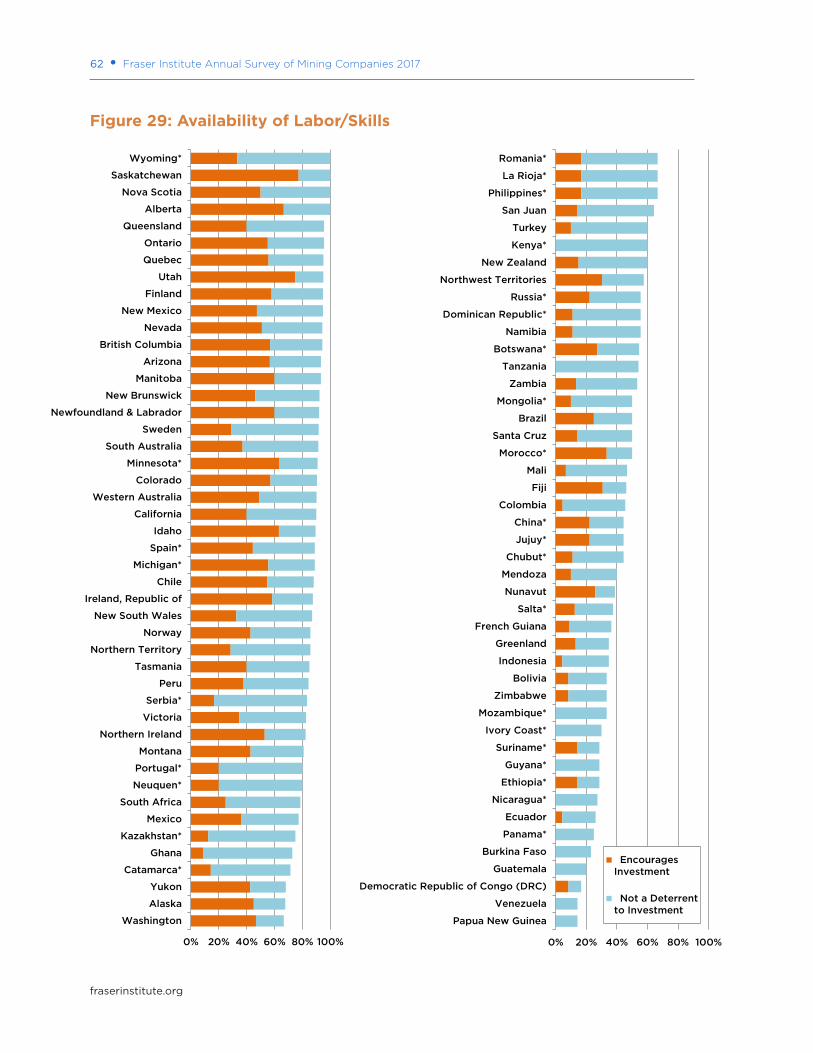
62 • Fraser Institute Annual Survey of Mining Companies 2017
fraserinstitute.org
Figure 29: Availability of Labor/Skills
0% 20% 40% 60% 80% 100%
Washington
Alaska
Yukon
Catamarca*
Ghana
Kazakhstan*
Mexico
South Africa
Neuquen*
Portugal*
Montana
Northern Ireland
Victoria
Serbia*
Peru
Tasmania
Northern Territory
Norway
New South Wales
Ireland, Republic of
Chile
Michigan*
Spain*
Idaho
California
Western Australia
Colorado
Minnesota*
South Australia
Sweden
Newfoundland & Labrador
New Brunswick
Manitoba
Arizona
British Columbia
Nevada
New Mexico
Finland
Utah
Quebec
Ontario
Queensland
Alberta
Nova Scotia
Saskatchewan
Wyoming*
0% 20% 40% 60% 80% 100%
Papua New Guinea
Venezuela
Democratic Republic of Congo (DRC)
Guatemala
Burkina Faso
Panama*
Ecuador
Nicaragua*
Ethiopia*
Guyana*
Suriname*
Ivory Coast*
Mozambique*
Zimbabwe
Bolivia
Indonesia
Greenland
French Guiana
Salta*
Nunavut
Mendoza
Chubut*
Jujuy*
China*
Colombia
Fiji
Mali
Morocco*
Santa Cruz
Brazil
Mongolia*
Zambia
Tanzania
Botswana*
Namibia
Dominican Republic*
Russia*
Northwest Territories
New Zealand
Kenya*
Turkey
San Juan
Philippines*
La Rioja*
Romania*
EncouragesInvestment
Not a Deterrentto Investment
fraserinstitute.org
Acknowledgments
We would like to thank the hundreds of members of the mining community who have responded to the survey this year and in previous years. You do a service to your industry by providing such valuable information.
We would also like to thank a number of mining associations that generously helped inform their readers and members of the opportunity to participate in the survey. We would also like to thank then Executive Director Michael Walker and Laura Jones for conceptualizing this project 20 years ago. As well, we thank Taylor Jackson for his excellent research assistance.
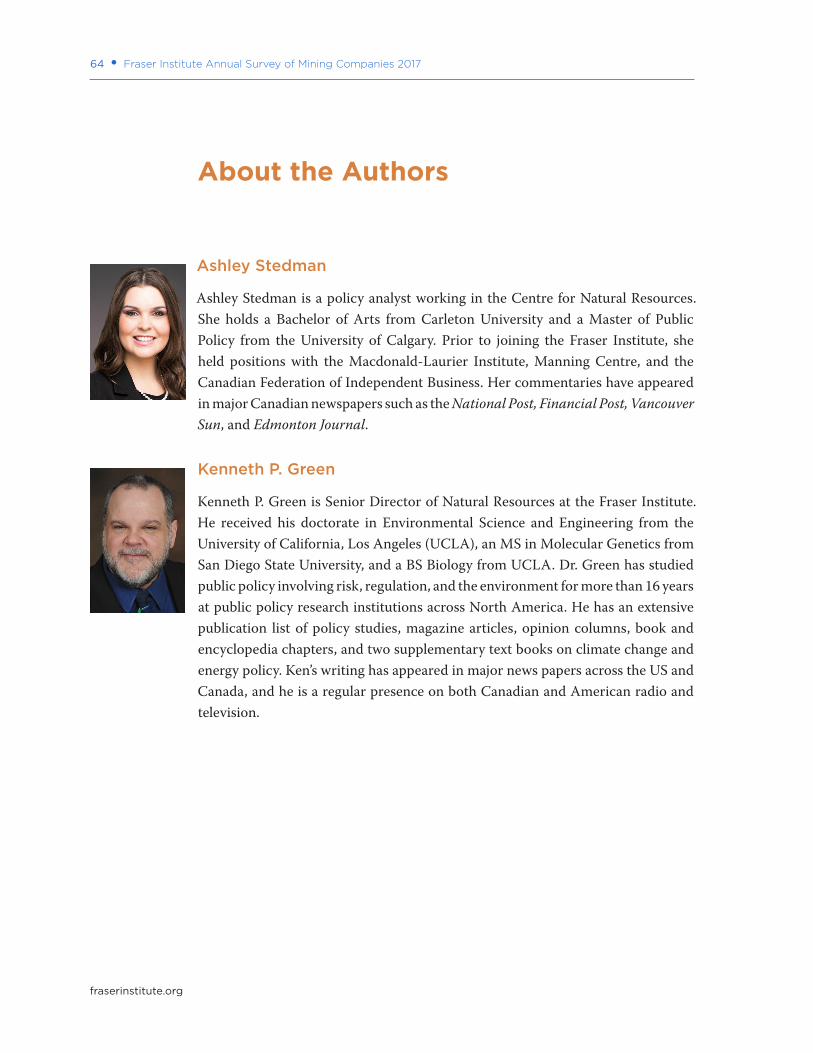
64 • Fraser Institute Annual Survey of Mining Companies 2017
fraserinstitute.org
About the Authors
Ashley Stedman
Ashley Stedman is a policy analyst working in the Centre for Natural Resources. She holds a Bachelor of Arts from Carleton University and a Master of Public Policy from the University of Calgary. Prior to joining the Fraser Institute, she held positions with the Macdonald-Laurier Institute, Manning Centre, and the Canadian Federation of Independent Business. Her commentaries have appeared in major Canadian newspapers such as the National Post, Financial Post, Vancouver Sun, and Edmonton Journal.
Kenneth P. Green
Kenneth P. Green is Senior Director of Natural Resources at the Fraser Institute. He received his doctorate in Environmental Science and Engineering from the University of California, Los Angeles (UCLA), an MS in Molecular Genetics from San Diego State University, and a BS Biology from UCLA. Dr. Green has studied public policy involving risk, regulation, and the environment for more than 16 years at public policy research institutions across North America. He has an extensive publication list of policy studies, magazine articles, opinion columns, book and encyclopedia chapters, and two supplementary text books on climate change and energy policy. Ken’s writing has appeared in major news papers across the US and Canada, and he is a regular presence on both Canadian and American radio and television.
Fraser Institute Annual Survey of Mining Companies 2017 • 65
fraserinstitute.org
Publishing Information
DistributionThese publications are available from <http://www.fraserinstitute.org> in Portable Document Format (PDF) and can be read with Adobe Acrobat® or Adobe Reader®, versions 8 or later. Adobe Reader® DC, the most recent version, is available free of charge from Adobe Systems Inc. at <http://get.adobe.com/reader/>. Readers having trouble viewing or printing our PDF files using applica-tions from other manufacturers (e.g., Apple’s Preview) should use Reader® or Acrobat®.
Ordering publicationsTo order printed publications from the Fraser Institute, please contact:
• e-mail: [email protected] • telephone: 604.688.0221 ext. 580 or, toll free, 1.800.665.3558 ext. 580 • fax: 604.688.8539.
MediaFor media enquiries, please contact our communications department via e-mail: [email protected]; telephone: 604.714.4582. In Toronto, contact our media specialist via telephone at 416.363.6575, ext. 238.
CopyrightCopyright © 2018 by the Fraser Institute. All rights reserved. No part of this publication may be reproduced in any manner whatsoever without written permission except in the case of brief pas-sages quoted in critical articles and reviews.
Date of issueFebruary 2018
ISBN978-0-88975-483-6
CitationStedman, Ashley, and Kenneth P. Green (2018). Fraser Institute Annual Survey of Mining Companies 2017. Fraser Institute. <http://www.fraserinstitute.org>.
66 • Fraser Institute Annual Survey of Mining Companies 2017
fraserinstitute.org
Supporting the Fraser Institute
To learn how to support the Fraser Institute, please contact
• Development Department, Fraser Institute Fourth Floor, 1770 Burrard Street Vancouver, British Columbia, V6J 3G7 Canada
• telephone, toll-free: 1.800.665.3558 ext. 548
• e-mail: [email protected]
• website:: http://www.fraserinstitute.org/donate
Purpose, funding, and independenceThe Fraser Institute provides a useful public service. We report objective infor-mation about the economic and social effects of current public policies, and we offer evidence-based research and education about policy options that can improve the quality of life.
The Institute is a non-profit organization. Our activities are funded by charitable donations, unrestricted grants, ticket sales, and sponsorships from events, the licensing of products for public distribution, and the sale of publications.
All research is subject to rigorous review by external experts, and is conducted and published separately from the Institute’s Board of Trustees and its donors.
The opinions expressed by authors are their own, and do not necessarily reflect those of the Institute, its Board of Trustees, its donors and supporters, or its staff. This publication in no way implies that the Fraser Institute, its trustees, or staff are in favour of, or oppose the passage of, any bill; or that they support or oppose any particular political party or candidate.
As a healthy part of public discussion among fellow citizens who de-sire to improve the lives of people through better public policy, the Institute welcomes evidence-focused scrutiny of the research we publish, including verification of data sources, replication of analytical methods, and intelligent debate about the practical effects of policy recommendations.
Fraser Institute Annual Survey of Mining Companies 2017 • 67
fraserinstitute.org
About the Fraser Institute
Our mission is to improve the quality of life for Canadians, their families, and future generations by studying, measuring, and broadly communicating the ef-fects of government policies, entrepreneurship, and choice on their well-being.
Notre mission consiste à améliorer la qualité de vie des Canadiens et des généra-tions à venir en étudiant, en mesurant et en diffusant les effets des poli tiques gouvernementales, de l’entrepreneuriat et des choix sur leur bien-être.
Peer review —validating the accuracy of our research
The Fraser Institute maintains a rigorous peer review process for its research. New research, major research projects, and substantively modified research conducted by the Fraser Institute are reviewed by experts with a recognized expertise in the topic area being addressed. Whenever possible, external review is a blind process. Updates to previously reviewed research or new editions of previously reviewed research are not reviewed unless the update includes substantive or material changes in the methodology.
The review process is overseen by the directors of the Institute’s re-search departments who are responsible for ensuring all research published by the Institute passes through the appropriate peer review. If a dispute about the recommendations of the reviewers should arise during the Institute’s peer review process, the Institute has an Editorial Advisory Board, a panel of schol-ars from Canada, the United States, and Europe to whom it can turn for help in resolving the dispute.
68 • Fraser Institute Annual Survey of Mining Companies 2017
fraserinstitute.org
Editorial Advisory Board
* deceased; † Nobel Laureate
Prof. Terry L. Anderson
Prof. Robert Barro
Prof. Jean-Pierre Centi
Prof. John Chant
Prof. Bev Dahlby
Prof. Erwin Diewert
Prof. Stephen Easton
Prof. J.C. Herbert Emery
Prof. Jack L. Granatstein
Prof. Herbert G. Grubel
Prof. James Gwartney
Prof. Ronald W. Jones
Dr. Jerry Jordan
Prof. Ross McKitrick
Prof. Michael Parkin
Prof. Friedrich Schneider
Prof. Lawrence B. Smith
Dr. Vito Tanzi
Prof. Armen Alchian*
Prof. Michael Bliss
Prof. James M. Buchanan* †
Prof. Friedrich A. Hayek* †
Prof. H.G. Johnson*
Prof. F.G. Pennance*
Prof. George Stigler* †
Sir Alan Walters*
Prof. Edwin G. West*
Members
Past members


![[XLS] UnclaimedDividend/Y2007... · Web viewNAURU NEPAL NETHERLANDS NETHERLANDS ANTILLES NEW CALEDONIA NEW ZEALAND NICARAGUA NIGER NIGERIA NIUE NORFOLK ISLAND NORTHERN MARIANA ISLANDS](https://img.pdfslide.us/doc/110x75/5af87c057f8b9ad2208c96dd/xls-unclaimeddividendy2007web-viewnauru-nepal-netherlands-netherlands-antilles.jpg)


![[XLS] UnclaimedDividend... · Web viewNAURU NEPAL NETHERLANDS NETHERLANDS ANTILLES NEW CALEDONIA NEW ZEALAND NICARAGUA NIGER NIGERIA NIUE NORFOLK ISLAND NORTHERN MARIANA ISLANDS NORWAY](https://img.pdfslide.us/doc/110x75/5af87c057f8b9ad2208c96e8/xls-unclaimeddividendweb-viewnauru-nepal-netherlands-netherlands-antilles-new.jpg)