Embed Size (px)
DESCRIPTION
Fraser Forum is a bi-monthly magazine of critical thought offering analysis and perspectives from many researchers across the Fraser Institute on a wide range of issues.
Citation preview

Fraser Forum
The Fraser Institute’s vision is a free and prosperous world where individuals benefit from greater choice, competitive markets, and per-sonal responsibility. Our mission is to measure, study, and communicate the impact of competitive markets and government interventions on the welfare of individuals. Founded in 1974, we are an independent Cana-dian research and educational organization. Our work is financed by tax-deductible contributions from thousands of individuals, organizations, and foundations. In order to protect its independence, the Institute does not accept grants from government or contracts for research.
For additional copies, or to become a supporter and receive Fraser Forum, write or call the Fraser Institute, 4th Floor, 1770 Burrard Street, Vancouver, BC V6J 3G7 Telephone: (604) 688-0221; Fax: (604) 688-8539; Toll-free: 1-800-665-3558 (ext. 580–book orders; ext. 586–development)
Copyright © 2011 Fraser Institute ISSN 0827-7893 (print version) ISSN 1480-3690 (online version) Printed and bound in Canada.
Return undeliverable Canadian addresses to:Fraser Institute, 4th Floor, 1770 Burrard St., Vancouver, BC V6J 3G7
The contributors to this publication have worked independently and opinions expressed by them are, therefore, their own and do not neces-sarily reflect the opinions of the supporters, trustees, or other staff of the Fraser Institute. This publication in no way implies that the Fraser Insti-tute, its trustees, or staff are in favour of, or oppose the passage of, any bill; or that they support or oppose any particular political party or candidate.
Fraser Institute Board of Trustees Peter Brown (Chairman), Ed-ward Belzberg (Vice Chairman), Mark W. Mitchell (Vice Chairman), Salem Ben Nasser Al Ismaily, Louis-Philippe Amiot, Gordon Arnell, Charles Bar-low, Jr., Ryan Beedie, Brad Bennett, Everett Berg, T. Patrick Boyle, Joseph Canavan, Alex Chafuen, Derwood Chase, Jr., James Davidson, John Diel-wart, Stuart Elman, Greg Fleck, Paul Fletcher, Shaun Francis, Ned Good-man, John Hagg, Paul Hill, Stephen Hynes, C. Ken Jesperson, Andrew Jud-son, Robert Lee, Brandt Louie, Lukas Lundin, David MacKenzie, Hubert Marleau, James McGovern, George Melville, Gwyn Morgan, Eleanor Nicholls, Roger Phillips, Herb Pinder, R. Jack Pirie, Conrad Riley, Gavin Semple, Rod Senft, Anthony Sessions, Christopher Shackleton, Bill Siebens, Anna Stylianides, Arni Thorsteinson, Michael Walker, Jona-than Wener, Catherine Windels, Brett J. Skinner (President), Peter Cow-ley (Senior Vice President, Operations), Niels Veldhuis (Vice President, Research), Fred McMahon (Vice President, Research), Stuart MacInnis (Secretary-Treasurer)
Purpose, Funding, and IndependenceThe Fraser Institute provides a useful public service. We report objective information about the economic and social effects of current public policies, and we offer evidence-based research and education about policy options that can improve the quality of life. The Institute is a non-profit organiza-tion. Our activities are funded by charitable donations, unrestricted grants, ticket sales and sponsorships from events, the licensing of products for public distribution, and the sale of publications. All research is subject to rigorous review by external experts, and is conducted and published separately from the Institute’s Board of Trustees and its donors. The opinions expressed by staff or author(s) are those of the individuals themselves, and should not be interpreted to reflect those of the Institute, its Board of Trustees, or its donors and supporters. As a healthy part of public discussion among fellow citizens who desire to improve the lives of people through better public policy, the Institute welcomes evidence-focused scrutiny of the research we publish, including verification of data sources, replication of analytical methods, and intelligent debate about the practical effects of policy recommendations.
From the editor
www.fraserinstitute.org Fraser Forum September/October 2011 3
PublisherChief Editor
Managing EditorEditorial Advisor
Contributing Editors
Art Direction and Cover DesignCover Photos
Production and LayoutMedia Relations
Advertising Sales
Fraser InstituteBrett J. SkinnerCari A. FergusonKristin McCahonPeter CowleyCharles LammamFred McMahonBill C. RayBigstockCari A. FergusonDean PelkeyAdvertising In PrintTel: (604) 681-1811E-mail: info@advertising inprint.com
Labour in Canada
This issue of Fraser Forum arrives shortly after Canadians celebrate the economic and social achievements of workers on the first Monday of September; as such, it seems appropriate to have a labour-themed
issue. In the July/August issue of Fraser Forum was an article about Tax Free-dom day, which discussed the day in the year that marks the point at which Canadians start working for themselves rather than merely to fulfill their tax burdens; however, rather than focus on the financial impacts of Canadian labour, this issue centers around the ways in which certain forms of labour are structured.
Particularly, this issue of Fraser Forum addresses the concerns, fur-ther emphasized by the Canada Post strike this summer, about the dangers of the monopoly that the Canadian government has on our national mail distribution. In Recent mail disruption strengthens case to privatize Canada Post (pg. 12), Charles Lammam and Amela Karabegović raise the important point that while the postal system continues to be a crown corporation, it will not have consumers’ best interests at heart. In the future, to protect charities, small businesses, and ordinary individuals from similar labour disagreements and subsequent service disruptions like the one we experienced this summer, the solution is to privatize Canada Post.
Similarly, two other articles in this issue of Forum directly address no-tions of labour and labour markets. In the article Indecent disclosure (pg. 16), Niels Veldhuis and Amela Karabegović question why Canadian unions are not held to the same standards of transparency and accountability as are their American counterparts. Moreover, with recent legislation in Canada increasing disclosure requirements for publicly traded companies, charities, and other public organizations, one must ask (as the authors do) isn’t it time for the special treatment of Canadians unions to end? Finally, Niels Veldhuis, Peter Cowley, and Milagros Palacios once again express concern over the structure of teacher compensation in British Columbia (pg. 15) and argue that, in order to focus on teaching effectiveness, a future collective agreement with the British Columbia Teachers’ Federation should tie teacher pay to performance. Also in this issue is a summary of the 2011 Global Petroleum Survey (pg. 28), our Quarterly Research Alert (pg. 19), and a commentary by Mark Milke on the false existence of a successful welfare state (pg. 8). Lastly, included also is another new article in our regulation section about the proposed ban on BC pesticides, in which Nachum Gabler and Joel Wood discuss better options (pg. 33).
Cari A. Ferguson ([email protected])
4 Fraser Forum September/October 2011 www.fraserinstitute.org
ContentsFraser Forum
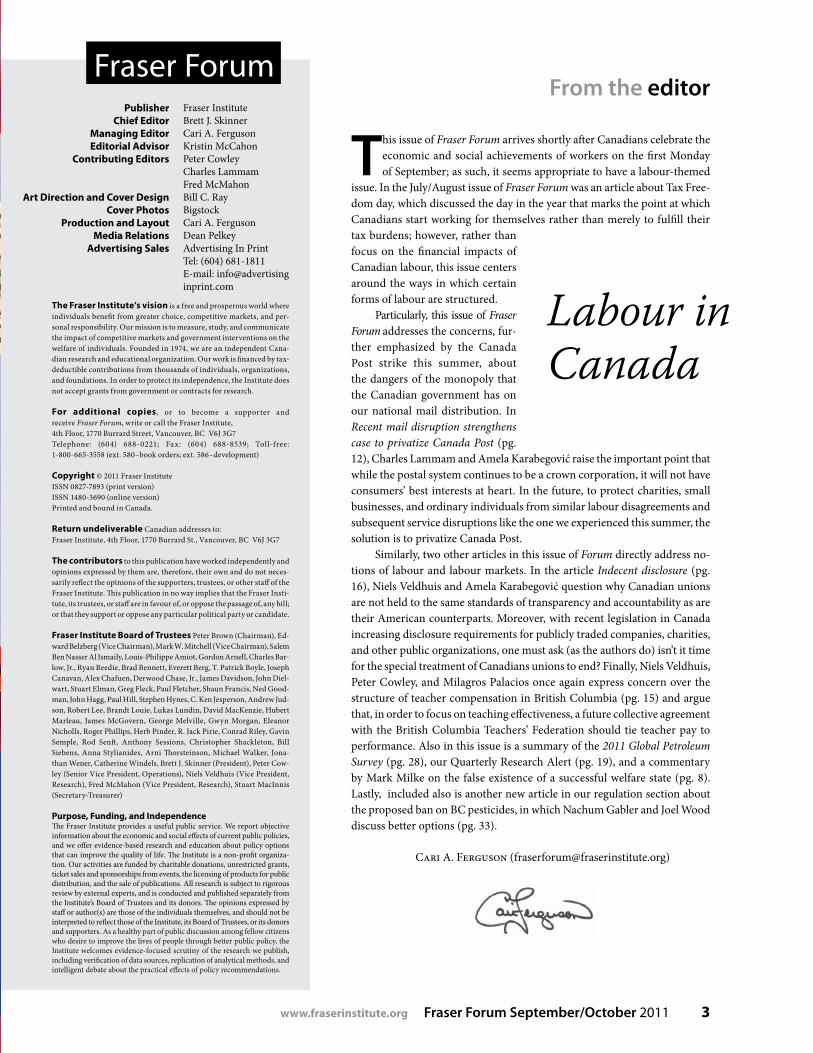
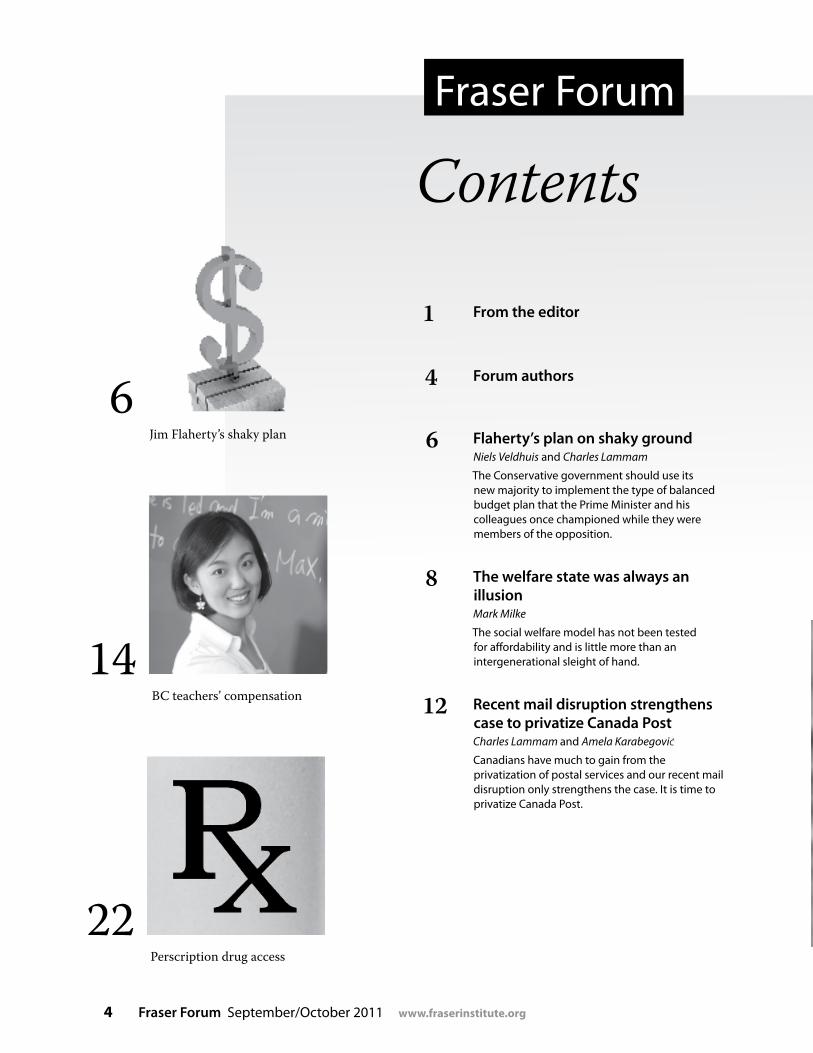
6Jim Flaherty’s shaky plan
22Perscription drug access
14BC teachers’ compensation
1 From the editor
4 Forum authors
6 Flaherty’s plan on shaky groundNiels Veldhuis and Charles Lammam
The Conservative government should use its new majority to implement the type of balanced budget plan that the Prime Minister and his colleagues once championed while they were members of the opposition.
8 The welfare state was always an illusionMark Milke
The social welfare model has not been tested for affordability and is little more than an intergenerational sleight of hand.
12 Recent mail disruption strengthens case to privatize Canada PostCharles Lammam and Amela Karabegović
Canadians have much to gain from the privatization of postal services and our recent mail disruption only strengthens the case. It is time to privatize Canada Post.
www.fraserinstitute.org Fraser Forum September/October 2011 5
14 New compensation package for BC teachers should tie pay to performanceNiels Veldhuis, Peter Cowley, and Milagros Palacios
The current compensation system for BC teachers does not recognize effectiveness, in teaching, but the British Columbia Teacher’s Federation does not seem willing to consider one that does.
16 Indecent disclosure Niels Veldhuis and Amela Karabegović
Disclosure requirements are already in place in Canada for publicly traded companies, charities, and other public organizations; unions should be treated no differently.
19 Quarterly research alertOur researchers summarize the findings of recent studies on important topics including taxation, the environment, and charitable giving.
22 Using private drug insurance to achieve universal access for new prescription drugsMark Rovere
It is time for governments to get out of the business of drug insurance and allow a competitive private sector to do what it does best: respond to consumer demand.
26 Corporate headquarters in CanadaAlex Gainer
On a per capita basis, more corporations locate their headquarters in Calgary than in any other Canadian city.
28 Overcoming regulatory obstacles to upstream petroleum investmentGerry Angevine and Miguel Cervantes
This article summarizes the results of the 2011 Global Petroleum Survey.
33 British Columbia pesticide prohibition Nachum Gabler and Joel Wood
The proposed blanket prohibition on cosmetic pesticide use in BC is devoid of the careful contrasting of costs and benefits that should be undertaken before any regulations are adopted.
Feature Story
Privatize Canada Post—page 12
You wil

6 Fraser Forum September/October 2011 www.fraserinstitute.org
Forum Authors
Mark Milke ([email protected]) is director of the Fraser Institute’s Alberta office and of the Fraser Institute’s Alberta Prosperity Project. He has a Ph.D. in International Relations and Political Philosophy from the University of Calgary.
Charles laMMaM ([email protected]) is a senior policy analyst in the Fiscal Studies department at the Fraser Institute. He holds an M.A. in public policy from Simon Fraser University.
Milagros PalaCios ([email protected]) is a senior economist with the Fraser Institute’s Fiscal Studies Department. She holds an M.Sc. in economics from the University of Concepcion in Chile.
Joel Wood ([email protected]) is the Institute’s senior research economist in the Centre for Environmental Studies and Centre for Risk and Regulation. He has completed a Master’s degree in economics and all the requirements for a Ph.D. in economics from the University of Guelph.
Niels Veldhuis ([email protected]) is the director of fiscal studies and vice president, Canadian Policy Research, at the Fraser Institute. He has an M.A. in economics from Simon Fraser University.
Mark roVere ([email protected]) is the associate director of the Health Policy Research Centre at the Fraser Institute. He holds an M.A. in political science from the University of Windsor.
Peter CoWley ([email protected]) is the director of School Performance Studies at the Fraser Institute. He as a B.A. in commerce and is co-author of the Institute’s report cards on schools in British Columbia, Alberta, Ontario, Quebec, and Washington state.
gerry aNgeViNe ([email protected]) is senior economist in the Fraser Institute’s Centre for Energy Studies. He has A.M. and Ph.D. degrees in economics from the University of Michigan, an M.A. economics degree from Dalhousie University and a B.Comm. from Mount Allison University.
aMela karabegoVić (amela.karabegovic@fraserinsti tute.org) is a senior economist in the Fiscal Studies department at the Fraser Institute. She has an M.A. in economics from Simon Fraser University.
NaChuM gabler ([email protected]) is a research assistant in the Centre for Canadian-American Relations at the Fraser Institute. He has an M.A. in economics from Boston University.
alex gaiNer ([email protected]) is a research economist in the Fiscal Studies department at the Fraser Institute. He holds an M.A. in economics from the University of British Columbia.
Miguel CerVaNtes ([email protected]) is an economist in the Fraser Institute’s Centre for Global Resource Studies. He holds B.A. and M.A. degrees in economics from the University of Texas at El Paso.

www.fraserinstitute.org Fraser Forum September/October 2011 7

8 Fraser Forum September/October 2011 www.fraserinstitute.org
Flaherty’s plan on shaky groundNiels Veldhuis aNd Charles laMMaM
Bigstock
On August 9th, 2011, the National Post’s editorial page celebrated the contin-uation of Canada’s AAA credit rat-
ing, in light of the US downgrade to AA+ (National Post, 2011).1 While there is no doubt that our fiscal health is relatively better than that of the United States and
many European countries, recent market volatility combined with declining com-modity prices should not make Canadians too complacent.
The Post noted that Canada had learned its lesson years ago. However, the
way we see it, the federal government is making the same basic mistake: pin-
ning hopes for a balanced budget on a combination of significantly higher future revenues while trying to slow
the growth in spending.In June 2011, the federal
government tabled a plan to balance the budget in five years (Department of Fi-nance, Canada, 2011).2 To get there, the Conservatives
forecasted revenues to grow at a robust average rate of 5.6%
over the next five years, while planning to hold program spending
increases to an average rate of 2.0%.The problem with this plan is
that while the federal government directly controls the amount it decides to spend—though Ca-nadians should exercise healthy
scepticism as the Conservatives’ track record on spending suggests
it will be unable to hold the line at 2.0%—the government is exposed to
revenue shocks that are beyond its control.A balanced budget plan that relies on
robust average revenue growth of 5.6% is one with significant risk and little-to-no upside potential. Lower than forecasted
revenue growth will mean larger deficits for a much longer period and significantly more
government debt. As we previously pointed out in our analy-
sis of the June budget, “The same approach did not work in the 1980s and early 1990s. Successive
www.fraserinstitute.org Fraser Forum September/October 2011 9
federal governments failed to balance the budget by try-ing to slow the growth in spending while hoping for higher revenues” (Veldhuis and Lammam, 2011).
Like the incumbent Conservatives, the Progressive Conservative government in the late 1980s and early 1990s was at least notionally predisposed to lower levels of government spending and balanced budgets. However, failure to eliminate the deficit came from the Progres-sive Conservative’s inability to constrain spending growth coupled with lower than expected revenues. That ulti-mately resulted in ongoing deficits, mounting debt, and a loss of Canada’s AAA rating in 1994.
Now, just months after the 2011 budget was tabled, the current government’s fiscal plan is facing similar risks with signs of a slowing US economy and the possibility of a double-dip recession increasing. Given that Canada’s economy is tied heavily to the US, any material slowdown in the US will likely have a negative impact on the Cana-dian economy, federal revenues, and the Conservatives’ deficit-reduction plan.3
To reduce the frailty of the current fiscal plan and to set Canada apart from the rest of the world, the Ca-nadian government must quickly balance its budget. Fi-nance Minister Flaherty can use the government’s fall economic and fiscal update to do just that—and balance the books in two years, not five.
First, Flaherty should ensure that program spending is returned to pre-stimulus levels. This can be achieved by greatly expanding the government’s Strategic and Op-erating Review, currently a one-year review of program spending —excluding transfers to individuals and gov-ernments—which proposes to find a mere 2% in sav-ings from the $352.5 billion in departmental spending planned from 2012–13 to 2014–15.
The expanded Strategic and Operating Review ought to prioritize spending so that important areas are spared deep cuts while lower priority areas carry a greater bur-den of the spending reductions. A good starting point is to significantly reduce, or eliminate, corporate subsidies, which have grown substantially under the Conservative regime.4
A two-year, balanced budget plan would substan-tially reduce the risks associated with a revenue shock like a slowing US economy. Such a plan also provides the Conservatives with upside potential. That is, if revenues rebound strongly, the Conservatives could then imple-ment a much-needed, multi-year plan to reduce personal income taxes.
In the wake of the American credit downgrade, the stock market plunge was an arresting reminder of the
risks facing the Canadian economy. The US economy is looking ever more fragile, sovereign debt concerns are growing in Europe, and commodity prices are soften-ing; all reasons why Canadians should feel increasingly uneasy about the government’s fiscal plan. The newly minted Conservative government should use its major-ity to implement the type of balanced budget plan that the Prime Minister and his colleagues once championed while they were members of the opposition.
Notes
1 A credit rating evaluates the credit worthiness of an issuer of debt, in this case government. AAA is the highest rating meaning the debt issuer is not likely to default.
2 Please note that, unless otherwise indicated, all data refer-enced in this article are sourced from Department of Finance, Canada (2011).
3 Interestingly, the Conservatives’ plan is built on the assump-tion that the US economy will grow robustly at an inflation-adjusted average rate of 3.2% over the next five years—faster than the Canadian economy at 2.7%.
4 Federal subsidies to the auto sector—just one of many sec-tors that receive corporate welfare—grew by around $10 bil-lion in 2009-10 (see Department of Finance, Canada, 2010).
References
Department of Finance, Canada (2010, March 4). Canada’s Economic Action Plan Year 2– Leading the Way on Jobs and Growth. < http://www.budget.gc.ca/2010/pdf/budget-planbudgetaire-eng.pdf>,as of 10 August 2011.
Department of Finance, Canada (2011, June 6). The Next Phase of Canada’s Economic Action Plan – A Low-Tax Plan for Jobs and Growth. <http://www.budget.gc.ca/2011/plan/Budget2011-eng.pdf>,as of 10 August 2011.
National Post (2011, August 6). Our AAA Nation. Na-tional Post. <http://www.nationalpost.com/opinion/na-tion/5225504/story.html>, as of 10 August 2011.
Veldhuis, Niels, and Charles Lammam (2011, June 8). The To-ries’ High-Tax-and-Spending Plan. Winnipeg Free Press. <http://www.winnipegfreepress.com/opinion/westview/the-tories-high-tax-and-spending-plan-123442069.html>, as of 10 August 2011.
The Canadian government must quickly balance its budget
10 Fraser Forum September/October 2011 www.fraserinstitute.org
It is folly to believe that governments can provide any and every service from birth to death while ignoring the economy
Wikimedia Commons
www.fraserinstitute.org Fraser Forum September/October 2011 11
The latest European Union (EU) deal for Greece will see yet another infusion of Euros
directed towards one of that conti-nent’s most profligate member states. The entire package, $109 billion Eu-ros in total, will be split between EU member countries who will contrib-ute $72 billion Euros with the private sector offering up $37 billion Euros (European Union, 2011). That is the equivalent of Canadian $149 billion (Bank of Canada, 2011).
It is proper that Europe’s private sector finally participate in the bailout; it’s overdue for financial institutions to bear part of the cost for the risk they took on by lending money to Greece in the first place. But the latest Greek bailout, as well as the budget problems in the United States, should cause both citizens and governments around the world to revisit cherished assumptions about the viability of the welfare state.
If the recent high-profile prob-lems in Greece (and the US) demon-strate anything, it is how the notion that governments can provide almost any and every service from birth to death—and yet ignore the economy and demographics—is folly. Much of the welfare state concept was always an illusion, one financed by lavish amounts of debt for which present and future taxpayers will pay in the form of higher taxes and reduced ser-vices during their lifetimes.
That this is not yet clear to many is unfortunate. The denial only delays a consideration of policy remedies that would better provide for inter-national shifts and thus better secure people’s financial and social needs. For example, it would have been preferable to mandate health care and savings accounts for individuals and families over the decades; that would at least have partially reduced the pressure to borrow from future generations via the public purse.
The denial starts at the highest levels. In a recent closed-door meet-ing in Washington, D.C., where I was present, several current and former European politicians, including at least two former heads of state, as-serted that the European model—by which they meant lavish social services—was a success. Here is the problem with that boast: insofar as European, American, and Canadian social programs have been financed by government borrowing in most years—and they have— it is an ex-aggeration to argue that such mod-els are a success or sustainable. It is akin to buying an expensive home and several luxury sports cars and handing the payments to the kids once they have become adults.
In the case of governments, the borrowing has been substantial. To understand the scope, consider the debt trajectory of the United States
and selected European countries since 1995, about the time (or short-ly after) that many Canadian gov-ernments began to grapple with our red ink. (All the following figures are from OECD, 2011a and OECD, 2011b unless otherwise noted.)
In 1995, Greece’s net liabilities were already 81% of GDP, in a year when Canada’s equivalent figure was 71%. Italy stood at 99% of GDP. Back then, France, Germany, and the Unit-ed Kingdom had net liabilities of 38%, 30%, and 26% respectively. Portugal’s was 24% and the US figure was 54%.
Fast forward to 2011, and all the countries are further in debt save Italy
Mark Milke
The welfare state was always an illusion
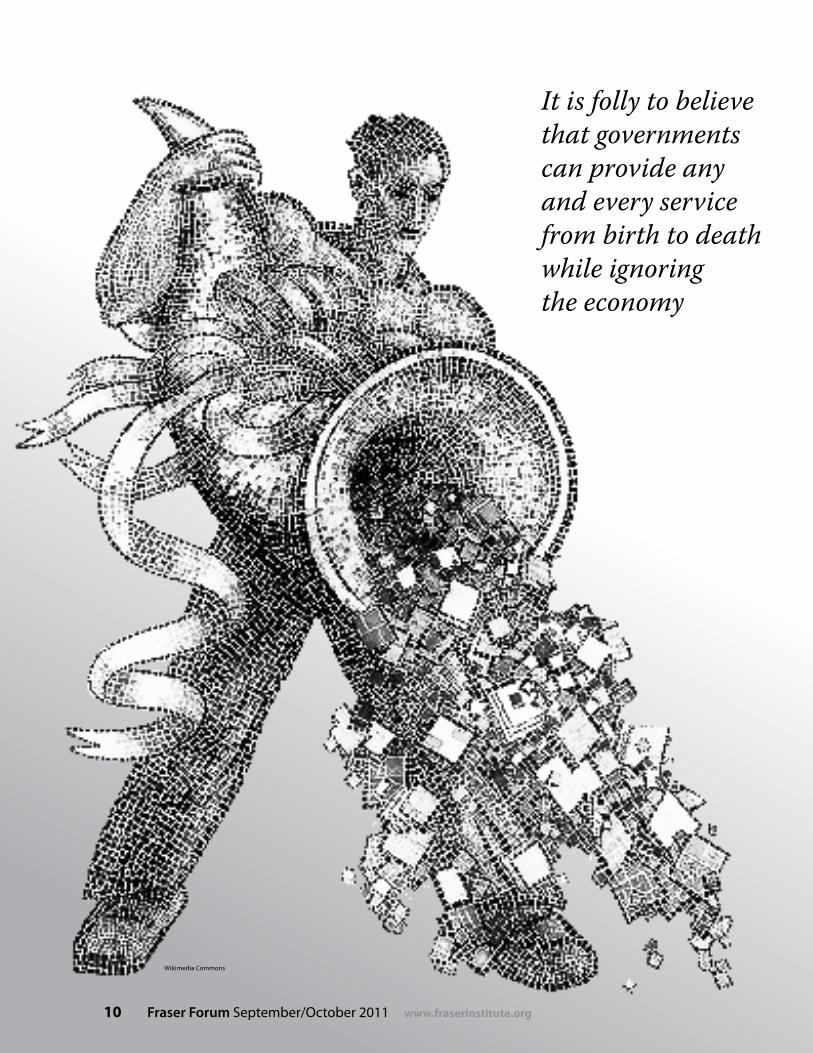
Greece’s President Papandreou has secured a second bailout for his country from the European Union.
Wik
imed
ia C
om
mo
ns
12 Fraser Forum September/October 2011 www.fraserinstitute.org
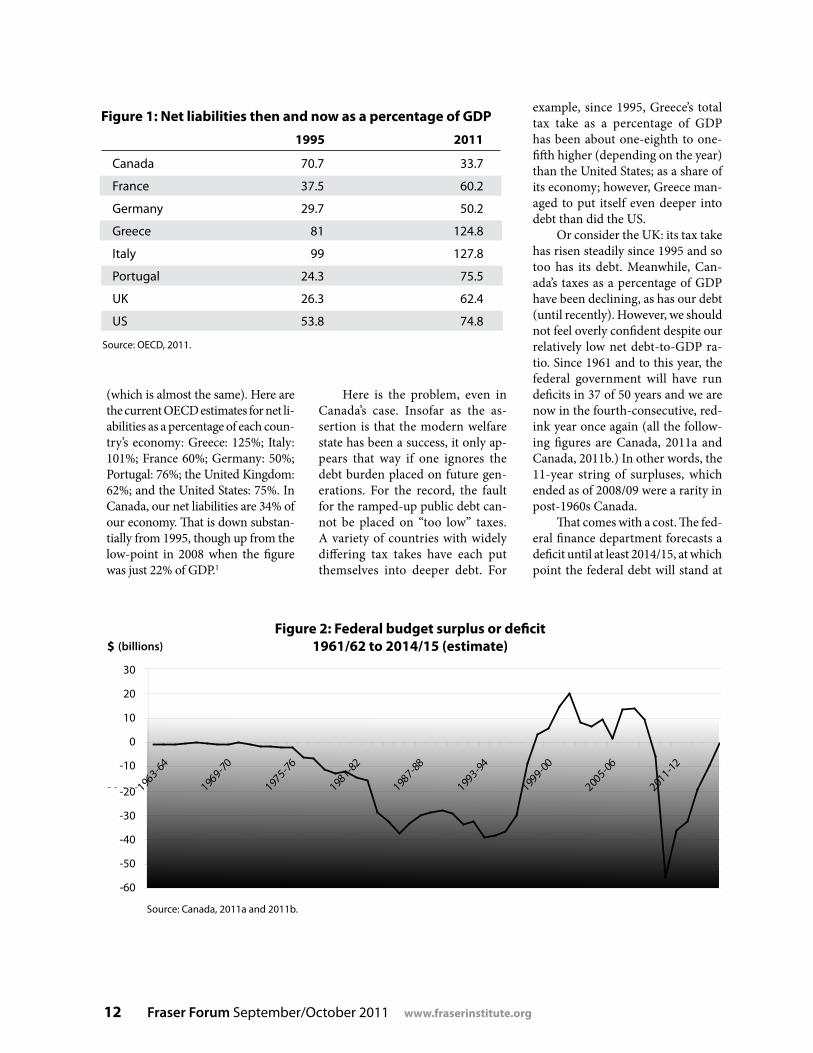
(which is almost the same). Here are the current OECD estimates for net li-abilities as a percentage of each coun-try’s economy: Greece: 125%; Italy: 101%; France 60%; Germany: 50%; Portugal: 76%; the United Kingdom: 62%; and the United States: 75%. In Canada, our net liabilities are 34% of our economy. That is down substan-tially from 1995, though up from the low-point in 2008 when the figure was just 22% of GDP.1
Here is the problem, even in Canada’s case. Insofar as the as-sertion is that the modern welfare state has been a success, it only ap-pears that way if one ignores the debt burden placed on future gen-erations. For the record, the fault for the ramped-up public debt can-not be placed on “too low” taxes. A variety of countries with widely differing tax takes have each put themselves into deeper debt. For
example, since 1995, Greece’s total tax take as a percentage of GDP has been about one-eighth to one-fifth higher (depending on the year) than the United States; as a share of its economy; however, Greece man-aged to put itself even deeper into debt than did the US.
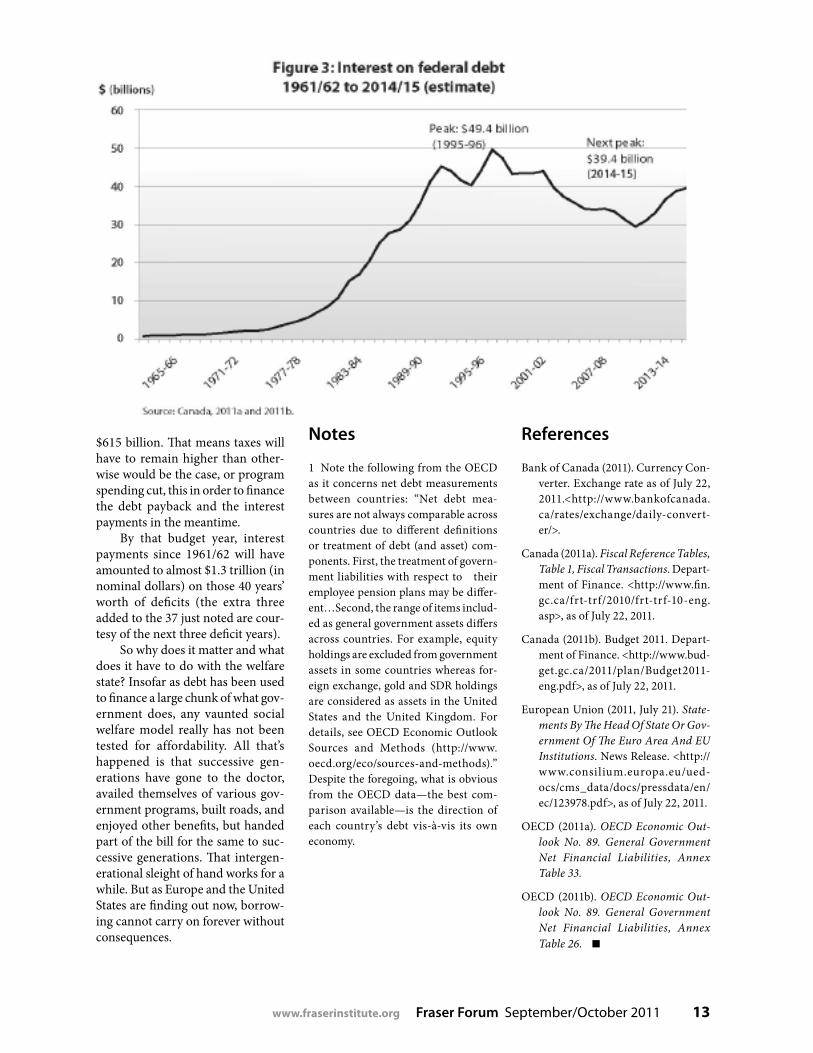
Or consider the UK: its tax take has risen steadily since 1995 and so too has its debt. Meanwhile, Can-ada’s taxes as a percentage of GDP have been declining, as has our debt (until recently). However, we should not feel overly confident despite our relatively low net debt-to-GDP ra-tio. Since 1961 and to this year, the federal government will have run deficits in 37 of 50 years and we are now in the fourth-consecutive, red-ink year once again (all the follow-ing figures are Canada, 2011a and Canada, 2011b.) In other words, the 11-year string of surpluses, which ended as of 2008/09 were a rarity in post-1960s Canada.
That comes with a cost. The fed-eral finance department forecasts a deficit until at least 2014/15, at which point the federal debt will stand at
Canada 70.7 33.7
France 37.5 60.2
Germany 29.7 50.2
Greece 81 124.8
Italy 99 127.8
Portugal 24.3 75.5
UK 26.3 62.4
US 53.8 74.8
Figure 1: Net liabilities then and now as a percentage of GDP 1995 2011
Source: OECD, 2011.
Figure 2: Federal budget surplus or deficit1961/62 to 2014/15 (est.)
-60,000
-50,000
-40,000
-30,000
-20,000
-10,000
0
10,000
20,000
30,000
1963-64
1969-70
1975-76
1981-82
1987-88
1993-94
1999-00
2005-06
2011-12
$, in
millions
Source: Canada, 2011a and 2011b.
$, in millions(billions)
30
20
10
0
-10
-20
-30
-40
-50
-60
Figure 2: Federal budget surplus or deficit1961/62 to 2014/15 (estimate)
www.fraserinstitute.org Fraser Forum September/October 2011 13
$615 billion. That means taxes will have to remain higher than other-wise would be the case, or program spending cut, this in order to finance the debt payback and the interest payments in the meantime.
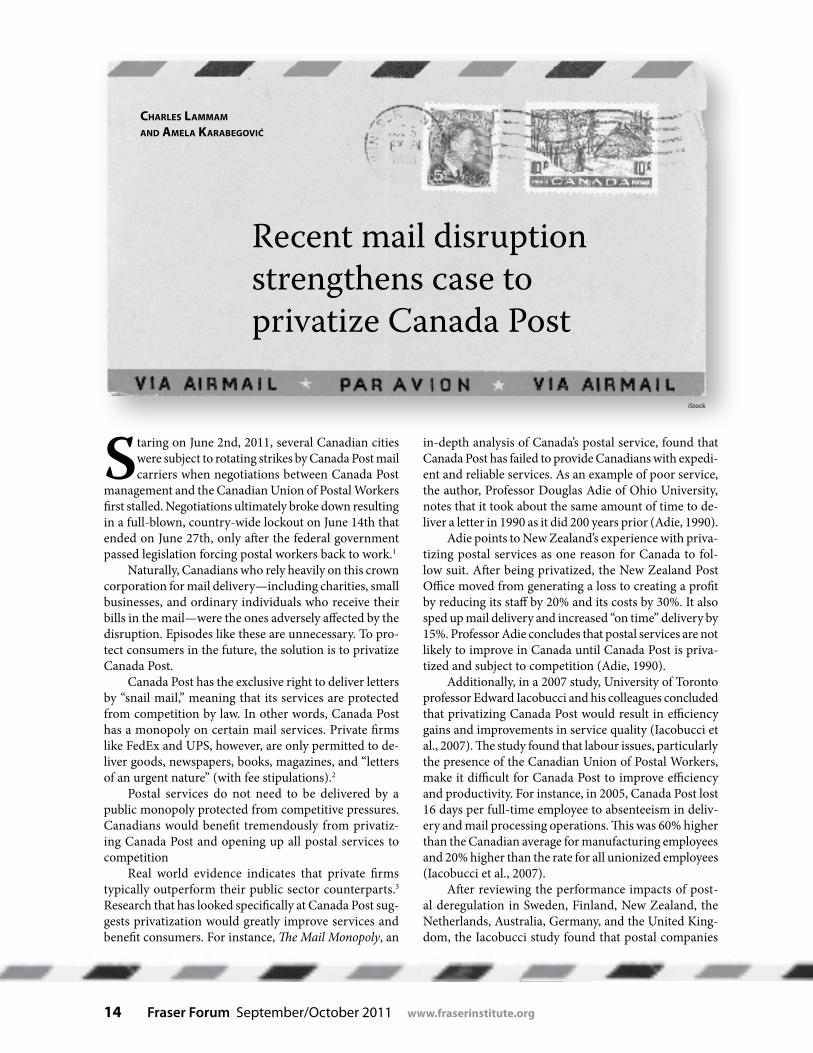
By that budget year, interest payments since 1961/62 will have amounted to almost $1.3 trillion (in nominal dollars) on those 40 years’ worth of deficits (the extra three added to the 37 just noted are cour-tesy of the next three deficit years).
So why does it matter and what does it have to do with the welfare state? Insofar as debt has been used to finance a large chunk of what gov-ernment does, any vaunted social welfare model really has not been tested for affordability. All that’s happened is that successive gen-erations have gone to the doctor, availed themselves of various gov-ernment programs, built roads, and enjoyed other benefits, but handed part of the bill for the same to suc-cessive generations. That intergen-erational sleight of hand works for a while. But as Europe and the United States are finding out now, borrow-ing cannot carry on forever without consequences.
References
Bank of Canada (2011). Currency Con-verter. Exchange rate as of July 22, 2011.<http://www.bankofcanada.ca/rates/exchange/daily-convert-er/>.
Canada (2011a). Fiscal Reference Tables, Table 1, Fiscal Transactions. Depart-ment of Finance. <http://www.fin.gc.ca/frt-trf/2010/frt-trf-10-eng.asp>, as of July 22, 2011.
Canada (2011b). Budget 2011. Depart-ment of Finance. <http://www.bud-get.gc.ca/2011/plan/Budget2011-eng.pdf>, as of July 22, 2011.
European Union (2011, July 21). State-ments By The Head Of State Or Gov-ernment Of The Euro Area And EU Institutions. News Release. <http://www.consilium.europa.eu/ued-ocs/cms_data/docs/pressdata/en/ec/123978.pdf>, as of July 22, 2011.
OECD (2011a). OECD Economic Out-look No. 89. General Government Net Financial Liabilities, Annex Table 33.
OECD (2011b). OECD Economic Out-look No. 89. General Government Net Financial Liabilities, Annex Table 26.
Notes
1 Note the following from the OECD as it concerns net debt measurements between countries: “Net debt mea-sures are not always comparable across countries due to different definitions or treatment of debt (and asset) com-ponents. First, the treatment of govern-ment liabilities with respect to their employee pension plans may be differ-ent…Second, the range of items includ-ed as general government assets differs across countries. For example, equity holdings are excluded from government assets in some countries whereas for-eign exchange, gold and SDR holdings are considered as assets in the United States and the United Kingdom. For details, see OECD Economic Outlook Sources and Methods (http://www.oecd.org/eco/sources-and-methods).” Despite the foregoing, what is obvious from the OECD data—the best com-parison available—is the direction of each country’s debt vis-à-vis its own economy.
14 Fraser Forum September/October 2011 www.fraserinstitute.org
Staring on June 2nd, 2011, several Canadian cities were subject to rotating strikes by Canada Post mail carriers when negotiations between Canada Post
management and the Canadian Union of Postal Workers first stalled. Negotiations ultimately broke down resulting in a full-blown, country-wide lockout on June 14th that ended on June 27th, only after the federal government passed legislation forcing postal workers back to work.1
Naturally, Canadians who rely heavily on this crown corporation for mail delivery—including charities, small businesses, and ordinary individuals who receive their bills in the mail—were the ones adversely affected by the disruption. Episodes like these are unnecessary. To pro-tect consumers in the future, the solution is to privatize Canada Post.
Canada Post has the exclusive right to deliver letters by “snail mail,” meaning that its services are protected from competition by law. In other words, Canada Post has a monopoly on certain mail services. Private firms like FedEx and UPS, however, are only permitted to de-liver goods, newspapers, books, magazines, and “letters of an urgent nature” (with fee stipulations).2
Postal services do not need to be delivered by a public monopoly protected from competitive pressures. Canadians would benefit tremendously from privatiz-ing Canada Post and opening up all postal services to competition
Real world evidence indicates that private firms typically outperform their public sector counterparts.3 Research that has looked specifically at Canada Post sug-gests privatization would greatly improve services and benefit consumers. For instance, The Mail Monopoly, an
in-depth analysis of Canada’s postal service, found that Canada Post has failed to provide Canadians with expedi-ent and reliable services. As an example of poor service, the author, Professor Douglas Adie of Ohio University, notes that it took about the same amount of time to de-liver a letter in 1990 as it did 200 years prior (Adie, 1990).
Adie points to New Zealand’s experience with priva-tizing postal services as one reason for Canada to fol-low suit. After being privatized, the New Zealand Post Office moved from generating a loss to creating a profit by reducing its staff by 20% and its costs by 30%. It also sped up mail delivery and increased “on time” delivery by 15%. Professor Adie concludes that postal services are not likely to improve in Canada until Canada Post is priva-tized and subject to competition (Adie, 1990).
Additionally, in a 2007 study, University of Toronto professor Edward Iacobucci and his colleagues concluded that privatizing Canada Post would result in efficiency gains and improvements in service quality (Iacobucci et al., 2007). The study found that labour issues, particularly the presence of the Canadian Union of Postal Workers, make it difficult for Canada Post to improve efficiency and productivity. For instance, in 2005, Canada Post lost 16 days per full-time employee to absenteeism in deliv-ery and mail processing operations. This was 60% higher than the Canadian average for manufacturing employees and 20% higher than the rate for all unionized employees (Iacobucci et al., 2007).
After reviewing the performance impacts of post-al deregulation in Sweden, Finland, New Zealand, the Netherlands, Australia, Germany, and the United King-dom, the Iacobucci study found that postal companies
Charles laMMaM aNd aMela karabegoVić
Recent mail disruption strengthens case to privatize Canada Post
iStock
www.fraserinstitute.org Fraser Forum September/October 2011 15
increased service quality, adapted products and services to demand, introduced several mail-related innovations, reduced employment, and improved labour performance.
Privatizing Canada Post may also result in decreased stamp prices. A recent report from the Montreal Eco-nomic Institute summarized the European experience with privatization and competition in postal services and found that Austria, the Netherlands, and Germany expe-rienced an 11% to 17% decline in the price of stamps for letter mail after privatization (Geloso and Chassin, 2011).
Lower prices and other benefits of privatization re-sult from key differences between the behaviour of private sector firms and crown corporations and the incentives each face. Crown corporations typically operate in a state-provided monopoly shielded from competitive discipline. This means they are not required to constantly update technologies and production processes or offer inno-vative products and services to customers. The lack of competition also translates into less pressure to avoid or minimize work stoppages; in the private sector, the de-cline in profits and market share would be detrimental to a firm’s viability.
In addition, crown corporations use less capital and are more labour-intensive than private sector firms (Meg-ginson and Netter, 2001). As a result, they tend to be less productive.
Another essential difference is that crown corpora-tions are influenced heavily by governments preoccu-pied with fulfilling political goals rather than pursuing economic or business objectives. Instead of allocating capital where it yields the highest economic return, gov-ernments typically allocate capital to areas that maximize their chances for re-election. This leads to a misallocation of resources.
Finally, crown corporations rarely go broke, since governments generally bail them out. If private businesses incur sustained losses, the decline of capital will push them into bankruptcy. To prevent this from occurring, private sector firms must provide customers with the quality of goods and services they demand, in a timely and efficient manner and at affordable prices. Crown cor-porations simply do not face the same pressures.
Canadians have much to gain from the privatization of postal services and our recent mail disruption only strengthens the case. It is time to privatize Canada Post.
Notes
1 The dates cited in this paragraph are sourced from Canada Post’s website: http://www.canadapost.ca/cpo/mc/aboutus/news/pr/2011/index.jsf.
2 For additional details on the exclusive privileges of Canada Post, see the Canada Post Corporation Act: http://laws-lois.justice.gc.ca/eng/acts/C-10/page-4.html.
3 See Lammam and Veldhuis (2009) for a survey of the aca-demic evidence on the benefits of privatization.
References
Adie, Douglas K. (1990). The Mail Monopoly–Analysing Ca-nadian Postal Service. Fraser Institute.
Geloso, Vincent, and Youri Chassin (2011). Canada Post: Opening Up to Competition. Economic Note (May). Mon-treal Economic Institute.
Iacobucci, Edward M., Michael J. Trebilock, and Tracey D. Epps (2007). Rerouting the Mail: Why Canada Post is Due for Reform. CD Howe Institute.
Lammam, Charles, and Niels Veldhuis (2009). It’s Time To Privatize Canada’s Crown Corporations. Fraser Forum (May): 31-34.
Megginson, William L., and Jeffry M. Netter. (2001). From State to Market: A Survey of Empirical Studies on Priva-tization. Journal of Economic Literature 39, 2: 321–89.
iStock

16 Fraser Forum September/October 2011 www.fraserinstitute.org
Niels Veldhuis, Peter CoWley, aNd Milagros PalaCios
Given the current fiscal climate—the BC govern-ment’s significant deficit ($1.4 billion over the next two years)1— and comparisons with the income of
average BC families, now is hardly the time for increased wages and benefits for BC teachers. Rather than give all teachers more, the next collective agreement should tie teacher pay to performance.
Largely as a result of the recent recession, the income of BC families has grown by only 0.8%, on average, over the past four years (The Fraser Institute’s 2011 Tax Calcu-lator; calculation by the authors). That is lower than the rate of inflation (Statistics Canada, 2011; calculations by authors). In other words, consumer prices have increased faster than the income of average BC families, meaning that many families are actually worse off today.
But this is not true for BC teachers who signed a generous collective agreement in 2006, which gave them an annual average wage increase of 2.5% over five years
(add in benefits and total compensation increase by 16% over the life of the agreement). In addition, each teacher received a $4,000 signing bonus (British Columbia Public School Employers’ Association, 2011a; British Columbia Teachers’ Federation, 2006a).
While average BC families struggled during the re-cession, BC teachers prospered. And after all this, the BC Teachers Federation (BCTF) wants even more as it renegotiates its contract.
Based on media reports, the BCTF is currently asking for2:
26 weeks (half year) paid leave to care for someone (being a family member is not a requirement);
a year's pay as a “bonus” for retiring veteran teachers; two weeks paid leave upon the death of any friend;
five paid days per year for professional activities; two sick days a month that can be saved up; and a substantial pay increase (not yet specified) that
New comp ensa t ion package for BC teachers
should t ie pay to
p er formance
Bigstock

www.fraserinstitute.org Fraser Forum September/October 2011 17
would make BC teacher “the best paid teachers in the country.”
According to the teachers’ “employer”— the BC Public School Employers Association— it would cost BC taxpayers more than $2 billion to meet these demands (British Columbia Public School Employers’ Association, 2011b). And that doesn’t include their full salary demands.
The BC teachers union continues to ask for more, but refuses to consider a “merit pay” system that rewards teachers for effective teaching and encourages less suc-cessful teachers to improve their skills.1 Such systems are common in both the public and the private sectors. Sales commissions, bonuses for established levels of superior performance, piecework, team incentives, and pay raises based on past success are all of common systems merit pay.
BC teachers generally earn a pay increase in two ways: they all get an annual increase upon completion of each of their first ten years of service or they get a boost through additional schooling.2
The research here is clear. Except for the first couple of years of teaching, more experience does not make a teacher more effective. Likewise, an advanced degree does not necessarily produce a more effective teacher either (Cowley and Veldhuis, 2011).3 The current compensa-tion system for BC teachers simply does not recognize effectiveness, and the BCTF is not willing to consider one that does.4
Add to this the fact that it is nearly impossible to penalize a failing teacher and you have a compensation system that contributes little to the improvement of our children’s futures. BC families need a reasonable deal to be finalized before kids return to school in September. Unfor-tunately, the BCTF’s current demands are not reasonable.
Notes
1 See British Columbia, Ministry of Finance (2011) for deficit estimates for 2011/12 and 2012/13.
2 See http://www.ctvbc.ctv.ca/servlet/an/local/CTVNews/20110104/bc_abbott_carbon_tax_110104?hub=BritishColumbiaHome
3 See the Teacher Qualification Service (TQS) category re-quirements at www.tqs.bc.ca/requirements.html and Local Collective Agreements 2006-2011 at http://bctf.ca/Bargain-ingAndContracts.aspx?id=23150
4 There is solid evidence that properly designed merit pay sys-tems can have positive affects. Please see Cowley and Veldhuis for a review of the literature.
5 See Local Collective Agreements 2006-2011 http://bctf.ca/BargainingAndContracts.aspx?id=20788&libID=20778
ReferencesBritish Columbia, Ministry of Finance (2011). Budget and
Fiscal Plan 2011/12––2013/14. <http://www.bcbudget.gov.bc.ca/2011/bfp/2011_Budget_Fiscal_Plan.pdf>, as of July 25, 2011.
British Columbia Public School Employers’ Association (2011a). Provincial Collective Agreement 2006–2011.<http://www.bcpsea.bc.ca/documents/pca3.pdf>, as of July 25, 2011.
British Columbia Public School Employers’ Association (2011b). Updated Costing of Key BCTF Proposals. <http://www.bcpsea.bc.ca/documents/teacher%20bargaining/00-DS-Updated%20Costing%20of%20Key%20BCTF%20Proposals%20June%2028%202011.pdf>, as of June 28, 2011.
British Columbia Teachers’ Federation (2006a, September 5). BCTF Issue Alert, 19:1. <http://bctf.ca/publications/IssueAlert.aspx?id=6076>, as of June 28, 2011.
British Columbia Teachers’ Federation (2006b, September 8). BC Teachers Ratify Agreement. News Release < http://bctf.ca/NewsReleases.aspx?id=8236&printPage=true>, as of June 28.
Cowley, Peter, and Niels Veldhuis (2011). Properly Designed, Merit Pay For Teachers Will Pay Off For Students. Fraser Forum (May/June): 10–11. <http://www.fraserinstitute.org/uploadedFiles/fraser-ca/Content/research-news/re-search/articles/properly-designed-merit-pay-for-teachers.pdf>, as of June 28, 2011.
Statistics Canada (2011). The Consumer Price Index. Catalogue No. 62-001-XWE, 90, 6 (June). <http://www.statcan.gc.ca/bsolc/olc-cel/olc-cel?catno=62-001-X&lang=eng>, as of June 28, 2011.
I t i s nearlyimp oss ible top enal ize afai l ing teacher
Bigstock
18 Fraser Forum September/October 2011 www.fraserinstitute.org
Before Parliament was shut down, the mood in Ottawa was one of increased trans-
parency and accountability. For instance, two private member bills making their way through the House and Senate were aimed at increasing the transparency of First Nations re-serves and Canadian charities. Be-fore this mood changes, the federal government should consider greater disclosure for another sector that se-verely lacks it: Canadian unions.
The current push for greater transparency
The push for greater transparency on First Nations reserves has gained
traction with Canadian politicians over the past year. In the fall of 2010, Kelly Block, a Conservative member of parliament tabled a private mem-ber’s bill (Bill C-575: Reserve Politi-cians’ Pay Transparency Bill) that would require public disclosure (on the Internet) of the salaries and re-imbursement of expenses for First Nations chiefs and council mem-bers across Canada (Parliament of Canada, 2011a; Craig, 2011). The bill has passed its second reading in the House of Commons with 151 MPs voting for the bill and 128 against (Parliament of Canada, 2011a).
Similar developments have oc-curred in the charitable sector. Al-bina Guarnieri, a Liberal member of parliament drafted a bill (Bill C-470:
An Act to Amend the Income Tax Act Disclosure of Compensation — Regis-tered Charities) into parliament that proposes public disclosure for an-nual compensation of any executive or employee (at a registered charity) paid over $100,000. The House of Commons passed the bill on March 8th, 2011, and the next day it then passed its first reading in the Senate (Parliament of Canada, 2011b).
Of course, greater transparency and accountability are goals most Canadians would support. Canadian taxpayers, after all, provide billions to First Nations reserves and should therefore receive information on how their money is spent.
Registered charities, on the oth-er hand, are exempt from taxes and
Niels Veldhuis aNd aMela karabegoVić
Indecent disclosure Canadian unions should reveal financials
Fotolia

can issue receipts providing their donors with tax credits for their do-nation. Many charities also receive direct funding from the government. In part for these reasons, registered charities are already required to pro-vide financial information including staff compensation to Canada Rev-enue Agency, which publishes it for public viewing on its website (see http://www.cra—arc.gc.ca/chrts—gvng/lstngs/menu—eng.html).
The benefits of transparency and accountability
Public disclosure of financial infor-mation allows interested parties to gauge the financial health and per-formance of organizations. In ad-dition, transparency leads to, and is essential for, accountability. Dis-closing financial information pub-licly allows people to determine the appropriateness and effectiveness of spending (Palacios, et al., 2006). Empirical research has found that the benefits of greater transparency include improved governance and reduced corruption.1
Indecent union disclosure
While public companies, charities—and hopefully soon, First Nations reserves—are subject to significant level of disclosure, little is required of unions in Canada in terms of releas-ing financial information. Currently, neither the federal government nor provincial governments require public disclosure of union financial information (Palacios, et al., 2006). This special treatment is striking giv-en that unions receive funding from tax-deductible union dues.
In addition, workers in Canada can be legally forced to join a union as a condition of employment and
have no choice but to remit union dues. Union leaders are able to use these mandatory and tax-deductible union dues to fight political battles, which their “members” and non-members may or may not support.
Union leaders in most juris-dictions (provincial and federal) would likely highlight that unions are required to make financial state-ments available to their members; Alberta, Prince Edward Island, and Saskatchewan do not require disclo-sure of financial statements to union members (Palacios, et al., 2006). However, union members must for-mally request financial statements, meaning the requests are not anony-mous (Palacios, et al., 2006). Lack of anonymity, seriously compromises a worker’s confidentiality and ability to make assessments without influence from union representatives.
This also means that the dues paying unionized workers who have not been forced to join the union, or have chosen not to join, have no right to informa-tion about how their money is be-ing spent—even though they must pay those dues to keep their jobs. In addition, no Canadian province or the federal government prescribes or mandates a particular amount of detail in the financial statements (Palacios, et al., 2006). For instance, unions are not required to delineate expenses by type of activity. Most importantly, there is no require-ment that financial statements in-dicate a breakdown between money spent on activities directly related to representing workers and activities unrelated to representation such as political activities.
In comparison, the United States requires significantly more disclosure from unions. To counter corruption and mismanagement, and to increase the transparency of union operations, the US govern-ment enacted new financial dis-closure requirements in 2004. This legislation has required all unions
Fotolia
Fotolia
www.fraserinstitute.org Fraser Forum September/October 2011 19
20 Fraser Forum September/October 2011 www.fraserinstitute.org
to submit detailed financial statements to the Federal Department of Labor (DOL). Large unions—those that spend over $250,000 per year—are required to provide information for 47 financial items and another 21 non-financial items organized into two financial statements and 20 supporting schedules. Less onerous requirements are imposed on smaller unions, which spend less than $250,000 (Palacios, et al., 2006). Critically, all unions in the United States must specify the breakdown between spending on collective representation and spending not related to representation.
Another important aspect of union financial disclo-sure in the US is that union members and the public have equal access to all this information on the DOL website. This allows anonymous access in which union representa-tives are less likely to influence a worker’s decisions.
Providing publically disclosed information about the financial status of unions enables workers to assess more accurately the financial position, activities, and perfor-mance of their representatives. Disclosing financial infor-mation publicly allows workers and interested parties to determine the appropriateness and effectiveness of union spending. The increased transparency that comes from public disclosure is also essential for accountability and provides an incentive for union leaders to manage mem-bership dues properly.
Despite its depth and coverage, there is room for improvement when it comes to union disclosure in the United States. For example, the available data lack sim-plicity, making it difficult for an average person to get a true picture of unions’ finances (Palacios, et al., 2006). Unfortunately, many additional disclosure requirements that would have made union disclosure more comprehen-sive were stalled and/or rescinded by the Obama Admin-istration (Sherk, 2010; Korbe, 2011).
Specific differences in laws regarding union mem-bership and union dues payments magnify the differ-ences in union disclosure laws in Canada and the United States. As noted, workers can be forced to join a union as a condition of employment and are required to pay full union dues; this stands in stark contrast to the United States where workers cannot be forced to join or maintain membership in a union to retain their jobs. In addition, federal laws in the US allow workers a choice when it comes to financially supporting union activities that are not linked directly with worker representation, such as political activities.
Put another way, US workers have a choice regard-ing union membership and full dues payment, and have anonymous access to detailed information on union fi-nances. Canadian workers have neither.
Conclusion
Canadian politicians should be applauded for encour-aging increased transparency and accountability. Pub-lic disclosure of financial information allows interested parties to gauge the financial health and performance of organizations, and the transparency created by disclosure laws serves to improve the governance of those organiza-tions. Given the disclosure requirements already in place for publicly traded companies, charities, and other public organizations, it is time to end the special treatment of unions. At a minimum, Canadian unions should have the same level of financial disclosure as do their counterparts in the US. As the saying goes, “a little information goes a long way.”
This article was first published by C2C: Canada’s Journal of Ideas at http://www.c2cjournal.ca/.
Note
1 For a summary of the literature on the benefits of transpar-ency, see Palacios, et al., 2006.
References
Craig, Colin (2011). What’s So Secret about Reserve Politicians’ Pay? The Canadian Taxpayers Federation.
Korbe, Tina (2011, March 4). Obama, Solis Gut Bush—Era Union Financial Transparency Regs. Washington Ex-aminer. <http://washingtonexaminer.com/opinion/op-eds/2011/03/obama-solis-gut-bush-era-union-financial-transparency-regis>, as of August 2, 2011.
Palacios, Milagros, Jason Clemens, Keith Godin, and Niels Veldhuis (2006). Union Disclosure in Canada and the United States. Studies in Labour Markets. Fraser Institute.
Parliament of Canada (2011a). LEGISinfo — Private Member’s Bill C – 575 (40— 3). <http://www.parl.gc.ca/LegisInfo/BillDetails.aspx?Language=E&Mode=1&Bill=C575&Parl=40&Ses=3>, as of August 2, 2011.
Parliament of Canada (2011b). LEGISinfo — Private Member’s Bill C – 470 (40— 3). <http://www.parl.gc.ca/LegisInfo/Bill-Details.aspx?Language=E&Mode=1&billId=4328660>, as of August 2, 2011).
Sherk, James (2010, December 16). Congress Should Block Union Transparency Rollback. WebMemo, No. 3084. Heri-tage Foundation.
www.fraserinstitute.org Fraser Forum September/October 2011 21
Tax policy
Kesselman, Jonathan (2011). Consumer Impacts of BC’s Harmonized Sales Tax: Tax Grab or Pass-Through? Canadian Public Policy 37, 2: 138–162.
Based on the notion that businesses do not pass on tax savings to consumers, many British Columbians believe that the harmonized sales tax (HST) shifts the tax bur-den from businesses to consumers and results in signifi-cantly higher prices. Using data from Statistics Canada’s Consumer Price Index, which helps measure monthly and annual price changes, this study analyzes the actual impact of BC’s HST on prices in the six months after its July 1st, 2010 implementation. The study finds that the overall price level in BC increased initially in July relative to three western provinces without a harmonized sales tax (Alberta, Saskatchewan, and Manitoba), but fell in the ensuing months. All told, the HST raised BC’s overall price level by only 0.5% to 0.6%. This increase is equiva-lent to consumers paying an additional $1 for every $165 to $200 spent on all goods and services. The increase in overall prices is negligible and suggests businesses have passed on much of their tax savings to consumers in a very short period.
—Milagros Palacios
Perotti, Roberto (2011). The Effects of Tax Shocks on Output: Not So Large, But Not Small Either. NBER Working Paper No. 16786. National Bureau of Eco-nomic Research.
Despite much evidence showing that tax increases hinder economic growth, a hotly debated public policy issue is the magnitude of the impact. In this paper, the author builds on seminal work by University of California, Berk-ley professors Christina and David Romer, which found that a 1.0 percentage point increase in government tax revenue as a proportion of gross domestic product (GDP) leads to a decline in GDP of 3.0 percentage points after three years. Using a slightly different methodology than the Romers—one that separates the effects of two types of tax changes (policy-driven and business-cycle in-duced)—the author finds that the impact of tax increases is still significant but smaller than what the Romers esti-mated. The period of analysis in this paper is also differ-ent. The author examines quarterly data from the United States over the period 1945 to 2009 (vs. 1947 to 2006).
In the end, he finds that “a one percentage point of GDP increase in taxes leads to a decline in output by about 1.5 percentage points after 12 quarters [three years]” (p. 38).
—Charles Lammam
Government performance
Bergh, Andreas, and Magnus Henrekson (2011). Government Size and Growth: A Survey and Interpre-tation of the Evidence. Journal of Economic Surveys (forthcoming).
While some level of government activity is necessary for a well-functioning economy, excessively large government sectors can have dulling effects. This study comprehen-sively surveys the recent literature on the relationship between government size and economic growth with a special focus on studies including: highly developed countries such as Canada; measurements of government size being total taxes or spending relative to gross domes-tic product (GDP); and the effects of changes in govern-ment size over time. The authors conclude the “consen-sus” is that larger governments and income growth per person have a negative correlation. Typically, an increase in government size of 10 percentage points of GDP (mea-sured by total taxes or spending) is associated with a 0.5 to 1.0 percentage point lower annual growth rate. The negative effects of big government can occur because of increased economic distortions through the tax system or unproductive spending that damages otherwise well-functioning markets. The composition of government also matters for economic growth. For example, a tax system that relies more on personal income taxes is more damaging than one that relies more on sales taxes. On the spending side, government transfers and consumption are negatively related to growth while education spending is positively related. In addition, the study tries to ex-plain why some big government countries (i.e., Sweden) might experience above-average economic growth. First, high levels of social trust in the population may mitigate the harms from big governments on the economy. Sec-ond, “market-friendly” policies in other areas may offset growth-damaging policies from big government such as high taxes.
—Charles Lammam
Quarterly Research Alert
22 Fraser Forum September/October 2011 www.fraserinstitute.org
Underground economy
Terefe, Berouk, Conrad Barber-Dueck, and Marie-Josée Lamontagne (2011). Estimating the Underground Economy in Canada, 1992–2008 (June 2011). Income and Expenditure Accounts Division: Statistics Canada.
The authors estimate the size of Canada’s underground economy—economic activities that are not captured by traditional measures due to their hidden, illegal, or infor-mal nature—over the period 1992 to 2008. Their estimate excludes illegal activities related to drugs and prostitu-tion because reliable data in these areas is unavailable. Between 1992 and 2008, there was a total of almost $444 billion in underground activity in Canada (excluding il-legal drugs and prostitution). Although the dollar value of Canada’s underground economy nearly doubled from $18.8 billion in 1992 to $35.7 billion in 2008, it declined as a proportion of gross domestic product (GDP) from 2.7% to 2.2% over the same period. The decline occurred because traditionally underground industries (i.e., con-struction) are a shrinking portion of the overall economy and because non-underground industries (i.e., public administration) are growing quickly. In 2008, the three largest underground economy industries (excluding il-legal drugs and prostitution) were construction (30%), retail trade (16%), and accommodation and food services (12%).—Milagros Palacios
Labour market policy
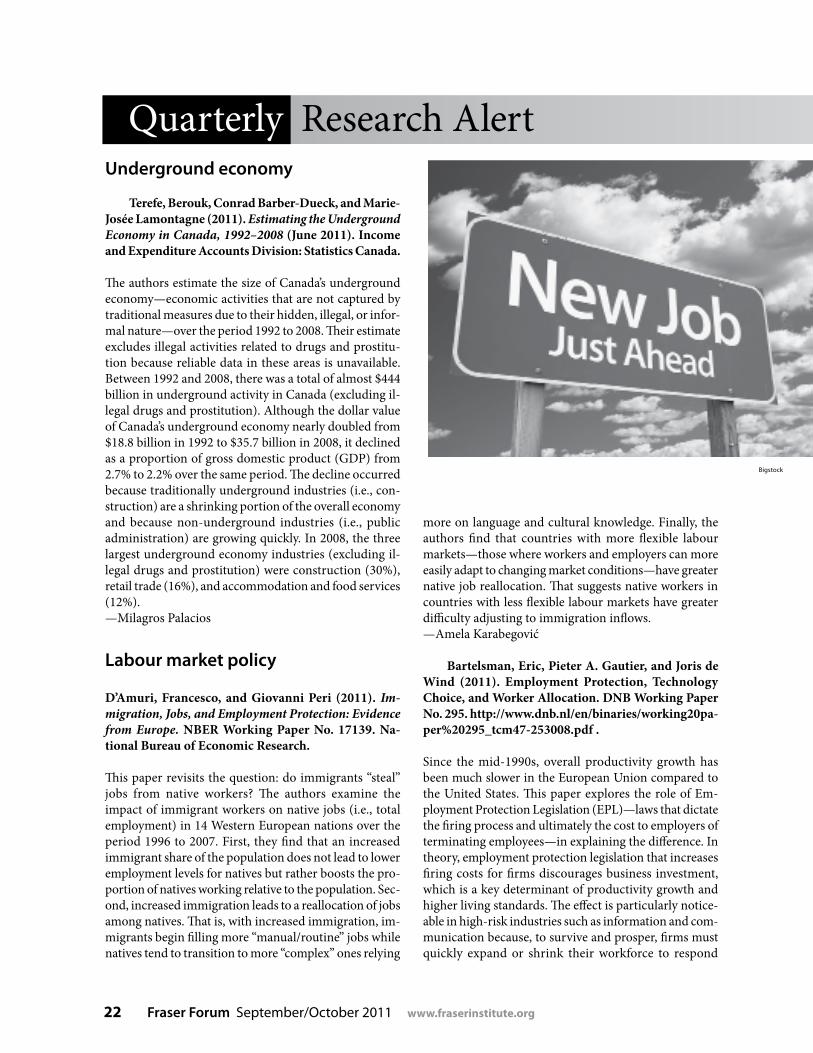
D’Amuri, Francesco, and Giovanni Peri (2011). Im-migration, Jobs, and Employment Protection: Evidence from Europe. NBER Working Paper No. 17139. Na-tional Bureau of Economic Research.
This paper revisits the question: do immigrants “steal” jobs from native workers? The authors examine the impact of immigrant workers on native jobs (i.e., total employment) in 14 Western European nations over the period 1996 to 2007. First, they find that an increased immigrant share of the population does not lead to lower employment levels for natives but rather boosts the pro-portion of natives working relative to the population. Sec-ond, increased immigration leads to a reallocation of jobs among natives. That is, with increased immigration, im-migrants begin filling more “manual/routine” jobs while natives tend to transition to more “complex” ones relying
Quarterly Research Alert
more on language and cultural knowledge. Finally, the authors find that countries with more flexible labour markets—those where workers and employers can more easily adapt to changing market conditions—have greater native job reallocation. That suggests native workers in countries with less flexible labour markets have greater difficulty adjusting to immigration inflows.—Amela Karabegović
Bartelsman, Eric, Pieter A. Gautier, and Joris de Wind (2011). Employment Protection, Technology Choice, and Worker Allocation. DNB Working Paper No. 295. http://www.dnb.nl/en/binaries/working20pa-per%20295_tcm47-253008.pdf .
Since the mid-1990s, overall productivity growth has been much slower in the European Union compared to the United States. This paper explores the role of Em-ployment Protection Legislation (EPL)—laws that dictate the firing process and ultimately the cost to employers of terminating employees—in explaining the difference. In theory, employment protection legislation that increases firing costs for firms discourages business investment, which is a key determinant of productivity growth and higher living standards. The effect is particularly notice-able in high-risk industries such as information and com-munication because, to survive and prosper, firms must quickly expand or shrink their workforce to respond
Bigstock
www.fraserinstitute.org Fraser Forum September/October 2011 23
New studies, new ideas
Bigstock
to constantly changing market conditions, and also to capitalize on new opportunities in a timely fashion. Af-ter examining data on employment protection laws in European countries and in the US, the authors find that “higher firing costs are associated with lower employ-ment shares in high risk industries [like information and communication] and higher shares in low risk industries” (p. 35). They extend the results to explain the European/US productivity gap: the costs of investing in new tech-nology are lower in the US due to lower firing costs so high risk industries are better able to flourish, which in-creases the country’s overall productivity growth.—Amela Karabegović
Industrial policy
Haltiwanger, John C., Ron S. Jarmin, and Javier Miranda (2010). Who Creates Jobs? Small vs. Large vs. Young. NBER Working Paper No. 16300. National Bu-reau of Economic Research.
The authors challenge the widespread perception that “most new jobs are created by small businesses.” They use a new dataset on US firms spanning 1976 to 2005 and covering all businesses in the private non-farm economy that file payroll taxes with the Internal Revenue Service (IRS). The data is unique because it includes the age of firms. The authors do not find a relationship between net job growth (jobs created less jobs destroyed) and firm size but do find one between net job growth and firm age. That is, young firms—especially firms less than 5 years old—are positively associated with net job growth. This relationship is strongest for business start-ups—firms less than 1 year old—which make up just 3% of total US em-ployment but close to 20% of total US gross job creation.—Alex Gainer
Education policy
Woessmann, Ludger (2011). Cross-Country Evi-dence on Teacher Performance Pay. Economics of Edu-cation Review 30, 3: 404–418.
There has been much discussion recently, particularly in British Columbia, about introducing performance-related pay structures (i.e., “merit pay”) for public school teachers. Such structures reward effective teach-ers for improved student outcomes. This study examines
the impact of teacher performance pay on student test scores using data from 28 highly developed countries. Canada is not included in the analysis because data was not provided in the survey of teacher salaries and salary adjustments. The data include standardized test results from the Programme for International Student Assess-ment (PISA) for students in each country on subject areas covering mathematics, science, and reading. To be clas-sified as using teacher performance pay, a country must award its public school teachers “salary adjustments” for “outstanding performance in teaching.” The study finds that student test scores are significantly higher in coun-tries that use teacher performance pay compared to those that do not. This relationship is most pronounced for test scores in mathematics and reading.—Alex Gainer
Border policy
Nguyen, Trien T., and Randall M. Wigle (2011). Bor-der Delays Re-Emerging Priority: Within-Country Dimensions for Canada. Canadian Public Policy 37, 1: 49–59.
Since the unfortunate 9/11 attacks, the Canada-US bor-der has “thickened” due to heightened security causing increased delays. This study estimates the impact of bor-der delays on Canadian trade flows and the Canadian economy more generally. The impact of border delays is quantified for two scenarios. Under the first, border delays are assumed to increase costs for businesses en-gaged in both merchandise and service trade by 1%. This translates into a shortfall in total Canadian trade of 3.6% and lost economic output valued at 1% of Canada’s total gross domestic product (GDP). In the second and less conservative scenario, the assumption is that border de-lays cause a 2% cost increase for businesses in merchan-dise trade and a 1% cost increase for those in service trade. Here, the impact is more negative: a shortfall in total Canadian trade of 6.8% and lost economic output equal to 1.8% of total Canadian GDP. The study also finds that Ontario and Quebec are hardest hit by border de-lays while British Columbia suffers the least. The study concludes that there are large economic benefits from reducing border delays. —Nachum Gabler

24 Fraser Forum September/October 2011 www.fraserinstitute.org
Using private drug insurance to achieve universal
access for new prescription
drugs Mark roVere
Canadians dependent on pro-vincial public drug plans continue to wait unreason-
ably long times to access the newest drugs that Health Canada certifies as safe and effective. Moreover, recipients of these programs are often outright denied access to such new drugs. This should come as no surprise, as prov-inces are faced with political pressures and budget constraints due to unsus-tainable health care costs (Skinner and Rovere, 2011). While some provincial plans cover more new drugs than others, in general, cost containment policies such as delaying and denying coverage for the newest prescription drugs are common among all provin-cial drug plans. In contrast, evidence shows that private drug insurance in Canada tends to cover far more new drugs certified by Health Canada and covers new drugs much sooner than public drug programs (Rovere and Skinner, 2011). Under these circum-stances, it is clear that private drug insurance in Canada is far more gen-erous in terms of covering new drugs than publicly funded government-run programs. Therefore, if all Canadians want speedy, universal access to the
newest prescription drugs approved by Health Canada, the optimal solu-tion is for governments to get out of the drug insurance business altogether and instead facilitate access to private sector insurance through means-test-ed subsidies for low-income people.
Waiting for new drugs
Canadians wait longer than their European and American counterparts to access the newest drugs. Our an-nual update of Access Delayed, Access Denied: Waiting for New Medicines in Canada finds that Health Canada’s performance was worse than that of the European EMEA (the European Union’s drug certification agency) in all four years studied (2006 to 2009). Likewise, the most recently available data indicate that Health Canada’s performance was worse than that of the American FDA in five of the last six years studied (2004 to 2009) (Ro-vere and Skinner, 2011). This means that Canadians are often deprived of many of the new drugs that are avail-able in other countries.
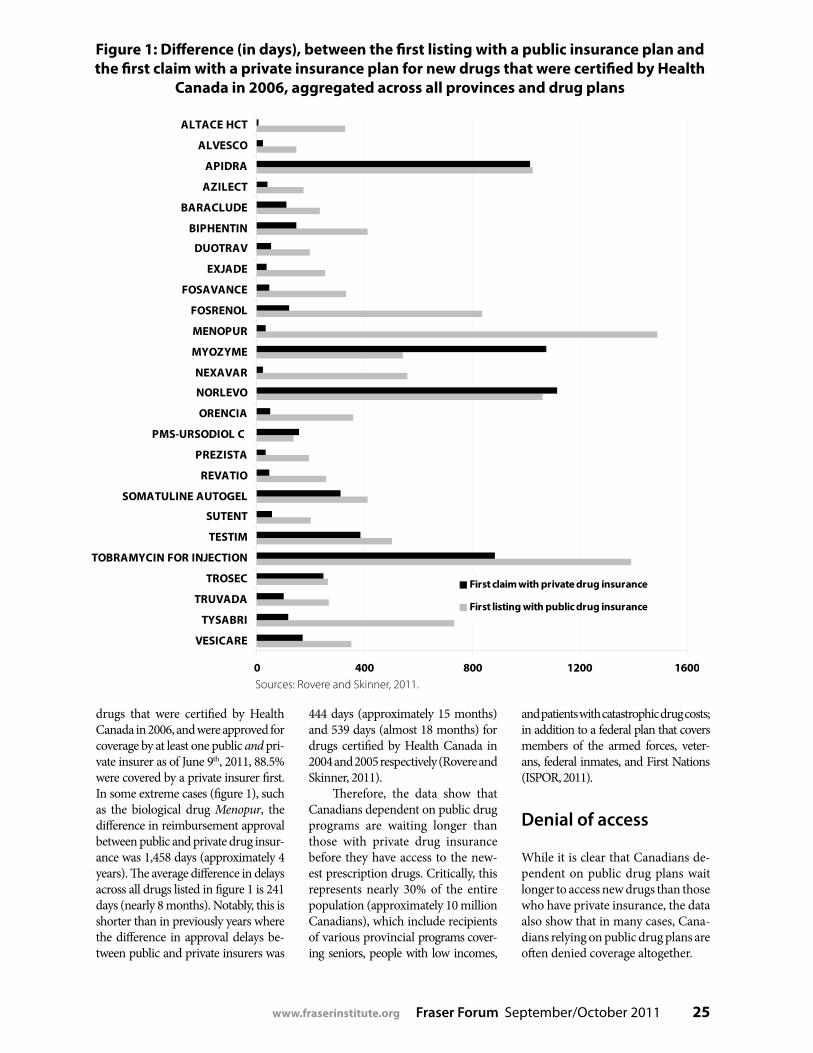
Once Health Canada certifies a new drug—giving the drug manufac-turer permission to sell the product in Canada—the wait is not over for many Canadians. This is because in-surers, both public and private, must decide whether or not the new drug will be covered under their respec-tive drug plans. Although it is normal for drug insurers to take “some” time when deciding if they will cover a spe-cific drug, the data indicate that public drug insurance plans in Canada take far longer than private drug insurance plans to make a decision. Figure 1 dis-plays the difference in days between the first claim that was made with a private insurance plan and the first listing of the drug with a public insurance plan (aggregated across provinces) for all drugs that received certification from Health Canada in 2006 (pharmaceuti-cal and biological), and that have been approved for reimbursement by at least one public and private drug insurance plan as of June 9th, 2011. As figure 1 shows, only three drugs (Myozyme, Norlevo, and PMS-Ursodiol C) were listed for public reimbursement before being covered by at least one private in-surer. Put another way, out of the new
NEW
Bigstock
www.fraserinstitute.org Fraser Forum September/October 2011 25
0 400 800 1200 1600
VESICARE
TYSABRI
TRUVADA
TROSEC
TOBRAMYCIN FOR INJECTION
TESTIM
SUTENT
SOMATULINE AUTOGEL
REVATIO
PREZISTA
PMS-URSODIOL C
ORENCIA
NORLEVO
NEXAVAR
MYOZYME
MENOPUR
FOSRENOL
FOSAVANCE
EXJADE
DUOTRAV
BIPHENTIN
BARACLUDE
AZILECT
APIDRA
ALVESCO
ALTACE HCT
First claim with private drug insurance
First listing with public drug insurance
drugs that were certified by Health Canada in 2006, and were approved for coverage by at least one public and pri-vate insurer as of June 9th, 2011, 88.5% were covered by a private insurer first. In some extreme cases (figure 1), such as the biological drug Menopur, the difference in reimbursement approval between public and private drug insur-ance was 1,458 days (approximately 4 years). The average difference in delays across all drugs listed in figure 1 is 241 days (nearly 8 months). Notably, this is shorter than in previously years where the difference in approval delays be-tween public and private insurers was
444 days (approximately 15 months) and 539 days (almost 18 months) for drugs certified by Health Canada in 2004 and 2005 respectively (Rovere and Skinner, 2011).
Therefore, the data show that Canadians dependent on public drug programs are waiting longer than those with private drug insurance before they have access to the new-est prescription drugs. Critically, this represents nearly 30% of the entire population (approximately 10 million Canadians), which include recipients of various provincial programs cover-ing seniors, people with low incomes,
and patients with catastrophic drug costs; in addition to a federal plan that covers members of the armed forces, veter-ans, federal inmates, and First Nations (ISPOR, 2011).
Denial of access
While it is clear that Canadians de-pendent on public drug plans wait longer to access new drugs than those who have private insurance, the data also show that in many cases, Cana-dians relying on public drug plans are often denied coverage altogether.
Figure 1: Difference (in days), between the first listing with a public insurance plan and the first claim with a private insurance plan for new drugs that were certified by Health
Canada in 2006, aggregated across all provinces and drug plans
Sources: Rovere and Skinner, 2011.

26 Fraser Forum September/October 2011 www.fraserinstitute.org
2004 2005 2006 2007 2008 2009
Number of drugs claimed
by at least one private
insurer (across the provinces)
Drugs claimed as a %
of NOCs
Number of drugs claimed
by at least one private
insurer (across the provinces)
Drugs claimed as a %
of NOCs
Number of drugs claimed
by at least one private insurer
(across the provinces)
Drugs claimed as a %
of NOCs
Number of drugs claimed
by at least one private
insurer (across the provinces)
Drugs claimed as a %
of NOCs
Number of drugs claimed
by at least one private insurer
(across the provinces)
Drugs claimed as a %
of NOCs
Number of drugs claimed
by at least one private
insurer (across the provinces)
Drugs claimed as a %
of NOCs
46 97.9% 40 90.9% 41 82.0% 31 73.8% 22 68.8% 37 82.2%
Total new drugs 47 44 50 42 32 45
Source: Rovere and Skinner, 2011.
Table 2: Drugs covered by at least one private insurer, as a percentage of new drugs approved by Health Canada, averaged across all provinces, as of June 9th, 2011
Source: Rovere and Skinner, 2011.
2004 2005 2006 2007 2008 2009
Number of drugs
approved
Drugs approved as a % of
NOCs
Number of drugs
approved
Drugs approved as a % of
NOCs
Number of drugs
approved
Drugs approved as a % of
NOCs
Number of drugs
approved
Drugs approved as a % of
NOCs
Number of drugs
approved
Drugs approved as a % of
NOCs
Number of drugs
approved
Drugs approved as a % of
NOCs
AB 8 17.0% 4 9.1% 12 24.0% 5 11.9% 6 18.8% 6 13.3%
BC 10 21.3% 2 4.5% 9 18.0% 7 16.7% 8 25.0% 10 22.2%
MB 9 19.1% 5 11.4% 11 22.0% 8 19.0% 6 18.8% 1 2.2%
NB 11 23.4% 12 27.3% 23 46.0% 16 38.1% 11 34.4% 4 8.9%
NL 11 23.4% 9 20.5% 18 36.0% 11 26.2% 10 31.3% 4 8.9%
NS 9 19.1% 13 29.5% 16 32.0% 9 21.4% 7 21.9% 5 11.1%
ON 8 17.0% 7 15.9% 11 22.0% 11 26.2% 7 21.9% 4 8.9%
PEI 9 19.1% 8 18.2% 13 26.0% 7 16.7% 2 6.3% 4 8.9%
QC 20 42.6% 14 31.8% 24 48.0% 22 52.4% 14 43.8% 16 35.6%
SK 13 27.7% 11 25.0% 18 36.0% 11 26.2% 10 31.3% 5 11.1%
Provincial average 23.0% 19.3% 31.0% 25.5% 25.3% 13.1%
Total new drugs 47 44 50 42 32 45
Table 1: Public reimbursement approvals, as a percentage of new drugs approved by Health Canada, by province, 2004–2009, as of June 9th, 2011
www.fraserinstitute.org Fraser Forum September/October 2011 27
Averaged across all provincial public drug programs, as of June 9th, 2011, only 23.0% of all drugs that Health Canada approved as safe and effective in 2004 had actually been approved for reimbursement (fully or partially) by the provinces; com-pared to 19.3% of new drugs certi-fied in 2005, 31.0% of new drugs cer-tified in 2006, 25.5% of new drugs certified in 2007, 25.3% of new drugs certified in 2008, and 13.1% of new drugs certified in 2009 (table 1). The coverage rate (percentage of drugs that were approved for public reim-bursement) averaged across all years was less than 23%.
In contrast, a comparison of private insurance coverage over the same period shows that private in-surers in Canada (averaged across provinces and insurers) are far more generous in terms of covering the amount of new drugs. As table 2 shows, averaged across all provinces, 97.9% of all new drugs that Health Canada approved as safe and effec-tive in 2004 were covered by at least one private insurer as of June 9th, 2011. Similarly, 90.9% of new drugs certified in 2005, 82.0% of new drugs certified in 2006, 73.8% of new drugs certified in 2007, 68.8% of new drugs certified in 2008, and 82.2% of new drugs certified in 2009 were covered by at least one private insurer (aver-aged across all provinces) as of June 9th, 2011. The coverage rate (percent-age of drugs that were approved for coverage by at least one private in-surer) averaged across all years was almost 83%.
Allow a competitive private drug insurance market to facilitate universal access for all Canadians
The data show that private drug in-surance in Canada covers new drugs sooner—and covers far more new
drugs than public drug plans. While some Canadians cannot afford to purchase private drug insurance, they should not be penalized by be-ing forced into a centrally planned public program that is bound by political decisions and budget con-straints, which ultimately restrict consumer choice. In order to achieve universal access to new drugs, re-gardless of income, all Canadians should have the ability to purchase a drug insurance plan that meets their individual needs in the private market. This could be achieved by replacing existing government drug plans with a regulated, competitive, private-sector market in which uni-versal access to catastrophic drug insurance is facilitated through means-tested subsidies for people with low incomes.1 This sensible pol-icy would restrict subsidies to only those requiring financial assistance to pay for their drugs, as oppose to age-based subsidies which are com-mon in a number of provinces.
In recent years there has been growing pressure on the federal government to create a national pharmacare program, ostensibly to improve access to new drugs. But such an approach is the opposite of what we should do. Expanding the role of government in the provision of drug insurance will certainly only increase the politicization of cover-age decisions and further stretch the already bursting budgets cur-rently facing governments. Whereas income-based subsidies will provide all Canadians2 with access to private drug insurance, and therefore offer the benefits of more generous and timely coverage of the newest pre-scription drugs. It is time for gov-ernments to get out of the business of drug insurance; governments only need to target subsidies to those who genuinely need help to pay their drug costs, and allow a competitive private sector to do what it does best: respond to consumer demand.
Notes
1 Research shows that most people spend a very small share of their income on prescription drugs. Those who have ‘catastrophic drug costs’ (high drug costs relative to their income) – should receive public subsidies. Critically, tax funded subsidies must solely be allo-cated based on need (income-based).
2 This is precisely how Switzerland and the Netherlands achieve universal health care coverage. Public subsidies are allocated to those with low-income – which are used to purchase a basic health insurance plan in the competi-tive private insurance market. .
References
Canadian Institute for Health Infor-mation [CIHI] (2010). Drug Ex-penditure in Canada, 1985 to 2010. <http://secure.cihi.ca/cihiweb/products/drug_expenditure_2010_en.pdf>, as of July 27, 2011.
International Society for Pharmaco-economics and Outcomes Research [ISPOR] (2011). Canada- Pharma-ceuticals. <http://www.ispor.org/HTARoadMaps/CanadaPharm.asp>, as of July 27, 2011.
Rovere, Mark, and Brett J. Skinner (2011). Access Delayed, Access Denied:Waiting for New Medicines in Canada. Fraser Institute. <http://www.fraserinstitute.org>, as of July 27, 2011.
Skinner, Brett J., and Mark Rovere (2011). Canada’s Medicare Bubble: Is Government Health Spending Sustainable without User-based Funding? Fraser Institute. <http://www.fraserinstitute.org>, as of July 27, 2011.

28 Fraser Forum September/October 2011 www.fraserinstitute.org
Table 1: Corporate headquarters overview
1990 2000 2010
Number of top 500
headquarters
% of top 500
Number of top 500
headquarters
% of top 500
Number of top 500
headquarters
% of top 500
Montreal 96 19.2% 92 18.4% 81 16.2%
Toronto 186 37.2% 190 38.0% 175 35.0%
Winnipeg 18 3.6% 18 3.6% 14 2.8%
Calgary 44 8.8% 50 10.0% 75 15.0%
Vancouver 45 9.0% 41 8.2% 49 9.8%
Sources: FP Magazine, 1991, 2001, 2011. Calculations by author.
alex gaiNer
Corporate headquarters
in Canada
iSto
ckp
hot
o
Which Canadian city is home to the largest num-ber of corporate headquarters for Canada’s top 500 corporations?1 How has this changed
over time?Table 1 contains data from 1990, 2000, and 2010
showing how many corporate headquarters are located
in Canada’s five main corporate centres: Montreal, To-ronto, Winnipeg, Calgary, and Vancouver.2 Toronto was overwhelmingly the dominant location for corporate headquarters in all three years examined. In 2010, 35.0% of corporate headquarters for Canada’s top 500 corpora-tions were located in Toronto. Montreal ranked second, Calgary third, Vancouver fourth, and Winnipeg last.
Is the absolute number of corporate headquarters an effective measure of corporate headquarter activity?
No. A better way to measure corporate headquarters activity is to adjust for population. Simply counting the number of corporate head offices without adjusting for the size of the city ignores the real effect that the con-centration of corporate headquarters can have on an economy. This concentration is important because of the spin-off effects associated with corporate headquar-ters. Support professionals such as lawyers, consultants, and accountants tend to establish themselves near these headquarters and create a larger professional community, a greater concentration of knowledge, and easier access to high quality services for other companies nearby.
By this measure, Calgary is by far the Canadian leader in the concentration of corporate headquarters, with 6.0 corporate head offices per 100,000 people in 2010. Calgary’s concentration is double that of Toronto, which had 3.0 corporate head offices per 100,000 people (table 2; figure 1). Montreal had 2.1 corporate head of-fices per 100,000 people. Vancouver was fourth among the cities with 2.0 corporate head offices per 100,000 people, and Winnipeg had 1.9 corporate head offices per 100,000 people.
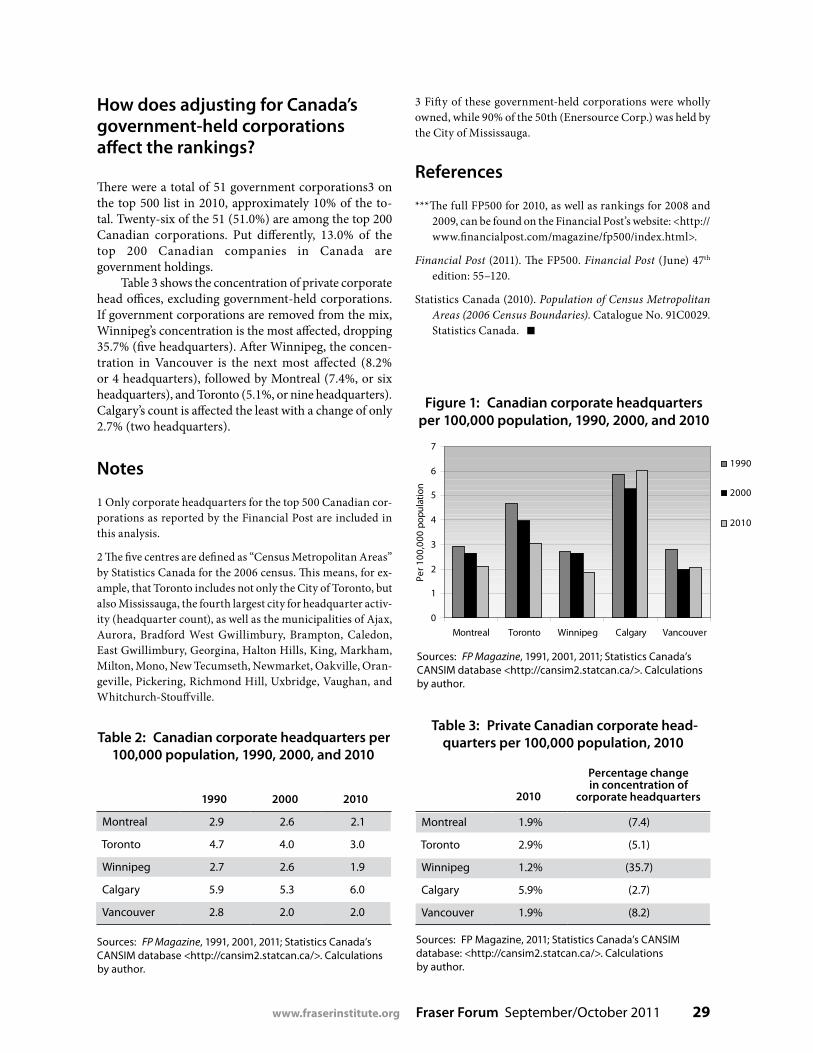
www.fraserinstitute.org Fraser Forum September/October 2011 29
Table 2: Canadian corporate headquarters per 100,000 population, 1990, 2000, and 2010
1990 2000 2010
Montreal 2.9 2.6 2.1
Toronto 4.7 4.0 3.0
Winnipeg 2.7 2.6 1.9
Calgary 5.9 5.3 6.0
Vancouver 2.8 2.0 2.0
Sources: FP Magazine, 1991, 2001, 2011; Statistics Canada’s CANSIM database <http://cansim2.statcan.ca/>. Calculations by author.
Table 3: Private Canadian corporate head-quarters per 100,000 population, 2010
2010
Percentage change in concentration of
corporate headquarters
Montreal 1.9% (7.4)
Toronto 2.9% (5.1)
Winnipeg 1.2% (35.7)
Calgary 5.9% (2.7)
Vancouver 1.9% (8.2)
Sources: FP Magazine, 2011; Statistics Canada’s CANSIM database: <http://cansim2.statcan.ca/>. Calculations by author.
How does adjusting for Canada’s government-held corporations affect the rankings?
There were a total of 51 government corporations3 on the top 500 list in 2010, approximately 10% of the to-tal. Twenty-six of the 51 (51.0%) are among the top 200 Canadian corporations. Put differently, 13.0% of the top 200 Canadian companies in Canada are government holdings.
Table 3 shows the concentration of private corporate head offices, excluding government-held corporations. If government corporations are removed from the mix, Winnipeg’s concentration is the most affected, dropping 35.7% (five headquarters). After Winnipeg, the concen-tration in Vancouver is the next most affected (8.2% or 4 headquarters), followed by Montreal (7.4%, or six headquarters), and Toronto (5.1%, or nine headquarters). Calgary’s count is affected the least with a change of only 2.7% (two headquarters).
Notes
1 Only corporate headquarters for the top 500 Canadian cor-porations as reported by the Financial Post are included in this analysis.
2 The five centres are defined as “Census Metropolitan Areas” by Statistics Canada for the 2006 census. This means, for ex-ample, that Toronto includes not only the City of Toronto, but also Mississauga, the fourth largest city for headquarter activ-ity (headquarter count), as well as the municipalities of Ajax, Aurora, Bradford West Gwillimbury, Brampton, Caledon, East Gwillimbury, Georgina, Halton Hills, King, Markham, Milton, Mono, New Tecumseth, Newmarket, Oakville, Oran-geville, Pickering, Richmond Hill, Uxbridge, Vaughan, and Whitchurch-Stouffville.
Sources: FP Magazine, 1991, 2001, 2011; Statistics Canada’s CANSIM database <http://cansim2.statcan.ca/>. Calculations by author.
Figure 1: Canadian corporate headquarters per 100,000 population, 1990, 2000, and 2010Figure 1: Corporate Headquarters by City,
1990, 2000, and 2010
0
1
2
3
4
5
6
7
Montreal Toronto Winnipeg Calgary Vancouver
Per 1
00,0
00 p
opul
atio
n
1990
2000
2010
3 Fifty of these government-held corporations were wholly owned, while 90% of the 50th (Enersource Corp.) was held by the City of Mississauga.
References
***The full FP500 for 2010, as well as rankings for 2008 and 2009, can be found on the Financial Post’s website: <http://www.financialpost.com/magazine/fp500/index.html>.
Financial Post (2011). The FP500. Financial Post (June) 47th
edition: 55–120.
Statistics Canada (2010). Population of Census Metropolitan Areas (2006 Census Boundaries). Catalogue No. 91C0029. Statistics Canada.
30 Fraser Forum September/October 2011 www.fraserinstitute.org
Overcoming regulatory obstacles to upstreampetroleum investmentgerry aNgeViNe aNd Miguel CerVaNtes
The Fraser Institute’s annual global survey of petroleum explorers and developers
measures the extent to which each of 17 factors poses a barrier to in-vestment in jurisdictions around the world. This year a total of 502 individuals with 478 companies participated in the survey, providing sufficient data to evaluate 135 juris-dictions. This article discusses how the survey data were used to evaluate the regulatory climate in provinces, states, and countries around the world, and which jurisdictions ap-pear to pose the most and least con-cern for petroleum investors because of regulatory issues. It also examines where and why the most deteriora-tion and most improvement have occurred in the regulatory climate since the first half of 2010.1
The survey process
The survey questionnaire provided a list of 146 jurisdictions that respon-dents could evaluate.2 Respondents were requested to evaluate only those jurisdictions with which they were familiar.3
For each of 17 factors judged to be important determinants of
investment decisions, respondents were asked to select one of the fol-lowing responses as best describing each jurisdiction that they chose to evaluate:1. Encourages investment2. Is not a deterrent to investment3. Is a mild deterrent to investment4. Is a strong deterrent to investment5. Would not invest due to this criterion
For each jurisdiction, scores were assigned to each factor accord-ing to the percentage of responses received that indicated that the fac-tor posed a barrier to investment, i.e., either a mild or strong deterrent, or a problem of such degree that the respondent “would not invest at all.” The greater the proportion of nega-tive responses garnered by a juris-diction for a given factor, the greater the investment barrier that the factor was seen to pose. Jurisdictions with the lowest scores were assumed to pose fewer investment barriers and, therefore, ranked higher in terms of their attractiveness for investment.
The discussion that follows is based on “Regulatory Climate In-dex” (RCI) values derived from re-sponses pertaining to 6 factors ad-dressed in the survey questionnaire
that pertain regulatory conditions.4
For each jurisdiction, higher index values point to greater barriers to development.
Where the regulatory climate is of most and least concern
Of the 135 jurisdictions ranked in the survey, 41 had RCI values great-er than 60. These jurisdictions were judged to have relatively unattractive regulatory climates (table 1).
The first 14 jurisdictions in this group have RCI values greater than 80, meaning that they have unsa-vory regulatory environments. In general, the most important reason why jurisdictions such as Venezuela, Kazakhstan, Ecuador, Iran, Russia, and the others in this group (except for the US Offshore-Pacific) have such poor RCI ratings is because of negative responses to the question on legal system fairness and trans-parency. The second most important reason is uncertainty regarding the interpretation and administration of existing regulations. The cost of regulatory compliance, labour regulations, and agreements and
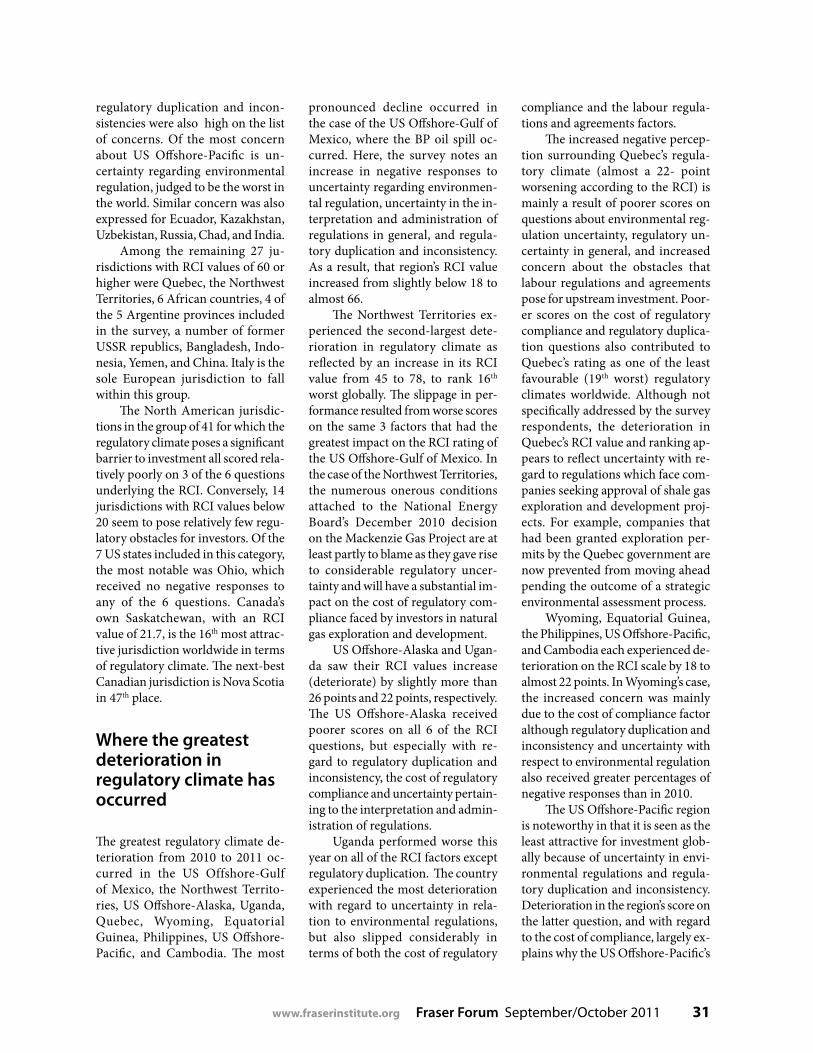
www.fraserinstitute.org Fraser Forum September/October 2011 31
regulatory duplication and incon-sistencies were also high on the list of concerns. Of the most concern about US Offshore-Pacific is un-certainty regarding environmental regulation, judged to be the worst in the world. Similar concern was also expressed for Ecuador, Kazakhstan, Uzbekistan, Russia, Chad, and India.
Among the remaining 27 ju-risdictions with RCI values of 60 or higher were Quebec, the Northwest Territories, 6 African countries, 4 of the 5 Argentine provinces included in the survey, a number of former USSR republics, Bangladesh, Indo-nesia, Yemen, and China. Italy is the sole European jurisdiction to fall within this group.
The North American jurisdic-tions in the group of 41 for which the regulatory climate poses a significant barrier to investment all scored rela-tively poorly on 3 of the 6 questions underlying the RCI. Conversely, 14 jurisdictions with RCI values below 20 seem to pose relatively few regu-latory obstacles for investors. Of the 7 US states included in this category, the most notable was Ohio, which received no negative responses to any of the 6 questions. Canada’s own Saskatchewan, with an RCI value of 21.7, is the 16th most attrac-tive jurisdiction worldwide in terms of regulatory climate. The next-best Canadian jurisdiction is Nova Scotia in 47th place.
Where the greatest deterioration in regulatory climate has occurred
The greatest regulatory climate de-terioration from 2010 to 2011 oc-curred in the US Offshore-Gulf of Mexico, the Northwest Territo-ries, US Offshore-Alaska, Uganda, Quebec, Wyoming, Equatorial Guinea, Philippines, US Offshore-Pacific, and Cambodia. The most
pronounced decline occurred in the case of the US Offshore-Gulf of Mexico, where the BP oil spill oc-curred. Here, the survey notes an increase in negative responses to uncertainty regarding environmen-tal regulation, uncertainty in the in-terpretation and administration of regulations in general, and regula-tory duplication and inconsistency. As a result, that region’s RCI value increased from slightly below 18 to almost 66.
The Northwest Territories ex-perienced the second-largest dete-rioration in regulatory climate as reflected by an increase in its RCI value from 45 to 78, to rank 16th worst globally. The slippage in per-formance resulted from worse scores on the same 3 factors that had the greatest impact on the RCI rating of the US Offshore-Gulf of Mexico. In the case of the Northwest Territories, the numerous onerous conditions attached to the National Energy Board’s December 2010 decision on the Mackenzie Gas Project are at least partly to blame as they gave rise to considerable regulatory uncer-tainty and will have a substantial im-pact on the cost of regulatory com-pliance faced by investors in natural gas exploration and development.
US Offshore-Alaska and Ugan-da saw their RCI values increase (deteriorate) by slightly more than 26 points and 22 points, respectively. The US Offshore-Alaska received poorer scores on all 6 of the RCI questions, but especially with re-gard to regulatory duplication and inconsistency, the cost of regulatory compliance and uncertainty pertain-ing to the interpretation and admin-istration of regulations.
Uganda performed worse this year on all of the RCI factors except regulatory duplication. The country experienced the most deterioration with regard to uncertainty in rela-tion to environmental regulations, but also slipped considerably in terms of both the cost of regulatory
compliance and the labour regula-tions and agreements factors.
The increased negative percep-tion surrounding Quebec’s regula-tory climate (almost a 22- point worsening according to the RCI) is mainly a result of poorer scores on questions about environmental reg-ulation uncertainty, regulatory un-certainty in general, and increased concern about the obstacles that labour regulations and agreements pose for upstream investment. Poor-er scores on the cost of regulatory compliance and regulatory duplica-tion questions also contributed to Quebec’s rating as one of the least favourable (19th worst) regulatory climates worldwide. Although not specifically addressed by the survey respondents, the deterioration in Quebec’s RCI value and ranking ap-pears to reflect uncertainty with re-gard to regulations which face com-panies seeking approval of shale gas exploration and development proj-ects. For example, companies that had been granted exploration per-mits by the Quebec government are now prevented from moving ahead pending the outcome of a strategic environmental assessment process.
Wyoming, Equatorial Guinea, the Philippines, US Offshore-Pacific, and Cambodia each experienced de-terioration on the RCI scale by 18 to almost 22 points. In Wyoming’s case, the increased concern was mainly due to the cost of compliance factor although regulatory duplication and inconsistency and uncertainty with respect to environmental regulation also received greater percentages of negative responses than in 2010.
The US Offshore-Pacific region is noteworthy in that it is seen as the least attractive for investment glob-ally because of uncertainty in envi-ronmental regulations and regula-tory duplication and inconsistency. Deterioration in the region’s score on the latter question, and with regard to the cost of compliance, largely ex-plains why the US Offshore-Pacific’s
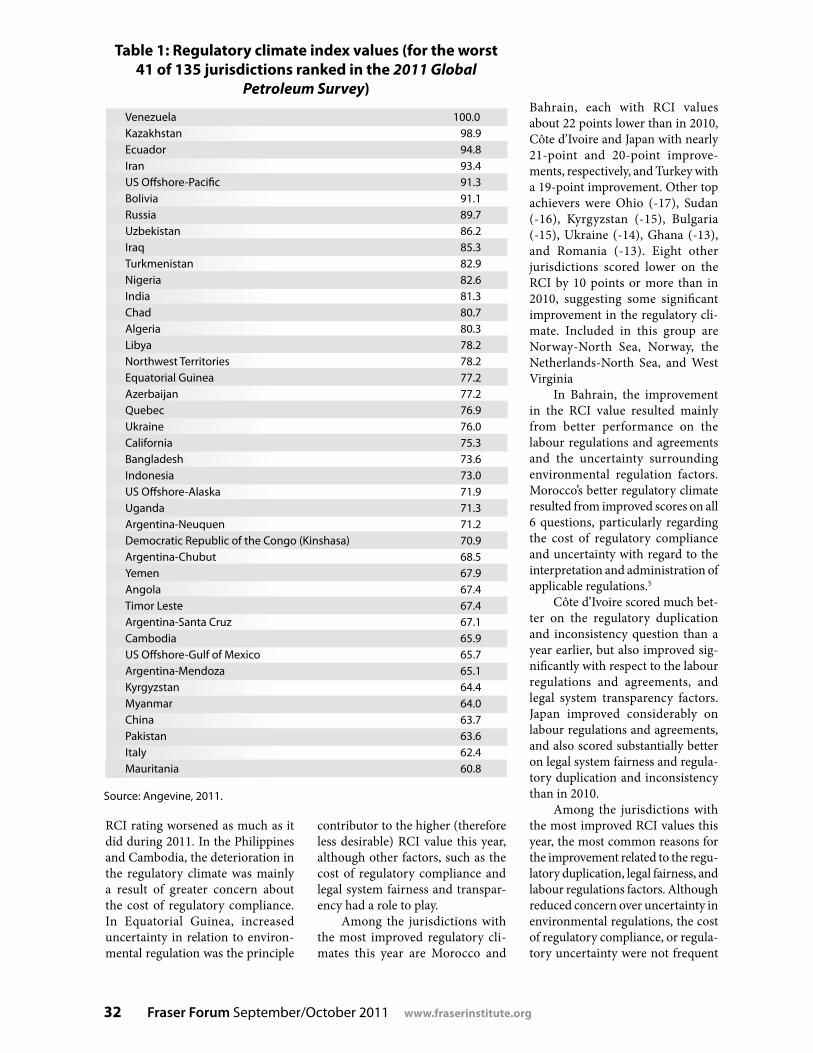
32 Fraser Forum September/October 2011 www.fraserinstitute.org
Bahrain, each with RCI values about 22 points lower than in 2010, Côte d’Ivoire and Japan with nearly 21-point and 20-point improve-ments, respectively, and Turkey with a 19-point improvement. Other top achievers were Ohio (-17), Sudan (-16), Kyrgyzstan (-15), Bulgaria (-15), Ukraine (-14), Ghana (-13), and Romania (-13). Eight other jurisdictions scored lower on the RCI by 10 points or more than in 2010, suggesting some significant improvement in the regulatory cli-mate. Included in this group are Norway-North Sea, Norway, the Netherlands-North Sea, and West Virginia
In Bahrain, the improvement in the RCI value resulted mainly from better performance on the labour regulations and agreements and the uncertainty surrounding environmental regulation factors. Morocco’s better regulatory climate resulted from improved scores on all 6 questions, particularly regarding the cost of regulatory compliance and uncertainty with regard to the interpretation and administration of applicable regulations.5
Côte d’Ivoire scored much bet-ter on the regulatory duplication and inconsistency question than a year earlier, but also improved sig-nificantly with respect to the labour regulations and agreements, and legal system transparency factors. Japan improved considerably on labour regulations and agreements, and also scored substantially better on legal system fairness and regula-tory duplication and inconsistency than in 2010.
Among the jurisdictions with the most improved RCI values this year, the most common reasons for the improvement related to the regu-latory duplication, legal fairness, and labour regulations factors. Although reduced concern over uncertainty in environmental regulations, the cost of regulatory compliance, or regula-tory uncertainty were not frequent
Table 1: Regulatory climate index values (for the worst 41 of 135 jurisdictions ranked in the 2011 Global
Petroleum Survey)
Venezuela 100.0 Kazakhstan 98.9 Ecuador 94.8 Iran 93.4 US Offshore-Pacific 91.3 Bolivia 91.1 Russia 89.7 Uzbekistan 86.2 Iraq 85.3 Turkmenistan 82.9 Nigeria 82.6 India 81.3 Chad 80.7 Algeria 80.3 Libya 78.2 Northwest Territories 78.2 Equatorial Guinea 77.2 Azerbaijan 77.2 Quebec 76.9 Ukraine 76.0 California 75.3 Bangladesh 73.6 Indonesia 73.0 US Offshore-Alaska 71.9 Uganda 71.3 Argentina-Neuquen 71.2 Democratic Republic of the Congo (Kinshasa) 70.9 Argentina-Chubut 68.5 Yemen 67.9 Angola 67.4 Timor Leste 67.4 Argentina-Santa Cruz 67.1 Cambodia 65.9 US Offshore-Gulf of Mexico 65.7 Argentina-Mendoza 65.1 Kyrgyzstan 64.4 Myanmar 64.0 China 63.7 Pakistan 63.6 Italy 62.4 Mauritania 60.8
Source: Angevine, 2011.
RCI rating worsened as much as it did during 2011. In the Philippines and Cambodia, the deterioration in the regulatory climate was mainly a result of greater concern about the cost of regulatory compliance. In Equatorial Guinea, increased uncertainty in relation to environ-mental regulation was the principle
contributor to the higher (therefore less desirable) RCI value this year, although other factors, such as the cost of regulatory compliance and legal system fairness and transpar-ency had a role to play.
Among the jurisdictions with the most improved regulatory cli-mates this year are Morocco and
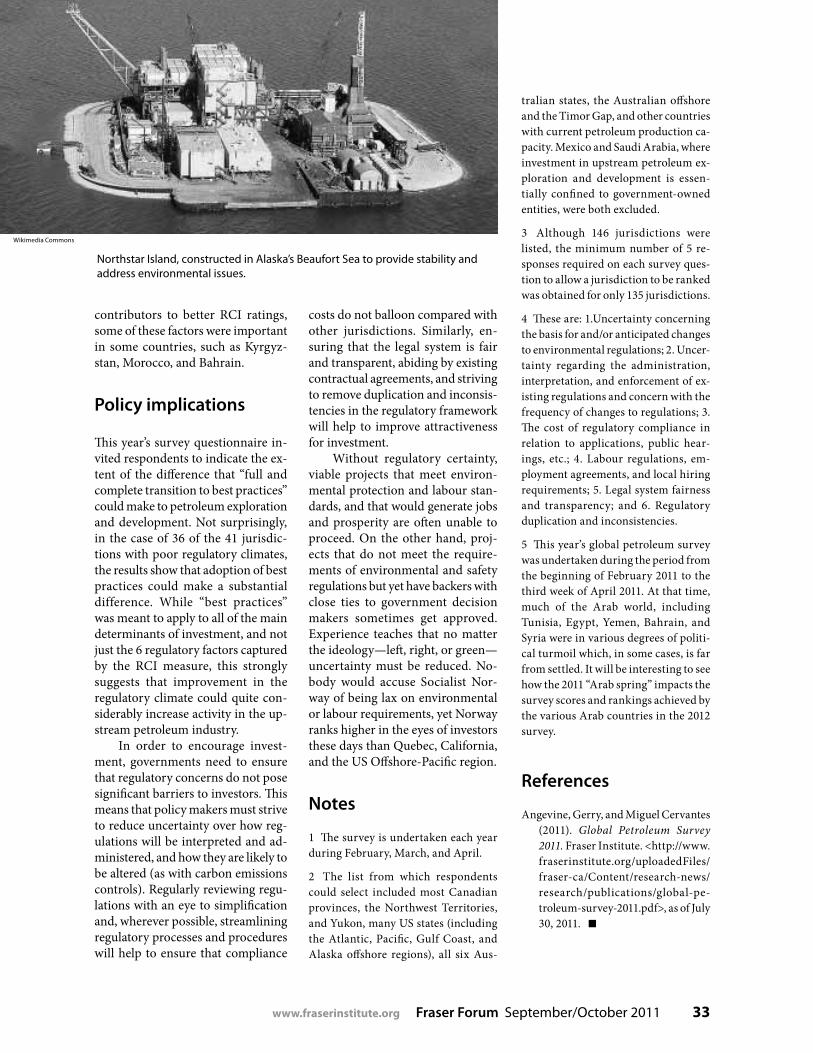
www.fraserinstitute.org Fraser Forum September/October 2011 33
contributors to better RCI ratings, some of these factors were important in some countries, such as Kyrgyz-stan, Morocco, and Bahrain.
Policy implications
This year’s survey questionnaire in-vited respondents to indicate the ex-tent of the difference that “full and complete transition to best practices” could make to petroleum exploration and development. Not surprisingly, in the case of 36 of the 41 jurisdic-tions with poor regulatory climates, the results show that adoption of best practices could make a substantial difference. While “best practices” was meant to apply to all of the main determinants of investment, and not just the 6 regulatory factors captured by the RCI measure, this strongly suggests that improvement in the regulatory climate could quite con-siderably increase activity in the up-stream petroleum industry.
In order to encourage invest-ment, governments need to ensure that regulatory concerns do not pose significant barriers to investors. This means that policy makers must strive to reduce uncertainty over how reg-ulations will be interpreted and ad-ministered, and how they are likely to be altered (as with carbon emissions controls). Regularly reviewing regu-lations with an eye to simplification and, wherever possible, streamlining regulatory processes and procedures will help to ensure that compliance
Northstar Island, constructed in Alaska’s Beaufort Sea to provide stability and address environmental issues.
costs do not balloon compared with other jurisdictions. Similarly, en-suring that the legal system is fair and transparent, abiding by existing contractual agreements, and striving to remove duplication and inconsis-tencies in the regulatory framework will help to improve attractiveness for investment.
Without regulatory certainty, viable projects that meet environ-mental protection and labour stan-dards, and that would generate jobs and prosperity are often unable to proceed. On the other hand, proj-ects that do not meet the require-ments of environmental and safety regulations but yet have backers with close ties to government decision makers sometimes get approved. Experience teaches that no matter the ideology—left, right, or green—uncertainty must be reduced. No-body would accuse Socialist Nor-way of being lax on environmental or labour requirements, yet Norway ranks higher in the eyes of investors these days than Quebec, California, and the US Offshore-Pacific region.
Notes
1 The survey is undertaken each year during February, March, and April.
2 The list from which respondents could select included most Canadian provinces, the Northwest Territories, and Yukon, many US states (including the Atlantic, Pacific, Gulf Coast, and Alaska offshore regions), all six Aus-
tralian states, the Australian offshore and the Timor Gap, and other countries with current petroleum production ca-pacity. Mexico and Saudi Arabia, where investment in upstream petroleum ex-ploration and development is essen-tially confined to government-owned entities, were both excluded.
3 Although 146 jurisdictions were listed, the minimum number of 5 re-sponses required on each survey ques-tion to allow a jurisdiction to be ranked was obtained for only 135 jurisdictions.
4 These are: 1.Uncertainty concerning the basis for and/or anticipated changes to environmental regulations; 2. Uncer-tainty regarding the administration, interpretation, and enforcement of ex-isting regulations and concern with the frequency of changes to regulations; 3. The cost of regulatory compliance in relation to applications, public hear-ings, etc.; 4. Labour regulations, em-ployment agreements, and local hiring requirements; 5. Legal system fairness and transparency; and 6. Regulatory duplication and inconsistencies.
5 This year’s global petroleum survey was undertaken during the period from the beginning of February 2011 to the third week of April 2011. At that time, much of the Arab world, including Tunisia, Egypt, Yemen, Bahrain, and Syria were in various degrees of politi-cal turmoil which, in some cases, is far from settled. It will be interesting to see how the 2011 “Arab spring” impacts the survey scores and rankings achieved by the various Arab countries in the 2012 survey.
References
Angevine, Gerry, and Miguel Cervantes (2011). Global Petroleum Survey 2011. Fraser Institute. <http://www.fraserinstitute.org/uploadedFiles/fraser-ca/Content/research-news/research/publications/global-pe-troleum-survey-2011.pdf>, as of July 30, 2011.
Wikimedia Commons
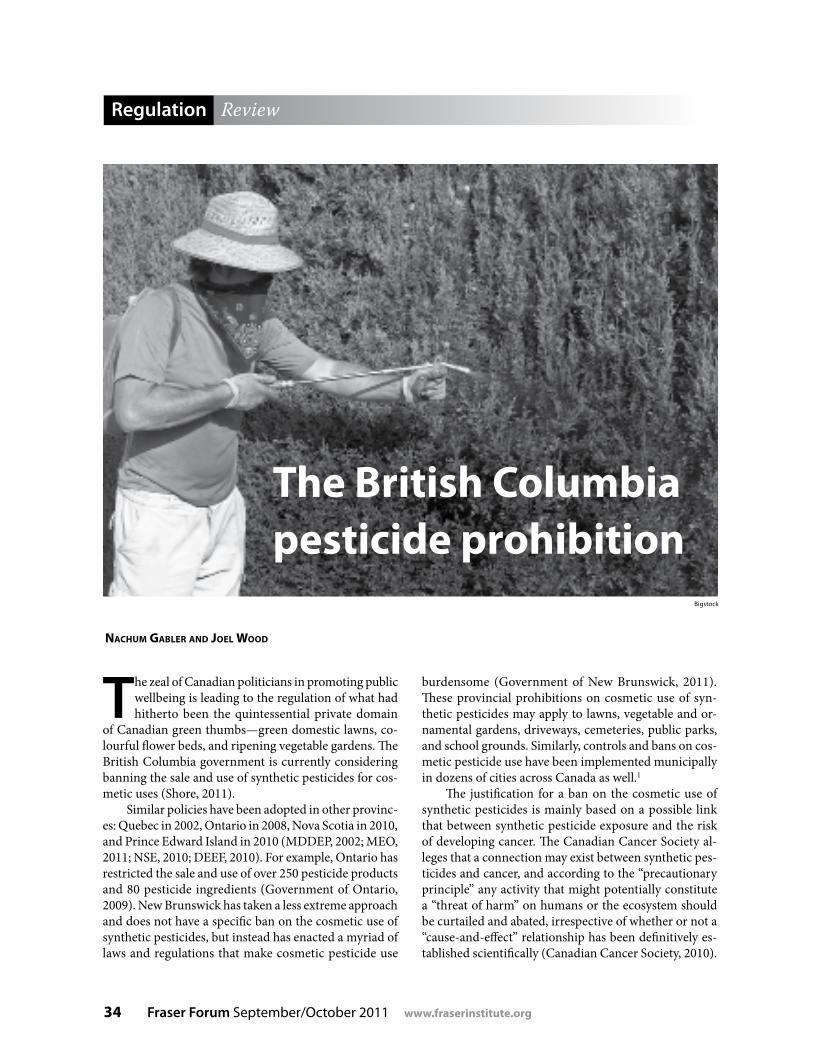
34 Fraser Forum September/October 2011 www.fraserinstitute.org
NaChuM gabler aNd Joel Wood
Regulation Review
The British Columbia pesticide prohibition
The zeal of Canadian politicians in promoting public wellbeing is leading to the regulation of what had hitherto been the quintessential private domain
of Canadian green thumbs—green domestic lawns, co-lourful flower beds, and ripening vegetable gardens. The British Columbia government is currently considering banning the sale and use of synthetic pesticides for cos-metic uses (Shore, 2011).
Similar policies have been adopted in other provinc-es: Quebec in 2002, Ontario in 2008, Nova Scotia in 2010, and Prince Edward Island in 2010 (MDDEP, 2002; MEO, 2011; NSE, 2010; DEEF, 2010). For example, Ontario has restricted the sale and use of over 250 pesticide products and 80 pesticide ingredients (Government of Ontario, 2009). New Brunswick has taken a less extreme approach and does not have a specific ban on the cosmetic use of synthetic pesticides, but instead has enacted a myriad of laws and regulations that make cosmetic pesticide use
burdensome (Government of New Brunswick, 2011). These provincial prohibitions on cosmetic use of syn-thetic pesticides may apply to lawns, vegetable and or-namental gardens, driveways, cemeteries, public parks, and school grounds. Similarly, controls and bans on cos-metic pesticide use have been implemented municipally in dozens of cities across Canada as well.1
The justification for a ban on the cosmetic use of synthetic pesticides is mainly based on a possible link that between synthetic pesticide exposure and the risk of developing cancer. The Canadian Cancer Society al-leges that a connection may exist between synthetic pes-ticides and cancer, and according to the “precautionary principle” any activity that might potentially constitute a “threat of harm” on humans or the ecosystem should be curtailed and abated, irrespective of whether or not a “cause-and-effect” relationship has been definitively es-tablished scientifically (Canadian Cancer Society, 2010).
Bigstock
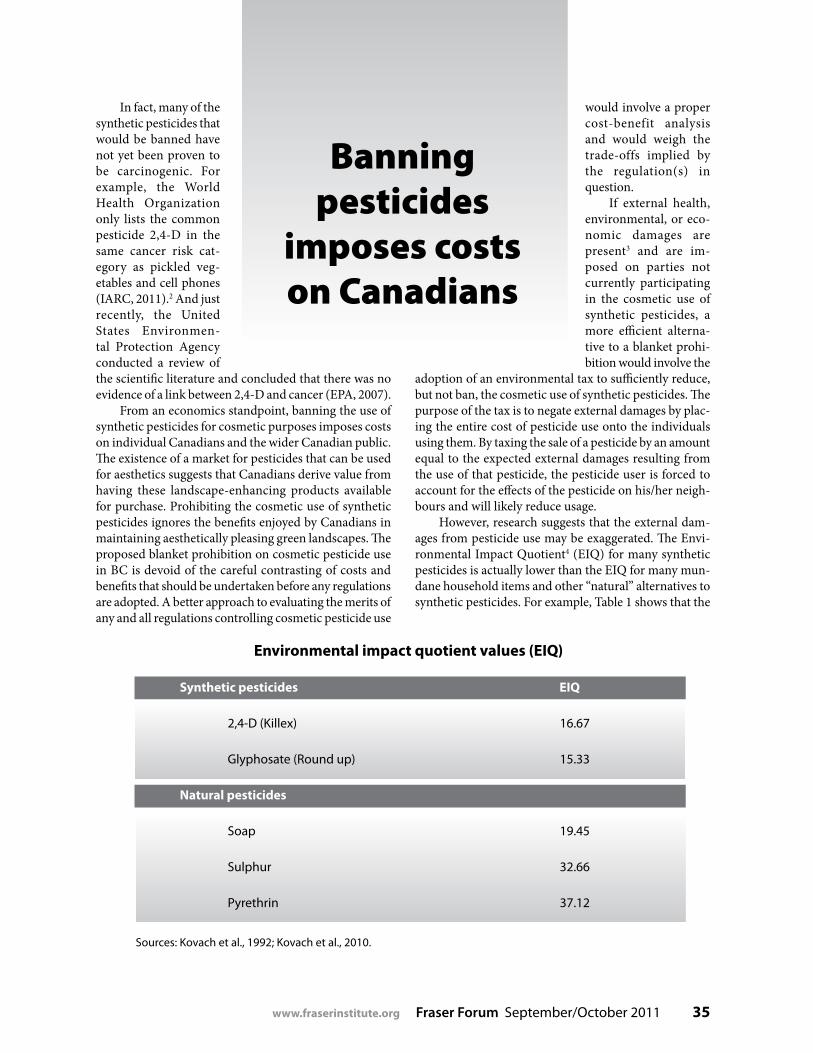
www.fraserinstitute.org Fraser Forum September/October 2011 35
In fact, many of the synthetic pesticides that would be banned have not yet been proven to be carcinogenic. For example, the World Health Organization only lists the common pesticide 2,4-D in the same cancer risk cat-egory as pickled veg-etables and cell phones (IARC, 2011).2 And just recently, the United States Environmen-tal Protection Agency conducted a review of the scientific literature and concluded that there was no evidence of a link between 2,4-D and cancer (EPA, 2007).
From an economics standpoint, banning the use of synthetic pesticides for cosmetic purposes imposes costs on individual Canadians and the wider Canadian public. The existence of a market for pesticides that can be used for aesthetics suggests that Canadians derive value from having these landscape-enhancing products available for purchase. Prohibiting the cosmetic use of synthetic pesticides ignores the benefits enjoyed by Canadians in maintaining aesthetically pleasing green landscapes. The proposed blanket prohibition on cosmetic pesticide use in BC is devoid of the careful contrasting of costs and benefits that should be undertaken before any regulations are adopted. A better approach to evaluating the merits of any and all regulations controlling cosmetic pesticide use
Environmental impact quotient values (EIQ)
Synthetic pesticides EIQ
2,4-D (Killex) 16.67
Glyphosate (Round up) 15.33
Natural pesticides
Soap 19.45
Sulphur 32.66
Pyrethrin 37.12
would involve a proper cost-benefit analysis and would weigh the trade-offs implied by the regulation(s) in question.
If external health, environmental, or eco-nomic damages are present3 and are im-posed on parties not currently participating in the cosmetic use of synthetic pesticides, a more efficient alterna-tive to a blanket prohi-bition would involve the
adoption of an environmental tax to sufficiently reduce, but not ban, the cosmetic use of synthetic pesticides. The purpose of the tax is to negate external damages by plac-ing the entire cost of pesticide use onto the individuals using them. By taxing the sale of a pesticide by an amount equal to the expected external damages resulting from the use of that pesticide, the pesticide user is forced to account for the effects of the pesticide on his/her neigh-bours and will likely reduce usage.
However, research suggests that the external dam-ages from pesticide use may be exaggerated. The Envi-ronmental Impact Quotient4 (EIQ) for many synthetic pesticides is actually lower than the EIQ for many mun-dane household items and other “natural” alternatives to synthetic pesticides. For example, Table 1 shows that the
Sources: Kovach et al., 1992; Kovach et al., 2010.
Banning pesticides
imposes costs on Canadians

36 Fraser Forum September/October 2011 www.fraserinstitute.org
EIQ for both soap and sulphur are higher than the EIQ for the common pesticide ingredient 2,4-D.
Either a blanket ban or an environmental tax will en-courage individuals to substitute natural alternatives that can be potentially more harmful. Consider the recent case of a Victoria couple who set their own home ablaze while trying to eradicate their weed problem with a specialized blow torch, which they did because artificial pesticide use is banned in Victoria (Clarke, 2011). Though this case is anecdotal, it lends credibility to the assertion that using public policy to subvert market forces and regulate the availability of certain commodities that might potentially pose some kind of a risk is likely to give birth to other risks. These other risks arise from the sometimes clever, sometimes careless, ways that Canadians adapt to altered incentives resulting from regulation.
Notes
1 At the federal level, Health Canada is the main agency re-sponsible for devising and enforcing regulations and guide-lines that govern pesticide availability, distribution, and use in Canada. Those synthetic pesticides being banned for cosmetic use at the municipal and provincial levels are deemed safe to use by Health Canada.
2 2,4-D is included in the classification of Chlorophenoxy Herbicides in IARC (2011).
3 External damages are incurred by individuals from the use of pesticides by other individuals (e.g., effects on neighbours from your own pesticide use).
4 Developed by scientists at Cornell University, the Envi-ronmental Impact Quotient measures the relative impact on humans and the environment of commonly used synthetic and natural pesticides. For more information see Kovach et al. (1992) and Kovach et al. (2010).
References
Canadian Cancer Society (2010). Our Position on the Cosmetic Use of Pesticides <http://www.cancer.ca/Canada-wide/Pre-vention/Cancer%20risk%20around%20you/Pesticides/Our%20position%20on%20cosmetic%20use%20of%20pesticides.aspx?sc_lang=en>, as of July 26, 2011.
Clarke, Brennan (2011, June 7). B.C. Couple’s Eco-Friendly War On Weeds Goes Up In Smoke. Globe and Mail: A7.
Department of Energy, Environment and Forestry [DEEF] (2010). Restrictions on Lawn Pesticides. Government of
Regulation Review
Prince Edward Island. <http://www.gov.pe.ca/envengfor/index.php3?number=1030236&lang=E>, as of July 26, 2011.
Environmental Protection Agency [EPA] (2007). 2,4-D, 2,4-DP, and 2,4-DB; Decision Not to Initiate Special Review. Government of the United States. <http://www.epa.gov/fedrgstr/EPA-PEST/2007/August/Day-08/p15109.htm>, as of August 22, 2011.
Government of New Brunswick (2011). Environment: Man-aging Pesticides and their applications in New Brunswick <http://www.gnb.ca/0009/0369/0002/0001-e.asp>, as of July 26, 2011.
Government of Ontario (2009). News Release: Greening On-tario’s Lawns And Gardens. <http://www.news.ontario.ca/ene/en/2009/04/greening-ontarios-lawns-and-gardens.html>, as of July 26, 2011.
International Agency for Research on Cancer [IARC] (2011).Agents Classified by the IARC monographs, Volumes 1-102. World Health Organization. <http://monographs.iarc.fr/ENG/Classification/ClassificationsAlphaOrder.pdf>, as of August 22, 2011.
Kovach, J., C. Petzoldt, J. Degnil, and J. Tette (1992). A Method To Measure The Environmental Impact Of Pesticides. New York’s Food and Life Sciences Bulletin 139.<http://ecom-mons.library.cornell.edu/bitstream/1813/5203/1/FLS-139.pdf>, as of July 11, 2011.
Kovach, J., C. Petzoldt, J. Degni, and J. Tette (2010). EIQ Values 2010. Cornell University.<http://www.nysipm.cornell.edu/publications/eiq/files/EIQ_values_2010.xls>, as of July 11, 2011.
Ministere Developpement durable, Environment et Parcs [MDDEP] (2002). The Pesticides Management Code. Gov-ernment of Quebec. <http://www.mddep.gouv.qc.ca/pes-ticides/permis-en/code-gestion-en/index.htm>, as of July 26, 2011.
Ministry of the Environment, Ontario [MEO] (2011). Pesti-cides. <http://www.ene.gov.on.ca/environment/en/cat-egory/pesticides/index.htm>, as of July 26, 2011.
Nova Scotia Environment [NSE] (2010). Environment: Lawns and Ornamental Gardens - Non-essential Pesticides. Gov-ernment of Nova Scotia. <http://www.gov.ns.ca/nse/pests/non-essential.pesticides.asp>, as of July 26, 2011.
Shore, Randy (2011, July 6). Province Eyes Ban on Use of Cos-metic Pesticides at Home. Vancouver Sun. <http://www.vancouversun.com/health/Province+eyes+cosmetic+pesticides+home/5056658/story.html>, as of July 26, 2011.

www.fraserinstitute.org Fraser Forum September/October 2011 37
For information write: [email protected] or call: 416.363.6575 ext. 578
Thank you to our media partner:
Behind the Spin FRASER
Is government-run, tax-payer financed education the cornerstone of democracy? Thursday, September 22nd, 2011 Reception 6:00 pm $69
Private Dinner 8:30 pm $200(optional)
Annie Kidder and Peter Cowley
ONE KING WEST, Toronto
Wednesday, October 26th, 2011The FIFTH Grill, Toronto
Thank you to our series sponsors:
Developments in Russia: What it means for us—energy, global stability, and economic impact in fragile times
Reception 6:00 pm $69Private Dinner 8:30 pm $200(optional)
Behind the Spin FRASER
Andrei Illarionov

38 Fraser Forum September/October 2011 www.fraserinstitute.org