Embed Size (px)
Citation preview

ization
Massive
2016
Irrigation Efficiency and the Nile Delta Water Balance
François Molle, Ibrahim Gaafar, Doaa Ezzat El-Agha and
Edwin Rap
Water and salt management in the Nile Delta: Report No.9

2
3
Irrigation Efficiency and the Nile Delta Water Balance
François Molle, Ibrahim Gaafar, Doaa Ezzat El-Agha, Edwin Rap
December 2016
4
TABLE OF CONTENTS
1 Introduction ............................................................................................................................... 7
2 Inflow to the Delta ..................................................................................................................... 8
2.1 Rainfall ............................................................................................................................... 8
2.2 Nile River ........................................................................................................................... 8
3 Drainage water reuse ................................................................................................................. 9
3.1 Official water reuse ........................................................................................................... 9
3.2 Informal drainage water reuse ....................................................................................... 12
4 Groundwater use and balance .................................................................................................. 14
4.1 Aquifer recharge ............................................................................................................. 14
4.2 Aquifer discharge ............................................................................................................ 14
4.2.1 Outflow to lateral aquifers .................................................................................................. 15
4.2.2 Outflow to waterways and evapotranspiration .................................................................. 15
4.2.3 Outflow to the sea ............................................................................................................... 15
4.2.4 Abstraction by pumping ...................................................................................................... 17
5 Outflow by evaporation and evapotranspiration ...................................................................... 19
5.1 Evaporation from water bodies ...................................................................................... 19
5.2 Evaporation through domestic and industrial use .......................................................... 19
5.3 Plot evapotranspiration (irrigated agriculture) ............................................................... 19
5.4 Pond evaporation (aquaculture) ..................................................................................... 21
6 Outflow to the sea ................................................................................................................... 22
6.1 Outflow through Nile River branches ............................................................................. 22
6.2 Outflow of drainage water .............................................................................................. 22
7 Aspects of the salt balance ....................................................................................................... 25
8 Water balance of the Delta ...................................................................................................... 29
9 Discussion ................................................................................................................................ 31
10 Conclusions .............................................................................................................................. 37
11 Appendices .............................................................................................................................. 40
11.1 Appendix 1: Examples of diffuse agricultural expansion ................................................ 40
11.2 Map showing the spatial distribution of annual ET in the Nile delta and fringes........... 47
12 References ............................................................................................................................... 48
13 Reports by IWMI/WMRI ........................................................................................................... 54
5
LIST OF FIGURES
Figure 1. Main terms of the water balance in the Nile Delta ........................................................... 8
Figure 2. Patterns of official drainage reuse ................................................................................. 10
Figure 3. Patterns of official and unofficial drainage reuse ........................................................... 10
Figure 4. Total drainage water reuse Q (Bm3) and average salinity (TDS) .................................... 11
Figure 5. Water reuse from drains in summer of 2014 .................................................................. 13
Figure 6. Salt load discharged at key pumping stations ................................................................. 16
Figure 8. Lateral recharge by groundwater flows; Historical movement of the 1 g/l line in groundwater salinity ............................................................................................................... 17
Figure 9. Expansion of groundwater-based irrigation in the west Delta ....................................... 17
Figure 10. Well density in an area north-east of Tanta ................................................................. 19
Figure 7. Main drainage pump stations, showing annual volumes pumped ................................. 23
Figure 11. Drainage flow to the sea. .............................................................................................. 23
Figure 12. Fluctuation of water levels and salinity upstream and downstream of the pump station in Main Drain 7 ....................................................................................................................... 24
Figure 13. Water salinity in drains – summer 2014 (in μmhos) ..................................................... 26
Figure 14. Areas with drainage water salinity > 2 μmhos . ............................................................ 28
Figure 15. Tentative average water balance of the Nile Delta ....................................................... 30
Figure 16. Relationship between releases from HAD and outflow in the Nile Delta ..................... 31
Figure 17. Evolution of the rice acreage in the Nile Delta ............................................................. 32
Figure 18. Growth in agricultural area .......................................................................................... 33
Figure 19. Tentative zoning of the central Delta ............................................................................ 37
6
LIST OF ACRONYMS
AMSL Above mean sea level
APRP Agricultural Policy Reform Program
Bm3 Billion cubic meters
f/fed feddan (0.42 hectare)
GDP Gross Domestic Product
ha hectares
HAD High Aswan Dam
IIP Irrigation Improvement Project
IIIMP Integrated Irrigation Improvement and Management Project
IRG International Resources Group
IWMD Integrated Water Management District
IWMI International Water Management Institute
m meters
MALR Ministry of Agriculture and Land Reform
M&I Municipal and Industrial water
Mg/l miligram/liter
mm millimetres
Mha Million hectares
Mm3 Million cubic meters
µmhos micromhos (unit of electric conductivity)
MWRI Ministry of Water Resources and Irrigation
PS Pumping Station
TDS Total Dissolved Solids
Y year
W10 Pilot area in Meet Yazid, which tested mesqa-level and on-farm improvements
WMRI Water Management Research Institute
ACKNOWLEDGEMENTS
The authors want to thank Safwat Abdel-Dayem and Robert Smit for valuable comments made on earlier versions of this report.
7
1 Introduction
The Nile Delta is the terminal part of a 3.17 million km2 wide river basin that spans 11 countries before joining the Mediterranean Sea in Egypt. Nile waters are diverted to irrigate 5.36 million hectares (Mha) of land basin-wide, of which 3.4 Mha are to be found in Egypt (FAO, 2011) and around 2.27 Mha in the Nile Delta proper (MALR, 2011). In Egypt 55% of the population are dependent on the agricultural sector for their livelihood, a sector that accounts for about 15% of a Gross Domestic Product (GDP) of US$232 billion, and close to one-third of total employment (FAO, 2000).
A dense network of waterways dissects the Nile Delta, including 40,000 km of canals that branch off the Nile River and convey water to over 2 million farmers across several nested geographical scales and institutional levels (van Achthoven et al., 2004). Intermingled with these conveyance canals are 18,000 km of drains, where water is partially both reused by farmers and pumped back to higher-level delivery canals, and eventually conveyed to coastal lakes and the sea. As agriculture is the major user of water in Egypt, accounting for 85% of national demand, the question of irrigation-water-use efficiency over a range of scales (i.e. from on-farm to basin) is key to satisfying growing non-agricultural needs and possibly to expanding agriculture to provide livelihood opportunities for Egypt's rural population.
Increasing the efficiency and equity of water use and management at all levels and also increasing agricultural productivity while conserving the resource base are the most salient objectives of both the National Water Resources Plan 2017 (MWRI, 2005) and the Government of Egypt's Strategy for Sustainable Agricultural Development 2030 (ARDC, 2009). Any discussion of the potential for increasing efficiency and how to achieve this is eventually linked to the question of the overall water availability. In other words, this starts with understanding how much water enters the Nile Delta, how it is then distributed, how much is drained to the sea, and whether this amount can be reduced to free up water for other consumptive uses, including more agriculture.
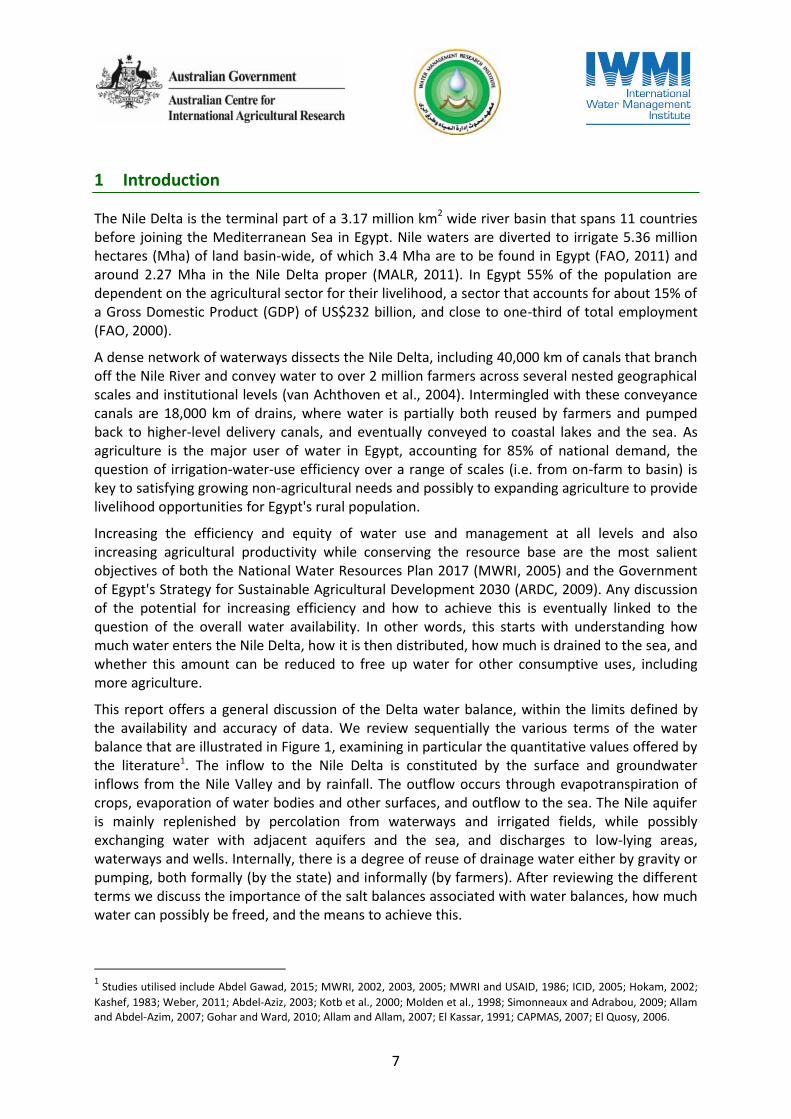
This report offers a general discussion of the Delta water balance, within the limits defined by the availability and accuracy of data. We review sequentially the various terms of the water balance that are illustrated in Figure 1, examining in particular the quantitative values offered by the literature1. The inflow to the Nile Delta is constituted by the surface and groundwater inflows from the Nile Valley and by rainfall. The outflow occurs through evapotranspiration of crops, evaporation of water bodies and other surfaces, and outflow to the sea. The Nile aquifer is mainly replenished by percolation from waterways and irrigated fields, while possibly exchanging water with adjacent aquifers and the sea, and discharges to low-lying areas, waterways and wells. Internally, there is a degree of reuse of drainage water either by gravity or pumping, both formally (by the state) and informally (by farmers). After reviewing the different terms we discuss the importance of the salt balances associated with water balances, how much water can possibly be freed, and the means to achieve this.
1 Studies utilised include Abdel Gawad, 2015; MWRI, 2002, 2003, 2005; MWRI and USAID, 1986; ICID, 2005; Hokam, 2002;
Kashef, 1983; Weber, 2011; Abdel-Aziz, 2003; Kotb et al., 2000; Molden et al., 1998; Simonneaux and Adrabou, 2009; Allam and Abdel-Azim, 2007; Gohar and Ward, 2010; Allam and Allam, 2007; El Kassar, 1991; CAPMAS, 2007; El Quosy, 2006.
8
Figure 1. Main terms of the water balance in the Nile Delta
2 Inflow to the Delta
2.1 Rainfall
Rainfall varies from 250 mm on the north-western coast to 50 mm in Cairo. Its contribution to the Delta water balance is taken by IRG (1998) to be 0.8 billion cubic meters (Bm3). Values appearing in the literature vary from 0.5 to 1.3 Bm3 for the whole Nile Delta and Valley system. We rely here on an average rounded-up value of 1 Bm3.
2.2 Nile River
The quantity of water that reaches the Delta depends on how much has been released from the High Aswan Dam (HAD) and how much has been consumed for human and agricultural purposes along the Nile Valley. This second term varies with cropping patterns but is relatively stable since all return flows end up back in the river (with the exception of those in the Fayoum, which end up in a sink – the Qaraoun Lake). Releases from HAD depend on the run-off received by the dam, but its high capacity has in general allowed managers to even out variations, and releases are estimated to be around 57 Bm3/y. This is slightly more than the official quota of 55.5 Bm3, partly because Sudan is not taking its full share and partly due to favorable hydrological conditions in the late 2000s. Data on the total inflow to the delta for the period 2008-2012 indicate values between 38.3 and 47.4 Bm3, representing a substantial variation of over 9 Bm3 between 2008 and 2010 (DRI, 2013; see appendix 1). We rely here on an average inflow of 42 Bm3, keeping in mind that a variation of ± 10% is possible, if not common.
Main reuse (official)
Secondary reuse (off.)
Farm level reuse
Groundwater
ET agriculture Evapo non-ag
Inflow from valley
Outflow to fringes
Seawater/freshwater
displacement
Sea
Rainfall
Inflowpast Cairo
Evapo aquacult.

9
3 Drainage water reuse
Drainage water from irrigated fields is re-injected into the distribution system at different locations in the Nile Delta. This reuse substantially increases the overall efficiency of the Delta water use. However, it is a process that merely facilitates water distribution across a long, ramified and complex network. Reuse adds water locally, and is therefore very important for local managers, but it does not add water to the Delta per se and therefore does not alter the overall macro-level water balance. We nevertheless describe the various means through which water is reused in the Nile Delta, since it is relevant to the salt balance of the Delta.
3.1 Official water reuse
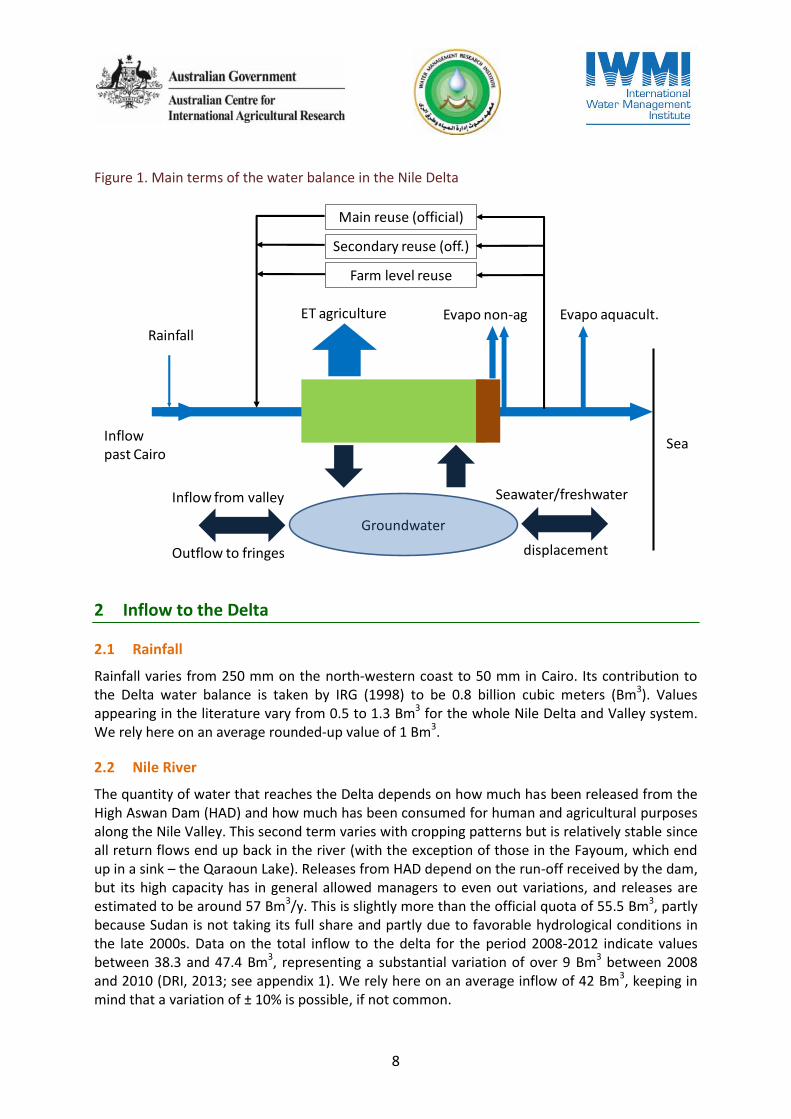
Drainage water reuse is a constitutive feature of the Nile Delta. The upper central part of the Delta, for example, is able to drain back into the Rosetta branch, from which drainage water mixes with Nile water and is further distributed to downstream areas (Area 1, in Figure 2). This reuse of drainage water by gravity is estimated by DRI at around 22 Mm3 annually, which is probably largely underestimated.2
The Ministry of Water Resources and Irrigation (MWRI) has long been constructing pump stations which abstract water from main drains at locations where they cross or come close to main canals and even branches of the Nile. Drainage water is therefore lifted and re-injected into the distribution system. Unfortunately, this system has been challenged by the degraded water quality in many drains, which does not always allow it to be re-injected into canals, especially when these convey water that is used downstream for domestic purposes. This is the case, for example, on the main drain leading to the Edku Lake (Area 2, in Figure 2) and on the Omoum drain (Area 3, in Figure 2), where several pump stations to divert drainage water to nearby New Lands (in Nubaria) were installed but never used, as well as along the Ismailia canal (Area 4, in Figure 2), where pumping in El-Mahsama had to be discontinued in 1994 due to poor water quality (van Achthoven et al., 2004). By 2005 (APP, 2005) only half of the 29 reuse pump stations that had been installed were functioning well or with only minor problems (4 had been stopped and 3 built but never used due to poor water quality).
IRG et al. (1998) provided a detailed analysis of the potential of reuse, taking into consideration the constraints of salinity and pollution. They identified potential reuse at 8.1 Bm3, if all waters under 1.5 g/l are diverted, but this figure should be revised since the construction of new pumping stations. In any case, reuse (6-7 Bm3) has increased since this study thanks to the reuse of water in the Kalapsho project (central Delta) and around 1.5 Bm3 mixed into the Salam canal. On account of the underestimated return flow by gravity, we assess here main official reuse at 8 Bm3. Pollution remains the main constraint to drainage water reuse.
2 If we consider the command area drained by the Tila and Sabal drains, an inflow based on delta per feddan averages (18
m3/day) and an efficiency of 50%, we should have a value of roughly 0.92 Bm
3. Since the outflow occurs by gravity with very
limited head it is virtually impossible to estimate through hydraulic formulas. Our estimate seems therefore more reasonable than the 0.22 Bm3 value given by DRI for 2011-12.
10
Figure 2. Patterns of official drainage reuse (El-Sayed, 2015)
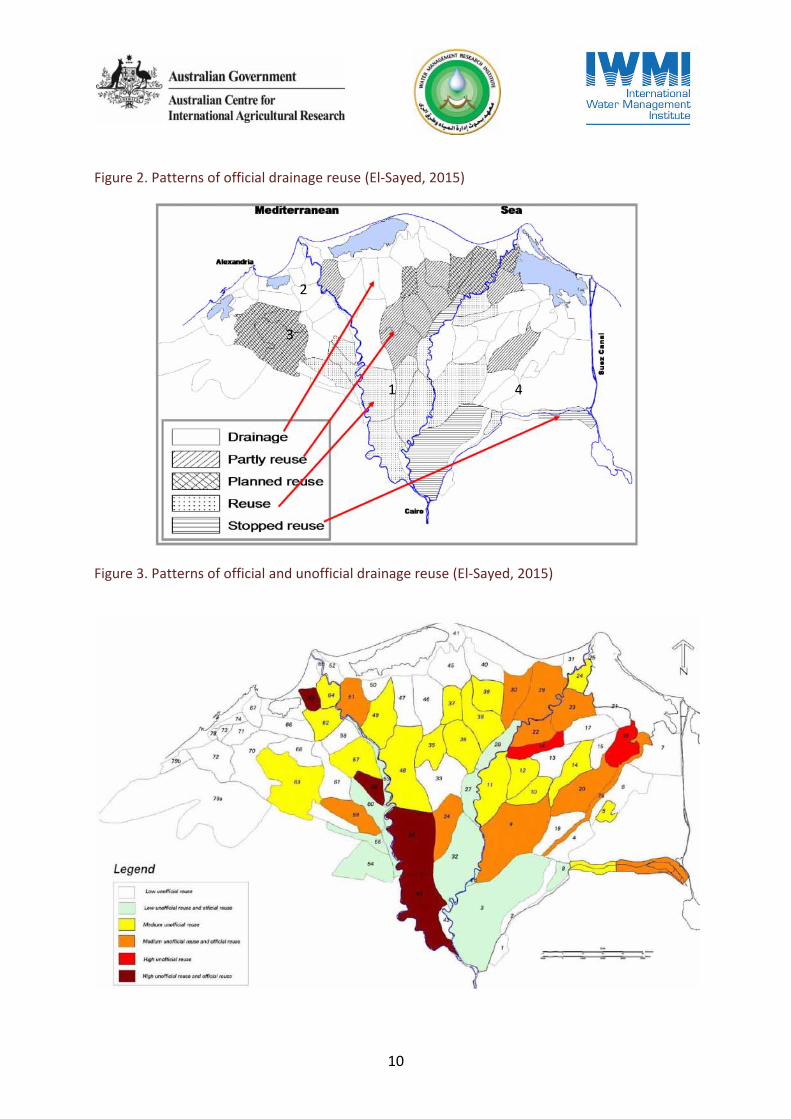
Figure 3. Patterns of official and unofficial drainage reuse (El-Sayed, 2015)
2
1
3
4
11
As a result, the idea of reuse has been extended to secondary drains which, with possible exceptions when these are collecting wastewater from nearby industries or a medium-sized city, still have reasonably good water quality. This so-called intermediate reuse has been extensively developed in the northern part of the Delta in recent years, often in response to local water shortages and public complaints (IWMI-WMRI report 1, 2013). JICA and GIZ, for example, have provided financial support for such stations, which are not always well inventoried. In the lower Meet Yazid canal command area, for example, there are as many as 25 pump stations (many of them very recent) with a combined pumping capacity equivalent to roughly 25% of the discharge in the main irrigation canal3 (Figure 5) (IWMI and WMRI, 2013). This is happening in an area reported to have no official reuse (Figure 3), which indicates a need to update information about the current situation.
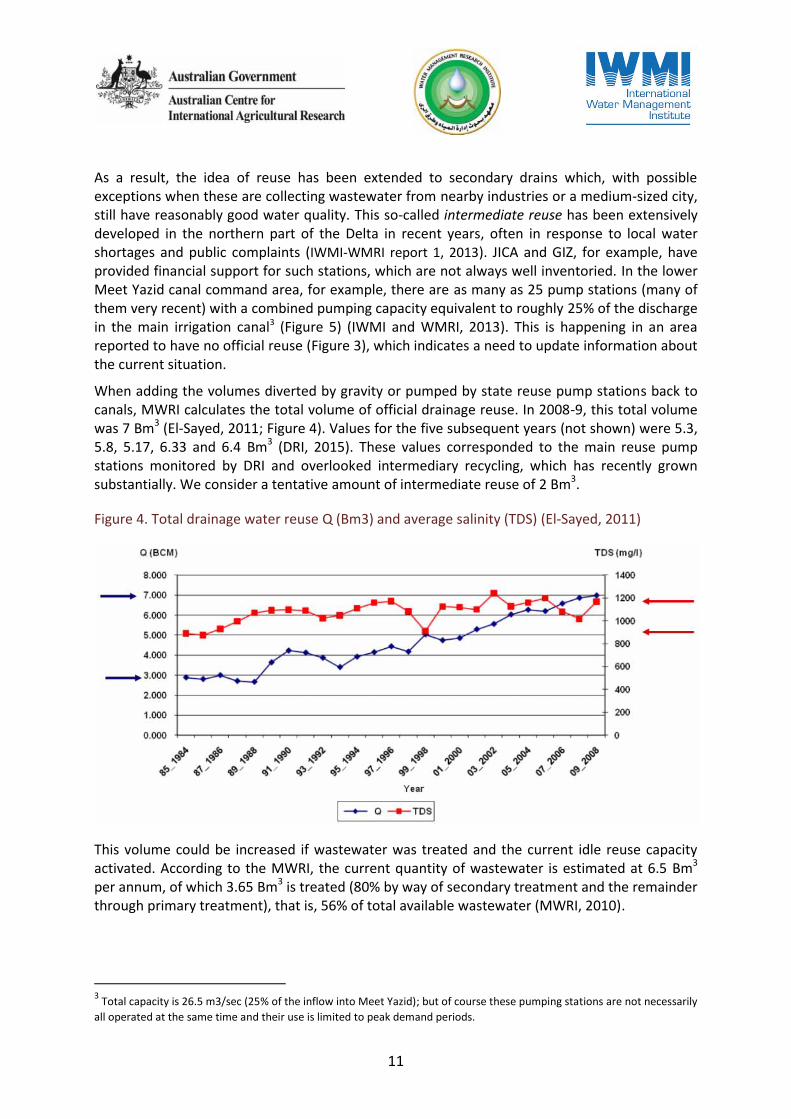
When adding the volumes diverted by gravity or pumped by state reuse pump stations back to canals, MWRI calculates the total volume of official drainage reuse. In 2008-9, this total volume was 7 Bm3 (El-Sayed, 2011; Figure 4). Values for the five subsequent years (not shown) were 5.3, 5.8, 5.17, 6.33 and 6.4 Bm3 (DRI, 2015). These values corresponded to the main reuse pump stations monitored by DRI and overlooked intermediary recycling, which has recently grown substantially. We consider a tentative amount of intermediate reuse of 2 Bm3.
Figure 4. Total drainage water reuse Q (Bm3) and average salinity (TDS) (El-Sayed, 2011)
This volume could be increased if wastewater was treated and the current idle reuse capacity activated. According to the MWRI, the current quantity of wastewater is estimated at 6.5 Bm3 per annum, of which 3.65 Bm3 is treated (80% by way of secondary treatment and the remainder through primary treatment), that is, 56% of total available wastewater (MWRI, 2010).
3 Total capacity is 26.5 m3/sec (25% of the inflow into Meet Yazid); but of course these pumping stations are not necessarily
all operated at the same time and their use is limited to peak demand periods.
12
3.2 Informal drainage water reuse
Like the government, individual or groups of farmers have long identified and implemented the idea of sourcing water from nearby drains. As with any water-short large-scale irrigation system globally, farmers have been pushed to resort to conjunctive use (Molle et al., 2010; IWMI-WMRI report 1, 2013; RISE, 2013).
According to Ritzema (2009), this 'unofficial' reuse was estimated in the 2000s to be between 2.8 Bm3 and 4.4 Bm3 per year. Although officially prohibited by the state it is tolerated as a response to the government’s failure to supply adequate water for agriculture. Thirty years ago both the official and unofficial reuse were already believed to cover around 15% of the crop water requirements (El Quosy, 1989). Van Achthoven et al. (2004) cite a source establishing informal reuse of drainage water at between 3 and 4 Mm3 — almost as much as the official reuse (Bazaraa, 2002). Whatever the accuracy of these figures they are not updated and do not account for a possible increase in informal drainage water reuse over recent years.
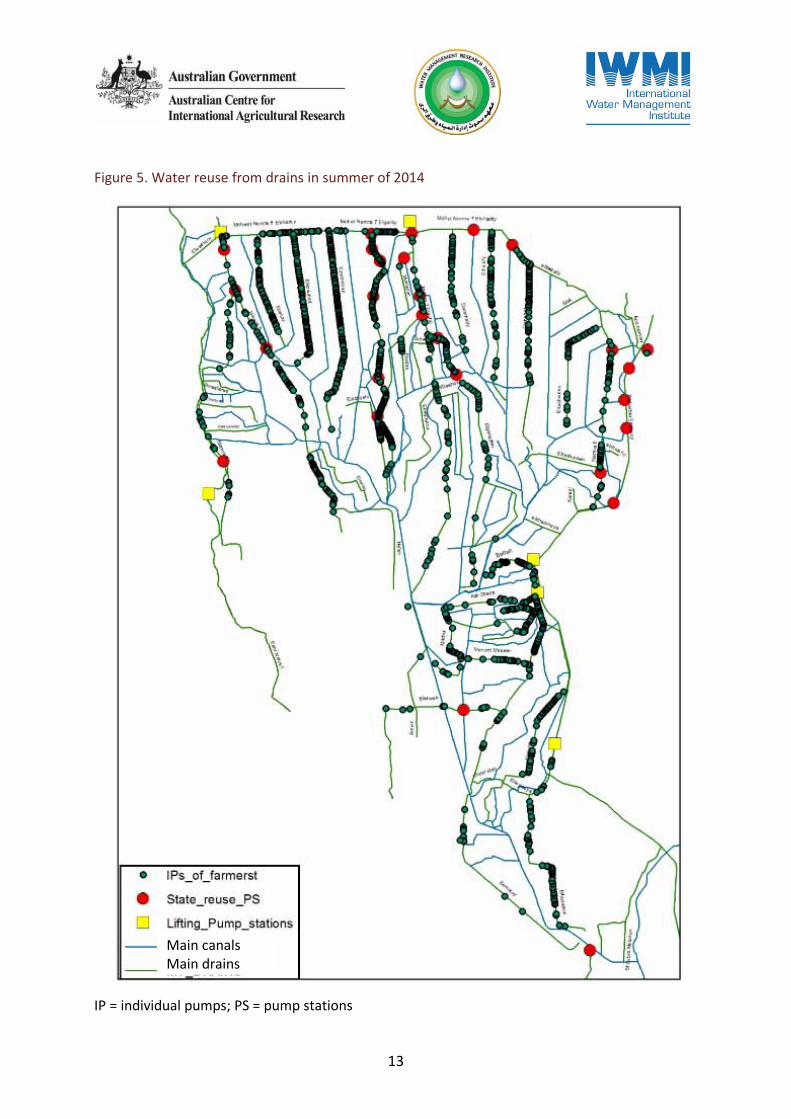
Indeed, to our knowledge there has been no recent systematic assessment of informal drainage water reuse. We have undertaken a survey to estimate the number of individual pump stations abstracting water from main and secondary drains in the Meet Yazid canal command area (except the W10 area), which roughly totals 100,000 ha. We recorded the location of individual pumps through field surveys along the drains and estimated the number of pumps at around 2,5004. As expected, and shown in the following map (Figure 5), there is a very high density of pumps in the downstream half of the command area. In contrast, the secondary drains of the upstream part had few if any pumps.
It must be noted that the survey did not consider drainage water reuse from tertiary drains. In some water-short areas this reuse can be considerable. For example, the monitoring of a collective pump station (IIP) in the Abu Mustafa canal has shown that the command area of 44 ha is also supplied by a total of 25 individual pumps that abstract water from tertiary drains (unpublished data). In such situations the degree of reuse is extremely high and so is the efficiency of water use as a result.
It is difficult to assess the amount of water effectively mobilized by individual reuse strategies. While the number of pumps observed in the northern part of the area is impressive a large proportion of them are used only occasionally in summer. We work here with a hypothetical volume of 4 Bm3, in line with the estimates mentioned above.
4 More than 2,000 geo-referenced pictures have been taken. However, it is difficult to obtain an exhaustive accounting of
these mobile pumps. Many are brought to the drains for a few hours of pumping and the number of pumps observed will therefore greatly depend on whether the corresponding canal is 'on' or 'off' and water short or not. The proportion of these pumps that are fixed also varies, depending upon the distance and access to the pump, how easily it can be stolen and how frequently it has to be used. For example, it was observed that the number of mobile pumps set up along main drain 7 varied greatly.
13
Figure 5. Water reuse from drains in summer of 2014
IP = individual pumps; PS = pump stations
Main canals Main drains
14
4 Groundwater use and balance
4.1 Aquifer recharge
The storage capacity of the Nile Delta aquifer is estimated at 500 Bm3 (Sherif, 1999). The aquifer is said to be semi-confined, as its top is covered by a thin clay layer whose thickness varies from 5 m in the south to 20 m in the middle and 50 m in the north of the Delta, while disappearing in some places (Mabrouk et al., 2013). The saturated thickness of the aquifer varies from 200 m in the southern part to about 1,000 m in the northern part (RIGW, 1992). Depths to groundwater range between 1-2 m in the north, 3-4 m in the middle and 5 m in the south (Mabrouk et al., 2013), while ground elevation decreases gradually from around 18 m (AMSL) at the apex of the Delta to around 5 m near Tanta, sloping down to the sea by 1 m per 10 km on average (Saleh, 1980). Furthermore, the Nile Delta slopes from east to west, with the Damietta branch being approximately 2 m higher than the Rosetta branch (Abu Al-Izz, 1971).
Deep percolation from excess irrigation water and seepage from the river branches, canals and drains in the southern and middle parts of the Nile Delta recharges the aquifer, while there is some upward seepage in the northern part (Kashef, 1982; Diab and Saleh, 1981; Sefelnasr and Sherif, 2013). While some parts of the Nile branches recharge the aquifer, others capture groundwater when the aquifer level is higher than the surface water level (FAO, 2013). Mohamed and Hua (2010) note, however, that the infiltration from canals in the western Delta is small compared with what the aquifer gains from the Rosetta branch. Yet the Nubaria canal (west) and Ismailia canal (east) that run along the fringes of the Delta have substantial infiltrations, enhanced by widening operations that disrupt the clay deposited in these canals (African Water Facility, 2007). Irrigation in the New Lands served by these canals, developed on lighter soils, also generates substantial aquifer recharge (Khalil et al., 2015).
Downward leakage towards the aquifer due to water used for irrigation and canal infiltration has been estimated at between 0.25 and 0.80 mm/day in the central and southern parts of the Delta (DRI, 1989; Nofal et al., 2015). These values have been in use for a very long time and are associated with a total recharge rate (by infiltration) of 6.78 Bm3/y (FAO, 2013; Mabrouk et al., 2013; Mohamed and Hua, 2010, etc), a value already used in the 1980s (e.g. Kashef, 1983). However, this key term of the water balance is extremely difficult to measure or estimate and is not known with much accuracy.
Groundwater modelling studies generally neglect the contribution of rainfall (with an average between 25 and 200 mm/year) to recharge since it is very small compared to the recharge rate (Mabrouk et al., 2013).
Additionally, there is no data available for the inflow from the valley part of the Nile aquifer. It is therefore not considered here. Groundwater in the Delta is not a separate or additional resource and is directly fed by surface water brought by the Nile River.
4.2 Aquifer discharge
Groundwater discharge from the Nile Delta aquifer takes place in different indirect and direct ways: through seepage to waterways (drains and, in some parts, canals), seepage to water bodies and evapotranspiration, inter-aquifer flow, outflow to the sea and direct groundwater abstraction through wells.
15
4.2.1 Outflow to lateral aquifers
Outflow of the Nile Delta aquifer occurs towards the Moghra aquifer along the fringe of the western Nile Delta, with a transfer estimated by RIGW/IWACO (1990) between 50 and 100 Mm3/year. Because of the depletion of the Moghra aquifer it is likely that this value has dramatically increased. Other authors (e.g. Gawad and Bekhit, 2014, cited in MetaMeta, 2015) consider that the Moghra aquifer is solely of fossil origin and that there is no interconnection with the Nile system due to the presence of a tectonic fault. We have tentatively considered here a value of 100 Mm3.
4.2.2 Outflow to waterways and evapotranspiration
While in the southern part of the Delta, where the aquifer is unconfined, waterways recharge the aquifer by percolation, the opposite is true in the northern fringe where the aquifer is semi-confined and subject to upward seepage. Groundwater is discharged to the relatively incised drainage system but also to canals: during the 'off' turn of water distribution some seepage of very saline water can be observed and this has to be flushed away at the beginning of the next 'on' period before farmers can use the water. The phenomenon is possibly more significant in terms of salt balance than in quantitative volumetric terms. Some water makes its way to the soil and the crop roots, contributing to plot evapotranspiration. In official water balances this contribution ('intrusion') to both waterways and ET is sometimes taken at 1 or 2 Bm3 (Oosterban, 1999; MWRI, 2002, 2003) or disregarded altogether.
We may use the overall salt balance of the Delta to estimate this contribution. In rounded-up values the amount of salt released by the Aswan dam is 11 million t (55 Bm3 x 0.2 g/l), while the amount released to the sea is around 36 million t (12 Bm3 x 3 g/l). This means that approximately 25 million tons of salt are brought up from saline aquifers in the semi-confined part of the Delta and residual soil salinity in the western delta.
Figure 6 shows that the main salt-flushing point corresponds to the drains coming from western new lands (tentatively one third of the total [around 8 million tons] can be attributed to the new lands). We can estimate the corresponding volume with a rough calculation. The salinity in drains near the lakes and seashore is around 3-10 g/l and includes a mix of drainage water (at around 1 g/l) and upward seepage, taken tentatively here at 15 g/l on average5. In order to account for 17 million t of salt (25-8), this upward seepage (with an average salinity of 15 g/l) has to amount to 1.1 Bm3 – a significant value. We rely here on a rounded value of 1 Bm3.
4.2.3 Outflow to the sea
The question of how much Nile water travels to the sea underground is difficult because answers that can be obtained through modelling are contingent upon a physical description of the aquifer itself and knowledge of the spatial distribution of both recharge and abstraction. Needless to say, current knowledge on all these complex elements remains somewhat crude.
Freshwater outflow to the sea was estimated at 0.37 Bm3 in 1958 and 0.28 Bm3 in 1962 (Zeidan, 2016). Zeidan (2016) reports that in 1980 an extensive study was conducted to evaluate the safe
5 Maps provided by Morsy (2009) or FAO (2013) show a large spatial variability of this value. Maps are often drawn based
on the interpolation of very few points, when it comes to the northern part of the delta. This value is indicative of an average for the irrigated area undergoing upward groundwater seepage (see Figure 13, Figure 14) and should be refined.

16
yield of the Nile Delta aquifer and that the annual outflow of freshwater to the sea was estimated at 0.97 Bm3.
Figure 6. Salt load discharged at key pumping stations (DRI, 2013)
For the west Delta, Mohamed and Hua (2010) have found a deficit of 0.14 Mm3/y in the aquifer, which is promoting seawater intrusion. Abstraction of groundwater in the eastern Delta New Lands is much more limited because its quality is in general degraded. This maintains groundwater at a rather high level (with instances of waterlogging) and a net positive outflow to the sea (Khalil et al., 2015).
Recent research has found that groundwater intrudes from the sea to the Nile Delta aquifer (0.56 Bm3/y at intermediate depths) as well as flowing from the aquifer towards the sea (0.14 Bm3/y at deeper depths), prompting the conclusion that, overall, "the Nile Delta aquifer is not losing fresh groundwater flux to the sea" (Nofal et al., 2015).
Considering that this term of the balance is in all cases of a minor magnitude, we have taken it here arbitrarily at 0. This is consistent with the fact that salinity isolines have not yet been substantially altered in past decades (Figure 7). However, an overall macro-level balance hides the likely fact that the positive outflow of the eastern Delta compensates for the negative outflow of the central and western Delta and therefore obscures the local problems associated with these deficits.
17
4.2.4 Abstraction by pumping
Groundwater abstraction by wells in the Delta has consistently increased, if judged by the number of wells inventoried: from 5,600 wells in 1952, to 13,000 in 1991, 22,905 in 2011 (11,120 wells in the west Delta, 2,887 in the central Delta and 8,898 in the eastern Delta: MWRI, 2013), and finally 32,054 agricultural wells in 2016 (Zeidan, 2016; MWRI, 2016).
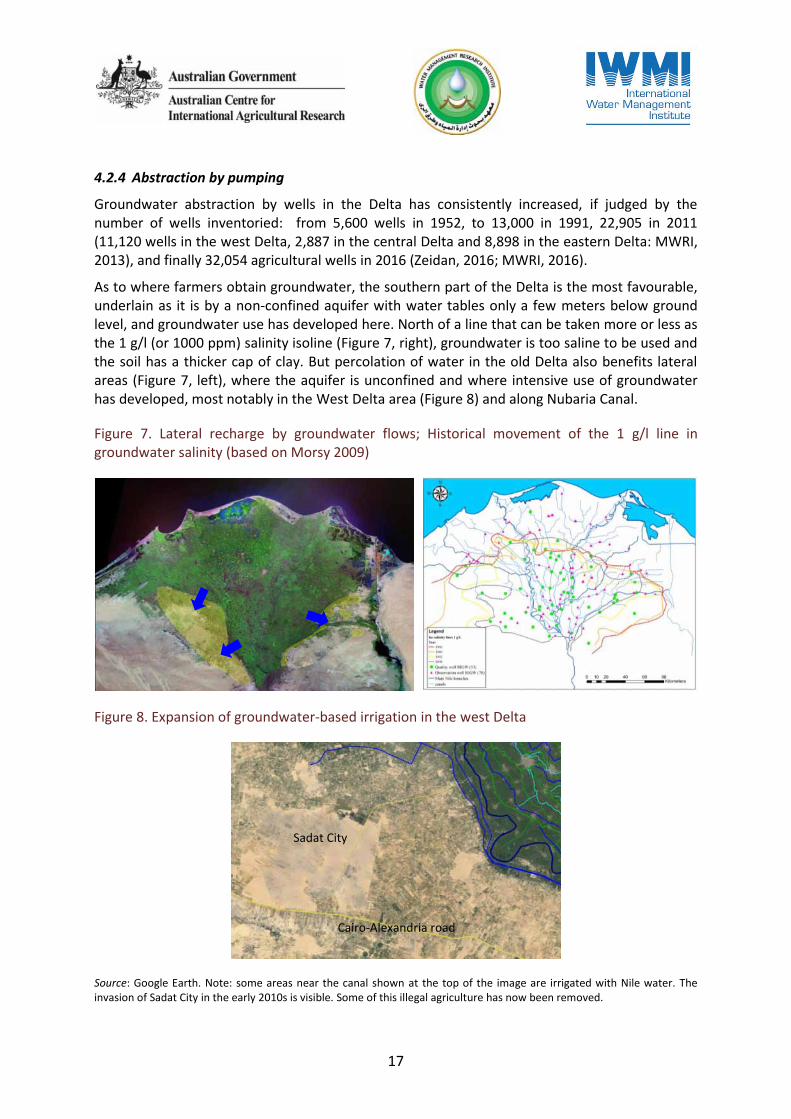
As to where farmers obtain groundwater, the southern part of the Delta is the most favourable, underlain as it is by a non-confined aquifer with water tables only a few meters below ground level, and groundwater use has developed here. North of a line that can be taken more or less as the 1 g/l (or 1000 ppm) salinity isoline (Figure 7, right), groundwater is too saline to be used and the soil has a thicker cap of clay. But percolation of water in the old Delta also benefits lateral areas (Figure 7, left), where the aquifer is unconfined and where intensive use of groundwater has developed, most notably in the West Delta area (Figure 8) and along Nubaria Canal.
Figure 7. Lateral recharge by groundwater flows; Historical movement of the 1 g/l line in groundwater salinity (based on Morsy 2009)
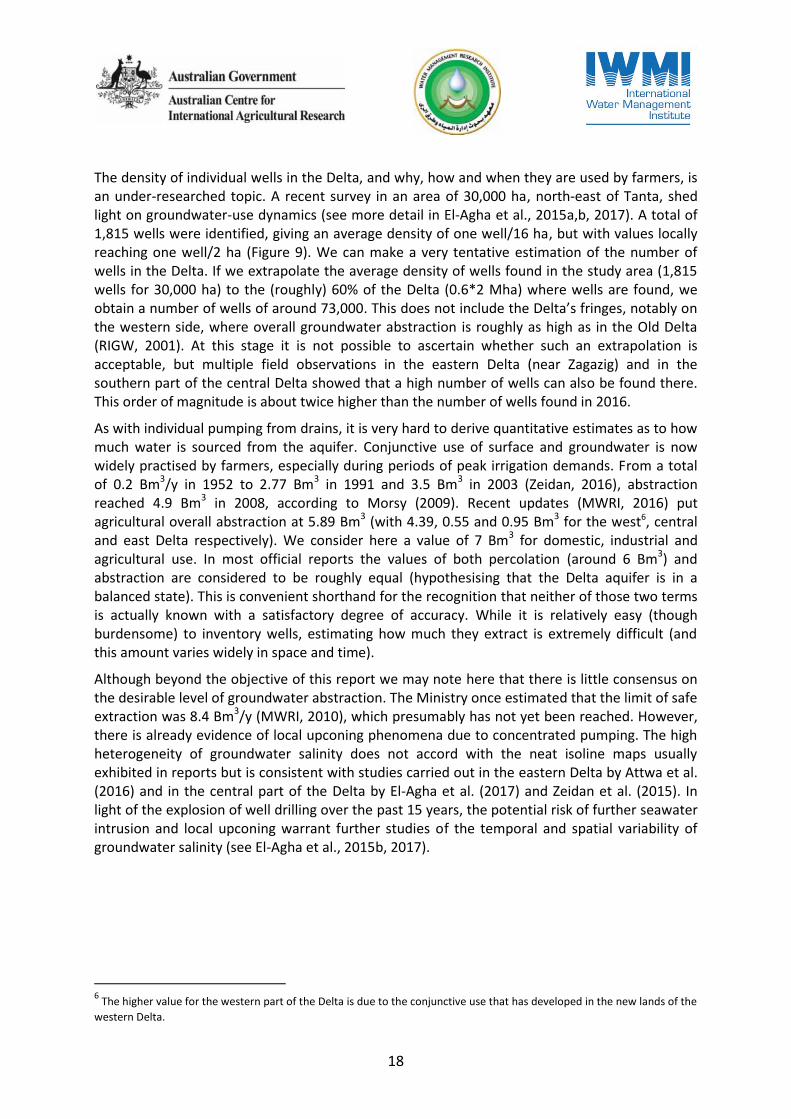
Figure 8. Expansion of groundwater-based irrigation in the west Delta
Source: Google Earth. Note: some areas near the canal shown at the top of the image are irrigated with Nile water. The invasion of Sadat City in the early 2010s is visible. Some of this illegal agriculture has now been removed.
Cairo-Alexandria road
Sadat City
18
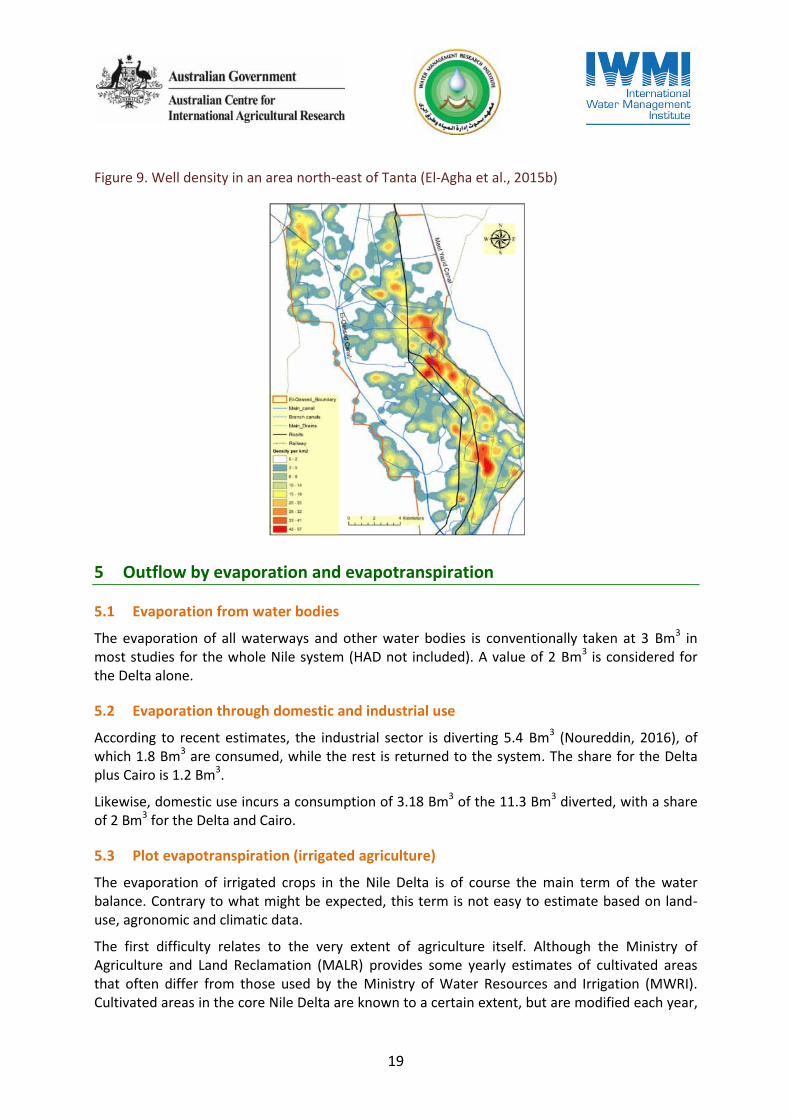
The density of individual wells in the Delta, and why, how and when they are used by farmers, is an under-researched topic. A recent survey in an area of 30,000 ha, north-east of Tanta, shed light on groundwater-use dynamics (see more detail in El-Agha et al., 2015a,b, 2017). A total of 1,815 wells were identified, giving an average density of one well/16 ha, but with values locally reaching one well/2 ha (Figure 9). We can make a very tentative estimation of the number of wells in the Delta. If we extrapolate the average density of wells found in the study area (1,815 wells for 30,000 ha) to the (roughly) 60% of the Delta (0.6*2 Mha) where wells are found, we obtain a number of wells of around 73,000. This does not include the Delta’s fringes, notably on the western side, where overall groundwater abstraction is roughly as high as in the Old Delta (RIGW, 2001). At this stage it is not possible to ascertain whether such an extrapolation is acceptable, but multiple field observations in the eastern Delta (near Zagazig) and in the southern part of the central Delta showed that a high number of wells can also be found there. This order of magnitude is about twice higher than the number of wells found in 2016.
As with individual pumping from drains, it is very hard to derive quantitative estimates as to how much water is sourced from the aquifer. Conjunctive use of surface and groundwater is now widely practised by farmers, especially during periods of peak irrigation demands. From a total of 0.2 Bm3/y in 1952 to 2.77 Bm3 in 1991 and 3.5 Bm3 in 2003 (Zeidan, 2016), abstraction reached 4.9 Bm3 in 2008, according to Morsy (2009). Recent updates (MWRI, 2016) put agricultural overall abstraction at 5.89 Bm3 (with 4.39, 0.55 and 0.95 Bm3 for the west6, central and east Delta respectively). We consider here a value of 7 Bm3 for domestic, industrial and agricultural use. In most official reports the values of both percolation (around 6 Bm3) and abstraction are considered to be roughly equal (hypothesising that the Delta aquifer is in a balanced state). This is convenient shorthand for the recognition that neither of those two terms is actually known with a satisfactory degree of accuracy. While it is relatively easy (though burdensome) to inventory wells, estimating how much they extract is extremely difficult (and this amount varies widely in space and time).
Although beyond the objective of this report we may note here that there is little consensus on the desirable level of groundwater abstraction. The Ministry once estimated that the limit of safe extraction was 8.4 Bm3/y (MWRI, 2010), which presumably has not yet been reached. However, there is already evidence of local upconing phenomena due to concentrated pumping. The high heterogeneity of groundwater salinity does not accord with the neat isoline maps usually exhibited in reports but is consistent with studies carried out in the eastern Delta by Attwa et al. (2016) and in the central part of the Delta by El-Agha et al. (2017) and Zeidan et al. (2015). In light of the explosion of well drilling over the past 15 years, the potential risk of further seawater intrusion and local upconing warrant further studies of the temporal and spatial variability of groundwater salinity (see El-Agha et al., 2015b, 2017).
6 The higher value for the western part of the Delta is due to the conjunctive use that has developed in the new lands of the
western Delta.
19
Figure 9. Well density in an area north-east of Tanta (El-Agha et al., 2015b)
5 Outflow by evaporation and evapotranspiration
5.1 Evaporation from water bodies
The evaporation of all waterways and other water bodies is conventionally taken at 3 Bm3 in most studies for the whole Nile system (HAD not included). A value of 2 Bm3 is considered for the Delta alone.
5.2 Evaporation through domestic and industrial use
According to recent estimates, the industrial sector is diverting 5.4 Bm3 (Noureddin, 2016), of which 1.8 Bm3 are consumed, while the rest is returned to the system. The share for the Delta plus Cairo is 1.2 Bm3.
Likewise, domestic use incurs a consumption of 3.18 Bm3 of the 11.3 Bm3 diverted, with a share of 2 Bm3 for the Delta and Cairo.
5.3 Plot evapotranspiration (irrigated agriculture)
The evaporation of irrigated crops in the Nile Delta is of course the main term of the water balance. Contrary to what might be expected, this term is not easy to estimate based on land-use, agronomic and climatic data.
The first difficulty relates to the very extent of agriculture itself. Although the Ministry of Agriculture and Land Reclamation (MALR) provides some yearly estimates of cultivated areas that often differ from those used by the Ministry of Water Resources and Irrigation (MWRI). Cultivated areas in the core Nile Delta are known to a certain extent, but are modified each year,
20
due, in particular, to the encroachment of urbanisation into agricultural areas (of which more later). The situation is less certain concerning the new lands, a large part of which has been based on groundwater in recent years. It is also often unclear whether data refer to equipped command areas or actual cultivated areas. In many areas there is often a significant difference between these values because a portion of the land is left uncultivated for a number of reasons (poor soil, poor access to roads, salinity, insufficient water supply, etc.), which is well illustrated by the situation at the downstream end of the Nubaria canal (Hamam canal and extension).
While some equipped areas are not being cultivated, a lot of uncontrolled horizontal expansion and informal reclamation occurs along the valley and the margins of the Delta (see Barnes, 2012; Sims, 2015). Uncontrolled horizontal expansion is very difficult to quantify but estimates in 2010 put it at 361,000 fed, 36% of which in the Delta and the rest in upper/middle Egypt (MWRI, 2013).
Appendix 1 provides several images of new-land areas, showing the expansion of irrigation over the past 10 years, often with some contribution of, or fully based on groundwater. This has been largely uncontrolled and even less monitored. The images provide a stunning view of how investors have taken over the Wadi Natrun area over the past 10 years, tapping the Moghra aquifer with limited regulation, if not encouragement, by the government7. This dynamic began 30 years ago between the Nubaria canal and the Cairo-Alexandria road, based on the unconfined aquifer fed by the Delta. Images also provide a striking view of changes in the eastern Delta, in particular since the widening of the Ismailia canal in 1995 (Rashed and El-Sayed, 2014). Most of the new area is supplied by surface water (Ismailia canal and other canals in the old Delta), but there is also some development based on groundwater and even wastewater reuse (Rashed and El-Sayed, 2014; Khalil et al., 2015; Allam et al., 2016). The poor quality of groundwater has constrained agricultural development on this side of the Delta. Other images show that similar dynamics can be observed along the Nile Valley.
As a result of the above phenomena the areas irrigated either by surface or groundwater, or both, are not known accurately. A large part of the groundwater used actually has its origin in the Nile River itself: by impacting piezometric levels this massive pumping thrives on existing stocks but also, dynamically, on surface water itself, drawing more water from connected waterways (notably the Rosetta Branch, with regard to the western Delta). This complexity is mind-boggling, but a safe conclusion seems to be that consumption of Nile water, whether direct or indirect, has increased over the past 30 years.
In addition to the total area itself comes the issue of cropping patterns. Here there is also significant divergence between the areas as considered by the MALR and MWRI, particularly regarding the extent of rice cultivation. Farmers frequently divide their small plots into several smaller sections with different crops, and monitoring/aggregating this information is a Herculean task. The fact that cropping calendars are not uniform and are staggered over several months for a given crop makes it even harder to ascertain crop requirements based on estimated cropping patterns and calendars. To add to this, for each type of crop there are several varieties with various cycle durations, for example rice varieties with shorter cycles, down to 90 days, have been increasingly used. In the particular case of bersim (Egyptian clover) farmers may vary the
7 On the 2017 picture there is a recent flurry of pivots in the square of desert belonging to the army.
21
cultivation period (and the number of cuts) based on their choice of cropping patterns and rotations.
Last but not least, there is no agreement on crop-based water requirements. The MALR and MWRI formed a working group that has been attempting to settle the issue for more than 10 years but has yet to reach a conclusion.8 IWMI and WMRI (see IWMI-WMRI report 1, 2013; Appendix 6.3) have shown that official reports and technical studies present or use widely varying values of ET and net and gross water requirements. This is not specific to Egypt but confirms that estimating theoretical crop requirements is not as easy or accurate as many would like to believe.
We are concerned here with potential crop water requirements and consumption. In terms of water management there would still be one step to derive irrigation water requirements from crop agronomic requirements. This requires estimates of the efficiency coefficients of water conveyance and application at the tertiary and plot levels. Extreme values found in the literature for gross irrigation requirements of crops such as rice, wheat and cotton are in a ratio of 2 (ibid.).
An alternative is to use satellite imagery and energy balances to estimate total evapotranspiration. The accuracy of remote sensing data varies depending on several factors, such as crop type and crop development stage, and also the number of samples used for matching actual field data and remote sensing interpretations. This approach is interesting in terms of identifying spatial contrasts at a given point in time between areas with high and low ET but has its limitations when it comes to estimating absolute ET values (see Droogers et al., 2009, who found variations of up to 31% on Delta ET estimated by two different reports using remote sensing). One such exercise (Simonneaux and Adrabou, 2009) has estimated ET for the Delta (2.6 Mha) at 30 Bm3.
In practice, actual ET is often estimated as the closing term of the water balance. For the entire Nile Delta and valley system, estimates of total ET in the literature vary between 36 and 41 Bm3.
5.4 Pond evaporation (aquaculture)
Having developed mainly in an informal manner, the aquaculture found along the northern fringe of the Delta is not usually computed together with agriculture. This is also due to the fact that a large part of this aquaculture diverts drainage outflows after the terminal pump stations that lift drainage water to flush it to the sea or coastal lakes. As a result they are not considered part of the official command area of the MWRI. The volumes used will have to be deducted from the computed outflow to the sea.
This aquaculture has developed into one of the largest such inland areas in the world, estimated at 300,000 fed – roughly 120,000 ha (rounded to 100,000 ha to deduct aquaculture that developed within irrigation areas). Most fishpond owners do not raise fish during winter but some cultivate wheat or barley in rotation with fish. However, all ponds evaporate as open water bodies during the spring, summer and autumn. If we assume an order of magnitude of 1 m of evaporation during this period, we can estimate the consumption of water in aquaculture at around 1 Bm3.
8 The MWRI tends to use lower crop requirement values than the MALR so that it can show that it is delivering sufficient
water to farmers.
22
6 Outflow to the sea
6.1 Outflow through Nile River branches
Seckler and Altaf (1997) have observed a clear reduction of the Nile Rosetta and Damietta branchesʼ outflow to the sea from a value of 6.2 Bm3 in 1980 to 3.9 Bm3 in 1990 and 1.7 Bm3 in 1996. This amount of water, released annually to the sea for navigation, has been reduced from around 1.2 Bm3 in 1992 to only 0.3 Bm3 in 1996 by virtue of the staggering of the winter closure (Attia, 1996). Each branch of the Nile (Rosetta and Damietta) is closed by a dam located near its respective estuary, but locks allow for navigation. What is 'lost' to the sea through the two branches is now estimated at 0.2 Bm3/year (MWRI 2005).
6.2 Outflow of drainage water
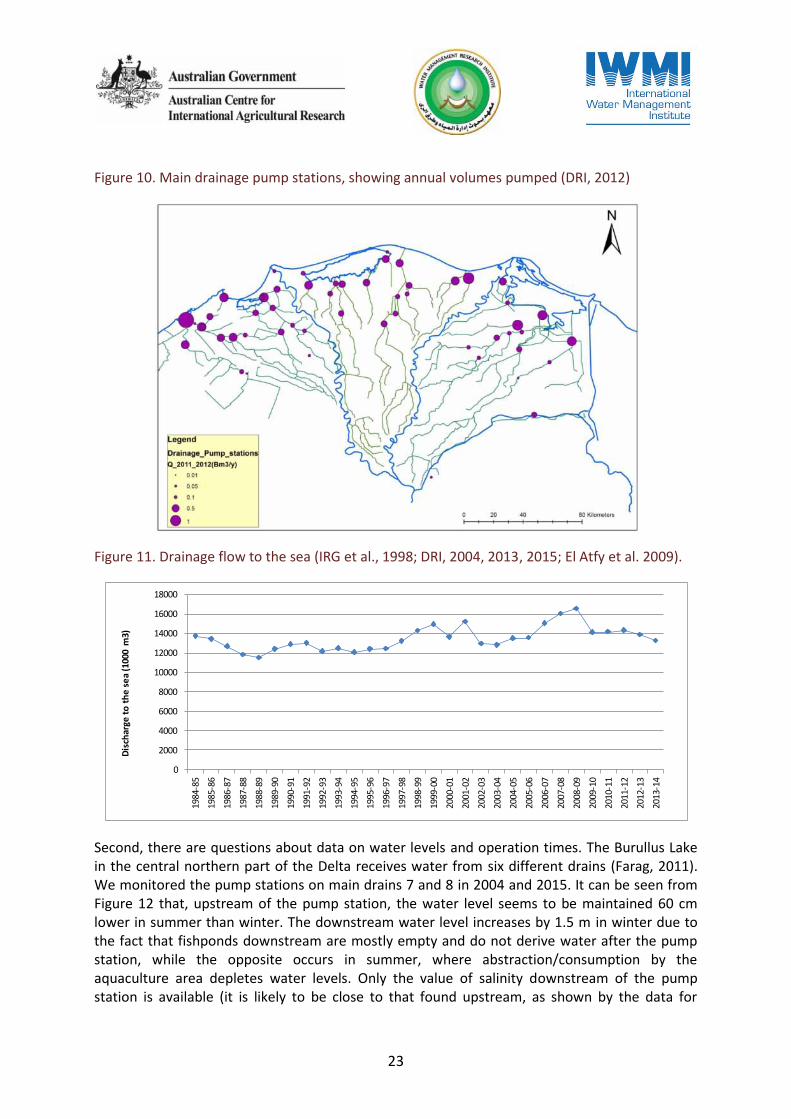
Where and how, then, does Nile water flow out to the sea? It is not well understood by the general public that 1) the main waterways and coastal lakes connecting the Delta to the sea are closed by regulators with few exceptions, and 2) that 90% of the drainage water (Volker, 1979) must be lifted over a height of approximately 2.5 m by pump stations constructed in parallel to these regulators.9 The need for such regulators is to prevent sea-water intrusion inland, and to allow pump stations to lower the water levels in irrigated lands –both in the drains and in the soil- which, otherwise, would be roughly at sea level. A total of 53 pumping stations pump out drainage water to either the sea/coastal lakes or from secondary drainage areas to main drains (Figure 10). The Ministry periodically calibrates the pumps to establish curves indicating actual discharge depending on the head (height) between downstream and upstream water levels. Operation times are recorded and used to calculate the monthly volumes pumped out to the sea at each station. When aggregated these data provide an estimate of how much water is released to the sea.
Figure 11 shows the historical evolution of total drainage outflow and reveals an unexpected relative stability (this is discussed later).
The importance of the quantitative estimation of drainage outflow to the sea raises questions around the data and the methodology used for this estimation. First, pumps are reportedly calibrated each year and declining efficiencies and discharges are therefore monitored. If and when this is not the case the volumes pumped might be slightly overestimated because of the general downward trend in pump efficiency.
9 Bahr el Baqr and (eastern Delta) and Gharbia (central Delta) drains discharge by gravity (but they are fed by secondary
drains generally connected to them by lifting stations).
23
Figure 10. Main drainage pump stations, showing annual volumes pumped (DRI, 2012)
Figure 11. Drainage flow to the sea (IRG et al., 1998; DRI, 2004, 2013, 2015; El Atfy et al. 2009).
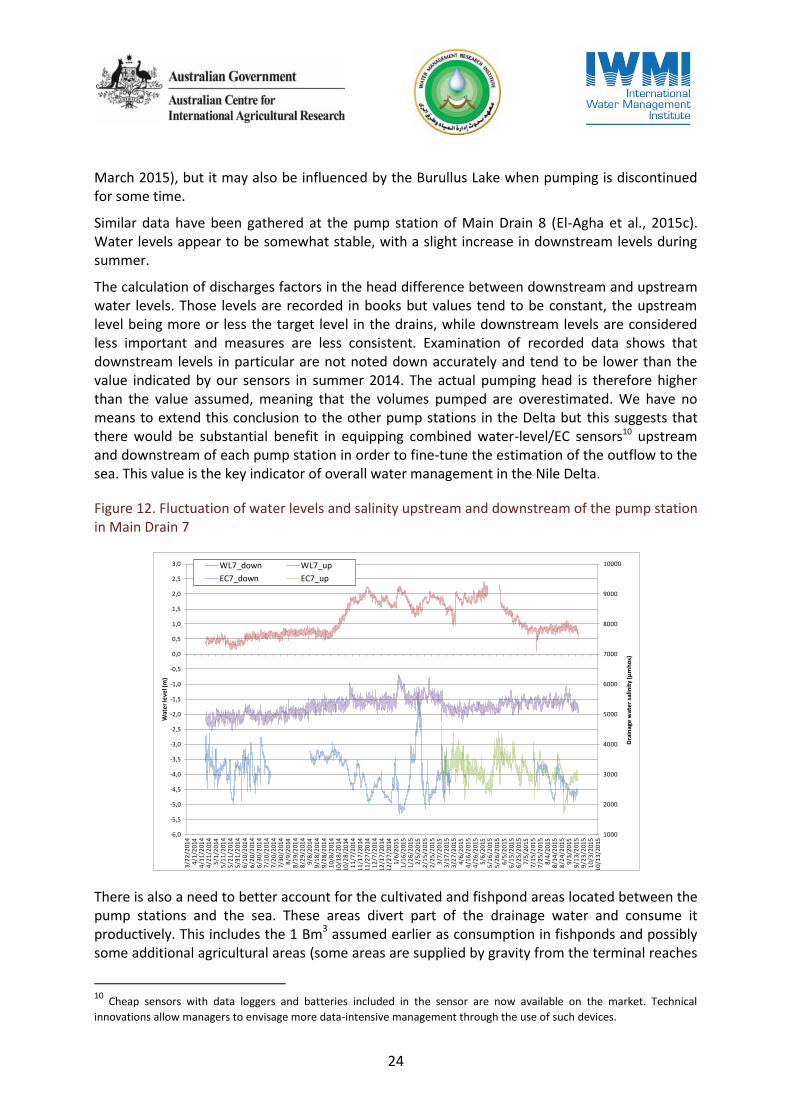
Second, there are questions about data on water levels and operation times. The Burullus Lake in the central northern part of the Delta receives water from six different drains (Farag, 2011). We monitored the pump stations on main drains 7 and 8 in 2004 and 2015. It can be seen from Figure 12 that, upstream of the pump station, the water level seems to be maintained 60 cm lower in summer than winter. The downstream water level increases by 1.5 m in winter due to the fact that fishponds downstream are mostly empty and do not derive water after the pump station, while the opposite occurs in summer, where abstraction/consumption by the aquaculture area depletes water levels. Only the value of salinity downstream of the pump station is available (it is likely to be close to that found upstream, as shown by the data for
0
2000
4000
6000
8000
10000
12000
14000
16000
18000
1984
-85
1985
-86
1986
-87
1987
-88
1988
-89
1989
-90
1990
-91
1991
-92
1992
-93
1993
-94
1994
-95
1995
-96
1996
-97
1997
-98
1998
-99
1999
-00
2000
-01
2001
-02
2002
-03
2003
-04
2004
-05
2005
-06
2006
-07
2007
-08
2008
-09
2009
-10
2010
-11
2011
-12
2012
-13
2013
-14
Dis
char
ge t
o t
he
se
a (1
000
m3)
24
March 2015), but it may also be influenced by the Burullus Lake when pumping is discontinued for some time.
Similar data have been gathered at the pump station of Main Drain 8 (El-Agha et al., 2015c). Water levels appear to be somewhat stable, with a slight increase in downstream levels during summer.
The calculation of discharges factors in the head difference between downstream and upstream water levels. Those levels are recorded in books but values tend to be constant, the upstream level being more or less the target level in the drains, while downstream levels are considered less important and measures are less consistent. Examination of recorded data shows that downstream levels in particular are not noted down accurately and tend to be lower than the value indicated by our sensors in summer 2014. The actual pumping head is therefore higher than the value assumed, meaning that the volumes pumped are overestimated. We have no means to extend this conclusion to the other pump stations in the Delta but this suggests that there would be substantial benefit in equipping combined water-level/EC sensors10 upstream and downstream of each pump station in order to fine-tune the estimation of the outflow to the sea. This value is the key indicator of overall water management in the Nile Delta.
Figure 12. Fluctuation of water levels and salinity upstream and downstream of the pump station in Main Drain 7
There is also a need to better account for the cultivated and fishpond areas located between the pump stations and the sea. These areas divert part of the drainage water and consume it productively. This includes the 1 Bm3 assumed earlier as consumption in fishponds and possibly some additional agricultural areas (some areas are supplied by gravity from the terminal reaches
10
Cheap sensors with data loggers and batteries included in the sensor are now available on the market. Technical
innovations allow managers to envisage more data-intensive management through the use of such devices.
1000
2000
3000
4000
5000
6000
7000
8000
9000
10000
-6,0
-5,5
-5,0
-4,5
-4,0
-3,5
-3,0
-2,5
-2,0
-1,5
-1,0
-0,5
0,0
0,5
1,0
1,5
2,0
2,5
3,0
3/2
2/2
014
4/1
/20
144
/11
/201
44
/21
/201
45
/1/2
014
5/1
1/2
014
5/2
1/2
014
5/3
1/2
014
6/1
0/2
014
6/2
0/2
014
6/3
0/2
014
7/1
0/2
014
7/2
0/2
014
7/3
0/2
014
8/9
/20
148
/19
/201
48
/29
/201
49
/8/2
014
9/1
8/2
014
9/2
8/2
014
10
/8/2
014
10
/18
/20
141
0/2
8/2
014
11
/7/2
014
11
/17
/20
141
1/2
7/2
014
12
/7/2
014
12
/17
/20
141
2/2
7/2
014
1/6
/20
151
/16
/201
51
/26
/201
52
/5/2
015
2/1
5/2
015
2/2
5/2
015
3/7
/20
153
/17
/201
53
/27
/201
54
/6/2
015
4/1
6/2
015
4/2
6/2
015
5/6
/20
155
/16
/201
55
/26
/201
56
/5/2
015
6/1
5/2
015
6/2
5/2
015
7/5
/20
157
/15
/201
57
/25
/201
58
/4/2
015
8/1
4/2
015
8/2
4/2
015
9/3
/20
159
/13
/201
59
/23
/201
51
0/3
/201
51
0/1
3/2
015
Dra
inag
e w
ate
r sa
linit
y (µ
mh
os)
Wat
er
leve
l (m
)
WL7_down WL7_up
EC7_down EC7_up
25
of the main drains [e.g. Gharbia, or Main Drain 1, in the central Delta] and estimating diversions is not easy11).
7 Aspects of the salt balance
Water dynamics in the Delta and the corresponding quantitative mass balance cannot be evaluated without a corresponding analysis of the salt balance. Depending on water management practices salt may accumulate in both the soil and specific drains, which may impair agriculture and prevent conjunctive use.
In a survey undertaken in 1991, the Total Dissolve Solids (TDS) in Nile water recorded upstream of the Delta barrage ranged from 246 mg/l in May to 410 mg/l just before the peak of the winter closure period (January). A survey in 2002 showed how TDS gradually increases from 171 mg/l downstream of HAD to 240 mg/l at the Delta barrage and then to 450 mg/l along the 80 km of the Rosetta branch (APP, 2008). If we assume that there is no net increase in the salt load along the Nile Valley, then the 171/240 ratio (= 0.71) gives an estimation of the percentage of the water released from HAD that reaches the Delta without being consumed on the way. The sharper increase along the Rosetta branch is due to the incorporation of drainage return flow from the central Delta.
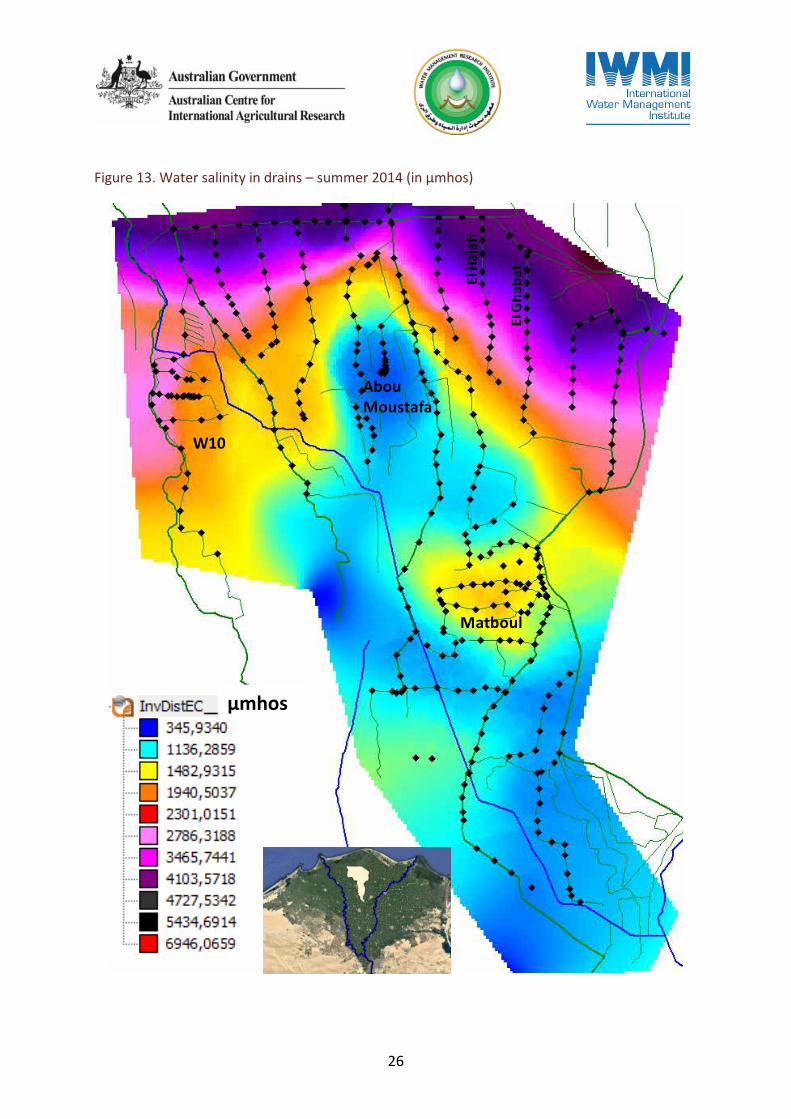
Figure 13 shows the spatial variability of drain-water salinity in the Meet Yazid command area in summer (El-Agha et al., 2015c): the greater part of the upstream command area of Meet Yazid has a drainage water salinity under 1,400 µmhos12, with the exception of an area near Matboul, where salinity is between 1,400 and 2,500 µmhos. This is a low-lying area, which actually has to be drained by a large-scale pump station. Medium salinity is observed on the western part, in the W10 area, which can be explained by the fact that this area is predominantly fed with drainage water from the Nashart drain, which has higher salinity (IWMI and WMRI, 2013).
The figure indicates a growing salinity as one moves northward, until the Moheet drain that defines the limit of the agricultural area. Interestingly, the command area of the Abu Mustafa canal, in the middle of the command area, produces drainage water with salinity under 2,000 µmhos, which contrasts with adjacent areas, where salinity varies between 2,000 and 4,500 µmhos13. The Ghabat and Halafy drains, to the east, exhibit a clear pattern of growing salinity as one moves northward, indicating a south-north gradient of soil salinity compatible with the fact that, historically, flooding, impoundment and seawater influence were more pronounced and prolonged towards the sea.
11
For example, the fraction reused or drained to the sea by gravity at the terminal weirs of Gharbia Drain and Drain 1 are
hard to estimate. Nada's (2017) measurements at the end of Drain 1 suggest that outflow to the sea might be less than estimated by DRI. 12
1000 µmhos = 1 mmhos (millimhos) = 640 mg/l (or ppm) = 0.64 g/l 13
Maps from 1913 indicate that Abu Mustafa was the only area north of El-Riyad City to be cultivated at that time, most
likely on account of its better soil and higher elevation.
26
Figure 13. Water salinity in drains – summer 2014 (in μmhos)
Matboul
W10
AbouMoustafa
El H
alaf
i
El G
hab
at
µmhos
27
The fact that these drains generate water with salinity approximately 4 times higher than in the upstream part of the canal command area indicates that deeper groundwater is constantly pushed upwards by the semi-artesian conditions of the aquifer in the northern part of the Delta. This groundwater not only carries the salts accumulated in the soil profile upwards but is also affected by (underground) seawater intrusion. The lower the elevation of the ground (to the north) the higher the effect. We have noted earlier that drains and even canals intercept this upward seepage of salty water.
The results for winter 2014/15 show that the average EC of drainage water was 3,033 μmhos in winter against 2,333 µmhos in summer – an increase of 33% (limited to the downstream area because upstream has a mostly even and good drainage salinity level). This is due to the fact that the amounts of irrigation and drainage water decrease in winter compared with the summer season when rice is cultivated. Additionally, lower average levels in canals and drains promote the drainage of deeper soil layers, which have a higher salt content.
This generation of salt in the northern part of the Delta is responsible for the well-known fact that the salt mass flushed down to the sea through the pumping station is almost three times larger than the salt mass brought into the Delta by the Nile River itself (Roest, 1999; Zhu et al.; 1996). Salt loading is particularly strong in the west Delta due to the salts washed out from land leaching on the new lands of Nubaria (Zhu et al., 1996).
There are several issues associated with the generation of salts in the drains of the Nile Delta. The first is local and concerns those drains in the northern fringe that have high salinity but are also used by farmers to complement failing irrigation water. Should the irrigation efficiency in these areas be substantially improved the resulting decrease in return flows would translate into a proportional increase in salt concentration. This would further limit the opportunity for farmers to rely occasionally on drainage water or would increase the impact of salt on yields. This constraint does not apply to upstream areas where the phenomenon of increasing drainage water salinity would still keep the quality of this water within a range suitable for downstream reuse.
The second issue refers to the aquaculture that thrives on the drainage water generated in the highly saline northern drains, and which could potentially be threatened by an increase in salinity, whether due to increased upward seepage or improved irrigation efficiency. Fortunately this turns out not to be the case since the type of aquaculture found in these areas, for example those around Lake Burullus, can readily stand much more saline water than is the case at present (Dickson, 2014). An indication of this is the use of brackish groundwater by fish farms located far from the main drains and which receive water that is degraded in quality (particularly in dissolved oxygen) having been reused several times by other farms. The conclusion is that possible changes in the salt balance of the Delta will not significantly affect fishpond aquaculture (and may even prove beneficial).
The situation is less clear, however, with regard to the ecology and fisheries of the lakes themselves. Drainage water helps maintain a favourable salt balance in the lakes for fish production, which, according to Abdel-Dayem et al. (2007), should remain between 5,500 and 6,250 μmhos. Likewise, IRG et al. (1998) have determined that to maintain an adequate environmental flow to the lakes a minimum volume of 8.5 Bm3 is needed. In addition, through
28
percolation of water in ponds, coastal aquaculture positively contributes to the combating of seawater intrusion.
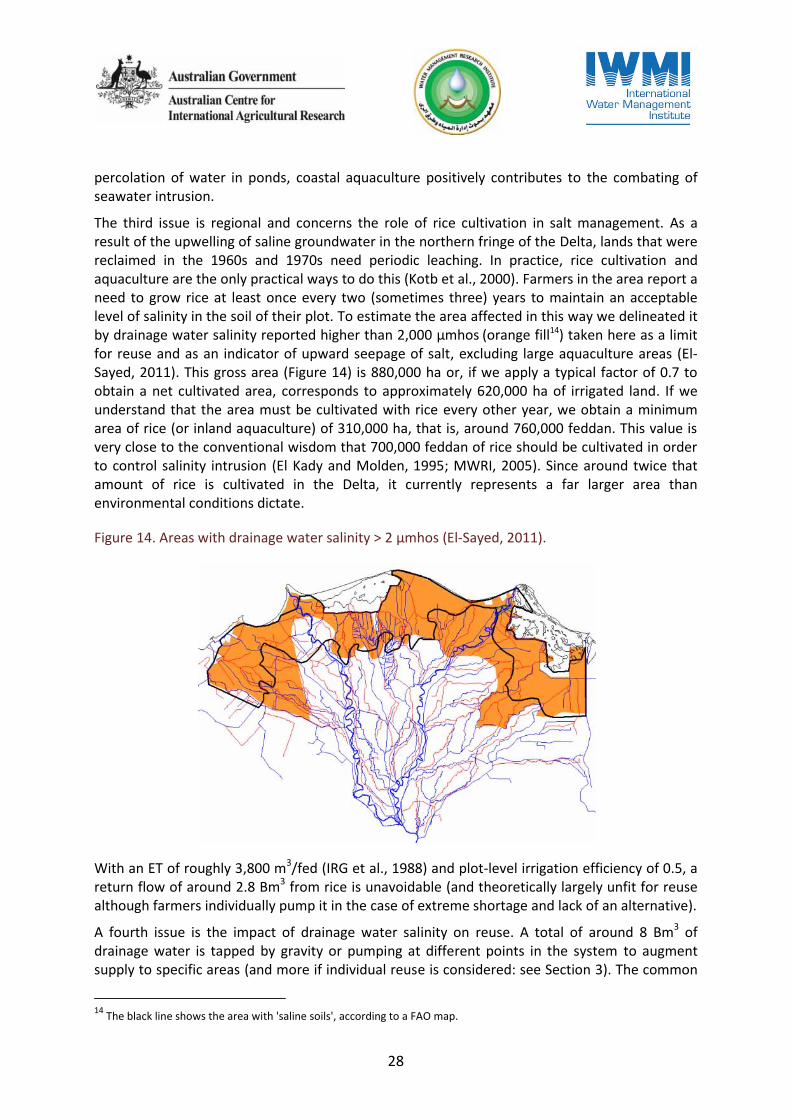
The third issue is regional and concerns the role of rice cultivation in salt management. As a result of the upwelling of saline groundwater in the northern fringe of the Delta, lands that were reclaimed in the 1960s and 1970s need periodic leaching. In practice, rice cultivation and aquaculture are the only practical ways to do this (Kotb et al., 2000). Farmers in the area report a need to grow rice at least once every two (sometimes three) years to maintain an acceptable level of salinity in the soil of their plot. To estimate the area affected in this way we delineated it by drainage water salinity reported higher than 2,000 μmhos (orange fill14) taken here as a limit for reuse and as an indicator of upward seepage of salt, excluding large aquaculture areas (El-Sayed, 2011). This gross area (Figure 14) is 880,000 ha or, if we apply a typical factor of 0.7 to obtain a net cultivated area, corresponds to approximately 620,000 ha of irrigated land. If we understand that the area must be cultivated with rice every other year, we obtain a minimum area of rice (or inland aquaculture) of 310,000 ha, that is, around 760,000 feddan. This value is very close to the conventional wisdom that 700,000 feddan of rice should be cultivated in order to control salinity intrusion (El Kady and Molden, 1995; MWRI, 2005). Since around twice that amount of rice is cultivated in the Delta, it currently represents a far larger area than environmental conditions dictate.
Figure 14. Areas with drainage water salinity > 2 μmhos (El-Sayed, 2011).
With an ET of roughly 3,800 m3/fed (IRG et al., 1988) and plot-level irrigation efficiency of 0.5, a return flow of around 2.8 Bm3 from rice is unavoidable (and theoretically largely unfit for reuse although farmers individually pump it in the case of extreme shortage and lack of an alternative).
A fourth issue is the impact of drainage water salinity on reuse. A total of around 8 Bm3 of drainage water is tapped by gravity or pumping at different points in the system to augment supply to specific areas (and more if individual reuse is considered: see Section 3). The common
14
The black line shows the area with 'saline soils', according to a FAO map.

29
practice in Egypt is to mix drainage water with fresh water so that the resulting salinity would be around 1 g/l (Abdel Dayem et al., 2007), with the following rules:
Table 1. Criteria for mixing drainage and canal waters (Kotb et al., 2000)
For example, the blending of Bahr Tira irrigation water and drainage water from Gharbia drain (whose salinity is around 1.5 g/l at its terminal part; Allam et al., 2016) through the Hamol pumping station limits the potential for reuse. There is difficulty retrieving good-quality drainage water due to its spatial and temporal variability. According to El Atfy et al. (2009), a third of the drainage outflow to the sea has acceptable salinity for irrigation of tolerant crops and halophytes. As mentioned earlier, however, pollution constitutes a constraint that in many cases prevents reuse even where salinity does not.
If the salt concentration in the drains increases because of a reduced return flow, then a lower portion of drainage water will be usable. If current irrigation with, say, 50% efficiency is improved to 66%, then return flows will be reduced from one half to one third, meaning that the salinity of drainage water (concentration) will be multiplied by 1.5. At the same time less water applied at the farm level would allow more to be distributed to downstream areas, which would in turn have less need to pump from drains. This would not be the case, however, where shortages are due to a lack of canal capacity in the face of an overextended rice area. This identifies an important and complex trade-off between increasing irrigation efficiency and reusing drainage water, which has to be looked at for each specific location.
8 Water balance of the Delta
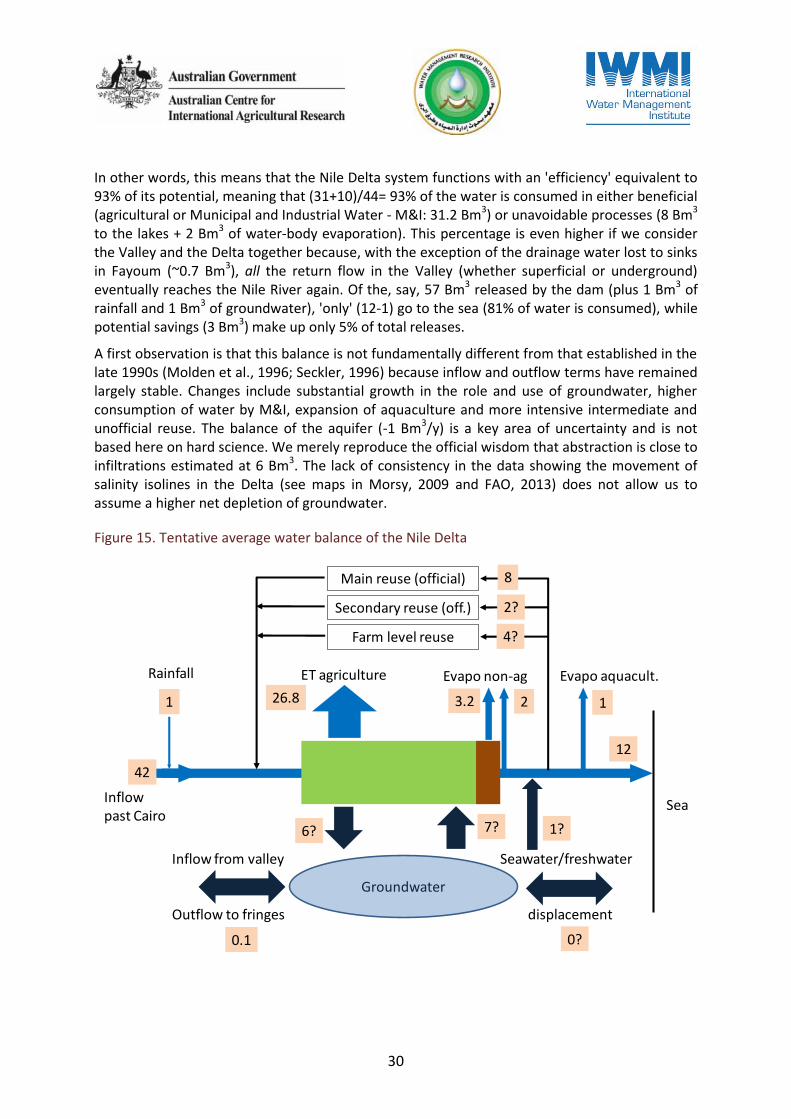
Figure 15 provides a summary of the terms of the annual water balance reviewed above. Total inflow into the Delta is 45 Bm3, including 42 Bm3 of Nile water, 1 Bm3 of rainfall, a hypothetical net depletion of 1 Bm3 of groundwater, plus 1 Bm3 of 'intrusion' (this last term, however, should not be computed as inflow since it is merely pumped out to the sea). The total of all diversions, adding reuse volumes, is around 63 Bm3 (42 Bm3 of Nile water, 7 of groundwater and 14 Bm3 of official/unofficial reuse). With an average of 13 Bm3 (minus 1 Bm3 consumed by aquaculture) flushed out to sea, the depleted fraction is (44-12)/44 = 73%. Most of this consumption is beneficial or unavoidable (evaporation of water bodies, navigation, unrecoverable drainage). If we assume that a minimum outflow of 8 Bm3 must be ensured, then only 4 Bm3, that is 9% of the water supplied (not including the 1 Bm3 'intrusion' of saline water), could be made available for consumption by agricultural or non-agricultural processes. While not much this figure is not irrelevant.
30
In other words, this means that the Nile Delta system functions with an 'efficiency' equivalent to 93% of its potential, meaning that (31+10)/44= 93% of the water is consumed in either beneficial (agricultural or Municipal and Industrial Water - M&I: 31.2 Bm3) or unavoidable processes (8 Bm3 to the lakes + 2 Bm3 of water-body evaporation). This percentage is even higher if we consider the Valley and the Delta together because, with the exception of the drainage water lost to sinks in Fayoum (~0.7 Bm3), all the return flow in the Valley (whether superficial or underground) eventually reaches the Nile River again. Of the, say, 57 Bm3 released by the dam (plus 1 Bm3 of rainfall and 1 Bm3 of groundwater), 'only' (12-1) go to the sea (81% of water is consumed), while potential savings (3 Bm3) make up only 5% of total releases.
A first observation is that this balance is not fundamentally different from that established in the late 1990s (Molden et al., 1996; Seckler, 1996) because inflow and outflow terms have remained largely stable. Changes include substantial growth in the role and use of groundwater, higher consumption of water by M&I, expansion of aquaculture and more intensive intermediate and unofficial reuse. The balance of the aquifer (-1 Bm3/y) is a key area of uncertainty and is not based here on hard science. We merely reproduce the official wisdom that abstraction is close to infiltrations estimated at 6 Bm3. The lack of consistency in the data showing the movement of salinity isolines in the Delta (see maps in Morsy, 2009 and FAO, 2013) does not allow us to assume a higher net depletion of groundwater.
Figure 15. Tentative average water balance of the Nile Delta
Main reuse (official)
Secondary reuse (off.)
Farm level reuse
Groundwater
ET agriculture Evapo non-ag
Inflow from valley
Outflow to fringes
Seawater/freshwater
displacement
Sea
42
12
8
2?
4?
6? 7?
0.1 0?
26.8 3.21
Rainfall
Inflowpast Cairo
Evapo aquacult.
12
1?
31
9 Discussion
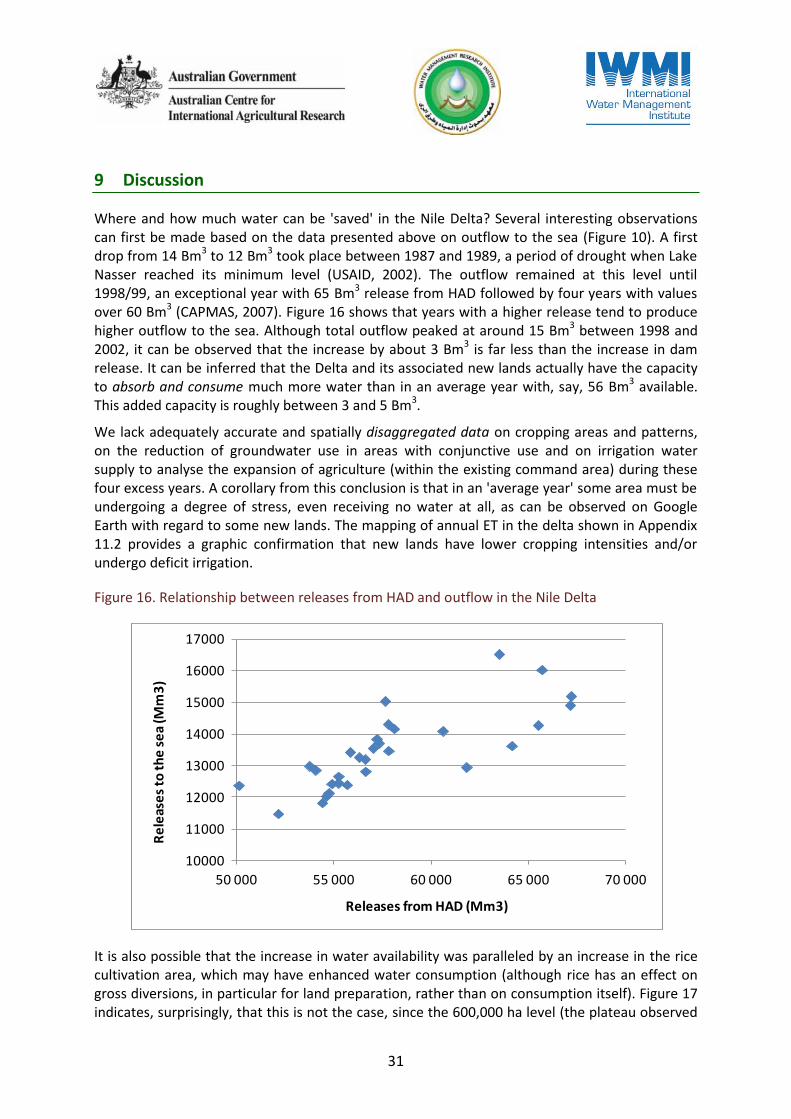
Where and how much water can be 'saved' in the Nile Delta? Several interesting observations can first be made based on the data presented above on outflow to the sea (Figure 10). A first drop from 14 Bm3 to 12 Bm3 took place between 1987 and 1989, a period of drought when Lake Nasser reached its minimum level (USAID, 2002). The outflow remained at this level until 1998/99, an exceptional year with 65 Bm3 release from HAD followed by four years with values over 60 Bm3 (CAPMAS, 2007). Figure 16 shows that years with a higher release tend to produce higher outflow to the sea. Although total outflow peaked at around 15 Bm3 between 1998 and 2002, it can be observed that the increase by about 3 Bm3 is far less than the increase in dam release. It can be inferred that the Delta and its associated new lands actually have the capacity to absorb and consume much more water than in an average year with, say, 56 Bm3 available. This added capacity is roughly between 3 and 5 Bm3.
We lack adequately accurate and spatially disaggregated data on cropping areas and patterns, on the reduction of groundwater use in areas with conjunctive use and on irrigation water supply to analyse the expansion of agriculture (within the existing command area) during these four excess years. A corollary from this conclusion is that in an 'average year' some area must be undergoing a degree of stress, even receiving no water at all, as can be observed on Google Earth with regard to some new lands. The mapping of annual ET in the delta shown in Appendix 11.2 provides a graphic confirmation that new lands have lower cropping intensities and/or undergo deficit irrigation.
Figure 16. Relationship between releases from HAD and outflow in the Nile Delta
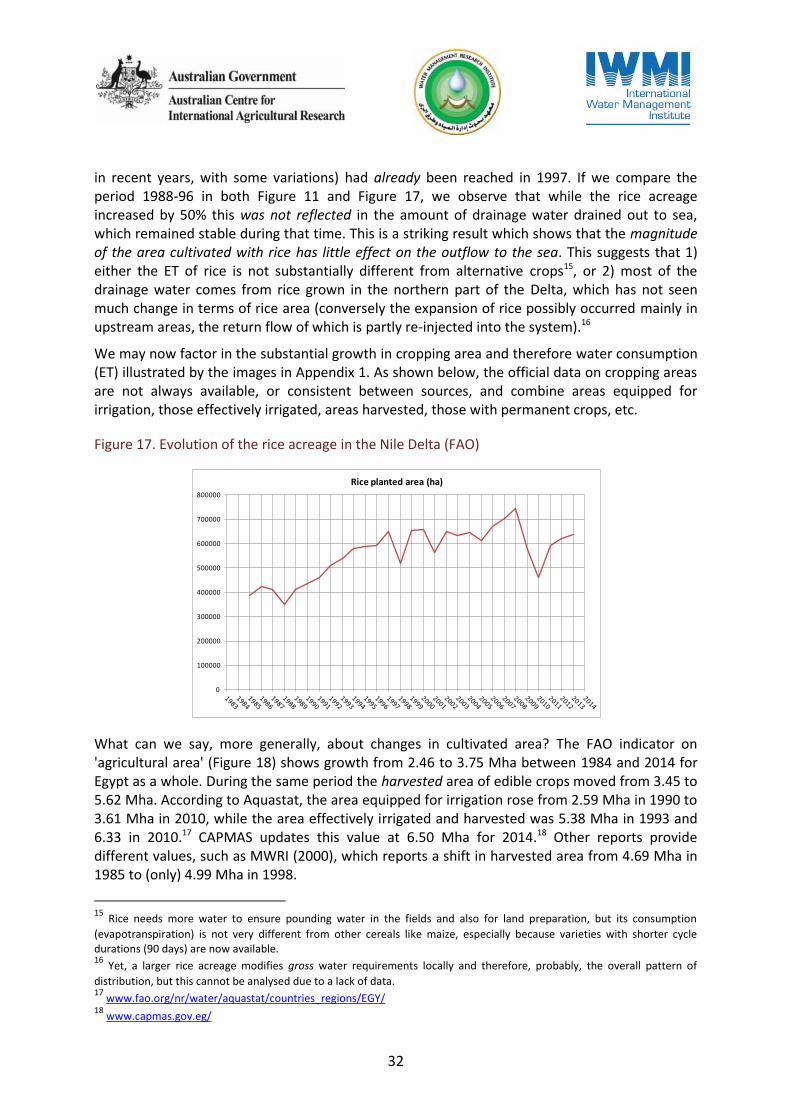
It is also possible that the increase in water availability was paralleled by an increase in the rice cultivation area, which may have enhanced water consumption (although rice has an effect on gross diversions, in particular for land preparation, rather than on consumption itself). Figure 17 indicates, surprisingly, that this is not the case, since the 600,000 ha level (the plateau observed
10000
11000
12000
13000
14000
15000
16000
17000
50 000 55 000 60 000 65 000 70 000
Re
leas
es
to t
he
se
a (M
m3
)
Releases from HAD (Mm3)
32
in recent years, with some variations) had already been reached in 1997. If we compare the period 1988-96 in both Figure 11 and Figure 17, we observe that while the rice acreage increased by 50% this was not reflected in the amount of drainage water drained out to sea, which remained stable during that time. This is a striking result which shows that the magnitude of the area cultivated with rice has little effect on the outflow to the sea. This suggests that 1) either the ET of rice is not substantially different from alternative crops15, or 2) most of the drainage water comes from rice grown in the northern part of the Delta, which has not seen much change in terms of rice area (conversely the expansion of rice possibly occurred mainly in upstream areas, the return flow of which is partly re-injected into the system).16
We may now factor in the substantial growth in cropping area and therefore water consumption (ET) illustrated by the images in Appendix 1. As shown below, the official data on cropping areas are not always available, or consistent between sources, and combine areas equipped for irrigation, those effectively irrigated, areas harvested, those with permanent crops, etc.
Figure 17. Evolution of the rice acreage in the Nile Delta (FAO)
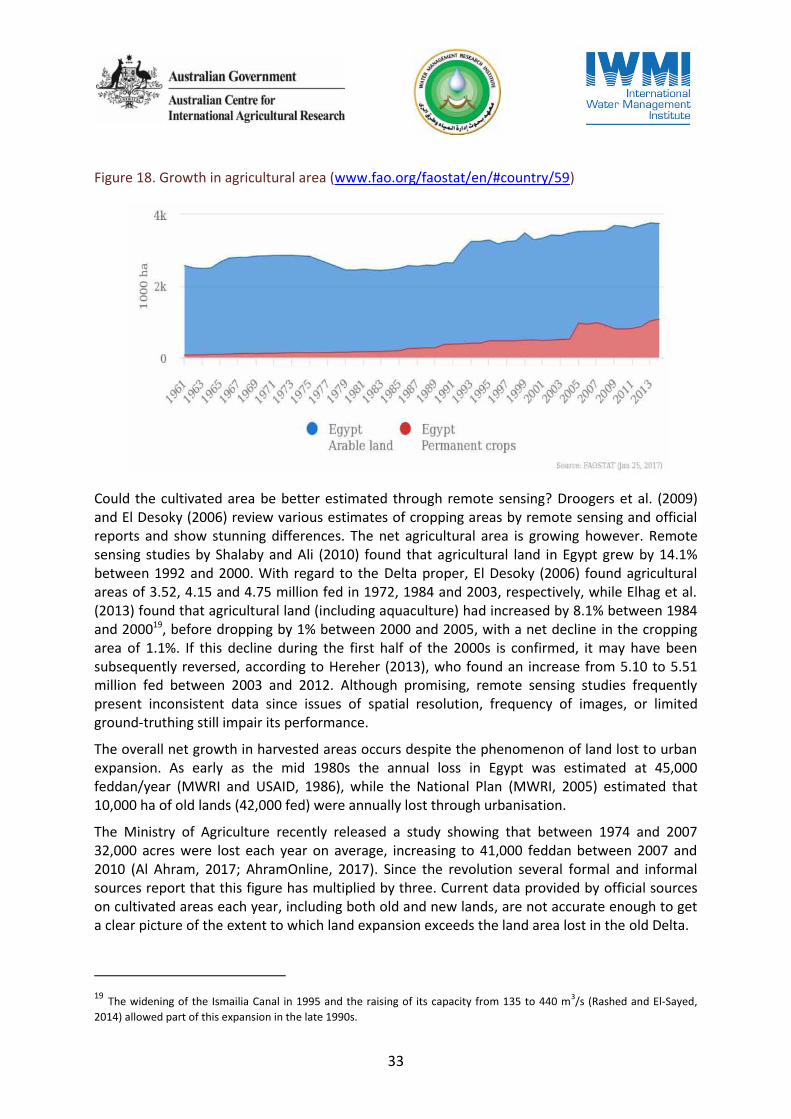
What can we say, more generally, about changes in cultivated area? The FAO indicator on 'agricultural area' (Figure 18) shows growth from 2.46 to 3.75 Mha between 1984 and 2014 for Egypt as a whole. During the same period the harvested area of edible crops moved from 3.45 to 5.62 Mha. According to Aquastat, the area equipped for irrigation rose from 2.59 Mha in 1990 to 3.61 Mha in 2010, while the area effectively irrigated and harvested was 5.38 Mha in 1993 and 6.33 in 2010.17 CAPMAS updates this value at 6.50 Mha for 2014.18 Other reports provide different values, such as MWRI (2000), which reports a shift in harvested area from 4.69 Mha in 1985 to (only) 4.99 Mha in 1998.
15
Rice needs more water to ensure pounding water in the fields and also for land preparation, but its consumption
(evapotranspiration) is not very different from other cereals like maize, especially because varieties with shorter cycle durations (90 days) are now available. 16
Yet, a larger rice acreage modifies gross water requirements locally and therefore, probably, the overall pattern of
distribution, but this cannot be analysed due to a lack of data. 17
www.fao.org/nr/water/aquastat/countries_regions/EGY/ 18
www.capmas.gov.eg/
0
100000
200000
300000
400000
500000
600000
700000
800000
Rice planted area (ha)
33
Figure 18. Growth in agricultural area (www.fao.org/faostat/en/#country/59)
Could the cultivated area be better estimated through remote sensing? Droogers et al. (2009) and El Desoky (2006) review various estimates of cropping areas by remote sensing and official reports and show stunning differences. The net agricultural area is growing however. Remote sensing studies by Shalaby and Ali (2010) found that agricultural land in Egypt grew by 14.1% between 1992 and 2000. With regard to the Delta proper, El Desoky (2006) found agricultural areas of 3.52, 4.15 and 4.75 million fed in 1972, 1984 and 2003, respectively, while Elhag et al. (2013) found that agricultural land (including aquaculture) had increased by 8.1% between 1984 and 200019, before dropping by 1% between 2000 and 2005, with a net decline in the cropping area of 1.1%. If this decline during the first half of the 2000s is confirmed, it may have been subsequently reversed, according to Hereher (2013), who found an increase from 5.10 to 5.51 million fed between 2003 and 2012. Although promising, remote sensing studies frequently present inconsistent data since issues of spatial resolution, frequency of images, or limited ground-truthing still impair its performance.
The overall net growth in harvested areas occurs despite the phenomenon of land lost to urban expansion. As early as the mid 1980s the annual loss in Egypt was estimated at 45,000 feddan/year (MWRI and USAID, 1986), while the National Plan (MWRI, 2005) estimated that 10,000 ha of old lands (42,000 fed) were annually lost through urbanisation.
The Ministry of Agriculture recently released a study showing that between 1974 and 2007 32,000 acres were lost each year on average, increasing to 41,000 feddan between 2007 and 2010 (Al Ahram, 2017; AhramOnline, 2017). Since the revolution several formal and informal sources report that this figure has multiplied by three. Current data provided by official sources on cultivated areas each year, including both old and new lands, are not accurate enough to get a clear picture of the extent to which land expansion exceeds the land area lost in the old Delta.
19 The widening of the Ismailia Canal in 1995 and the raising of its capacity from 135 to 440 m3/s (Rashed and El-Sayed,
2014) allowed part of this expansion in the late 1990s.
34
Despite some inconsistency in data, the net increase in the cultivated area shows that land expansion has outpaced reduction through urbanisation, though the magnitude of this is uncertain as are the respective contributions of surface and groundwater.
The conclusion is that despite the expansion of agriculture and despite the growing share of rice in the crop mix the amount of outflow to the sea has remained largely stable. It is striking to note that since 1985 the outflow to the sea has remained at (around) 13 Bm3, with occasional higher values largely explained by higher releases from HAD (Figure 16). One would have expected that the net increase in cultivated/harvested area in both the Delta and the valley would cause greater ET, meaning less outflow to the sea. The latter is the return flow of an irrigation process that has changed little in terms of technique, although the gradual installation of subsurface drainage across the entire Delta, combined with the increase in rice cultivation, must have worked to increase the drainage flow. This trend may have been counterbalanced by lower per-feddan water application and consumption on an expanding land and by inland aquaculture,20 which has largely developed based on drainage water. It is hard to disentangle these various and counteracting trends based on the available data.
The question remains as to where the increased water consumption has come from, besides excess years such as those following 1998. Possible answers are 1) deficit irrigation in some parts of the Delta (less water being distributed, creating local water shortages21); 2) a depletion of the aquifer, which may be affecting the prevailing balance between freshwater percolation and seawater intrusion but has not yet manifested itself in a clear way, other than in the western Delta; 3) a reduction in crop requirements associated with a change in the crop mix (not investigated in this report for lack of data but unlikely to be substantial); 4) an overestimation of cultivated areas22; 5) an increase in upward seepage in the north of the Delta.23
The crop mix is largely stable because a large area of the Delta is dedicated to wheat and rice (partly for home consumption), bersim and maize (for animals), cotton and vegetables. This basic crop mix is rather stable and cannot be altered dramatically. The exception is perhaps the total rice area, but even a drop from 1,500,000 to 700,000 fed affects only 10% of the Delta, with ET consumption differences with regard to alternative crops that are, in addition, not huge.
For a given volume released from the HAD, and a constant outflow, real savings can also come from improved on-farm practices that reduce soil evaporation and unproductive losses, such as laser levelling, lining of marwas (quaternary ditches), distribution of water through piped networks (see Molle et al., 2015), mulching and raised beds (Karrou et al., 2011)24. These measures have been and are being implemented by the Ministry of Agriculture and farmers but have not been systematized.
20
'Inland aquaculture has developed in the official irrigation command area. It is illegal to use irrigation water for
aquaculture but those farms largely abstract water from drains in areas where irrigation water is too uncertain to grow crops. 21
There are frequent reports of such shortages; see for example Almasry Alyoum, 2010a, 2010b; Egypt Independent, 2016. 22
According to an international expert with longstanding experience in Egypt, figures from the Ministry of Agriculture are
known to be overestimated because officials are 'stuck with their own [planning] targets' and are reluctant to report under-achievement (Pers. Comm. 2009). 23
This does not seem to be the case because the salt load pumped out to sea, as calculated by DRI and available in its
yearbooks, does not show any rising trend. 24
See www.icarda.org/sites/default/files/u158/Science%20Impact%20Raised-Bed_final.pdf,
35
Though limited, opportunities remain to reduce non-beneficial water consumption at the system level, for example through:
the maintenance of drains in upper Egypt, which are clogged up with weeds, preventing proper drainage and causing higher evaporation losses (Hegazy and Nadr, 1995)
the reduction of return flows to Lake Qaroun, the sink of drainage flows in Fayoum
the improvement of irrigation efficiency in parts of the new lands (e.g. in Nubaria and along the Ismailia canal) to avoid percolation to saline aquifers and/or water-logging
the treatment of polluted water currently going to the sea because it cannot be taken up by reuse pump stations.
Because return flows are partly recycled or needed to maintain an adequate salt balance in the system (not mentioning to flush pollution), improvements in plot-level efficiency do not necessarily translate into gain at the system level. Although MWRI well acknowledges the scale-sensitive nature of water-use efficiency, this is not generally the case elsewhere. Egyptian newspapers frequently refer to alleged wastage of water resources, some claiming that 12 Bm3 are 'wasted'. This lack of understanding of the situation is passed on to the public. Consumption and diversion (or gross and net water-use values) are taken as equivalent25, which is not the case because of the high degree of drainage water reuse. It is announced that a drop in rice cultivation from 2.2 to 1.2 million feddan 'saved 6 Bm3 of water' (Almasry Alyoum, 2010a), while the target of '18.5 million cubic metres of recycled waste water' is understood as an addition to the available resource (Almasry Alyoum, 2010b). Such misunderstandings can even lead to absurd projects, such as the idea of conveying and distributing HAD waters through pipes on both sides of the Nile with the promise of increasing the agricultural area by 7 million feddans (Al Ahram Hebdo, 2013), dubbed the 'third Egyptian irrigation revolution'. Even taking into account journalists' simplifications and confusion this may suggest a priority given to political announcements that is unhelpful in analysing the situation and devising adequate responses.
The 'Sustainable Agricultural Development Strategy towards 2030' developed in the late 2000s by the MALR (ARDC, 2009) comprehensively considered the various dimensions of agricultural production. With regard to water management its ambition was to improve water-use efficiency from 50% to 80% by 2013, which "would save quantities of water estimated at 5.3 and 12.4 Bm3 by the years 2017 and 2030 respectively" and allow an expansion of 5 million feddan. These are puzzling numbers since it is hard to imagine how a quantity of 12.4 Bm3, roughly the outflow to the sea, could be relocated to new lands. It would mean no water being allowed to reach the sea and a rapid collapse of the Delta due to extreme concentrations of salts and pollution. Such efficiency targets – "5 million feddan [converted] in 10 years, which will contribute to the provision of 10 Bm3 of water" – are announced by some officials and spread by the media (Daily News Egypt, 2014; Amwal Al Ghad, 2015). Such fanciful numbers fail to understand the difference between water-use efficiency on the plot and in the system (Delta) – an issue that was identified and discussed as far back as the mid-1990s within the MWRI.
25
For example: "Rice cultivation consumes between 6000 and 7000 cubic meters, in contrast to the 3000 cubic meters
consumed by other summer crops. The increase in rice cultivation area from 1.76 million acres to around 2 million acres is matched by a rise in water consumption ranging from 2 to 4 billion cubic meters of water" (Daily News Egypt, 2013).
36
To illustrate the fact that the Delta must be understood based on a zoning of salt and pollution generation, efficiency improvements and reuse, Figure 19 distinguished between several zones within the central Delta:
1A: this area drains back by gravity to the Rosetta branch. Improving efficiency will not make more water available and is not therefore a target per se.
1B: in this area drainage water is partly reused by pumping into Bahr Shehbin and Damietta branch, but reuse is limited by degraded water quality. Water savings are partly beneficial.
2A: Nashart drain flows into Lake Burullus. The upper part of this drainage unit has limited salinity but collects pollutants. The downstream Meet Yazid command area reuses the drain’s water for lack of fresh water supply although theoretically its quality does not allow this (see IWMI and WMRI, 2013). The lower part (2A') is highly saline. Irrigation efficiency could be increased beneficially in both these areas by using the saved fresh water from the canal network instead of reusing the more saline and polluted drainage water.
2B: Gharbia Drain upper catchment (2B) has its water partly pumped into Meet Yazid at Mahalat Ruh pumping station (PS). 2B' reach generates drainage water with low salinity, while the 2B'' reach generates highly saline drainage water. The mixture is still partly usable at Hamol PS, with pollution as a more serious constraint. Efficiency improvements in 2B would increase salinity beyond current values (1,500 mg/l), which would affect the possibility of reuse.
3A, 3B also generate very saline return flows that should not be, but are partly, reused, because no alternative water sources exist. Reducing return flow will raise salinity but coastal aquaculture would not be affected.
3C corresponds to Drain 1 and Drain 2: drainage water is partly reused in Qalaphso/Zian area (3E). Higher salinity would mean that only reuse for aquaculture is possible (already the case in half the area).
3D is irrigated through a mix of water from Tira Branch canal and Gharbia drain water (through Hamol PS). Both pollution and current salinity levels are constraints to reuse that would be compounded by improved efficiency upstream.
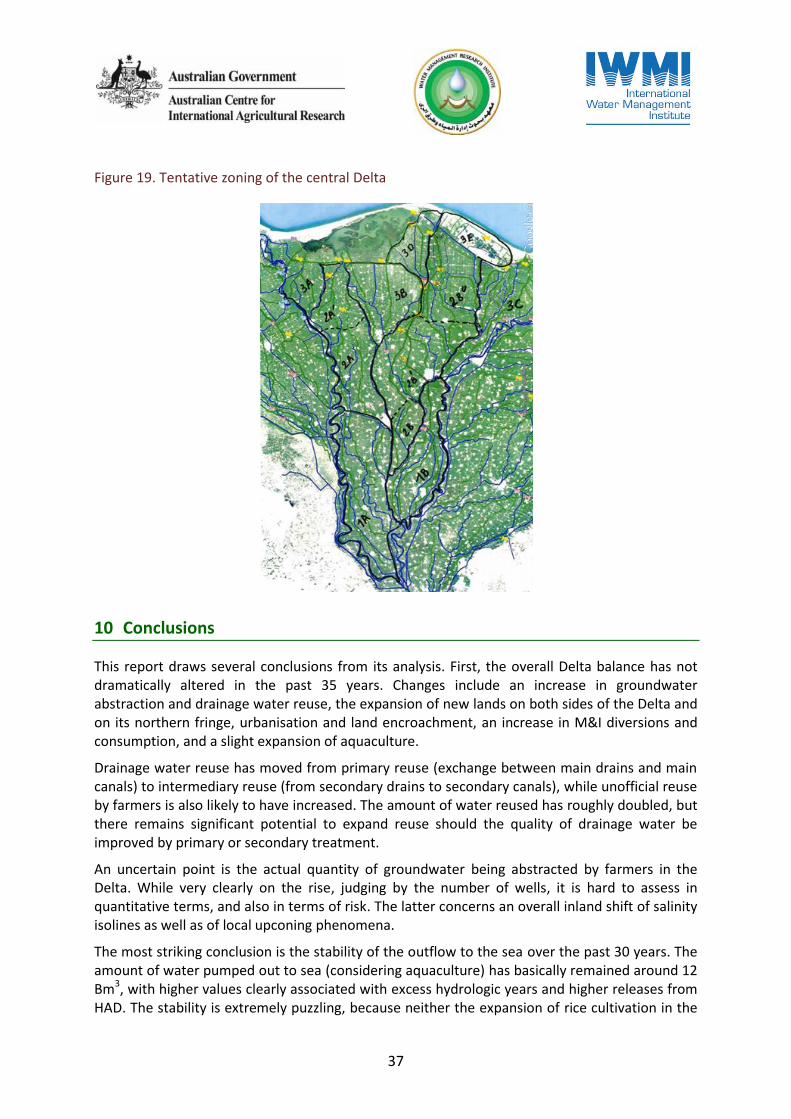
37
Figure 19. Tentative zoning of the central Delta
10 Conclusions
This report draws several conclusions from its analysis. First, the overall Delta balance has not dramatically altered in the past 35 years. Changes include an increase in groundwater abstraction and drainage water reuse, the expansion of new lands on both sides of the Delta and on its northern fringe, urbanisation and land encroachment, an increase in M&I diversions and consumption, and a slight expansion of aquaculture.
Drainage water reuse has moved from primary reuse (exchange between main drains and main canals) to intermediary reuse (from secondary drains to secondary canals), while unofficial reuse by farmers is also likely to have increased. The amount of water reused has roughly doubled, but there remains significant potential to expand reuse should the quality of drainage water be improved by primary or secondary treatment.
An uncertain point is the actual quantity of groundwater being abstracted by farmers in the Delta. While very clearly on the rise, judging by the number of wells, it is hard to assess in quantitative terms, and also in terms of risk. The latter concerns an overall inland shift of salinity isolines as well as of local upconing phenomena.
The most striking conclusion is the stability of the outflow to the sea over the past 30 years. The amount of water pumped out to sea (considering aquaculture) has basically remained around 12 Bm3, with higher values clearly associated with excess hydrologic years and higher releases from HAD. The stability is extremely puzzling, because neither the expansion of rice cultivation in the
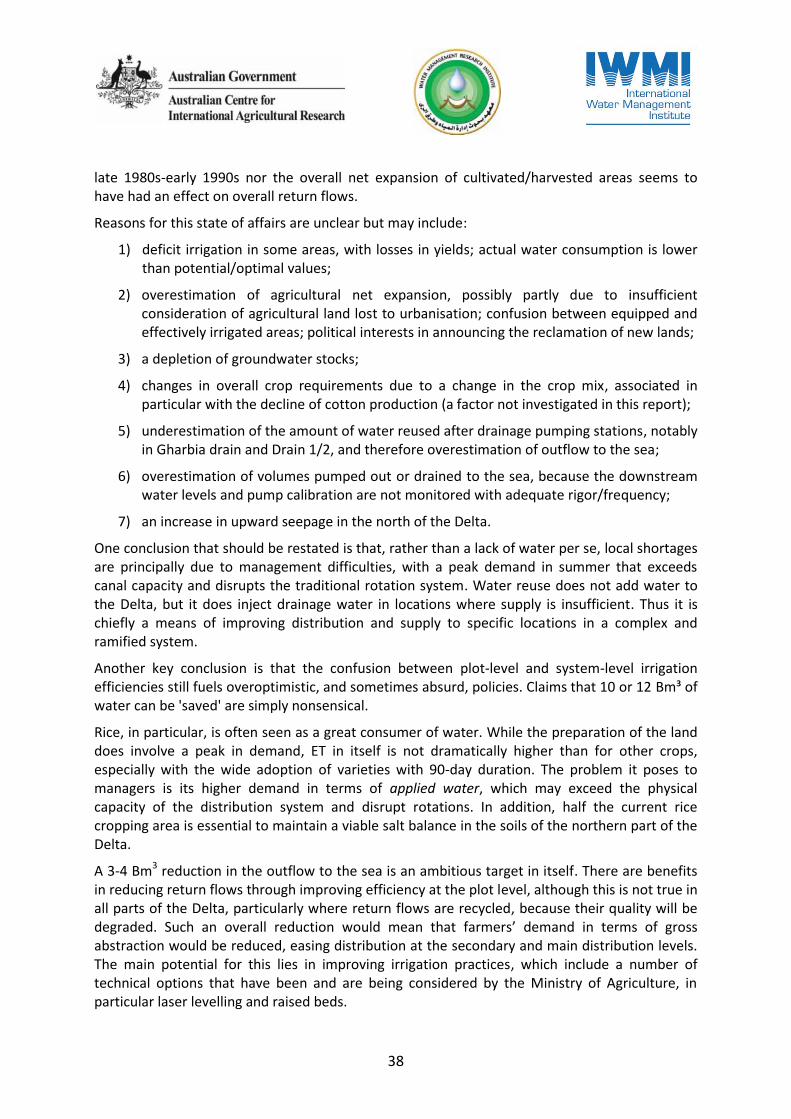
38
late 1980s-early 1990s nor the overall net expansion of cultivated/harvested areas seems to have had an effect on overall return flows.
Reasons for this state of affairs are unclear but may include:
1) deficit irrigation in some areas, with losses in yields; actual water consumption is lower than potential/optimal values;
2) overestimation of agricultural net expansion, possibly partly due to insufficient consideration of agricultural land lost to urbanisation; confusion between equipped and effectively irrigated areas; political interests in announcing the reclamation of new lands;
3) a depletion of groundwater stocks;
4) changes in overall crop requirements due to a change in the crop mix, associated in particular with the decline of cotton production (a factor not investigated in this report);
5) underestimation of the amount of water reused after drainage pumping stations, notably in Gharbia drain and Drain 1/2, and therefore overestimation of outflow to the sea;
6) overestimation of volumes pumped out or drained to the sea, because the downstream water levels and pump calibration are not monitored with adequate rigor/frequency;
7) an increase in upward seepage in the north of the Delta.
One conclusion that should be restated is that, rather than a lack of water per se, local shortages are principally due to management difficulties, with a peak demand in summer that exceeds canal capacity and disrupts the traditional rotation system. Water reuse does not add water to the Delta, but it does inject drainage water in locations where supply is insufficient. Thus it is chiefly a means of improving distribution and supply to specific locations in a complex and ramified system.
Another key conclusion is that the confusion between plot-level and system-level irrigation efficiencies still fuels overoptimistic, and sometimes absurd, policies. Claims that 10 or 12 Bm³ of water can be 'saved' are simply nonsensical.
Rice, in particular, is often seen as a great consumer of water. While the preparation of the land does involve a peak in demand, ET in itself is not dramatically higher than for other crops, especially with the wide adoption of varieties with 90-day duration. The problem it poses to managers is its higher demand in terms of applied water, which may exceed the physical capacity of the distribution system and disrupt rotations. In addition, half the current rice cropping area is essential to maintain a viable salt balance in the soils of the northern part of the Delta.
A 3-4 Bm3 reduction in the outflow to the sea is an ambitious target in itself. There are benefits in reducing return flows through improving efficiency at the plot level, although this is not true in all parts of the Delta, particularly where return flows are recycled, because their quality will be degraded. Such an overall reduction would mean that farmersʼ demand in terms of gross abstraction would be reduced, easing distribution at the secondary and main distribution levels. The main potential for this lies in improving irrigation practices, which include a number of technical options that have been and are being considered by the Ministry of Agriculture, in particular laser levelling and raised beds.
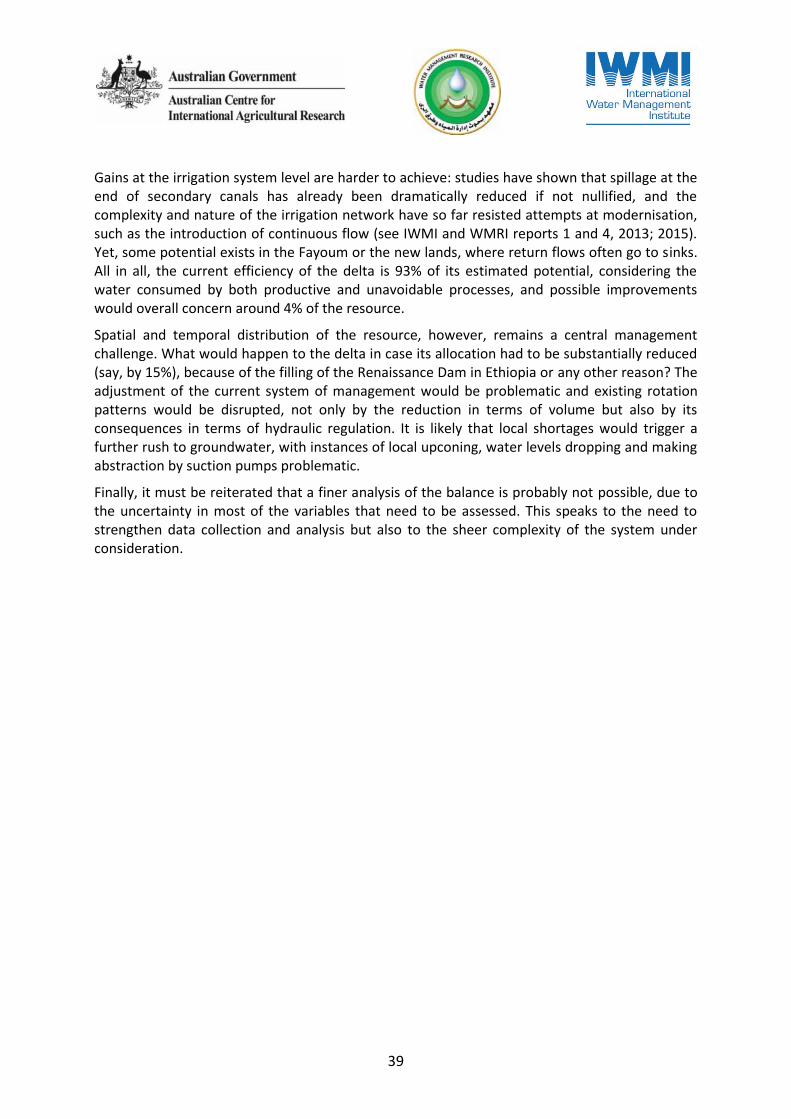
39
Gains at the irrigation system level are harder to achieve: studies have shown that spillage at the end of secondary canals has already been dramatically reduced if not nullified, and the complexity and nature of the irrigation network have so far resisted attempts at modernisation, such as the introduction of continuous flow (see IWMI and WMRI reports 1 and 4, 2013; 2015). Yet, some potential exists in the Fayoum or the new lands, where return flows often go to sinks. All in all, the current efficiency of the delta is 93% of its estimated potential, considering the water consumed by both productive and unavoidable processes, and possible improvements would overall concern around 4% of the resource.
Spatial and temporal distribution of the resource, however, remains a central management challenge. What would happen to the delta in case its allocation had to be substantially reduced (say, by 15%), because of the filling of the Renaissance Dam in Ethiopia or any other reason? The adjustment of the current system of management would be problematic and existing rotation patterns would be disrupted, not only by the reduction in terms of volume but also by its consequences in terms of hydraulic regulation. It is likely that local shortages would trigger a further rush to groundwater, with instances of local upconing, water levels dropping and making abstraction by suction pumps problematic.
Finally, it must be reiterated that a finer analysis of the balance is probably not possible, due to the uncertainty in most of the variables that need to be assessed. This speaks to the need to strengthen data collection and analysis but also to the sheer complexity of the system under consideration.
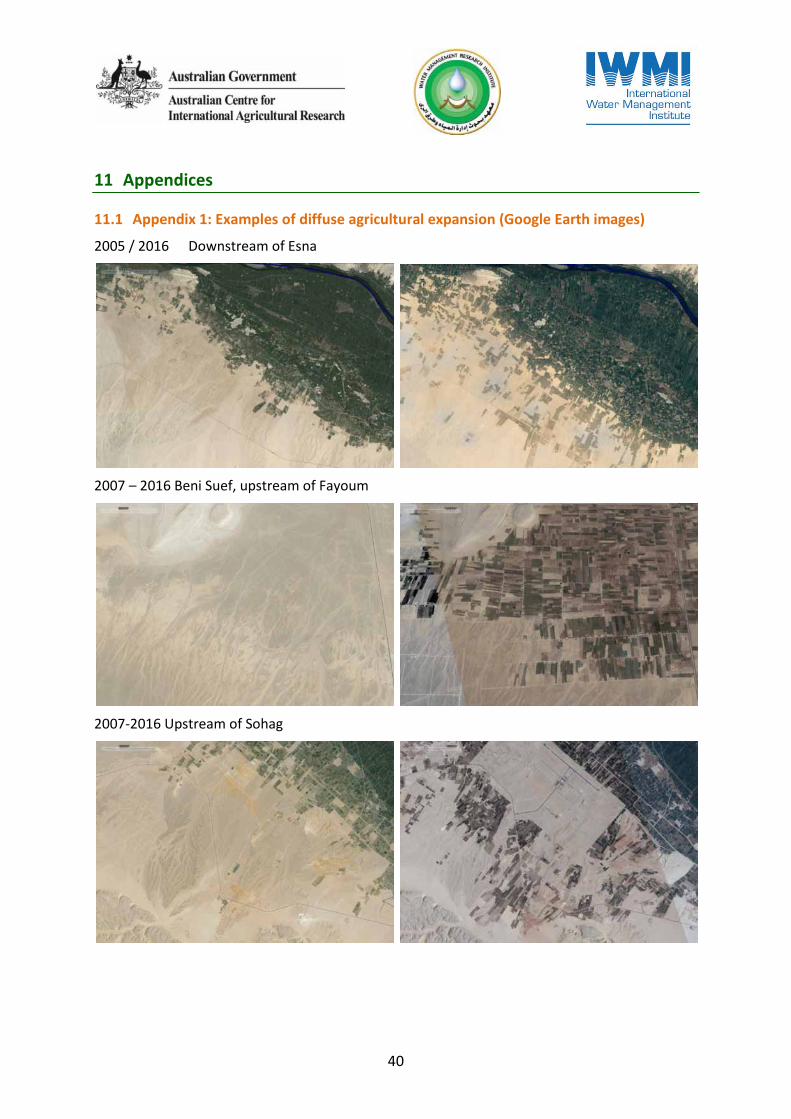
40
11 Appendices
11.1 Appendix 1: Examples of diffuse agricultural expansion (Google Earth images)
2005 / 2016 Downstream of Esna
2007 – 2016 Beni Suef, upstream of Fayoum
2007-2016 Upstream of Sohag
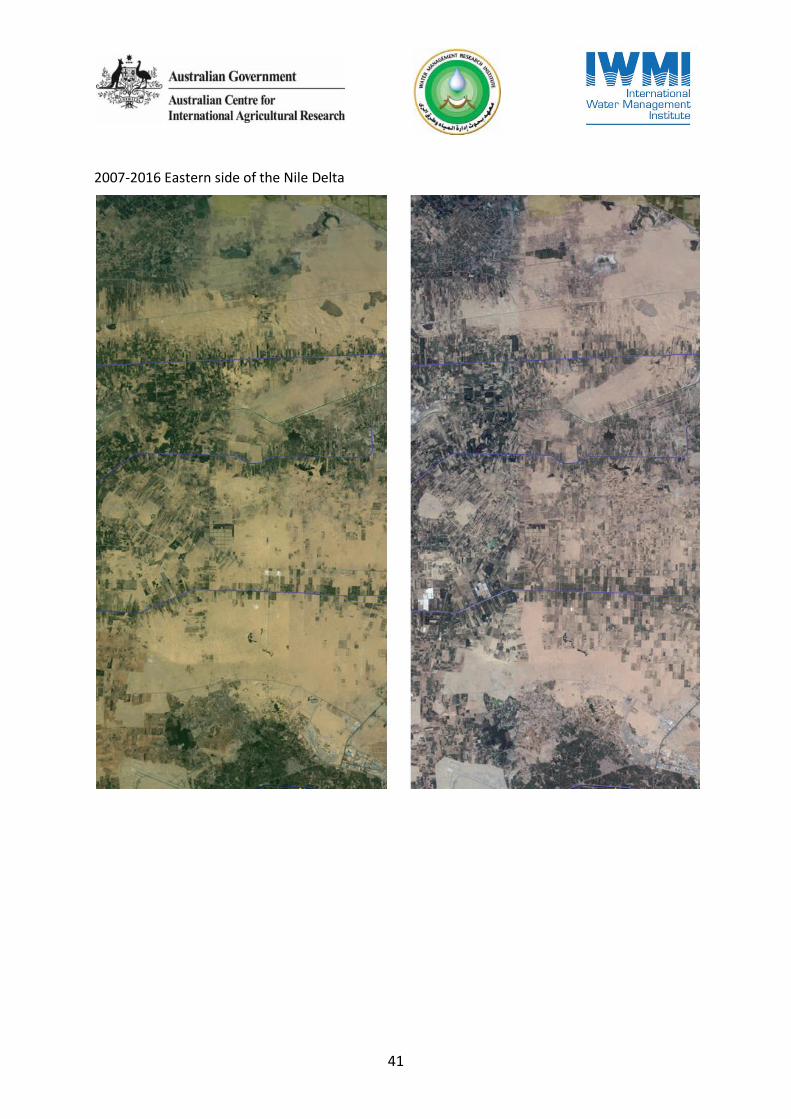
41
2007-2016 Eastern side of the Nile Delta
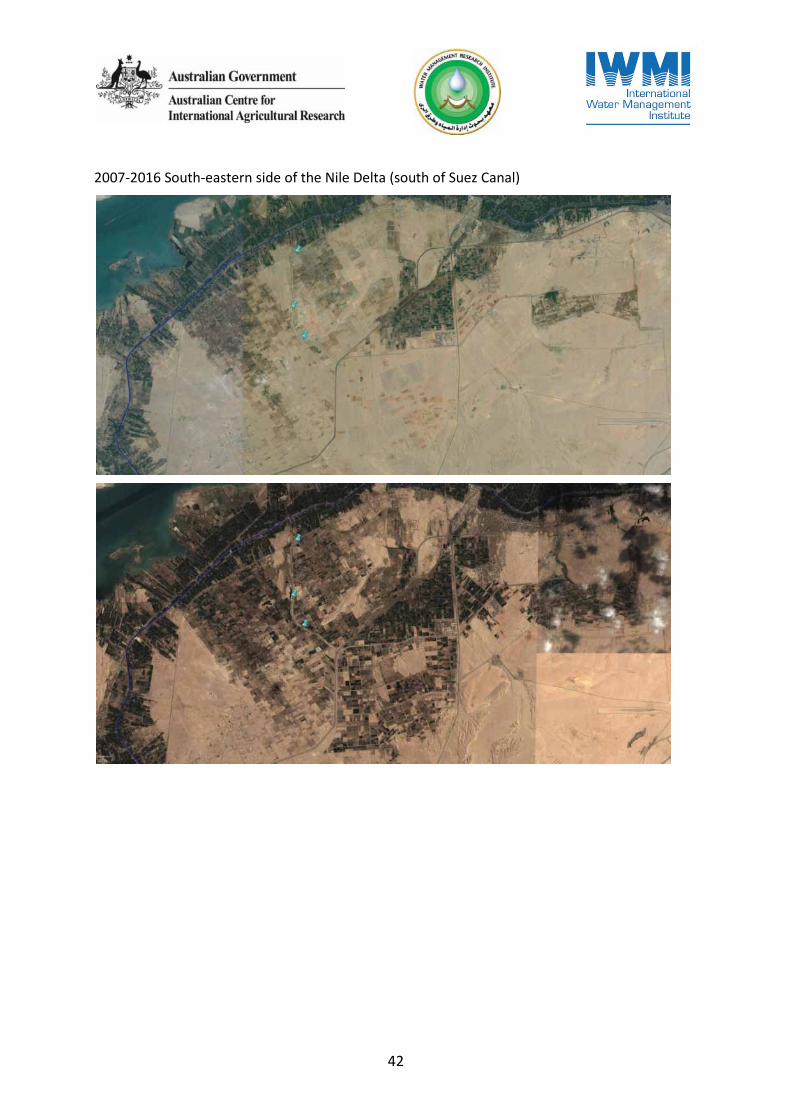
42
2007-2016 South-eastern side of the Nile Delta (south of Suez Canal)
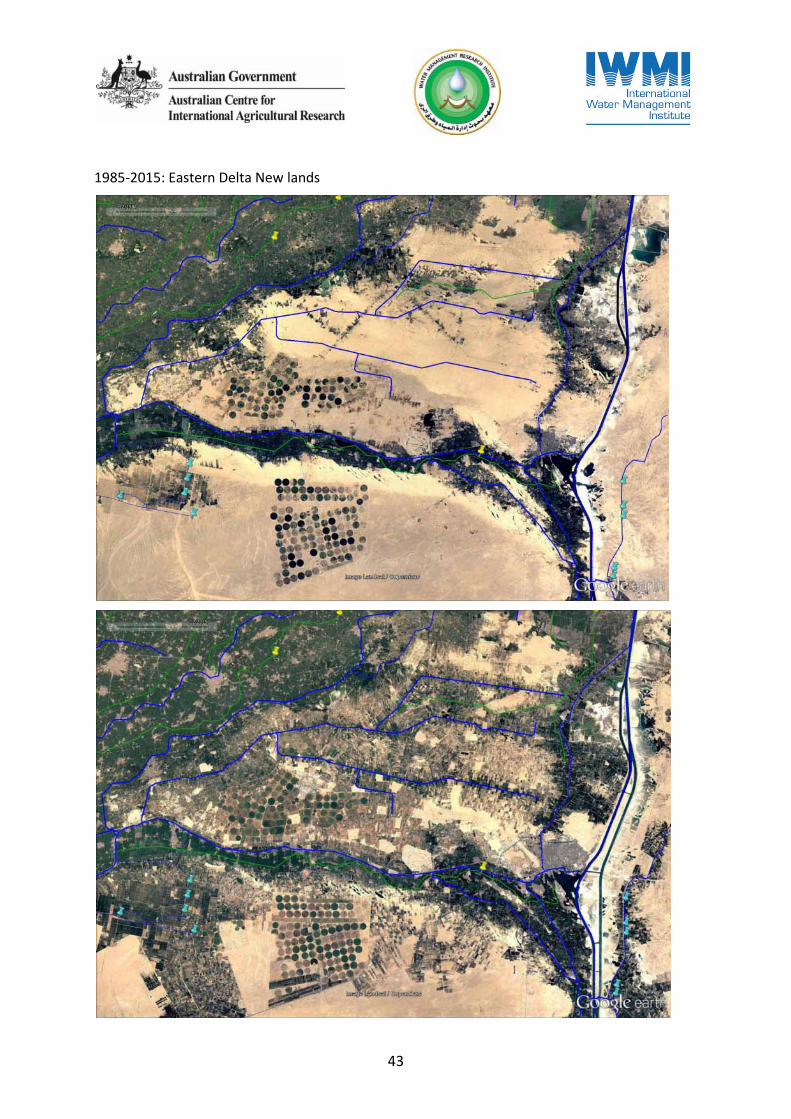
43
1985-2015: Eastern Delta New lands
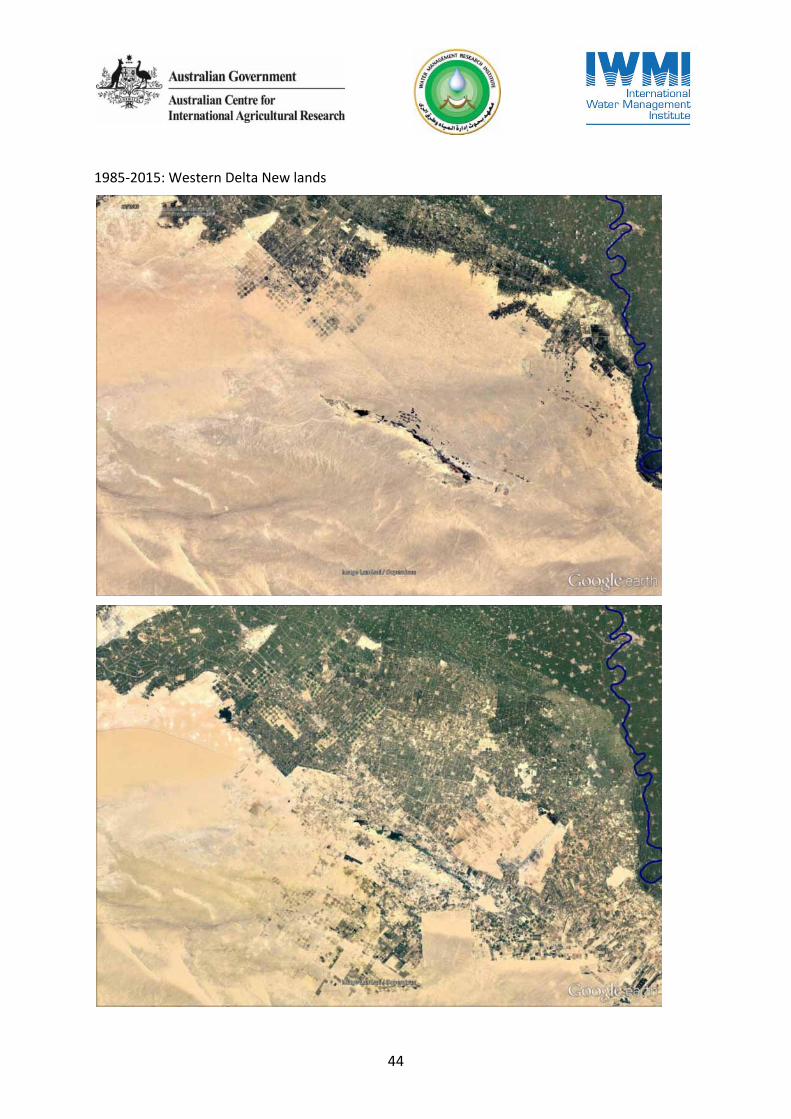
44
1985-2015: Western Delta New lands

45
1984-2016: Western Delta new lands (zoom on Sadat City)
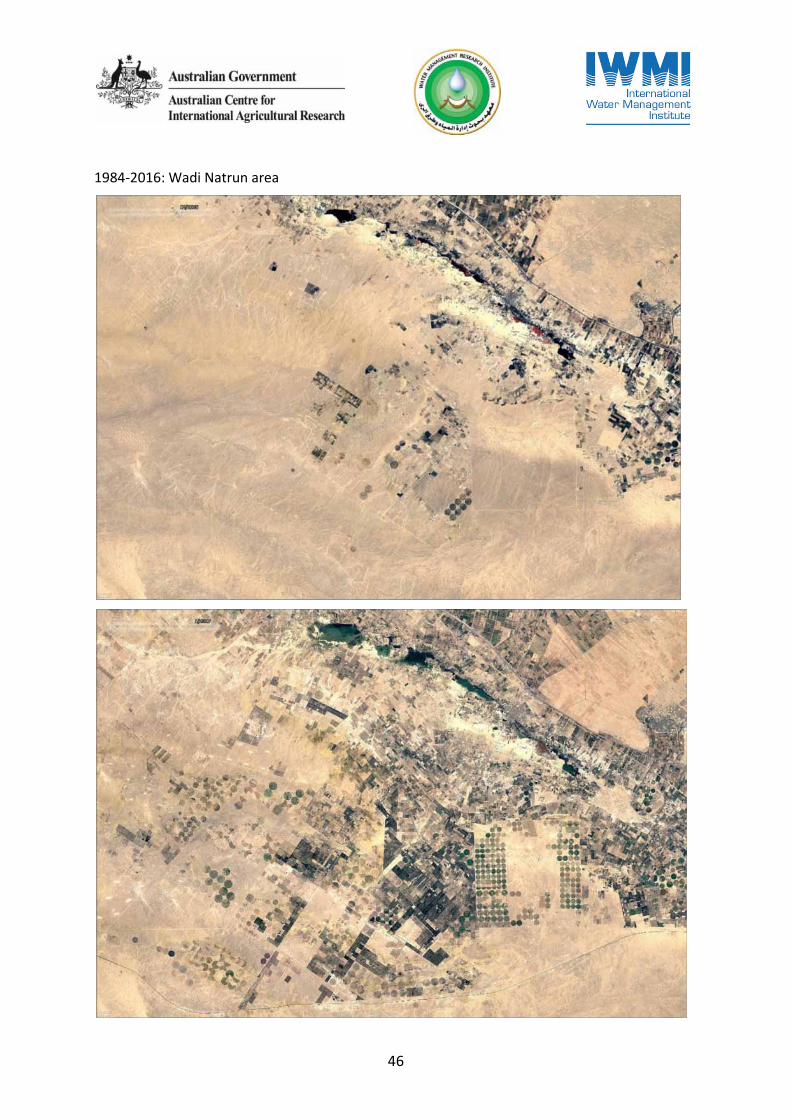
46
1984-2016: Wadi Natrun area

47
11.2 Appendix 2: Map showing the spatial distribution of annual ET in the Nile delta and fringes
Source: http://www.fao.org/in-action/remote-sensing-for-water-productivity/wapor/en/#/catalog/en
48
12 References
Abdel Gawad, S. 2015. Egypt strategy for climate change adaptation for water security. Powerpoint presentation.
Abdel-Aziz, Y. 2003. Decentralisation and water user participation. Water Demand Management Forum. IDRC.
Abdel-Dayem, S.; Abdel-Gawad, S. and Fahmy, H. 2007. Drainage in Egypt: a story of determination, continuity, and success. Irrigation and Drainage 56: S101–S111 (2007).
Abu Al-Izz, M.S. 1971. Land forms of Egypt. The American University in Cairo press, Dar Al Maaref, Cairo, Egypt.
African Water Facility, 2007. Egypt. Comprehensive study and project preparation for the rehabilitation of the Nubaria and Ismailia canals. Appraisal report.
AhramOnline. 2017. Urban encroachment, lost development, and Egypt's next president. Sunday, 15 January 2017.
Al Ahram Hebdo. 2013. Irrigation: Nouveau débat sur les eaux du Nil. 13 au 19 février 2013 - Numéro 961.
Al Ahram. 2017. Experts: Ministry of Irrigation deceived "people and the government". http://agri.ahram.org.eg/News/55542.aspx
Allam, A.; Tawfik, A.; Yoshimura, C. and Fleifle, A. 2016. Simulation-based optimization framework for reuse of agricultural drainage water in irrigation. Journal of Environmental Management 172 (2016) 82e96.
Allam, M.N. and Allam, G.I. 2007. Water Resources In Egypt: Future challenges and opportunities. Water International 32(2): 205-218.
Allam, M.N and Abdel-Azim, R. 2007. Review and analysis of water use efficiency and water productivity in Egypt. Options Méditerranéennes, Series B, n°57 Water Use Efficiency and Water Productivity.
Almasry Alyoum. 2010a. New irrigation policy saved water, says minster. 19 - 08 – 2010.
Almasry Alyoum. 2010b. Egypt forges strategy to face anticipated water shortages. 29 - 08 – 2010.
Amwal Al Ghad. 2015. Field irrigation project to provide 7%-10% increase in cultivated land: Beltagy. 09 - 02 – 2015.
APP (Egyptian‐Dutch Advisory Panel on Water Management). 2005. Workshop on intermediate reuse of drainage water. Cairo, Egypt, June, 23 ‐ 2005.
ARDC (Agricultural Research and Development Council). 2009. Sustainable agricultural development strategy towards 2030. Cairo: Ministry of Agriculture and Land Reclamation, Egypt.
Attia, B.B. 1996. A framework for the development of Egypt's national water policy. Ministry of Public Works and Water Resources, Cairo, Egypt.
Attwa, M.; Gemail, KS; Eleraki, M. 2016. Use of salinity and resistivity measurements to study the coastal aquifer salinization in a semi-arid region: a case study in northeast Nile Delta, Egypt. Environ Earth Sci (2016) 75:784.
Barnes, J. 2012. Pumping possibility: Agricultural expansion through desert reclamation in Egypt. Social Studies of Science 42(4) 517-538.
Bazaraa, A.S. 2002. Reuse of agricultural drainage water: revision of the reuse mixing policy. Cairo: Advisory Panel Project on Water Management.
CAPMAS. 2007. Bulletin of water resources & irrigation.
Daily News Egypt. 2013. Canals proposed to end Egypt's water shortage. 10 - 12 – 2013.
49
Daily News Egypt. 2014. Irrigation development project to provide 10bn cubic metres of water: Agriculture minister. 08 - 07 – 2014.
Diab, MSh; Saleh, M.F. 1981. The hydro geochemistry of the Pleistocene aquifer in the Nile Delta area, Egypt. Environment International, Volume 7, Issue 3, 1982, Pages 221–230.
Dickson; M. 2014. Personnal communication. World Fish.
DRI. 1989. Drainage Research Institute, Cairo, Egypt: Land Drainage in Egypt, edited by: Amer, M. H. and de Ridder, N. A., Drainage Research Institute, Cairo, Egypt.
DRI. 2004. Yearbook 2002/2003. Cairo, Ministry of water and irrigation.
DRI. 2012. Yearbook 20010/2011. Cairo, Ministry of water and irrigation.
DRI. 2013. Yearbook 20010/2011. Cairo, Ministry of water and irrigation.
DRI. 2015. Yearbook 2013/2014. Cairo, Ministry of water and irrigation.
Droogers, P.; Immerzeel, W. and Perry, C. 2009. Application of Remote Sensing in National Water Plans: Demonstration cases for Egypt, Saudi-Arabia and Tunisia. Report FutureWater: 80. Report for the World Bank.
Egypt Independent. 2016. Water shortage ruins crops on 10,000 feddans of Daqahlia farmland. 21-05-2016.
El Kady, M. and D. J. Molden. 1995. Conservation Potential for Egypt's Nile Waters: the Strategic research Program, WRSR Report 22, Ministry of Public Works and Water Resources, National Water Research Center and Winrock International Institute for Agricultural Development.
El Kassar, G.M. 1991. Nile water mlanagement and optimization of the scarce water resources in Egypt. MSc thesis, University of Newcastle upon Tyne.
El Quosy, D.E. 1989. Drainage water re-use projects in the Nile delta: the past, the present and the future. In: MH Amer and NA De Ridder (Eds). Land drainage in Egypt, Drainage Research Institute, Cairo, pp. 163-175.
El Quosy, D.E. 2006. A Study on Matching Irrigation Supply and Demand (MISD). Prepared for Eco ConServ-Environmental Solutions. Cairo – July 2006.
El-Agha, D.E.; Closas, A.; Molle, F. 2015a. Survey of groundwater use in the central part of the Nile Delta, Water and Salt Management in the Nile Delta Project Report No. 6. IWMI, WMRI: Cairo, 2015.
El-Agha, D.E.; Closas, A.; Molle, F. 2015b. Dynamics of groundwater use in the central part of the Nile Delta, Dry Land Systems Report, IWMI, WMRI: Cairo, 2015.
El-Agha, D.; Molle, F.; El Baily, M.; El Desouqy, E.; Abou El-Hassan, W. 2015c. Spatial and temporal variability of water quality in the Nile Delta. Water and Salt Management in the Nile delta Project Report No. 7. IWMI, WMRI: Cairo, 2015.
El-Agha, D.E.; Closas, A. and Molle, F. 2017. Under the radar: Dynamics of groundwater use in the Nile delta. Hydrogeology Journal.
El-Atfy, K.; Abdin, A. and Gaafar, I. 2009. Egyptian water use: patterns, performance and prospective. Draft.
El-Desoky, M. 2006. Monitoring spatial and temporal changes of agricultural lands in the Nile Delta and their implications on soil characteristics using remote sensing. Phd thesis, the University of Arizona.
Elhag, M.; Psilovikos, A. and Sakellariou-Makrantonaki, M. 2013. Land use changes and its impacts on water resources in Nile Delta region using remote sensing techniques. Environment, Development and Sustainability 15(5):1189-1204.
El-Sayed, A. 2011. Drainage Water Management in Egypt. Powerpoint presentation. DRI, Egypt.
El-Sayed, A. 2015. Drainage water reuse strategic options and measures to alleviate risk of failure, Egypt. Powerpoint presentation, ICID 2015, Montpellier. DRI, Egypt.
50
FAO (Food and Agriculture Organization). 2000. Water and agriculture in the Nile Basin. Nile Basin Initiative Report to ICCON, Background Paper prepared by FAO. AGL/MISC/29/2000. Rome: FAO.
FAO. 2011. Synthesis report. FAO-Nile Basin Project GCP/INT/945/ITA. Rome: FAO.
FAO. 2013. Monitoring of climate change risk impacts of sea level rise on groundwater and agriculture in the Nile Delta. TCP/EGY/3301.
Farag, H. 2011. Impact of Climate Change on Water Quality of Northern Lakes in Egypt. National Water Research Center, Egypt. Presentation at Tiger Capacity Building Facility, 4th Workshop, 12-13 December, 2011, South Africa.
Gawad, J. and Bekhit, 2014. Hydrological Assessment of the Moghra Aquifer at Nour Farm, Daltex Corporation. Prepared for GIZ.
Gohar, A.A. and Ward, F.A. 2010. Gains from expanded irrigation water trading in Egypt: An integrated basin approach. Ecological Economics 69(2010): 2535–2548.
Hegazy, A. and Nadr, M. 1995. Management and Operation of the Nile River System To-day. Working Paper Series No. 12-2. Strategic Research Programme. www.fao.org/nr/water/aquastat/countries_regions/EGY/
Hereher, M.E. 2013. The status of Egypt’s agricultural lands using MODIS Aqua data. The Egyptian Journal of Remote Sensing and Space Sciences (2013) 16, 83–89
Hokam, E.M. 2002. Computer-based expert system to optimize the water supply for modern irrigation systems in selected regions in Egypt. PhD Thesis, University of Justus-Liebig.
ICID. 2005. Water Policy Issues of Egypt. Country Policy Support Programme (CPSP) Project funded by The Govt. of The Netherlands.
IRG (International Resources Group); Winrock International; Nile Consultants. 1998. National policy for drainage water reuse. Report No. 8. APRP - Water Policy Reform Program
IWMI and WMRI. 2013. An exploratory survey of water management in the Meet Yazid Canal command area of the Nile Delta. Water and Salt Management in the Nile delta Project Report No. 1. IWMI, WMRI: Cairo, 2013.
Karrou, M., Oweis, T., Benli, B., Swelam, A. (eds) 2011. Improving water and land productivities in irrigated systems. Community-based optimization of the management of scarce water resources in agriculture in CWANA. Report no. 10. International Center for Agricultural Research in the Dry Areas (ICARDA), Aleppo, Syria.
Kashef, AI 1983. Salt Water Intrusion at the Nile River, Ground Water 21(2): 160-167.
Kashef, AI 1982. Harmonizing Ghyben-Herzberg interface with rigorous solutions. Ground Water, 21(1).
Khalil, M.M.; Tokunaga, T. and Yousef, A.F. 2015. Insights from stable isotopes and hydrochemistry to the Quaternary groundwater system, south of the Ismailia canal, Egypt. Journal of Hydrology 527 (2015) 555–564.
Kotb, T.H.S., Watanabe, T.; Ogino, Y. and Tanji, K.K. 2000. Soil salinization in the Nile Delta and related policy issues in Egypt. Agricultural Water Management 43(2000): 239-261.
Mabrouk, MB, Jonoski, A, Solomatine, D, Uhlenbrook, S. 2013. A review of seawater intrusion in the Nile Delta groundwater system – the basis for assessing impacts due to climate changes and water resources development. Hydrology and Earth System Sciences. Discussions, 10, 10873–10911.
MALR (Ministry of Agriculture and Land Reclamation) 2011. Egypt—Country Profile, July 2011. Rome: FAO, <http://www.fao.org/ag/AGP/AGPC/doc/Counprof/Egypt/Egypt.html#intro>.
MetaMeta. 2015. Local Groundwater Management in Moghra Aquifer – Opportunities, requirements, first steps. Main Report.
Mohamed, R.F. and Hua, C.Z. 2010. Regional groundwater flow modeling in Western Nile Delta, Egypt. World Rural Observations 2010, 2(2) http://www.sciencepub.net/rural
51
Molden, D.; El Kady, M. and Zhu, Z. 1996. Nile Water Use: Patterns, Performance, and. WRSR discussion paper series No. 24.
Molden, D.; El Kady, M. and Zhu, Z. 1998. Use and productivity of Egypt's Nile water. USCID 14th Technical Conference.
Molle, F.; Gaafar, I. and El-Agha D.E. 2016. Irrigation efficiency and the Nile Delta water balance. Water and Salt Management in the Nile Delta Project Report No. 9. IWMI, WMRI: Cairo, 2016.
Molle, F.; Rap, E.; Al-Agha, D.E.; Ismail, A.; Abou El Hassan, W. and Freeg, M. 2015. Irrigation Improvement Projects in the Nile Delta: promises, challenges, surprises. Water and Salt Management in the Nile Delta Project Report No. 4. IWMI, WMRI: Cairo, 2015.
Molle, F.; Venot, J.-P., Lannerstad, M.; Hoogesteger, J. 2010. Villains or heroes? Farmers' adjustments to water scarcity. Irrigation and Drainage 59(4): 419-431.
Morsy, WS. 2009. Environmental management to groundwater resources for Nile Delta region, PhD thesis, Faculty of Engineering, Cairo University, Egypt.
MWRI (Ministry of Water Resources and Irrigation). 2000. Crop Water Use and Water Balance of the Nile System. NWRP Technical Report No. 8. National Water Resources Plan for Egypt.
MWRI. 2002. Adopted measures to face major challenges in the Egyptian Water Sector. Cairo: MWRI.
MWRI. 2005. Water for the future. National water resources plan for Egypt 2017. Planning sector of Ministry of Water Resources and Irrigation.
MWRI. 2010. Strategy of Water Resources of Egypt till 2050, Ministry of Water Resources and Irrigation.
MWRI. 2013. NWRP Measures. National Water Resources Plan, Coordination Project (NWRP-CP). Technical Report 44. Ministry of Water Resources and Irrigation – Planning Sector.
MWRI. 2016. Powerpoint. Unpublished data.
MWRI and USAID. 1986. Strategies for irrigation development in Egypt. Water Management Synthesis II, Project Agricultural and Irrigation Engineering.
Nada, A.M. 2017. Assessment for drainage water supplements to the irrigation network at Kalabsho and Zian Area, SOBEK-Application. The Egyptian International Journal of Engineering Sciences and Technology. Vol. 22 (January 2017) 50–57.
Nofal, E.R.; Amer, M.A.; El-Didy, S.M. and Fekry, A.M. 2015. Delineation and modeling of seawater intrusion into the Nile Delta Aquifer: A new perspective. Water Science 29 (2015) 156-166.
NourEddin, M. 2016. Presentation of future water availability and requirements. Powerpoint presentation.
Oosterban, R.J. 1999. Impacts of the irrigation improvement project, Egypt, on drainage requirements and water savings. Unpublished report.
Rashed, A.A. and El-Sayed, E.A. 2014. Simulating Agricultural Drainage Water Reuse Using QUAL2K Model: Case Study of the Ismailia Canal Catchment Area, Egypt. J. Irrig. Drain Eng., 2014, 140(5): -1—1.
RIGW. 1992. Groundwater resources and projection of groundwater development. Water security project, Research Inst. for Groundwater, Kanater El-Khairia, Egypt.
RIGW. 2000. Groundwater Well Inventory in the Nile Valley and Delta. NWRP Technical Report No 4.
RIGW. 2001. Groundwater in the Nile Valley and Delta. NWRP Technical Report No 16.
RIGW. 2003. Impacts of future surface water development on groundwater aquifer system in the west Nile Delta Region. Research Inst. for Groundwater, Kanater El-Khairia, Egypt.
52
RIGW/IWACO. 1990. Hydrogeological inventory and groundwater development plan western Nile Delta region. TN 77.01300-9-02. 59. Research Inst. for Groundwater, Kanater El-Khairia, Egypt.
RISE (Research Institute for a Sustainable Environment). 2013. Case study report. American University of Cairo.
Ritzema, H.P. 2009. Drain for gain. Making water management worth its salt. PhD thesis. UNESCO-IHE Institute for Water Education.
Roest, C.W.J. 1999. Regional water distribution in the Nile delta of Egypt. Draft.
Saleh MF. 1980. Some hydrogeological and hydrochemical studies on the Nile Delta. M.Sc. Thesis, Faculty of Science, Ain Shams University, Egypt.
Seckler, D. 1996. The new era of water resources management. Research Report 1. Colombo, Sri Lanka: International Irrigation Management Institute (IIMI).
Seckler, D. and Altaf, Z. 1997. Use and productivity of the Nile water in Egypt. International Irrigation Management Institue. Colombo, Sri Lanka. Annual report 1997. 12-21.
Sefelnasr, A. and Sherif, M. 2013. Impacts of Seawater Rise on Seawater Intrusion in the Nile Delta Aquifer, Egypt. Groundwater. doi: 10.1111/gwat.12058.
Shah, T. 1993. Groundwater markets and irrigation development: political economy and practical policy. Oxford University Press.
Shalaby, A. and Ali, R.R. 2010. Agricultural land Monitoring in Egypt using NOAA-AVHRR and SPOT Vegetation Data. Nature and Science 2010;8(11)
Sherif, M. 1999. The Nile Delta Aquifer in Egypt. Seawater Intrusion in Coastal Aquifers, Chapter 17 concepts methods and practices, edited by: Bear, J., Cheng, A., Sorek, S., Ouazar, D., and Herrera, A., Theory and Application of Transport in Porous Media, Kluwer academic publishers, the Netherlands, 14, 559–590.
Sherif, MA, Sefelnasr, A, Javadi 2012. Incorporating the concept of equivalent freshwater head in successive horizontal simulations of seawater intrusion in the Nile Delta aquifer, Egypt. Journal of Hydrology, Volumes 464–465, Pages 186–198.
Simonneaux, V. and Adrabou, M. 2010. Evapotranspiration assessment in the Nile Delta using MODIS Satellite data. Poster.
Sims, D. 2015. Egypt’s desert dreams: development or disaster? American University in Cairo Press, Cairo.
USAID. 2002. Economic instruments for improved water resources management in Egypt. Report No. 57, APRP—Water Policy Activity
van Achthoven, T.; Merabet, Z.; Shalaby, K.S.; van Steenbergen, F. 2004. Balancing productivity and environmental pressure in Egypt: toward an interdisciplinary and integrated approach to agricultural drainage. A&RD Working Paper 13. World Bank.
Van Steenbergen, F., El Haouari, N. 2011. The blind spot in water governance: conjunctive groundwater use in the MENA countries. In Water policy and law in the Mediterranean: an evolving nexus, edited by Slavko Bogdanovic, UNESCO.
Volker, A. 1979. Re-use of drainage water; measurement and inventory. Report of a mission to Egypt 7-22 January 1979 for the Advisory Panel for Land Drainage in Egypt.
Weber, P. 2011. Is Egypt facing a Water Crisis ? Egyptian-German Water Resources Management Reform Programme (Agricultural Components).
Zeidan, B.A. 2016. Groundwater monitoring, modeling and assessment in the Nile Delta. Unpublished chapter.
53
Zeidan, B.A., Aly, A.I.M., Rashwan, I. M.H., Ahmed, M.A., S.M. Ghoraba. 2015. Scenarios for groundwater remediation using n15 in Nile Delta. Eighteenth International Water Technology Conference, IWTC18 Sharm ElSheikh, 12-14 March 2015.
Zhu, Z.; Molden, D. and El Kady. 1996. Salt loading in the Nile irrigation system. WRSR discussion paper series No. 25.
54
13 Reports by IWMI/WMRI
1. IWMI and WMRI. 2013. An exploratory survey of water management in the Meet Yazid Canal command area of the Nile Delta. Water and Salt Management in the Nile delta Project Report No. 1. IWMI, WMRI: Cairo, 2013.
2. Duttra, S. 2013. Understanding mesqa and marwa water management practices in IIP areas of the Nile Delta. Water and Salt Management in the Nile delta Project Report No. 2. IWMI, WMRI: Cairo, 2013.
3. Molle, F. and Rap, E. 2014. Brief Retrospective on Water User Organizations in Egypt. Water and Salt Management in the Nile delta Project Report No. 3. IWMI, WMRI: Cairo, 2014.
4. Molle, F.; Rap, E.; El-Agha, D.E.; Ismail, A.; Abou El Hassan, W. and Freeg, M. 2015. Irrigation Improvement Projects in the Nile Delta: promises, challenges, surprises. Water and Salt Management in the Nile delta Project Report No. 4. IWMI, WMRI: Cairo, 2015.
5. Molle, F.; Abou El Hassan, W.; Salama, S.; El-Agha, D.E. and Rap, E. 2015. Water and salt dynamics at the meso-level in IIIMP areas, Mares El Gamal canal. Water and Salt Management in the Nile delta Project Report No. 5. IWMI, WMRI: Cairo, 2015.
6. El-Agha, D.E.; Closas, A. and Molle, F. 2015. Survey of groundwater use in the central part of the Nile Delta. Water and Salt Management in the Nile delta Project Report No. 6. IWMI, WMRI: Cairo, 2015.
7. El-Agha, D.E.; Molle, F.; El Baily, M.; El Desouqy, E.; Abou El-Hassan, W. 2015. Spatial and temporal variability of water quality in the Nile Delta. Water and Salt Management in the Nile delta Project Report No. 7. IWMI, WMRI: Cairo, 2015.
8. Rap, E.; Molle, F.; El-Agha, D.E.; Ismail, A. 2015. Branch Canal Water User Associations in the central Nile Delta. Water and Salt Management in the Nile delta Project Report No. 8. IWMI, WMRI: Cairo, 2015.
9. Molle, F.; Gaafar, I., El-Agha, D.E. and Rap, E. 2016. Irrigation efficiency and the Nile Delta water balance. Water and Salt Management in the Nile delta Project Report No. 9. IWMI, WMRI: Cairo, 2016.
10. Gaafar, I.; Abou El-Hassan, W.; El Tahan, N. and Mustafa. 2015. Fishpond water management in the Lake Burullus area. Water and Salt Management in the Nile delta Project Report No. 10. IWMI, WMRI: Cairo, 2015.