Embed Size (px)
Citation preview

SEMIANNUAL REPORT AND SHAREHOLDER LETTER
FRANKLIN MUTUAL GLOBAL DISCOVERY FUNDA Series of Franklin Mutual Series Funds
June 30, 2021
Sign up for electronic delivery at franklintempleton.com/edelivery

Not FDIC Insured May Lose Value No Bank Guarantee
franklintempleton.com Not part of the semiannual report 1
SHAREHOLDER LETTERDear Franklin Mutual Global Discovery Fund Shareholder:
After a difficult period of lockdowns, anxiety and grief, the beginning of 2021 brought much needed optimism and the promise of relief. Before the start of the reporting period, our unsung heroes in lab coats announced viable vaccine candidates. By December 2020, vaccines were approved for emergency use. An additional stimulus package was also passed, delivering financial assistance to many people in need. Ten-year U.S. Treasury rates rose as investors began to anticipate a possible economic recovery. A rotation out of growth stocks and into value stocks took place, which set the tone for much of the six-month period through June 30, 2021.
The rotation into many “reopening” names meant that companies which had benefited from consumer behavior shifts during the lockdown, such as online payment processors, online retailers, and remote worker infrastructure providers, fell out of favor. Instead, companies that stood to benefit from economic reopening, such as hotels, casinos, restaurants, and other leisure companies, received a boost. Smaller capitalization companies, which tend to be more sensitive to the economic cycle, also outperformed their larger capitalization counterparts for much of the six months. The new Biden administration, and its focus on overhauling America’s infrastructure, also supported a rally in building products companies and other potential beneficiaries of the country’s structural overhaul. The U.S. government successfully passed an additional stimulus bill in March 2021, and progress toward an infrastructure plan is ongoing.
In addition to the reopening theme driving performance, the “reflation trade” also dominated much of the six months. The massive amounts of stimulus provided by central banks, combined with increased consumer spending and supply chain difficulties, led to building inflationary pressure and rising interest rates. This propelled some areas of global markets upward, such as many companies in the financials and energy sectors. However, toward period-end, investor concerns over rising inflation worked to constrain global equity market gains.
During the last half of the period, regional vaccination rates were a significant influencer of market activity. Geographic regions such as the U.S., where vaccine distribution was widespread, experienced markedly higher economic recovery than regions with lower vaccination rates. In
addition, a new coronavirus variant called the Delta variant, spread quickly through many countries that lacked vaccine distribution infrastructure, further delaying progress towards normalcy in these areas.
Not all progress is evidenced by a steady march forward. Markets continue to be affected by global vaccine distribution and ongoing complications surrounding COVID-19. As concerns about mounting inflation and fluctuating interest rates influence investor behavior, pockets of volatility may crop up. However, market volatility can often present opportunities. We remain focused on identifying stocks trading at attractive valuations based upon our assessment of fair value. Our process of finding underappreciated and misunderstood companies with identifiable catalysts to unlock shareholder value may provide meaningful upside potential, and a degree of downside protection during turbulent periods. To that end, we recognize the importance of financial professionals in today’s markets and encourage investors to continue to seek their advice. Amid changing markets and economic conditions, we are confident investors with a well-diversified portfolio and a patient, long-term outlook should be well-positioned for the years ahead.
On the following pages, the portfolio management team reviews investment decisions made during the past six months considering the economic environment and other factors. Please remember all securities markets fluctuate, as do mutual fund share prices.
We thank you for investing with Franklin Templeton, welcome your questions and comments, and look forward to continuing to serve your investment needs in the years ahead.
Sincerely,
Christian Correa, CFAPresident and Chief Investment OfficerFranklin Mutual Advisers, LLC
This letter reflects our analysis and opinions as of June 30, 2021, unless otherwise indicated. The information is not a complete analysis of every aspect of any market, country, industry, security or fund. Statements of fact are from sources considered reliable.
CFA® is a trademark owned by CFA Institute.

franklintempleton.comSemiannual Report2
ContentsSemiannual ReportFranklin Mutual Global Discovery Fund.................................3Performance Summary..........................................................8Your Fund’s Expenses .........................................................10Financial Highlights and Statement of Investments.............11Financial Statements ...........................................................22Notes to Financial Statements.............................................26Shareholder Information ......................................................41
Visit franklintempleton.com for fund updates, to access your account, or to find helpful financial planning tools.

3franklintempleton.com Semiannual Report
SEMIANNUAL REPORT
Franklin Mutual Global Discovery FundThis semiannual report for Franklin Mutual Global Discovery Fund covers the period ended June 30, 2021.
Your Fund’s Goal and Main InvestmentsThe Fund seeks capital appreciation. Under normal market conditions, the Fund invests primarily in equity securities of U.S. and foreign companies that we believe are available at market prices less than their intrinsic value. The equity securities in which the Fund invests are primarily common stock, with a current focus on mid- and large cap companies. To a lesser extent, the Fund also invests in merger arbitrage securities and the debt and equity of distressed companies. The Fund may invest a substantial portion, potentially up to 100% of its assets, in foreign securities and participations in foreign government debt. The Geographic Composition table on this page lists the leading countries where the Fund invests.
Performance OverviewThe Fund’s Class Z shares posted a +16.02% cumulative total return for the six months ended June 30, 2021. In comparison, the Fund’s new benchmark, the MSCI World Value Index-NR (USD), which tracks the performance of stocks exhibiting overall value style characteristics in global developed markets, posted a +14.72% cumulative total return.1 Also for comparison, the Fund’s prior benchmark, the MSCI World Index (USD), which tracks equity market performance in global developed markets, posted a +13.33% cumulative total return.1 The MSCI World Value Index-NR (USD) is replacing the MSCI World Index (USD) as the Fund’s benchmark. The investment manager believes the composition of the MSCI World Value Index-NR (USD) more accurately reflects the Fund’s current investment strategy and portfolio characteristics, and that the actual tax withholding rates for the Fund are closer to the assumptions of the MSCI World Value Index-NR (USD; net of taxes on dividends) than the MSCI World Index (USD; gross of taxes on dividends). You can find more of the Fund’s performance data in the Performance Summary beginning on page 8.
Performance data represent past performance, which does not guarantee future results. Investment return and principal value will fluctuate, and you may have a gain or loss when you sell your shares. Current performance may differ from figures shown. For most recent month-end performance, go to franklintempleton.com or call (800) 342-5236.
Geographic Composition6/30/21
% of Total Net Assets
United States 49.3% United Kingdom 8.7% Germany 7.5% France 7.3% Netherlands 6.0% Switzerland 5.0% Canada 3.0% Israel 1.9% Japan 1.6% South Korea 1.5% China 1.3% Other 0.7% Short-Term Investments & Other Net Assets 6.2%
Economic and Market OverviewGlobal developed and emerging market equities, as measured by the MSCI All Country World Index-NR (USD), posted a +12.30% total return for the six months ended June 30, 2021.1 Global equities benefited from monetary and fiscal stimulus measures, rebounding economic activity and easing novel coronavirus (COVID-19) pandemic restrictions in many regions. The implementation of vaccination programs and additional fiscal stimulus measures led many equity markets to reach new all-time price highs.
In the U.S., the economy continued to recover and equities rallied amid an accommodative monetary policy, additional fiscal stimulus measures and ongoing vaccination programs. The lifting of many COVID-19 restrictions and strong consumer spending also supported the economy. Gross domestic product (GDP) growth accelerated in 2021’s first
1. Source: Morningstar.The indexes are unmanaged and include reinvestment of any income or distributions. They do not reflect any fees, expenses or sales charges. One cannot invest directly in an index, and an index is not representative of the Fund’s portfolio. Net Returns (NR) include income net of tax withholding when dividends are paid.See www.franklintempletondatasources.com for additional data provider information.The dollar value, number of shares or principal amount, and names of all portfolio holdings are listed in the Fund’s Statement of Investments (SOI).The SOI begins on page 16.

FRANKLIN MUTUAL GLOBAL DISCOVERY FUND
4 franklintempleton.comSemiannual Report
quarter, with total economic output nearly reaching pre-pandemic levels. The rebound in corporate earnings and progress toward a bipartisan infrastructure plan further bolstered investor sentiment. The U.S. Federal Reserve kept the federal funds target rate at a record-low range of 0.00%–0.25% and continued its program of open-ended bond purchases to help keep markets functioning.
The economic recovery in the eurozone was relatively weak, as quarter-over-quarter GDP growth contracted during 2021’s first quarter. GDP growth rates were mostly negative among the region’s largest economies amid renewed lockdowns, delays in COVID-19 vaccine distribution and weak consumer spending. Nevertheless, optimism that successful vaccine programs would lift global growth helped European developed market equities, as measured by the MSCI Europe Index-NR (USD), to post a +11.80% total return for the six months under review.1
Asian developed and emerging market equities, as measured by the MSCI All Country Asia Index-NR (USD), posted a +4.54% total return for the six-month period.1 The region’s economic recovery was pressured by weak domestic demand, most notably in China, despite improvement in manufacturing and exports. Asian equity markets experienced increased volatility near period-end due to inflation concerns, rising COVID-19 infection rates in many countries, especially India, and renewed lockdowns.
Global emerging market stocks, as measured by the MSCI Emerging Markets Index-NR (USD), posted a +7.45% total return for the six months under review.1 The recovery in oil and industrial metals prices supported global emerging market equities. Late in the period, higher COVID-19 cases in some countries, limited vaccine rollouts and concerns about rising interest rates and inflation amid higher commodity prices dampened investor enthusiasm in global emerging market equities.
Investment StrategyAt Franklin Mutual Series, we are committed to our distinctive value approach to investing, which we believe can generate above-average risk-adjusted returns over time for our shareholders. Our major investment strategy is investing in undervalued stocks. When selecting undervalued equities, we are attracted to what we believe are fundamentally strong companies with healthy balance sheets, high-quality assets, substantial free cash flow and shareholder-oriented management teams and whose stocks are trading at discounts to our assessment of the companies’ intrinsic or business value. We also look for asset-rich companies whose shares may be trading at
depressed levels due to concerns over short-term earnings disappointments, litigation, management strategy or other perceived negatives. This strict value approach is not only intended to improve the likelihood of capital appreciation, but also reduces the risk of substantial declines, in our opinion. While the vast majority of our undervalued equity and debt investments are made in publicly traded companies globally, we may invest occasionally in privately held companies as well. Our portfolio selection process generally includes an assessment of the potential impacts of any material environmental, social and governance (ESG) factors on the long-term risk and return profile of a company.
To a lesser extent, we complement this more traditional investment strategy with two others. One is distressed investing, a highly specialized field that has proven quite profitable during certain periods over the years. Distressed investing is complex and can take many forms. The most common distressed investment the Fund undertakes is the purchase of financially troubled or bankrupt companies’ debt at a substantial discount to face value. After the financially distressed company is reorganized, often in bankruptcy court, the old debt is typically replaced with new securities issued by the financially stronger company.
The other piece of our investment strategy is participating in arbitrage situations, another highly specialized field. When companies announce proposed mergers or takeovers, commonly referred to as deals, the target company may trade at a discount to the bid it ultimately accepts. One form of arbitrage involves purchasing the target company’s stock when it is trading below the value we believe it would receive in a deal. In keeping with our commitment to a relatively conservative investment approach, we typically focus our arbitrage efforts on announced deals, and avoid rumored deals or other situations we consider relatively risky. In addition, it is our practice to hedge the Fund’s currency exposure when we deem it advantageous for our shareholders.
Manager’s DiscussionBefore the start of the period, a large, multi-year performance gap existed between growth and value stocks. The beginning of 2021 brought a rotation into value stocks that lasted for much of the period, narrowing the gap. For the six-month period ending June 30, 2021, the MSCI World Value Index-NR (USD) posted a +14.72% total return, while the MSCI World Growth Index-NR (USD) posted a +11.14% total return.1 While “the reopening trade” boosted the stock prices of many companies that stood to benefit from economic reopening and citizens’ reentry into a more normalized society, a bigger driver of performance within our

FRANKLIN MUTUAL GLOBAL DISCOVERY FUND
5franklintempleton.com Semiannual Report
portfolios was “the reflation trade,” reflecting expectations of rising interest rates and increasing inflationary pressures. Fiscal and monetary stimulus, increased demand for certain products such as automobiles where production was constrained by supply bottlenecks, a steepening yield curve and commodity price increases are drivers of the reflation trade.
Many of Franklin Mutual Series’ portfolios had a significant position in banks. The team had invested in these stocks due to their discounted pricing compared to our assessment of fair value. When rates started to rise at the beginning of the period, banks benefited. Higher rates generally mean high spreads on lending products. Moreover, increased economic activity and overall confidence in future economic growth spurs increased lending activity, which is also good for banks. Investments in companies such as ING Groep, Wells Fargo and Capital One Financial were some of our biggest contributors to absolute performance during the period. In the Top 10 Industries table on this page, "Banks" is listed with other industries in which the Fund invests.
Our traditional value equity investment approach is complemented with two other investment strategies we use to take advantage of special situations, which are merger arbitrage and distressed investing. We were active in special situations investing during the first half of 2021. During the period, our new ideas were driven by merger arbitrage opportunities, while our attention in credit remained focused on opportunistic performing and stressed names, in addition to post-reorganization distressed securities.
Within merger arbitrage, which involves trading the stocks of companies involved in a merger or acquisition, activity has been significant. Strong global markets and cheap and available financing have helped to increase and sustain merger activity. As corporations seek inorganic growth opportunities across products, service offerings and end markets while extracting merger synergies, we expect deal momentum to continue. We are seeking opportunities that either present a straightforward rate of return with relatively low risk, deals with high discounts due to concerns over the antitrust review process, or deals stemming from unsolicited approaches or auctions.
Within our distressed credit strategy, historically low rates and a steepening yield curve drove tight credit spreads. As a result, total risk-adjusted return potential in performing and stressed credit was muted during the period, particularly in fixed-rate, long duration investments. Given the current environment, we have limited the scope of our investments in distressed credit.
Top 10 Industries6/30/21
% of Total Net Assets
a
Pharmaceuticals 10.0%
Oil, Gas & Consumable Fuels 9.5%
Banks 8.4%
Insurance 7.1%
Health Care Providers & Services 4.6%
Software 4.3%
Technology Hardware, Storage & Peripherals 3.9%
Diversified Telecommunication Services 3.6%
Tobacco 3.4%
IT Services 3.2%
Fund PerformanceTurning to Fund performance, top positive contributors included Wells Fargo, ING Groep and Eli Lilly. Wells Fargo and ING Groep are listed among the Fund’s largest positions in the Top 10 Holdings table on page 6.
Wells Fargo was among the leading contributors to Fund results during the period. The company announced its first-quarter 2021 results in April. Headline earnings per share beat consensus expectations. The mortgage and investment banking business lines generated strong fee revenues and management expects profitability of the company’s other core lines of business to improve as the economy continues to reopen. The stock performed well throughout the remainder of the six-month period.
Financial services company ING Groep was a main contributor to Fund results during the period. The stock price rose throughout the six months, riding a wave of investor optimism and positive financial results. Early in the period, the company announced fourth-quarter 2020 adjusted earnings per share that beat expectations, which helped provide support for price appreciation in February and March. In May, ING Groep announced strong results for 2021’s first quarter, further lifting the price. In addition, the continuing prospect of improving economic conditions and higher interest rates has helped to support financial stocks. Additionally, management has announced a series of restructurings and market exits to reduce cost and streamline the company’s operations.
Shares of drug company Eli Lilly appreciated during the period and contributed positively to portfolio results. The company's stock appreciated strongly given positive phase 2 data for its Alzheimer's compound, Donanemab. Eli Lilly expected to file Donanemab with the U.S. Food and Drug Administration (FDA) earlier than originally planned, due

FRANKLIN MUTUAL GLOBAL DISCOVERY FUND
6 franklintempleton.comSemiannual Report
to the FDA's recent approval of Aduhelm, an Alzheimer's product from Biogen (not a Fund holding). In addition, Eli Lilly’s diabetes drug, Trulicity, continues to grow strongly, and its key diabetes pipeline compound, Tirzepatide, showed positive results in multiple phase 3 clinical trials, which further strengthens the company’s position in the growing diabetes end market.
Top 10 Holdings6/30/21
Company Industry, Country
% of Total Net Assets
a a
GlaxoSmithKline plc 3.2%Pharmaceuticals, United KingdomCharter Communications, Inc. 2.7%Media, United StatesDeutsche Telekom AG 2.6%Diversified Telecommunication Services,
GermanyMerck & Co., Inc. 2.6%Pharmaceuticals, United StatesWells Fargo & Co. 2.5%Banks, United StatesCVS Health Corp. 2.5%Health Care Providers & Services, United StatesBP plc 2.5%Oil, Gas & Consumable Fuels, United KingdomING Groep NV 2.4%Banks, NetherlandsWilliams Cos., Inc. (The) 2.4%Oil, Gas & Consumable Fuels, United StatesBritish American Tobacco plc 2.2%Tobacco, United Kingdom
During the period under review, Fund investments that detracted from performance included Cognizant Technology Solutions, Check Point Software Technologies and Credit Suisse Group.
Outsourcing services company Cognizant Technology Solutions detracted from results during the period. The stock fell precipitously in May after the company’s first-quarter 2021 earnings call. Despite financial results that were largely in-line with expectations, investors reacted negatively as the company lowered its full-year margin guidance to tackle a high employee attrition rate, which led to lost business opportunities due to the inability to source talent. Long term, the company is investing in its recruiting and employee retention efforts and building out its automation technology to decouple employee headcount growth from revenue growth.
Israel-based information technology security software provider Check Point Software Technologies detracted from Fund performance during the period. The stock slid in February after the company announced fourth fiscal quarter results, including 2021 guidance that was below consensus expectations due to higher selling, general and administrative expenses, lower interest income and foreign
exchange headwinds. In late April, the company announced first-quarter 2021 financial results that were in-line with estimates, as better subscription revenues offset lower product revenues. The stock traded within a narrow price range for the remainder of the six-month period.
The stock of Switzerland-based financial services company Credit Suisse detracted from portfolio results during the six-month period. In March, the price fell due to two large risk management lapses at the firm. First, the collapse of Greensill, which is a provider of supply chain finance to companies around the world. Funds managed by Credit Suisse had approximately $10 billion of exposure. Since the collapse of Greensill, Credit Suisse continues to work on recovering and returning investors’ capital. Second, the firm had outsized exposure to Archegos Capital Management, a prime broker client of the firm. Although multiple global banks suffered losses, Credit Suisse suffered significantly higher losses than others, with a $5.5 billion write-off booked during the quarter. As a result of this charge, it was forced to raise close to $2 billion to shore up the bank's capital. In response to the two events, Credit Suisse announced multiple restructuring programs and management changes. The stock traded within a narrow price range for the remainder of the period.
During the period, the Fund held currency forwards and futures, seeking to substantially hedge most of the currency risk of the portfolio’s non-U.S. dollar investments. The hedges had a positive overall impact on the Fund’s performance as the U.S. dollar rose against most currencies during the period.
Thank you for your participation in Franklin Mutual Global Discovery Fund. We look forward to continuing to serve your investment needs.
Christian Correa, CFAKatrina Dudley, CFATimothy Rankin, CFA
Portfolio Management Team
The foregoing information reflects our analysis, opinions and portfolio holdings as of June 30, 2021, the end of the reporting period. The way we implement our main investment strategies and the resulting portfolio holdings may change depending on factors such as market and economic conditions. These opinions may not be relied upon as investment advice or an offer for a particular security. The information is not a complete analysis of every aspect of any market, country, industry, security or the Fund. Statements of fact are from sources considered reliable, but the investment

FRANKLIN MUTUAL GLOBAL DISCOVERY FUND
7franklintempleton.com Semiannual Report
manager makes no representation or warranty as to their completeness or accuracy. Although historical performance is no guarantee of future results, these insights may help you understand our investment management philosophy.

Performance Summary as of June 30, 2021
FRANKLIN MUTUAL GLOBAL DISCOVERY FUND
8 franklintempleton.comSemiannual Report
The performance table does not reflect any taxes that a shareholder would pay on Fund dividends, capital gain distributions, if any, or any realized gains on the sale of Fund shares. Total return reflects reinvestment of the Fund’s dividends and capital gain distributions, if any, and any unrealized gains or losses. Your dividend income will vary depending on dividends or interest paid by securities in the Fund’s portfolio, adjusted for operating expenses of each class. Capital gain distributions are net profits realized from the sale of portfolio securities.
Performance as of 6/30/211
Cumulative total return excludes sales charges. Average annual total return includes maximum sales charges. Sales charges will vary depending on the size of the investment and the class of share purchased. The maximum is 5.50% and the minimum is 0%. Class A: 5.50% maximum initial sales charge; For other share classes, visit franklintempleton.com.
Share ClassCumulative
Total Return2Average Annual
Total Return3
–
Z6-Month +16.02% +16.02%1-Year +41.65% +41.65%5-Year +52.55% +8.81%10-Year +105.76% +7.48%
A4
6-Month +15.90% +9.51%1-Year +41.31% +33.53%5-Year +50.66% +7.32%10-Year +100.26% +6.59%
Performance data represent past performance, which does not guarantee future results. Investment return and principal value will fluctuate, and you may have a gain or loss when you sell your shares. Current performance may differ from figures shown. For most recent month-end performance, go to franklintempleton.com or call (800) 342-5236.
See page 9 for Performance Summary footnotes.

FRANKLIN MUTUAL GLOBAL DISCOVERY FUNDPERFORMANCE SUMMARY
9franklintempleton.com Semiannual Report
Total Annual Operating Expenses1
Share ClassWith Fee
WaiverWithout Fee
Waiver
Z 1.01% 1.02%A 1.26% 1.27%
Each class of shares is available to certain eligible investors and has different annual fees and expenses, as described in the prospectus.
All investments involve risks, including possible loss of principal. Value securities may not increase in price as anticipated or may decline further in value. Special risks are associated with foreign investing, including currency fluctuations, economic instability and political developments. To the extent that the Fund focuses on particular countries, regions, industries, sectors or types of investment from time to time, the Fund may be subject to greater risks of adverse developments in such areas of focus than a fund that invests in a wider variety of countries, regions, industries, sectors or investments. Because the Fund may invest its assets in companies in a specific region, including Europe, it is subject to greater risks of adverse developments in that region and/or the surrounding regions than a fund that is more broadly diversified geographically. Current political uncertainty concerning the economic consequences of the departure of the U.K. from the European Union may increase market volatility. Smaller-company stocks have exhibited greater price volatility than larger-company stocks, particularly over the short term. The Fund’s investments in companies engaged in mergers, reorganizations or liquidations also involve special risks as pending deals may not be completed on time or on favorable terms. The Fund may invest in lower-rated bonds, which entail higher credit risk. Events such as the spread of deadly diseases, disasters, and financial, political or social disruptions, may heighten risks and adversely affect performance. The Fund’s prospectus also includes a description of the main investment risks.
1. The Fund has an expense reduction contractually guaranteed through 4/30/22. Fund investment results reflect the expense reduction; without this reduction, the results would have been lower. 2. Cumulative total return represents the change in value of an investment over the periods indicated.3. Average annual total return represents the average annual change in value of an investment over the periods indicated. Return for less than one year, if any, has not been annualized.4. Prior to 9/10/18, these shares were offered at a higher initial sales charge of 5.75%, thus actual returns (with sales charges) would have differed. Average annual total returns (with sales charges) have been restated to reflect the current maximum initial sales charge of 5.50%. 5. Figures are as stated in the Fund’s current prospectus and may differ from the expense ratios disclosed in the Your Fund’s Expenses and Financial Highlights sections in this report. In periods of market volatility, assets may decline significantly, causing total annual Fund operating expenses to become higher than the figures shown.See www.franklintempletondatasources.com for additional data provider information.

Your Fund’s Expenses
FRANKLIN MUTUAL GLOBAL DISCOVERY FUND
10 franklintempleton.comSemiannual Report
As a Fund shareholder, you can incur two types of costs: (1) transaction costs, including sales charges (loads) on Fund purchases and redemptions; and (2) ongoing Fund costs, including management fees, distribution and service (12b-1) fees, and other Fund expenses. All mutual funds have ongoing costs, sometimes referred to as operating expenses. The table below shows ongoing costs of investing in the Fund and can help you understand these costs and compare them with those of other mutual funds. The table assumes a $1,000 investment held for the six months indicated.
Actual Fund ExpensesThe table below provides information about actual account values and actual expenses in the columns under the heading “Actual.” In these columns the Fund’s actual return, which includes the effect of Fund expenses, is used to calculate the “Ending Account Value” for each class of shares. You can estimate the expenses you paid during the period by following these steps (of course, your account value and expenses will differ from those in this illustration): Divide your account value by $1,000 (if your account had an $8,600 value, then $8,600 ÷ $1,000 = 8.6). Then multiply the result by the number in the row for your class of shares under the headings “Actual” and “Expenses Paid During Period” (if Actual Expenses Paid During Period were $7.50, then 8.6 x $7.50 = $64.50). In this illustration, the actual expenses paid this period are $64.50.
Hypothetical Example for Comparison with Other FundsUnder the heading “Hypothetical” in the table, information is provided about hypothetical account values and hypothetical expenses based on the Fund’s actual expense ratio and an assumed rate of return of 5% per year before expenses, which is not the Fund’s actual return. This information may not be used to estimate the actual ending account balance or expenses you paid for the period, but it can help you compare ongoing costs of investing in the Fund with those of other funds. To do so, compare this 5% hypothetical example for the class of shares you hold with the 5% hypothetical examples that appear in the shareholder reports of other funds.
Please note that expenses shown in the table are meant to highlight ongoing costs and do not reflect any transactional costs. Therefore, information under the heading “Hypothetical” is useful in comparing ongoing costs only, and will not help you compare total costs of owning different funds. In addition, if transactional costs were included, your total costs would have been higher.
Actual (actual return after expenses)
Hypothetical (5% annual return before expenses)
Share Class
Beginning Account
Value 1/1/21
Ending Account
Value 6/30/21
Expenses Paid During
Period 1/1/21–6/30/211, 2
Ending Account
Value 6/30/21
Expenses Paid During
Period 1/1/21–6/30/211, 2
a
Net Annualized
Expense Ratio2
Z $1,000 $1,160.20 $5.58 $1,019.63 $5.22 1.04%A $1,000 $1,159.00 $6.91 $1,018.39 $6.46 1.29%C $1,000 $1,154.70 $10.91 $1,014.67 $10.20 2.04%R $1,000 $1,157.40 $8.25 $1,017.15 $7.71 1.54%
R6 $1,000 $1,161.00 $5.08 $1,020.09 $4.75 0.95%
1. Expenses are equal to the annualized expense ratio for the six-month period as indicated above—in the far right column—multiplied by the simple average account value over the period indicated, and then multiplied by 181/365 to reflect the one-half year period.2. Reflects expenses after fee waivers and expense reimbursements. Does not include acquired fund fees and expenses.

FRANKLIN MUTUAL SERIES FUNDS
Financial HighlightsFranklin Mutual Global Discovery Fund
franklintempleton.com The accompanying notes are an integral part of these financial statements. Semiannual Report 11
a
Six Months Ended June
30, 2021 (unaudited)
Year Ended December 31,
2020 2019 2018 2017 2016
Class ZPer share operating performance(for a share outstanding throughout the
period)Net asset value, beginning of period . . . . . $28.77 $31.19 $26.86 $32.42 $31.12 $29.35Income from investment operationsa:
Net investment incomeb . . . . . . . . . . . . . 0.32 0.96c 0.67 0.58 0.76d 0.67e
Net realized and unrealized gains (losses) 4.29 (2.38) 5.91 (4.13) 2.29 3.08Total from investment operations . . . . . . . . 4.61 (1.42) 6.58 (3.55) 3.05 3.75Less distributions from:
Net investment income . . . . . . . . . . . . . . — (0.83) (0.70) (0.64) (0.79) (0.69)Net realized gains . . . . . . . . . . . . . . . . . — (0.17) (1.55) (1.37) (0.96) (1.29)
Total distributions . . . . . . . . . . . . . . . . . . . — (1.00) (2.25) (2.01) (1.75) (1.98)Net asset value, end of period . . . . . . . . . . $33.38 $28.77 $31.19 $26.86 $32.42 $31.12
Total returnf . . . . . . . . . . . . . . . . . . . . . . . . 16.02% (4.38)% 24.70% (10.78)% 9.84% 12.86%
Ratios to average net assetsg
Expensesh,i . . . . . . . . . . . . . . . . . . . . . . . . 1.04%j 1.03%j 1.00%j 0.97%j 0.96% 0.99%j
Expenses - incurred in connection with securities sold short . . . . . . . . . . . . . . . . . 0.03% 0.01% 0.02% —%k —% 0.01%Net investment income . . . . . . . . . . . . . . . 2.02% 3.66%c 2.20% 1.82% 2.30%d 2.27%e
Supplemental dataNet assets, end of period (000’s) . . . . . . . . $3,460,782 $3,274,956 $5,176,787 $5,114,274 $7,175,981 $8,354,865Portfolio turnover rate . . . . . . . . . . . . . . . . 18.41% 17.25% 14.08% 14.70% 17.50% 17.01%
aThe amount shown for a share outstanding throughout the period may not correlate with the Statement of Operations for the period due to the timing of sales and repurchases of the Fund’s shares in relation to income earned and/or fluctuating fair value of the investments of the Fund.bBased on average daily shares outstanding.cNet investment income per share includes approximately $0.43 per share related to income received in the form of special dividends and an adjustment for EU reclaims in connection with certain Fund holdings. Excluding this amount, the ratio of net investment income to average net assets would have been 2.02%.dNet investment income per share includes approximately $0.20 per share related to income received in the form of special dividends in connection with certain Fund holdings. Excluding this amount, the ratio of net investment income to average net assets would have been 1.68%.eNet investment income per share includes approximately $0.10 per share related to income received in the form of special dividends in connection with certain Fund holdings. Excluding this amount, the ratio of net investment income to average net assets would have been 1.94%.fTotal return is not annualized for periods less than one year.gRatios are annualized for periods less than one year.hIncludes dividends and/or interest expense on securities sold short and security borrowing fees, if any. See below for the ratios of such expenses to average net assets for the periods presented. See Note 1(d).iBenefit of expense reduction rounds to less than 0.01%.jBenefit of waiver and payments by affiliates rounds to less than 0.01%.kRounds to less than 0.01%.

FRANKLIN MUTUAL SERIES FUNDSFINANCIAL HIGHLIGHTS
Franklin Mutual Global Discovery Fund (continued)
franklintempleton.comSemiannual Report The accompanying notes are an integral part of these financial statements.12
a
Six Months Ended June
30, 2021 (unaudited)
Year Ended December 31,
2020 2019 2018 2017 2016
Class APer share operating performance(for a share outstanding throughout the
period)Net asset value, beginning of period . . . . . $28.12 $30.51 $26.32 $31.80 $30.57 $28.86Income from investment operationsa:
Net investment incomeb . . . . . . . . . . . . . 0.27 0.86c 0.58 0.49 0.66d 0.59e
Net realized and unrealized gains (losses) 4.20 (2.32) 5.78 (4.04) 2.25 3.01Total from investment operations . . . . . . . . 4.47 (1.46) 6.36 (3.55) 2.91 3.60Less distributions from:
Net investment income . . . . . . . . . . . . . . — (0.76) (0.62) (0.56) (0.72) (0.60)Net realized gains . . . . . . . . . . . . . . . . . — (0.17) (1.55) (1.37) (0.96) (1.29)
Total distributions . . . . . . . . . . . . . . . . . . . — (0.93) (2.17) (1.93) (1.68) (1.89)Net asset value, end of period . . . . . . . . . . $32.59 $28.12 $30.51 $26.32 $31.80 $30.57
Total returnf . . . . . . . . . . . . . . . . . . . . . . . . 15.90% (4.61)% 24.37% (10.99)% 9.57% 12.56%
Ratios to average net assetsg
Expensesh,i . . . . . . . . . . . . . . . . . . . . . . . . 1.29%j 1.28%j 1.25%j 1.22%j 1.21% 1.24%j
Expenses - incurred in connection with securities sold short . . . . . . . . . . . . . . . . . 0.03% 0.01% 0.02% —%k —% 0.01%Net investment income . . . . . . . . . . . . . . . 1.77% 3.39%c 1.95% 1.57% 2.05%d 2.02%e
Supplemental dataNet assets, end of period (000’s) . . . . . . . . $5,702,618 $5,358,016 $7,683,644 $7,461,444 $9,589,033 $10,498,722Portfolio turnover rate . . . . . . . . . . . . . . . . 18.41% 17.25% 14.08% 14.70% 17.50% 17.01%
aThe amount shown for a share outstanding throughout the period may not correlate with the Statement of Operations for the period due to the timing of sales and repurchases of the Fund’s shares in relation to income earned and/or fluctuating fair value of the investments of the Fund.bBased on average daily shares outstanding.cNet investment income per share includes approximately $0.42 per share related to income received in the form of special dividends and an adjustment for EU reclaims in connection with certain Fund holdings. Excluding this amount, the ratio of net investment income to average net assets would have been 1.75%.dNet investment income per share includes approximately $0.20 per share related to income received in the form of special dividends in connection with certain Fund holdings. Excluding this amount, the ratio of net investment income to average net assets would have been 1.43%.eNet investment income per share includes approximately $0.10 per share related to income received in the form of special dividends in connection with certain Fund holdings. Excluding this amount, the ratio of net investment income to average net assets would have been 1.69%.fTotal return does not reflect sales commissions or contingent deferred sales charges, if applicable, and is not annualized for periods less than one year.gRatios are annualized for periods less than one year.hIncludes dividends and/or interest expense on securities sold short and security borrowing fees, if any. See below for the ratios of such expenses to average net assets for the periods presented. See Note 1(d).iBenefit of expense reduction rounds to less than 0.01%.jBenefit of waiver and payments by affiliates rounds to less than 0.01%.kRounds to less than 0.01%.

FRANKLIN MUTUAL SERIES FUNDSFINANCIAL HIGHLIGHTS
Franklin Mutual Global Discovery Fund (continued)
franklintempleton.com The accompanying notes are an integral part of these financial statements. Semiannual Report 13
a
Six Months Ended June
30, 2021 (unaudited)
Year Ended December 31,
2020 2019 2018 2017 2016
Class CPer share operating performance(for a share outstanding throughout the
period)Net asset value, beginning of period . . . . . $28.12 $30.46 $26.25 $31.44 $30.22 $28.55Income from investment operationsa:
Net investment incomeb . . . . . . . . . . . . . 0.15 0.67c 0.36 0.26 0.41d 0.36e
Net realized and unrealized gains (losses) 4.20 (2.34) 5.74 (3.98) 2.23 2.97Total from investment operations . . . . . . . . 4.35 (1.67) 6.10 (3.72) 2.64 3.33Less distributions from:
Net investment income . . . . . . . . . . . . . . — (0.50) (0.34) (0.10) (0.46) (0.37)Net realized gains . . . . . . . . . . . . . . . . . — (0.17) (1.55) (1.37) (0.96) (1.29)
Total distributions . . . . . . . . . . . . . . . . . . . — (0.67) (1.89) (1.47) (1.42) (1.66)Net asset value, end of period . . . . . . . . . . $32.47 $28.12 $30.46 $26.25 $31.44 $30.22
Total returnf . . . . . . . . . . . . . . . . . . . . . . . . 15.47% (5.32)% 23.43% (11.70)% 8.78% 11.70%
Ratios to average net assetsg
Expensesh,i . . . . . . . . . . . . . . . . . . . . . . . . 2.04%j 2.03%j 2.00%j 1.97%j 1.96% 1.99%j
Expenses - incurred in connection with securities sold short . . . . . . . . . . . . . . . . . 0.03% 0.01% 0.02% —%k —% 0.01%Net investment income . . . . . . . . . . . . . . . 1.00% 2.66%c 1.20% 0.82% 1.30%d 1.27%e
Supplemental dataNet assets, end of period (000’s) . . . . . . . . $469,703 $494,606 $872,717 $1,054,412 $2,438,507 $2,758,563Portfolio turnover rate . . . . . . . . . . . . . . . . 18.41% 17.25% 14.08% 14.70% 17.50% 17.01%
aThe amount shown for a share outstanding throughout the period may not correlate with the Statement of Operations for the period due to the timing of sales and repurchases of the Fund’s shares in relation to income earned and/or fluctuating fair value of the investments of the Fund.bBased on average daily shares outstanding.cNet investment income per share includes approximately $0.42 per share related to income received in the form of special dividends and an adjustment for EU reclaims in connection with certain Fund holdings. Excluding this amount, the ratio of net investment income to average net assets would have been 1.01%.dNet investment income per share includes approximately $0.20 per share related to income received in the form of special dividends in connection with certain Fund holdings. Excluding this amount, the ratio of net investment income to average net assets would have been 0.68%.eNet investment income per share includes approximately $0.10 per share related to income received in the form of special dividends in connection with certain Fund holdings. Excluding this amount, the ratio of net investment income to average net assets would have been 0.94%.fTotal return does not reflect sales commissions or contingent deferred sales charges, if applicable, and is not annualized for periods less than one year.gRatios are annualized for periods less than one year.hIncludes dividends and/or interest expense on securities sold short and security borrowing fees, if any. See below for the ratios of such expenses to average net assets for the periods presented. See Note 1(d).iBenefit of expense reduction rounds to less than 0.01%.jBenefit of waiver and payments by affiliates rounds to less than 0.01%.kRounds to less than 0.01%.

FRANKLIN MUTUAL SERIES FUNDSFINANCIAL HIGHLIGHTS
Franklin Mutual Global Discovery Fund (continued)
franklintempleton.comSemiannual Report The accompanying notes are an integral part of these financial statements.14
a
Six Months Ended June
30, 2021 (unaudited)
Year Ended December 31,
2020 2019 2018 2017 2016
Class RPer share operating performance(for a share outstanding throughout the
period)Net asset value, beginning of period . . . . . $27.70 $30.08 $25.97 $31.37 $30.17 $28.51Income from investment operationsa:
Net investment incomeb . . . . . . . . . . . . . 0.23 0.78c 0.50 0.41 0.57d 0.50e
Net realized and unrealized gains (losses) 4.13 (2.29) 5.69 (3.97) 2.22 2.98Total from investment operations . . . . . . . . 4.36 (1.51) 6.19 (3.56) 2.79 3.48Less distributions from:
Net investment income . . . . . . . . . . . . . . — (0.70) (0.53) (0.47) (0.63) (0.53)Net realized gains . . . . . . . . . . . . . . . . . — (0.17) (1.55) (1.37) (0.96) (1.29)
Total distributions . . . . . . . . . . . . . . . . . . . — (0.87) (2.08) (1.84) (1.59) (1.82)Net asset value, end of period . . . . . . . . . . $32.06 $27.70 $30.08 $25.97 $31.37 $30.17
Total returnf . . . . . . . . . . . . . . . . . . . . . . . . 15.74% (4.87)% 24.09% (11.24)% 9.31% 12.28%
Ratios to average net assetsg
Expensesh,i . . . . . . . . . . . . . . . . . . . . . . . . 1.54%j 1.53%j 1.50%j 1.47%j 1.46% 1.49%j
Expenses - incurred in connection with securities sold short . . . . . . . . . . . . . . . . . 0.03% 0.01% 0.02% —%k —% 0.01%Net investment income . . . . . . . . . . . . . . . 1.50% 3.13%c 1.70% 1.32% 1.80%d 1.77%e
Supplemental dataNet assets, end of period (000’s) . . . . . . . . $166,256 $175,393 $251,089 $274,086 $398,692 $444,813Portfolio turnover rate . . . . . . . . . . . . . . . . 18.41% 17.25% 14.08% 14.70% 17.50% 17.01%
aThe amount shown for a share outstanding throughout the period may not correlate with the Statement of Operations for the period due to the timing of sales and repurchases of the Fund’s shares in relation to income earned and/or fluctuating fair value of the investments of the Fund.bBased on average daily shares outstanding.cNet investment income per share includes approximately $0.41 per share related to income received in the form of special dividends and an adjustment for EU reclaims in connection with certain Fund holdings. Excluding this amount, the ratio of net investment income to average net assets would have been 1.48%.dNet investment income per share includes approximately $0.20 per share related to income received in the form of special dividends in connection with certain Fund holdings. Excluding this amount, the ratio of net investment income to average net assets would have been 1.18%.eNet investment income per share includes approximately $0.10 per share related to income received in the form of special dividends in connection with certain Fund holdings. Excluding this amount, the ratio of net investment income to average net assets would have been 1.44%.fTotal return is not annualized for periods less than one year.gRatios are annualized for periods less than one year.hIncludes dividends and/or interest expense on securities sold short and security borrowing fees, if any. See below for the ratios of such expenses to average net assets for the periods presented. See Note 1(d).iBenefit of expense reduction rounds to less than 0.01%.jBenefit of waiver and payments by affiliates rounds to less than 0.01%.kRounds to less than 0.01%.

FRANKLIN MUTUAL SERIES FUNDSFINANCIAL HIGHLIGHTS
Franklin Mutual Global Discovery Fund (continued)
franklintempleton.com The accompanying notes are an integral part of these financial statements. Semiannual Report 15
a
Six Months Ended June
30, 2021 (unaudited)
Year Ended December 31,
2020 2019 2018 2017 2016
Class R6Per share operating performance(for a share outstanding throughout the
period)Net asset value, beginning of period . . . . . $28.75 $31.17 $26.85 $32.41 $31.13 $29.35Income from investment operationsa:
Net investment incomeb . . . . . . . . . . . . . 0.32 0.97c 0.70 0.62 0.75d 0.61e
Net realized and unrealized gains (losses) 4.31 (2.35) 5.90 (4.13) 2.34 3.19Total from investment operations . . . . . . . . 4.63 (1.38) 6.60 (3.51) 3.09 3.80Less distributions from:
Net investment income . . . . . . . . . . . . . . — (0.87) (0.73) (0.68) (0.85) (0.73)Net realized gains . . . . . . . . . . . . . . . . . — (0.17) (1.55) (1.37) (0.96) (1.29)
Total distributions . . . . . . . . . . . . . . . . . . . — (1.04) (2.28) (2.05) (1.81) (2.02)Net asset value, end of period . . . . . . . . . . $33.38 $28.75 $31.17 $26.85 $32.41 $31.13
Total returnf . . . . . . . . . . . . . . . . . . . . . . . . 16.10% (4.27)% 24.80% (10.67)% 9.98% 13.02%
Ratios to average net assetsg
Expenses before waiver and payments by affiliatesh . . . . . . . . . . . . . . . . . . . . . . . . . . 0.95% 0.92% 0.90% 0.88% 0.84% 0.85%Expenses net of waiver and payments by affiliatesh,i . . . . . . . . . . . . . . . . . . . . . . . . . 0.95%j 0.92%j 0.89% 0.87% 0.84% 0.85%j
Expenses - incurred in connection with securities sold short . . . . . . . . . . . . . . . . . 0.03% 0.01% 0.02% —%k —% 0.01%Net investment income . . . . . . . . . . . . . . . 2.04% 3.73%c 2.31% 1.92% 2.42%d 2.41%e
Supplemental dataNet assets, end of period (000’s) . . . . . . . . $693,463 $843,143 $1,295,457 $1,418,812 $2,221,338 $528,617Portfolio turnover rate . . . . . . . . . . . . . . . . 18.41% 17.25% 14.08% 14.70% 17.50% 17.01%
aThe amount shown for a share outstanding throughout the period may not correlate with the Statement of Operations for the period due to the timing of sales and repurchases of the Fund’s shares in relation to income earned and/or fluctuating fair value of the investments of the Fund.bBased on average daily shares outstanding.cNet investment income per share includes approximately $0.43 per share related to income received in the form of special dividends and an adjustment for EU reclaims in connection with certain Fund holdings. Excluding this amount, the ratio of net investment income to average net assets would have been 2.08%.dNet investment income per share includes approximately $0.20 per share related to income received in the form of special dividends in connection with certain Fund holdings. Excluding this amount, the ratio of net investment income to average net assets would have been 1.80%.eNet investment income per share includes approximately $0.10 per share related to income received in the form of special dividends in connection with certain Fund holdings. Excluding this amount, the ratio of net investment income to average net assets would have been 2.08%.fTotal return is not annualized for periods less than one year.gRatios are annualized for periods less than one year.hIncludes dividends and/or interest expense on securities sold short and security borrowing fees, if any. See below for the ratios of such expenses to average net assets for the periods presented. See Note 1(d).iBenefit of expense reduction rounds to less than 0.01%.jBenefit of waiver and payments by affiliates rounds to less than 0.01%.kRounds to less than 0.01%.

FRANKLIN MUTUAL SERIES FUNDS
Statement of Investments (unaudited), June 30, 2021Franklin Mutual Global Discovery Fund
franklintempleton.comSemiannual Report The accompanying notes are an integral part of these financial statements.16
a a Country Shares a Valuea a a a a a
Common Stocks 94.2%Aerospace & Defense 2.6%
aAirbus SE . . . . . . . . . . . . . . . . . . . . . . . . . . . . . . . . . . . . . . . . . . . France 880,238 $113,430,735BAE Systems plc . . . . . . . . . . . . . . . . . . . . . . . . . . . . . . . . . . . . . United Kingdom 21,813,405 157,635,522
271,066,257
Auto Components 1.6%Cie Generale des Etablissements Michelin SCA . . . . . . . . . . . . . . France 1,058,149 168,889,917
a,b,cInternational Automotive Components Group Brazil LLC . . . . . . . . Brazil 3,819,425 275,468
169,165,385
Automobiles 1.4%aGeneral Motors Co. . . . . . . . . . . . . . . . . . . . . . . . . . . . . . . . . . . . . United States 2,418,152 143,082,054
Banks 8.4%BNP Paribas SA . . . . . . . . . . . . . . . . . . . . . . . . . . . . . . . . . . . . . . France 3,112,487 195,355,048Citigroup, Inc. . . . . . . . . . . . . . . . . . . . . . . . . . . . . . . . . . . . . . . . . United States 2,261,326 159,988,815ING Groep NV . . . . . . . . . . . . . . . . . . . . . . . . . . . . . . . . . . . . . . . Netherlands 19,204,674 254,951,093Wells Fargo & Co. . . . . . . . . . . . . . . . . . . . . . . . . . . . . . . . . . . . . . United States 5,893,904 266,934,912
877,229,868
Beverages 1.4%Heineken NV . . . . . . . . . . . . . . . . . . . . . . . . . . . . . . . . . . . . . . . . Netherlands 1,242,920 150,902,534
Biotechnology 0.9%aAlexion Pharmaceuticals, Inc. . . . . . . . . . . . . . . . . . . . . . . . . . . . . United States 496,900 91,285,499
Building Products 1.6%Johnson Controls International plc . . . . . . . . . . . . . . . . . . . . . . . . . United States 2,422,107 166,229,203
Capital Markets 1.8%Credit Suisse Group AG, A . . . . . . . . . . . . . . . . . . . . . . . . . . . . . . Switzerland 14,069,420 147,277,642
a,dGuotai Junan Securities Co. Ltd., H, 144A, Reg S . . . . . . . . . . . . . China 29,002,025 41,190,086
188,467,728
Chemicals 2.8%BASF SE . . . . . . . . . . . . . . . . . . . . . . . . . . . . . . . . . . . . . . . . . . . Germany 2,128,478 168,035,732
dCovestro AG, 144A, Reg S . . . . . . . . . . . . . . . . . . . . . . . . . . . . . . Germany 1,989,819 128,669,573
296,705,305
Construction Materials 1.0%HeidelbergCement AG . . . . . . . . . . . . . . . . . . . . . . . . . . . . . . . . . Germany 1,203,248 103,315,424
Consumer Finance 1.5%Capital One Financial Corp. . . . . . . . . . . . . . . . . . . . . . . . . . . . . . United States 1,041,265 161,073,283
Diversified Financial Services 1.9%eVoya Financial, Inc. . . . . . . . . . . . . . . . . . . . . . . . . . . . . . . . . . . . . United States 3,206,753 197,215,310
Diversified Telecommunication Services 3.6%Deutsche Telekom AG . . . . . . . . . . . . . . . . . . . . . . . . . . . . . . . . . . Germany 13,096,354 277,011,329
aFrontier Communications Parent, Inc. . . . . . . . . . . . . . . . . . . . . . . United States 3,852,837 101,714,897
378,726,226
Entertainment 1.8%a,eWalt Disney Co. (The) . . . . . . . . . . . . . . . . . . . . . . . . . . . . . . . . . . United States 1,046,661 183,971,604
Food Products 1.5%Kraft Heinz Co. (The) . . . . . . . . . . . . . . . . . . . . . . . . . . . . . . . . . . United States 3,899,800 159,033,844
Health Care Equipment & Supplies 1.7%Medtronic plc . . . . . . . . . . . . . . . . . . . . . . . . . . . . . . . . . . . . . . . . United States 1,476,101 183,228,417

FRANKLIN MUTUAL SERIES FUNDSSTATEMENT OF INVESTMENTS (UNAUDITED)
Franklin Mutual Global Discovery Fund (continued)
franklintempleton.com The accompanying notes are an integral part of these financial statements. Semiannual Report 17
a a Country Shares a Valuea a a a a a
Common Stocks (continued) Health Care Providers & Services 4.6%Anthem, Inc. . . . . . . . . . . . . . . . . . . . . . . . . . . . . . . . . . . . . . . . . . United States 578,928 $221,034,711CVS Health Corp. . . . . . . . . . . . . . . . . . . . . . . . . . . . . . . . . . . . . . United States 3,156,566 263,383,867
484,418,578
Hotels, Restaurants & Leisure 1.4%aAccor SA . . . . . . . . . . . . . . . . . . . . . . . . . . . . . . . . . . . . . . . . . . . France 3,966,567 148,376,498
Industrial Conglomerates 1.6%General Electric Co. . . . . . . . . . . . . . . . . . . . . . . . . . . . . . . . . . . . United States 12,864,150 173,151,459
Insurance 8.4%aAlleghany Corp. . . . . . . . . . . . . . . . . . . . . . . . . . . . . . . . . . . . . . . United States 188,061 125,449,851China Pacific Insurance Group Co. Ltd., H . . . . . . . . . . . . . . . . . . . China 28,811,032 90,502,502Everest Re Group Ltd. . . . . . . . . . . . . . . . . . . . . . . . . . . . . . . . . . United States 547,000 137,849,470Hartford Financial Services Group, Inc. (The) . . . . . . . . . . . . . . . . United States 2,779,763 172,261,913NN Group NV . . . . . . . . . . . . . . . . . . . . . . . . . . . . . . . . . . . . . . . . Netherlands 4,742,775 224,064,463Willis Towers Watson plc . . . . . . . . . . . . . . . . . . . . . . . . . . . . . . . . United States 591,300 136,010,826
886,139,025
IT Services 3.2%Capgemini SE . . . . . . . . . . . . . . . . . . . . . . . . . . . . . . . . . . . . . . . . France 705,592 135,706,338Cognizant Technology Solutions Corp., A . . . . . . . . . . . . . . . . . . . . United States 2,856,690 197,854,349
333,560,687
Media 2.7%aCharter Communications, Inc., A . . . . . . . . . . . . . . . . . . . . . . . . . . United States 393,865 284,153,904
Oil, Gas & Consumable Fuels 9.5%BP plc . . . . . . . . . . . . . . . . . . . . . . . . . . . . . . . . . . . . . . . . . . . . . . United Kingdom 59,232,197 259,775,364Canadian Natural Resources Ltd. . . . . . . . . . . . . . . . . . . . . . . . . . Canada 5,694,700 206,704,174Inter Pipeline Ltd. . . . . . . . . . . . . . . . . . . . . . . . . . . . . . . . . . . . . . Canada 7,391,495 120,136,015Kinder Morgan, Inc. . . . . . . . . . . . . . . . . . . . . . . . . . . . . . . . . . . . . United States 8,832,758 161,021,178Williams Cos., Inc. (The) . . . . . . . . . . . . . . . . . . . . . . . . . . . . . . . . United States 9,375,435 248,917,799
996,554,530
Pharmaceuticals 10.6%aElanco Animal Health, Inc. . . . . . . . . . . . . . . . . . . . . . . . . . . . . . . . United States 1,852,612 64,267,111eEli Lilly & Co. . . . . . . . . . . . . . . . . . . . . . . . . . . . . . . . . . . . . . . . . United States 925,326 212,380,824GlaxoSmithKline plc . . . . . . . . . . . . . . . . . . . . . . . . . . . . . . . . . . . United Kingdom 16,933,085 332,913,227
eMerck & Co., Inc. . . . . . . . . . . . . . . . . . . . . . . . . . . . . . . . . . . . . . United States 3,504,973 272,581,750Novartis AG, ADR . . . . . . . . . . . . . . . . . . . . . . . . . . . . . . . . . . . . . Switzerland 2,364,276 215,716,542
aOrganon & Co. . . . . . . . . . . . . . . . . . . . . . . . . . . . . . . . . . . . . . . . United States 328,547 9,941,832
1,107,801,286
Road & Rail 0.5%Kansas City Southern . . . . . . . . . . . . . . . . . . . . . . . . . . . . . . . . . . United States 195,300 55,342,161
Semiconductors & Semiconductor Equipment 2.7%aRenesas Electronics Corp. . . . . . . . . . . . . . . . . . . . . . . . . . . . . . . Japan 15,502,134 167,319,694Xilinx, Inc. . . . . . . . . . . . . . . . . . . . . . . . . . . . . . . . . . . . . . . . . . . . United States 793,900 114,829,696
282,149,390
Software 4.7%aAvaya Holdings Corp. . . . . . . . . . . . . . . . . . . . . . . . . . . . . . . . . . . United States 537 14,445aCheck Point Software Technologies Ltd. . . . . . . . . . . . . . . . . . . . . Israel 1,702,597 197,722,590Oracle Corp. . . . . . . . . . . . . . . . . . . . . . . . . . . . . . . . . . . . . . . . . . United States 2,498,666 194,496,161
aSlack Technologies, Inc., A . . . . . . . . . . . . . . . . . . . . . . . . . . . . . . United States 2,346,100 103,932,230
496,165,426

FRANKLIN MUTUAL SERIES FUNDSSTATEMENT OF INVESTMENTS (UNAUDITED)
Franklin Mutual Global Discovery Fund (continued)
franklintempleton.comSemiannual Report The accompanying notes are an integral part of these financial statements.18
a a Country Shares a Valuea a a a a a
Common Stocks (continued) Technology Hardware, Storage & Peripherals 3.9%Catcher Technology Co. Ltd. . . . . . . . . . . . . . . . . . . . . . . . . . . . . . Taiwan 11,600,852 $75,628,329Samsung Electronics Co. Ltd. . . . . . . . . . . . . . . . . . . . . . . . . . . . . South Korea 2,221,535 158,502,645
a,eWestern Digital Corp. . . . . . . . . . . . . . . . . . . . . . . . . . . . . . . . . . . United States 2,387,620 169,926,916
404,057,890
Textiles, Apparel & Luxury Goods 1.5%Cie Financiere Richemont SA . . . . . . . . . . . . . . . . . . . . . . . . . . . . Switzerland 1,283,249 155,566,505
Tobacco 3.4%Altria Group, Inc. . . . . . . . . . . . . . . . . . . . . . . . . . . . . . . . . . . . . . . United States 2,606,727 124,288,743British American Tobacco plc . . . . . . . . . . . . . . . . . . . . . . . . . . . . . United Kingdom 5,861,984 227,611,414
351,900,157
Total Common Stocks (Cost $7,085,743,729) . . . . . . . . . . . . . . . . . . . . . . . . . . . . . . . . . . . . 9,880,035,437
Preferred Stocks 1.1%Automobiles 1.1%fVolkswagen AG, 2.3% . . . . . . . . . . . . . . . . . . . . . . . . . . . . . . . . . . Germany 439,987 110,327,901
Total Preferred Stocks (Cost $60,355,997) . . . . . . . . . . . . . . . . . . . . . . . . . . . . . . . . . . . . . . 110,327,901
Warrants
Warrants 0.0%†
Software 0.0%†
aAvaya Holdings Corp., 12/15/22 . . . . . . . . . . . . . . . . . . . . . . . . . . United States 280,051 1,436,661
Textiles, Apparel & Luxury Goods 0.0%†
aCie Financiere Richemont SA, 11/22/23 . . . . . . . . . . . . . . . . . . . . . Switzerland 3,074,198 2,059,987
Total Warrants (Cost $—) . . . . . . . . . . . . . . . . . . . . . . . . . . . . . . . . . . . . . . . . . . . . . . . . . . . . . 3,496,648
Principal Amount*
Convertible Bonds 0.0%†
Banks 0.0%†
dCredit Suisse Group Guernsey VII Ltd., BR, Senior Note, 144A, Reg S, 3%, 11/12/21 . . . . . . . . . . . . . . . . . . . . . . . . . . . . . . . . . . . . . Switzerland 5,924,000 CHF 7,209,961
Total Convertible Bonds (Cost $6,523,152) . . . . . . . . . . . . . . . . . . . . . . . . . . . . . . . . . . . . . 7,209,961
Corporate Bonds 2.1%Airlines 1.9%
dAmerican Airlines Inc/AAdvantage Loyalty IP Ltd.,Senior Secured Note, 144A, 5.5%, 4/20/26 . . . . . . . . . . . . . . . . United States 40,715,000 43,157,900Senior Secured Note, 144A, 5.75%, 4/20/29 . . . . . . . . . . . . . . . United States 3,257,000 3,525,703
dAmerican Airlines, Inc., Senior Secured Note, 144A, 11.75%, 7/15/25 United States 77,131,000 96,895,819dMileage Plus Holdings LLC / Mileage Plus Intellectual Property
Assets Ltd., Senior Secured Note, 144A, 6.5%, 6/20/27 . . . . . . . United States 47,777,000 52,662,198
196,241,620
Multiline Retail 0.2%dMacy's, Inc., Senior Secured Note, 144A, 8.375%, 6/15/25 . . . . . . United States 19,531,000 21,556,462
Total Corporate Bonds (Cost $187,231,029) . . . . . . . . . . . . . . . . . . . . . . . . . . . . . . . . . . . . . 217,798,082

FRANKLIN MUTUAL SERIES FUNDSSTATEMENT OF INVESTMENTS (UNAUDITED)
Franklin Mutual Global Discovery Fund (continued)
franklintempleton.com The accompanying notes are an integral part of these financial statements. Semiannual Report 19
a a CountryPrincipal Amount*
a Valuea a a a a a
g,hSenior Floating Rate Interests 0.1%Airlines 0.1%AAdvantage Loyalty IP Ltd. (American Airlines, Inc.), Initial Term
Loan, 5.5%, (3-month USD LIBOR + 4.75%), 4/20/28 . . . . . . . . . United States 8,515,000 $8,888,084
Total Senior Floating Rate Interests (Cost $8,432,802) . . . . . . . . . . . . . . . . . . . . . . . . . . . 8,888,084
Shares
Companies in Liquidation 0.0%a,b,iTribune Media, Litigation Trust, Contingent Distribution . . . . . . . . . United States 1,297,978 —a,b,iVistra Energy Corp., Litigation Trust, Contingent Distribution . . . . . United States 142,325,613 —a,b,iWalter Energy, Inc., Litigation Trust, Contingent Distribution . . . . . . United States 30,996,000 —
Total Companies in Liquidation (Cost $4,500,343) . . . . . . . . . . . . . . . . . . . . . . . . . . . . . . . —
Total Long Term Investments (Cost $7,352,787,052) . . . . . . . . . . . . . . . . . . . . . . . . . . . . . 10,227,756,113 a
Short Term Investments 1.4%
a a CountryPrincipal Amount*
a Valuea a a a a a
U.S. Government and Agency Securities 1.4%jFHLB, 7/01/21 . . . . . . . . . . . . . . . . . . . . . . . . . . . . . . . . . . . . . . . United States 700,000 700,000
jU.S. Treasury Bills,7/01/21 . . . . . . . . . . . . . . . . . . . . . . . . . . . . . . . . . . . . . . . . . . . United States 36,700,000 36,700,0007/13/21 . . . . . . . . . . . . . . . . . . . . . . . . . . . . . . . . . . . . . . . . . . . United States 50,000,000 49,999,375
e 10/21/21 . . . . . . . . . . . . . . . . . . . . . . . . . . . . . . . . . . . . . . . . . . United States 16,500,000 16,497,81810/28/21 . . . . . . . . . . . . . . . . . . . . . . . . . . . . . . . . . . . . . . . . . . United States 22,000,000 21,996,36411/04/21 . . . . . . . . . . . . . . . . . . . . . . . . . . . . . . . . . . . . . . . . . . United States 25,000,000 24,995,771
150,189,328
Total U.S. Government and Agency Securities (Cost $150,893,298) . . . . . . . . . . . . . . . . 150,889,328
Total Short Term Investments (Cost $150,893,298) . . . . . . . . . . . . . . . . . . . . . . . . . . . . . . . 150,889,328
a
Total Investments (Cost $7,503,680,350) 98.9% . . . . . . . . . . . . . . . . . . . . . . . . . . . . . . . . . . $10,378,645,441Securities Sold Short (3.7)% . . . . . . . . . . . . . . . . . . . . . . . . . . . . . . . . . . . . . . . . . . . . . . . . . . (386,327,639)Other Assets, less Liabilities 4.8% . . . . . . . . . . . . . . . . . . . . . . . . . . . . . . . . . . . . . . . . . . . . . 500,503,933
Net Assets 100.0% . . . . . . . . . . . . . . . . . . . . . . . . . . . . . . . . . . . . . . . . . . . . . . . . . . . . . . . . . . . $10,492,821,735
Shares
Securities Sold Short (3.7)%Common Stocks (3.7)%Insurance (1.4)%
kAon plc, A . . . . . . . . . . . . . . . . . . . . . . . . . . . . . . . . . . . . . . . . . . . United States 589,248 (140,688,852)
Pharmaceuticals (0.6)%kAstraZeneca plc, ADR . . . . . . . . . . . . . . . . . . . . . . . . . . . . . . . . . . United Kingdom 1,055,565 (63,228,344)
Road & Rail (0.1)%kCanadian National Railway Co. . . . . . . . . . . . . . . . . . . . . . . . . . . . Canada 89,304 (9,423,358)
Semiconductors & Semiconductor Equipment (1.2)%kAdvanced Micro Devices, Inc. . . . . . . . . . . . . . . . . . . . . . . . . . . . . United States 1,368,208 (128,515,777)

FRANKLIN MUTUAL SERIES FUNDSSTATEMENT OF INVESTMENTS (UNAUDITED)
Franklin Mutual Global Discovery Fund (continued)
franklintempleton.comSemiannual Report The accompanying notes are an integral part of these financial statements.20
a
a a Country Shares a Valuea a a a a a
Securities Sold Short (continued)
Common Stocks (continued)
Software (0.4)%ksalesforce.com, Inc. . . . . . . . . . . . . . . . . . . . . . . . . . . . . . . . . . . . United States 182,058 (44,471,308)
Total Common Stocks (Proceeds $352,437,752) . . . . . . . . . . . . . . . . . . . . . . . . . . . . . . . . . (386,327,639)
Total Securities Sold Short (Proceeds $352,437,752) . . . . . . . . . . . . . . . . . . . . . . . . . . . . . $(386,327,639)
* The principal amount is stated in U.S. dollars unless otherwise indicated.† Rounds to less than 0.1% of net assets.a Non-income producing.b Fair valued using significant unobservable inputs. See Note 13 regarding fair value measurements.c See Note 10 regarding restricted securities.d Security was purchased pursuant to Rule 144A or Regulation S under the Securities Act of 1933. 144A securities may be sold in transactions exempt from registration only to qualified institutional buyers or in a public offering registered under the Securities Act of 1933. Regulation S securities cannot be sold in the United States without either an effective registration statement filed pursuant to the Securities Act of 1933, or pursuant to an exemption from registration. At June 30, 2021, the aggregate value of these securities was $394,867,702, representing 3.8% of net assets.e A portion or all of the security has been segregated as collateral for securities sold short and/or open forward exchange contracts. At June 30, 2021, the aggregate value of these securities pledged amounted to $522,633,836, representing 5.0% of net assets.f Variable rate security. The rate shown represents the yield at period end.g See Note 1(f) regarding senior floating rate interests.h The coupon rate shown represents the rate at period end.i Contingent distributions represent the right to receive additional distributions, if any, during the reorganization of the underlying company. Shares represent total underlying principal of debt securities. j The security was issued on a discount basis with no stated coupon rate.k See Note 1(d) regarding securities sold short.

FRANKLIN MUTUAL SERIES FUNDSSTATEMENT OF INVESTMENTS (UNAUDITED)
Franklin Mutual Global Discovery Fund (continued)
franklintempleton.com The accompanying notes are an integral part of these financial statements. Semiannual Report 21
At June 30, 2021, the Fund had the following futures contracts outstanding. See Note 1(c).
Futures Contracts
Description TypeNumber of Contracts
Notional Amount*
Expiration Date
Value/ Unrealized
Appreciation (Depreciation)
Foreign exchange contractsForeign Exchange EUR/USD . . . . . . . . . . . . . . . . . . . Short 2,929 $434,407,312 9/13/21 $12,916,530Foreign Exchange GBP/USD . . . . . . . . . . . . . . . . . . . Short 2,262 195,168,188 9/13/21 5,253,257
Total Futures Contracts . . . . . . . . . . . . . . . . . . . . . . . . . . . . . . . . . . . . . . . . . . . . . . . . . . . . . . . . . . . . . . . . . . . . . . $18,169,787
*As of period end.
At June 30, 2021, the Fund had the following forward exchange contracts outstanding. See Note 1(c).
Forward Exchange Contracts
CurrencyCounter-
partya Type QuantityContract Amount*
Settlement Date
Unrealized Appreciation
Unrealized Depreciation
a a a a a a a a
OTC Forward Exchange ContractsCanadian Dollar . . . . HSBK Sell 118,606,773 97,829,727 7/19/21 $2,162,658 $—Canadian Dollar . . . . UBSW Sell 16,754,753 13,873,130 7/19/21 358,906 —Swiss Franc . . . . . . . HSBK Sell 139,010,427 153,171,432 7/19/21 2,865,115 —British Pound . . . . . . SSBT Sell 3,954,230 5,496,024 7/23/21 25,535 —British Pound . . . . . . UBSW Buy 3,954,230 5,596,516 7/23/21 — (126,027)British Pound . . . . . . HSBK Buy 6,568,998 9,263,340 8/18/21 2,876 (177,949)British Pound . . . . . . SSBT Sell 1,249,495 1,761,298 8/18/21 32,611 —British Pound . . . . . . UBSW Buy 15,066,078 21,194,048 8/18/21 — (349,993)British Pound . . . . . . UBSW Sell 58,530,776 82,502,670 8/18/21 1,524,815 —Euro . . . . . . . . . . . . . HSBK Sell 152,684,140 185,408,983 8/23/21 4,144,409 —Euro . . . . . . . . . . . . . SSBT Buy 6,948,741 8,417,885 8/23/21 — (168,433)Euro . . . . . . . . . . . . . UBSW Sell 1,949,414 2,391,751 8/23/21 77,433 —New Taiwan Dollar . . HSBK Sell 1,302,109,438 46,880,335 8/27/21 32,259 (3,131)New Taiwan Dollar . . UBSW Sell 734,711,894 26,513,175 8/27/21 77,502 —Euro . . . . . . . . . . . . . HSBK Sell 131,668,784 156,829,206 10/07/21 1,019,239 (662,421)Euro . . . . . . . . . . . . . SSBT Sell 81,310,888 95,957,419 10/07/21 — (670,714)Euro . . . . . . . . . . . . . UBSW Sell 67,018,988 81,242,803 10/07/21 1,598,862 —Euro . . . . . . . . . . . . . HSBK Sell 63,028,980 76,587,169 11/17/21 1,609,640 —Euro . . . . . . . . . . . . . SSBT Sell 17,000,000 20,799,517 11/17/21 576,788 —Euro . . . . . . . . . . . . . UBSW Sell 71,680,845 86,725,789 11/17/21 1,456,240 —South Korean Won . . HSBK Sell 2,120,543,905 1,881,583 11/19/21 6,176 —South Korean Won . . UBSW Sell 2,556,005,623 2,269,080 11/19/21 8,552 —South Korean Won . . HSBK Sell 49,143,964,054 44,220,856 12/17/21 765,748 —South Korean Won . . UBSW Sell 78,805,125,918 70,943,200 12/17/21 1,260,477 —
Total Forward Exchange Contracts . . . . . . . . . . . . . . . . . . . . . . . . . . . . . . . . . . . . . . . . . . . . . . . . . . . $19,605,841 $(2,158,668)Net unrealized appreciation (depreciation) . . . . . . . . . . . . . . . . . . . . . . . . . . . . . . . . . . . . . . . . . . . . $17,447,173
aMay be comprised of multiple contracts with the same counterparty, currency and settlement date.*In U.S. dollars unless otherwise indicated.
See Note 11 regarding other derivative information.
See Abbreviations on page 40.

FRANKLIN MUTUAL SERIES FUNDSFINANCIAL STATEMENTS
Statement of Assets and LiabilitiesJune 30, 2021 (unaudited)
franklintempleton.comSemiannual Report The accompanying notes are an integral part of these financial statements.22
Franklin Mutual Global
Discovery Fund
Assets:Investments in securities:
Cost - Unaffiliated issuers . . . . . . . . . . . . . . . . . . . . . . . . . . . . . . . . . . . . . . . . . . . . . . . . . . . . . . . . . . . . . . . . . . . $7,503,680,350
Value - Unaffiliated issuers . . . . . . . . . . . . . . . . . . . . . . . . . . . . . . . . . . . . . . . . . . . . . . . . . . . . . . . . . . . . . . . . . . $10,378,645,441Cash . . . . . . . . . . . . . . . . . . . . . . . . . . . . . . . . . . . . . . . . . . . . . . . . . . . . . . . . . . . . . . . . . . . . . . . . . . . . . . . . . . . . 18,546,799Foreign currency, at value (cost $8,596,428) . . . . . . . . . . . . . . . . . . . . . . . . . . . . . . . . . . . . . . . . . . . . . . . . . . . . . . 8,596,428Receivables:
Investment securities sold . . . . . . . . . . . . . . . . . . . . . . . . . . . . . . . . . . . . . . . . . . . . . . . . . . . . . . . . . . . . . . . . . . . 68,134,649Capital shares sold . . . . . . . . . . . . . . . . . . . . . . . . . . . . . . . . . . . . . . . . . . . . . . . . . . . . . . . . . . . . . . . . . . . . . . . . 2,759,064Dividends and interest . . . . . . . . . . . . . . . . . . . . . . . . . . . . . . . . . . . . . . . . . . . . . . . . . . . . . . . . . . . . . . . . . . . . . 30,039,840European Union tax reclaims (Note 1g) . . . . . . . . . . . . . . . . . . . . . . . . . . . . . . . . . . . . . . . . . . . . . . . . . . . . . . . . . 10,872,394Deposits with brokers for:
Securities sold short . . . . . . . . . . . . . . . . . . . . . . . . . . . . . . . . . . . . . . . . . . . . . . . . . . . . . . . . . . . . . . . . . . . . . 386,186,020Futures contracts . . . . . . . . . . . . . . . . . . . . . . . . . . . . . . . . . . . . . . . . . . . . . . . . . . . . . . . . . . . . . . . . . . . . . . . . 11,838,585
Variation margin on futures contracts . . . . . . . . . . . . . . . . . . . . . . . . . . . . . . . . . . . . . . . . . . . . . . . . . . . . . . . . . . . 2,692,288Unrealized appreciation on OTC forward exchange contracts . . . . . . . . . . . . . . . . . . . . . . . . . . . . . . . . . . . . . . . . . . 19,605,841Other assets . . . . . . . . . . . . . . . . . . . . . . . . . . . . . . . . . . . . . . . . . . . . . . . . . . . . . . . . . . . . . . . . . . . . . . . . . . . . . . 1,380,944
Total assets . . . . . . . . . . . . . . . . . . . . . . . . . . . . . . . . . . . . . . . . . . . . . . . . . . . . . . . . . . . . . . . . . . . . . . . . . . 10,939,298,293Liabilities:
Payables:Investment securities purchased . . . . . . . . . . . . . . . . . . . . . . . . . . . . . . . . . . . . . . . . . . . . . . . . . . . . . . . . . . . . . . 21,130,121Capital shares redeemed . . . . . . . . . . . . . . . . . . . . . . . . . . . . . . . . . . . . . . . . . . . . . . . . . . . . . . . . . . . . . . . . . . . 12,934,112Management fees . . . . . . . . . . . . . . . . . . . . . . . . . . . . . . . . . . . . . . . . . . . . . . . . . . . . . . . . . . . . . . . . . . . . . . . . . 7,436,613Distribution fees . . . . . . . . . . . . . . . . . . . . . . . . . . . . . . . . . . . . . . . . . . . . . . . . . . . . . . . . . . . . . . . . . . . . . . . . . . 1,656,378Transfer agent fees . . . . . . . . . . . . . . . . . . . . . . . . . . . . . . . . . . . . . . . . . . . . . . . . . . . . . . . . . . . . . . . . . . . . . . . . 1,969,789Trustees' fees and expenses . . . . . . . . . . . . . . . . . . . . . . . . . . . . . . . . . . . . . . . . . . . . . . . . . . . . . . . . . . . . . . . . . 1,191,193
Securities sold short, at value (proceeds $352,437,752) . . . . . . . . . . . . . . . . . . . . . . . . . . . . . . . . . . . . . . . . . . . . . . 386,327,639Unrealized depreciation on OTC forward exchange contracts . . . . . . . . . . . . . . . . . . . . . . . . . . . . . . . . . . . . . . . . . . 2,158,668Accrued expenses and other liabilities . . . . . . . . . . . . . . . . . . . . . . . . . . . . . . . . . . . . . . . . . . . . . . . . . . . . . . . . . . . 11,672,045
Total liabilities . . . . . . . . . . . . . . . . . . . . . . . . . . . . . . . . . . . . . . . . . . . . . . . . . . . . . . . . . . . . . . . . . . . . . . . . . 446,476,558Net assets, at value . . . . . . . . . . . . . . . . . . . . . . . . . . . . . . . . . . . . . . . . . . . . . . . . . . . . . . . . . . . . . . . . . $10,492,821,735
Net assets consist of:Paid-in capital . . . . . . . . . . . . . . . . . . . . . . . . . . . . . . . . . . . . . . . . . . . . . . . . . . . . . . . . . . . . . . . . . . . . . . . . . . . . . $7,357,526,514Total distributable earnings (losses) . . . . . . . . . . . . . . . . . . . . . . . . . . . . . . . . . . . . . . . . . . . . . . . . . . . . . . . . . . . . . 3,135,295,221
Net assets, at value . . . . . . . . . . . . . . . . . . . . . . . . . . . . . . . . . . . . . . . . . . . . . . . . . . . . . . . . . . . . . . . . . $10,492,821,735

FRANKLIN MUTUAL SERIES FUNDSFINANCIAL STATEMENTS
Statement of Assets and Liabilities (continued)
June 30, 2021 (unaudited)
franklintempleton.com The accompanying notes are an integral part of these financial statements. Semiannual Report 23
Franklin Mutual Global
Discovery Fund
Class Z:Net assets, at value . . . . . . . . . . . . . . . . . . . . . . . . . . . . . . . . . . . . . . . . . . . . . . . . . . . . . . . . . . . . . . . . . . . . . . . $3,460,781,638Shares outstanding . . . . . . . . . . . . . . . . . . . . . . . . . . . . . . . . . . . . . . . . . . . . . . . . . . . . . . . . . . . . . . . . . . . . . . . . 103,672,972Net asset value and maximum offering price per share . . . . . . . . . . . . . . . . . . . . . . . . . . . . . . . . . . . . . . . . . . . . . $33.38
Class A:Net assets, at value . . . . . . . . . . . . . . . . . . . . . . . . . . . . . . . . . . . . . . . . . . . . . . . . . . . . . . . . . . . . . . . . . . . . . . . $5,702,618,323Shares outstanding . . . . . . . . . . . . . . . . . . . . . . . . . . . . . . . . . . . . . . . . . . . . . . . . . . . . . . . . . . . . . . . . . . . . . . . . 174,999,243Net asset value per sharea . . . . . . . . . . . . . . . . . . . . . . . . . . . . . . . . . . . . . . . . . . . . . . . . . . . . . . . . . . . . . . . . . . $32.59Maximum offering price per share (net asset value per share ÷ 94.50%) . . . . . . . . . . . . . . . . . . . . . . . . . . . . . . . . $34.49
Class C:Net assets, at value . . . . . . . . . . . . . . . . . . . . . . . . . . . . . . . . . . . . . . . . . . . . . . . . . . . . . . . . . . . . . . . . . . . . . . . $469,703,457Shares outstanding . . . . . . . . . . . . . . . . . . . . . . . . . . . . . . . . . . . . . . . . . . . . . . . . . . . . . . . . . . . . . . . . . . . . . . . . 14,465,162Net asset value and maximum offering price per sharea . . . . . . . . . . . . . . . . . . . . . . . . . . . . . . . . . . . . . . . . . . . . . $32.47
Class R:Net assets, at value . . . . . . . . . . . . . . . . . . . . . . . . . . . . . . . . . . . . . . . . . . . . . . . . . . . . . . . . . . . . . . . . . . . . . . . $166,255,505Shares outstanding . . . . . . . . . . . . . . . . . . . . . . . . . . . . . . . . . . . . . . . . . . . . . . . . . . . . . . . . . . . . . . . . . . . . . . . . 5,184,990Net asset value and maximum offering price per share . . . . . . . . . . . . . . . . . . . . . . . . . . . . . . . . . . . . . . . . . . . . . $32.06
Class R6:Net assets, at value . . . . . . . . . . . . . . . . . . . . . . . . . . . . . . . . . . . . . . . . . . . . . . . . . . . . . . . . . . . . . . . . . . . . . . . $693,462,812Shares outstanding . . . . . . . . . . . . . . . . . . . . . . . . . . . . . . . . . . . . . . . . . . . . . . . . . . . . . . . . . . . . . . . . . . . . . . . . 20,775,549Net asset value and maximum offering price per share . . . . . . . . . . . . . . . . . . . . . . . . . . . . . . . . . . . . . . . . . . . . . $33.38
aRedemption price is equal to net asset value less contingent deferred sales charges, if applicable.

FRANKLIN MUTUAL SERIES FUNDSFINANCIAL STATEMENTS
Statement of Operationsfor the six months ended June 30, 2021 (unaudited)
franklintempleton.comSemiannual Report The accompanying notes are an integral part of these financial statements.24
Franklin Mutual Global
Discovery Fund
Investment income:Dividends: (net of foreign taxes of $8,501,001)
Unaffiliated issuers . . . . . . . . . . . . . . . . . . . . . . . . . . . . . . . . . . . . . . . . . . . . . . . . . . . . . . . . . . . . . . . . . . . . . . . . $143,407,303Interest:
Unaffiliated issuers . . . . . . . . . . . . . . . . . . . . . . . . . . . . . . . . . . . . . . . . . . . . . . . . . . . . . . . . . . . . . . . . . . . . . . . . 7,957,953Income from securities loaned:
Unaffiliated entities (net of fees and rebates) . . . . . . . . . . . . . . . . . . . . . . . . . . . . . . . . . . . . . . . . . . . . . . . . . . . . . 4,395Non-controlled affiliates (Note 3f) . . . . . . . . . . . . . . . . . . . . . . . . . . . . . . . . . . . . . . . . . . . . . . . . . . . . . . . . . . . . . 33
Other income (Note 1g) . . . . . . . . . . . . . . . . . . . . . . . . . . . . . . . . . . . . . . . . . . . . . . . . . . . . . . . . . . . . . . . . . . . . . . 7,026,847Total investment income . . . . . . . . . . . . . . . . . . . . . . . . . . . . . . . . . . . . . . . . . . . . . . . . . . . . . . . . . . . . . . . . . . . 158,396,531
Expenses:Management fees (Note 3a) . . . . . . . . . . . . . . . . . . . . . . . . . . . . . . . . . . . . . . . . . . . . . . . . . . . . . . . . . . . . . . . . . . . 43,981,295Distribution fees: (Note 3c) Class A . . . . . . . . . . . . . . . . . . . . . . . . . . . . . . . . . . . . . . . . . . . . . . . . . . . . . . . . . . . . . . . . . . . . . . . . . . . . . . . . 6,952,883 Class C . . . . . . . . . . . . . . . . . . . . . . . . . . . . . . . . . . . . . . . . . . . . . . . . . . . . . . . . . . . . . . . . . . . . . . . . . . . . . . . . 2,408,888 Class R . . . . . . . . . . . . . . . . . . . . . . . . . . . . . . . . . . . . . . . . . . . . . . . . . . . . . . . . . . . . . . . . . . . . . . . . . . . . . . . . 426,933Transfer agent fees: (Note 3e) Class Z . . . . . . . . . . . . . . . . . . . . . . . . . . . . . . . . . . . . . . . . . . . . . . . . . . . . . . . . . . . . . . . . . . . . . . . . . . . . . . . . 2,127,133 Class A . . . . . . . . . . . . . . . . . . . . . . . . . . . . . . . . . . . . . . . . . . . . . . . . . . . . . . . . . . . . . . . . . . . . . . . . . . . . . . . . 3,494,183 Class C . . . . . . . . . . . . . . . . . . . . . . . . . . . . . . . . . . . . . . . . . . . . . . . . . . . . . . . . . . . . . . . . . . . . . . . . . . . . . . . . 302,474 Class R . . . . . . . . . . . . . . . . . . . . . . . . . . . . . . . . . . . . . . . . . . . . . . . . . . . . . . . . . . . . . . . . . . . . . . . . . . . . . . . . 107,221 Class R6 . . . . . . . . . . . . . . . . . . . . . . . . . . . . . . . . . . . . . . . . . . . . . . . . . . . . . . . . . . . . . . . . . . . . . . . . . . . . . . . 128,441Custodian fees (Note 4) . . . . . . . . . . . . . . . . . . . . . . . . . . . . . . . . . . . . . . . . . . . . . . . . . . . . . . . . . . . . . . . . . . . . . . 130,005Reports to shareholders . . . . . . . . . . . . . . . . . . . . . . . . . . . . . . . . . . . . . . . . . . . . . . . . . . . . . . . . . . . . . . . . . . . . . . 885,906Registration and filing fees . . . . . . . . . . . . . . . . . . . . . . . . . . . . . . . . . . . . . . . . . . . . . . . . . . . . . . . . . . . . . . . . . . . . 98,046Professional fees . . . . . . . . . . . . . . . . . . . . . . . . . . . . . . . . . . . . . . . . . . . . . . . . . . . . . . . . . . . . . . . . . . . . . . . . . . . 217,677Trustees' fees and expenses . . . . . . . . . . . . . . . . . . . . . . . . . . . . . . . . . . . . . . . . . . . . . . . . . . . . . . . . . . . . . . . . . . 401,423Dividends on securities sold short . . . . . . . . . . . . . . . . . . . . . . . . . . . . . . . . . . . . . . . . . . . . . . . . . . . . . . . . . . . . . . 1,600,102Other . . . . . . . . . . . . . . . . . . . . . . . . . . . . . . . . . . . . . . . . . . . . . . . . . . . . . . . . . . . . . . . . . . . . . . . . . . . . . . . . . . . . 166,071
Total expenses . . . . . . . . . . . . . . . . . . . . . . . . . . . . . . . . . . . . . . . . . . . . . . . . . . . . . . . . . . . . . . . . . . . . . . . . . 63,428,681Expense reductions (Note 4) . . . . . . . . . . . . . . . . . . . . . . . . . . . . . . . . . . . . . . . . . . . . . . . . . . . . . . . . . . . . . . . (207)Expenses waived/paid by affiliates (Note 3f and 3g) . . . . . . . . . . . . . . . . . . . . . . . . . . . . . . . . . . . . . . . . . . . . . . (14,574)
Net expenses . . . . . . . . . . . . . . . . . . . . . . . . . . . . . . . . . . . . . . . . . . . . . . . . . . . . . . . . . . . . . . . . . . . . . . . . . 63,413,900Net investment income . . . . . . . . . . . . . . . . . . . . . . . . . . . . . . . . . . . . . . . . . . . . . . . . . . . . . . . . . . . . . . . . 94,982,631
Realized and unrealized gains (losses):Net realized gain (loss) from:
Investments: Unaffiliated issuers . . . . . . . . . . . . . . . . . . . . . . . . . . . . . . . . . . . . . . . . . . . . . . . . . . . . . . . . . . . . . . . . . . . . . . 584,412,002
Foreign currency transactions . . . . . . . . . . . . . . . . . . . . . . . . . . . . . . . . . . . . . . . . . . . . . . . . . . . . . . . . . . . . . . . . (126,550)Forward exchange contracts . . . . . . . . . . . . . . . . . . . . . . . . . . . . . . . . . . . . . . . . . . . . . . . . . . . . . . . . . . . . . . . . . (17,128,008)Futures contracts . . . . . . . . . . . . . . . . . . . . . . . . . . . . . . . . . . . . . . . . . . . . . . . . . . . . . . . . . . . . . . . . . . . . . . . . . (12,490,285)Securities sold short . . . . . . . . . . . . . . . . . . . . . . . . . . . . . . . . . . . . . . . . . . . . . . . . . . . . . . . . . . . . . . . . . . . . . . . (4,379,690)
Net realized gain (loss) . . . . . . . . . . . . . . . . . . . . . . . . . . . . . . . . . . . . . . . . . . . . . . . . . . . . . . . . . . . . . . . . . . 550,287,469Net change in unrealized appreciation (depreciation) on:
Investments:Unaffiliated issuers . . . . . . . . . . . . . . . . . . . . . . . . . . . . . . . . . . . . . . . . . . . . . . . . . . . . . . . . . . . . . . . . . . . . . . 843,917,150
Translation of other assets and liabilities denominated in foreign currencies . . . . . . . . . . . . . . . . . . . . . . . . . . . . . . (2,055,181)Forward exchange contracts . . . . . . . . . . . . . . . . . . . . . . . . . . . . . . . . . . . . . . . . . . . . . . . . . . . . . . . . . . . . . . . . . 53,502,894Futures contracts . . . . . . . . . . . . . . . . . . . . . . . . . . . . . . . . . . . . . . . . . . . . . . . . . . . . . . . . . . . . . . . . . . . . . . . . . 24,419,907Securities sold short . . . . . . . . . . . . . . . . . . . . . . . . . . . . . . . . . . . . . . . . . . . . . . . . . . . . . . . . . . . . . . . . . . . . . . . (31,621,896)
Net change in unrealized appreciation (depreciation) . . . . . . . . . . . . . . . . . . . . . . . . . . . . . . . . . . . . . . . . . . . . 888,162,874Net realized and unrealized gain (loss) . . . . . . . . . . . . . . . . . . . . . . . . . . . . . . . . . . . . . . . . . . . . . . . . . . . . . . . . . . . . 1,438,450,343Net increase (decrease) in net assets resulting from operations . . . . . . . . . . . . . . . . . . . . . . . . . . . . . . . . . . . . . . . . . . $1,533,432,974

FRANKLIN MUTUAL SERIES FUNDSFINANCIAL STATEMENTS
Statements of Changes in Net Assets
franklintempleton.com The accompanying notes are an integral part of these financial statements. Semiannual Report 25
Franklin Mutual Global Discovery FundSix Months Ended
June 30, 2021 (unaudited)
Year Ended December 31, 2020
Increase (decrease) in net assets:Operations:
Net investment income . . . . . . . . . . . . . . . . . . . . . . . . . . . . . . . . . . . . . . . . . . . . . . . . . $94,982,631 $376,927,972Net realized gain (loss) . . . . . . . . . . . . . . . . . . . . . . . . . . . . . . . . . . . . . . . . . . . . . . . . . 550,287,469 (534,362,129)Net change in unrealized appreciation (depreciation) . . . . . . . . . . . . . . . . . . . . . . . . . . . 888,162,874 (1,200,560,423)
Net increase (decrease) in net assets resulting from operations . . . . . . . . . . . . . . . . 1,533,432,974 (1,357,994,580)Distributions to shareholders: Class Z . . . . . . . . . . . . . . . . . . . . . . . . . . . . . . . . . . . . . . . . . . . . . . . . . . . . . . . . . . . . . — (114,749,627) Class A . . . . . . . . . . . . . . . . . . . . . . . . . . . . . . . . . . . . . . . . . . . . . . . . . . . . . . . . . . . . . — (179,565,272) Class C . . . . . . . . . . . . . . . . . . . . . . . . . . . . . . . . . . . . . . . . . . . . . . . . . . . . . . . . . . . . . — (12,234,587) Class R . . . . . . . . . . . . . . . . . . . . . . . . . . . . . . . . . . . . . . . . . . . . . . . . . . . . . . . . . . . . . — (5,652,491) Class R6 . . . . . . . . . . . . . . . . . . . . . . . . . . . . . . . . . . . . . . . . . . . . . . . . . . . . . . . . . . . . — (30,706,058)Total distributions to shareholders . . . . . . . . . . . . . . . . . . . . . . . . . . . . . . . . . . . . . . . . . . — (342,908,035)Capital share transactions: (Note 2) Class Z . . . . . . . . . . . . . . . . . . . . . . . . . . . . . . . . . . . . . . . . . . . . . . . . . . . . . . . . . . . . . (316,818,003) (1,287,029,331) Class A . . . . . . . . . . . . . . . . . . . . . . . . . . . . . . . . . . . . . . . . . . . . . . . . . . . . . . . . . . . . . (472,977,101) (1,502,192,342) Class C . . . . . . . . . . . . . . . . . . . . . . . . . . . . . . . . . . . . . . . . . . . . . . . . . . . . . . . . . . . . . (95,207,158) (272,533,751) Class R . . . . . . . . . . . . . . . . . . . . . . . . . . . . . . . . . . . . . . . . . . . . . . . . . . . . . . . . . . . . . (34,101,927) (52,024,364) Class R6 . . . . . . . . . . . . . . . . . . . . . . . . . . . . . . . . . . . . . . . . . . . . . . . . . . . . . . . . . . . . (267,620,754) (318,898,089)Total capital share transactions . . . . . . . . . . . . . . . . . . . . . . . . . . . . . . . . . . . . . . . . . . . . (1,186,724,943) (3,432,677,877)
Net increase (decrease) in net assets . . . . . . . . . . . . . . . . . . . . . . . . . . . . . . . . . . . 346,708,031 (5,133,580,492)Net assets:
Beginning of period . . . . . . . . . . . . . . . . . . . . . . . . . . . . . . . . . . . . . . . . . . . . . . . . . . . . . 10,146,113,704 15,279,694,196End of period . . . . . . . . . . . . . . . . . . . . . . . . . . . . . . . . . . . . . . . . . . . . . . . . . . . . . . . . . . $10,492,821,735 $10,146,113,704

FRANKLIN MUTUAL SERIES FUNDS
Notes to Financial Statements (unaudited)Franklin Mutual Global Discovery Fund
26 franklintempleton.comSemiannual Report
1. Organization and Significant Accounting Policies
Franklin Mutual Series Funds (Trust) is registered under the Investment Company Act of 1940 (1940 Act) as an open-end management investment company, consisting of six separate funds and applies the specialized accounting and reporting guidance in U.S. Generally Accepted Accounting Principles (U.S. GAAP). Franklin Mutual Global Discovery Fund (Fund) is included in this report. The Fund offers five classes of shares: Class Z, Class A, Class C, Class R and Class R6. Class C shares automatically convert to Class A shares after they have been held for 10 years. Each class of shares may differ by its initial sales load, contingent deferred sales charges, voting rights on matters affecting a single class, its exchange privilege and fees due to differing arrangements for distribution and transfer agent fees.
The following summarizes the Fund's significant accounting policies.
a. Financial Instrument Valuation The Fund's investments in financial instruments are carried at fair value daily. Fair value is the price that would be received to sell an asset or paid to transfer a liability in an orderly transaction between market participants on the measurement date. The Fund calculates the net asset value (NAV) per share each business day as of 4 p.m. Eastern time or the regularly scheduled close of the New York Stock Exchange (NYSE), whichever is earlier. Under compliance policies and procedures approved by the Trust’s Board of Trustees (the Board), the Fund's administrator has responsibility for oversight of valuation, including leading the cross-functional Valuation Committee (VC). The Fund may utilize independent pricing services, quotations from securities and financial instrument dealers, and other market sources to determine fair value.
Equity securities and derivative financial instruments listed on an exchange or on the NASDAQ National Market System are valued at the last quoted sale price or the official closing price of the day, respectively. Foreign equity securities are valued as of the close of trading on the foreign stock exchange on which the security is primarily traded, or as of 4 p.m. Eastern time. The value is then converted into its U.S. dollar equivalent at the foreign exchange rate in effect at 4 p.m. Eastern time on the day that the value of the security is determined. Over-the-counter (OTC) securities are valued within the range of the most recent quoted bid and ask prices. Securities that trade in multiple markets or on multiple
exchanges are valued according to the broadest and most representative market. Certain equity securities are valued based upon fundamental characteristics or relationships to similar securities.
Debt securities generally trade in the OTC market rather than on a securities exchange. The Fund's pricing services use multiple valuation techniques to determine fair value. In instances where sufficient market activity exists, the pricing services may utilize a market-based approach through which quotes from market makers are used to determine fair value. In instances where sufficient market activity may not exist or is limited, the pricing services also utilize proprietary valuation models which may consider market characteristics such as benchmark yield curves, credit spreads, estimated default rates, anticipated market interest rate volatility, coupon rates, anticipated timing of principal repayments, underlying collateral, and other unique security features in order to estimate the relevant cash flows, which are then discounted to calculate the fair value. Securities denominated in a foreign currency are converted into their U.S. dollar equivalent at the foreign exchange rate in effect at 4 p.m. Eastern time on the date that the values of the foreign debt securities are determined.
Investments in open-end mutual funds are valued at the closing NAV.
Certain derivative financial instruments trade in the OTC market. The Fund's pricing services use various techniques including industry standard option pricing models and proprietary discounted cash flow models to determine the fair value of those instruments. The Fund's net benefit or obligation under the derivative contract, as measured by the fair value of the contract, is included in net assets.
The Fund has procedures to determine the fair value of financial instruments for which market prices are not reliable or readily available. Under these procedures, the Fund primarily employs a market-based approach which may use related or comparable assets or liabilities, recent transactions, market multiples, book values, and other relevant information for the investment to determine the fair value of the investment. An income-based valuation approach may also be used in which the anticipated future cash flows of the investment are discounted to calculate fair value. Discounts may also be applied due to the nature or duration of any restrictions on the disposition of the investments. Due to the inherent uncertainty of valuations of

FRANKLIN MUTUAL SERIES FUNDSNOTES TO FINANCIAL STATEMENTS (UNAUDITED)
27franklintempleton.com Semiannual Report
Franklin Mutual Global Discovery Fund (continued)
such investments, the fair values may differ significantly from the values that would have been used had an active market existed.
Trading in securities on foreign securities stock exchanges and OTC markets may be completed before 4 p.m. Eastern time. In addition, trading in certain foreign markets may not take place on every Fund's business day. Events can occur between the time at which trading in a foreign security is completed and 4 p.m. Eastern time that might call into question the reliability of the value of a portfolio security held by the Fund. As a result, differences may arise between the value of the Fund's portfolio securities as determined at the foreign market close and the latest indications of value at 4 p.m. Eastern time. In order to minimize the potential for these differences, an independent pricing service may be used to adjust the value of the Fund's portfolio securities to the latest indications of fair value at 4 p.m. Eastern time. At June 30, 2021, certain securities may have been fair valued using these procedures, in which case the securities were categorized as Level 2 inputs within the fair value hierarchy (referred to as “market level fair value”). See the Fair Value Measurements note for more information.
When the last day of the reporting period is a non-business day, certain foreign markets may be open on those days that the Fund's NAV is not calculated, which could result in differences between the value of the Fund's portfolio securities on the last business day and the last calendar day of the reporting period. Any security valuation changes due to an open foreign market are adjusted and reflected by the Fund for financial reporting purposes.
b. Foreign Currency Translation Portfolio securities and other assets and liabilities denominated in foreign currencies are translated into U.S. dollars based on the exchange rate of such currencies against U.S. dollars on the date of valuation. The Fund may enter into foreign currency exchange contracts to facilitate transactions denominated in a foreign currency. Purchases and sales of securities, income and expense items denominated in foreign currencies are translated into U.S. dollars at the exchange rate in effect on the transaction date. Portfolio securities and assets and liabilities denominated in foreign currencies contain risks that those currencies will
decline in value relative to the U.S. dollar. Occasionally, events may impact the availability or reliability of foreign exchange rates used to convert the U.S. dollar equivalent value. If such an event occurs, the foreign exchange rate will be valued at fair value using procedures established and approved by the Board.
The Fund does not separately report the effect of changes in foreign exchange rates from changes in market prices on securities held. Such changes are included in net realized and unrealized gain or loss from investments in the Statement of Operations.
Realized foreign exchange gains or losses arise from sales of foreign currencies, currency gains or losses realized between the trade and settlement dates on securities transactions and the difference between the recorded amounts of dividends, interest, and foreign withholding taxes and the U.S. dollar equivalent of the amounts actually received or paid. Net unrealized foreign exchange gains and losses arise from changes in foreign exchange rates on foreign denominated assets and liabilities other than investments in securities held at the end of the reporting period.
c. Derivative Financial InstrumentsThe Fund invested in derivative financial instruments in order to manage risk or gain exposure to various other investments or markets. Derivatives are financial contracts based on an underlying or notional amount, require no initial investment or an initial net investment that is smaller than would normally be required to have a similar response to changes in market factors, and require or permit net settlement. Derivatives contain various risks including the potential inability of the counterparty to fulfill their obligations under the terms of the contract, the potential for an illiquid secondary market, and/or the potential for market movements which expose the Fund to gains or losses in excess of the amounts shown in the Statement of Assets and Liabilities. Realized gain and loss and unrealized appreciation and depreciation on these contracts for the period are included in the Statement of Operations.
Derivative counterparty credit risk is managed through a formal evaluation of the creditworthiness of all potential counterparties. The Fund attempts to reduce its exposure to counterparty credit risk on OTC derivatives, whenever possible, by entering into International Swaps and Derivatives Association (ISDA) master agreements
1. Organization and Significant Accounting Policies (continued)
a. Financial Instrument Valuation (continued)

FRANKLIN MUTUAL SERIES FUNDSNOTES TO FINANCIAL STATEMENTS (UNAUDITED)
28 franklintempleton.comSemiannual Report
Franklin Mutual Global Discovery Fund (continued)
with certain counterparties. These agreements contain various provisions, including but not limited to collateral requirements, events of default, or early termination. Termination events applicable to the counterparty include certain deteriorations in the credit quality of the counterparty. Termination events applicable to the Fund include failure of the Fund to maintain certain net asset levels and/or limit the decline in net assets over various periods of time. In the event of default or early termination, the ISDA master agreement gives the non-defaulting party the right to net and close-out all transactions traded, whether or not arising under the ISDA agreement, to one net amount payable by one counterparty to the other. However, absent an event of default or early termination, OTC derivative assets and liabilities are presented gross and not offset in the Statement of Assets and Liabilities. Early termination by the counterparty may result in an immediate payment by the Fund of any net liability owed to that counterparty under the ISDA agreement. At June 30, 2021, the Fund had OTC derivatives in a net liability position of $204,213 and the aggregate value of collateral pledged for such contracts was $715,921.
Collateral requirements differ by type of derivative. Collateral or initial margin requirements are set by the broker or exchange clearing house for exchange traded and centrally cleared derivatives. Initial margin deposited is held at the exchange and can be in the form of cash and/or securities. For OTC derivatives traded under an ISDA master agreement, posting of collateral is required by either the Fund or the applicable counterparty if the total net exposure of all OTC derivatives with the applicable counterparty exceeds the minimum transfer amount, which typically ranges from $100,000 to $250,000, and can vary depending on the counterparty and the type of the agreement. Generally, collateral is determined at the close of Fund business each day and any additional collateral required due to changes in derivative values may be delivered by the Fund or the counterparty the next business day, or within a few business days. Collateral pledged and/or received by the Fund for OTC derivatives, if any, is held in segregated accounts with the Fund's custodian/counterparty broker and can be in the form of cash and/or securities. Unrestricted cash may be invested according to the Fund's investment objectives. To the extent that the amounts due to the Fund
from its counterparties are not subject to collateralization or are not fully collateralized, the Fund bears the risk of loss from counterparty non-performance.
At June 30, 2021, the Fund received $15,642,426 in U.K. Treasury Bonds and U.S. Treasury Bills, Bonds and Notes as collateral for derivatives.
The Fund entered into exchange traded futures contracts primarily to manage exposure to certain foreign currencies. A futures contract is an agreement between the Fund and a counterparty to buy or sell an asset at a specified price on a future date. Required initial margins are pledged by the Fund, and the daily change in fair value is accounted for as a variation margin payable or receivable in the Statement of Assets and Liabilities.
The Fund entered into OTC forward exchange contracts primarily to manage exposure to certain foreign currencies. A forward exchange contract is an agreement between the Fund and a counterparty to buy or sell a foreign currency at a specific exchange rate on a future date.
See Note 11 regarding other derivative information.
d. Securities Sold ShortThe Fund is engaged in selling securities short, which obligates the Fund to replace a borrowed security with the same security at current fair value. The Fund incurs a loss if the price of the security increases between the date of the short sale and the date on which the Fund replaces the borrowed security. The Fund realizes a gain if the price of the security declines between those dates. Gains are limited to the price at which the Fund sold the security short, while losses are potentially unlimited in size.
The Fund is required to establish a margin account with the broker lending the security sold short. While the short sale is outstanding, the broker retains the proceeds of the short sale to the extent necessary to meet margin requirements until the short position is closed out. A deposit must also be maintained with the Fund's custodian/counterparty broker consisting of cash and/or securities having a value equal to a specified percentage of the value of the securities sold short. The Fund is obligated to pay fees for borrowing the securities sold short and is required to pay the counterparty any dividends and/or interest due on securities sold short. Such dividends and/or interest and any security borrowing fees are recorded as an expense to the Fund.
1. Organization and Significant Accounting Policies (continued)
c. Derivative Financial Instruments (continued)

FRANKLIN MUTUAL SERIES FUNDSNOTES TO FINANCIAL STATEMENTS (UNAUDITED)
29franklintempleton.com Semiannual Report
Franklin Mutual Global Discovery Fund (continued)
e. Securities LendingThe Fund participates in an agency based securities lending program to earn additional income. The Fund receives collateral in the form of cash and/or U.S. Government and Agency securities against the loaned securities in an amount equal to at least 102% of the fair value of the loaned securities. Collateral is maintained over the life of the loan in an amount not less than 100% of the fair value of loaned securities, as determined at the close of Fund business each day; any additional collateral required due to changes in security values is delivered to the Fund on the next business day. Any cash collateral received is deposited into a joint cash account with other funds and is used to invest in a money market fund managed by Franklin Advisers, Inc., an affiliate of the Fund, and/or a joint repurchase agreement. The Fund may receive income from the investment of cash collateral, in addition to lending fees and rebates paid by the borrower. Income from securities loaned, net of fees paid to the securities lending agent and/or third-party vendor, is reported separately in the Statement of Operations. The Fund bears the market risk with respect to any cash collateral investment, securities loaned, and the risk that the agent may default on its obligations to the Fund. If the borrower defaults on its obligation to return the securities loaned, the Fund has the right to repurchase the securities in the open market using the collateral received. The securities lending agent has agreed to indemnify the Fund in the event of default by a third party borrower. At June 30, 2021, the Fund had no securities on loan.
f. Senior Floating Rate InterestsThe Fund invests in senior secured corporate loans that pay interest at rates which are periodically reset by reference to a base lending rate plus a spread. These base lending rates are generally the prime rate offered by a designated U.S. bank or the London InterBank Offered Rate (LIBOR). Senior secured corporate loans often require prepayment of principal from excess cash flows or at the discretion of the borrower. As a result, actual maturity may be substantially less than the stated maturity. Senior secured corporate loans in which the Fund invests are generally readily marketable, but may be subject to certain restrictions on resale.
g. Income and Deferred Taxes It is the Fund's policy to qualify as a regulated investment company under the Internal Revenue Code. The Fund intends to distribute to shareholders substantially all of its taxable income and net realized gains to relieve it from federal income and excise taxes. As a result, no provision for U.S. federal income taxes is required.
The Fund may be subject to foreign taxation related to income received, capital gains on the sale of securities and certain foreign currency transactions in the foreign jurisdictions in which it invests. Foreign taxes, if any, are recorded based on the tax regulations and rates that exist in the foreign markets in which the Fund invests. When a capital gain tax is determined to apply, the Fund records an estimated deferred tax liability in an amount that would be payable if the securities were disposed of on the valuation date.
As a result of several court cases, in certain countries across the European Union, the Fund filed additional tax reclaims for previously withheld taxes on dividends earned in those countries (EU reclaims). Income recognized, if any, for EU reclaims is reflected as other income in the Statement of Operations and any related receivable, if any, is reflected as European Union tax reclaims in the Statement of Assets and Liabilities. When uncertainty exists as to the ultimate resolution of these proceedings, the likelihood of receipt of these EU reclaims, and the potential timing of payment, no amounts are reflected in the financial statements. For U.S. income tax purposes, EU reclaims received by the Fund, if any, reduce the amount of foreign taxes Fund shareholders can use as tax deductions or credits on their income tax returns. In the event that EU reclaims received by the Fund during a fiscal year exceed foreign withholding taxes paid by the Fund, and the Fund previously passed through to its shareholders foreign taxes incurred by the Fund to be used as a credit or deduction on a shareholder’s income tax return, the Fund will enter into a closing agreement with the Internal Revenue Service (IRS) in order to pay the associated tax liability on behalf of the Fund's shareholders.
The Fund may recognize an income tax liability related to its uncertain tax positions under U.S. GAAP when the uncertain tax position has a less than 50% probability that it will be sustained upon examination by the tax authorities based on its technical merits. As of June 30, 2021, the Fund has determined that no tax liability is required in its financial statements related to uncertain tax positions for any open
1. Organization and Significant Accounting Policies (continued)

FRANKLIN MUTUAL SERIES FUNDSNOTES TO FINANCIAL STATEMENTS (UNAUDITED)
30 franklintempleton.comSemiannual Report
Franklin Mutual Global Discovery Fund (continued)
tax years (or expected to be taken in future tax years). Open tax years are those that remain subject to examination and are based on the statute of limitations in each jurisdiction in which the Fund invests.
h. Security Transactions, Investment Income, Expenses and DistributionsSecurity transactions are accounted for on trade date. Realized gains and losses on security transactions are determined on a specific identification basis. Interest income and estimated expenses are accrued daily. Amortization of premium and accretion of discount on debt securities are included in interest income. Dividend income and dividends declared on securities sold short are recorded on the ex-dividend date except for certain dividends from securities where the dividend rate is not available. In such cases, the dividend is recorded as soon as the information is received by the Fund. Distributions to shareholders are recorded on the ex-dividend date. Distributable earnings are determined according to income tax regulations (tax basis) and may differ from earnings recorded in accordance with U.S. GAAP. These differences may be permanent or temporary. Permanent differences are reclassified among capital accounts to reflect their tax character. These reclassifications have no impact on net assets or the results of operations. Temporary differences are not reclassified, as they may reverse in subsequent periods.
Common expenses incurred by the Trust are allocated among the Funds based on the ratio of net assets of each Fund to the combined net assets of the Trust or based on the ratio of number of shareholders of each Fund to the combined number of shareholders of the Trust. Fund specific expenses are charged directly to the Fund that incurred the expense.
Realized and unrealized gains and losses and net investment income, excluding class specific expenses, are allocated daily to each class of shares based upon the relative proportion of net assets of each class. Differences in per share distributions by class are generally due to differences in class specific expenses.
i. Accounting EstimatesThe preparation of financial statements in accordance with U.S. GAAP requires management to make estimates and assumptions that affect the reported amounts of assets and liabilities at the date of the financial statements and the amounts of income and expenses during the reporting period. Actual results could differ from those estimates.
j. Guarantees and IndemnificationsUnder the Trust's organizational documents, its officers and trustees are indemnified by the Trust against certain liabilities arising out of the performance of their duties to the Trust. Additionally, in the normal course of business, the Trust, on behalf of the Fund, enters into contracts with service providers that contain general indemnification clauses. The Trust's maximum exposure under these arrangements is unknown as this would involve future claims that may be made against the Trust that have not yet occurred. Currently, the Trust expects the risk of loss to be remote.
1. Organization and Significant Accounting Policies (continued)
g. Income and Deferred Taxes (continued)
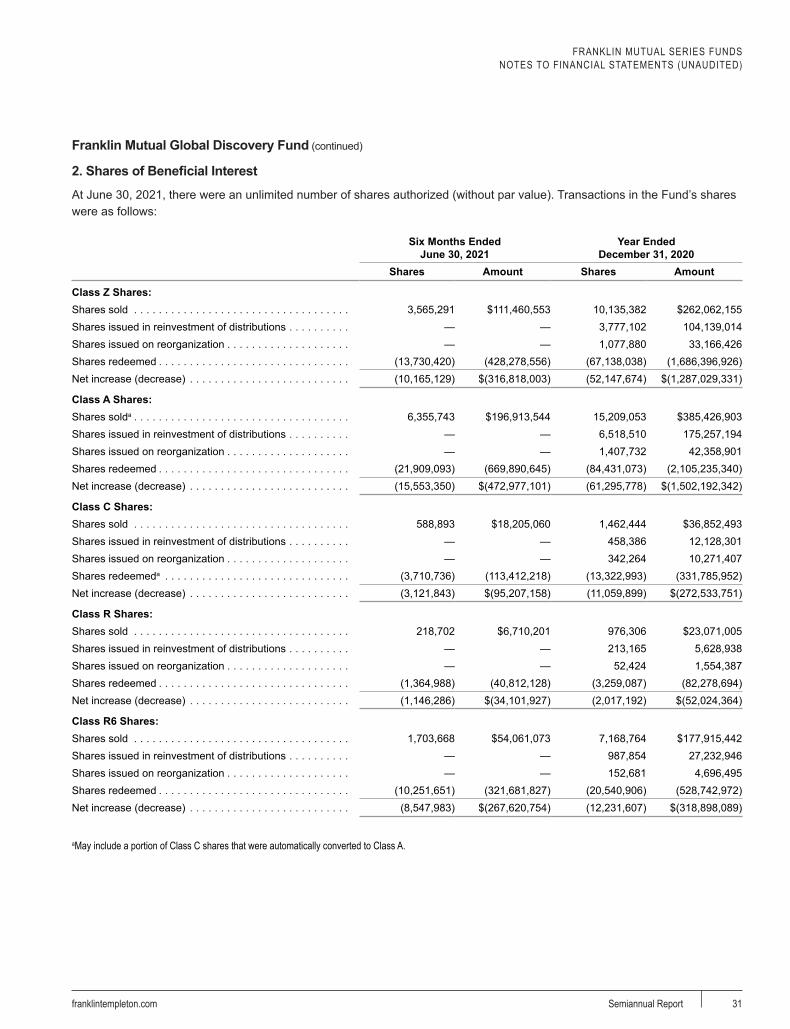
FRANKLIN MUTUAL SERIES FUNDSNOTES TO FINANCIAL STATEMENTS (UNAUDITED)
31franklintempleton.com Semiannual Report
Franklin Mutual Global Discovery Fund (continued)
2. Shares of Beneficial Interest
At June 30, 2021, there were an unlimited number of shares authorized (without par value). Transactions in the Fund’s shares were as follows:
Six Months Ended June 30, 2021
Year Ended December 31, 2020
Shares Amount Shares Amount
Class Z Shares:Shares sold . . . . . . . . . . . . . . . . . . . . . . . . . . . . . . . . . . . 3,565,291 $111,460,553 10,135,382 $262,062,155Shares issued in reinvestment of distributions . . . . . . . . . . — — 3,777,102 104,139,014Shares issued on reorganization . . . . . . . . . . . . . . . . . . . . — — 1,077,880 33,166,426Shares redeemed . . . . . . . . . . . . . . . . . . . . . . . . . . . . . . . (13,730,420) (428,278,556) (67,138,038) (1,686,396,926)Net increase (decrease) . . . . . . . . . . . . . . . . . . . . . . . . . . (10,165,129) $(316,818,003) (52,147,674) $(1,287,029,331)
Class A Shares:Shares solda . . . . . . . . . . . . . . . . . . . . . . . . . . . . . . . . . . . 6,355,743 $196,913,544 15,209,053 $385,426,903Shares issued in reinvestment of distributions . . . . . . . . . . — — 6,518,510 175,257,194Shares issued on reorganization . . . . . . . . . . . . . . . . . . . . — — 1,407,732 42,358,901Shares redeemed . . . . . . . . . . . . . . . . . . . . . . . . . . . . . . . (21,909,093) (669,890,645) (84,431,073) (2,105,235,340)Net increase (decrease) . . . . . . . . . . . . . . . . . . . . . . . . . . (15,553,350) $(472,977,101) (61,295,778) $(1,502,192,342)
Class C Shares:Shares sold . . . . . . . . . . . . . . . . . . . . . . . . . . . . . . . . . . . 588,893 $18,205,060 1,462,444 $36,852,493Shares issued in reinvestment of distributions . . . . . . . . . . — — 458,386 12,128,301Shares issued on reorganization . . . . . . . . . . . . . . . . . . . . — — 342,264 10,271,407Shares redeemeda . . . . . . . . . . . . . . . . . . . . . . . . . . . . . . (3,710,736) (113,412,218) (13,322,993) (331,785,952)Net increase (decrease) . . . . . . . . . . . . . . . . . . . . . . . . . . (3,121,843) $(95,207,158) (11,059,899) $(272,533,751)
Class R Shares:Shares sold . . . . . . . . . . . . . . . . . . . . . . . . . . . . . . . . . . . 218,702 $6,710,201 976,306 $23,071,005Shares issued in reinvestment of distributions . . . . . . . . . . — — 213,165 5,628,938Shares issued on reorganization . . . . . . . . . . . . . . . . . . . . — — 52,424 1,554,387Shares redeemed . . . . . . . . . . . . . . . . . . . . . . . . . . . . . . . (1,364,988) (40,812,128) (3,259,087) (82,278,694)Net increase (decrease) . . . . . . . . . . . . . . . . . . . . . . . . . . (1,146,286) $(34,101,927) (2,017,192) $(52,024,364)
Class R6 Shares:Shares sold . . . . . . . . . . . . . . . . . . . . . . . . . . . . . . . . . . . 1,703,668 $54,061,073 7,168,764 $177,915,442Shares issued in reinvestment of distributions . . . . . . . . . . — — 987,854 27,232,946Shares issued on reorganization . . . . . . . . . . . . . . . . . . . . — — 152,681 4,696,495Shares redeemed . . . . . . . . . . . . . . . . . . . . . . . . . . . . . . . (10,251,651) (321,681,827) (20,540,906) (528,742,972)Net increase (decrease) . . . . . . . . . . . . . . . . . . . . . . . . . . (8,547,983) $(267,620,754) (12,231,607) $(318,898,089)
aMay include a portion of Class C shares that were automatically converted to Class A.
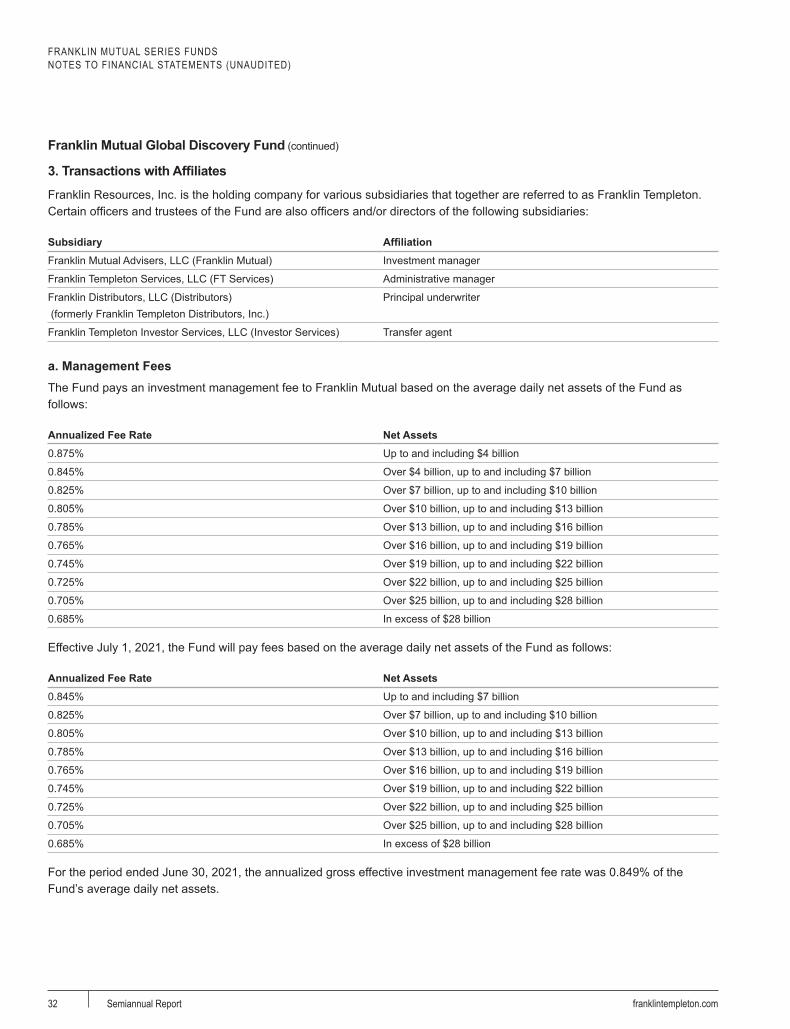
FRANKLIN MUTUAL SERIES FUNDSNOTES TO FINANCIAL STATEMENTS (UNAUDITED)
32 franklintempleton.comSemiannual Report
Franklin Mutual Global Discovery Fund (continued)
3. Transactions with Affiliates
Franklin Resources, Inc. is the holding company for various subsidiaries that together are referred to as Franklin Templeton. Certain officers and trustees of the Fund are also officers and/or directors of the following subsidiaries:
Subsidiary AffiliationFranklin Mutual Advisers, LLC (Franklin Mutual) Investment manager
Franklin Templeton Services, LLC (FT Services) Administrative manager
Franklin Distributors, LLC (Distributors) (formerly Franklin Templeton Distributors, Inc.)
Principal underwriter
Franklin Templeton Investor Services, LLC (Investor Services) Transfer agent
a. Management FeesThe Fund pays an investment management fee to Franklin Mutual based on the average daily net assets of the Fund as follows:
Annualized Fee Rate Net Assets0.875% Up to and including $4 billion
0.845% Over $4 billion, up to and including $7 billion
0.825% Over $7 billion, up to and including $10 billion
0.805% Over $10 billion, up to and including $13 billion
0.785% Over $13 billion, up to and including $16 billion
0.765% Over $16 billion, up to and including $19 billion
0.745% Over $19 billion, up to and including $22 billion
0.725% Over $22 billion, up to and including $25 billion
0.705% Over $25 billion, up to and including $28 billion
0.685% In excess of $28 billion
Effective July 1, 2021, the Fund will pay fees based on the average daily net assets of the Fund as follows:
Annualized Fee Rate Net Assets0.845% Up to and including $7 billion
0.825% Over $7 billion, up to and including $10 billion
0.805% Over $10 billion, up to and including $13 billion
0.785% Over $13 billion, up to and including $16 billion
0.765% Over $16 billion, up to and including $19 billion
0.745% Over $19 billion, up to and including $22 billion
0.725% Over $22 billion, up to and including $25 billion
0.705% Over $25 billion, up to and including $28 billion
0.685% In excess of $28 billion
For the period ended June 30, 2021, the annualized gross effective investment management fee rate was 0.849% of the Fund’s average daily net assets.

FRANKLIN MUTUAL SERIES FUNDSNOTES TO FINANCIAL STATEMENTS (UNAUDITED)
33franklintempleton.com Semiannual Report
Franklin Mutual Global Discovery Fund (continued)
b. Administrative Fees
Under an agreement with Franklin Mutual, FT Services provides administrative services to the Fund. The fee is paid by Franklin Mutual based on the Fund’s average daily net assets, and is not an additional expense of the Fund.
c. Distribution FeesThe Board has adopted distribution plans for each share class, with the exception of Class Z and Class R6 shares, pursuant to Rule 12b-1 under the 1940 Act. Under the Fund’s Class A reimbursement distribution plan, the Fund reimburses Distributors for costs incurred in connection with the servicing, sale and distribution of the Fund's shares up to the maximum annual plan rate. Under the Class A reimbursement distribution plan, costs exceeding the maximum for the current plan year cannot be reimbursed in subsequent periods. In addition, under the Fund’s Class C and R compensation distribution plans, the Fund pays Distributors for costs incurred in connection with the servicing, sale and distribution of the Fund's shares up to the maximum annual plan rate for each class. The plan year, for purposes of monitoring compliance with the maximum annual plan rates, is February 1 through January 31.
The maximum annual plan rates, based on the average daily net assets, for each class, are as follows:
Class A . . . . . . . . . . . . . . . . . . . . . . . . . . . . . . . . . . . . . . . . . . . . . . . . . . . . . . . . . . . . . . . . . . . . . . . . . . . . . . . . . . . . 0.35%Class C . . . . . . . . . . . . . . . . . . . . . . . . . . . . . . . . . . . . . . . . . . . . . . . . . . . . . . . . . . . . . . . . . . . . . . . . . . . . . . . . . . . . 1.00%Class R . . . . . . . . . . . . . . . . . . . . . . . . . . . . . . . . . . . . . . . . . . . . . . . . . . . . . . . . . . . . . . . . . . . . . . . . . . . . . . . . . . . . 0.50%
The Board has set the current rate at 0.25% per year for Class A shares until further notice and approval by the Board.
d. Sales Charges/Underwriting AgreementsFront-end sales charges and contingent deferred sales charges (CDSC) do not represent expenses of the Fund. These charges are deducted from the proceeds of sales of Fund shares prior to investment or from redemption proceeds prior to remittance, as applicable. Distributors has advised the Fund of the following commission transactions related to the sales and redemptions of the Fund's shares for the period:
Sales charges retained net of commissions paid to unaffiliated brokers/dealers . . . . . . . . . . . . . . . . . . . . . . . . . . . . . . $175,670CDSC retained . . . . . . . . . . . . . . . . . . . . . . . . . . . . . . . . . . . . . . . . . . . . . . . . . . . . . . . . . . . . . . . . . . . . . . . . . . . . . . $14,486
e. Transfer Agent FeesEach class of shares pays transfer agent fees to Investor Services for its performance of shareholder servicing obligations. The fees are based on an annualized asset based fee of 0.02% plus a transaction based fee. In addition, each class reimburses Investor Services for out of pocket expenses incurred and, except for Class R6, reimburses shareholder servicing fees paid to third parties. These fees are allocated daily based upon their relative proportion of such classes' aggregate net assets. Class R6 pays Investor Services transfer agent fees specific to that class.
For the period ended June 30, 2021, the Fund paid transfer agent fees of $6,159,452, of which $2,336,956 was retained by Investor Services.
3. Transactions with Affiliates (continued)

FRANKLIN MUTUAL SERIES FUNDSNOTES TO FINANCIAL STATEMENTS (UNAUDITED)
34 franklintempleton.comSemiannual Report
Franklin Mutual Global Discovery Fund (continued)
f. Investments in Affiliated Management Investment Companies
The Fund invests in one or more affiliated management investment companies. As defined in the 1940 Act, an investment is deemed to be a “Controlled Affiliate” of a fund when a fund owns, either directly or indirectly, 25% or more of the affiliated fund’s outstanding shares or has the power to exercise control over management or policies of such fund. The Fund does not invest for purposes of exercising a controlling influence over the management or policies. Management fees paid by the Fund are waived on assets invested in the affiliated management investment companies, as noted in the Statement of Operations, in an amount not to exceed the management and administrative fees paid directly or indirectly by each affiliate. During the period ended June 30, 2021, the Fund held investments in affiliated management investment companies as follows:
aa
Value at Beginning of Period Purchases Sales
Realized Gain (Loss)
Net Change in Unrealized
Appreciation (Depreciation)
Value at End
of Period
Number of Shares Held
at End of Period
Investment Income
a a a a a a a a
Franklin Mutual Global Discovery FundNon-Controlled Affiliates
Income from securities
loanedInstitutional Fiduciary Trust - Money Market Portfolio, 0.01% . . . . . . . $— $8,653,000 $(8,653,000) $— $— $—a — $33Total Affiliated Securities . . . . $— $8,653,000 $(8,653,000) $— $— $— $33
a As of June 30, 2021, no longer held by the Fund.
g. Waiver and Expense ReimbursementsEffective July 1, 2021, Franklin Mutual contractually agreed in advance to waive or limit its fees and to assume as its own expense certain expenses otherwise payable by the Fund so that the operating expenses (excluding distribution fees, acquired fund fees and expenses, expenses related to securities sold short, and certain non-routine expenses or costs, including those relating to litigation, indemnification, reorganizations, and liquidations) for each class of the Fund do not exceed 1.00% based on the average net assets of each class until April 30, 2022. Total expenses waived or paid are not subject to recapture subsequent to the Fund's fiscal year end.
Investor Services has contractually agreed in advance to waive or limit its fees so that the Class R6 transfer agent fees do not exceed 0.03% based on the average net assets of the class until April 30, 2022.
4. Expense Offset Arrangement
The Fund has entered into an arrangement with its custodian whereby credits realized as a result of uninvested cash balances are used to reduce a portion of the Fund's custodian expenses. During the period ended June 30, 2021, the custodian fees were reduced as noted in the Statement of Operations.
3. Transactions with Affiliates (continued)

FRANKLIN MUTUAL SERIES FUNDSNOTES TO FINANCIAL STATEMENTS (UNAUDITED)
35franklintempleton.com Semiannual Report
Franklin Mutual Global Discovery Fund (continued)
5. Independent Trustees' Retirement Plan
On January 1, 1993, the Trust adopted an Independent Trustees’ Retirement Plan (Plan). The Plan is an unfunded defined benefit plan that provides benefit payments to Trustees whose length of service and retirement age meets the eligibility requirements of the Plan. Benefits under the Plan are based on years of service and fees paid to each trustee at the time of retirement. Effective in December 1996, the Plan was closed to new participants.
During the period ended June 30, 2021, the Fund’s projected benefit obligation and benefit payments under the Plan were as follows:
aProjected benefit obligation at June 30, 2021 . . . . . . . . . . $1,146,554bIncrease (decrease) in projected benefit obligation . . . . . . $(403)Benefit payments made to retired trustees . . . . . . . . . . . . . $(3,652)
aThe projected benefit obligation is included in trustees’ fees and expenses in the Statement of Assets and Liabilities.bThe increase (decrease) in projected benefit obligation is reflected in trustees’ fees and expenses in the Statement of Operations.
6. Income Taxes
For tax purposes, capital losses may be carried over to offset future capital gains.
At December 31, 2020, the capital loss carryforwards were as follows:
Capital loss carryforwards not subject to expiration:Short term . . . . . . . . . . . . . . . . . . . . . . . . . . . . . . . . . . . . . . . . . . . . . . . . . . . . . . . . . . . . . . . . . . . . . . . . . . . . . . . . $106,292,917Long term . . . . . . . . . . . . . . . . . . . . . . . . . . . . . . . . . . . . . . . . . . . . . . . . . . . . . . . . . . . . . . . . . . . . . . . . . . . . . . . . 404,873,458a
Total capital loss carryforwards . . . . . . . . . . . . . . . . . . . . . . . . . . . . . . . . . . . . . . . . . . . . . . . . . . . . . . . . . . . . . . . $511,166,375
aIncludes $7,228,368 from the acquired Franklin Mutual International Fund, which may be carried over to offset future capital gains, subject to certain limitations.
At June 30, 2021, the cost of investments and net unrealized appreciation (depreciation) for income tax purposes were as follows:
Cost of investments . . . . . . . . . . . . . . . . . . . . . . . . . . . . . . . . . . . . . . . . . . . . . . . . . . . . . . . . . . . . . . . . . . . . . . . . . . $7,117,762,515
Unrealized appreciation . . . . . . . . . . . . . . . . . . . . . . . . . . . . . . . . . . . . . . . . . . . . . . . . . . . . . . . . . . . . . . . . . . . . . . . . $3,155,666,599Unrealized depreciation . . . . . . . . . . . . . . . . . . . . . . . . . . . . . . . . . . . . . . . . . . . . . . . . . . . . . . . . . . . . . . . . . . . . . . . . (245,494,352)Net unrealized appreciation (depreciation) . . . . . . . . . . . . . . . . . . . . . . . . . . . . . . . . . . . . . . . . . . . . . . . . . . . . . . . . . . $2,910,172,247
Differences between income and/or capital gains as determined on a book basis and a tax basis are primarily due to differing treatments of defaulted securities, foreign currency transactions, futures contracts, EU reclaims, pass-through entity income, passive foreign investment company shares, tax straddles and return of capital distributions.
7. Investment Transactions
Purchases and sales of investments (excluding short term securities and securities sold short) for the period ended June 30, 2021, aggregated $1,841,577,496 and $2,878,423,806, respectively.
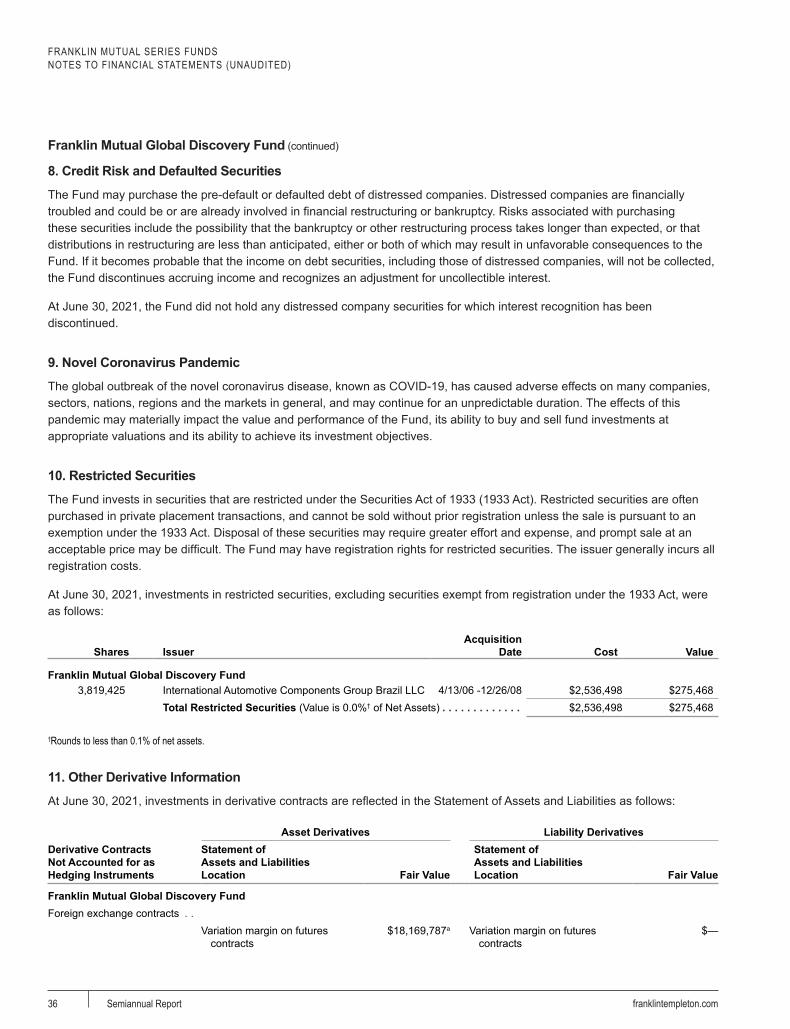
FRANKLIN MUTUAL SERIES FUNDSNOTES TO FINANCIAL STATEMENTS (UNAUDITED)
36 franklintempleton.comSemiannual Report
Franklin Mutual Global Discovery Fund (continued)
8. Credit Risk and Defaulted Securities
The Fund may purchase the pre-default or defaulted debt of distressed companies. Distressed companies are financially troubled and could be or are already involved in financial restructuring or bankruptcy. Risks associated with purchasing these securities include the possibility that the bankruptcy or other restructuring process takes longer than expected, or that distributions in restructuring are less than anticipated, either or both of which may result in unfavorable consequences to the Fund. If it becomes probable that the income on debt securities, including those of distressed companies, will not be collected, the Fund discontinues accruing income and recognizes an adjustment for uncollectible interest.
At June 30, 2021, the Fund did not hold any distressed company securities for which interest recognition has been discontinued.
9. Novel Coronavirus Pandemic
The global outbreak of the novel coronavirus disease, known as COVID-19, has caused adverse effects on many companies, sectors, nations, regions and the markets in general, and may continue for an unpredictable duration. The effects of this pandemic may materially impact the value and performance of the Fund, its ability to buy and sell fund investments at appropriate valuations and its ability to achieve its investment objectives.
10. Restricted Securities
The Fund invests in securities that are restricted under the Securities Act of 1933 (1933 Act). Restricted securities are often purchased in private placement transactions, and cannot be sold without prior registration unless the sale is pursuant to an exemption under the 1933 Act. Disposal of these securities may require greater effort and expense, and prompt sale at an acceptable price may be difficult. The Fund may have registration rights for restricted securities. The issuer generally incurs all registration costs.
At June 30, 2021, investments in restricted securities, excluding securities exempt from registration under the 1933 Act, were as follows:
Shares IssuerAcquisition
Date Cost Value
Franklin Mutual Global Discovery Fund 3,819,425 International Automotive Components Group Brazil LLC 4/13/06 -12/26/08 $2,536,498 $275,468
Total Restricted Securities (Value is 0.0%† of Net Assets) . . . . . . . . . . . . . $2,536,498 $275,468
†Rounds to less than 0.1% of net assets.
11. Other Derivative Information
At June 30, 2021, investments in derivative contracts are reflected in the Statement of Assets and Liabilities as follows:
Asset Derivatives Liability DerivativesDerivative Contracts Not Accounted for as Hedging Instruments
Statement of Assets and Liabilities Location Fair Value
Statement of Assets and Liabilities Location Fair Value
Franklin Mutual Global Discovery FundForeign exchange contracts . .
Variation margin on futures contracts
$18,169,787a Variation margin on futures contracts
$—

FRANKLIN MUTUAL SERIES FUNDSNOTES TO FINANCIAL STATEMENTS (UNAUDITED)
37franklintempleton.com Semiannual Report
Franklin Mutual Global Discovery Fund (continued)
Asset Derivatives Liability Derivatives Derivative Contracts Not Accounted for as Hedging Instruments
Statement of Assets and Liabilities Location Fair Value
Statement of Assets and Liabilities Location Fair Value
Franklin Mutual Global Discovery Fund (continued)
Unrealized appreciation on OTC forward exchange contracts
$19,605,841 Unrealized depreciation on OTC forward exchange contracts
$2,158,668
Total . . . . . . . . . . . . . . . . . . . . $37,775,628 $2,158,668
aThis amount reflects the cumulative appreciation (depreciation) of futures contracts as reported in the Statement of Investments. Only the variation margin receivable/payable at period end is separately reported within the Statement of Assets and Liabilities. Prior variation margin movements were recorded to cash upon receipt or payment.
For the period ended June 30, 2021, the effect of derivative contracts in the Statement of Operations was as follows:
Derivative Contracts Not Accounted for as Hedging Instruments
Statement of Operations Location
Net Realized Gain (Loss) for
the PeriodStatement of Operations Location
Net Change in Unrealized
Appreciation (Depreciation) for the Period
Franklin Mutual Global Discovery FundNet realized gain (loss) from: Net change in unrealized
appreciation (depreciation) on:
Foreign exchange contracts . . . . .Futures contracts $(12,490,285) Futures contracts $24,419,907Forward exchange contracts (17,128,008) Forward exchange contracts 53,502,894
Total . . . . . . . . . . . . . . . . . . . . . . . $(29,618,293) $77,922,801
For the period ended June 30, 2021, the average month end notional amount of futures contracts represented $671,887,001. The average month end contract value of forward exchange contracts was $1,302,541,202.
See Note 1(c) regarding derivative financial instruments.
12. Credit Facility
The Fund, together with other U.S. registered and foreign investment funds (collectively, Borrowers), managed by Franklin Templeton, are borrowers in a joint syndicated senior unsecured credit facility totaling $2.675 billion (Global Credit Facility) which matures on February 4, 2022. This Global Credit Facility provides a source of funds to the Borrowers for temporary and emergency purposes, including the ability to meet future unanticipated or unusually large redemption requests.
Under the terms of the Global Credit Facility, the Fund shall, in addition to interest charged on any borrowings made by the Fund and other costs incurred by the Fund, pay its share of fees and expenses incurred in connection with the implementation and maintenance of the Global Credit Facility, based upon its relative share of the aggregate net assets of all of the Borrowers, including an annual commitment fee of 0.15% based upon the unused portion of the Global Credit Facility. These fees are reflected in other expenses in the Statement of Operations. During the period ended June 30, 2021, the Fund did not use the Global Credit Facility.
11. Other Derivative Information (continued)

FRANKLIN MUTUAL SERIES FUNDSNOTES TO FINANCIAL STATEMENTS (UNAUDITED)
38 franklintempleton.comSemiannual Report
Franklin Mutual Global Discovery Fund (continued)
13. Fair Value Measurements
The Fund follows a fair value hierarchy that distinguishes between market data obtained from independent sources (observable inputs) and the Fund's own market assumptions (unobservable inputs). These inputs are used in determining the value of the Fund's financial instruments and are summarized in the following fair value hierarchy:
• Level 1 – quoted prices in active markets for identical financial instruments
• Level 2 – other significant observable inputs (including quoted prices for similar financial instruments, interest rates, prepayment speed, credit risk, etc.)
• Level 3 – significant unobservable inputs (including the Fund's own assumptions in determining the fair value of financial instruments)
The input levels are not necessarily an indication of the risk or liquidity associated with financial instruments at that level.
A summary of inputs used as of June 30, 2021, in valuing the Fund's assets and liabilities carried at fair value, is as follows:
Level 1 Level 2 Level 3 Total
Franklin Mutual Global Discovery FundAssets:
Investments in Securities:Common Stocks:
Aerospace & Defense . . . . . . . . . . . . . . . . . . . $— $271,066,257 $— $271,066,257Auto Components . . . . . . . . . . . . . . . . . . . . . . — 168,889,917 275,468 169,165,385Automobiles . . . . . . . . . . . . . . . . . . . . . . . . . . 143,082,054 — — 143,082,054Banks . . . . . . . . . . . . . . . . . . . . . . . . . . . . . . . 426,923,727 450,306,141 — 877,229,868Beverages . . . . . . . . . . . . . . . . . . . . . . . . . . . — 150,902,534 — 150,902,534Biotechnology . . . . . . . . . . . . . . . . . . . . . . . . . 91,285,499 — — 91,285,499Building Products . . . . . . . . . . . . . . . . . . . . . . 166,229,203 — — 166,229,203Capital Markets . . . . . . . . . . . . . . . . . . . . . . . . — 188,467,728 — 188,467,728Chemicals . . . . . . . . . . . . . . . . . . . . . . . . . . . — 296,705,305 — 296,705,305Construction Materials . . . . . . . . . . . . . . . . . . — 103,315,424 — 103,315,424Consumer Finance . . . . . . . . . . . . . . . . . . . . . 161,073,283 — — 161,073,283Diversified Financial Services . . . . . . . . . . . . . 197,215,310 — — 197,215,310Diversified Telecommunication Services . . . . . 101,714,897 277,011,329 — 378,726,226Entertainment . . . . . . . . . . . . . . . . . . . . . . . . . 183,971,604 — — 183,971,604Food Products . . . . . . . . . . . . . . . . . . . . . . . . 159,033,844 — — 159,033,844Health Care Equipment & Supplies . . . . . . . . . 183,228,417 — — 183,228,417Health Care Providers & Services . . . . . . . . . . 484,418,578 — — 484,418,578Hotels, Restaurants & Leisure . . . . . . . . . . . . . — 148,376,498 — 148,376,498Industrial Conglomerates . . . . . . . . . . . . . . . . 173,151,459 — — 173,151,459Insurance . . . . . . . . . . . . . . . . . . . . . . . . . . . . 571,572,060 314,566,965 — 886,139,025IT Services . . . . . . . . . . . . . . . . . . . . . . . . . . . 197,854,349 135,706,338 — 333,560,687Media . . . . . . . . . . . . . . . . . . . . . . . . . . . . . . . 284,153,904 — — 284,153,904Oil, Gas & Consumable Fuels . . . . . . . . . . . . . 736,779,166 259,775,364 — 996,554,530Pharmaceuticals . . . . . . . . . . . . . . . . . . . . . . . 774,888,059 332,913,227 — 1,107,801,286Road & Rail . . . . . . . . . . . . . . . . . . . . . . . . . . 55,342,161 — — 55,342,161Semiconductors & Semiconductor Equipment . 114,829,696 167,319,694 — 282,149,390Software . . . . . . . . . . . . . . . . . . . . . . . . . . . . . 496,165,426 — — 496,165,426Technology Hardware, Storage & Peripherals . 169,926,916 234,130,974 — 404,057,890Textiles, Apparel & Luxury Goods . . . . . . . . . . — 155,566,505 — 155,566,505

FRANKLIN MUTUAL SERIES FUNDSNOTES TO FINANCIAL STATEMENTS (UNAUDITED)
39franklintempleton.com Semiannual Report
Franklin Mutual Global Discovery Fund (continued)
Level 1 Level 2 Level 3 Total
Franklin Mutual Global Discovery Fund (continued) Assets: (continued)
Investments in Securities:
Common Stocks:
Tobacco . . . . . . . . . . . . . . . . . . . . . . . . . . . . . $124,288,743 $227,611,414 $— $351,900,157Preferred Stocks . . . . . . . . . . . . . . . . . . . . . . . . — 110,327,901 — 110,327,901Warrants . . . . . . . . . . . . . . . . . . . . . . . . . . . . . . 3,496,648 — — 3,496,648Convertible Bonds . . . . . . . . . . . . . . . . . . . . . . . — 7,209,961 — 7,209,961Corporate Bonds . . . . . . . . . . . . . . . . . . . . . . . . — 217,798,082 — 217,798,082Senior Floating Rate Interests . . . . . . . . . . . . . . . — 8,888,084 — 8,888,084Companies in Liquidation . . . . . . . . . . . . . . . . . . — — —a —Short Term Investments . . . . . . . . . . . . . . . . . . . 150,189,328 700,000 — 150,889,328
Total Investments in Securities . . . . . . . . . . . $6,150,814,331 $4,227,555,642b $275,468 $10,378,645,441
Other Financial Instruments:Forward exchange contracts . . . . . . . . . . . . . . . $— $19,605,841 $— $19,605,841Futures contracts . . . . . . . . . . . . . . . . . . . . . . . . 18,169,787 — — 18,169,787
Total Other Financial Instruments . . . . . . . . . $18,169,787 $19,605,841 $— $37,775,628
Liabilities:Other Financial Instruments:
Securities Sold Short . . . . . . . . . . . . . . . . . . . . . $386,327,639 $— $— $386,327,639Forward exchange contracts . . . . . . . . . . . . . . . . — 2,158,668 — 2,158,668
Total Other Financial Instruments . . . . . . . . . $386,327,639 $2,158,668 $— $388,486,307
a Includes securities determined to have no value at June 30, 2021.b Includes foreign securities valued at $3,992,959,515, which were categorized as Level 2 as a result of the application of market level fair value procedures. See the Financial Instrument Valuation note for more information.
A reconciliation in which Level 3 inputs are used in determining fair value is presented when there are significant Level 3 assets and/or liabilities at the beginning and/or end of the period.
14. New Accounting Pronouncements
In March 2020, the Financial Accounting Standards Board (FASB) issued Accounting Standards Update (ASU) No. 2020-04, Reference Rate Reform (Topic 848) – Facilitation of the Effects of Reference Rate Reform on Financial Reporting. In January 2021, the FASB issued ASU No. 2021-01, with further amendments to Topic 848. The amendments in the ASUs provide optional temporary accounting recognition and financial reporting relief from the effect of certain types of contract modifications due to the planned discontinuation of the LIBOR and other interbank-offered based reference rates as of the end of 2021 and 2023. The ASUs are effective for certain reference rate-related contract modifications that occur during the period March 12, 2020 through December 31, 2022. Management has reviewed the requirements and believes the adoption of these ASUs will not have a material impact on the financial statements.
15. Subsequent Events
The Fund has evaluated subsequent events through the issuance of the financial statements and determined that in addition to those events previously disclosed, the following subsequent event requires disclosure:
On July 13, 2021, the Board approved a change to the automatic conversion feature for Class C that will convert shareholders’ Class C shares into Class A shares after they have been held for 8 years. The change will become effective August 2, 2021. Further details are disclosed in the Fund’s Prospectus.
13. Fair Value Measurements (continued)
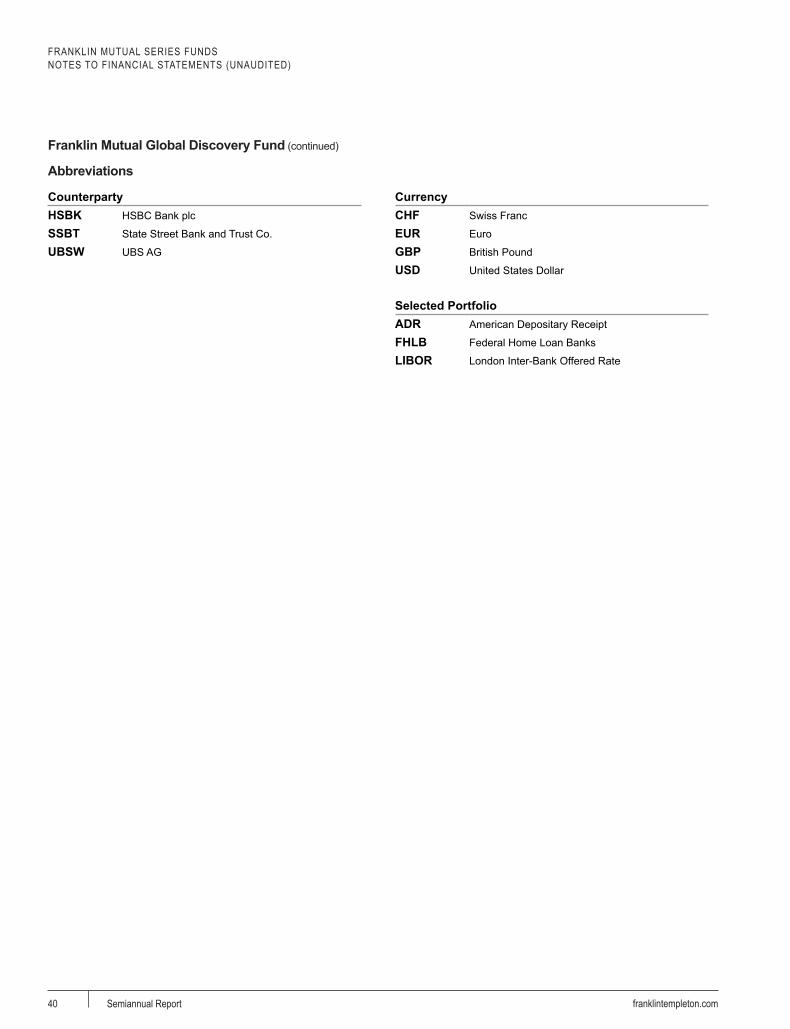
FRANKLIN MUTUAL SERIES FUNDSNOTES TO FINANCIAL STATEMENTS (UNAUDITED)
40 franklintempleton.comSemiannual Report
Franklin Mutual Global Discovery Fund (continued)
Abbreviations
CounterpartyHSBK HSBC Bank plc
SSBT State Street Bank and Trust Co.
UBSW UBS AG
CurrencyCHF Swiss Franc
EUR Euro
GBP British Pound
USD United States Dollar
Selected PortfolioADR American Depositary Receipt
FHLB Federal Home Loan Banks
LIBOR London Inter-Bank Offered Rate

FRANKLIN MUTUAL SERIES FUNDS
Shareholder Information
41franklintempleton.com Semiannual Report
Board Approval of Investment Management AgreementsFRANKLIN MUTUAL SERIES FUNDSFranklin Mutual Global Discovery Fund(Fund)
The Board of Trustees (Board), including a majority of trustees that are not “interested persons” as such term is defined in section 2(a)(19) of the Investment Company Act of 1940 (hereinafter referred to as “independent trustees”), at a meeting held on June 25, 2021, unanimously approved the renewal of the Fund’s investment management agreement. Prior to a meeting of all of the trustees for the purpose of considering such renewal, the independent trustees participated in two other meetings held in connection with the renewal process. Throughout the process, the independent trustees received assistance and advice from and met separately with independent counsel. The independent trustees met with and interviewed officers of the investment manager (including portfolio managers), the transfer agent and shareholder services group and the distributor. In approving the renewal of the investment management agreement for the Fund, the Board, including the independent trustees, determined that the investment management fee structure was fair and reasonable and that continuance of the agreement was in the best interests of the Fund and its shareholders.
In reaching their decision on the investment management agreement, the trustees took into account information furnished throughout the year at regular Board meetings, as well as information specifically requested and furnished for the renewal process, which culminated in the meetings referred to above for the specific purpose of considering such agreement. Information furnished throughout the year included, among others, reports on the Fund’s investment performance, expenses, portfolio composition, portfolio brokerage execution, client commission arrangements, derivatives, securities lending, asset segregation, portfolio turnover, Rule 12b-1 plan, distribution, shareholder servicing, legal and compliance matters, pricing of securities, sales and redemptions, and marketing support payments made to financial intermediaries, as well as a third-party survey of transfer agent fees charged to funds within the Franklin Templeton (FT) complex in comparison with those charged to other fund complexes deemed comparable. Also, related financial statements and other information about the scope and quality of services provided by the investment manager and its affiliates and enhancements to such services over the
past year were provided. In addition, the trustees received periodic reports throughout the year and during the renewal process relating to compliance with the Fund’s investment policies and restrictions. During the renewal process, the independent trustees considered the investment manager’s methods of operation within the Franklin Templeton group and its activities on behalf of other clients. The Board also reviewed and considered an annual report on payments made by FT or the Fund to financial intermediaries, as well as a memorandum relating to third-party servicing arrangements, which included discussion of the changing distribution landscape for the Fund.
The information obtained by the trustees during the renewal process also included a special report prepared by Broadridge Financial Solutions, Inc., an independent third-party analyst that utilizes data from Lipper, Inc. (“Lipper”), comparing the Fund’s investment performance and expenses with those of other mutual funds deemed comparable to the Fund as selected by Lipper (Broadridge Section 15(c) Report). The trustees reviewed the Broadridge Section 15(c) Report and its usefulness in the renewal process with respect to matters such as comparative fees, expenses, expense ratios, performance and volatility. They concluded that the report continues to be a reliable resource in the performance of their duties.
In addition, the trustees received a Profitability Study (Profitability Study) prepared by management discussing the profitability to FT from its overall U.S. fund operations, as well as on an individual fund-by-fund basis. Over the past year, the Board and counsel to the independent trustees continued to receive reports on management’s handling of recent regulatory inquiries and pending legal actions against the investment manager and its affiliates. The independent trustees were satisfied with the actions taken to date by management in response to such regulatory and legal matters.
The trustees reviewed the personnel, operations, financial condition, and investment management capabilities, methodologies and resources of the investment manager. As part of this review, particular attention was given to management’s diligent risk management program, including continual monitoring and management of cybersecurity, liquidity and counterparty credit risk, and attention given to derivatives and other complex instruments that are held and expected to be held by the Fund and how such instruments are used to carry out the Fund’s investment goal(s). The Board also took into account, among other things,

FRANKLIN MUTUAL SERIES FUNDSSHAREHOLDER INFORMATION
42 franklintempleton.comSemiannual Report
management’s efforts in establishing a global credit facility for the benefit of the Fund and other accounts managed by FT to provide a source of cash for temporary and emergency purposes or to meet unusual redemption requests as well as the strong financial position of the investment manager’s parent company and its commitment to the mutual fund business. The Board noted management’s continuing efforts and expenditures in establishing effective business continuity plans and developing strategies to address areas of heightened concern in the mutual fund industry, such as cybersecurity in the current work-from-home environment and liquidity risk management. The Board also recognized management’s commitment to facilitating Board oversight of particular areas, including derivatives and payments to intermediaries, by enhanced reporting.
In addition to the above and other matters considered by the trustees throughout the course of the year, the following discussion relates to certain primary factors relevant to the Board’s decision. This discussion of the information and factors considered by the Board (including the information and factors discussed above) is not intended to be exhaustive, but rather summarizes certain factors considered by the Board. In view of the wide variety of factors considered, the Board did not, unless otherwise noted, find it practicable to quantify or otherwise assign relative weights to the foregoing factors. In addition, individual trustees may have assigned different weights to various factors.
NATURE, EXTENT AND QUALITY OF SERVICESThe trustees reviewed the nature, extent and quality of the services provided, and to be provided, by the investment manager. The trustees cited the investment manager’s ability to implement the Fund’s disciplined value investment approach and its long-term relationship with the Fund as reasons that shareholders choose to invest, and remain invested, in the Fund. The trustees reviewed the Fund’s portfolio management team, including its performance, staffing, skills and compensation program. With respect to portfolio manager compensation, management assured the trustees that the Fund’s long-term performance is a significant component of incentive-based compensation and noted that a portion of a portfolio manager’s incentive-based compensation is paid in shares of pre- designated funds from the portfolio manager’s fund management area. The trustees noted that the portfolio manager compensation program aligned the interests of the portfolio managers with that of shareholders of the Fund. The trustees discussed with management various other products, portfolios and entities that are advised by the investment manager and the allocation of assets and expenses among and within them, as well as their relative fees and reasons for differences with
respect thereto and any potential conflicts. During regular Board meetings and the aforementioned meetings of the independent trustees, the trustees received reports and presentations on the investment manager’s best execution trading policies. The trustees considered periodic reports provided to them showing that the investment manager complied with the investment policies and restrictions of the Fund as well as other reports periodically furnished to the Board covering matters such as the compliance of portfolio managers and other management personnel with the code of ethics covering the investment management personnel, the adherence to fair value pricing procedures established by the Board and the accuracy of net asset value calculations. The Board noted the extent of the benefits provided to Fund shareholders from being part of the Franklin Templeton group of funds, including the right to exchange investments between funds (same class) without a sales charge, the ability to reinvest Fund dividends into other funds and the right to combine holdings of other funds to obtain reduced sales charges. The Board considered the investment manager’s significant efforts in developing and implementing compliance procedures established in accordance with SEC and other requirements.
The Board considered the nature, extent and quality of the services to be provided under the Fund’s other service agreements to determine that, on an overall basis, Fund shareholders were well served. In this connection, the Board also took into account transfer agent and shareholder services provided to Fund shareholders by an affiliate of the investment manager, noting continuing expenditures by management to increase and improve the scope of such services and favorable periodic reports on shareholder services conducted by independent third parties. While such considerations directly affected the trustees’ decision in renewing the Fund’s transfer agent and shareholder services agreement, the Board also considered these commitments as incidental benefits to Fund shareholders deriving from the investment management relationship.
Based on their review, the trustees were satisfied with the nature and quality of the overall services provided, and to be provided, by the investment manager and its affiliates to the Fund and its shareholders and were confident in the abilities of the management team to continue the disciplined value investment approach of the Fund and to provide quality services to the Fund and its shareholders.
INVESTMENT PERFORMANCEThe trustees reviewed and placed significant emphasis on the investment performance of the Fund over the one-, three-, five- and 10-year periods ended December 31, 2020. They considered the history of performance of the Fund

FRANKLIN MUTUAL SERIES FUNDSSHAREHOLDER INFORMATION
43franklintempleton.com Semiannual Report
relative to various benchmarks. As part of their review, they inquired of management regarding benchmarks, style drift and restrictions on permitted investments. Consideration was also given to performance in the context of available levels of cash during the periods.
The trustees had meetings during the year, including the meetings referred to above held in connection with the renewal process, with the Fund’s portfolio managers to discuss performance and the management of the Fund. As part of these discussions, the Board had extensive discussions with senior management of FT regarding the retirement of the Chief Investment Officer of the investment manager and the appointment of the new Chief Investment Officer effective November 2, 2020, as well as other personnel matters. In addition to the materials provided by management in connection with the renewal process, the independent trustees requested throughout the year (and received) additional presentations from the investment manager and senior management of FT regarding the performance of the investment manager and the Fund. As part of these presentations, the investment manager and senior management of FT reviewed enhancements that have been made, and are being made, to the investment manager’s investment process.
Particular attention in assessing performance was given to the Broadridge Section 15(c) Report. That report showed the investment performance of the Fund (Class A shares) in comparison to other funds determined comparable by Lipper.
The comparable funds to the Fund, as chosen by Lipper, included all retail and institutional global multi-cap value funds. The Fund had total returns in the lowest performing quintile for the one-year period ended December 31, 2020, and had annualized total returns for the three- and five-year periods also in the lowest performing quintiles. The trustees noted that the Fund’s total return on an annualized basis for the 10-year period ended December 31, 2020 was in the second-lowest performing quintile. The trustees also compared Fund performance to other industry benchmarks, including measures of risk-adjusted performance of a fund, as part of their evaluation of investment performance. The trustees discussed with management the reasons for the relative underperformance for the one-, three-, five- and 10-year periods ended December 31, 2020. While disappointed with the relative underperformance of the Fund, the Board did not believe that any changes with respect to the Fund were warranted at the time, particularly since the recent personnel changes had taken effect on
November 2, 2020 and the enhancements to the investment manager’s personnel and investment process continue to be implemented. The Board noted that it would continue to monitor future performance.
COMPARATIVE EXPENSES AND MANAGEMENT PROFITABILITYThe trustees considered the cost of the services provided and to be provided and the profits realized by the investment manager and its affiliates from their respective relationships with the Fund. As part of the renewal process, the trustees explored with management the trends in expense ratios over the past three fiscal years and the reasons for any increases in the Fund’s expense ratios (or components thereof). In considering the appropriateness of the management fee and other expenses charged to the Fund, the Board took into account various factors including investment performance and matters relating to Fund operations, including, but not limited to, the quality and experience of its portfolio managers and research staff. Consideration was also given to a comparative analysis in the Broadridge Section 15(c) Report of the investment management fee and total expense ratio of the Fund in comparison with those of a group of other funds selected by Lipper as its appropriate Lipper expense group. Lipper expense data is based upon information taken from each fund’s most recent annual report, which reflects historical asset levels that may be quite different from those currently existing, particularly in a period of market volatility. While recognizing such inherent limitation and the fact that expense ratios generally increase as assets decline and decrease as assets grow, the Board believed the independent analysis conducted by Lipper to be an appropriate measure of comparative expenses.
In reviewing comparative costs, emphasis was given to the Fund’s contractual management fee in comparison with the contractual management fee that would have been charged by other funds within its Lipper expense group assuming they were similar in size to the Fund, as well as the actual total expenses of the Fund in comparison with those of its Lipper expense group. The Lipper contractual management fee analysis includes administrative charges as being part of the management fee, and total expenses, for comparative consistency, are shown by Lipper for Fund Class A shares.
The Fund’s contractual management fee rate was in the most expensive quintile of its Lipper expense group and its total expenses were also in the most expensive quintile of such group. Based, in part, on such relative expense rankings, the independent trustees negotiated with management to reduce the investment management and total expenses of the Fund. Such negotiations resulted in a reduction in the investment management fee

FRANKLIN MUTUAL SERIES FUNDSSHAREHOLDER INFORMATION
44 franklintempleton.comSemiannual Report
charged with respect to assets under management up to $4 billion from 87.5 basis points to 84.5 basis points and the implementation of a voluntary one-year total expense cap on operating expenses (e.g., excluding 12b-1 fees) of 100 basis points. Following such changes, the Board found such comparative fees and expenses to be acceptable in view of factors relating to the Fund’s operations, such as the quality and experience of its portfolio managers.
The trustees also reviewed the Profitability Study addressing profitability of Franklin Resources, Inc., from its overall U.S. fund business, as well as profitability to the Fund’s investment manager and its affiliates, from providing investment management and other services to the Fund during the 12-month period ended September 30, 2020, the most recent fiscal year-end of Franklin Resources, Inc. The trustees reviewed the basis on which such reports are prepared and the cost allocation methodology utilized in the Profitability Study, it being recognized that allocation methodologies may each be reasonable while producing different results. In this respect, the Board noted that the reasonableness of the cost allocation methodologies was reviewed by independent accountants on an every other year basis.
The independent trustees met with management to discuss the Profitability Study. This included, among other things, a comparison of investment management income with investment management expenses of the Fund; comparison of underwriting revenues and expenses; the relative relationship of investment management and underwriting expenses; shareholder servicing profitability; economies of scale; and the relative contribution of the Fund to the profitability of the investment manager and its parent. In discussing the Profitability Study with the Board, the investment manager stated its belief that the costs incurred in establishing the infrastructure necessary to operate the type of mutual fund operations conducted by it and its affiliates may not be fully reflected in the expenses allocated to the Fund in determining its profitability.
The Board also took into account management’s expenditures in improving shareholder services provided to the Fund, as well as the need to meet additional regulatory and compliance requirements. The trustees also considered the extent to which the investment manager may derive ancillary benefits from Fund operations, including those derived from economies of scale, discussed below, the allocation of Fund brokerage and the use of commission dollars to pay for research and other similar services.
Based upon their consideration of all these factors, the trustees determined that the level of profits realized by the investment manager and its affiliates in providing services to the Fund was not excessive in view of the nature, quality and extent of services provided.
ECONOMIES OF SCALEThe Board considered economies of scale realized by the investment manager and its affiliates as the Fund grows larger and the extent to which they are shared with Fund shareholders, as for example, in the level of the investment management fee charged, in the quality and efficiency of services rendered and in increased capital commitments benefiting the Fund directly or indirectly. While recognizing that any precise determination is inherently subjective, the trustees noted that, based upon the Profitability Study, as some funds increase in size, at some point economies of scale may result in the investment manager realizing a larger profit margin on investment management services provided to such a fund. The trustees also noted that benefits of economies of scale will be shared with Fund shareholders due to the decline in the effective investment management fee rate as breakpoints are achieved by the Fund.
The trustees noted that breakpoints had been instituted as part of the Fund’s investment management fee and that the Board regularly evaluates whether additional breakpoints are appropriate. The trustees assessed the savings to shareholders resulting from such breakpoints and believed, following the negotiations noted above regarding the change in the Fund’s breakpoints, they were appropriate and they agreed to continue to monitor the appropriateness of the breakpoints. The trustees also considered the effects an increase in assets under management would have on the investment management fee and expense ratio of the Fund. To the extent further economies of scale may be realized by the investment manager and its affiliates, the Board believed the investment management fees provide a sharing of benefits with the Fund and its shareholders.
Liquidity Risk Management Program-Funds no HLIMEach Fund has adopted and implemented a written Liquidity Risk Management Program (the “LRMP”) as required by Rule 22e-4 under the Investment Company Act of 1940 (the “Liquidity Rule”). The LRMP is designed to assess and manage each Fund’s liquidity risk, which is defined as the risk that the Fund could not meet requests to redeem shares issued by the Fund without significant dilution of remaining investors’ interests in the Fund. In accordance with the Liquidity Rule, the LRMP includes policies and procedures

FRANKLIN MUTUAL SERIES FUNDSSHAREHOLDER INFORMATION
45franklintempleton.com Semiannual Report
that provide for: (1) assessment, management, and review (no less frequently than annually) of each Fund’s liquidity risk; (2) classification of each Fund’s portfolio holdings into one of four liquidity categories (Highly Liquid, Moderately Liquid, Less Liquid, and Illiquid); (3) for Funds that do not primarily hold assets that are Highly Liquid, establishing and maintaining a minimum percentage of the Fund’s net assets in Highly Liquid investments (called a “Highly Liquid Investment Minimum” or “HLIM”); and (4) prohibiting the Fund’s acquisition of Illiquid investments that would result in the Fund holding more than 15% of its net assets in Illiquid assets. The LRMP also requires reporting to the Securities and Exchange Commission (“SEC”) (on a non-public basis) and to the Board if the Fund’s holdings of Illiquid assets exceed 15% of the Fund’s net assets. Funds with HLIMs must have procedures for addressing HLIM shortfalls, including reporting to the Board and, with respect to HLIM shortfalls lasting more than seven consecutive calendar days, reporting to the SEC (on a non-public basis).
The Director of Liquidity Risk within the Investment Risk Management Group (the “IRMG”) is the appointed Administrator of the LRMP. The IRMG maintains the Investment Liquidity Committee (the “ILC”) to provide oversight and administration of policies and procedures governing liquidity risk management for FT products and portfolios. The ILC includes representatives from Franklin Templeton’s Risk, Trading, Global Compliance, Investment Compliance, Investment Operations, Valuation Committee, Product Management and Global Product Strategy.
In assessing and managing each Fund’s liquidity risk, the ILC considers, as relevant, a variety of factors, including the Fund’s investment strategy and the liquidity of its portfolio investments during both normal and reasonably foreseeable stressed conditions; its short and long-term cash flow projections; and its cash holdings and access to other funding sources including the Funds’ interfund lending facility and line of credit. Classification of the Fund’s portfolio holdings in the four liquidity categories is based on the number of days it is reasonably expected to take to convert the investment to cash (for Highly Liquid and Moderately Liquid holdings) or sell or dispose of the investment (for Less Liquid and Illiquid investments), in current market conditions without significantly changing the investment’s market value.
Each Fund primarily holds liquid assets that are defined under the Liquidity Rule as "Highly Liquid Investments," and therefore is not required to establish an HLIM. Highly Liquid Investments are defined as cash and any investment
reasonably expected to be convertible to cash in current market conditions in three business days or less without the conversion to cash significantly changing the market value of the investment.
At meetings of the Funds’ Board of Trustees held in May 2021, the Program Administrator provided a written report to the Board addressing the adequacy and effectiveness of the program for the year ended December 31, 2020. The Program Administrator report concluded that (i.) the LRMP, as adopted and implemented, remains reasonably designed to assess and manage each Fund’s liquidity risk; (ii.) the LRMP, including the Highly Liquid Investment Minimum (“HLIM”) where applicable, was implemented and operated effectively to achieve the goal of assessing and managing each Fund’s liquidity risk; and (iii.) each Fund was able to meet requests for redemption without significant dilution of remaining investors’ interests in the Fund.
Proxy Voting Policies and ProceduresThe Fund’s investment manager has established Proxy Voting Policies and Procedures (Policies) that the Fund uses to determine how to vote proxies relating to portfolio securities. Shareholders may view the Fund’s complete Policies online at franklintempleton.com. Alternatively, shareholders may request copies of the Policies free of charge by calling the Proxy Group collect at (954) 527-7678 or by sending a written request to: Franklin Templeton Companies, LLC, 300 S.E. 2nd Street, Fort Lauderdale, FL 33301, Attention: Proxy Group. Copies of the Fund’s proxy voting records are also made available online at franklintempleton.com and posted on the U.S. Securities and Exchange Commission’s website at sec.gov and reflect the most recent 12-month period ended June 30.
Quarterly Statement of InvestmentsThe Trust, on behalf of the Fund, files a complete statement of investments with the U.S. Securities and Exchange Commission for the first and third quarters for each fiscal year as an exhibit to its report on Form N-PORT. Shareholders may view the filed Form N-PORT by visiting the Commission’s website at sec.gov. The filed form may also be viewed and copied at the Commission’s Public Reference Room in Washington, DC. Information regarding the operations of the Public Reference Room may be obtained by calling (800) SEC-0330.

FRANKLIN MUTUAL SERIES FUNDSSHAREHOLDER INFORMATION
46 franklintempleton.comSemiannual Report
Householding of Reports and ProspectusesYou will receive, or receive notice of the availability of, the Fund’s financial reports every six months. In addition, you will receive an annual updated summary prospectus (detail prospectus available upon request). To reduce Fund expenses, we try to identify related shareholders in a household and send only one copy of the financial reports (to the extent received by mail) and summary prospectus. This process, called “householding,” will continue indefinitely unless you instruct us otherwise. If you prefer not to have these documents householded, please call us at (800) 632-2301. At any time you may view current prospectuses/summary prospectuses and financial reports on our website. If you choose, you may receive these documents through electronic delivery.

477 S 08/21© 2021 Franklin Templeton Investments. All rights reserved.
Authorized for distribution only when accompanied or preceded by a summary prospectus and/or prospectus. Investors should carefully consider a fund’s investment goals, risks, charges and expenses before investing. A prospectus contains this and other information; please read it carefully before investing.
To help ensure we provide you with quality service, all calls to and from our service areas are monitored and/or recorded.
Semiannual Report and Shareholder LetterFranklin Mutual Global Discovery Fund
Investment Manager Distributor Shareholder ServicesFranklin Mutual Advisers, LLC
Franklin Distributors, LLC(800) DIAL BEN® / 342-5236franklintempleton.com
(800) 632-2301 - (Class A, C, R & R6)(800) 448-FUND - (Class Z)