Embed Size (px)
Citation preview

S E P T E M B E R 3 0 , 2 0 0 8
Franklin DynaTech Fund
Franklin Growth Fund
Franklin Income Fund
Franklin U.S. GovernmentSecurities Fund
Franklin Utilities Fund
FranklinCustodian Funds
A N N U A L R E P O RT A N D S H A R E H O L D E R L E T T E R
Want to receivethis document
FASTER via email?
Eligible shareholders can sign up for eDelivery at franklintempleton.com. See inside for details.

Franklin Templeton InvestmentsGain From Our Perspective®
TRUE DIVERSIFICATION
RELIABILITY YOU CAN TRUST
SPECIALIZED EXPERTISE
MUTUAL FUNDS | RETIREMENT PLANS | 529 COLLEGE SAVINGS PLANS | SEPARATE ACCOUNTS
Franklin Templeton’s distinct multi-manager structure combines the specialized expertise of three world-class investment management groups—Franklin, Templeton and Mutual Series.
Each of our portfolio management groups operates autonomously, relyingon its own research and staying true to the unique investment disciplines that underlie its success.
Franklin. Founded in 1947, Franklin is a recognized leader in fixed incomeinvesting and also brings expertise in growth- and value-style U.S. equityinvesting.
Templeton. Founded in 1940, Templeton pioneered international investingand, in 1954, launched what has become the industry’s oldest global fund.Today, with offices in over 25 countries, Templeton offers investors a trulyglobal perspective.
Mutual Series. Founded in 1949, Mutual Series is dedicated to a unique style ofvalue investing, searching aggressively for opportunity among what it believesare undervalued stocks, as well as arbitrage situations and distressed securities.
Because our management groups work independently and adhere to differentinvestment approaches, Franklin, Templeton and Mutual Series funds typicallyhave distinct portfolios. That’s why our funds can be used to build trulydiversified allocation plans covering every major asset class.
At Franklin Templeton Investments, we seek to consistently provide investorswith exceptional risk-adjusted returns over the long term, as well as the reliable,accurate and personal service that has helped us become one of the mosttrusted names in financial services.
Not part of the annual report

Not part of the annual report | 1
A Message from Gregory E. Johnson,President and Chief Executive Officer of Franklin Resources, Inc.
October 31, 2008
Dear Shareholder:
The enclosed annual report for Franklin Custodian Funds covers the yearended September 30, 2008, but I would like to add some comments on marketevents that occurred in October. Recent market volatility has been jarring toeveryone, including those of us who have worked in financial markets formany years. Bank lending around the world has seized up, and the fallout hasimpacted venerable firms alongside broader stock and bond indexes.
This environment is bound to provoke great concern, but it’s equally impor-tant to put the latest market developments in perspective. That’s why I’d liketo offer a few thoughts on these events, our company’s approach to investingand the strong health of our organization.
A key point to recognize is that global financial turmoil is being addressed byglobal action. Central banks around the world have coordinated their effortsto cut interest rates and supply liquidity to frozen funding markets. A numberof governments have also intervened to rescue major financial institutions or
NOT FDIC INSURED | MAY LOSE VALUE | NO BANK GUARANTEE
Sign up for eDelivery of your Shareholder Report
Shareholders who are registered at franklintempleton.com can receive this report via email by
selecting eDelivery options under “My Profile.” Not all accounts are eligible for eDelivery.
ContentsAnnual Report
Economic and Market Overview 4
Franklin DynaTech Fund . . . . . 6
Franklin Growth Fund . . . . . . . 16
Franklin Income Fund . . . . . . 25
Franklin U.S. Government Securities Fund . . . . . . . . . . . 39
Franklin Utilities Fund . . . . . . 50
Financial Highlights and Statements of Investments . . . 59
Financial Statements . . . . . . . 107
Notes to Financial Statements . . . . . . . 116
Report of Independent Registered Public Accounting Firm . . . . . . . . . . . 135
Tax Designation . . . . . . . . . . . 136
Board Members and Officers . . 137
Shareholder Information . . . . 142
CEO’s Message . . . . . . . . . . . 1
2 | Not part of the annual report
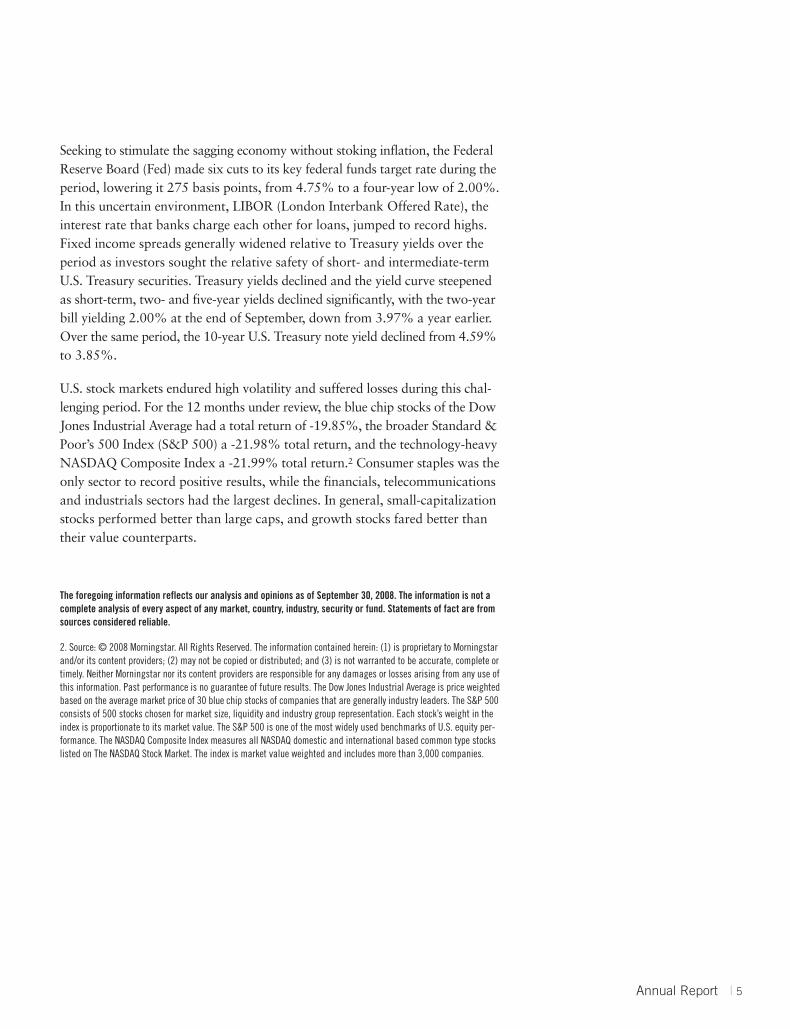
find an orderly way for them to be acquired. Here in the U.S., the FederalReserve and Treasury Department have moved rapidly to establish new pro-grams for easing money market pressures and handling troubled financial assets.The outcome of all these efforts may take a while to be realized, but I believethe latest actions here and abroad mark a significant turning point for globalcapital markets.
It’s also important to remember that as daunting as current market conditionsmay be, we have navigated through other periods of market volatility. U.S. stockmarkets recorded three bear markets during the 1960s as the nation grappledwith the Vietnam War and a turbulent economy.1 The quintupling of oil pricesin 1973 led to a deep U.S. recession and a stock market plunge of 45.1% fromJanuary 1973 through December 1974.1 And the “Black Monday” stock marketcrash of 1987 remains the largest single-day percentage decline in the historyof the Dow Jones Industrial Average.2
Advice applicable throughout these upheavals remains true today. The late Sir John Templeton, writing 15 years ago, ended a list of his core investmentprinciples with these thoughts: “Do not be fearful or negative too often. . . .For 100 years optimists have carried the day in U.S. stocks. Even in the dark’70s, many professional money managers — and many individual investorstoo — made money in stocks . . . . In this century or the next it’s still ‘Buy low,sell high.’”3
Sir John knew these simple concepts were difficult to execute in the face of pes-simism. Nonetheless, that is precisely how our Franklin, Templeton and MutualSeries portfolio managers are contending with today’s challenging environ-ment. They are using their expertise to sort through investment opportunities,avoiding those firms that have become merely cheap and identifying those firmsbest positioned to be eventual winners. This kind of rigorous, bottom-up,security-by-security analysis is the fundamental investment discipline practicedacross our global platform.
These asset management strengths are also the core of our business. Unlikefinancial firms that have dominated recent headlines, Franklin Templetonderives its revenue primarily from investment management, not investmentbanking or securities brokerage. Additionally, our assets under management arediversified by investment objective, clientele and geographic region. Diversifiedpositioning helps our firm maintain healthy operating margins even when
1. Source: Ned Davis Research, Inc.
2. Source: NYSE Euronext. The Dow Jones Industrial Average is price weighted based on the average market price of 30 blue chip stocks of companies that are generally industry leaders.
3. Source: “16 Rules for Investment Success” by Sir John Templeton.

Not part of the annual report | 3
volatile markets reduce assets under management. It is also important to notethat maintaining a strong balance sheet has been a pillar of our managementstrategy. We have a substantial pool of cash and investments and low levels ofdebt, and we are in the enviable position of not having to depend on credit tomeet our operating needs. In fact, our strong franchise, sound capitalizationand minimal leverage led Standard & Poor’s to recently raise its credit ratingson Franklin Resources, Inc. (BEN) to the highest level currently applied to apublicly traded asset manager.4
Franklin Templeton’s six-decade growth into a premier global asset managerhas given us the conviction that although conditions remain challenging, thereare ample reasons to be optimistic about eventual market stabilization andrecovery. Being able to take advantage of markets shaken by maximum pes-simism has helped our firm develop into an organization that stretches across29 countries and manages assets for more than 20 million shareholder accounts.
In the enclosed annual report for Franklin Custodian Funds, the portfoliomanagers discuss market conditions, investment decisions and Fund performanceduring the year ended September 30, 2008. The report contains additional per-formance data and financial information. Our website, franklintempleton.com,offers more timely discussions, daily prices, portfolio holdings and other infor-mation. We encourage you to discuss your concerns with your financial advisor,who can review your overall portfolio, reassess your goals and help you stayfocused on the long term. As times like these illustrate, all securities marketsfluctuate, as do fund share prices.
We are grateful for the trust you have placed in Franklin Templeton andremain focused on serving your investment needs.
Sincerely,
Gregory E. JohnsonPresident and Chief Executive OfficerFranklin Resources, Inc.
This letter reflects our analysis and opinions as of October 31, 2008. The information is not a complete analysis of every aspect of any market, country, industry, security or fund. Statements of fact are from sources considered reliable.
4. Source: Standard & Poor’s press release, 10/6/08.

For the year ended September 30, 2008, the decelerating U.S. economy con-tended with a staggering financial markets crisis amid a wave of governmentinterventions and emergency funding. In addition, high oil prices, the worsthousing market contraction in decades, a severe credit crunch and rising job-lessness weighed on the economy. Economic growth, as measured by grossdomestic product (GDP), reported a -0.2% annualized rate for the fourthquarter of 2007. GDP edged up to 0.9% annualized in the first quarter of 2008and improved at a 2.8% annualized pace in the second quarter, based largelyon strong exports and government spending. However, GDP fell an estimatedannualized 0.3% in 2008’s third quarter as the subprime financial crisis deep-ened and spread into all aspects of the economy. The U.S. dollar declined for much of the 12 months compared with most foreign currencies, whichcontributed to increased export demand and aided the manufacturing sector.The greenback then rallied toward period-end, breaking a six-year downwardtrend as commodity prices fell, inflationary concerns abated and global eco-nomic growth began to subside. Supports to the economy included an inventorybuildup, expanding government spending and a boost to household financesfrom a fiscal stimulus package. Although tax rebate checks lifted spendingtemporarily, retail sales remained weak and new vehicle sales hit a 15-year low.
The U.S. labor market contracted and the unemployment rate rose from 4.7%at the beginning of the period to 6.1% in September, the highest level sinceSeptember 2003.1 Volatile oil prices soared to an all-time trading high of $145per barrel in July 2008 but eased to $101 by period-end. Many other com-modity prices — including those for coal, natural gas, precious metals, rawmaterials and agricultural commodities — also neared or surpassed all-timehighs due to increased worldwide demand and investors seeking alternatives to shaky stocks and corporate bonds. These prices plummeted through muchof third quarter 2008 as global demand and speculative buying subsided. Forthe 12 months ended September 30, 2008, inflation as measured by the coreConsumer Price Index (CPI), which excludes food and energy costs, rose 2.5%;this was higher than its 2.2% 10-year average rate.1
1. Source: Bureau of Labor Statistics.
4 | Annual Report
Annual Report
Economic and Market Overview
Seeking to stimulate the sagging economy without stoking inflation, the FederalReserve Board (Fed) made six cuts to its key federal funds target rate during theperiod, lowering it 275 basis points, from 4.75% to a four-year low of 2.00%.In this uncertain environment, LIBOR (London Interbank Offered Rate), theinterest rate that banks charge each other for loans, jumped to record highs.Fixed income spreads generally widened relative to Treasury yields over theperiod as investors sought the relative safety of short- and intermediate-termU.S. Treasury securities. Treasury yields declined and the yield curve steepenedas short-term, two- and five-year yields declined significantly, with the two-yearbill yielding 2.00% at the end of September, down from 3.97% a year earlier.Over the same period, the 10-year U.S. Treasury note yield declined from 4.59%to 3.85%.
U.S. stock markets endured high volatility and suffered losses during this chal-lenging period. For the 12 months under review, the blue chip stocks of the DowJones Industrial Average had a total return of -19.85%, the broader Standard &Poor’s 500 Index (S&P 500) a -21.98% total return, and the technology-heavyNASDAQ Composite Index a -21.99% total return.2 Consumer staples was theonly sector to record positive results, while the financials, telecommunicationsand industrials sectors had the largest declines. In general, small-capitalizationstocks performed better than large caps, and growth stocks fared better thantheir value counterparts.
The foregoing information reflects our analysis and opinions as of September 30, 2008. The information is not acomplete analysis of every aspect of any market, country, industry, security or fund. Statements of fact are fromsources considered reliable.
2. Source: © 2008 Morningstar. All Rights Reserved. The information contained herein: (1) is proprietary to Morningstarand/or its content providers; (2) may not be copied or distributed; and (3) is not warranted to be accurate, complete ortimely. Neither Morningstar nor its content providers are responsible for any damages or losses arising from any use ofthis information. Past performance is no guarantee of future results. The Dow Jones Industrial Average is price weightedbased on the average market price of 30 blue chip stocks of companies that are generally industry leaders. The S&P 500consists of 500 stocks chosen for market size, liquidity and industry group representation. Each stock’s weight in theindex is proportionate to its market value. The S&P 500 is one of the most widely used benchmarks of U.S. equity per-formance. The NASDAQ Composite Index measures all NASDAQ domestic and international based common type stockslisted on The NASDAQ Stock Market. The index is market value weighted and includes more than 3,000 companies.
Annual Report | 5

6 | Annual Report
Franklin DynaTech Fund
Your Fund’s Goal and Main Investments: Franklin DynaTech Fund seeks capital
appreciation by investing substantially in equity securities of companies emphasizing scientific or
technological development or that are in fast-growing industries.
This annual report for Franklin DynaTech Fund covers the fiscal year endedSeptember 30, 2008.
Performance Overview
Franklin DynaTech Fund – Class A had a -21.36% cumulative total return forthe 12 months under review. For the same period, the Fund performed betterthan its narrow benchmark, the NASDAQ 100 Index, which had a price-onlyreturn of -24.22%, and performed comparably to the broader Standard &Poor’s 500 Index (S&P 500), which had a -21.98% total return.1 You can findthe Fund’s long-term performance data in the Performance Summary beginningon page 9.
Investment Strategy
Based on our independent analysis of individual companies, we search forleading companies that we believe have a sustainable competitive advantage dueto state-of-the-art and innovative products, technologies and business models.We consider such factors as a company’s competitive positioning, patents, new
1. Source: © 2008 Morningstar. All Rights Reserved. The information contained herein: (1) is proprietary to Morningstarand/or its content providers; (2) may not be copied or distributed; and (3) is not warranted to be accurate, complete ortimely. Neither Morningstar nor its content providers are responsible for any damages or losses arising from any use ofthis information. The NASDAQ 100 Index includes 100 of the largest domestic and international nonfinancial companieslisted on The NASDAQ Stock Market based on market capitalization. The index reflects companies across major indus-try groups including computer hardware and software, telecommunications, retail/wholesale trade and biotechnology.It does not contain financial companies including investment companies. The NASDAQ 100 Index is calculated under a modified capitalization-weighted methodology. Index returns are price-return only and do not include reinvested divi-dends. The S&P 500 consists of 500 stocks chosen for market size, liquidity and industry group representation. Eachstock’s weight in the index is proportionate to its market value. The S&P 500 includes reinvested dividends and is oneof the most widely used benchmarks of U.S. equity performance. The indexes are unmanaged. One cannot investdirectly in an index, nor is an index representative of the Fund’s portfolio.
The dollar value, number of shares or principal amount, and names of all portfolio holdings are listed in theFund’s Statement of Investments (SOI). The SOI begins on page 63.
Performance data represent past
performance, which does not
guarantee future results.
Investment return and principal
value will fluctuate, and you may
have a gain or loss when you sell
your shares. Current performance
may differ from figures shown.
Please visit franklintempleton.comor call (800) 342-5236 for most
recent month-end performance.

products, market share, industry growth, recent operational execution andmanagerial strength. We use a conservative, bottom-up research process to buyand hold what we consider to be undervalued companies.
Manager’s Discussion
During this challenging year, many Fund holdings declined in value and hurtFund performance. These included computer processing hardware manufacturerApple, Internet search engine Google and computer technology firm NVIDIA.Apple’s share price fell late in the reporting period after investors began ques-tioning whether consumers would continue to buy the company’s high-endproducts amid the current global economic slowdown. Google’s shares sufferedlargely due to decelerating advertising revenue. NVIDIA’s share price declinedmainly due to expectations for slowing computer and semiconductor sales, andwe sold it by period-end.
The information technology sector suffered steep declines during the year underreview.2 Within the sector, the semiconductors and semiconductor equipmentindustry, including Intel and Varian Semiconductor Equipment, hurt perform-ance on an absolute basis during the period. The industry can be sensitive toeconomic changes, and this poor performance reflected slow growth in thecurrent global economic downturn. Most of the industries in this sector, suchas Internet software and services, software, and communications equipment,also weighed on the Fund’s performance.
One of the most significant contributors to Fund performance during the year under review was global retail electronic payments network operatorVisa, whose initial public offering in March was the largest ever recorded.Other major contributors to performance included biotechnology giantGenentech, whose shares shot up in price after drugmaker Roche offered to buy full control of the company, and drug manufacturer MillenniumPharmaceuticals, whose share price increased after it agreed to be acquired by Takeda Pharmaceuticals. These companies led biotechnology to boost Fundperformance from an industry perspective. We no longer held MillenniumPharmaceuticals by period-end.
Annual Report | 7
2. The information technology sector comprises communications equipment; computers and peripherals; electronicequipment, instruments and components; Internet software and services; IT services; semiconductors and semiconductorequipment; and software in the SOI.
Portfolio BreakdownFranklin DynaTech FundBased on Total Net Assets as of 9/30/08
Software
Biotechnology
Computers & Peripherals
Health Care Equipment & Supplies
Semiconductors & Semiconductor Equipment
Internet Software & Services
Pharmaceuticals
Chemicals
Communications Equipment
15.8%
12.2%
7.6%
7.3%
6.4%
5.5%
5.4%
4.7%
4.6%
4.5%
4.5%
3.7%
2.2%
10.0%
5.6%
IT Services
Energy Equipment & Services
Life Sciences Tools & Services
Electronic Equipment, Instruments & Components
Other
Short-Term Investments & Other Net Assets

Thank you for your continued participation in Franklin DynaTech Fund. Welook forward to serving your future investment needs.
Rupert H. Johnson, Jr.
Matthew J. Moberg, CPA
Portfolio Management TeamFranklin DynaTech Fund
The foregoing information reflects our analysis, opinions and portfolio holdings as of September 30, 2008, the endof the reporting period. The way we implement our main investment strategies and the resulting portfolio holdingsmay change depending on factors such as market and economic conditions. These opinions may not be relied uponas investment advice or an offer for a particular security. The information is not a complete analysis of everyaspect of any market, country, industry, security or the Fund. Statements of fact are from sources consideredreliable, but the investment manager makes no representation or warranty as to their completeness or accuracy.Although historical performance is no guarantee of future results, these insights may help you understand ourinvestment management philosophy.
8 | Annual Report
Top 10 HoldingsFranklin DynaTech Fund9/30/08
Company % of TotalSector/Industry Net Assets
Genentech Inc. 4.9%Biotechnology
Intel Corp. 4.6%Semiconductors & Semiconductor Equipment
Apple Inc. 4.1%Computers & Peripherals
Google Inc., A 3.6%Internet Software & Services
Hewlett-Packard Co. 3.5%Computers & Peripherals
Visa Inc., A 3.4%IT Services
Adobe Systems Inc. 3.0%Software
Gilead Sciences Inc. 3.0%Biotechnology
Sigma-Aldrich Corp. 2.9%Chemicals
Celgene Corp. 2.8%Biotechnology

Annual Report | 9
Performance Summary as of 9/30/08Franklin DynaTech Fund
Your dividend income will vary depending on dividends or interest paid by securities in the Fund’sportfolio, adjusted for operating expenses of each class. Capital gain distributions are net profitsrealized from the sale of portfolio securities. The performance table and graphs do not reflect anytaxes that a shareholder would pay on Fund dividends, capital gain distributions, if any, or anyrealized gains on the sale of Fund shares. Total return reflects reinvestment of the Fund’s dividendsand capital gain distributions, if any, and any unrealized gains or losses.
Price and Distribution Information
Class A (Symbol: FKDNX) Change 9/30/08 9/30/07
Net Asset Value (NAV) -$7.46 $24.87 $32.33
Distributions (10/1/07–9/30/08)
Long-Term Capital Gain $0.7062
Class B (Symbol: FDNBX) Change 9/30/08 9/30/07
Net Asset Value (NAV) -$7.30 $23.48 $30.78
Distributions (10/1/07–9/30/08)
Long-Term Capital Gain $0.7062
Class C (Symbol: FDYNX) Change 9/30/08 9/30/07
Net Asset Value (NAV) -$7.23 $23.23 $30.46
Distributions (10/1/07–9/30/08)
Long-Term Capital Gain $0.7062
Advisor Class (Symbol: n/a) Change 9/30/08 5/15/08
Net Asset Value (NAV) -$6.50 $24.90 $31.40

Performance Summary (continued)
10 | Annual Report
Performance
Cumulative total return excludes sales charges. Average annual total return and value of $10,000 investment include max-imum sales charges. Class A: 5.75% maximum initial sales charge; Class B: contingent deferred sales charge (CDSC)declining from 4% to 1% over six years, and eliminated thereafter; Class C: 1% CDSC in first year only; Advisor Class: nosales charges.
Class A 1-Year 5-Year 10-Year
Cumulative Total Return1 -21.36% +26.05% +52.12%
Average Annual Total Return2 -25.88% +3.51% +3.67%
Value of $10,000 Investment3 $7,412 $11,880 $14,336
Total Annual Operating Expenses4 0.99%
Class B 1-Year 5-Year Inception (2/1/00)
Cumulative Total Return1 -21.96% +21.31% -11.37%
Average Annual Total Return2 -25.01% +3.59% -1.38%
Value of $10,000 Investment3 $7,499 $11,931 $8,863
Total Annual Operating Expenses4 1.75%
Class C 1-Year 5-Year 10-Year
Cumulative Total Return1 -21.93% +21.39% +41.21%
Average Annual Total Return2 -22.69% +3.95% +3.51%
Value of $10,000 Investment3 $7,731 $12,139 $14,121
Total Annual Operating Expenses4 1.74%
Advisor Class5 1-Year 5-Year 10-Year
Cumulative Total Return1 -21.27% +26.20% +52.30%
Average Annual Total Return2 -21.27% +4.76% +4.30%
Value of $10,000 Investment3 $7,873 $12,620 $15,230
Total Annual Operating Expenses4 0.75%
Performance data represent past performance, which does not guarantee future results. Investment return and principalvalue will fluctuate, and you may have a gain or loss when you sell your shares. Current performance may differ from figures shown. For most recent month-end performance, see “Funds and Performance” at franklintempleton.com or call (800) 342-5236.

Performance Summary (continued)
Annual Report | 11
Average Annual Total Return
Class A 9/30/08
1-Year -25.88%
5-Year +3.51%
10-Year +3.67%
Class A (10/1/98–9/30/08)
$0
$10,000
$20,000
$30,000
$40,000
9/089/069/049/029/0010/98
$11,852$13,519$14,336
Franklin DynaTech Fund S&P 5006 NASDAQ 100 Index6
Total Return Index Comparison for Hypothetical $10,000 Investment
Total return represents the change in value of an investment over the periods shown. It includes anycurrent, applicable, maximum sales charge, Fund expenses, account fees and reinvested distributions.The indexes are unmanaged. They differ from the Fund in composition and do not pay managementfees or expenses. One cannot invest directly in an index.
Average Annual Total Return
Class B 9/30/08
1-Year -25.01%
5-Year +3.59%
Since Inception (2/1/00) -1.38%
Class B (2/1/00–9/30/08)
9/089/069/049/022/00$0
$5,000
$10,000
$15,000
$4,467
$9,695$8,863
Franklin DynaTech Fund S&P 5006 NASDAQ 100 Index6

Performance Summary (continued)
12 | Annual Report
Class C (10/1/98–9/30/08)
9/089/069/049/029/0010/98$0
$10,000
$30,000
$20,000
$40,000
$11,852$13,519$14,121
Franklin DynaTech Fund S&P 5006 NASDAQ 100 Index6
Advisor Class (10/1/98–9/30/08)5
$0
$10,000
$20,000
$30,000
$40,000
9/089/069/049/029/0010/98
$11,852$13,519$15,230
Franklin DynaTech Fund S&P 5006 NASDAQ 100 Index6
Average Annual Total Return
Class C 9/30/08
1-Year -22.69%
5-Year +3.95%
10-Year +3.51%
Average Annual Total Return
Advisor Class5 9/30/08
1-Year -21.27%
5-Year +4.76%
10-Year +4.30%

Performance Summary (continued)
Endnotes
The Fund’s investments in fast-growing industries, including the technology and telecommunications sectors (which have historically beenvolatile), could result in increased price fluctuation, especially over the short term, due to the rapid pace of product change and developmentand changes in government regulation of companies emphasizing scientific or technological advancement. The Fund may also invest in small-capitalization companies, which involves special risks such as relatively small revenues, limited product lines and modest market share. Theprices of these securities can be volatile, especially over the short term, and investors should expect fluctuation in the value of their invest-ment. The Fund’s prospectus also includes a description of the main investment risks.
Class A: Prior to 8/3/98, these shares were offered at a lower initial sales charge; thus actual total returns may differ.
Class B: These shares have higher annual fees and expenses than Class A shares.
Class C: Prior to 1/1/04, these shares were offered with an initial sales charge; thus actual total returns would have differed. These shareshave higher annual fees and expenses than Class A shares.
Advisor Class: Shares are available to certain eligible investors as described in the prospectus.
1. Cumulative total return represents the change in value of an investment over the periods indicated.
2. Average annual total return represents the average annual change in value of an investment over the periods indicated.
3. These figures represent the value of a hypothetical $10,000 investment in the Fund over the periods indicated.
4. Figures are as stated in the Fund’s prospectus current as of the date of this report.
5. Effective 5/15/08, the Fund began offering Advisor Class shares, which do not have sales charges or a Rule 12b-1 plan. Performance quotationsfor this class reflect the following methods of calculation: (a) For periods prior to 5/15/08, a restated figure is used based upon the Fund’s Class Aperformance, excluding the effect of Class A’s maximum initial sales charge, but reflecting the effect of the Class A Rule 12b-1 fees; and (b) for peri-ods after 5/14/08, actual Advisor Class performance is used reflecting all charges and fees applicable to that class. Since 5/15/08 (commencementof sales), the cumulative total return of Advisor Class shares was -20.70%.
6. Source: © 2008 Morningstar. The S&P 500 consists of 500 stocks chosen for market size, liquidity and industry group representation. Each stock’sweight in the index is proportionate to its market value. The S&P 500 includes reinvested dividends and is one of the most widely used benchmarksof U.S. equity performance. The NASDAQ 100 Index includes 100 of the largest domestic and international nonfinancial companies listed on The NASDAQ Stock Market based on market capitalization. The index reflects companies across major industry groups including computer hardware andsoftware, telecommunications, retail/wholesale trade and biotechnology. It does not contain financial companies including investment companies.The NASDAQ 100 Index is calculated under a modified capitalization-weighted methodology. Index returns are price-return only and do not includereinvested dividends.
Annual Report | 13

14 | Annual Report
Your Fund’s ExpensesFranklin DynaTech Fund
As a Fund shareholder, you can incur two types of costs:
• Transaction costs, including sales charges (loads) on Fund purchases and redemption fees; and
• Ongoing Fund costs, including management fees, distribution and service (12b-1) fees, and otherFund expenses. All mutual funds have ongoing costs, sometimes referred to as operating expenses.
The following table shows ongoing costs of investing in the Fund and can help you understandthese costs and compare them with those of other mutual funds. The table assumes a $1,000investment held for the six months indicated.
Actual Fund Expenses
The first line (Actual) for each share class listed in the table provides actual account values andexpenses. The “Ending Account Value” is derived from the Fund’s actual return, which includesthe effect of Fund expenses.
You can estimate the expenses you paid during the period by following these steps. Of course,your account value and expenses will differ from those in this illustration:
1. Divide your account value by $1,000.If an account had an $8,600 value, then $8,600 ÷ $1,000 = 8.6.
2. Multiply the result by the number under the heading “Expenses Paid During Period.”If Expenses Paid During Period were $7.50, then 8.6 x $7.50 = $64.50.
In this illustration, the estimated expenses paid this period are $64.50.
Hypothetical Example for Comparison with Other Funds
Information in the second line (Hypothetical) for each class in the table can help you compareongoing costs of investing in the Fund with those of other mutual funds. This information may not be used to estimate the actual ending account balance or expenses you paid during the period.The hypothetical “Ending Account Value” is based on the actual expense ratio for each class andan assumed 5% annual rate of return before expenses, which does not represent the Fund’s actualreturn. The figure under the heading “Expenses Paid During Period” shows the hypotheticalexpenses your account would have incurred under this scenario. You can compare this figure withthe 5% hypothetical examples that appear in shareholder reports of other funds.

Your Fund’s Expenses (continued)
Annual Report | 15
Please note that expenses shown in the table are meant to highlight ongoing costs and do not reflectany transaction costs, such as sales charges or redemption fees. Therefore, the second line for eachclass is useful in comparing ongoing costs only, and will not help you compare total costs of own-ing different funds. In addition, if transaction costs were included, your total costs would havebeen higher. Please refer to the Fund prospectus for additional information on operating expenses.
Beginning Account Ending Account Expenses Paid During Class A Value 4/1/08 Value 9/30/08 Period* 4/1/08–9/30/08
Actual $1,000 $ 895.20 $4.60
Hypothetical (5% return before expenses) $1,000 $1,020.15 $4.90
Class B
Actual $1,000 $ 891.70 $8.13
Hypothetical (5% return before expenses) $1,000 $1,016.40 $8.67
Class C
Actual $1,000 $ 892.10 $8.14
Hypothetical (5% return before expenses) $1,000 $1,016.40 $8.67
Advisor Class
Actual (5/15/08–9/30/08) $1,000 $ 793.00 $2.49
Hypothetical (5% return before expenses) $1,000 $1,021.35 $3.69
*Expenses are calculated using the most recent six-month expense ratio, annualized for each class (A: 0.97%; B: 1.72%; C: 1.72%; and AdvisorClass: 0.73%), multiplied by the average account value over the period, multiplied by 183/366 (Hypothetical for all share classes; Actual for Classes A, B and C) to reflect the one-half year period. For Actual Advisor Class expenses, the multiplier is 139/366 to reflect the number of dayssince the class’s inception.
16 | Annual Report
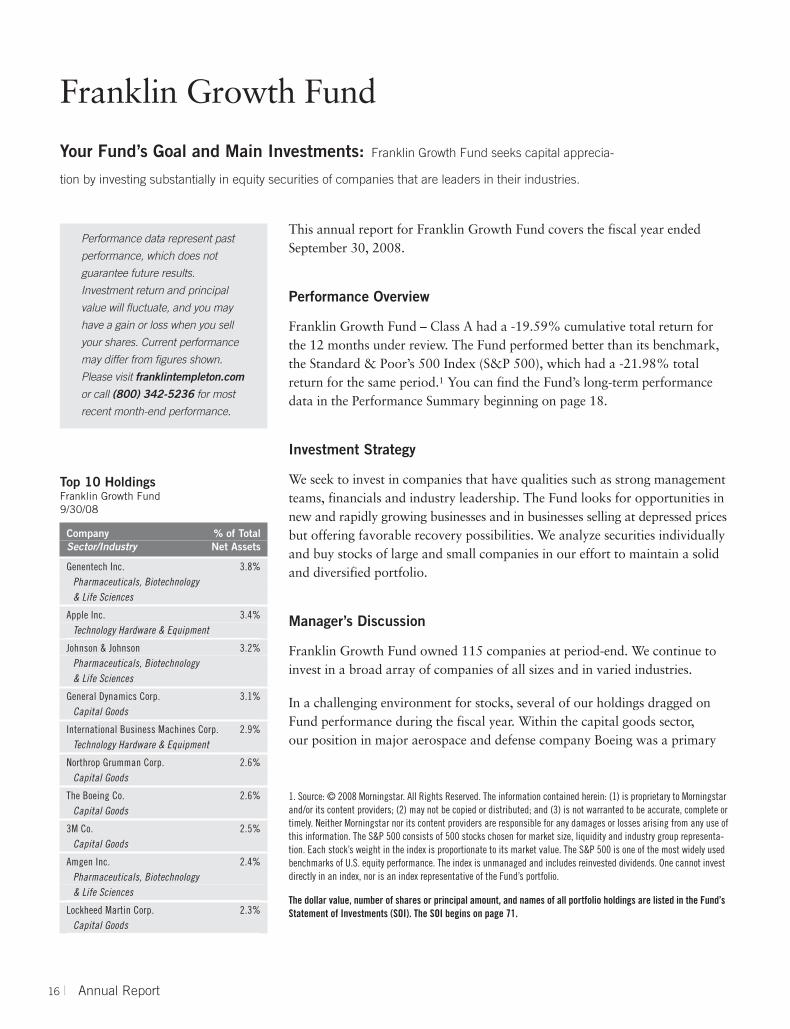
This annual report for Franklin Growth Fund covers the fiscal year endedSeptember 30, 2008.
Performance Overview
Franklin Growth Fund – Class A had a -19.59% cumulative total return forthe 12 months under review. The Fund performed better than its benchmark,the Standard & Poor’s 500 Index (S&P 500), which had a -21.98% totalreturn for the same period.1 You can find the Fund’s long-term performancedata in the Performance Summary beginning on page 18.
Investment Strategy
We seek to invest in companies that have qualities such as strong managementteams, financials and industry leadership. The Fund looks for opportunities innew and rapidly growing businesses and in businesses selling at depressed pricesbut offering favorable recovery possibilities. We analyze securities individuallyand buy stocks of large and small companies in our effort to maintain a solidand diversified portfolio.
Manager’s Discussion
Franklin Growth Fund owned 115 companies at period-end. We continue toinvest in a broad array of companies of all sizes and in varied industries.
In a challenging environment for stocks, several of our holdings dragged onFund performance during the fiscal year. Within the capital goods sector, our position in major aerospace and defense company Boeing was a primary
1. Source: © 2008 Morningstar. All Rights Reserved. The information contained herein: (1) is proprietary to Morningstarand/or its content providers; (2) may not be copied or distributed; and (3) is not warranted to be accurate, complete ortimely. Neither Morningstar nor its content providers are responsible for any damages or losses arising from any use ofthis information. The S&P 500 consists of 500 stocks chosen for market size, liquidity and industry group representa-tion. Each stock’s weight in the index is proportionate to its market value. The S&P 500 is one of the most widely usedbenchmarks of U.S. equity performance. The index is unmanaged and includes reinvested dividends. One cannot investdirectly in an index, nor is an index representative of the Fund’s portfolio.
The dollar value, number of shares or principal amount, and names of all portfolio holdings are listed in the Fund’sStatement of Investments (SOI). The SOI begins on page 71.
Franklin Growth Fund
Your Fund’s Goal and Main Investments: Franklin Growth Fund seeks capital apprecia-
tion by investing substantially in equity securities of companies that are leaders in their industries.
Performance data represent past
performance, which does not
guarantee future results.
Investment return and principal
value will fluctuate, and you may
have a gain or loss when you sell
your shares. Current performance
may differ from figures shown.
Please visit franklintempleton.comor call (800) 342-5236 for most
recent month-end performance.
Top 10 HoldingsFranklin Growth Fund9/30/08
Company % of TotalSector/Industry Net Assets
Genentech Inc. 3.8%Pharmaceuticals, Biotechnology & Life Sciences
Apple Inc. 3.4%Technology Hardware & Equipment
Johnson & Johnson 3.2%Pharmaceuticals, Biotechnology & Life Sciences
General Dynamics Corp. 3.1%Capital Goods
International Business Machines Corp. 2.9%Technology Hardware & Equipment
Northrop Grumman Corp. 2.6%Capital Goods
The Boeing Co. 2.6%Capital Goods
3M Co. 2.5%Capital Goods
Amgen Inc. 2.4%Pharmaceuticals, Biotechnology & Life Sciences
Lockheed Martin Corp. 2.3%Capital Goods

Annual Report | 17
detractor. Northrop-Grumman, another big defense contractor held by theFund, also declined substantially. Some other capital goods holdings alsodeclined in value, where Textron and 3M were particular disappointments. Inthe transportation sector, the airlines industry struggled and some airline hold-ings weighed on Fund performance during the period. Among the poorestperformers were Continental Airlines, Texas-based AMR (the parent companyof American Airlines) and U.K.-based British Airways.
During the period under review, Fund performance was largely driven by thepositive returns of holdings in the pharmaceuticals, biotechnology and life sciences sector. Among these were biotech leaders Genentech and Amgen, anddiversified health care products manufacturer Johnson & Johnson. BaxterInternational, in the health care equipment and services sector, also aided theFund. Other key contributors included road and rail stocks in the transporta-tion sector. Our investments in railroad transportation operators such as UnionPacific and Arkansas Best appreciated significantly during the year under review.
Thank you for your continued participation in Franklin Growth Fund. Welook forward to serving your future investment needs.
V. Jerry PalmieriPortfolio ManagerFranklin Growth Fund
The foregoing information reflects our analysis, opinions and portfolio holdings as of September 30, 2008, the endof the reporting period. The way we implement our main investment strategies and the resulting portfolio holdingsmay change depending on factors such as market and economic conditions. These opinions may not be reliedupon as investment advice or an offer for a particular security. The information is not a complete analysis ofevery aspect of any market, country, industry, security or the Fund. Statements of fact are from sources consid-ered reliable, but the investment manager makes no representation or warranty as to their completeness oraccuracy. Although historical performance is no guarantee of future results, these insights may help you under-stand our investment management philosophy.
Portfolio BreakdownFranklin Growth FundBased on Total Net Assets as of 9/30/08
Capital Goods*
Pharmaceuticals, Biotechnology & Life Sciences
Technology Hardware & Equipment
Transportation
Software & Services
Automobiles & Components
Materials
Commercial & Professional Services
Media
Energy
Other
Health Care Equipment & Services
28.8%
20.7%
12.9%
9.8%
6.3%
4.0%
2.7%
2.4%
2.3%
2.2%
2.2%
5.7%
*Significant exposure to a single sector may result ingreater volatility for the Fund than a more broadlydiversified portfolio.

18 | Annual Report
Performance Summary as of 9/30/08Franklin Growth Fund
Price and Distribution Information
Class A (Symbol: FKGRX) Change 9/30/08 9/30/07
Net Asset Value (NAV) -$9.19 $37.17 $46.36
Distributions (10/1/07–9/30/08)
Dividend Income $0.1302
Class B (Symbol: FKGBX) Change 9/30/08 9/30/07
Net Asset Value (NAV) -$8.98 $35.44 $44.42
Class C (Symbol: FRGSX) Change 9/30/08 9/30/07
Net Asset Value (NAV) -$8.89 $35.14 $44.03
Class R (Symbol: FGSRX) Change 9/30/08 9/30/07
Net Asset Value (NAV) -$9.12 $36.87 $45.99
Distributions (10/1/07–9/30/08)
Dividend Income $0.0304
Advisor Class (Symbol: FCGAX) Change 9/30/08 9/30/07
Net Asset Value (NAV) -$9.20 $37.25 $46.45
Distributions (10/1/07–9/30/08)
Dividend Income $0.2332
Your dividend income will vary depending on dividends or interest paid by securities in the Fund’sportfolio, adjusted for operating expenses of each class. Capital gain distributions are net profitsrealized from the sale of portfolio securities. The performance table and graphs do not reflect anytaxes that a shareholder would pay on Fund dividends, capital gain distributions, if any, or anyrealized gains on the sale of Fund shares. Total return reflects reinvestment of the Fund’s dividendsand capital gain distributions, if any, and any unrealized gains or losses.

Performance Summary (continued)
Annual Report | 19
Performance
Cumulative total return excludes sales charges. Average annual total return and value of $10,000 investment include maximum sales charges. Class A: 5.75% maximum initial sales charge; Class B: contingent deferred sales charge (CDSC) declining from 4% to 1% over six years, and eliminated thereafter; Class C: 1% CDSC in first year only; Class R/Advisor Class: no sales charges.
Class A 1-Year 5-Year 10-Year
Cumulative Total Return1 -19.59% +39.80% +46.49%
Average Annual Total Return2 -24.22% +5.67% +3.28%
Value of $10,000 Investment3 $7,578 $13,176 $13,808
Total Annual Operating Expenses4 0.93%
Class B 1-Year 5-Year Inception (1/1/99)
Cumulative Total Return1 -20.22% +34.65% +22.83%
Average Annual Total Return2 -23.41% +5.81% +2.13%
Value of $10,000 Investment3 $7,659 $13,265 $12,283
Total Annual Operating Expenses4 1.69%
Class C 1-Year 5-Year 10-Year
Cumulative Total Return1 -20.19% +34.64% +35.88%
Average Annual Total Return2 -20.99% +6.13% +3.11%
Value of $10,000 Investment3 $7,901 $13,464 $13,588
Total Annual Operating Expenses4 1.69%
Class R 1-Year 5-Year Inception (1/1/02)
Cumulative Total Return1 -19.78% +38.07% +17.12%
Average Annual Total Return2 -19.78% +6.66% +2.37%
Value of $10,000 Investment3 $8,022 $13,807 $11,712
Total Annual Operating Expenses4 1.19%
Advisor Class 1-Year 5-Year 10-Year
Cumulative Total Return1 -19.39% +41.51% +50.11%
Average Annual Total Return2 -19.39% +7.19% +4.15%
Value of $10,000 Investment3 $8,061 $14,151 $15,011
Total Annual Operating Expenses4 0.69%
Performance data represent past performance, which does not guarantee future results. Investment return and principalvalue will fluctuate, and you may have a gain or loss when you sell your shares. Current performance may differ from figures shown. For most recent month-end performance, see “Funds and Performance” at franklintempleton.com or call (800) 342-5236.

Performance Summary (continued)
20 | Annual Report
Average Annual Total Return
Class A 9/30/08
1-Year -24.22%
5-Year +5.67%
10-Year +3.28%
Average Annual Total Return
Class B 9/30/08
1-Year -23.41%
5-Year +5.81%
Since Inception (1/1/99) +2.13%
Class A (10/1/98–9/30/08)
$5,000
$10,000
$15,000
$20,000
9/089/069/049/029/0010/98
Franklin Growth Fund S&P 5005
$13,519$13,808
Class B (1/1/99–9/30/08)
9/089/069/049/029/001/99$5,000
$10,000
$15,000
$20,000
$11,146$12,283
Franklin Growth Fund S&P 5005
Total Return Index Comparison for Hypothetical $10,000 Investment
Total return represents the change in value of an investment over the periods shown. It includes anycurrent, applicable, maximum sales charge, Fund expenses, account fees and reinvested distributions.The unmanaged index includes reinvestment of any income or distributions. It differs from theFund in composition and does not pay management fees or expenses. One cannot invest directly inan index.

Performance Summary (continued)
Annual Report | 21
Class C (10/1/98–9/30/08)
$5,000
$10,000
$15,000
$20,000
9/089/069/049/029/0010/98
Franklin Growth Fund S&P 5005
$13,519$13,588
Average Annual Total Return
Class C 9/30/08
1-Year -20.99%
5-Year +6.13%
10-Year +3.11%
Average Annual Total Return
Class R 9/30/08
1-Year -19.78%
5-Year +6.66%
Since Inception (1/1/02) +2.37%
Class R (1/1/02–9/30/08)
9/089/069/049/021/02$5,000
$10,000
$15,000
$20,000
$11,497$11,712
Franklin Growth Fund S&P 5005

Performance Summary (continued)
22 | Annual Report
Advisor Class (10/1/98–9/30/08)
$5,000
$10,000
$15,000
$20,000
9/089/069/049/029/0010/98
Franklin Growth Fund S&P 5005
$13,519$15,011
Average Annual Total Return
Advisor Class 9/30/08
1-Year -19.39%
5-Year +7.19%
10-Year +4.15%
Endnotes
Historically, the Fund has focused on larger companies. The Fund may also invest in small, relatively new and/orunseasoned companies, which involves additional risks, as the prices of these securities can be volatile, par-ticularly over the short term. In addition, the Fund may invest up to 40% of its net assets in stocks of foreigncompanies, which involve special risks, including currency volatility and political, economic and regulatoryuncertainty. The Fund’s portfolio includes investments in technology, which has been among the market’smost volatile sectors. The Fund’s prospectus also includes a description of the main investment risks.
Class A: Prior to 8/3/98, these shares were offered at a lower initial sales charge; thus actual total returnsmay differ.
Class B: These shares have higher annual fees and expenses than Class A shares.
Class C: Prior to 1/1/04, these shares were offered with an initial sales charge; thus actual total returnswould have differed. These shares have higher annual fees and expenses than Class A shares.
Class R: Shares are available to certain eligible investors as described in the prospectus. These shares havehigher annual fees and expenses than Class A shares.
Advisor Class: Shares are available to certain eligible investors as described in the prospectus.
1. Cumulative total return represents the change in value of an investment over the periods indicated.
2. Average annual total return represents the average annual change in value of an investment over the periodsindicated.
3. These figures represent the value of a hypothetical $10,000 investment in the Fund over the periods indicated.
4. Figures are as stated in the Fund’s prospectus current as of the date of this report.
5. Source: © 2008 Morningstar. The S&P 500 consists of 500 stocks chosen for market size, liquidity and industrygroup representation. Each stock’s weight in the index is proportionate to its market value. The S&P 500 is one ofthe most widely used benchmarks of U.S. equity performance.

Annual Report | 23
Your Fund’s ExpensesFranklin Growth Fund
As a Fund shareholder, you can incur two types of costs:
• Transaction costs, including sales charges (loads) on Fund purchases and redemption fees; and
• Ongoing Fund costs, including management fees, distribution and service (12b-1) fees, and otherFund expenses. All mutual funds have ongoing costs, sometimes referred to as operating expenses.
The following table shows ongoing costs of investing in the Fund and can help you understandthese costs and compare them with those of other mutual funds. The table assumes a $1,000investment held for the six months indicated.
Actual Fund Expenses
The first line (Actual) for each share class listed in the table provides actual account values andexpenses. The “Ending Account Value” is derived from the Fund’s actual return, which includesthe effect of Fund expenses.
You can estimate the expenses you paid during the period by following these steps. Of course,your account value and expenses will differ from those in this illustration:
1. Divide your account value by $1,000.If an account had an $8,600 value, then $8,600 ÷ $1,000 = 8.6.
2. Multiply the result by the number under the heading “Expenses Paid During Period.”If Expenses Paid During Period were $7.50, then 8.6 x $7.50 = $64.50.
In this illustration, the estimated expenses paid this period are $64.50.
Hypothetical Example for Comparison with Other Funds
Information in the second line (Hypothetical) for each class in the table can help you compareongoing costs of investing in the Fund with those of other mutual funds. This information may not be used to estimate the actual ending account balance or expenses you paid during the period.The hypothetical “Ending Account Value” is based on the actual expense ratio for each class andan assumed 5% annual rate of return before expenses, which does not represent the Fund’s actualreturn. The figure under the heading “Expenses Paid During Period” shows the hypotheticalexpenses your account would have incurred under this scenario. You can compare this figure withthe 5% hypothetical examples that appear in shareholder reports of other funds.

Your Fund’s Expenses (continued)
24 | Annual Report
Please note that expenses shown in the table are meant to highlight ongoing costs and do not reflectany transaction costs, such as sales charges or redemption fees. Therefore, the second line for eachclass is useful in comparing ongoing costs only, and will not help you compare total costs of own-ing different funds. In addition, if transaction costs were included, your total costs would havebeen higher. Please refer to the Fund prospectus for additional information on operating expenses.
Beginning Account Ending Account Expenses Paid During Class A Value 4/1/08 Value 9/30/08 Period* 4/1/08–9/30/08
Actual $1,000 $ 920.10 $4.13
Hypothetical (5% return before expenses) $1,000 $1,020.70 $4.34
Class B
Actual $1,000 $ 916.70 $7.71
Hypothetical (5% return before expenses) $1,000 $1,016.95 $8.12
Class C
Actual $1,000 $ 916.80 $7.72
Hypothetical (5% return before expenses) $1,000 $1,016.95 $8.12
Class R
Actual $1,000 $ 919.20 $5.33
Hypothetical (5% return before expenses) $1,000 $1,019.45 $5.60
Advisor Class
Actual $1,000 $ 921.30 $2.93
Hypothetical (5% return before expenses) $1,000 $1,021.95 $3.08
*Expenses are calculated using the most recent six-month expense ratio, annualized for each class (A: 0.86%; B: 1.61%; C: 1.61%; R: 1.11%; andAdvisor: 0.61%), multiplied by the average account value over the period, multiplied by 183/366 to reflect the one-half year period.

Annual Report | 25
This annual report for Franklin Income Fund covers the fiscal year endedSeptember 30, 2008.
Performance Overview
Franklin Income Fund – Class A had a -21.36% cumulative total return forthe year under review. The Fund performed comparably with its equity bench-mark, the Standard & Poor’s 500 Index (S&P 500), which had a -21.98% totalreturn; underperformed its fixed income benchmark, the Barclays Capital (BC;formerly, Lehman Brothers) U.S. Aggregate Index, which returned +3.65%;and underperformed its peers as measured by the Lipper Mixed-Asset TargetAllocation Moderate Funds Classification Average, which had a -14.89% totalreturn, for the same period.1 You can find the Fund’s long-term performancedata in the Performance Summary beginning on page 30.
Investment Strategy
Based on our independent analysis of debt, convertible and equity securities, wesearch for undervalued or out-of-favor securities we believe offer opportunities
1. Source: © 2008 Morningstar. All Rights Reserved. The information contained herein: (1) is proprietary to Morningstarand/or its content providers; (2) may not be copied or distributed; and (3) is not warranted to be accurate, complete ortimely. Neither Morningstar nor its content providers are responsible for any damages or losses arising from any use ofthis information. The S&P 500 consists of 500 stocks chosen for market size, liquidity and industry group representa-tion. Each stock’s weight in the index is proportionate to its market value. The S&P 500 is one of the most widely usedbenchmarks of U.S. equity performance. The BC U.S. Aggregate Index represents securities that are SEC-registered,taxable and dollar denominated. The index covers the U.S. investment grade fixed-rate bond market, with index com-ponents for government and corporate securities, mortgage pass-through securities and asset-backed securities. All issues included must have at least one year to final maturity and must be rated investment grade (Baa3 or better)by Moody’s Investors Service. They must also be dollar denominated and nonconvertible. Total return includes priceappreciation/depreciation and income as a percentage of the original investment. The index is rebalanced monthly bymarket capitalization.
Source: Lipper Inc. The Lipper Mixed-Asset Target Allocation Moderate Funds Classification Average is calculated byaveraging the total returns of all funds within the Lipper Mixed-Asset Target Allocation Moderate Funds classificationin the Lipper Open-End underlying funds universe. Lipper Mixed-Asset Target Allocation Moderate Funds are defined asfunds that, by portfolio practice, maintain a mix of between 40%-60% equity securities, with the remainder investedin bonds, cash and cash equivalents. For the 12-month period ended 9/30/08, there were 498 funds in this category.Lipper calculations do not include sales charges or expense subsidization by a fund’s manager. The Fund’s perform-ance relative to the average may have differed if these and other factors had been considered.
The indexes are unmanaged and include reinvestment of any income or distributions. One cannot invest directly in anindex, nor is an index representative of the Fund’s portfolio.
The dollar value, number of shares or principal amount, and names of all portfolio holdings are listed in the Fund’sStatement of Investments (SOI). The SOI begins on page 81.
Franklin Income Fund
Your Fund’s Goal and Main Investments: Franklin Income Fund seeks to maximize
income while maintaining prospects for capital appreciation through a diversified portfolio of debt and
equity securities.
Performance data represent past
performance, which does not
guarantee future results.
Investment return and principal
value will fluctuate, and you may
have a gain or loss when you sell
your shares. Current performance
may differ from figures shown.
Please visit franklintempleton.comor call (800) 342-5236 for most
recent month-end performance.

for income today and significant growth tomorrow. We consider such factors asa company’s experience and managerial strength; its responsiveness to changesin interest rates and business conditions; debt maturity schedules and borrowingrequirements; a company’s changing financial condition and market recognitionof the change; and a security’s relative value based on such factors as anticipatedcash flow, interest or dividend coverage, asset coverage and earnings.
Manager’s Discussion
The Fund’s equity holdings generally underperformed its fixed income hold-ings. Stocks struggled with a difficult bear market, which declined more than20% during the year under review. This was exacerbated by the -39.32%return of the S&P 500 Financials Index for the same period.2
26 | Annual Report
2. Source: © 2008 Morningstar. The S&P 500 Financials Index is market value weighted and includes all the financialstocks in the S&P 500.
Dividend Distributions*Franklin Income Fund10/1/07–9/30/08
Dividend per Share (cents)Month Class A Class B Class B1** Class C Class R Advisor Class
October 1.20 1.01 1.09 1.09 1.12 1.24
November 1.20 1.01 1.09 1.09 1.12 1.24
December*** 1.75 1.55 1.63 1.63 1.67 1.78
January 1.20 1.00 1.08 1.08 1.12 1.23
February 1.25 1.05 1.13 1.13 1.17 1.28
March 1.25 1.08 1.15 1.15 1.18 1.28
April 1.25 1.08 1.15 1.15 1.18 1.28
May 1.25 1.08 1.15 1.15 1.18 1.28
June 1.25 1.08 1.15 1.15 1.18 1.28
July 1.25 1.08 1.15 1.15 1.18 1.28
August 1.25 1.08 1.15 1.15 1.18 1.28
September 1.25 1.09 1.16 1.16 1.19 1.27
Total 15.35 13.19 14.08 14.08 14.47 15.72
*All Fund distributions will vary depending upon current market conditions, and past distributions are not indicativeof future trends.
**On November 1, 2001, the Fund closed Class B to new investors and changed the name to Class B1; a new Class Bbecame available to investors.
***Includes an additional 0.55 cent per share distribution to meet excise tax requirements.

Annual Report | 27
As the credit crisis spread and engulfed more companies, some of the Fund’spreferred stock and convertible preferred stock holdings in financial compa-nies including Fannie Mae, Freddie Mac, Lehman Brothers Holdings andAmerican International Group (AIG) negatively impacted results. Althoughthe Fund avoided positions in these companies’ common stocks in favor ofinvestment-grade-rated securities higher in the capital structure, the unfore-seen market distress hampered the Fund’s performance.
Weakness spread across equity markets beyond financials and affected severalof the Fund’s large positions including AT&T, which declined mostly due torenewed concerns that softening economic conditions would further pressureconsumer and business spending.
Although utility stocks generally outperformed the broader equity market,returns remained negative. Thus, several of the Fund’s holdings lost valueincluding Public Service Enterprise Group, American Electric Power and Ameren,mostly resulting from concerns that falling commodity and ultimately powerprices would reduce earnings. Partially offsetting these declines were several ofthe Fund’s utility holdings that delivered positive total returns includingSouthern Co., Dominion Resources and FirstEnergy.
The Fund’s fixed income holdings also suffered from the credit crunch and asubstantial widening of credit spreads over the course of the Fund’s fiscal year.The 10-year U.S. Treasury note’s yield declined from 4.59% at the beginning ofthe period to a low of 3.31% on March 17, 2008. Partly due to investors’ fearsof increased U.S. government obligations associated with the credit crisis, theyield subsequently rose and ended the period at 3.85%.
Investment-grade and high yield corporate bonds were hard hit and under-performed U.S. Treasury securities. According to the BC U.S. CorporateInvestment Grade Index, investment-grade corporate bonds declined 6.78%,and their average spread to Treasuries increased from 152 basis points (bps)(100 bps equal one percentage point) to 467 bps.3 The BC U.S. Corporate HighYield Index fell 11.24%, and high yield corporate bonds’ average spread toTreasuries increased from 436 bps to 1,088 bps.4
Portfolio BreakdownFranklin Income FundBased on Total Net Assets as of 9/30/08
Corporate Straight Bonds
Utilities Stocks
Financials Stocks
Energy Stocks
Health Care Stocks
Telecommunication Services Stocks
Information Technology Stocks
Mortgage-Backed Securities
Materials Stocks
Consumer Discretionary Stocks
Corporate Convertible Bonds
Senior Floating Rate Interests
45.2%
18.4%
5.2%
5.1%
4.8%
4.7%
2.7%
2.3%
2.0%
1.3%
0.9%
0.9%
Industrials Stocks
0.2%
Short-Term Investments & Other Net Assets
6.3%
3. Source: © 2008 Morningstar. The BC U.S. Corporate Investment Grade Index is the corporate component of the BCU.S. Credit Index, which includes publicly issued, SEC-registered bonds that meet specified maturity, liquidity andquality requirements.
4. Source: © 2008 Morningstar. The BC U.S. Corporate High Yield Index is the corporate component of the BC U.S. HighYield Index, which includes fixed rate, non-investment-grade debt.

28 | Annual Report
Within the Fund’s fixed income holdings, detractors from Fund performancewere concentrated in the financial sector including investment-grade-ratedpositions in AIG and Lehman Brothers Holdings. These two long-standinginstitutions’ significant exposure to the credit crunch led to a crisis of confi-dence regarding their viability. This culminated in Lehman’s bankruptcy filingand AIG’s government-sponsored bailout aimed at preventing the systemic riskassociated with the company’s possible bankruptcy filing. GMAC and FordMotor Credit Company also pressured results due to concerns that the creditcrisis would further curtail these companies’ abilities to operate and meet debtobligations as they become due.
Despite a solid revenue and earnings growth period driven by strong perform-ance in high speed Internet, digital video and telephony, Charter Communicationsbonds declined in value as investors grew increasingly nervous about the com-pany’s long-term ability to manage its debt load in light of the credit markets’current state.
Some positive fixed income contributors to Fund performance for the 12 monthsunder review include hospital operator Tenet Healthcare, which benefited fromfavorable company-specific performance and investors’ perception of solidunderlying asset value from its owned and operated hospitals. Dollar Generalalso benefited from a cyclical shift toward lower-priced retailers particularly dueto fuel price increases that pressured consumers during the reporting period, aswell as from the company’s improved management execution. Mortgage-backedsecurity holdings issued by Ginnie Mae, Fannie Mae and Freddie Mac alsoperformed well despite continued mortgage market turmoil.
Top 5 Equity HoldingsFranklin Income Fund9/30/08
Company % of TotalSector/Industry Net Assets
Pfizer Inc. 2.3%Health Care
The Southern Co. 2.3%Utilities
Canadian Oil Sands Trust (Canada) 2.0%Energy
AT&T Inc. 1.8%Telecommunication Services
Dominion Resources Inc. 1.7%Utilities
Top 5 Bond Holdings*Franklin Income Fund9/30/08
Company % of TotalSector/Industry Net Assets
Ford Motor Credit Co. LLC 3.7%Consumer Discretionary
Tenet Healthcare Corp. 3.0%Health Care
Texas Competitive Electric Holdings Co. LLC 2.5%
Utilities
GMAC LLC 2.5%Financials
Dynegy Holdings Inc. 1.7%Utilities
*Does not include convertible bonds.

Annual Report | 29
Thank you for your continued participation in Franklin Income Fund. Welook forward to serving your future investment needs.
Edward Perks, CFA
Charles B. Johnson
Portfolio Management TeamFranklin Income Fund
The foregoing information reflects our analysis, opinions and portfolio holdings as of September 30, 2008, the endof the reporting period. The way we implement our main investment strategies and the resulting portfolio holdingsmay change depending on factors such as market and economic conditions. These opinions may not be relied uponas investment advice or an offer for a particular security. The information is not a complete analysis of everyaspect of any market, country, industry, security or the Fund. Statements of fact are from sources consideredreliable, but the investment manager makes no representation or warranty as to their completeness or accuracy.Although historical performance is no guarantee of future results, these insights may help you understand ourinvestment management philosophy.

30 | Annual Report
Performance Summary as of 9/30/08Franklin Income Fund
Price and Distribution Information
Class A (Symbol: FKINX) Change 9/30/08 9/30/07
Net Asset Value (NAV) -$0.76 $1.98 $2.74
Distributions (10/1/07–9/30/08)
Dividend Income $0.1535
Short-Term Capital Gain $0.0172
Long-Term Capital Gain $0.0437
Total $0.2144
Class B (Symbol: FBICX) Change 9/30/08 9/30/07
Net Asset Value (NAV) -$0.76 $1.97 $2.73
Distributions (10/1/07–9/30/08)
Dividend Income $0.1319
Short-Term Capital Gain $0.0172
Long-Term Capital Gain $0.0437
Total $0.1928
Class B1 (Symbol: FICBX) Change 9/30/08 9/30/07
Net Asset Value (NAV) -$0.76 $1.98 $2.74
Distributions (10/1/07–9/30/08)
Dividend Income $0.1408
Short-Term Capital Gain $0.0172
Long-Term Capital Gain $0.0437
Total $0.2017
Class C (Symbol: FCISX) Change 9/30/08 9/30/07
Net Asset Value (NAV) -$0.77 $1.99 $2.76
Distributions (10/1/07–9/30/08)
Dividend Income $0.1408
Short-Term Capital Gain $0.0172
Long-Term Capital Gain $0.0437
Total $0.2017
Your dividend income will vary depending on dividends or interest paid by securities in the Fund’sportfolio, adjusted for operating expenses of each class. Capital gain distributions are net profitsrealized from the sale of portfolio securities. The performance table and graphs do not reflect anytaxes that a shareholder would pay on Fund dividends, capital gain distributions, if any, or anyrealized gains on the sale of Fund shares. Total return reflects reinvestment of the Fund’s dividendsand capital gain distributions, if any, and any unrealized gains or losses.

Performance Summary (continued)
Annual Report | 31
Performance
Cumulative total return excludes sales charges. Average annual total return and value of $10,000 investment include maximum sales charges. Class A: 4.25% maximum initial sales charge; Class B/B1: contingent deferred sales charge(CDSC) declining from 4% to 1% over six years, and eliminated thereafter; Class C: 1% CDSC in first year only; Class R/Advisor Class: no sales charges.
Class A 1-Year 5-Year 10-Year
Cumulative Total Return1 -21.36% +25.64% +85.05%
Average Annual Total Return2 -24.66% +3.76% +5.90%
Value of $10,000 Investment3 $7,534 $12,029 $17,747
Distribution Rate4 7.25%
30-Day Standardized Yield5 8.92%
Total Annual Operating Expenses6 0.63%
Class B 1-Year 5-Year Inception (11/1/01)
Cumulative Total Return1 -22.13% +20.47% +43.90%
Average Annual Total Return2 -25.02% +3.49% +5.41%
Value of $10,000 Investment3 $7,498 $11,871 $14,390
Distribution Rate4 6.64%
30-Day Standardized Yield5 8.36%
Total Annual Operating Expenses6 1.48%
Class B1 1-Year 5-Year Inception (1/1/99)
Cumulative Total Return1 -21.77% +22.47% +72.14%
Average Annual Total Return2 -24.66% +3.84% +5.73%
Value of $10,000 Investment3 $7,534 $12,071 $17,214
Distribution Rate4 7.03%
30-Day Standardized Yield5 8.74%
Total Annual Operating Expenses6 1.13%
Price and Distribution Information (continued)
Class R (Symbol: FISRX) Change 9/30/08 9/30/07
Net Asset Value (NAV) -$0.76 $1.95 $2.71
Distributions (10/1/07–9/30/08)
Dividend Income $0.1447
Short-Term Capital Gain $0.0172
Long-Term Capital Gain $0.0437
Total $0.2056
Advisor Class (Symbol: FRIAX) Change 9/30/08 9/30/07
Net Asset Value (NAV) -$0.76 $1.97 $2.73
Distributions (10/1/07–9/30/08)
Dividend Income $0.1572
Short-Term Capital Gain $0.0172
Long-Term Capital Gain $0.0437
Total $0.2181

Performance Summary (continued)
32 | Annual Report
Performance (continued)
Class C 1-Year 5-Year 10-Year
Cumulative Total Return1 -21.98% +22.35% +76.24%
Average Annual Total Return2 -22.70% +4.12% +5.83%
Value of $10,000 Investment3 $7,730 $12,235 $17,624
Distribution Rate4 6.99%
30-Day Standardized Yield5 8.79%
Total Annual Operating Expenses6 1.13%
Class R 1-Year 5-Year Inception (1/1/02)
Cumulative Total Return1 -21.91% +23.09% +43.65%
Average Annual Total Return2 -21.91% +4.24% +5.52%
Value of $10,000 Investment3 $7,809 $12,309 $14,365
Distribution Rate4 7.32%
30-Day Standardized Yield5 8.99%
Total Annual Operating Expenses6 0.98%
Advisor Class 1-Year 5-Year 10-Year
Cumulative Total Return1 -21.33% +26.67% +87.42%
Average Annual Total Return2 -21.33% +4.84% +6.48%
Value of $10,000 Investment3 $7,867 $12,667 $18,742
Distribution Rate4 7.74%
30-Day Standardized Yield5 9.50%
Total Annual Operating Expenses6 0.48%
Performance data represent past performance, which does not guarantee future results. Investment return and principalvalue will fluctuate, and you may have a gain or loss when you sell your shares. Current performance may differ from figures shown. For most recent month-end performance, see “Funds and Performance” at franklintempleton.com or call (800) 342-5236.

Performance Summary (continued)
Annual Report | 33
Average Annual Total Return
Class A 9/30/08
1-Year -24.66%
5-Year +3.76%
10-Year +5.90%
Average Annual Total Return
Class B 9/30/08
1-Year -25.02%
5-Year +3.49%
Since Inception (11/1/01) +5.41%
Class A (10/1/98–9/30/08)
9/089/069/049/029/0010/98$5,000
$10,000
$15,000
$20,000
$25,000
$16,596$17,747
$14,399$13,519
Franklin Income Fund
S&P 5007
BC U.S. Aggregate Index7
Lipper Mixed-Asset Target Allocation Moderate Funds Classification Average7
Class B (11/1/01–9/30/08)
9/089/069/049/0211/01$5,000
$10,000
$15,000
$20,000
$13,501$14,390
$12,815$12,487
Franklin Income Fund
S&P 5007
BC U.S. Aggregate Index7
Lipper Mixed-Asset Target Allocation Moderate Funds Classification Average7
Total Return Index Comparison for Hypothetical $10,000 Investment
Total return represents the change in value of an investment over the periods shown. It includes anycurrent, applicable, maximum sales charge, Fund expenses, account fees and reinvested distributions.The unmanaged indexes include reinvestment of any income or distributions. They differ from theFund in composition and do not pay management fees or expenses. One cannot invest directly inan index.

Performance Summary (continued)
34 | Annual Report
Class B1 (1/1/99–9/30/08)
9/089/069/049/029/001/99
$10,000
$15,000
$20,000
$5,000
$25,000
$16,541$17,214
$13,049$11,146
Franklin Income Fund
S&P 5007
BC U.S. Aggregate Index7
Lipper Mixed-Asset Target Allocation Moderate Funds Classification Average7
Average Annual Total Return
Class B1 9/30/08
1-Year -24.66%
5-Year +3.84%
Since Inception (1/1/99) +5.73%
Average Annual Total Return
Class C 9/30/08
1-Year -22.70%
5-Year +4.12%
10-Year +5.83%
Class C (10/1/98–9/30/08)
9/089/069/049/029/0010/98$5,000
$10,000
$15,000
$20,000
$25,000
$16,596$17,624
$14,399$13,519
Franklin Income Fund
S&P 5007
BC U.S. Aggregate Index7
Lipper Mixed-Asset Target Allocation Moderate Funds Classification Average7

Performance Summary (continued)
Annual Report | 35
Class R (1/1/02–9/30/08)
9/089/069/049/021/02$5,000
$10,000
$15,000
$20,000
$13,777$14,365
$12,301$11,497
Franklin Income Fund
S&P 5007
BC U.S. Aggregate Index7
Lipper Mixed-Asset Target Allocation Moderate Funds Classification Average7
Advisor Class (10/1/98–9/30/08)
$5,000
$10,000
$15,000
$20,000
$25,000
$16,596
$18,742
$14,399$13,519
Franklin Income Fund
S&P 5007
BC U.S. Aggregate Index7
Lipper Mixed-Asset Target Allocation Moderate Funds Classification Average7
9/089/069/049/029/0010/98
Average Annual Total Return
Class R 9/30/08
1-Year -21.91%
5-Year +4.24%
Since Inception (1/1/02) +5.52%
Average Annual Total Return
Advisor Class 9/30/08
1-Year -21.33%
5-Year +4.84%
10-Year +6.48%

Performance Summary (continued)
36 | Annual Report
Endnotes
The Fund’s portfolio includes a substantial portion of higher-yielding, lower-rated corporate bonds because of the relatively higher yields theyoffer. These securities carry a greater degree of credit risk relative to investment-grade securities. The Fund’s share price and yield will beaffected by interest rate movements. Bond prices generally move in the opposite direction of interest rates. Thus, as prices of bonds in theFund adjust to a rise in interest rates, the Fund’s share price may decline. While stocks have historically outperformed other asset classesover the long term, they tend to fluctuate over the short term as a result of factors affecting individual companies, industries or the securitiesmarket as a whole. The Fund’s prospectus also includes a description of the main investment risks.
Class B: These shares have higher annual fees and expenses than Class A shares.
Class B1(formerly Class B): These shares have higher annual fees and expenses than Class A shares. Effective 11/1/01, closed to new investors.
Class C: Prior to 1/1/04, these shares were offered with an initial sales charge; thus actual total returns would have differed. These shareshave higher annual fees and expenses than Class A shares.
Class R: Shares are available to certain eligible investors as described in the prospectus. These shares have higher annual fees andexpenses than Class A shares.
Advisor Class: Shares are available to certain eligible investors as described in the prospectus.
1. Cumulative total return represents the change in value of an investment over the periods indicated.
2. Average annual total return represents the average annual change in value of an investment over the periods indicated.
3. These figures represent the value of a hypothetical $10,000 investment in the Fund over the periods indicated.
4. Distribution rate is based on an annualization of the respective class’s September dividend and the maximum offering price (NAV for Classes B,B1, C, R and Advisor) per share on 9/30/08.
5. Yield, calculated as required by the SEC, is based on the earnings of the Fund’s portfolio for the 30 days ended 9/30/08.
6. Figures are as stated in the Fund’s prospectus current as of the date of this report.
7. Sources: © 2008 Morningstar; Lipper Inc. The S&P 500 consists of 500 stocks chosen for market size, liquidity and industry group representation.Each stock’s weight in the index is proportionate to its market value. The S&P 500 is one of the most widely used benchmarks of U.S. equity perform-ance. The BC U.S. Aggregate Index represents securities that are SEC-registered, taxable and dollar denominated. The index covers the U.S. investmentgrade fixed-rate bond market, with index components for government and corporate securities, mortgage pass-through securities and asset-backedsecurities. All issues included must have at least one year to final maturity and must be rated investment grade (Baa3 or better) by Moody’s InvestorsService. They must also be dollar denominated and nonconvertible. Total return includes price appreciation/depreciation and income as a percentageof the original investment. The index is rebalanced monthly by market capitalization. The Lipper Mixed-Asset Target Allocation Moderate FundsClassification Average is calculated by averaging the total returns of all funds within the Lipper Mixed-Asset Target Allocation Moderate Funds classification in the Lipper Open-End underlying funds universe. Lipper Mixed-Asset Target Allocation Moderate Funds are defined as funds that, byportfolio practice, maintain a mix of between 40%-60% equity securities, with the remainder invested in bonds, cash and cash equivalents. For the12-month period ended 9/30/08, there were 498 funds in this category. Lipper calculations do not include sales charges or expense subsidization bya fund’s manager. The Fund’s performance relative to the average may have differed if these or other factors had been considered.

Annual Report | 37
Your Fund’s ExpensesFranklin Income Fund
As a Fund shareholder, you can incur two types of costs:
• Transaction costs, including sales charges (loads) on Fund purchases and redemption fees; and
• Ongoing Fund costs, including management fees, distribution and service (12b-1) fees, and otherFund expenses. All mutual funds have ongoing costs, sometimes referred to as operating expenses.
The following table shows ongoing costs of investing in the Fund and can help you understandthese costs and compare them with those of other mutual funds. The table assumes a $1,000investment held for the six months indicated.
Actual Fund Expenses
The first line (Actual) for each share class listed in the table provides actual account values andexpenses. The “Ending Account Value” is derived from the Fund’s actual return, which includesthe effect of Fund expenses.
You can estimate the expenses you paid during the period by following these steps. Of course,your account value and expenses will differ from those in this illustration:
1. Divide your account value by $1,000.If an account had an $8,600 value, then $8,600 ÷ $1,000 = 8.6.
2. Multiply the result by the number under the heading “Expenses Paid During Period.”If Expenses Paid During Period were $7.50, then 8.6 x $7.50 = $64.50.
In this illustration, the estimated expenses paid this period are $64.50.
Hypothetical Example for Comparison with Other Funds
Information in the second line (Hypothetical) for each class in the table can help you compareongoing costs of investing in the Fund with those of other mutual funds. This information may not be used to estimate the actual ending account balance or expenses you paid during the period.The hypothetical “Ending Account Value” is based on the actual expense ratio for each class andan assumed 5% annual rate of return before expenses, which does not represent the Fund’s actualreturn. The figure under the heading “Expenses Paid During Period” shows the hypotheticalexpenses your account would have incurred under this scenario. You can compare this figure withthe 5% hypothetical examples that appear in shareholder reports of other funds.

Your Fund’s Expenses (continued)
38 | Annual Report
Please note that expenses shown in the table are meant to highlight ongoing costs and do not reflectany transaction costs, such as sales charges or redemption fees. Therefore, the second line for eachclass is useful in comparing ongoing costs only, and will not help you compare total costs of own-ing different funds. In addition, if transaction costs were included, your total costs would havebeen higher. Please refer to the Fund prospectus for additional information on operating expenses.
Beginning Account Ending Account Expenses Paid During Class A Value 4/1/08 Value 9/30/08 Period* 4/1/08–9/30/08
Actual $1,000 $ 847.60 $2.86
Hypothetical (5% return before expenses) $1,000 $1,021.90 $3.13
Class B
Actual $1,000 $ 843.40 $6.77
Hypothetical (5% return before expenses) $1,000 $1,017.65 $7.41
Class B1
Actual $1,000 $ 845.50 $5.17
Hypothetical (5% return before expenses) $1,000 $1,019.40 $5.65
Class C
Actual $1,000 $ 846.10 $5.17
Hypothetical (5% return before expenses) $1,000 $1,019.40 $5.65
Class R
Actual $1,000 $ 844.10 $4.47
Hypothetical (5% return before expenses) $1,000 $1,020.15 $4.90
Advisor Class
Actual $1,000 $ 851.10 $2.18
Hypothetical (5% return before expenses) $1,000 $1,022.65 $2.38
*Expenses are calculated using the most recent six-month expense ratio, annualized for each class (A: 0.62%; B: 1.47%; B1; 1.12%; C: 1.12%; R: 0.97%; and Advisor: 0.47%), multiplied by the average account value over the period, multiplied by 183/366 to reflect the one-half year period.

Annual Report | 39
This annual report for Franklin U.S. Government Securities Fund covers thefiscal year ended September 30, 2008.
Performance Overview
Franklin U.S. Government Securities Fund – Class A posted a +6.00% cumula-tive total return for the 12 months under review. The Fund outperformed the+5.51% total return of its peers as measured by the Lipper GNMA FundsClassification Average.2 In comparison, the Barclays Capital (BC; formerly,Lehman Brothers) U.S. Government: Intermediate Index returned +7.52% for
Franklin U.S. Government Securities Fund
Your Fund’s Goal and Main Investments: Franklin U.S. Government Securities Fund
seeks income by investing at least 80% of its net assets in U.S. government securities. The Fund
presently invests substantially all of its assets in Government National Mortgage Association obligations
(Ginnie Maes).
1. Securities owned by the Fund, but not shares of the Fund, are guaranteed by the U.S. government, its agencies orinstrumentalities as to timely payment of principal and interest. The Fund’s yield and share price are not guaranteedand will vary with market conditions.
2. Source: Lipper Inc. The Lipper GNMA Funds Classification Average is calculated by averaging the total return for allfunds within the Lipper GNMA Funds classification in the Lipper Open-End underlying funds universe for the periodindicated. Lipper GNMA Funds are defined as funds that invest primarily in GNMA securities. For the 12-month periodended 9/30/08, there were 63 funds in this category. Lipper calculations do not include sales charges or expense sub-sidization by a fund’s manager. The Fund’s performance relative to the average may have differed if these or otherfactors had been considered. The index is unmanaged and includes reinvestment of any income or distributions. Onecannot invest directly in an index, nor is an index representative of the Fund’s portfolio.
The dollar value, number of shares or principal amount, and names of all portfolio holdings are listed in the Fund’sStatement of Investments (SOI). The SOI begins on page 96.
Short-Term
GNMA
Portfolio BreakdownFranklin U.S. Government Securities FundBased on Total Net Assets as of 9/30/08
GNMA 94.0%
Short-Term Investments & Other Net Assets 6.0%
Performance data represent past
performance, which does not
guarantee future results.
Investment return and principal
value will fluctuate, and you may
have a gain or loss when you sell
your shares. Current performance
may differ from figures shown.
Please visit franklintempleton.comor call (800) 342-5236 for most
recent month-end performance.
Since 1983, the Fund has invested sub-
stantially in Ginnie Mae securities, which
carry a guarantee backed by the full faith
and credit of the U.S. government as
to the timely payment of interest and
principal.1 Issued by the Government
National Mortgage Association (GNMA),
Ginnie Maes have been among the high-
est yielding U.S. government obligations
available.

40 | Annual Report
Dividend Distributions*Franklin U.S. Government Securities Fund10/1/07–9/30/08
Dividend Per ShareMonth Class A Class B Class C Class R Advisor Class
October 2.69 cents 2.41 cents 2.41 cents 2.49 cents 2.75 cents
November 2.69 cents 2.41 cents 2.41 cents 2.49 cents 2.75 cents
December 2.69 cents 2.40 cents 2.41 cents 2.49 cents 2.75 cents
January 2.69 cents 2.40 cents 2.41 cents 2.49 cents 2.75 cents
February 2.69 cents 2.40 cents 2.41 cents 2.49 cents 2.75 cents
March 2.69 cents 2.40 cents 2.41 cents 2.49 cents 2.77 cents
April 2.69 cents 2.40 cents 2.41 cents 2.49 cents 2.77 cents
May 2.69 cents 2.40 cents 2.41 cents 2.49 cents 2.77 cents
June 2.55 cents 2.26 cents 2.27 cents 2.34 cents 2.61 cents
July 2.55 cents 2.26 cents 2.27 cents 2.34 cents 2.61 cents
August 2.55 cents 2.26 cents 2.27 cents 2.34 cents 2.61 cents
September 2.55 cents 2.29 cents 2.29 cents 2.37 cents 2.62 cents
Total 31.72 cents 28.29 cents 28.38 cents 29.31 cents 32.51 cents
*All Fund distributions will vary depending upon current market conditions, and past distributions are not indicativeof future trends.
the same period.3 The Fund’s return reflects the effect of management fees and expenses, while the BC U.S. Government: Intermediate Index does nothave such costs. You can find the Fund’s long-term performance data in thePerformance Summary beginning on page 43.
Investment Strategy
We seek to invest substantially in GNMA (Ginnie Mae) obligations. We analyze securities using proprietary models to help us identify attractive invest-ment opportunities. The Fund’s short-term investments may include short-termgovernment securities and cash or cash equivalents.
3. Source: © 2008 Morningstar. All Rights Reserved. The information contained herein: (1) is proprietary to Morningstarand/or its content providers; (2) may not be copied or distributed; and (3) is not warranted to be accurate, complete ortimely. Neither Morningstar nor its content providers are responsible for any damages or losses arising from any use ofthis information. The BC U.S. Government: Intermediate Index is the intermediate component of the BC U.S. GovernmentIndex, which covers securities issued by the U.S. government (i.e., securities in the BC U.S. Treasury and Agency Indexes),including public obligations of the U.S. Treasury with a remaining maturity of one year or more and publicly issued debtof U.S. government agencies, quasi-federal corporations, and corporate or foreign debt guaranteed by the U.S. govern-ment. The index is unmanaged and includes reinvestment of any income or distributions. One cannot invest directly inan index, nor is an index representative of the Fund’s portfolio.

Annual Report | 41
Manager’s Discussion
During the 12 months under review, we were pleased with the Fund’s perform-ance versus its peers as measured by the Lipper GNMA Funds ClassificationAverage. Increased volatility and uncertainty characterized the fixed incomemarket environment and investors’ appetite for risk declined as economicprospects worsened and credit market conditions deteriorated. Against thisbackdrop, GNMA mortgage-backed securities (MBS) were among the bestperforming sectors in the fixed income market, although they lagged the supe-rior performance of U.S. Treasuries during the reporting period.
Overall conditions were challenging due to concerns about housing marketweakness, inflation, and continued financial market deleveraging and recapi-talization. Although GNMA securities were not immune to the volatility, theywere somewhat buffered from recent credit market disruptions due to theirhigh degree of credit safety. While concerns swirled around Fannie Mae andFreddie Mac debt, particularly near the end of the reporting period, manyinvestors appeared to find GNMA securities attractive due to their explicit government guarantee.1
Based on our belief that income should continue to drive performance withinthe GNMA market, we focused primarily on 30-year collateral bonds ratherthan their 15-year counterparts, which was consistent with our investmentstrategy. Historically, we have allocated the Fund’s assets between the two tiersof the GNMA market — the GNMA I (comprising single-issuer pools) andGNMA II (comprising multiple-issuer pools) programs. Over the period, weslightly reduced our allocation to GNMA I securities relative to our GNMA IIsector holdings. We maintained a bias toward premium coupons versus dis-counts, as we continued to believe the income stream from these securitiesshould remain the same as prepayments slow.
Our analysis indicated the high-quality prime mortgage market presentedopportunities as spreads have widened with weakness in lower-quality marketsectors. In light of many of the recent events in financial markets, we will con-tinue to monitor changes to the regulatory landscape carefully. We believe ourdedication to our long-term disciplined investment process and portfolio strategyhas served shareholders well over time as we seek opportunities with strongfundamentals and valuations across the entire GNMA investment universe.

Thank you for your continued participation in Franklin U.S. GovernmentSecurities Fund. We welcome your comments and questions and look forwardto serving your investment needs in the years ahead.
Roger A. Bayston, CFA
Jack Lemein
Paul Varunok
Portfolio Management TeamFranklin U.S. Government Securities Fund
The foregoing information reflects our analysis, opinions and portfolio holdings as of September 30, 2008, the endof the reporting period. The way we implement our main investment strategies and the resulting portfolio holdingsmay change depending on factors such as market and economic conditions. These opinions may not be relied uponas investment advice or an offer for a particular security. The information is not a complete analysis of everyaspect of any market, country, industry, security or the Fund. Statements of fact are from sources consideredreliable, but the investment manager makes no representation or warranty as to their completeness or accuracy.Although historical performance is no guarantee of future results, these insights may help you understand ourinvestment management philosophy.
42 | Annual Report
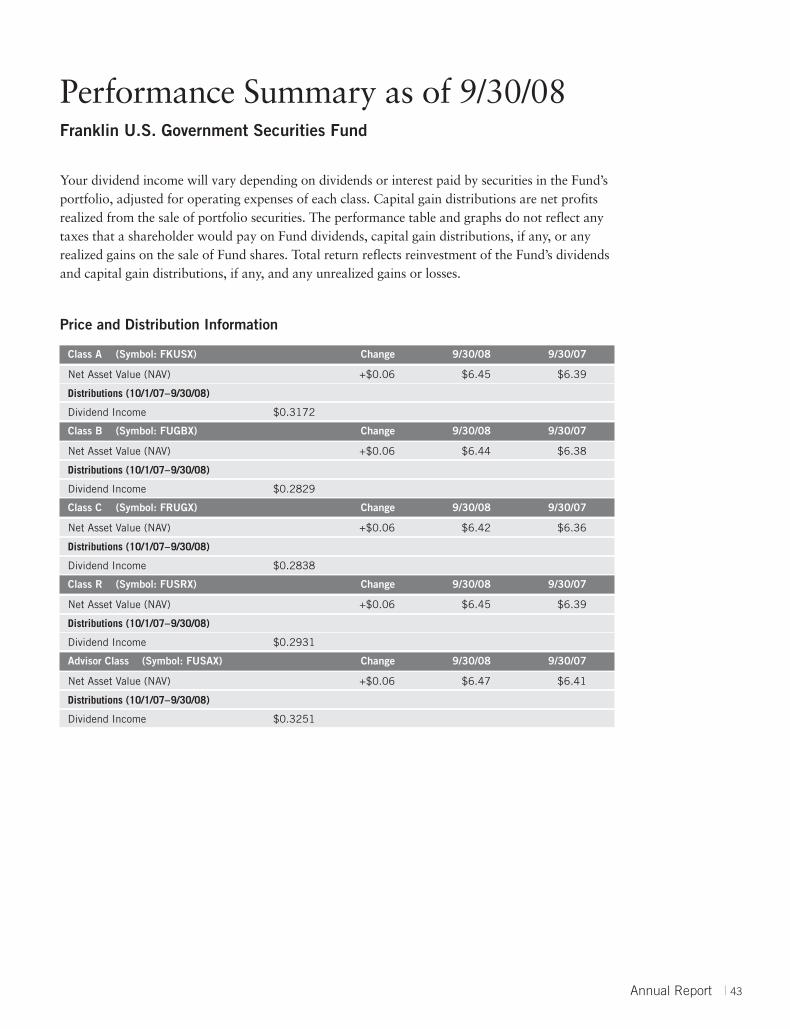
Performance Summary as of 9/30/08Franklin U.S. Government Securities Fund
Annual Report | 43
Price and Distribution Information
Class A (Symbol: FKUSX) Change 9/30/08 9/30/07
Net Asset Value (NAV) +$0.06 $6.45 $6.39
Distributions (10/1/07–9/30/08)
Dividend Income $0.3172
Class B (Symbol: FUGBX) Change 9/30/08 9/30/07
Net Asset Value (NAV) +$0.06 $6.44 $6.38
Distributions (10/1/07–9/30/08)
Dividend Income $0.2829
Class C (Symbol: FRUGX) Change 9/30/08 9/30/07
Net Asset Value (NAV) +$0.06 $6.42 $6.36
Distributions (10/1/07–9/30/08)
Dividend Income $0.2838
Class R (Symbol: FUSRX) Change 9/30/08 9/30/07
Net Asset Value (NAV) +$0.06 $6.45 $6.39
Distributions (10/1/07–9/30/08)
Dividend Income $0.2931
Advisor Class (Symbol: FUSAX) Change 9/30/08 9/30/07
Net Asset Value (NAV) +$0.06 $6.47 $6.41
Distributions (10/1/07–9/30/08)
Dividend Income $0.3251
Your dividend income will vary depending on dividends or interest paid by securities in the Fund’sportfolio, adjusted for operating expenses of each class. Capital gain distributions are net profitsrealized from the sale of portfolio securities. The performance table and graphs do not reflect anytaxes that a shareholder would pay on Fund dividends, capital gain distributions, if any, or anyrealized gains on the sale of Fund shares. Total return reflects reinvestment of the Fund’s dividendsand capital gain distributions, if any, and any unrealized gains or losses.

Performance Summary (continued)
44 | Annual Report
Performance
Cumulative total return excludes sales charges. Average annual total return includes maximum sales charges. Class A: 4.25%maximum initial sales charge; Class B: contingent deferred sales charge (CDSC) declining from 4% to 1% over six years,and eliminated thereafter; Class C: 1% CDSC in first year only; Class R/Advisor Class: no sales charges.
Class A 1-Year 5-Year 10-Year
Cumulative Total Return1 +6.00% +21.82% +61.30%
Average Annual Total Return2 +1.55% +3.13% +4.44%
Distribution Rate3 4.54%
30-Day Standardized Yield4 4.42%
Total Annual Operating Expenses5 0.73%
Class B 1-Year 5-Year Inception (1/1/99)
Cumulative Total Return1 +5.61% +18.88% +53.92%
Average Annual Total Return2 +1.61% +3.19% +4.52%
Distribution Rate3 4.26%
30-Day Standardized Yield4 4.10%
Total Annual Operating Expenses5 1.26%
Class C 1-Year 5-Year 10-Year
Cumulative Total Return1 +5.48% +18.77% +53.07%
Average Annual Total Return2 +4.48% +3.50% +4.35%
Distribution Rate3 4.28%
30-Day Standardized Yield4 4.09%
Total Annual Operating Expenses5 1.26%
Class R 1-Year 5-Year Inception (1/1/02)
Cumulative Total Return1 +5.61% +19.58% +30.93%
Average Annual Total Return2 +5.61% +3.64% +4.08%
Distribution Rate3 4.41%
30-Day Standardized Yield4 4.26%
Total Annual Operating Expenses5 1.11%
Advisor Class 1-Year 5-Year 10-Year
Cumulative Total Return1 +6.11% +22.53% +63.36%
Average Annual Total Return2 +6.11% +4.15% +5.03%
Distribution Rate3 4.86%
30-Day Standardized Yield4 4.76%
Total Annual Operating Expenses5 0.61%
Performance data represent past performance, which does not guarantee future results. Investment return and principalvalue will fluctuate, and you may have a gain or loss when you sell your shares. Current performance may differ from figures shown. For most recent month-end performance, see “Funds and Performance” at franklintempleton.com or call (800) 342-5236.

Average Annual Total Return
Class A 9/30/08
1-Year +1.55%
5-Year +3.13%
10-Year +4.44%
Performance Summary (continued)
Class A (10/1/98–9/30/08)
$15,856$16,498
$13,373
$15,445
9/089/069/049/029/0010/98$5,000
$10,000
$15,000
$20,000
Franklin U.S. GovernmentSecurities Fund
BC U.S. Government:Intermediate Index6
Lipper GNMA Funds ClassificationAverage6
CPI6
Total Return Index Comparison for Hypothetical $10,000 Investment
Total return represents the change in value of an investment over the periods shown. It includes anycurrent, applicable, maximum sales charge, Fund expenses, account fees and reinvested distributions.The unmanaged indexes include reinvestment of any income or distributions. They differ from theFund in composition and do not pay management fees or expenses. One cannot invest directly inan index.
Average Annual Total Return
Class B 9/30/08
1-Year +1.61%
5-Year +3.19%
Since Inception (1/1/99) +4.52%
Class B (1/1/99–9/30/08)
$15,794$16,457
$13,349$15,392
$5,000
$10,000
$15,000
$20,000
9/089/069/049/029/001/99
Franklin U.S. GovernmentSecurities Fund
BC U.S. Government:Intermediate Index6
Lipper GNMA Funds ClassificationAverage6
CPI6
Annual Report | 45

Class C (10/1/98–9/30/08)
$15,856$16,498
$13,373
$15,307
9/089/069/049/029/0010/98$5,000
$10,000
$15,000
$20,000
Franklin U.S. GovernmentSecurities Fund
BC U.S. Government:Intermediate Index6
Lipper GNMA Funds ClassificationAverage6
CPI6
Performance Summary (continued)
Class R (1/1/02–9/30/08)
$13,227$13,674
$12,382$13,093
$5,000
$10,000
$15,000
$20,000
9/089/069/049/021/02
Franklin U.S. GovernmentSecurities Fund
BC U.S. Government:Intermediate Index6
Lipper GNMA Funds ClassificationAverage6
CPI6
Average Annual Total Return
Class C 9/30/08
1-Year +4.48%
5-Year +3.50%
10-Year +4.35%
Average Annual Total Return
Class R 9/30/08
1-Year +5.61%
5-Year +3.64%
Since Inception (1/1/02) +4.08%
46 | Annual Report
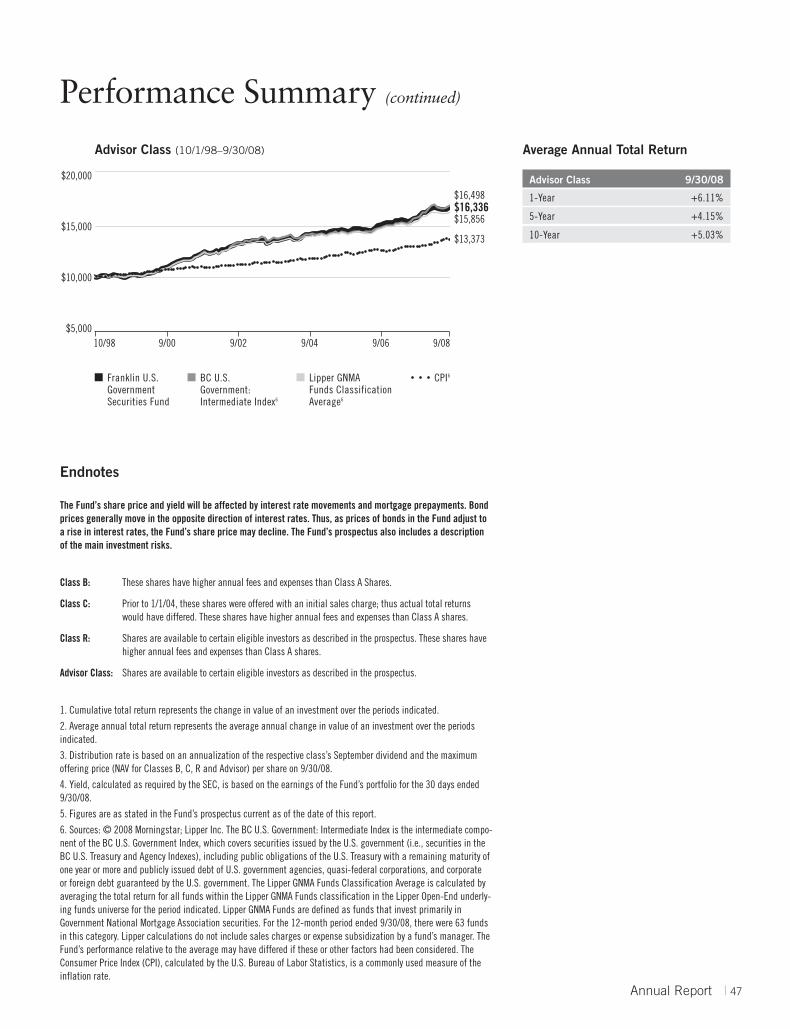
Advisor Class (10/1/98–9/30/08)
$15,856
$16,498
$13,373
$16,336
9/089/069/049/029/0010/98$5,000
$10,000
$15,000
$20,000
Franklin U.S. GovernmentSecurities Fund
BC U.S. Government:Intermediate Index6
Lipper GNMA Funds ClassificationAverage6
CPI6
Average Annual Total Return
Advisor Class 9/30/08
1-Year +6.11%
5-Year +4.15%
10-Year +5.03%
Performance Summary (continued)
Annual Report | 47
Endnotes
The Fund’s share price and yield will be affected by interest rate movements and mortgage prepayments. Bondprices generally move in the opposite direction of interest rates. Thus, as prices of bonds in the Fund adjust toa rise in interest rates, the Fund’s share price may decline. The Fund’s prospectus also includes a descriptionof the main investment risks.
Class B: These shares have higher annual fees and expenses than Class A Shares.
Class C: Prior to 1/1/04, these shares were offered with an initial sales charge; thus actual total returnswould have differed. These shares have higher annual fees and expenses than Class A shares.
Class R: Shares are available to certain eligible investors as described in the prospectus. These shares havehigher annual fees and expenses than Class A shares.
Advisor Class: Shares are available to certain eligible investors as described in the prospectus.
1. Cumulative total return represents the change in value of an investment over the periods indicated.
2. Average annual total return represents the average annual change in value of an investment over the periodsindicated.
3. Distribution rate is based on an annualization of the respective class’s September dividend and the maximumoffering price (NAV for Classes B, C, R and Advisor) per share on 9/30/08.
4. Yield, calculated as required by the SEC, is based on the earnings of the Fund’s portfolio for the 30 days ended9/30/08.
5. Figures are as stated in the Fund’s prospectus current as of the date of this report.
6. Sources: © 2008 Morningstar; Lipper Inc. The BC U.S. Government: Intermediate Index is the intermediate compo-nent of the BC U.S. Government Index, which covers securities issued by the U.S. government (i.e., securities in theBC U.S. Treasury and Agency Indexes), including public obligations of the U.S. Treasury with a remaining maturity ofone year or more and publicly issued debt of U.S. government agencies, quasi-federal corporations, and corporate or foreign debt guaranteed by the U.S. government. The Lipper GNMA Funds Classification Average is calculated byaveraging the total return for all funds within the Lipper GNMA Funds classification in the Lipper Open-End underly-ing funds universe for the period indicated. Lipper GNMA Funds are defined as funds that invest primarily inGovernment National Mortgage Association securities. For the 12-month period ended 9/30/08, there were 63 fundsin this category. Lipper calculations do not include sales charges or expense subsidization by a fund’s manager. TheFund’s performance relative to the average may have differed if these or other factors had been considered. TheConsumer Price Index (CPI), calculated by the U.S. Bureau of Labor Statistics, is a commonly used measure of theinflation rate.

48 | Annual Report
Your Fund’s ExpensesFranklin U.S. Government Securities Fund
As a Fund shareholder, you can incur two types of costs:
• Transaction costs, including sales charges (loads) on Fund purchases and redemption fees; and
• Ongoing Fund costs, including management fees, distribution and service (12b-1) fees, and otherFund expenses. All mutual funds have ongoing costs, sometimes referred to as operating expenses.
The following table shows ongoing costs of investing in the Fund and can help you understandthese costs and compare them with those of other mutual funds. The table assumes a $1,000investment held for the six months indicated.
Actual Fund Expenses
The first line (Actual) for each share class listed in the table provides actual account values andexpenses. The “Ending Account Value” is derived from the Fund’s actual return, which includesthe effect of Fund expenses.
You can estimate the expenses you paid during the period by following these steps. Of course,your account value and expenses will differ from those in this illustration:
1. Divide your account value by $1,000.If an account had an $8,600 value, then $8,600 ÷ $1,000 = 8.6.
2. Multiply the result by the number under the heading “Expenses Paid During Period.”If Expenses Paid During Period were $7.50, then 8.6 x $7.50 = $64.50.
In this illustration, the estimated expenses paid this period are $64.50.
Hypothetical Example for Comparison with Other Funds
Information in the second line (Hypothetical) for each class in the table can help you compareongoing costs of investing in the Fund with those of other mutual funds. This information may not be used to estimate the actual ending account balance or expenses you paid during the period.The hypothetical “Ending Account Value” is based on the actual expense ratio for each class andan assumed 5% annual rate of return before expenses, which does not represent the Fund’s actualreturn. The figure under the heading “Expenses Paid During Period” shows the hypotheticalexpenses your account would have incurred under this scenario. You can compare this figure withthe 5% hypothetical examples that appear in shareholder reports of other funds.

Annual Report | 49
Your Fund’s Expenses (continued)
Please note that expenses shown in the table are meant to highlight ongoing costs and do not reflectany transaction costs, such as sales charges or redemption fees. Therefore, the second line for eachclass is useful in comparing ongoing costs only, and will not help you compare total costs of own-ing different funds. In addition, if transaction costs were included, your total costs would havebeen higher. Please refer to the Fund prospectus for additional information on operating expenses.
Beginning Account Ending Account Expenses Paid During Class A Value 4/1/08 Value 9/30/08 Period* 4/1/08–9/30/08
Actual $1,000 $1,005.70 $3.61
Hypothetical (5% return before expenses) $1,000 $1,021.40 $3.64
Class B
Actual $1,000 $1,004.60 $6.21
Hypothetical (5% return before expenses) $1,000 $1,018.80 $6.26
Class C
Actual $1,000 $1,003.10 $6.21
Hypothetical (5% return before expenses) $1,000 $1,018.80 $6.26
Class R
Actual $1,000 $1,005.30 $5.46
Hypothetical (5% return before expenses) $1,000 $1,019.55 $5.50
Advisor Class
Actual $1,000 $1,006.30 $2.96
Hypothetical (5% return before expenses) $1,000 $1,022.05 $2.98
*Expenses are calculated using the most recent six-month expense ratio, annualized for each class (A: 0.72%; B: 1.24%; C: 1.24%; R: 1.09%; andAdvisor: 0.59%), multiplied by the average account value over the period, multiplied by 183/366 to reflect the one-half year period.

50 | Annual Report
This annual report for Franklin Utilities Fund covers the fiscal year endedSeptember 30, 2008.
Performance Overview
For the 12 months under review, Franklin Utilities Fund – Class A had a -11.63% cumulative total return. The Fund performed better than its broadbenchmark, the Standard & Poor’s 500 Index (S&P 500), which had a -21.98%total return for the same period.1 The Fund also performed better than the -14.25% total return of its narrow benchmark, the S&P 500 Utilities Index.2
You can find the Fund’s long-term performance data in the PerformanceSummary beginning on page 52.
Investment Strategy
We search for the best return opportunities available in the global utilitiesarena with a specific focus on the U.S. electricity sector. Generally, we look for companies producing a high percentage of earnings from regulated utilityfranchise operations.
Manager’s Discussion
In a difficult year for equities, utility stocks as a sector fared slightly betterthan the overall market, as they are generally considered a defensive investment.
Your Fund’s Goals and Main Investments: Franklin Utilities Fund seeks both capital
appreciation and current income by investing at least 80% of its net assets in public utility company
securities.
1. © 2008 Morningstar. All Rights Reserved. The information contained herein: (1) is proprietary to Morningstar and/orits content providers; (2) may not be copied or distributed; and (3) is not warranted to be accurate, complete or timely.Neither Morningstar nor its content providers are responsible for any damages or losses arising from any use of thisinformation. The S&P 500 consists of 500 stocks chosen for market size, liquidity and industry group representation.Each stock’s weight in the index is proportionate to its market value. The S&P 500 is one of the most widely usedbenchmarks of U.S. equity performance.
2. Source: © 2008 Morningstar. The S&P 500 Utilities Index is a market capitalization-weighted index that includeselectric utility stocks in the S&P 500.
The indexes are unmanaged and include reinvested dividends. One cannot invest directly in an index, nor is an indexrepresentative of the Fund’s portfolio.
The dollar value, number of shares or principal amount, and names of all portfolio holdings are listed in the Fund’sStatement of Investments (SOI). The SOI begins on page 103.
Franklin Utilities Fund
Performance data represent past
performance, which does not
guarantee future results. Investment
return and principal value will
fluctuate, and you may have a gain
or loss when you sell your shares.
Current performance may differ
from figures shown. Please visit
franklintempleton.com or call
(800) 342-5236 for most recent
month-end performance.
Portfolio BreakdownFranklin Utilities FundBased on Total Net Assets as of 9/30/08
Electric Utilities
Multi-Utilities
Oil, Gas & Consumable Fuels
Diversified Telecommunication Services
Gas Utilities
Independent Power Producers & Energy Traders
Water Utilities
Short-Term Investments & Other Net Assets
51.8%
39.0%
3.0%
2.7%
1.5%
1.2%
0.5%
0.3%

Annual Report | 51
A significant detractor from performance was Constellation Energy Group, an independent power producer and energy trader. Constellation’s share pricedropped after independent rating agency Standard & Poor’s downgraded thecompany’s debt. We sold Constellation by period-end. Some electric utilities didnot fare as well as others and were among major detractors during the reviewperiod. Entergy, which provides electricity to four southern states, and Exelon,which operates in Illinois and Pennsylvania, weighed on Fund performance.
Among the most significant contributors to Fund performance during the yearunder review was Southern Company, one of the largest electricity distributorsin the U.S. Other notable contributors included FirstEnergy, which appearedwell positioned for future carbon initiatives, and Washington state-based multi-utility company Puget Energy.
Thank you for your continued participation in Franklin Utilities Fund. Welook forward to serving your future investment needs.
John C. Kohli, CFAPortfolio ManagerFranklin Utilities Fund
The foregoing information reflects our analysis, opinions and portfolio holdings as of September 30, 2008, the endof the reporting period. The way we implement our main investment strategies and the resulting portfolio holdingsmay change depending on factors such as market and economic conditions. These opinions may not be relied uponas investment advice or an offer for a particular security. The information is not a complete analysis of everyaspect of any market, country, industry, security or the Fund. Statements of fact are from sources consideredreliable, but the investment manager makes no representation or warranty as to their completeness or accuracy.Although historical performance is no guarantee of future results, these insights may help you understand ourinvestment management philosophy.
Top 10 Equity HoldingsFranklin Utilities Fund9/30/08
Company % of TotalSector/Industry Net Assets
Entergy Corp. 6.8%Electric Utilities
Exelon Corp. 6.0%Electric Utilities
FirstEnergy Corp. 5.0%Electric Utilities
Dominion Resources Inc. 4.3%Multi-Utilities
The Southern Co. 4.1%Electric Utilities
PG&E Corp. 3.9%Multi-Utilities
FPL Group Inc. 3.7%Electric Utilities
Sempra Energy 3.5%Multi-Utilities
PPL Corp. 3.2%Electric Utilities
Public Service Enterprise Group Inc. 3.1%Multi-Utilities
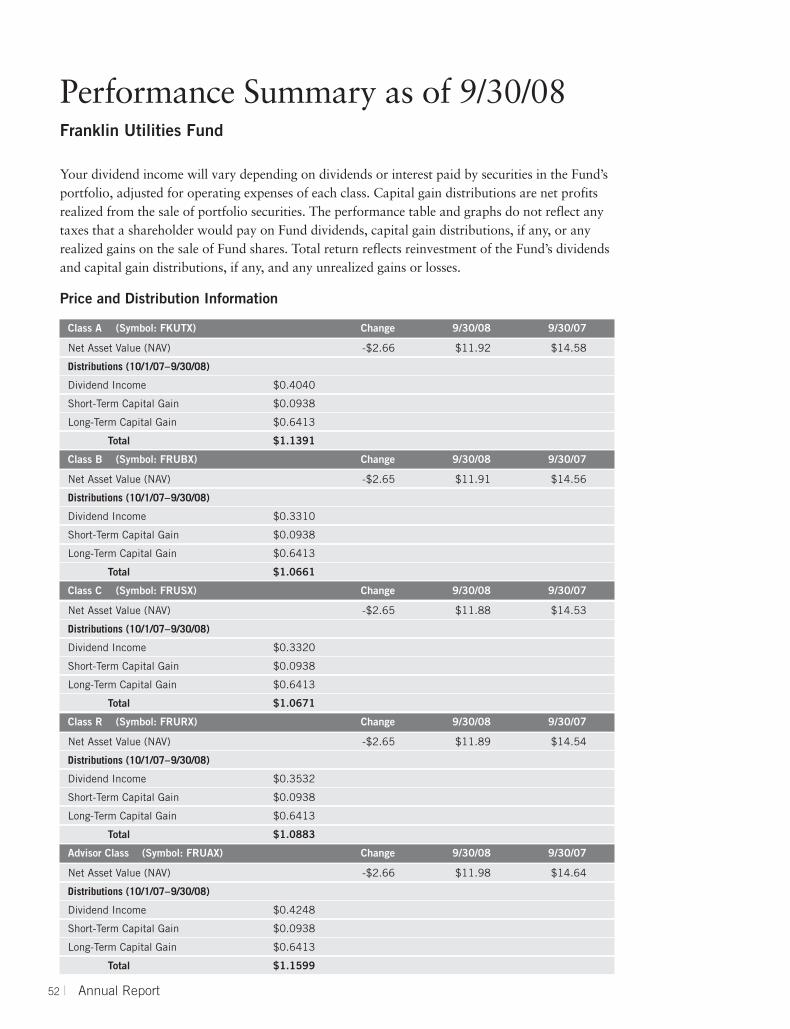
52 | Annual Report
Performance Summary as of 9/30/08Franklin Utilities Fund
Your dividend income will vary depending on dividends or interest paid by securities in the Fund’sportfolio, adjusted for operating expenses of each class. Capital gain distributions are net profitsrealized from the sale of portfolio securities. The performance table and graphs do not reflect anytaxes that a shareholder would pay on Fund dividends, capital gain distributions, if any, or anyrealized gains on the sale of Fund shares. Total return reflects reinvestment of the Fund’s dividendsand capital gain distributions, if any, and any unrealized gains or losses.
Price and Distribution Information
Class A (Symbol: FKUTX) Change 9/30/08 9/30/07
Net Asset Value (NAV) -$2.66 $11.92 $14.58
Distributions (10/1/07–9/30/08)
Dividend Income $0.4040
Short-Term Capital Gain $0.0938
Long-Term Capital Gain $0.6413
Total $1.1391
Class B (Symbol: FRUBX) Change 9/30/08 9/30/07
Net Asset Value (NAV) -$2.65 $11.91 $14.56
Distributions (10/1/07–9/30/08)
Dividend Income $0.3310
Short-Term Capital Gain $0.0938
Long-Term Capital Gain $0.6413
Total $1.0661
Class C (Symbol: FRUSX) Change 9/30/08 9/30/07
Net Asset Value (NAV) -$2.65 $11.88 $14.53
Distributions (10/1/07–9/30/08)
Dividend Income $0.3320
Short-Term Capital Gain $0.0938
Long-Term Capital Gain $0.6413
Total $1.0671
Class R (Symbol: FRURX) Change 9/30/08 9/30/07
Net Asset Value (NAV) -$2.65 $11.89 $14.54
Distributions (10/1/07–9/30/08)
Dividend Income $0.3532
Short-Term Capital Gain $0.0938
Long-Term Capital Gain $0.6413
Total $1.0883
Advisor Class (Symbol: FRUAX) Change 9/30/08 9/30/07
Net Asset Value (NAV) -$2.66 $11.98 $14.64
Distributions (10/1/07–9/30/08)
Dividend Income $0.4248
Short-Term Capital Gain $0.0938
Long-Term Capital Gain $0.6413
Total $1.1599
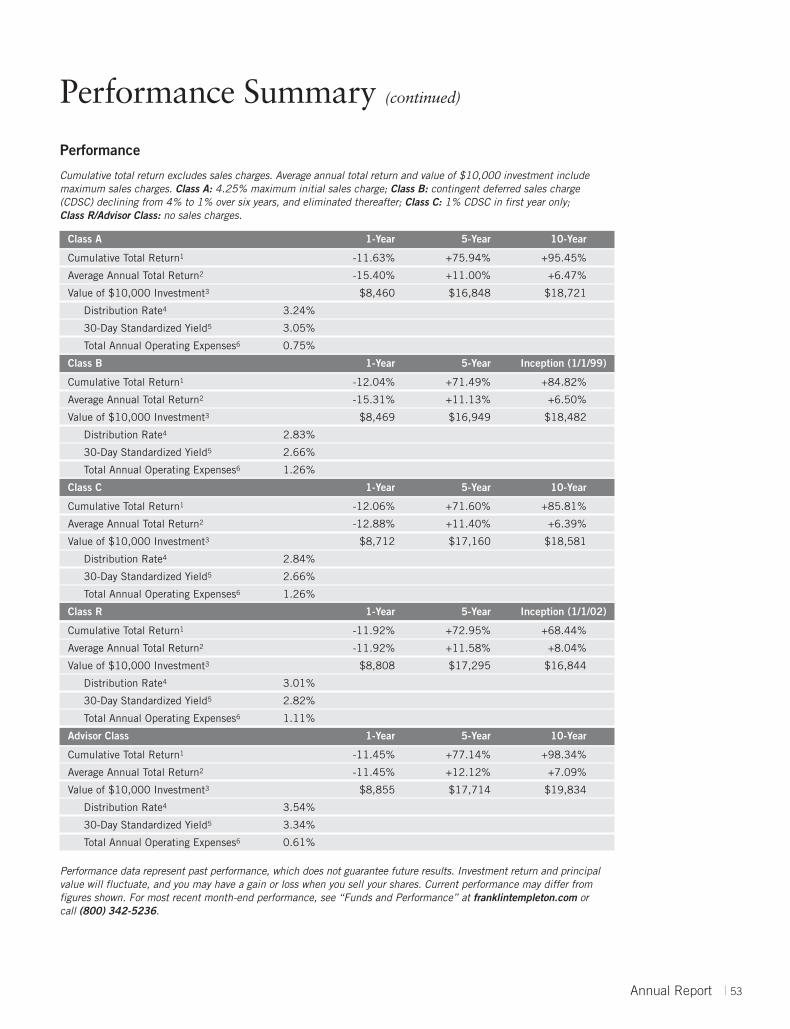
Performance Summary (continued)
Annual Report | 53
Performance
Cumulative total return excludes sales charges. Average annual total return and value of $10,000 investment include maximum sales charges. Class A: 4.25% maximum initial sales charge; Class B: contingent deferred sales charge (CDSC) declining from 4% to 1% over six years, and eliminated thereafter; Class C: 1% CDSC in first year only; Class R/Advisor Class: no sales charges.
Class A 1-Year 5-Year 10-Year
Cumulative Total Return1 -11.63% +75.94% +95.45%
Average Annual Total Return2 -15.40% +11.00% +6.47%
Value of $10,000 Investment3 $8,460 $16,848 $18,721
Distribution Rate4 3.24%
30-Day Standardized Yield5 3.05%
Total Annual Operating Expenses6 0.75%
Class B 1-Year 5-Year Inception (1/1/99)
Cumulative Total Return1 -12.04% +71.49% +84.82%
Average Annual Total Return2 -15.31% +11.13% +6.50%
Value of $10,000 Investment3 $8,469 $16,949 $18,482
Distribution Rate4 2.83%
30-Day Standardized Yield5 2.66%
Total Annual Operating Expenses6 1.26%
Class C 1-Year 5-Year 10-Year
Cumulative Total Return1 -12.06% +71.60% +85.81%
Average Annual Total Return2 -12.88% +11.40% +6.39%
Value of $10,000 Investment3 $8,712 $17,160 $18,581
Distribution Rate4 2.84%
30-Day Standardized Yield5 2.66%
Total Annual Operating Expenses6 1.26%
Class R 1-Year 5-Year Inception (1/1/02)
Cumulative Total Return1 -11.92% +72.95% +68.44%
Average Annual Total Return2 -11.92% +11.58% +8.04%
Value of $10,000 Investment3 $8,808 $17,295 $16,844
Distribution Rate4 3.01%
30-Day Standardized Yield5 2.82%
Total Annual Operating Expenses6 1.11%
Advisor Class 1-Year 5-Year 10-Year
Cumulative Total Return1 -11.45% +77.14% +98.34%
Average Annual Total Return2 -11.45% +12.12% +7.09%
Value of $10,000 Investment3 $8,855 $17,714 $19,834
Distribution Rate4 3.54%
30-Day Standardized Yield5 3.34%
Total Annual Operating Expenses6 0.61%
Performance data represent past performance, which does not guarantee future results. Investment return and principalvalue will fluctuate, and you may have a gain or loss when you sell your shares. Current performance may differ from figures shown. For most recent month-end performance, see “Funds and Performance” at franklintempleton.com or call (800) 342-5236.

Performance Summary (continued)
54 | Annual Report
Average Annual Total Return
Class A 9/30/08
1-Year -15.40%
5-Year +11.00%
10-Year +6.47%
Class A (10/1/98–9/30/08)
$5,000
$10,000
$15,000
$20,000
$25,000
9/089/069/049/029/0010/98
Franklin Utilities Fund S&P 5007 S&P 500 Utilities Index7
$13,519$15,074
$18,721
Total Return Index Comparison for Hypothetical $10,000 Investment
Total return represents the change in value of an investment over the periods shown. It includes anycurrent, applicable, maximum sales charge, Fund expenses, account fees and reinvested distributions.The unmanaged indexes include reinvestment of any income or distributions. They differ from theFund in composition and do not pay management fees or expenses. One cannot invest directly inan index.
Average Annual Total Return
Class B 9/30/08
1-Year -15.31%
5-Year +11.13%
Since Inception (1/1/99) +6.50%
Class B (1/1/99–9/30/08)
9/089/069/049/029/001/99$5,000
$10,000
$15,000
$25,000
$20,000
$14,695
$11,146
$18,482
Franklin Utilities Fund S&P 5007 S&P 500 Utilities Index7

Performance Summary (continued)
Annual Report | 55
Class C (10/1/98–9/30/08)
$5,000
$10,000
$15,000
$20,000
$25,000
9/089/069/049/029/0010/98
Franklin Utilities Fund S&P 5007 S&P 500 Utilities Index7
$13,519$15,074
$18,581
Class R (1/1/02–9/30/08)
9/089/069/049/021/02$5,000
$10,000
$15,000
$25,000
$20,000
$14,798
$11,497
$16,844
Franklin Utilities Fund S&P 5007 S&P 500 Utilities Index7
Average Annual Total Return
Class C 9/30/08
1-Year -12.88%
5-Year +11.40%
10-Year +6.39%
Average Annual Total Return
Class R 9/30/08
1-Year -11.92%
5-Year +11.58%
Since Inception (1/1/02) +8.04%
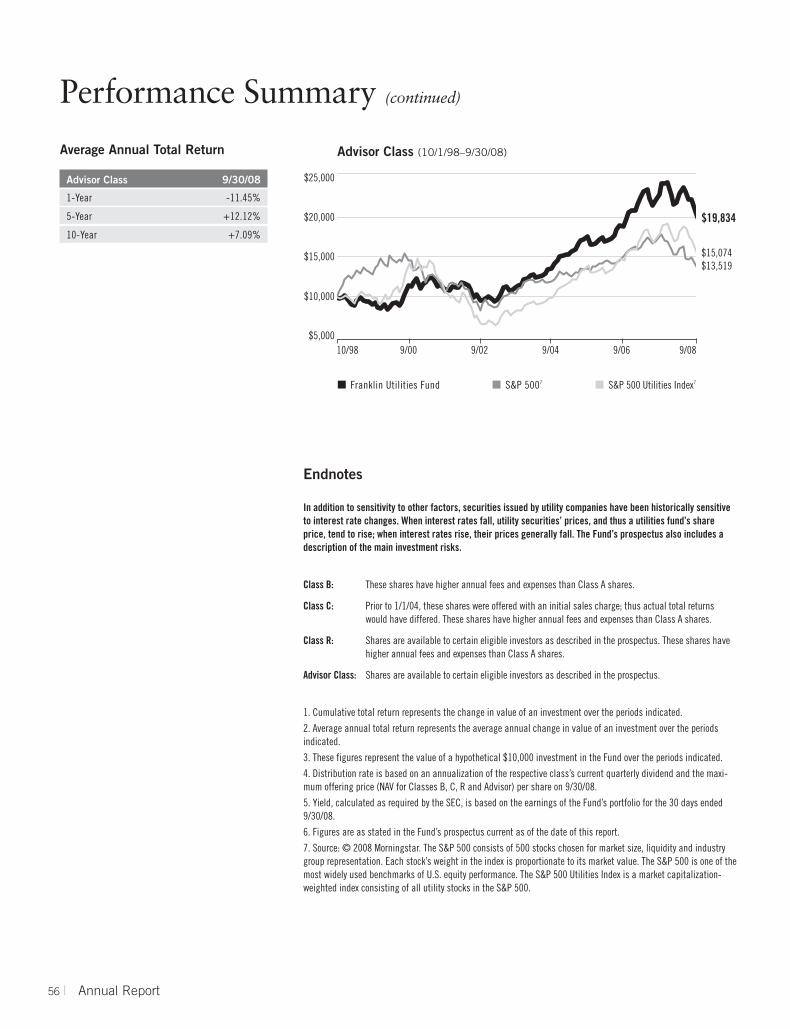
Performance Summary (continued)
56 | Annual Report
Advisor Class (10/1/98–9/30/08)
$5,000
$10,000
$15,000
$20,000
$25,000
9/089/069/049/029/0010/98
Franklin Utilities Fund S&P 5007 S&P 500 Utilities Index7
$13,519$15,074
$19,834
Average Annual Total Return
Advisor Class 9/30/08
1-Year -11.45%
5-Year +12.12%
10-Year +7.09%
Endnotes
In addition to sensitivity to other factors, securities issued by utility companies have been historically sensitiveto interest rate changes. When interest rates fall, utility securities’ prices, and thus a utilities fund’s shareprice, tend to rise; when interest rates rise, their prices generally fall. The Fund’s prospectus also includes adescription of the main investment risks.
Class B: These shares have higher annual fees and expenses than Class A shares.
Class C: Prior to 1/1/04, these shares were offered with an initial sales charge; thus actual total returnswould have differed. These shares have higher annual fees and expenses than Class A shares.
Class R: Shares are available to certain eligible investors as described in the prospectus. These shares havehigher annual fees and expenses than Class A shares.
Advisor Class: Shares are available to certain eligible investors as described in the prospectus.
1. Cumulative total return represents the change in value of an investment over the periods indicated.
2. Average annual total return represents the average annual change in value of an investment over the periodsindicated.
3. These figures represent the value of a hypothetical $10,000 investment in the Fund over the periods indicated.
4. Distribution rate is based on an annualization of the respective class’s current quarterly dividend and the maxi-mum offering price (NAV for Classes B, C, R and Advisor) per share on 9/30/08.
5. Yield, calculated as required by the SEC, is based on the earnings of the Fund’s portfolio for the 30 days ended9/30/08.
6. Figures are as stated in the Fund’s prospectus current as of the date of this report.
7. Source: © 2008 Morningstar. The S&P 500 consists of 500 stocks chosen for market size, liquidity and industrygroup representation. Each stock’s weight in the index is proportionate to its market value. The S&P 500 is one of themost widely used benchmarks of U.S. equity performance. The S&P 500 Utilities Index is a market capitalization-weighted index consisting of all utility stocks in the S&P 500.

Annual Report | 57
Your Fund’s ExpensesFranklin Utilities Fund
As a Fund shareholder, you can incur two types of costs:
• Transaction costs, including sales charges (loads) on Fund purchases and redemption fees; and
• Ongoing Fund costs, including management fees, distribution and service (12b-1) fees, and otherFund expenses. All mutual funds have ongoing costs, sometimes referred to as operating expenses.
The following table shows ongoing costs of investing in the Fund and can help you understandthese costs and compare them with those of other mutual funds. The table assumes a $1,000investment held for the six months indicated.
Actual Fund Expenses
The first line (Actual) for each share class listed in the table provides actual account values andexpenses. The “Ending Account Value” is derived from the Fund’s actual return, which includesthe effect of Fund expenses.
You can estimate the expenses you paid during the period by following these steps. Of course,your account value and expenses will differ from those in this illustration:
1. Divide your account value by $1,000.If an account had an $8,600 value, then $8,600 ÷ $1,000 = 8.6.
2. Multiply the result by the number under the heading “Expenses Paid During Period.”If Expenses Paid During Period were $7.50, then 8.6 x $7.50 = $64.50.
In this illustration, the estimated expenses paid this period are $64.50.
Hypothetical Example for Comparison with Other Funds
Information in the second line (Hypothetical) for each class in the table can help you compareongoing costs of investing in the Fund with those of other mutual funds. This information may not be used to estimate the actual ending account balance or expenses you paid during the period.The hypothetical “Ending Account Value” is based on the actual expense ratio for each class andan assumed 5% annual rate of return before expenses, which does not represent the Fund’s actualreturn. The figure under the heading “Expenses Paid During Period” shows the hypotheticalexpenses your account would have incurred under this scenario. You can compare this figure withthe 5% hypothetical examples that appear in shareholder reports of other funds.
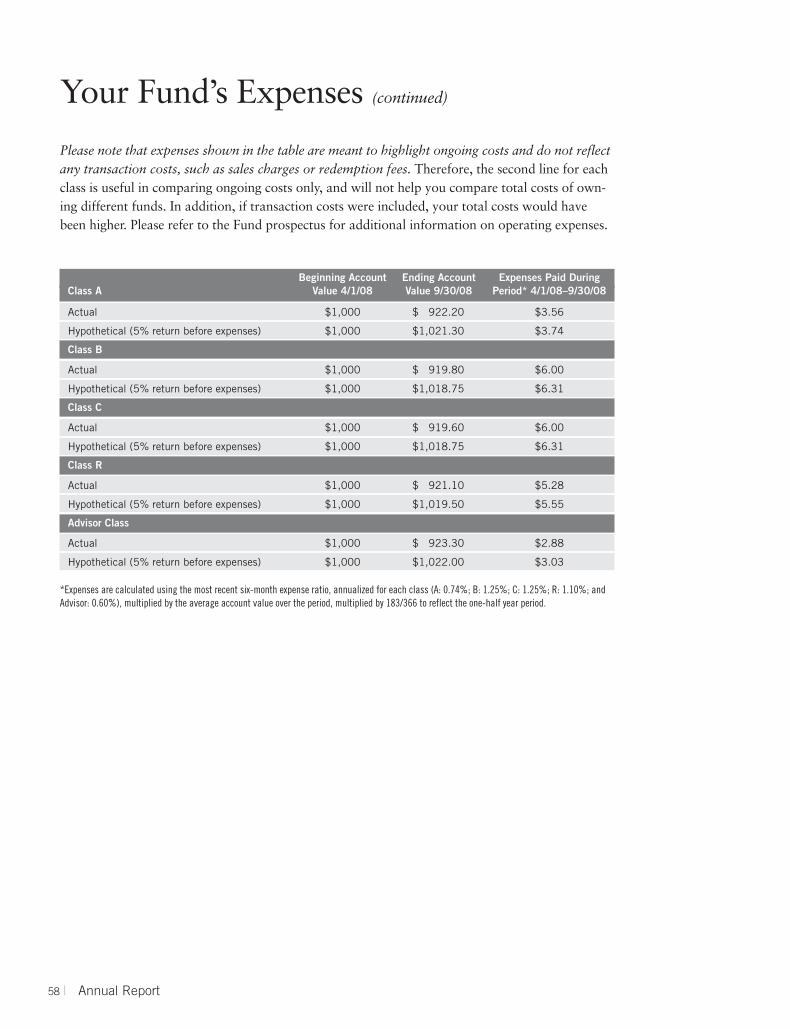
Your Fund’s Expenses (continued)
58 | Annual Report
Please note that expenses shown in the table are meant to highlight ongoing costs and do not reflectany transaction costs, such as sales charges or redemption fees. Therefore, the second line for eachclass is useful in comparing ongoing costs only, and will not help you compare total costs of own-ing different funds. In addition, if transaction costs were included, your total costs would havebeen higher. Please refer to the Fund prospectus for additional information on operating expenses.
Beginning Account Ending Account Expenses Paid During Class A Value 4/1/08 Value 9/30/08 Period* 4/1/08–9/30/08
Actual $1,000 $ 922.20 $3.56
Hypothetical (5% return before expenses) $1,000 $1,021.30 $3.74
Class B
Actual $1,000 $ 919.80 $6.00
Hypothetical (5% return before expenses) $1,000 $1,018.75 $6.31
Class C
Actual $1,000 $ 919.60 $6.00
Hypothetical (5% return before expenses) $1,000 $1,018.75 $6.31
Class R
Actual $1,000 $ 921.10 $5.28
Hypothetical (5% return before expenses) $1,000 $1,019.50 $5.55
Advisor Class
Actual $1,000 $ 923.30 $2.88
Hypothetical (5% return before expenses) $1,000 $1,022.00 $3.03
*Expenses are calculated using the most recent six-month expense ratio, annualized for each class (A: 0.74%; B: 1.25%; C: 1.25%; R: 1.10%; andAdvisor: 0.60%), multiplied by the average account value over the period, multiplied by 183/366 to reflect the one-half year period.

Franklin Custodian FundsFinancial Highlights
Annual Report | The accompanying notes are an integral part of these financial statements. | 59
Franklin DynaTech Fund
Year Ended September 30,Class A 2008 2007 2006 2005 2004
Per share operating performance(for a share outstanding throughout the year)
Net asset value, beginning of year . . . . . . . . . . . . . . . . . . . . . . . . . $32.33 $25.80 $24.98 $22.01 $20.17
Income from investment operationsa:
Net investment income (loss)b . . . . . . . . . . . . . . . . . . . . . . . . . . . (0.08) (0.08) (0.05) (0.01) (0.09)
Net realized and unrealized gains (losses) . . . . . . . . . . . . . . . . . . . (6.67) 6.61 0.87 2.98 1.93
Total from investment operations . . . . . . . . . . . . . . . . . . . . . . . . . . (6.75) 6.53 0.82 2.97 1.84
Less distributions from net realized gains . . . . . . . . . . . . . . . . . . . . (0.71) — — — —
Redemption feesc, d . . . . . . . . . . . . . . . . . . . . . . . . . . . . . . . . . . . . — — — — —
Net asset value, end of year . . . . . . . . . . . . . . . . . . . . . . . . . . . . . $24.87 $32.33 $25.80 $24.98 $22.01
Total returne . . . . . . . . . . . . . . . . . . . . . . . . . . . . . . . . . . . . . . . . . (21.36)% 25.31% 3.28% 13.49% 9.12%
Ratios to average net assets
Expensesf . . . . . . . . . . . . . . . . . . . . . . . . . . . . . . . . . . . . . . . . . . 0.97% 0.99% 0.97% 1.00% 0.97%
Net investment income (loss) . . . . . . . . . . . . . . . . . . . . . . . . . . . . (0.26)% (0.30)% (0.20)% (0.02)% (0.41)%
Supplemental data
Net assets, end of year (000’s) . . . . . . . . . . . . . . . . . . . . . . . . . . . $388,843 $553,347 $590,633 $628,732 $640,120
Portfolio turnover rate . . . . . . . . . . . . . . . . . . . . . . . . . . . . . . . . . . 41.01% 18.03% 18.61% 17.26% 14.93%
aThe amount shown for a share outstanding throughout the period may not correlate with the Statement of Operations for the period due to the timing of sales and repurchases ofthe Fund shares in relation to income earned and/or fluctuating market value of the investments of the Fund.bBased on average daily shares outstanding.cAmount rounds to less than $0.01 per share.dEffective September 1, 2008, the redemption fee was eliminated.eTotal return does not reflect sales commissions or contingent deferred sales charges, if applicable.fBenefit of expense reduction rounds to less than 0.01%.

Franklin Custodian FundsFinancial Highlights (continued)
60 | The accompanying notes are an integral part of these financial statements. | Annual Report
Franklin DynaTech Fund
Year Ended September 30,Class B 2008 2007 2006 2005 2004
Per share operating performance(for a share outstanding throughout the year)
Net asset value, beginning of year . . . . . . . . . . . . . . . . . . . . . . . . . . . . $30.78 $24.75 $24.15 $21.43 $19.79
Income from investment operationsa:
Net investment income (loss)b . . . . . . . . . . . . . . . . . . . . . . . . . . . . . . (0.29) (0.28) (0.23) (0.18) (0.25)
Net realized and unrealized gains (losses) . . . . . . . . . . . . . . . . . . . . . (6.30) 6.31 0.83 2.90 1.89
Total from investment operations . . . . . . . . . . . . . . . . . . . . . . . . . . . . . (6.59) 6.03 0.60 2.72 1.64
Less distributions from net realized gains . . . . . . . . . . . . . . . . . . . . . . . (0.71) — — — —
Redemption feesc, d . . . . . . . . . . . . . . . . . . . . . . . . . . . . . . . . . . . . . . — — — — —
Net asset value, end of year . . . . . . . . . . . . . . . . . . . . . . . . . . . . . . . . $23.48 $30.78 $24.75 $24.15 $21.43
Total returne . . . . . . . . . . . . . . . . . . . . . . . . . . . . . . . . . . . . . . . . . . . (21.96)% 24.36% 2.48% 12.69% 8.29%
Ratios to average net assets
Expensesf . . . . . . . . . . . . . . . . . . . . . . . . . . . . . . . . . . . . . . . . . . . . . 1.73% 1.75% 1.72% 1.74% 1.72%
Net investment income (loss) . . . . . . . . . . . . . . . . . . . . . . . . . . . . . . . (1.02)% (1.06)% (0.95)% (0.76)% (1.16)%
Supplemental data
Net assets, end of year (000’s) . . . . . . . . . . . . . . . . . . . . . . . . . . . . . . $10,704 $16,625 $18,718 $19,497 $18,824
Portfolio turnover rate . . . . . . . . . . . . . . . . . . . . . . . . . . . . . . . . . . . . 41.01% 18.03% 18.61% 17.26% 14.93%
aThe amount shown for a share outstanding throughout the period may not correlate with the Statement of Operations for the period due to the timing of sales and repurchases ofthe Fund shares in relation to income earned and/or fluctuating market value of the investments of the Fund.bBased on average daily shares outstanding.cAmount rounds to less than $0.01 per share.dEffective September 1, 2008, the redemption fee was eliminated.eTotal return does not reflect sales commissions or contingent deferred sales charges, if applicable.fBenefit of expense reduction rounds to less than 0.01%.

Franklin Custodian FundsFinancial Highlights (continued)
Annual Report | The accompanying notes are an integral part of these financial statements. | 61
Franklin DynaTech Fund
Year Ended September 30,Class C 2008 2007 2006 2005 2004
Per share operating performance(for a share outstanding throughout the year)
Net asset value, beginning of year . . . . . . . . . . . . . . . . . . . . . . . . . . . . $30.46 $24.50 $23.90 $21.21 $19.59
Income from investment operationsa:
Net investment income (loss)b . . . . . . . . . . . . . . . . . . . . . . . . . . . . . . (0.28) (0.28) (0.23) (0.17) (0.25)
Net realized and unrealized gains (losses) . . . . . . . . . . . . . . . . . . . . . (6.24) 6.24 0.83 2.86 1.87
Total from investment operations . . . . . . . . . . . . . . . . . . . . . . . . . . . . . (6.52) 5.96 0.60 2.69 1.62
Less distributions from net realized gains . . . . . . . . . . . . . . . . . . . . . . . (0.71) — — — —
Redemption feesc, d . . . . . . . . . . . . . . . . . . . . . . . . . . . . . . . . . . . . . . — — — — —
Net asset value, end of year . . . . . . . . . . . . . . . . . . . . . . . . . . . . . . . . $23.23 $30.46 $24.50 $23.90 $21.21
Total returne . . . . . . . . . . . . . . . . . . . . . . . . . . . . . . . . . . . . . . . . . . . (21.93)% 24.33% 2.51% 12.68% 8.27%
Ratios to average net assets
Expensesf . . . . . . . . . . . . . . . . . . . . . . . . . . . . . . . . . . . . . . . . . . . . . 1.73% 1.74% 1.71% 1.74% 1.72%
Net investment income (loss) . . . . . . . . . . . . . . . . . . . . . . . . . . . . . . . (1.02)% (1.05)% (0.94)% (0.76)% (1.16)%
Supplemental data
Net assets, end of year (000’s) . . . . . . . . . . . . . . . . . . . . . . . . . . . . . . $53,289 $70,413 $69,069 $73,587 $75,642
Portfolio turnover rate . . . . . . . . . . . . . . . . . . . . . . . . . . . . . . . . . . . . 41.01% 18.03% 18.61% 17.26% 14.93%
aThe amount shown for a share outstanding throughout the period may not correlate with the Statement of Operations for the period due to the timing of sales and repurchases ofthe Fund shares in relation to income earned and/or fluctuating market value of the investments of the Fund.bBased on average daily shares outstanding.cAmount rounds to less than $0.01 per share.dEffective September 1, 2008, the redemption fee was eliminated.eTotal return does not reflect sales commissions or contingent deferred sales charges, if applicable.fBenefit of expense reduction rounds to less than 0.01%.

Franklin Custodian FundsFinancial Highlights (continued)
62 | The accompanying notes are an integral part of these financial statements. | Annual Report
Franklin DynaTech Fund
Period EndedSeptember 30,
Advisor Class 2008a
Per share operating performance(for a share outstanding throughout the period)
Net asset value, beginning of period . . . . . . . . . . . . . . . . . . . . . . . . . . . . . . . . . . . . . . . . . . . . . . . . . . . . . . . . . . $31.40
Income from investment operationsb:
Net investment income (loss)c . . . . . . . . . . . . . . . . . . . . . . . . . . . . . . . . . . . . . . . . . . . . . . . . . . . . . . . . . . . . . . (0.01)
Net realized and unrealized gains (losses) . . . . . . . . . . . . . . . . . . . . . . . . . . . . . . . . . . . . . . . . . . . . . . . . . . . . . (6.49)
Total from investment operations . . . . . . . . . . . . . . . . . . . . . . . . . . . . . . . . . . . . . . . . . . . . . . . . . . . . . . . . . . . . (6.50)
Redemption feesd, e . . . . . . . . . . . . . . . . . . . . . . . . . . . . . . . . . . . . . . . . . . . . . . . . . . . . . . . . . . . . . . . . . . . . . . —
Net asset value, end of period . . . . . . . . . . . . . . . . . . . . . . . . . . . . . . . . . . . . . . . . . . . . . . . . . . . . . . . . . . . . . . $24.90
Total returnf . . . . . . . . . . . . . . . . . . . . . . . . . . . . . . . . . . . . . . . . . . . . . . . . . . . . . . . . . . . . . . . . . . . . . . . . . . . (20.70)%
Ratios to average net assetsg
Expensesh . . . . . . . . . . . . . . . . . . . . . . . . . . . . . . . . . . . . . . . . . . . . . . . . . . . . . . . . . . . . . . . . . . . . . . . . . . . . . 0.73%
Net investment income (loss) . . . . . . . . . . . . . . . . . . . . . . . . . . . . . . . . . . . . . . . . . . . . . . . . . . . . . . . . . . . . . . . (0.02)%
Supplemental data
Net assets, end of period (000’s) . . . . . . . . . . . . . . . . . . . . . . . . . . . . . . . . . . . . . . . . . . . . . . . . . . . . . . . . . . . . . $1,938
Portfolio turnover rate . . . . . . . . . . . . . . . . . . . . . . . . . . . . . . . . . . . . . . . . . . . . . . . . . . . . . . . . . . . . . . . . . . . . . 41.01%
aFor the period May 15, 2008 (effective date) to September 30, 2008.bThe amount shown for a share outstanding throughout the period may not correlate with the Statement of Operations for the period due to the timing of sales and repurchases ofthe Fund shares in relation to income earned and/or fluctuating market value of the investments of the Fund.cBased on average daily shares outstanding.dAmount rounds to less than $0.01 per share.eEffective September 1, 2008, the redemption fee was eliminated.fTotal return is not annualized for periods less than one year.gRatios are annualized for periods less than one year.hBenefit of expense reduction rounds to less than 0.01%.

Franklin Custodian FundsStatement of Investments, September 30, 2008
Annual Report | 63
Franklin DynaTech Fund Country Shares Value
Common Stocks 94.4%Air Freight & Logistics 1.7%C.H. Robinson Worldwide Inc. . . . . . . . . . . . . . . . . . . . . . . . . . . . . . . . . . . . United States 150,000 $ 7,644,000
Biotechnology 12.2%aCelgene Corp. . . . . . . . . . . . . . . . . . . . . . . . . . . . . . . . . . . . . . . . . . . . . . . United States 200,000 12,656,000aGenentech Inc. . . . . . . . . . . . . . . . . . . . . . . . . . . . . . . . . . . . . . . . . . . . . . United States 250,000 22,170,000aGilead Sciences Inc. . . . . . . . . . . . . . . . . . . . . . . . . . . . . . . . . . . . . . . . . . . United States 300,000 13,674,000aMyriad Genetics Inc. . . . . . . . . . . . . . . . . . . . . . . . . . . . . . . . . . . . . . . . . . . United States 70,000 4,541,600aOSI Pharmaceuticals Inc. . . . . . . . . . . . . . . . . . . . . . . . . . . . . . . . . . . . . . . United States 50,000 2,464,500
55,506,100
Capital Markets 0.6%The Goldman Sachs Group Inc. . . . . . . . . . . . . . . . . . . . . . . . . . . . . . . . . . . United States 20,000 2,560,000
Chemicals 4.6%Monsanto Co. . . . . . . . . . . . . . . . . . . . . . . . . . . . . . . . . . . . . . . . . . . . . . . . United States 80,000 7,918,400Sigma-Aldrich Corp. . . . . . . . . . . . . . . . . . . . . . . . . . . . . . . . . . . . . . . . . . . United States 250,000 13,105,000
21,023,400
Commercial Services & Supplies 1.4%aStericycle Inc. . . . . . . . . . . . . . . . . . . . . . . . . . . . . . . . . . . . . . . . . . . . . . . United States 110,000 6,480,100
Communications Equipment 5.5%aCisco Systems Inc. . . . . . . . . . . . . . . . . . . . . . . . . . . . . . . . . . . . . . . . . . . . United States 450,000 10,152,000QUALCOMM Inc. . . . . . . . . . . . . . . . . . . . . . . . . . . . . . . . . . . . . . . . . . . . . United States 225,000 9,668,250
aResearch In Motion Ltd. . . . . . . . . . . . . . . . . . . . . . . . . . . . . . . . . . . . . . . . Canada 75,000 5,122,500
24,942,750
Computers & Peripherals 7.6%aApple Inc. . . . . . . . . . . . . . . . . . . . . . . . . . . . . . . . . . . . . . . . . . . . . . . . . . United States 165,000 18,753,900Hewlett-Packard Co. . . . . . . . . . . . . . . . . . . . . . . . . . . . . . . . . . . . . . . . . . . United States 340,000 15,721,600
34,475,500
Electrical Equipment 1.4%ABB Ltd., ADR . . . . . . . . . . . . . . . . . . . . . . . . . . . . . . . . . . . . . . . . . . . . . . Switzerland 100,000 1,940,000
aEnergy Conversion Devices Inc. . . . . . . . . . . . . . . . . . . . . . . . . . . . . . . . . . . United States 35,000 2,038,750aSunPower Corp., A . . . . . . . . . . . . . . . . . . . . . . . . . . . . . . . . . . . . . . . . . . . United States 35,000 2,482,550
6,461,300
Electronic Equipment, Instruments & Components 2.2%aDolby Laboratories Inc., A . . . . . . . . . . . . . . . . . . . . . . . . . . . . . . . . . . . . . . United States 100,000 3,519,000aFLIR Systems Inc. . . . . . . . . . . . . . . . . . . . . . . . . . . . . . . . . . . . . . . . . . . . United States 170,000 6,531,400
10,050,400
Energy Equipment & Services 4.5%aFMC Technologies Inc. . . . . . . . . . . . . . . . . . . . . . . . . . . . . . . . . . . . . . . . . United States 180,000 8,379,000Schlumberger Ltd. . . . . . . . . . . . . . . . . . . . . . . . . . . . . . . . . . . . . . . . . . . . United States 125,000 9,761,250
aWeatherford International Ltd. . . . . . . . . . . . . . . . . . . . . . . . . . . . . . . . . . . . United States 100,000 2,514,000
20,654,250
Health Care Equipment & Supplies 7.3%Alcon Inc. . . . . . . . . . . . . . . . . . . . . . . . . . . . . . . . . . . . . . . . . . . . . . . . . . Switzerland 75,000 12,113,250
a Intuitive Surgical Inc. . . . . . . . . . . . . . . . . . . . . . . . . . . . . . . . . . . . . . . . . . United States 15,000 3,614,700

Franklin Custodian FundsStatement of Investments, September 30, 2008 (continued)
64 | Annual Report
Franklin DynaTech Fund Country Shares Value
Common Stocks (continued)Health Care Equipment & Supplies (continued)Medtronic Inc. . . . . . . . . . . . . . . . . . . . . . . . . . . . . . . . . . . . . . . . . . . . . . . United States 125,000 $ 6,262,500Stryker Corp. . . . . . . . . . . . . . . . . . . . . . . . . . . . . . . . . . . . . . . . . . . . . . . . United States 180,000 11,214,000
33,204,450
Health Care Providers & Services 1.9%aExpress Scripts Inc. . . . . . . . . . . . . . . . . . . . . . . . . . . . . . . . . . . . . . . . . . . United States 80,000 5,905,600aVCA Antech Inc. . . . . . . . . . . . . . . . . . . . . . . . . . . . . . . . . . . . . . . . . . . . . . United States 100,000 2,947,000
8,852,600
Internet & Catalog Retail 1.4%aAmazon.com Inc. . . . . . . . . . . . . . . . . . . . . . . . . . . . . . . . . . . . . . . . . . . . . United States 85,000 6,184,600
Internet Software & Services 5.4%aBaidu.com Inc., ADR . . . . . . . . . . . . . . . . . . . . . . . . . . . . . . . . . . . . . . . . . China 15,000 3,723,450aGoogle Inc., A . . . . . . . . . . . . . . . . . . . . . . . . . . . . . . . . . . . . . . . . . . . . . . United States 41,000 16,421,320aMercadoLibre Inc. . . . . . . . . . . . . . . . . . . . . . . . . . . . . . . . . . . . . . . . . . . . Argentina 80,000 1,628,000aSohu.com Inc. . . . . . . . . . . . . . . . . . . . . . . . . . . . . . . . . . . . . . . . . . . . . . . China 50,000 2,787,500
24,560,270
IT Services 4.5%MasterCard Inc., A . . . . . . . . . . . . . . . . . . . . . . . . . . . . . . . . . . . . . . . . . . . United States 30,000 5,319,900Visa Inc., A . . . . . . . . . . . . . . . . . . . . . . . . . . . . . . . . . . . . . . . . . . . . . . . . United States 250,000 15,347,500
20,667,400
Life Sciences Tools & Services 3.7%aCovance Inc. . . . . . . . . . . . . . . . . . . . . . . . . . . . . . . . . . . . . . . . . . . . . . . . United States 60,000 5,304,600a Illumina Inc. . . . . . . . . . . . . . . . . . . . . . . . . . . . . . . . . . . . . . . . . . . . . . . . United States 65,000 2,634,450aWaters Corp. . . . . . . . . . . . . . . . . . . . . . . . . . . . . . . . . . . . . . . . . . . . . . . . United States 150,000 8,727,000
16,666,050
Machinery 0.1%a John Bean Technologies . . . . . . . . . . . . . . . . . . . . . . . . . . . . . . . . . . . . . . . United States 38,880 492,221
Pharmaceuticals 4.7%Johnson & Johnson . . . . . . . . . . . . . . . . . . . . . . . . . . . . . . . . . . . . . . . . . . . United States 100,000 6,928,000Novo-Nordisk AS, ADR . . . . . . . . . . . . . . . . . . . . . . . . . . . . . . . . . . . . . . . . Denmark 80,000 4,096,000Teva Pharmaceutical Industries Ltd., ADR . . . . . . . . . . . . . . . . . . . . . . . . . . Israel 225,000 10,302,750
21,326,750
Semiconductors & Semiconductor Equipment 6.4%Intel Corp. . . . . . . . . . . . . . . . . . . . . . . . . . . . . . . . . . . . . . . . . . . . . . . . . . United States 1,125,000 21,071,250
aLam Research Corp. . . . . . . . . . . . . . . . . . . . . . . . . . . . . . . . . . . . . . . . . . . United States 100,000 3,149,000aVarian Semiconductor Equipment Associates Inc. . . . . . . . . . . . . . . . . . . . . . United States 200,000 5,024,000
29,244,250
Software 15.8%aActivision Blizzard Inc. . . . . . . . . . . . . . . . . . . . . . . . . . . . . . . . . . . . . . . . . United States 560,000 8,640,800aAdobe Systems Inc. . . . . . . . . . . . . . . . . . . . . . . . . . . . . . . . . . . . . . . . . . . United States 350,000 13,814,500aANSYS Inc. . . . . . . . . . . . . . . . . . . . . . . . . . . . . . . . . . . . . . . . . . . . . . . . . United States 150,000 5,680,500aAutodesk Inc. . . . . . . . . . . . . . . . . . . . . . . . . . . . . . . . . . . . . . . . . . . . . . . . United States 120,000 4,026,000aConcur Technologies Inc. . . . . . . . . . . . . . . . . . . . . . . . . . . . . . . . . . . . . . . United States 150,000 5,739,000aElectronic Arts Inc. . . . . . . . . . . . . . . . . . . . . . . . . . . . . . . . . . . . . . . . . . . . United States 130,000 4,808,700
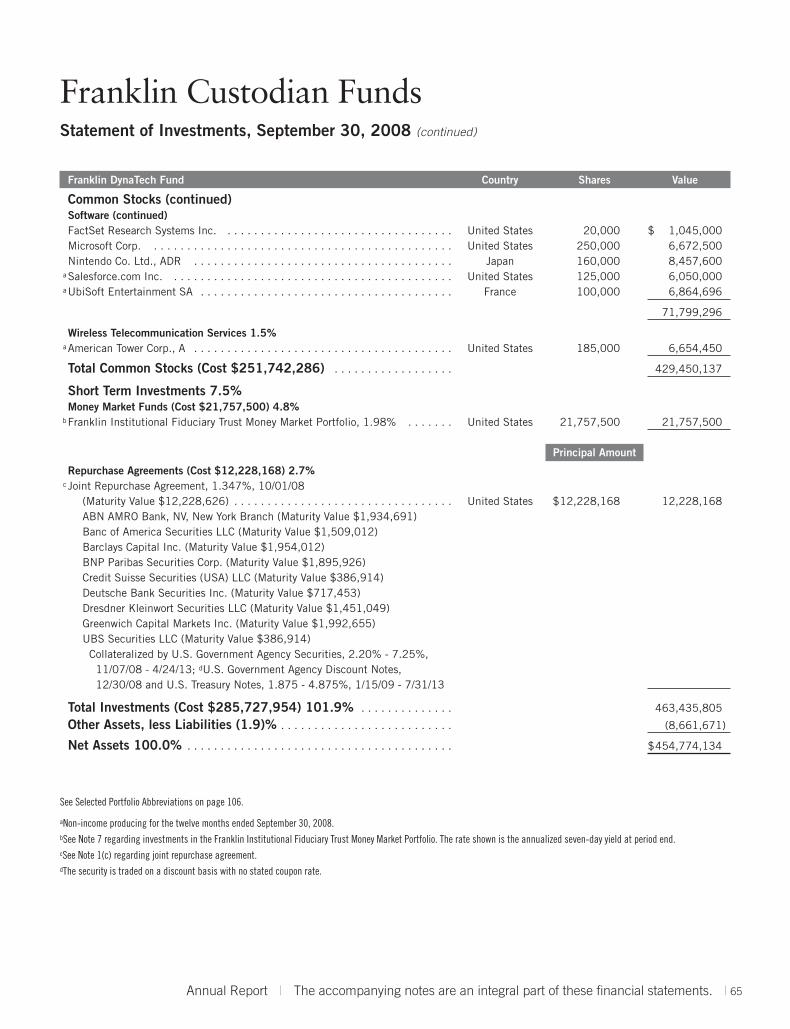
Franklin Custodian FundsStatement of Investments, September 30, 2008 (continued)
Annual Report | The accompanying notes are an integral part of these financial statements. | 65
Franklin DynaTech Fund Country Shares Value
Common Stocks (continued)Software (continued)FactSet Research Systems Inc. . . . . . . . . . . . . . . . . . . . . . . . . . . . . . . . . . . United States 20,000 $ 1,045,000Microsoft Corp. . . . . . . . . . . . . . . . . . . . . . . . . . . . . . . . . . . . . . . . . . . . . . United States 250,000 6,672,500Nintendo Co. Ltd., ADR . . . . . . . . . . . . . . . . . . . . . . . . . . . . . . . . . . . . . . . Japan 160,000 8,457,600
aSalesforce.com Inc. . . . . . . . . . . . . . . . . . . . . . . . . . . . . . . . . . . . . . . . . . . United States 125,000 6,050,000aUbiSoft Entertainment SA . . . . . . . . . . . . . . . . . . . . . . . . . . . . . . . . . . . . . . France 100,000 6,864,696
71,799,296
Wireless Telecommunication Services 1.5%aAmerican Tower Corp., A . . . . . . . . . . . . . . . . . . . . . . . . . . . . . . . . . . . . . . . United States 185,000 6,654,450
Total Common Stocks (Cost $251,742,286) . . . . . . . . . . . . . . . . . . 429,450,137
Short Term Investments 7.5%Money Market Funds (Cost $21,757,500) 4.8%
bFranklin Institutional Fiduciary Trust Money Market Portfolio, 1.98% . . . . . . . United States 21,757,500 21,757,500
Principal Amount
Repurchase Agreements (Cost $12,228,168) 2.7%c Joint Repurchase Agreement, 1.347%, 10/01/08
(Maturity Value $12,228,626) . . . . . . . . . . . . . . . . . . . . . . . . . . . . . . . . . United States $12,228,168 12,228,168ABN AMRO Bank, NV, New York Branch (Maturity Value $1,934,691)Banc of America Securities LLC (Maturity Value $1,509,012)Barclays Capital Inc. (Maturity Value $1,954,012)BNP Paribas Securities Corp. (Maturity Value $1,895,926)Credit Suisse Securities (USA) LLC (Maturity Value $386,914)Deutsche Bank Securities Inc. (Maturity Value $717,453)Dresdner Kleinwort Securities LLC (Maturity Value $1,451,049)Greenwich Capital Markets Inc. (Maturity Value $1,992,655)UBS Securities LLC (Maturity Value $386,914)Collateralized by U.S. Government Agency Securities, 2.20% - 7.25%, 11/07/08 - 4/24/13; dU.S. Government Agency Discount Notes, 12/30/08 and U.S. Treasury Notes, 1.875 - 4.875%, 1/15/09 - 7/31/13
Total Investments (Cost $285,727,954) 101.9% . . . . . . . . . . . . . . 463,435,805
Other Assets, less Liabilities (1.9)% . . . . . . . . . . . . . . . . . . . . . . . . . . (8,661,671)
Net Assets 100.0% . . . . . . . . . . . . . . . . . . . . . . . . . . . . . . . . . . . . . . . . $454,774,134
See Selected Portfolio Abbreviations on page 106.
aNon-income producing for the twelve months ended September 30, 2008.bSee Note 7 regarding investments in the Franklin Institutional Fiduciary Trust Money Market Portfolio. The rate shown is the annualized seven-day yield at period end.cSee Note 1(c) regarding joint repurchase agreement.dThe security is traded on a discount basis with no stated coupon rate.

Franklin Custodian FundsFinancial Highlights
66 | The accompanying notes are an integral part of these financial statements. | Annual Report
Franklin Growth Fund
Year Ended September 30,Class A 2008 2007 2006 2005 2004
Per share operating performance(for a share outstanding throughout the year)
Net asset value, beginning of year . . . . . . . . . . . . . . . . . $46.36 $39.10 $34.83 $30.58 $26.87
Income from investment operationsa:
Net investment incomeb . . . . . . . . . . . . . . . . . . . . . . . . 0.24 0.16 0.12 0.13 0.06
Net realized and unrealized gains (losses) . . . . . . . . . . . (9.30) 7.21 4.21 4.20 3.68
Total from investment operations . . . . . . . . . . . . . . . . . . (9.06) 7.37 4.33 4.33 3.74
Less distributions from net investment income . . . . . . . . (0.13) (0.11) (0.06) (0.08) (0.03)
Redemption feesc, d . . . . . . . . . . . . . . . . . . . . . . . . . . . . — — — — —
Net asset value, end of year . . . . . . . . . . . . . . . . . . . . . . $37.17 $46.36 $39.10 $34.83 $30.58
Total returne . . . . . . . . . . . . . . . . . . . . . . . . . . . . . . . . . (19.59)% 18.87% 12.46% 14.17% 13.92%
Ratios to average net assets
Expensesf . . . . . . . . . . . . . . . . . . . . . . . . . . . . . . . . . . . 0.89% 0.93% 0.91% 0.94% 0.98%
Net investment income . . . . . . . . . . . . . . . . . . . . . . . . . 0.56% 0.37% 0.34% 0.40% 0.20%
Supplemental data
Net assets, end of year (000’s) . . . . . . . . . . . . . . . . . . . . $1,708,612 $2,123,419 $1,695,802 $1,567,675 $1,531,871
Portfolio turnover rate . . . . . . . . . . . . . . . . . . . . . . . . . . 5.64% 0.37% 2.21% 1.16% 1.56%
aThe amount shown for a share outstanding throughout the period may not correlate with the Statement of Operations for the period due to the timing of sales and repurchases ofthe Fund shares in relation to income earned and/or fluctuating market value of the investments of the Fund.bBased on average daily shares outstanding.cAmount rounds to less than $0.01 per share.dEffective September 1, 2008, the redemption fee was eliminated.eTotal return does not reflect sales commissions or contingent deferred sales charges, if applicable.fBenefit of expense reduction rounds to less than 0.01%.

Franklin Custodian FundsFinancial Highlights (continued)
Annual Report | The accompanying notes are an integral part of these financial statements. | 67
Franklin Growth Fund
Year Ended September 30,Class B 2008 2007 2006 2005 2004
Per share operating performance(for a share outstanding throughout the year)
Net asset value, beginning of year . . . . . . . . . . . . . . . . . . . . . . . . . $44.42 $37.65 $33.73 $29.77 $26.32
Income from investment operationsa:
Net investment income (loss)b . . . . . . . . . . . . . . . . . . . . . . . . . . . (0.08) (0.16) (0.15) (0.11) (0.16)
Net realized and unrealized gains (losses) . . . . . . . . . . . . . . . . . . . (8.90) 6.93 4.07 4.07 3.61
Total from investment operations . . . . . . . . . . . . . . . . . . . . . . . . . . (8.98) 6.77 3.92 3.96 3.45
Redemption feesc, d . . . . . . . . . . . . . . . . . . . . . . . . . . . . . . . . . . . . — — — — —
Net asset value, end of year . . . . . . . . . . . . . . . . . . . . . . . . . . . . . $35.44 $44.42 $37.65 $33.73 $29.77
Total returne . . . . . . . . . . . . . . . . . . . . . . . . . . . . . . . . . . . . . . . . . (20.22)% 17.98% 11.62% 13.30% 13.11%
Ratios to average net assets
Expensesf . . . . . . . . . . . . . . . . . . . . . . . . . . . . . . . . . . . . . . . . . . . 1.64% 1.69% 1.67% 1.69% 1.73%
Net investment income (loss) . . . . . . . . . . . . . . . . . . . . . . . . . . . . (0.19)% (0.39)% (0.42)% (0.35)% (0.55)%
Supplemental data
Net assets, end of year (000’s) . . . . . . . . . . . . . . . . . . . . . . . . . . . $89,779 $138,640 $122,871 $123,926 $121,986
Portfolio turnover rate . . . . . . . . . . . . . . . . . . . . . . . . . . . . . . . . . . 5.64% 0.37% 2.21% 1.16% 1.56%
aThe amount shown for a share outstanding throughout the period may not correlate with the Statement of Operations for the period due to the timing of sales and repurchases ofthe Fund shares in relation to income earned and/or fluctuating market value of the investments of the Fund.bBased on average daily shares outstanding.cAmount rounds to less than $0.01 per share.dEffective September 1, 2008, the redemption fee was eliminated.eTotal return does not reflect sales commissions or contingent deferred sales charges, if applicable.fBenefit of expense reduction rounds to less than 0.01%.

Franklin Custodian FundsFinancial Highlights (continued)
68 | The accompanying notes are an integral part of these financial statements. | Annual Report
Franklin Growth Fund
Year Ended September 30,Class C 2008 2007 2006 2005 2004
Per share operating performance(for a share outstanding throughout the year)
Net asset value, beginning of year . . . . . . . . . . . . . . . . . . . . . . . . . $44.03 $37.32 $33.43 $29.51 $26.09
Income from investment operationsa:
Net investment income (loss)b . . . . . . . . . . . . . . . . . . . . . . . . . . . (0.08) (0.16) (0.15) (0.11) (0.16)
Net realized and unrealized gains (losses) . . . . . . . . . . . . . . . . . . . (8.81) 6.87 4.04 4.03 3.58
Total from investment operations . . . . . . . . . . . . . . . . . . . . . . . . . . (8.89) 6.71 3.89 3.92 3.42
Redemption feesc, d . . . . . . . . . . . . . . . . . . . . . . . . . . . . . . . . . . . . — — — — —
Net asset value, end of year . . . . . . . . . . . . . . . . . . . . . . . . . . . . . $35.14 $44.03 $37.32 $33.43 $29.51
Total returne . . . . . . . . . . . . . . . . . . . . . . . . . . . . . . . . . . . . . . . . . (20.19)% 17.98% 11.60% 13.32% 13.11%
Ratios to average net assets
Expensesf . . . . . . . . . . . . . . . . . . . . . . . . . . . . . . . . . . . . . . . . . . 1.64% 1.69% 1.66% 1.69% 1.73%
Net investment income (loss) . . . . . . . . . . . . . . . . . . . . . . . . . . . . (0.19)% (0.39)% (0.41)% (0.35)% (0.55)%
Supplemental data
Net assets, end of year (000’s) . . . . . . . . . . . . . . . . . . . . . . . . . . . $255,425 $340,671 $273,512 $270,538 $270,131
Portfolio turnover rate . . . . . . . . . . . . . . . . . . . . . . . . . . . . . . . . . . 5.64% 0.37% 2.21% 1.16% 1.56%
aThe amount shown for a share outstanding throughout the period may not correlate with the Statement of Operations for the period due to the timing of sales and repurchases ofthe Fund shares in relation to income earned and/or fluctuating market value of the investments of the Fund.bBased on average daily shares outstanding.cAmount rounds to less than $0.01 per share.dEffective September 1, 2008, the redemption fee was eliminated.eTotal return does not reflect sales commissions or contingent deferred sales charges, if applicable.fBenefit of expense reduction rounds to less than 0.01%.

Franklin Custodian FundsFinancial Highlights (continued)
Annual Report | The accompanying notes are an integral part of these financial statements. | 69
Franklin Growth Fund
Year Ended September 30,Class R 2008 2007 2006 2005 2004
Per share operating performance(for a share outstanding throughout the year)
Net asset value, beginning of year . . . . . . . . . . . . . . . . . . . . . . . . . . . . $45.99 $38.80 $34.59 $30.39 $26.74
Income from investment operationsa:
Net investment income (loss)b . . . . . . . . . . . . . . . . . . . . . . . . . . . . . . 0.14 0.04 0.02 0.05 (0.02)
Net realized and unrealized gains (losses) . . . . . . . . . . . . . . . . . . . . . (9.23) 7.16 4.19 4.16 3.67
Total from investment operations . . . . . . . . . . . . . . . . . . . . . . . . . . . . . (9.09) 7.20 4.21 4.21 3.65
Less distributions from net investment income . . . . . . . . . . . . . . . . . . . (0.03) (0.01) —c (0.01) —
Redemption feesc, d . . . . . . . . . . . . . . . . . . . . . . . . . . . . . . . . . . . . . . . — — — — —
Net asset value, end of year . . . . . . . . . . . . . . . . . . . . . . . . . . . . . . . . $36.87 $45.99 $38.80 $34.59 $30.39
Total returne . . . . . . . . . . . . . . . . . . . . . . . . . . . . . . . . . . . . . . . . . . . . (19.78)% 18.55% 12.18% 13.87% 13.65%
Ratios to average net assets
Expensesf . . . . . . . . . . . . . . . . . . . . . . . . . . . . . . . . . . . . . . . . . . . . . 1.14% 1.19% 1.17% 1.19% 1.23%
Net investment income (loss) . . . . . . . . . . . . . . . . . . . . . . . . . . . . . . . 0.31% 0.11% 0.08% 0.15% (0.05)%
Supplemental data
Net assets, end of year (000’s) . . . . . . . . . . . . . . . . . . . . . . . . . . . . . . $30,175 $53,134 $37,804 $27,818 $20,060
Portfolio turnover rate . . . . . . . . . . . . . . . . . . . . . . . . . . . . . . . . . . . . . 5.64% 0.37% 2.21% 1.16% 1.56%
aThe amount shown for a share outstanding throughout the period may not correlate with the Statement of Operations for the period due to the timing of sales and repurchases ofthe Fund shares in relation to income earned and/or fluctuating market value of the investments of the Fund.bBased on average daily shares outstanding.cAmount rounds to less than $0.01 per share.dEffective September 1, 2008, the redemption fee was eliminated.eTotal return does not reflect sales commissions or contingent deferred sales charges, if applicable.fBenefit of expense reduction rounds to less than 0.01%.

Franklin Custodian FundsFinancial Highlights (continued)
70 | The accompanying notes are an integral part of these financial statements. | Annual Report
Franklin Growth Fund
Year Ended September 30,Advisor Class 2008 2007 2006 2005 2004
Per share operating performance(for a share outstanding throughout the year)
Net asset value, beginning of year . . . . . . . . . . . . . . . . . . . . . . . . . $46.45 $39.17 $34.89 $30.63 $26.91
Income from investment operationsa:
Net investment incomeb . . . . . . . . . . . . . . . . . . . . . . . . . . . . . . . 0.34 0.27 0.22 0.21 0.14
Net realized and unrealized gains (losses) . . . . . . . . . . . . . . . . . . . (9.31) 7.21 4.21 4.21 3.67
Total from investment operations . . . . . . . . . . . . . . . . . . . . . . . . . . (8.97) 7.48 4.43 4.42 3.81
Less distributions from net investment income . . . . . . . . . . . . . . . . (0.23) (0.20) (0.15) (0.16) (0.09)
Redemption feesc, d . . . . . . . . . . . . . . . . . . . . . . . . . . . . . . . . . . . . — — — — —
Net asset value, end of year . . . . . . . . . . . . . . . . . . . . . . . . . . . . . $37.25 $46.45 $39.17 $34.89 $30.63
Total return . . . . . . . . . . . . . . . . . . . . . . . . . . . . . . . . . . . . . . . . . (19.39)% 19.16% 12.73% 14.45% 14.19%
Ratios to average net assets
Expensese . . . . . . . . . . . . . . . . . . . . . . . . . . . . . . . . . . . . . . . . . . 0.64% 0.69% 0.67% 0.69% 0.73%
Net investment income . . . . . . . . . . . . . . . . . . . . . . . . . . . . . . . . . 0.81% 0.61% 0.58% 0.65% 0.45%
Supplemental data
Net assets, end of year (000’s) . . . . . . . . . . . . . . . . . . . . . . . . . . . $256,988 $363,221 $274,603 $221,752 $133,332
Portfolio turnover rate . . . . . . . . . . . . . . . . . . . . . . . . . . . . . . . . . . 5.64% 0.37% 2.21% 1.16% 1.56%
aThe amount shown for a share outstanding throughout the period may not correlate with the Statement of Operations for the period due to the timing of sales and repurchases ofthe Fund shares in relation to income earned and/or fluctuating market value of the investments of the Fund.bBased on average daily shares outstanding.cAmount rounds to less than $0.01 per share.dEffective September 1, 2008, the redemption fee was eliminated.eBenefit of expense reduction rounds to less than 0.01%.

Franklin Custodian FundsStatement of Investments, September 30, 2008
Annual Report | 71
Franklin Growth Fund Shares Value
Common Stocks 100.0%Automobiles & Components 2.7%
aFord Motor Co. . . . . . . . . . . . . . . . . . . . . . . . . . . . . . . . . . . . . . . . . . . . . . . . . . . . . . . . . . . 1,100,000 $ 5,720,000General Motors Corp. . . . . . . . . . . . . . . . . . . . . . . . . . . . . . . . . . . . . . . . . . . . . . . . . . . . . . 400,000 3,780,000Harley-Davidson Inc. . . . . . . . . . . . . . . . . . . . . . . . . . . . . . . . . . . . . . . . . . . . . . . . . . . . . . . 500,000 18,650,000Johnson Controls Inc. . . . . . . . . . . . . . . . . . . . . . . . . . . . . . . . . . . . . . . . . . . . . . . . . . . . . . 1,200,000 36,396,000
64,546,000
Banks 0.0%b
aTree. Com, Inc. . . . . . . . . . . . . . . . . . . . . . . . . . . . . . . . . . . . . . . . . . . . . . . . . . . . . . . . . . . 10,003 48,214
Capital Goods 28.8%3M Co. . . . . . . . . . . . . . . . . . . . . . . . . . . . . . . . . . . . . . . . . . . . . . . . . . . . . . . . . . . . . . . . 855,000 58,405,050The Boeing Co. . . . . . . . . . . . . . . . . . . . . . . . . . . . . . . . . . . . . . . . . . . . . . . . . . . . . . . . . . . 1,045,000 59,930,750Emerson Electric Co. . . . . . . . . . . . . . . . . . . . . . . . . . . . . . . . . . . . . . . . . . . . . . . . . . . . . . . 1,000,000 40,790,000General Dynamics Corp. . . . . . . . . . . . . . . . . . . . . . . . . . . . . . . . . . . . . . . . . . . . . . . . . . . . 1,000,000 73,620,000General Electric Co. . . . . . . . . . . . . . . . . . . . . . . . . . . . . . . . . . . . . . . . . . . . . . . . . . . . . . . 70,000 1,785,000Illinois Tool Works Inc. . . . . . . . . . . . . . . . . . . . . . . . . . . . . . . . . . . . . . . . . . . . . . . . . . . . . 1,000,000 44,450,000Ingersoll-Rand Co. Ltd., A . . . . . . . . . . . . . . . . . . . . . . . . . . . . . . . . . . . . . . . . . . . . . . . . . . 1,002,000 31,232,340Lockheed Martin Corp. . . . . . . . . . . . . . . . . . . . . . . . . . . . . . . . . . . . . . . . . . . . . . . . . . . . . 500,000 54,835,000Northrop Grumman Corp. . . . . . . . . . . . . . . . . . . . . . . . . . . . . . . . . . . . . . . . . . . . . . . . . . . 1,000,000 60,540,000Pall Corp. . . . . . . . . . . . . . . . . . . . . . . . . . . . . . . . . . . . . . . . . . . . . . . . . . . . . . . . . . . . . . . 500,000 17,195,000Raytheon Co. . . . . . . . . . . . . . . . . . . . . . . . . . . . . . . . . . . . . . . . . . . . . . . . . . . . . . . . . . . . 600,000 32,106,000Rockwell Collins Inc. . . . . . . . . . . . . . . . . . . . . . . . . . . . . . . . . . . . . . . . . . . . . . . . . . . . . . . 100,000 4,809,000
aSunPower Corp., A . . . . . . . . . . . . . . . . . . . . . . . . . . . . . . . . . . . . . . . . . . . . . . . . . . . . . . . 2,000 141,860Teleflex Inc. . . . . . . . . . . . . . . . . . . . . . . . . . . . . . . . . . . . . . . . . . . . . . . . . . . . . . . . . . . . . 500,000 31,745,000Textron Inc. . . . . . . . . . . . . . . . . . . . . . . . . . . . . . . . . . . . . . . . . . . . . . . . . . . . . . . . . . . . . 1,050,000 30,744,000
aThomas & Betts Corp. . . . . . . . . . . . . . . . . . . . . . . . . . . . . . . . . . . . . . . . . . . . . . . . . . . . . . 500,000 19,535,000Tyco International Ltd. . . . . . . . . . . . . . . . . . . . . . . . . . . . . . . . . . . . . . . . . . . . . . . . . . . . . 387,513 13,570,705United Technologies Corp. . . . . . . . . . . . . . . . . . . . . . . . . . . . . . . . . . . . . . . . . . . . . . . . . . . 850,000 51,051,000W.W. Grainger Inc. . . . . . . . . . . . . . . . . . . . . . . . . . . . . . . . . . . . . . . . . . . . . . . . . . . . . . . . 550,000 47,833,500
674,319,205
Commercial & Professional Services 2.3%Avery Dennison Corp. . . . . . . . . . . . . . . . . . . . . . . . . . . . . . . . . . . . . . . . . . . . . . . . . . . . . . 462,000 20,549,760Dun & Bradstreet Corp. . . . . . . . . . . . . . . . . . . . . . . . . . . . . . . . . . . . . . . . . . . . . . . . . . . . . 122,000 11,511,920Equifax Inc. . . . . . . . . . . . . . . . . . . . . . . . . . . . . . . . . . . . . . . . . . . . . . . . . . . . . . . . . . . . . 400,000 13,780,000Robert Half International Inc. . . . . . . . . . . . . . . . . . . . . . . . . . . . . . . . . . . . . . . . . . . . . . . . 300,000 7,425,000
53,266,680
Consumer Durables & Apparel 1.6%VF Corp. . . . . . . . . . . . . . . . . . . . . . . . . . . . . . . . . . . . . . . . . . . . . . . . . . . . . . . . . . . . . . . 500,000 38,655,000
Consumer Services 0.9%Carnival Corp. . . . . . . . . . . . . . . . . . . . . . . . . . . . . . . . . . . . . . . . . . . . . . . . . . . . . . . . . . . 565,000 19,972,750
a Interval Leisure Group Inc. . . . . . . . . . . . . . . . . . . . . . . . . . . . . . . . . . . . . . . . . . . . . . . . . . 60,020 624,208
20,596,958
Diversified Financials 0.8%Moody’s Corp. . . . . . . . . . . . . . . . . . . . . . . . . . . . . . . . . . . . . . . . . . . . . . . . . . . . . . . . . . . 538,000 18,292,000

Franklin Custodian FundsStatement of Investments, September 30, 2008 (continued)
72 | Annual Report
Franklin Growth Fund Shares Value
Common Stocks (continued)Energy 2.2%BP PLC, ADR (United Kingdom) . . . . . . . . . . . . . . . . . . . . . . . . . . . . . . . . . . . . . . . . . . . . . . 350,200 $ 17,569,534ConocoPhillips . . . . . . . . . . . . . . . . . . . . . . . . . . . . . . . . . . . . . . . . . . . . . . . . . . . . . . . . . . 35,000 2,563,750Devon Energy Corp. . . . . . . . . . . . . . . . . . . . . . . . . . . . . . . . . . . . . . . . . . . . . . . . . . . . . . . . 50,000 4,560,000Exxon Mobil Corp. . . . . . . . . . . . . . . . . . . . . . . . . . . . . . . . . . . . . . . . . . . . . . . . . . . . . . . . . 70,000 5,436,200Royal Dutch Shell PLC, A, ADR (Netherlands) . . . . . . . . . . . . . . . . . . . . . . . . . . . . . . . . . . . . 280,000 16,522,800Schlumberger Ltd. . . . . . . . . . . . . . . . . . . . . . . . . . . . . . . . . . . . . . . . . . . . . . . . . . . . . . . . 40,000 3,123,600
aTransocean Inc. . . . . . . . . . . . . . . . . . . . . . . . . . . . . . . . . . . . . . . . . . . . . . . . . . . . . . . . . . 15,222 1,671,985
51,447,869
Health Care Equipment & Services 4.0%aAdvanced Medical Optics Inc. . . . . . . . . . . . . . . . . . . . . . . . . . . . . . . . . . . . . . . . . . . . . . . . 88,888 1,580,429Baxter International Inc. . . . . . . . . . . . . . . . . . . . . . . . . . . . . . . . . . . . . . . . . . . . . . . . . . . . 400,000 26,252,000Cardinal Health Inc. . . . . . . . . . . . . . . . . . . . . . . . . . . . . . . . . . . . . . . . . . . . . . . . . . . . . . . 300,000 14,784,000
aEdwards Lifesciences Corp. . . . . . . . . . . . . . . . . . . . . . . . . . . . . . . . . . . . . . . . . . . . . . . . . . 50,000 2,888,000aHospira Inc. . . . . . . . . . . . . . . . . . . . . . . . . . . . . . . . . . . . . . . . . . . . . . . . . . . . . . . . . . . . . 40,000 1,528,000IMS Health Inc. . . . . . . . . . . . . . . . . . . . . . . . . . . . . . . . . . . . . . . . . . . . . . . . . . . . . . . . . . 500,000 9,455,000
a Intuitive Surgical Inc. . . . . . . . . . . . . . . . . . . . . . . . . . . . . . . . . . . . . . . . . . . . . . . . . . . . . . 1,000 240,980aMedco Health Solutions Inc. . . . . . . . . . . . . . . . . . . . . . . . . . . . . . . . . . . . . . . . . . . . . . . . . 96,480 4,341,600Medtronic Inc. . . . . . . . . . . . . . . . . . . . . . . . . . . . . . . . . . . . . . . . . . . . . . . . . . . . . . . . . . . 60,000 3,006,000Quest Diagnostics Inc. . . . . . . . . . . . . . . . . . . . . . . . . . . . . . . . . . . . . . . . . . . . . . . . . . . . . 500,000 25,835,000
aZimmer Holdings Inc. . . . . . . . . . . . . . . . . . . . . . . . . . . . . . . . . . . . . . . . . . . . . . . . . . . . . . 64,000 4,131,840
94,042,849
Household & Personal Products 0.1%The Procter & Gamble Co. . . . . . . . . . . . . . . . . . . . . . . . . . . . . . . . . . . . . . . . . . . . . . . . . . . 35,000 2,439,150
Materials 2.4%Air Products and Chemicals Inc. . . . . . . . . . . . . . . . . . . . . . . . . . . . . . . . . . . . . . . . . . . . . . 500,000 34,245,000Sigma-Aldrich Corp. . . . . . . . . . . . . . . . . . . . . . . . . . . . . . . . . . . . . . . . . . . . . . . . . . . . . . . 400,000 20,968,000
55,213,000
Media 2.2%Time Warner Inc. . . . . . . . . . . . . . . . . . . . . . . . . . . . . . . . . . . . . . . . . . . . . . . . . . . . . . . . . 1,350,000 17,698,500The Walt Disney Co. . . . . . . . . . . . . . . . . . . . . . . . . . . . . . . . . . . . . . . . . . . . . . . . . . . . . . . 1,130,000 34,679,700
52,378,200
Pharmaceuticals, Biotechnology & Life Sciences 20.7%Abbott Laboratories . . . . . . . . . . . . . . . . . . . . . . . . . . . . . . . . . . . . . . . . . . . . . . . . . . . . . . . 400,000 23,032,000Allergan Inc. . . . . . . . . . . . . . . . . . . . . . . . . . . . . . . . . . . . . . . . . . . . . . . . . . . . . . . . . . . . 800,000 41,200,000
aAmgen Inc. . . . . . . . . . . . . . . . . . . . . . . . . . . . . . . . . . . . . . . . . . . . . . . . . . . . . . . . . . . . . 932,000 55,239,640aBiogen Idec Inc. . . . . . . . . . . . . . . . . . . . . . . . . . . . . . . . . . . . . . . . . . . . . . . . . . . . . . . . . . 400,000 20,116,000aCelgene Corp. . . . . . . . . . . . . . . . . . . . . . . . . . . . . . . . . . . . . . . . . . . . . . . . . . . . . . . . . . . . 25,000 1,582,000aDionex Corp. . . . . . . . . . . . . . . . . . . . . . . . . . . . . . . . . . . . . . . . . . . . . . . . . . . . . . . . . . . . 250,000 15,887,500Eli Lilly and Co. . . . . . . . . . . . . . . . . . . . . . . . . . . . . . . . . . . . . . . . . . . . . . . . . . . . . . . . . . 400,000 17,612,000
aGenentech Inc. . . . . . . . . . . . . . . . . . . . . . . . . . . . . . . . . . . . . . . . . . . . . . . . . . . . . . . . . . . 1,000,000 88,680,000Johnson & Johnson . . . . . . . . . . . . . . . . . . . . . . . . . . . . . . . . . . . . . . . . . . . . . . . . . . . . . . . 1,081,000 74,891,680Merck & Co. Inc. . . . . . . . . . . . . . . . . . . . . . . . . . . . . . . . . . . . . . . . . . . . . . . . . . . . . . . . . 500,000 15,780,000
aMillipore Corp. . . . . . . . . . . . . . . . . . . . . . . . . . . . . . . . . . . . . . . . . . . . . . . . . . . . . . . . . . . 400,000 27,520,000Pfizer Inc. . . . . . . . . . . . . . . . . . . . . . . . . . . . . . . . . . . . . . . . . . . . . . . . . . . . . . . . . . . . . . 2,170,000 40,014,800

Franklin Custodian FundsStatement of Investments, September 30, 2008 (continued)
Annual Report | 73
Franklin Growth Fund Shares Value
Common Stocks (continued)Pharmaceuticals, Biotechnology & Life Sciences (continued)Roche Holding AG, ADR (Switzerland) . . . . . . . . . . . . . . . . . . . . . . . . . . . . . . . . . . . . . . . . . 40,000 $ 3,102,000Schering-Plough Corp. . . . . . . . . . . . . . . . . . . . . . . . . . . . . . . . . . . . . . . . . . . . . . . . . . . . . 500,000 9,235,000
aWaters Corp. . . . . . . . . . . . . . . . . . . . . . . . . . . . . . . . . . . . . . . . . . . . . . . . . . . . . . . . . . . . 500,000 29,090,000Wyeth . . . . . . . . . . . . . . . . . . . . . . . . . . . . . . . . . . . . . . . . . . . . . . . . . . . . . . . . . . . . . . . . 600,000 22,164,000
485,146,620
Retailing 0.8%aExpedia Inc. . . . . . . . . . . . . . . . . . . . . . . . . . . . . . . . . . . . . . . . . . . . . . . . . . . . . . . . . . . . . 300,100 4,534,511Genuine Parts Co. . . . . . . . . . . . . . . . . . . . . . . . . . . . . . . . . . . . . . . . . . . . . . . . . . . . . . . . . 300,400 12,079,084
aHSN Inc. . . . . . . . . . . . . . . . . . . . . . . . . . . . . . . . . . . . . . . . . . . . . . . . . . . . . . . . . . . . . . . 60,020 660,820aTicketmaster . . . . . . . . . . . . . . . . . . . . . . . . . . . . . . . . . . . . . . . . . . . . . . . . . . . . . . . . . . . 60,020 644,015
17,918,430
Semiconductors & Semiconductor Equipment 1.2%Intel Corp. . . . . . . . . . . . . . . . . . . . . . . . . . . . . . . . . . . . . . . . . . . . . . . . . . . . . . . . . . . . . . 900,000 16,857,000Texas Instruments Inc. . . . . . . . . . . . . . . . . . . . . . . . . . . . . . . . . . . . . . . . . . . . . . . . . . . . . 515,000 11,072,500
aVerigy Ltd. (Singapore) . . . . . . . . . . . . . . . . . . . . . . . . . . . . . . . . . . . . . . . . . . . . . . . . . . . . 48,974 797,297
28,726,797
Software & Services 6.3%Automatic Data Processing Inc. . . . . . . . . . . . . . . . . . . . . . . . . . . . . . . . . . . . . . . . . . . . . . . 700,000 29,925,000
aComputer Sciences Corp. . . . . . . . . . . . . . . . . . . . . . . . . . . . . . . . . . . . . . . . . . . . . . . . . . . 1,000,000 40,190,000aGoogle Inc., A . . . . . . . . . . . . . . . . . . . . . . . . . . . . . . . . . . . . . . . . . . . . . . . . . . . . . . . . . . 27,000 10,814,040a IAC/InterActiveCorp . . . . . . . . . . . . . . . . . . . . . . . . . . . . . . . . . . . . . . . . . . . . . . . . . . . . . . 150,050 2,595,865Microsoft Corp. . . . . . . . . . . . . . . . . . . . . . . . . . . . . . . . . . . . . . . . . . . . . . . . . . . . . . . . . . . 975,000 26,022,750
aOracle Corp. . . . . . . . . . . . . . . . . . . . . . . . . . . . . . . . . . . . . . . . . . . . . . . . . . . . . . . . . . . . . 500,000 10,155,000aYahoo! Inc. . . . . . . . . . . . . . . . . . . . . . . . . . . . . . . . . . . . . . . . . . . . . . . . . . . . . . . . . . . . . 1,600,000 27,680,000
147,382,655
Technology Hardware & Equipment 12.9%aAgilent Technologies Inc. . . . . . . . . . . . . . . . . . . . . . . . . . . . . . . . . . . . . . . . . . . . . . . . . . . . 400,000 11,864,000aApple Inc. . . . . . . . . . . . . . . . . . . . . . . . . . . . . . . . . . . . . . . . . . . . . . . . . . . . . . . . . . . . . . 700,000 79,562,000aCisco Systems Inc. . . . . . . . . . . . . . . . . . . . . . . . . . . . . . . . . . . . . . . . . . . . . . . . . . . . . . . . 1,545,000 34,855,200aDell Inc. . . . . . . . . . . . . . . . . . . . . . . . . . . . . . . . . . . . . . . . . . . . . . . . . . . . . . . . . . . . . . . 500,000 8,240,000aEMC Corp. . . . . . . . . . . . . . . . . . . . . . . . . . . . . . . . . . . . . . . . . . . . . . . . . . . . . . . . . . . . . . 1,000,000 11,960,000Hewlett-Packard Co. . . . . . . . . . . . . . . . . . . . . . . . . . . . . . . . . . . . . . . . . . . . . . . . . . . . . . . 1,156,250 53,465,000International Business Machines Corp. . . . . . . . . . . . . . . . . . . . . . . . . . . . . . . . . . . . . . . . . . 580,000 67,836,800
aLogitech International SA (Switzerland) . . . . . . . . . . . . . . . . . . . . . . . . . . . . . . . . . . . . . . . . 150,000 3,498,000aMettler-Toledo International Inc. . . . . . . . . . . . . . . . . . . . . . . . . . . . . . . . . . . . . . . . . . . . . . 50,000 4,900,000Molex Inc. . . . . . . . . . . . . . . . . . . . . . . . . . . . . . . . . . . . . . . . . . . . . . . . . . . . . . . . . . . . . . 146,483 3,288,543Molex Inc., A . . . . . . . . . . . . . . . . . . . . . . . . . . . . . . . . . . . . . . . . . . . . . . . . . . . . . . . . . . . 146,483 3,048,311QUALCOMM Inc. . . . . . . . . . . . . . . . . . . . . . . . . . . . . . . . . . . . . . . . . . . . . . . . . . . . . . . . . 110,000 4,726,700
aSun Microsystems Inc. . . . . . . . . . . . . . . . . . . . . . . . . . . . . . . . . . . . . . . . . . . . . . . . . . . . . 400,000 3,040,000Tyco Electronics Ltd. . . . . . . . . . . . . . . . . . . . . . . . . . . . . . . . . . . . . . . . . . . . . . . . . . . . . . . 387,513 10,718,610
301,003,164
Telecommunication Services 0.2%aAmerican Tower Corp., A . . . . . . . . . . . . . . . . . . . . . . . . . . . . . . . . . . . . . . . . . . . . . . . . . . . 115,000 4,136,550

Franklin Custodian FundsStatement of Investments, September 30, 2008 (continued)
74 | The accompanying notes are an integral part of these financial statements. | Annual Report
Franklin Growth Fund Shares Value
Common Stocks (continued)Transportation 9.8%Air France-KLM, ADR (France) . . . . . . . . . . . . . . . . . . . . . . . . . . . . . . . . . . . . . . . . . . . . . . . 550,000 $ 12,600,500
aAlaska Air Group Inc. . . . . . . . . . . . . . . . . . . . . . . . . . . . . . . . . . . . . . . . . . . . . . . . . . . . . . 500,000 10,195,000aAMR Corp. . . . . . . . . . . . . . . . . . . . . . . . . . . . . . . . . . . . . . . . . . . . . . . . . . . . . . . . . . . . . . 2,000,000 19,640,000Arkansas Best Corp. . . . . . . . . . . . . . . . . . . . . . . . . . . . . . . . . . . . . . . . . . . . . . . . . . . . . . . 500,000 16,845,000British Airways PLC, ADR (United Kingdom) . . . . . . . . . . . . . . . . . . . . . . . . . . . . . . . . . . . . . 500,000 15,062,500Canadian National Railway Co. (Canada) . . . . . . . . . . . . . . . . . . . . . . . . . . . . . . . . . . . . . . . . 500,000 23,915,000Canadian Pacific Railway Ltd. (Canada) . . . . . . . . . . . . . . . . . . . . . . . . . . . . . . . . . . . . . . . . 500,000 26,930,000
aContinental Airlines Inc., B . . . . . . . . . . . . . . . . . . . . . . . . . . . . . . . . . . . . . . . . . . . . . . . . . 1,000,000 16,680,000Expeditors International of Washington Inc. . . . . . . . . . . . . . . . . . . . . . . . . . . . . . . . . . . . . . . 80,000 2,787,200Forward Air Corp. . . . . . . . . . . . . . . . . . . . . . . . . . . . . . . . . . . . . . . . . . . . . . . . . . . . . . . . . 500,000 13,615,000Heartland Express Inc. . . . . . . . . . . . . . . . . . . . . . . . . . . . . . . . . . . . . . . . . . . . . . . . . . . . . 500,000 7,760,000Southwest Airlines Co. . . . . . . . . . . . . . . . . . . . . . . . . . . . . . . . . . . . . . . . . . . . . . . . . . . . . 65,200 946,052Union Pacific Corp. . . . . . . . . . . . . . . . . . . . . . . . . . . . . . . . . . . . . . . . . . . . . . . . . . . . . . . . 600,000 42,696,000Werner Enterprises Inc. . . . . . . . . . . . . . . . . . . . . . . . . . . . . . . . . . . . . . . . . . . . . . . . . . . . . 500,000 10,855,000
aYRC Worldwide Inc. . . . . . . . . . . . . . . . . . . . . . . . . . . . . . . . . . . . . . . . . . . . . . . . . . . . . . . 700,000 8,372,000
228,899,252
Utilities 0.1%Public Service Enterprise Group Inc. . . . . . . . . . . . . . . . . . . . . . . . . . . . . . . . . . . . . . . . . . . 100,000 3,279,000
Total Common Stocks (Cost $1,077,802,405) . . . . . . . . . . . . . . . . . . . . . . . . . . . . 2,341,737,593
Short Term Investments (Cost $1,560,596) 0.1%Money Market Funds 0.1%
cFranklin Institutional Fiduciary Trust Money Market Portfolio, 1.98% . . . . . . . . . . . . . . . . . . . 1,560,596 1,560,596
Total Investments (Cost $1,079,363,001) 100.1% . . . . . . . . . . . . . . . . . . . . . . . . 2,343,298,189
Other Assets, less Liabilities (0.1)% . . . . . . . . . . . . . . . . . . . . . . . . . . . . . . . . . . . . . . (2,318,965)
Net Assets 100.0% . . . . . . . . . . . . . . . . . . . . . . . . . . . . . . . . . . . . . . . . . . . . . . . . . . . . $2,340,979,224
See Selected Portfolio Abbreviations on page 106.
aNon-income producing for the twelve months ended September 30, 2008.bRounds to less than 0.1% of net assets.cSee Note 7 regarding investments in the Franklin Institutional Fiduciary Trust Money Market Portfolio. The rate shown is the annualized seven-day yield at period end.

Franklin Custodian FundsFinancial Highlights
Annual Report | The accompanying notes are an integral part of these financial statements. | 75
Franklin Income Fund
Year Ended September 30,Class A 2008 2007 2006 2005 2004
Per share operating performance(for a share outstanding throughout the year)
Net asset value, beginning of year . . . . . . . . . . . . $2.74 $2.57 $2.50 $2.42 $2.25
Income from investment operationsa:
Net investment incomeb . . . . . . . . . . . . . . . . . . 0.16 0.14 0.14 0.14 0.12
Net realized and unrealized gains (losses) . . . . . . (0.71) 0.21 0.09 0.10 0.22
Total from investment operations . . . . . . . . . . . . . (0.55) 0.35 0.23 0.24 0.34
Less distributions from:
Net investment income . . . . . . . . . . . . . . . . . . . (0.15) (0.14) (0.15) (0.15) (0.16)
Net realized gains . . . . . . . . . . . . . . . . . . . . . . (0.06) (0.04) (0.01) (0.01) (0.01)
Total distributions . . . . . . . . . . . . . . . . . . . . . . . (0.21) (0.18) (0.16) (0.16) (0.17)
Redemption feesc, d . . . . . . . . . . . . . . . . . . . . . . . — — — — —
Net asset value, end of year . . . . . . . . . . . . . . . . $1.98 $2.74 $2.57 $2.50 $2.42
Total returne . . . . . . . . . . . . . . . . . . . . . . . . . . . . (21.36)% 14.14% 9.73% 10.45% 15.50%
Ratios to average net assets
Expenses . . . . . . . . . . . . . . . . . . . . . . . . . . . . . . 0.62%f 0.63%f 0.64%g 0.65%g 0.68%f
Net investment income . . . . . . . . . . . . . . . . . . . . 6.44% 5.31% 5.61% 5.54% 5.11%
Supplemental data
Net assets, end of year (000’s) . . . . . . . . . . . . . . $26,892,973 $35,476,603 $26,641,398 $21,934,575 $14,743,190
Portfolio turnover rate . . . . . . . . . . . . . . . . . . . . . 39.92% 25.45% 28.35% 28.51% 31.90%
aThe amount shown for a share outstanding throughout the period may not correlate with the Statement of Operations for the period due to the timing of sales and repurchases ofthe Fund shares in relation to income earned and/or fluctuating market value of the investments of the Fund.bBased on average daily shares outstanding.cAmount rounds to less than $0.01 per share.dEffective September 1, 2008, the redemption fee was eliminated.eTotal return does not reflect sales commissions or contingent deferred sales charges, if applicable.fBenefit of expense reduction rounds to less than 0.01%.gBenefit of waiver and payment by affiliate and expense reduction rounds to less than 0.01%.

Franklin Custodian FundsFinancial Highlights (continued)
76 | The accompanying notes are an integral part of these financial statements. | Annual Report
Franklin Income Fund
Year Ended September 30,Class B 2008 2007 2006 2005 2004
Per share operating performance(for a share outstanding throughout the year)
Net asset value, beginning of year . . . . . . . . . . . . . . . . . $2.73 $2.56 $2.49 $2.41 $2.24
Income from investment operationsa:
Net investment incomeb . . . . . . . . . . . . . . . . . . . . . . . . 0.14 0.12 0.12 0.11 0.10
Net realized and unrealized gains (losses) . . . . . . . . . . . (0.71) 0.21 0.08 0.11 0.22
Total from investment operations . . . . . . . . . . . . . . . . . . (0.57) 0.33 0.20 0.22 0.32
Less distributions from:
Net investment income . . . . . . . . . . . . . . . . . . . . . . . . (0.13) (0.12) (0.12) (0.13) (0.14)
Net realized gains . . . . . . . . . . . . . . . . . . . . . . . . . . . . (0.06) (0.04) (0.01) (0.01) (0.01)
Total distributions . . . . . . . . . . . . . . . . . . . . . . . . . . . . . (0.19) (0.16) (0.13) (0.14) (0.15)
Redemption feesc, d . . . . . . . . . . . . . . . . . . . . . . . . . . . . — — — — —
Net asset value, end of year . . . . . . . . . . . . . . . . . . . . . . $1.97 $2.73 $2.56 $2.49 $2.41
Total returne . . . . . . . . . . . . . . . . . . . . . . . . . . . . . . . . . (22.13)% 13.23% 8.83% 9.57% 14.59%
Ratios to average net assets
Expenses . . . . . . . . . . . . . . . . . . . . . . . . . . . . . . . . . . . 1.47%f 1.48%f 1.49%g 1.50%g 1.53%f
Net investment income . . . . . . . . . . . . . . . . . . . . . . . . . 5.59% 4.46% 4.76% 4.69% 4.26%
Supplemental data
Net assets, end of year (000’s) . . . . . . . . . . . . . . . . . . . . $2,428,765 $3,745,636 $3,743,374 $3,922,396 $3,486,880
Portfolio turnover rate . . . . . . . . . . . . . . . . . . . . . . . . . . 39.92% 25.45% 28.35% 28.51% 31.90%
aThe amount shown for a share outstanding throughout the period may not correlate with the Statement of Operations for the period due to the timing of sales and repurchases ofthe Fund shares in relation to income earned and/or fluctuating market value of the investments of the Fund.bBased on average daily shares outstanding.cAmount rounds to less than $0.01 per share.dEffective September 1, 2008, the redemption fee was eliminated.eTotal return does not reflect sales commissions or contingent deferred sales charges, if applicable.fBenefit of expense reduction rounds to less than 0.01%.gBenefit of waiver and payment by affiliate and expense reduction rounds to less than 0.01%.

Franklin Custodian FundsFinancial Highlights (continued)
Annual Report | The accompanying notes are an integral part of these financial statements. | 77
Franklin Income Fund
Year Ended September 30,Class B1 2008 2007 2006 2005 2004
Per share operating performance(for a share outstanding throughout the year)
Net asset value, beginning of year . . . . . . . . . . . . . . . . . . . . . . . . . $2.74 $2.57 $2.50 $2.42 $2.25
Income from investment operationsa:
Net investment incomeb . . . . . . . . . . . . . . . . . . . . . . . . . . . . . . . 0.15 0.13 0.13 0.12 0.11
Net realized and unrealized gains (losses) . . . . . . . . . . . . . . . . . . . (0.71) 0.21 0.08 0.11 0.21
Total from investment operations . . . . . . . . . . . . . . . . . . . . . . . . . . (0.56) 0.34 0.21 0.23 0.32
Less distributions from:
Net investment income . . . . . . . . . . . . . . . . . . . . . . . . . . . . . . . . (0.14) (0.13) (0.13) (0.14) (0.14)
Net realized gains . . . . . . . . . . . . . . . . . . . . . . . . . . . . . . . . . . . (0.06) (0.04) (0.01) (0.01) (0.01)
Total distributions . . . . . . . . . . . . . . . . . . . . . . . . . . . . . . . . . . . . (0.20) (0.17) (0.14) (0.15) (0.15)
Redemption feesc, d . . . . . . . . . . . . . . . . . . . . . . . . . . . . . . . . . . . . — — — — —
Net asset value, end of year . . . . . . . . . . . . . . . . . . . . . . . . . . . . . $1.98 $2.74 $2.57 $2.50 $2.42
Total returne . . . . . . . . . . . . . . . . . . . . . . . . . . . . . . . . . . . . . . . . . (21.77)% 13.57% 9.17% 9.90% 14.90%
Ratios to average net assets
Expenses . . . . . . . . . . . . . . . . . . . . . . . . . . . . . . . . . . . . . . . . . . . 1.12%f 1.13%f 1.14%g 1.15%g 1.18%f
Net investment income . . . . . . . . . . . . . . . . . . . . . . . . . . . . . . . . . 5.94% 4.81% 5.11% 5.04% 4.61%
Supplemental data
Net assets, end of year (000’s) . . . . . . . . . . . . . . . . . . . . . . . . . . . $224,713 $397,224 $459,302 $493,063 $511,471
Portfolio turnover rate . . . . . . . . . . . . . . . . . . . . . . . . . . . . . . . . . . 39.92% 25.45% 28.35% 28.51% 31.90%
aThe amount shown for a share outstanding throughout the period may not correlate with the Statement of Operations for the period due to the timing of sales and repurchases ofthe Fund shares in relation to income earned and/or fluctuating market value of the investments of the Fund.bBased on average daily shares outstanding.cAmount rounds to less than $0.01 per share.dEffective September 1, 2008, the redemption fee was eliminated.eTotal return does not reflect sales commissions or contingent deferred sales charges, if applicable.fBenefit of expense reduction rounds to less than 0.01%.gBenefit of waiver and payment by affiliate and expense reduction rounds to less than 0.01%.

Franklin Custodian FundsFinancial Highlights (continued)
78 | The accompanying notes are an integral part of these financial statements. | Annual Report
Franklin Income Fund
Year Ended September 30,Class C 2008 2007 2006 2005 2004
Per share operating performance(for a share outstanding throughout the year)
Net asset value, beginning of year . . . . . . . . . . . . . . $2.76 $2.59 $2.51 $2.43 $2.26
Income from investment operationsa:
Net investment incomeb . . . . . . . . . . . . . . . . . . . . 0.15 0.13 0.13 0.13 0.11
Net realized and unrealized gains (losses) . . . . . . . (0.72) 0.21 0.09 0.10 0.21
Total from investment operations . . . . . . . . . . . . . . . (0.57) 0.34 0.22 0.23 0.32
Less distributions from:
Net investment income . . . . . . . . . . . . . . . . . . . . (0.14) (0.13) (0.13) (0.14) (0.14)
Net realized gains . . . . . . . . . . . . . . . . . . . . . . . . (0.06) (0.04) (0.01) (0.01) (0.01)
Total distributions . . . . . . . . . . . . . . . . . . . . . . . . . (0.20) (0.17) (0.14) (0.15) (0.15)
Redemption feesc, d . . . . . . . . . . . . . . . . . . . . . . . . — — — — —
Net asset value, end of year . . . . . . . . . . . . . . . . . . $1.99 $2.76 $2.59 $2.51 $2.43
Total returne . . . . . . . . . . . . . . . . . . . . . . . . . . . . . (21.98)% 13.47% 9.56% 9.84% 14.85%
Ratios to average net assets
Expenses . . . . . . . . . . . . . . . . . . . . . . . . . . . . . . . 1.12%f 1.13%f 1.14%g 1.15%g 1.18%f
Net investment income . . . . . . . . . . . . . . . . . . . . . 5.94% 4.81% 5.11% 5.04% 4.61%
Supplemental data
Net assets, end of year (000’s) . . . . . . . . . . . . . . . . $12,433,143 $16,203,796 $12,138,969 $10,113,365 $6,616,891
Portfolio turnover rate . . . . . . . . . . . . . . . . . . . . . . 39.92% 25.45% 28.35% 28.51% 31.90%
aThe amount shown for a share outstanding throughout the period may not correlate with the Statement of Operations for the period due to the timing of sales and repurchases ofthe Fund shares in relation to income earned and/or fluctuating market value of the investments of the Fund.bBased on average daily shares outstanding.cAmount rounds to less than $0.01 per share.dEffective September 1, 2008, the redemption fee was eliminated.eTotal return does not reflect sales commissions or contingent deferred sales charges, if applicable.fBenefit of expense reduction rounds to less than 0.01%.gBenefit of waiver and payment by affiliate and expense reduction rounds to less than 0.01%.
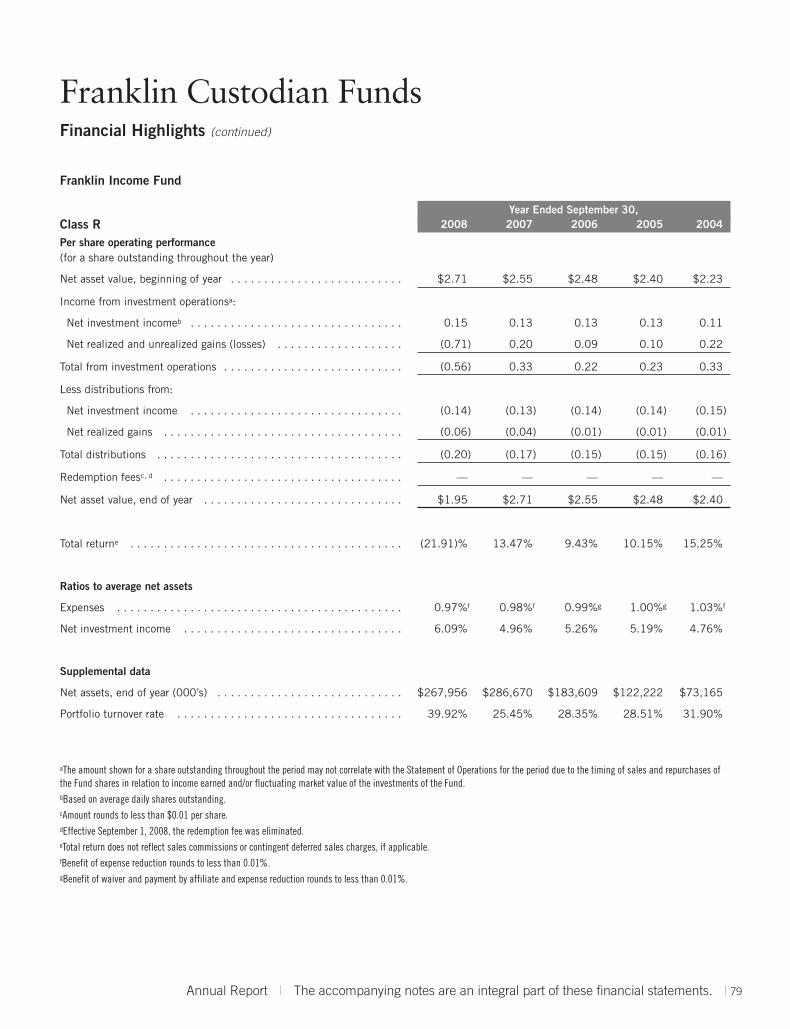
Franklin Custodian FundsFinancial Highlights (continued)
Annual Report | The accompanying notes are an integral part of these financial statements. | 79
Franklin Income Fund
Year Ended September 30,Class R 2008 2007 2006 2005 2004
Per share operating performance(for a share outstanding throughout the year)
Net asset value, beginning of year . . . . . . . . . . . . . . . . . . . . . . . . . . $2.71 $2.55 $2.48 $2.40 $2.23
Income from investment operationsa:
Net investment incomeb . . . . . . . . . . . . . . . . . . . . . . . . . . . . . . . . 0.15 0.13 0.13 0.13 0.11
Net realized and unrealized gains (losses) . . . . . . . . . . . . . . . . . . . (0.71) 0.20 0.09 0.10 0.22
Total from investment operations . . . . . . . . . . . . . . . . . . . . . . . . . . . (0.56) 0.33 0.22 0.23 0.33
Less distributions from:
Net investment income . . . . . . . . . . . . . . . . . . . . . . . . . . . . . . . . (0.14) (0.13) (0.14) (0.14) (0.15)
Net realized gains . . . . . . . . . . . . . . . . . . . . . . . . . . . . . . . . . . . . (0.06) (0.04) (0.01) (0.01) (0.01)
Total distributions . . . . . . . . . . . . . . . . . . . . . . . . . . . . . . . . . . . . . (0.20) (0.17) (0.15) (0.15) (0.16)
Redemption feesc, d . . . . . . . . . . . . . . . . . . . . . . . . . . . . . . . . . . . . — — — — —
Net asset value, end of year . . . . . . . . . . . . . . . . . . . . . . . . . . . . . . $1.95 $2.71 $2.55 $2.48 $2.40
Total returne . . . . . . . . . . . . . . . . . . . . . . . . . . . . . . . . . . . . . . . . . (21.91)% 13.47% 9.43% 10.15% 15.25%
Ratios to average net assets
Expenses . . . . . . . . . . . . . . . . . . . . . . . . . . . . . . . . . . . . . . . . . . . 0.97%f 0.98%f 0.99%g 1.00%g 1.03%f
Net investment income . . . . . . . . . . . . . . . . . . . . . . . . . . . . . . . . . 6.09% 4.96% 5.26% 5.19% 4.76%
Supplemental data
Net assets, end of year (000’s) . . . . . . . . . . . . . . . . . . . . . . . . . . . . $267,956 $286,670 $183,609 $122,222 $73,165
Portfolio turnover rate . . . . . . . . . . . . . . . . . . . . . . . . . . . . . . . . . . 39.92% 25.45% 28.35% 28.51% 31.90%
aThe amount shown for a share outstanding throughout the period may not correlate with the Statement of Operations for the period due to the timing of sales and repurchases ofthe Fund shares in relation to income earned and/or fluctuating market value of the investments of the Fund.bBased on average daily shares outstanding.cAmount rounds to less than $0.01 per share.dEffective September 1, 2008, the redemption fee was eliminated.eTotal return does not reflect sales commissions or contingent deferred sales charges, if applicable.fBenefit of expense reduction rounds to less than 0.01%.gBenefit of waiver and payment by affiliate and expense reduction rounds to less than 0.01%.

Franklin Custodian FundsFinancial Highlights (continued)
80 | The accompanying notes are an integral part of these financial statements. | Annual Report
Franklin Income Fund
Year Ended September 30,Advisor Class 2008 2007 2006 2005 2004
Per share operating performance(for a share outstanding throughout the year)
Net asset value, beginning of year . . . . . . . . . . . . . . . . . . . $2.73 $2.56 $2.49 $2.41 $2.24
Income from investment operationsa:
Net investment incomeb . . . . . . . . . . . . . . . . . . . . . . . . . 0.16 0.15 0.14 0.14 0.12
Net realized and unrealized gains (losses) . . . . . . . . . . . . (0.70) 0.21 0.09 0.11 0.22
Total from investment operations . . . . . . . . . . . . . . . . . . . (0.54) 0.36 0.23 0.25 0.34
Less distributions from:
Net investment income . . . . . . . . . . . . . . . . . . . . . . . . . (0.16) (0.15) (0.15) (0.16) (0.16)
Net realized gains . . . . . . . . . . . . . . . . . . . . . . . . . . . . . (0.06) (0.04) (0.01) (0.01) (0.01)
Total distributions . . . . . . . . . . . . . . . . . . . . . . . . . . . . . . (0.22) (0.19) (0.16) (0.17) (0.17)
Redemption feesc, d . . . . . . . . . . . . . . . . . . . . . . . . . . . . . — — — — —
Net asset value, end of year . . . . . . . . . . . . . . . . . . . . . . . $ 1.97 $2.73 $2.56 $2.49 $2.41
Total return . . . . . . . . . . . . . . . . . . . . . . . . . . . . . . . . . . . (21.33)% 14.36% 9.94% 10.65% 15.74%
Ratios to average net assets
Expenses . . . . . . . . . . . . . . . . . . . . . . . . . . . . . . . . . . . . 0.47%e 0.48%e 0.49%f 0.50%f 0.53%e
Net investment income . . . . . . . . . . . . . . . . . . . . . . . . . . 6.59% 5.46% 5.76% 5.69% 5.26%
Supplemental data
Net assets, end of year (000’s) . . . . . . . . . . . . . . . . . . . . . $4,259,806 $6,195,966 $3,786,643 $2,280,318 $901,149
Portfolio turnover rate . . . . . . . . . . . . . . . . . . . . . . . . . . . 39.92% 25.45% 28.35% 28.51% 31.90%
aThe amount shown for a share outstanding throughout the period may not correlate with the Statement of Operations for the period due to the timing of sales and repurchases ofthe Fund shares in relation to income earned and/or fluctuating market value of the investments of the Fund.bBased on average daily shares outstanding.cAmount rounds to less than $0.01 per share.dEffective September 1, 2008, the redemption fee was eliminated.eBenefit of expense reduction rounds to less than 0.01%.fBenefit of waiver and payment by affiliate and expense reduction rounds to less than 0.01%.

Franklin Custodian FundsStatement of Investments, September 30, 2008
Annual Report | 81
Franklin Income Fund Country Shares Value
Common Stocks 36.2%Energy 4.8%
aCanadian Oil Sands Trust . . . . . . . . . . . . . . . . . . . . . . . . . . . . . Canada 25,000,000 $ 910,243,765Chevron Corp. . . . . . . . . . . . . . . . . . . . . . . . . . . . . . . . . . . . . . United States 7,000,000 577,360,000ConocoPhillips . . . . . . . . . . . . . . . . . . . . . . . . . . . . . . . . . . . . . United States 5,750,000 421,187,500Spectra Energy Corp. . . . . . . . . . . . . . . . . . . . . . . . . . . . . . . . . United States 13,000,000 309,400,000
2,218,191,265
Financials 3.2%Bank of America Corp. . . . . . . . . . . . . . . . . . . . . . . . . . . . . . . . United States 20,000,000 700,000,000Duke Realty Corp. . . . . . . . . . . . . . . . . . . . . . . . . . . . . . . . . . . United States 3,163,800 77,766,204HSBC Holdings PLC . . . . . . . . . . . . . . . . . . . . . . . . . . . . . . . . . United Kingdom 35,000,000 566,175,447iStar Financial Inc. . . . . . . . . . . . . . . . . . . . . . . . . . . . . . . . . . . United States 5,213,500 13,555,100Wells Fargo & Co. . . . . . . . . . . . . . . . . . . . . . . . . . . . . . . . . . . . United States 4,000,000 150,120,000
1,507,616,751
Health Care 4.6%Bristol-Myers Squibb Co. . . . . . . . . . . . . . . . . . . . . . . . . . . . . . United States 14,000,000 291,900,000Merck & Co. Inc. . . . . . . . . . . . . . . . . . . . . . . . . . . . . . . . . . . . United States 20,000,000 631,200,000Pfizer Inc. . . . . . . . . . . . . . . . . . . . . . . . . . . . . . . . . . . . . . . . . United States 58,080,000 1,070,995,200Schering-Plough Corp. . . . . . . . . . . . . . . . . . . . . . . . . . . . . . . . United States 7,938,467 146,623,485
2,140,718,685
Industrials 0.2%3M Co. . . . . . . . . . . . . . . . . . . . . . . . . . . . . . . . . . . . . . . . . . . United States 783,568 53,525,530General Electric Co. . . . . . . . . . . . . . . . . . . . . . . . . . . . . . . . . . United States 2,400,000 61,200,000
114,725,530
Information Technology 1.8%Intel Corp. . . . . . . . . . . . . . . . . . . . . . . . . . . . . . . . . . . . . . . . . United States 36,213,400 678,276,982Microchip Technology Inc. . . . . . . . . . . . . . . . . . . . . . . . . . . . . . United States 5,000,000 147,150,000
825,426,982
Materials 0.7%AngloGold Ashanti Ltd., ADR . . . . . . . . . . . . . . . . . . . . . . . . . . . South Africa 2,884,064 66,621,879Barrick Gold Corp. . . . . . . . . . . . . . . . . . . . . . . . . . . . . . . . . . . Canada 298,200 10,955,868The Dow Chemical Co. . . . . . . . . . . . . . . . . . . . . . . . . . . . . . . . United States 7,181,222 228,219,235
305,796,982
Telecommunication Services 2.7%AT&T Inc. . . . . . . . . . . . . . . . . . . . . . . . . . . . . . . . . . . . . . . . . United States 30,000,000 837,600,000Verizon Communications Inc. . . . . . . . . . . . . . . . . . . . . . . . . . . United States 11,000,000 352,990,000Vodafone Group PLC . . . . . . . . . . . . . . . . . . . . . . . . . . . . . . . . . United Kingdom 30,000,000 66,245,455
1,256,835,455
Utilities 18.2%aAGL Resources Inc. . . . . . . . . . . . . . . . . . . . . . . . . . . . . . . . . . United States 4,000,000 125,520,000aAmeren Corp. . . . . . . . . . . . . . . . . . . . . . . . . . . . . . . . . . . . . . . United States 12,500,000 487,875,000American Electric Power Co. Inc. . . . . . . . . . . . . . . . . . . . . . . . . United States 8,633,800 319,709,614Atmos Energy Corp. . . . . . . . . . . . . . . . . . . . . . . . . . . . . . . . . . United States 4,000,000 106,480,000CenterPoint Energy Inc. . . . . . . . . . . . . . . . . . . . . . . . . . . . . . . United States 6,000,000 87,420,000Consolidated Edison Inc. . . . . . . . . . . . . . . . . . . . . . . . . . . . . . United States 12,000,000 515,520,000

Franklin Custodian FundsStatement of Investments, September 30, 2008 (continued)
82 | Annual Report
Franklin Income Fund Country Shares Value
Common Stocks (continued)Utilities (continued)Dominion Resources Inc. . . . . . . . . . . . . . . . . . . . . . . . . . . . . . United States 18,000,000 $ 770,040,000DTE Energy Co. . . . . . . . . . . . . . . . . . . . . . . . . . . . . . . . . . . . . United States 5,270,400 211,448,448Duke Energy Corp. . . . . . . . . . . . . . . . . . . . . . . . . . . . . . . . . . . United States 35,000,000 610,050,000FirstEnergy Corp. . . . . . . . . . . . . . . . . . . . . . . . . . . . . . . . . . . . United States 9,000,000 602,910,000FPL Group Inc. . . . . . . . . . . . . . . . . . . . . . . . . . . . . . . . . . . . . United States 7,000,000 352,100,000Hawaiian Electric Industries Inc. . . . . . . . . . . . . . . . . . . . . . . . . United States 1,720,000 49,897,200NiSource Inc. . . . . . . . . . . . . . . . . . . . . . . . . . . . . . . . . . . . . . United States 4,500,000 66,420,000
aPG&E Corp. . . . . . . . . . . . . . . . . . . . . . . . . . . . . . . . . . . . . . . . United States 20,000,000 749,000,000aPinnacle West Capital Corp. . . . . . . . . . . . . . . . . . . . . . . . . . . . United States 5,500,000 189,255,000Portland General Electric Co. . . . . . . . . . . . . . . . . . . . . . . . . . . . United States 3,100,000 73,346,000Progress Energy Inc. . . . . . . . . . . . . . . . . . . . . . . . . . . . . . . . . . United States 9,000,000 388,170,000Public Service Enterprise Group Inc. . . . . . . . . . . . . . . . . . . . . . United States 20,000,000 655,800,000
aPuget Energy Inc. . . . . . . . . . . . . . . . . . . . . . . . . . . . . . . . . . . . United States 7,500,000 200,250,000Sempra Energy . . . . . . . . . . . . . . . . . . . . . . . . . . . . . . . . . . . . . United States 6,379,600 321,978,412The Southern Co. . . . . . . . . . . . . . . . . . . . . . . . . . . . . . . . . . . . United States 28,385,300 1,069,841,957TECO Energy Inc. . . . . . . . . . . . . . . . . . . . . . . . . . . . . . . . . . . . United States 9,500,000 149,435,000Xcel Energy Inc. . . . . . . . . . . . . . . . . . . . . . . . . . . . . . . . . . . . . United States 18,544,750 370,709,552
8,473,176,183
Total Common Stocks (Cost $15,704,888,054) . . . . . . . 16,842,487,833
Convertible Preferred Stocks 2.4%Consumer Discretionary 0.2%General Motors Corp., 6.25%, cvt. pfd. . . . . . . . . . . . . . . . . . . . United States 11,000,000 88,000,000
Financials 1.8%American International Group Inc., 8.50%, cvt. pfd. . . . . . . . . . . United States 5,200,000 44,668,000Bank of America Corp., 7.25%, cvt. pfd., L . . . . . . . . . . . . . . . . United States 399,000 334,362,000Citigroup Inc., 6.50%, cvt. pfd. . . . . . . . . . . . . . . . . . . . . . . . . . United States 3,800,000 155,800,000Fannie Mae, 5.375%, cvt. pfd. . . . . . . . . . . . . . . . . . . . . . . . . . United States 4,700 16,450,000Fannie Mae, 8.75%, cvt. pfd. . . . . . . . . . . . . . . . . . . . . . . . . . . United States 3,239,000 8,097,500Felcor Lodging Trust Inc., 7.80%, cvt. pfd., A . . . . . . . . . . . . . . . United States 3,000,000 36,750,000Legg Mason Inc., 7.00%, cvt. pfd. . . . . . . . . . . . . . . . . . . . . . . . United States 2,625,000 91,875,000Lehman Brothers Holdings Inc., 7.25%, cvt. pfd., P . . . . . . . . . . United States 1,000,650 1,000,650Lehman Brothers Holdings Inc., 8.75%, cvt. pfd., Q . . . . . . . . . . United States 550,000 275,000Wachovia Corp., 7.50%, cvt. pfd., L . . . . . . . . . . . . . . . . . . . . . . United States 300,000 115,500,000Washington Mutual Inc., 7.75%, cvt. pfd., R . . . . . . . . . . . . . . . United States 445,220 124,661
804,902,811
Health Care 0.2%Schering-Plough Corp., 6.00%, cvt. pfd. . . . . . . . . . . . . . . . . . . United States 500,000 86,506,813
Utilities 0.2%CMS Energy Trust I, 7.75%, cvt. pfd. . . . . . . . . . . . . . . . . . . . . . United States 1,711,000 76,315,049
Total Convertible Preferred Stocks (Cost $4,385,213,241) . . . . . . . . . . . . . . . . . . . . . . . . . . 1,055,724,673

Franklin Custodian FundsStatement of Investments, September 30, 2008 (continued)
Annual Report | 83
Franklin Income Fund Country Shares Value
Equity Linked Securities 2.1%Consumer Discretionary 0.7%Citigroup into Comcast Corp., 8.50% . . . . . . . . . . . . . . . . . . . . . United States 15,000,000 $ 291,343,500
bThe Goldman Sachs Group Inc. into Comcast Corp., 5.00%, 144A . . . . . . . . . . . . . . . . . . . . . . . . . . . . . . . . . . . . United States 2,800,000 52,468,747
343,812,247
Energy 0.3%bThe Goldman Sachs Group Inc. into XTO Energy Inc., 9.00%,
144A . . . . . . . . . . . . . . . . . . . . . . . . . . . . . . . . . . . . . . . . . . United States 3,825,000 151,408,762
Information Technology 0.5%bMorgan Stanley into Texas Instruments Inc., 7.50% 144A . . . . . . United States 10,900,000 246,659,370
Materials 0.6%bThe Goldman Sachs Group Inc. into Barrick Gold Corp., 10.00%,
144A . . . . . . . . . . . . . . . . . . . . . . . . . . . . . . . . . . . . . . . . . . United States 8,282,800 292,855,664
Total Equity Linked Securities (Cost $1,253,289,737) . . . . . . . . . . . . . . . . . . . . . . . . . . 1,034,736,043
Preferred Stocks 0.2%Financials 0.2%Fannie Mae, 6.75%, pfd. . . . . . . . . . . . . . . . . . . . . . . . . . . . . . United States 3,000,000 5,400,000Fannie Mae, 7.625%, pfd., R . . . . . . . . . . . . . . . . . . . . . . . . . . United States 2,399,400 4,318,920Fannie Mae, 8.25%, pfd. . . . . . . . . . . . . . . . . . . . . . . . . . . . . . United States 11,784,000 25,689,120Freddie Mac, 8.375%, pfd., Z . . . . . . . . . . . . . . . . . . . . . . . . . . United States 16,608,000 27,071,040
Total Preferred Stocks (Cost $833,682,537) . . . . . . . . . 62,479,080
Principal Amountc
d,eSenior Floating Rate Interests 4.7%Consumer Discretionary 1.4%Clear Channel Communications Inc., Term Loan B, 7.359%, 11/13/15 . . . . . . . . . . . . . . . . . . . . . . . . . . . . . . . . . . . . . . . United States 635,000,000 521,228,955
Idearc Inc.,fTerm Loan A, 5.50%, 11/17/13 . . . . . . . . . . . . . . . . . . . . . . United States 45,000,000 28,718,250Term Loan B, 5.71% - 5.77%, 11/17/14 . . . . . . . . . . . . . . . . United States 24,936,548 14,213,833
Jarden Corp., Term Loan B-3, 6.262%, 1/24/12 . . . . . . . . . . . . . United States 123,437,661 111,865,380
676,026,418
Health Care 0.1%Bausch and Lomb Inc.,
gDelayed Draw Term Loan, 7.012%, 4/28/15 . . . . . . . . . . . . . . United States 5,268,000 4,903,628Parent Term Loan B, 7.012%, 4/28/15 . . . . . . . . . . . . . . . . . United States 34,856,600 32,445,673
37,349,301
Industrials 0.5%Allison Transmission Inc., Term Loan B, 5.22% - 5.57%, 8/07/14 . . . . . . . . . . . . . . . . . . . . . . . . . . . . . . . . . . . . . . . . United States 160,786,341 133,624,865
U.S. Investigations Services Inc., Term Loan B, 5.954%, 2/21/15 . . . . . . . . . . . . . . . . . . . . . . . . . . . . . . . . . . . . . . . . United States 108,897,243 95,012,845
228,637,710
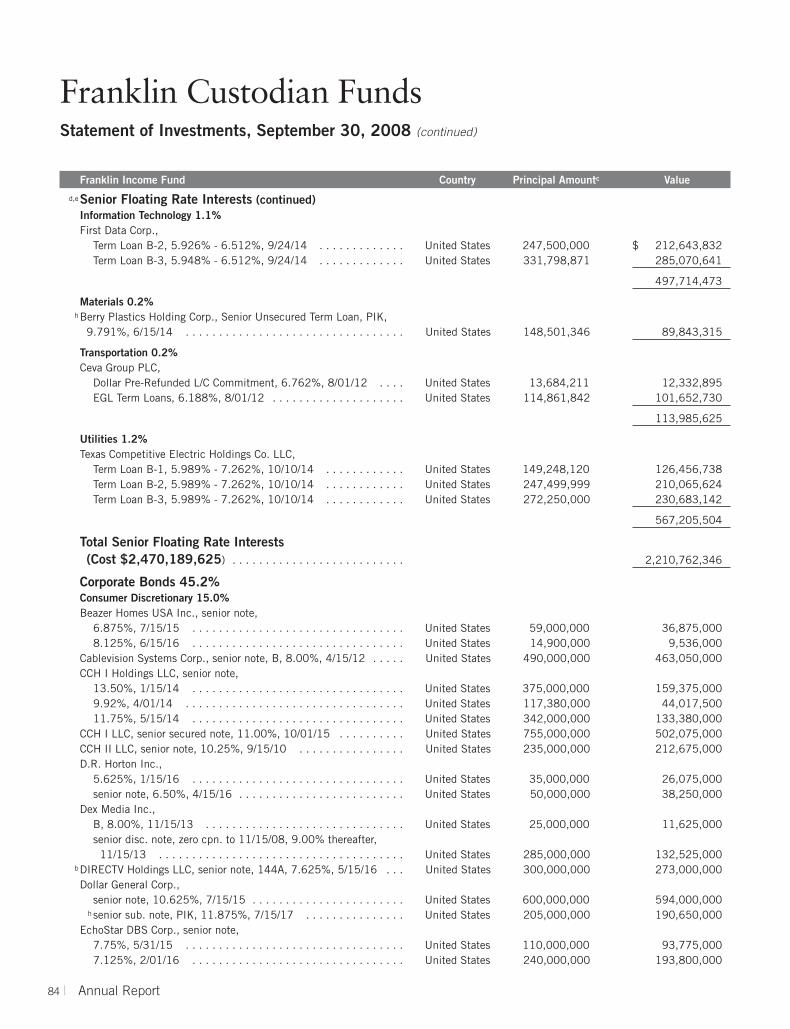
Franklin Custodian FundsStatement of Investments, September 30, 2008 (continued)
84 | Annual Report
Franklin Income Fund Country Principal Amountc Value
d,eSenior Floating Rate Interests (continued)Information Technology 1.1%First Data Corp.,
Term Loan B-2, 5.926% - 6.512%, 9/24/14 . . . . . . . . . . . . . United States 247,500,000 $ 212,643,832Term Loan B-3, 5.948% - 6.512%, 9/24/14 . . . . . . . . . . . . . United States 331,798,871 285,070,641
497,714,473
Materials 0.2%hBerry Plastics Holding Corp., Senior Unsecured Term Loan, PIK,
9.791%, 6/15/14 . . . . . . . . . . . . . . . . . . . . . . . . . . . . . . . . . United States 148,501,346 89,843,315
Transportation 0.2%Ceva Group PLC,
Dollar Pre-Refunded L/C Commitment, 6.762%, 8/01/12 . . . . United States 13,684,211 12,332,895EGL Term Loans, 6.188%, 8/01/12 . . . . . . . . . . . . . . . . . . . . United States 114,861,842 101,652,730
113,985,625
Utilities 1.2%Texas Competitive Electric Holdings Co. LLC,
Term Loan B-1, 5.989% - 7.262%, 10/10/14 . . . . . . . . . . . . United States 149,248,120 126,456,738Term Loan B-2, 5.989% - 7.262%, 10/10/14 . . . . . . . . . . . . United States 247,499,999 210,065,624Term Loan B-3, 5.989% - 7.262%, 10/10/14 . . . . . . . . . . . . United States 272,250,000 230,683,142
567,205,504
Total Senior Floating Rate Interests (Cost $2,470,189,625) . . . . . . . . . . . . . . . . . . . . . . . . . . 2,210,762,346
Corporate Bonds 45.2%Consumer Discretionary 15.0%Beazer Homes USA Inc., senior note,
6.875%, 7/15/15 . . . . . . . . . . . . . . . . . . . . . . . . . . . . . . . . United States 59,000,000 36,875,0008.125%, 6/15/16 . . . . . . . . . . . . . . . . . . . . . . . . . . . . . . . . United States 14,900,000 9,536,000
Cablevision Systems Corp., senior note, B, 8.00%, 4/15/12 . . . . . United States 490,000,000 463,050,000CCH I Holdings LLC, senior note,
13.50%, 1/15/14 . . . . . . . . . . . . . . . . . . . . . . . . . . . . . . . . United States 375,000,000 159,375,0009.92%, 4/01/14 . . . . . . . . . . . . . . . . . . . . . . . . . . . . . . . . . United States 117,380,000 44,017,50011.75%, 5/15/14 . . . . . . . . . . . . . . . . . . . . . . . . . . . . . . . . United States 342,000,000 133,380,000
CCH I LLC, senior secured note, 11.00%, 10/01/15 . . . . . . . . . . United States 755,000,000 502,075,000CCH II LLC, senior note, 10.25%, 9/15/10 . . . . . . . . . . . . . . . . United States 235,000,000 212,675,000D.R. Horton Inc.,
5.625%, 1/15/16 . . . . . . . . . . . . . . . . . . . . . . . . . . . . . . . . United States 35,000,000 26,075,000senior note, 6.50%, 4/15/16 . . . . . . . . . . . . . . . . . . . . . . . . . United States 50,000,000 38,250,000
Dex Media Inc.,B, 8.00%, 11/15/13 . . . . . . . . . . . . . . . . . . . . . . . . . . . . . . United States 25,000,000 11,625,000senior disc. note, zero cpn. to 11/15/08, 9.00% thereafter,
11/15/13 . . . . . . . . . . . . . . . . . . . . . . . . . . . . . . . . . . . . . United States 285,000,000 132,525,000bDIRECTV Holdings LLC, senior note, 144A, 7.625%, 5/15/16 . . . United States 300,000,000 273,000,000Dollar General Corp.,
senior note, 10.625%, 7/15/15 . . . . . . . . . . . . . . . . . . . . . . . United States 600,000,000 594,000,000hsenior sub. note, PIK, 11.875%, 7/15/17 . . . . . . . . . . . . . . . United States 205,000,000 190,650,000
EchoStar DBS Corp., senior note,7.75%, 5/31/15 . . . . . . . . . . . . . . . . . . . . . . . . . . . . . . . . . United States 110,000,000 93,775,0007.125%, 2/01/16 . . . . . . . . . . . . . . . . . . . . . . . . . . . . . . . . United States 240,000,000 193,800,000

Franklin Custodian FundsStatement of Investments, September 30, 2008 (continued)
Annual Report | 85
Franklin Income Fund Country Principal Amountc Value
Corporate Bonds (continued)Consumer Discretionary (continued)Ford Motor Co., 7.45%, 7/16/31 . . . . . . . . . . . . . . . . . . . . . . . . United States 600,000,000 $ 261,000,000Ford Motor Credit Co. LLC,
7.375%, 10/28/09 . . . . . . . . . . . . . . . . . . . . . . . . . . . . . . . United States 840,000,000 675,494,4007.875%, 6/15/10 . . . . . . . . . . . . . . . . . . . . . . . . . . . . . . . . United States 550,000,000 420,039,9507.375%, 2/01/11 . . . . . . . . . . . . . . . . . . . . . . . . . . . . . . . . United States 450,000,000 299,214,0007.00%, 10/01/13 . . . . . . . . . . . . . . . . . . . . . . . . . . . . . . . . United States 100,000,000 61,512,700senior note, 9.75%, 9/15/10 . . . . . . . . . . . . . . . . . . . . . . . . . United States 145,000,000 104,033,875senior note, 9.875%, 8/10/11 . . . . . . . . . . . . . . . . . . . . . . . . United States 75,000,000 51,814,350senior note, 7.25%, 10/25/11 . . . . . . . . . . . . . . . . . . . . . . . . United States 155,000,000 98,729,885
General Motors Corp., senior deb., 8.375%, 7/15/33 . . . . . . . . . United States 510,000,000 206,550,000Host Hotels & Resorts LP, senior note,
6.875%, 11/01/14 . . . . . . . . . . . . . . . . . . . . . . . . . . . . . . . United States 80,600,000 70,122,000O, 6.375%, 3/15/15 . . . . . . . . . . . . . . . . . . . . . . . . . . . . . . United States 219,000,000 179,032,500Q, 6.75%, 6/01/16 . . . . . . . . . . . . . . . . . . . . . . . . . . . . . . . United States 165,000,000 135,712,500
K. Hovnanian Enterprises Inc., senior note, 7.50%, 5/15/16 . . . . United States 30,100,000 17,608,500KB Home, senior note,
6.375%, 8/15/11 . . . . . . . . . . . . . . . . . . . . . . . . . . . . . . . . United States 40,000,000 36,400,0005.75%, 2/01/14 . . . . . . . . . . . . . . . . . . . . . . . . . . . . . . . . . United States 75,000,000 60,750,0006.25%, 6/15/15 . . . . . . . . . . . . . . . . . . . . . . . . . . . . . . . . . United States 90,000,000 73,800,0007.25%, 6/15/18 . . . . . . . . . . . . . . . . . . . . . . . . . . . . . . . . . United States 70,500,000 58,162,500
Liberty Media Corp., senior note, 5.70%, 5/15/13 . . . . . . . . . . . United States 130,400,000 109,095,509MGM MIRAGE, senior note,
6.75%, 4/01/13 . . . . . . . . . . . . . . . . . . . . . . . . . . . . . . . . . United States 70,000,000 54,950,0006.625%, 7/15/15 . . . . . . . . . . . . . . . . . . . . . . . . . . . . . . . . United States 120,000,000 84,000,0007.625%, 1/15/17 . . . . . . . . . . . . . . . . . . . . . . . . . . . . . . . . United States 250,000,000 181,250,000
R.H. Donnelley Corp.,senior disc. note, A-1, 6.875%, 1/15/13 . . . . . . . . . . . . . . . . United States 127,000,000 50,165,000senior disc. note, A-2, 6.875%, 1/15/13 . . . . . . . . . . . . . . . . United States 195,000,000 77,025,000senior note, 6.875%, 1/15/13 . . . . . . . . . . . . . . . . . . . . . . . . United States 55,000,000 21,725,000senior note, 8.875%, 10/15/17 . . . . . . . . . . . . . . . . . . . . . . . United States 501,500,000 173,017,500senior note, A-3, 8.875%, 1/15/16 . . . . . . . . . . . . . . . . . . . . United States 193,100,000 66,619,500
b,hUnivision Communications Inc., senior note, 144A, PIK, 9.75%, 3/15/15 . . . . . . . . . . . . . . . . . . . . . . . . . . . . . . . . . . United States 357,000,000 167,790,000
Visant Holding Corp., senior note, 8.75%, 12/01/13 . . . . . . . . . . United States 50,000,000 46,125,000
6,956,423,169
Consumer Staples 0.0%i
Dole Food Co. Inc., senior note, 8.625%, 5/01/09 . . . . . . . . . . . United States 3,050,000 2,928,000
Energy 5.1%Callon Petroleum Co., senior note, 9.75%, 12/08/10 . . . . . . . . . United States 110,000,000 103,400,000Chesapeake Energy Corp., senior note,
6.50%, 8/15/17 . . . . . . . . . . . . . . . . . . . . . . . . . . . . . . . . . United States 150,400,000 132,352,0006.25%, 1/15/18 . . . . . . . . . . . . . . . . . . . . . . . . . . . . . . . . . United States 150,000,000 129,000,0007.25%, 12/15/18 . . . . . . . . . . . . . . . . . . . . . . . . . . . . . . . . United States 160,000,000 148,000,0006.875%, 11/15/20 . . . . . . . . . . . . . . . . . . . . . . . . . . . . . . . United States 135,000,000 116,100,000
El Paso Corp., senior note, MTN, 7.75%, 1/15/32 . . . . . . . . . . . United States 250,000,000 210,065,250El Paso Natural Gas Co., senior note, 7.25%, 4/01/18 . . . . . . . . United States 50,000,000 46,750,000

Franklin Custodian FundsStatement of Investments, September 30, 2008 (continued)
86 | Annual Report
Franklin Income Fund Country Principal Amountc Value
Corporate Bonds (continued)Energy (continued)Mariner Energy Inc., senior note,
7.50%, 4/15/13 . . . . . . . . . . . . . . . . . . . . . . . . . . . . . . . . . United States 45,000,000 $ 40,050,0008.00%, 5/15/17 . . . . . . . . . . . . . . . . . . . . . . . . . . . . . . . . . United States 25,000,000 21,250,000
Nalco Finance Holdings, senior note, zero cpn. to 8/01/09, 9.00% thereafter, 2/01/14 . . . . . . . . . . . . . . . . . . . . . . . . . . . United States 380,000,000 336,300,000
Newfield Exploration Co., senior sub. note, 6.625%, 4/15/16 . . . United States 115,000,000 102,925,000OPTI Canada Inc., senior note, 7.875%, 12/15/14 . . . . . . . . . . . Canada 140,000,000 124,600,000Petrohawk Energy Corp., senior note,
9.125%, 7/15/13 . . . . . . . . . . . . . . . . . . . . . . . . . . . . . . . . United States 50,000,000 47,250,000b144A, 7.875%, 6/01/15 . . . . . . . . . . . . . . . . . . . . . . . . . . . United States 73,500,000 64,312,500
bPetroplus Finance Ltd., senior note, 144A, 6.75%, 5/01/14 . . . . Switzerland 22,000,000 18,700,000Pioneer Natural Resources Co., senior bond, 6.875%, 5/01/18 . . . United States 110,000,000 98,424,150Plains Exploration & Production Co., senior note, 7.75%, 6/15/15 . . . . . . . . . . . . . . . . . . . . . . . . . . . . . . . . . . . . . . . . . United States 75,000,000 69,375,000
Sabine Pass LNG LP, senior secured note,7.25%, 11/30/13 . . . . . . . . . . . . . . . . . . . . . . . . . . . . . . . . United States 95,000,000 75,525,0007.50%, 11/30/16 . . . . . . . . . . . . . . . . . . . . . . . . . . . . . . . . United States 390,000,000 306,150,000
Sesi LLC, senior note, 6.875%, 6/01/14 . . . . . . . . . . . . . . . . . . United States 110,000,000 96,250,000bW&T Offshore Inc., senior note, 144A, 8.25%, 6/15/14 . . . . . . . United States 100,000,000 80,500,000
2,367,278,900
Financials 5.5%American Express Co., senior note, 7.00%, 3/19/18 . . . . . . . . . . United States 90,000,000 79,563,330American Express Credit Corp., C, 7.30%, 8/20/13 . . . . . . . . . . . United States 150,000,000 144,824,250
bAmerican International Group Inc.,144A, 8.25%, 8/15/18 . . . . . . . . . . . . . . . . . . . . . . . . . . . . United States 175,000,000 101,808,875
d junior sub. deb., 144A, FRN, 8.175%, 5/15/58 . . . . . . . . . . . United States 600,000,000 96,133,800jBank of America Corp., pfd., sub. bond, M, 8.125%, Perpetual . . . United States 25,000,000 20,229,750GMAC LLC,
5.625%, 5/15/09 . . . . . . . . . . . . . . . . . . . . . . . . . . . . . . . . United States 235,000,000 167,931,9407.75%, 1/19/10 . . . . . . . . . . . . . . . . . . . . . . . . . . . . . . . . . United States 600,000,000 359,368,2007.25%, 3/02/11 . . . . . . . . . . . . . . . . . . . . . . . . . . . . . . . . . United States 225,000,000 106,487,1006.875%, 9/15/11 . . . . . . . . . . . . . . . . . . . . . . . . . . . . . . . . United States 800,000,000 357,497,6006.875%, 8/28/12 . . . . . . . . . . . . . . . . . . . . . . . . . . . . . . . . United States 300,400,000 119,488,6066.75%, 12/01/14 . . . . . . . . . . . . . . . . . . . . . . . . . . . . . . . . United States 125,000,000 48,025,625
iStar Financial Inc.,8.625%, 6/01/13 . . . . . . . . . . . . . . . . . . . . . . . . . . . . . . . . United States 160,000,000 83,265,920senior note, 5.95%, 10/15/13 . . . . . . . . . . . . . . . . . . . . . . . . United States 20,000,000 10,409,660
jJPMorgan Chase & Co., junior sub. note, 1, 7.90%, perpetual . . . United States 405,000,000 341,873,055kLehman Brothers Holdings Inc., senior note,
7.50%, 12/03/08 . . . . . . . . . . . . . . . . . . . . . . . . . . . . . . . . United States 400,000,000 35,860,0007.50%, 1/21/09 . . . . . . . . . . . . . . . . . . . . . . . . . . . . . . . . . United States 900,000,000 51,030,0006.20%, 9/26/14 . . . . . . . . . . . . . . . . . . . . . . . . . . . . . . . . . United States 326,000,000 42,380,0006.875%, 5/02/18 . . . . . . . . . . . . . . . . . . . . . . . . . . . . . . . . United States 104,900,000 13,637,0007.00%, 9/27/27 . . . . . . . . . . . . . . . . . . . . . . . . . . . . . . . . . United States 100,000,000 13,000,000
b,dLiberty Mutual Group, junior sub. note, 144A, FRN, 10.75%, 6/15/88 . . . . . . . . . . . . . . . . . . . . . . . . . . . . . . . . . . . . . . . . . United States 100,000,000 72,120,700
Merrill Lynch & Co. Inc., 6.875%, 4/25/18 . . . . . . . . . . . . . . . . United States 48,000,000 42,539,184bResidential Capital LLC, junior note, 144A, 9.625%, 5/15/15 . . . United States 49,429,000 12,110,105

Franklin Custodian FundsStatement of Investments, September 30, 2008 (continued)
Annual Report | 87
Franklin Income Fund Country Principal Amountc Value
Corporate Bonds (continued)Financials (continued)
jWells Fargo Capital XIII, pfd., 7.70%, Perpetual . . . . . . . . . . . . . United States 44,500,000 $ 38,835,150jWells Fargo Capital XV, 9.75%, Perpetual . . . . . . . . . . . . . . . . . . United States 210,000,000 203,895,930
2,562,315,780
Health Care 5.2%Community Health Systems Inc., senior sub. note, 8.875%, 7/15/15 . . . . . . . . . . . . . . . . . . . . . . . . . . . . . . . . . . . . . . . . United States 370,000,000 353,350,000
DaVita Inc.,senior note, 6.625%, 3/15/13 . . . . . . . . . . . . . . . . . . . . . . . . United States 140,000,000 133,700,000senior sub. note, 7.25%, 3/15/15 . . . . . . . . . . . . . . . . . . . . . United States 80,000,000 76,400,000
HCA Inc.,6.375%, 1/15/15 . . . . . . . . . . . . . . . . . . . . . . . . . . . . . . . . United States 125,000,000 99,062,500senior note, 6.50%, 2/15/16 . . . . . . . . . . . . . . . . . . . . . . . . . United States 150,000,000 119,625,000senior secured note, 9.25%, 11/15/16 . . . . . . . . . . . . . . . . . United States 132,900,000 129,577,500
Tenet Healthcare Corp., senior note,6.375%, 12/01/11 . . . . . . . . . . . . . . . . . . . . . . . . . . . . . . . United States 540,000,000 500,850,0006.50%, 6/01/12 . . . . . . . . . . . . . . . . . . . . . . . . . . . . . . . . . United States 265,000,000 246,450,0007.375%, 2/01/13 . . . . . . . . . . . . . . . . . . . . . . . . . . . . . . . . United States 380,000,000 347,700,000
dFRN, 9.25%, 2/01/15 . . . . . . . . . . . . . . . . . . . . . . . . . . . . . United States 330,000,000 313,500,000d,hU.S. Oncology Holdings Inc., senior note, PIK, FRN, 8.334%,
3/15/12 . . . . . . . . . . . . . . . . . . . . . . . . . . . . . . . . . . . . . . . . United States 75,232,814 58,305,431Vanguard Health Holding Co. I LLC, senior disc. note, zero cpn. to 10/01/09, 11.25% thereafter, 10/01/15 . . . . . . . . . . . . . . . . . United States 23,900,000 20,793,000
2,399,313,431
Industrials 3.7%Allied Waste North America Inc.,
senior note, B, 7.375%, 4/15/14 . . . . . . . . . . . . . . . . . . . . . United States 190,000,000 185,725,000senior note, B, 7.125%, 5/15/16 . . . . . . . . . . . . . . . . . . . . . United States 79,000,000 74,062,500senior secured note, 6.125%, 2/15/14 . . . . . . . . . . . . . . . . . United States 205,000,000 189,625,000senior secured note, 6.875%, 6/01/17 . . . . . . . . . . . . . . . . . United States 106,450,000 99,530,750
Browning-Ferris Industries Inc., 7.40%, 9/15/35 . . . . . . . . . . . . United States 100,000,000 88,500,000Hertz Corp.,
senior note, 8.875%, 1/01/14 . . . . . . . . . . . . . . . . . . . . . . . . United States 290,300,000 251,835,250senior sub. note, 10.50%, 1/01/16 . . . . . . . . . . . . . . . . . . . . United States 25,000,000 21,000,000
JohnsonDiversey Holdings Inc., senior disc. note, 10.67%, 5/15/13 . . . . . . . . . . . . . . . . . . . . . . . . . . . . . . . . . . . . . . . . United States 158,000,000 154,050,000
JohnsonDiversey Inc., senior sub. note, B, 9.625%, 5/15/12 . . . . United States 125,000,000 125,312,500L-3 Communications Corp., senior sub. note, 5.875%, 1/15/15 . . . United States 15,600,000 14,196,000
bNortek Inc., senior note, 144A, 10.00%, 12/01/13 . . . . . . . . . . . United States 100,000,000 88,500,000RBS Global & Rexnord Corp.,
senior note, 9.50%, 8/01/14 . . . . . . . . . . . . . . . . . . . . . . . . . United States 85,000,000 80,325,000senior sub. note, 11.75%, 8/01/16 . . . . . . . . . . . . . . . . . . . . United States 83,200,000 79,040,000
b,d,hRexnord Holdings Inc., senior note, 144A, PIK, FRN, 9.81%, 3/01/13 . . . . . . . . . . . . . . . . . . . . . . . . . . . . . . . . . . . . . . . . United States 89,220,363 68,699,679
Terex Corp., senior sub. note, 8.00%, 11/15/17 . . . . . . . . . . . . . United States 185,000,000 169,275,000bU.S. Investigations Services Inc., senior note, 144A, 10.50%,
11/01/15 . . . . . . . . . . . . . . . . . . . . . . . . . . . . . . . . . . . . . . . United States 50,000,000 44,750,000
1,734,426,679

Franklin Custodian FundsStatement of Investments, September 30, 2008 (continued)
88 | Annual Report
Franklin Income Fund Country Principal Amountc Value
Corporate Bonds (continued)Information Technology 3.7%
bCeridian Corp., senior note, 144A, 11.25%, 11/15/15 . . . . . . . . United States 80,000,000 $ 66,200,000bFirst Data Corp., senior note, 144A, 9.875%, 9/24/15 . . . . . . . . United States 275,000,000 216,218,750Fiserv Inc., senior note, 6.80%, 11/20/17 . . . . . . . . . . . . . . . . . United States 50,000,000 48,332,850Flextronics International Ltd., senior sub. note, 6.25%, 11/15/14 . . . . . . . . . . . . . . . . . . . . . . . . . . . . . . . . . . . . . . . Singapore 100,000,000 85,000,000
Freescale Semiconductor Inc., senior note,8.875%, 12/15/14 . . . . . . . . . . . . . . . . . . . . . . . . . . . . . . . United States 437,400,000 303,993,000
l 10.125%, 12/15/16 . . . . . . . . . . . . . . . . . . . . . . . . . . . . . . United States 630,000,000 406,350,000Lucent Technologies Inc., 6.45%, 3/15/29 . . . . . . . . . . . . . . . . . United States 180,000,000 110,700,000
bNortel Networks Ltd., senior note, 144A, 10.75%, 7/15/16 . . . . . Canada 77,100,000 47,609,250NXP BV/NXP Funding LLC, senior note, 9.50%, 10/15/15 . . . . . . Netherlands 50,000,000 25,875,000Qwest Capital Funding Inc., 7.25%, 2/15/11 . . . . . . . . . . . . . . . United States 26,600,000 25,004,000Sanmina-SCI Corp., senior sub. note,
6.75%, 3/01/13 . . . . . . . . . . . . . . . . . . . . . . . . . . . . . . . . . United States 150,000,000 132,000,0008.125%, 3/01/16 . . . . . . . . . . . . . . . . . . . . . . . . . . . . . . . . United States 100,000,000 85,500,000
SunGard Data Systems Inc.,senior note, 9.125%, 8/15/13 . . . . . . . . . . . . . . . . . . . . . . . . United States 59,300,000 53,666,500
bsenior note, 144A, 10.625%, 5/15/15 . . . . . . . . . . . . . . . . . . United States 55,000,000 51,975,000senior sub. note, 10.25%, 8/15/15 . . . . . . . . . . . . . . . . . . . . United States 100,000,000 87,250,000
1,745,674,350
Materials 1.3%Freeport-McMoRan Copper & Gold Inc., senior note, 8.375%, 4/01/17 . . . . . . . . . . . . . . . . . . . . . . . . . . . . . . . . . . . . . . . . United States 75,000,000 73,985,325
bIneos Group Holdings PLC, senior sub. note, 144A, 7.875%, 2/15/16 . . . . . . . . . . . . . . . . . . . . . . . . . . . . . . . . . . . . . . . . United Kingdom 175,000,000 EUR 131,086,861
Jefferson Smurfit Corp., senior note, 8.25%, 10/01/12 . . . . . . . . United States 200,000,000 168,000,000Nalco Co., senior note, 7.75%, 11/15/11 . . . . . . . . . . . . . . . . . . United States 5,000,000 4,925,000Novelis Inc., senior note, 7.25%, 2/15/15 . . . . . . . . . . . . . . . . . Canada 190,000,000 166,250,000Stone Container Corp., senior note, 8.00%, 3/15/17 . . . . . . . . . . United States 68,000,000 53,380,000
597,627,186
Telecommunication Services 0.2%bDigicel Group Ltd., senior note, 144A, 8.875%, 1/15/15 . . . . . . Jamaica 140,000,000 117,950,000
Transportation 0.2%bCeva Group PLC, senior note, 144A, 10.00%, 9/01/14 . . . . . . . . United Kingdom 100,000,000 96,500,000
Utilities 5.3%Aquila Inc., senior note, 14.875%, 7/01/12 . . . . . . . . . . . . . . . . United States 43,450,000 48,106,406Dynegy Holdings Inc., senior note,
6.875%, 4/01/11 . . . . . . . . . . . . . . . . . . . . . . . . . . . . . . . . United States 300,000,000 274,500,0008.75%, 2/15/12 . . . . . . . . . . . . . . . . . . . . . . . . . . . . . . . . . United States 275,000,000 261,250,0008.375%, 5/01/16 . . . . . . . . . . . . . . . . . . . . . . . . . . . . . . . . United States 210,000,000 183,750,0007.75%, 6/01/19 . . . . . . . . . . . . . . . . . . . . . . . . . . . . . . . . . United States 90,000,000 72,450,000
Energy Future Holdings Corp., senior note,b144A, 10.875%, 11/01/17 . . . . . . . . . . . . . . . . . . . . . . . . . United States 187,500,000 170,156,250
b,h144A, PIK, 11.25%, 11/01/17 . . . . . . . . . . . . . . . . . . . . . . . United States 243,700,000 207,145,000P, 5.55%, 11/15/14 . . . . . . . . . . . . . . . . . . . . . . . . . . . . . . . United States 300,000,000 225,269,100

Franklin Custodian FundsStatement of Investments, September 30, 2008 (continued)
Annual Report | 89
Franklin Income Fund Country Principal Amountc Value
Corporate Bonds (continued)Utilities (continued)
b Intergen NV, senior secured note, 144A, 9.00%, 6/30/17 . . . . . . Netherlands 80,000,000 $ 80,400,000PNM Resources Inc., senior note, 9.25%, 5/15/15 . . . . . . . . . . . United States 31,700,000 31,383,000Public Service Co. of New Mexico, senior note, 7.95%, 5/15/18 . . . . . . . . . . . . . . . . . . . . . . . . . . . . . . . . . . . . . . . . United States 52,400,000 49,509,092
Reliant Energy Inc., senior note,7.625%, 6/15/14 . . . . . . . . . . . . . . . . . . . . . . . . . . . . . . . . United States 150,000,000 113,250,0007.875%, 6/15/17 . . . . . . . . . . . . . . . . . . . . . . . . . . . . . . . . United States 153,100,000 114,059,500
bTexas Competitive Electric Holdings Co. LLC, senior note,144A, 10.25%, 11/01/15 . . . . . . . . . . . . . . . . . . . . . . . . . . United States 353,025,000 320,370,188
h144A, PIK, 10.50%, 11/01/16 . . . . . . . . . . . . . . . . . . . . . . . United States 150,000,000 127,875,000B, 144A, 10.25%, 11/01/15 . . . . . . . . . . . . . . . . . . . . . . . . United States 186,900,000 169,611,750
2,449,085,286
Total Corporate Bonds (Cost $27,891,660,955) . . . . . . 21,029,522,781
Convertible Bonds 0.9%Financials 0.3%
d iStar Financial Inc., cvt., senior note, FRN, 3.291%, 10/01/12 . . . . . . . . . . . . . . . . . . . . . . . . . . . . . . . . . . . . . . . United States 250,000,000 135,000,000
Health Care 0.2%bMylan Inc., 144A, cvt., 3.75%, 9/15/15 . . . . . . . . . . . . . . . . . . United States 80,000,000 79,000,000
Information Technology 0.4%bAdvanced Micro Devices Inc., cvt., senior note, 144A,
5.75%, 8/15/12 . . . . . . . . . . . . . . . . . . . . . . . . . . . . . . . . . . United States 325,000,000 186,875,000
Total Convertible Bonds (Cost $640,286,205) . . . . . . . . 400,875,000
Mortgage-Backed Securities 2.0%Federal Home Loan Mortgage Corp. (FHLMC) Fixed Rate 0.8%FHLMC Gold 30 Year, 5.00%, 5/01/33 - 8/01/34 . . . . . . . . . . . . United States 390,638,250 381,610,183
Federal National Mortgage Association (FNMA) Fixed Rate 0.8%FNMA 30 Year, 5.50%, 2/01/35 - 7/01/37 . . . . . . . . . . . . . . . . . United States 374,786,768 374,244,413
Government National Mortgage Association (GNMA) Fixed Rate 0.4%GNMA I SF 30 Year, 5.00%, 4/15/33 - 5/15/34 . . . . . . . . . . . . . United States 196,144,979 192,845,886
Total Mortgage-Backed Securities (Cost $942,876,169) . . . . . . . . . . . . . . . . . . . . . . . . . . . . 948,700,482
Total Investments before Short Term Investments (Cost $54,122,086,523) . . . . . . . . . . . . . . . . . . . . . . . . . 43,585,288,238
Short Term Investments 5.9%U.S. Government and Agency Securities (Cost $591,954,931) 1.2%
mFHLB, 10/01/08 - 10/09/08 . . . . . . . . . . . . . . . . . . . . . . . . . . . United States 592,068,000 592,048,992
Total Investments before Money Market Funds and Repurchase Agreements (Cost $54,714,041,454) . . . . . . . . 44,177,337,230

Franklin Custodian FundsStatement of Investments, September 30, 2008 (continued)
90 | The accompanying notes are an integral part of these financial statements. | Annual Report
Franklin Income Fund Country Shares Value
Short Term Investments (continued)Money Market Funds (Cost $268,661,516) 0.6%
nFranklin Institutional Fiduciary Trust Money Market Portfolio, 1.98% . . . . . . . . . . . . . . . . . . . . . . . . . . . . . . . . . . . . . . . . . United States 268,661,516 $ 268,661,516
Investments from Cash Collateral Received for Loaned Securities 0.1%Money Market Funds (Cost $29,080,893) 0.1%
oBank of New York Institutional Cash Reserve Fund, 2.18% . . . . . United States 29,080,893 28,790,084
Principal Amountc
Repurchase Agreements (Cost $1,864,985,975) 4.0%p Joint Repurchase Agreement, 1.347%, 10/01/08 . . . . . . . . . . . . 1,864,985,975 1,864,985,975
(Maturity Value $1,865,055,763)ABN AMRO Bank, NV, New York Branch
(Maturity Value $295,070,472)Banc of America Securities LLC (Maturity Value $230,147,881) Barclays Capital Inc. (Maturity Value $298,017,260) BNP Paribas Securities Corp. (Maturity Value $289,158,245) Credit Suisse Securities (USA) LLC (Maturity Value $59,010,364) Deutsche Bank Securities Inc. (Maturity Value $109,422,822) Dresdner Kleinwort Securities LLC (Maturity Value $221,307,518) Greenwich Capital Markets Inc. (Maturity Value $303,910,837) UBS Securities LLC (Maturity Value $59,010,364) Collateralized by U.S. Government Agency Securities, 2.20% - 7.25%, 11/07/08 - 4/24/13; mU.S. Government
Agency Discount Notes, 12/30/08 and U.S. Treasury Notes, 1.875 - 4.875%, 1/15/09 - 7/31/13
Total Investments (Cost $56,876,769,838) 99.6% . . . 46,339,774,805
Other Assets, less Liabilities 0.4% . . . . . . . . . . . . . . . . . . 167,580,506
Net Assets 100.0% . . . . . . . . . . . . . . . . . . . . . . . . . . . . . . . $46,507,355,311
See Currency and Selected Portfolio Abbreviations on page 106.
aSee Note 10 regarding holdings of 5% voting securities.bSecurity was purchased pursuant to Rule 144A under the Securities Act of 1933 and may be sold in transactions exempt from registration only to qualified institutional buyers or ina public offering registered under the Securities Act of 1933. These securities have been deemed liquid under guidelines approved by the Fund’s Board of Trustees. At September 30,2008, the aggregate value of these securities was $3,936,651,251, representing 8.46% of net assets.cThe principal amount is stated in U.S. dollars unless otherwise indicated.dThe coupon rate shown represents the rate at period end.eSee Note 1(g) regarding senior floating rate interests.fSecurity purchased on a delayed delivery basis. See Note 1(d).gSee Note 9 regarding unfunded loan commitments.hIncome may be received in additional securities and/or cash.iRounds to less than 0.1% of net assets.jPerpetual bond with no stated maturity date.kSee Note 8 regarding defaulted securities.lA portion or all of the security is on loan at September 30, 2008. See Note 1(f).mThe security is traded on a discount basis with no stated coupon rate.nSee Note 7 regarding investments in the Franklin Institutional Fiduciary Trust Money Market Portfolio. The rate shown is the annualized seven-day yield at period end.oThe rate shown is the annualized seven-day yield at period end.pSee Note 1(c) regarding joint repurchase agreements.

Franklin Custodian FundsFinancial Highlights
Annual Report | The accompanying notes are an integral part of these financial statements. | 91
Franklin U.S. Government Securities Fund
Year Ended September 30,Class A 2008 2007 2006 2005 2004
Per share operating performance(for a share outstanding throughout the year)
Net asset value, beginning of year . . . . . . . . . . . . . . . . . $6.39 $6.43 $6.53 $6.68 $6.81
Income from investment operationsa:
Net investment incomeb . . . . . . . . . . . . . . . . . . . . . . . . 0.30 0.31 0.30 0.28 0.27
Net realized and unrealized gains (losses) . . . . . . . . . . . 0.08 (0.02) (0.09) (0.11) (0.04)
Total from investment operations . . . . . . . . . . . . . . . . . . 0.38 0.29 0.21 0.17 0.23
Less distributions from net investment income . . . . . . . . (0.32) (0.33) (0.31) (0.32) (0.36)
Redemption feesc, d . . . . . . . . . . . . . . . . . . . . . . . . . . . . — — — — —
Net asset value, end of year . . . . . . . . . . . . . . . . . . . . . . $6.45 $6.39 $6.43 $6.53 $6.68
Total returne . . . . . . . . . . . . . . . . . . . . . . . . . . . . . . . . . 6.00% 4.63% 3.40% 2.67% 3.46%
Ratios to average net assets
Expensesf . . . . . . . . . . . . . . . . . . . . . . . . . . . . . . . . . . . 0.72% 0.72% 0.72% 0.72% 0.70%
Net investment income . . . . . . . . . . . . . . . . . . . . . . . . . 4.64% 4.78% 4.64% 4.29% 4.09%
Supplemental data
Net assets, end of year (000’s) . . . . . . . . . . . . . . . . . . . . $5,353,961 $5,073,449 $5,291,117 $5,901,449 $6,420,381
Portfolio turnover rate . . . . . . . . . . . . . . . . . . . . . . . . . . 21.66% 12.34% 20.54% 29.14% 41.45%
aThe amount shown for a share outstanding throughout the period may not correlate with the Statement of Operations for the period due to the timing of sales and repurchases ofthe Fund shares in relation to income earned and/or fluctuating market value of the investments of the Fund.bBased on average daily shares outstanding.cAmount rounds to less than $0.01 per share.dEffective September 1, 2008, the redemption fee was eliminated.eTotal return does not reflect sales commissions or contingent deferred sales charges, if applicable.fBenefit of expense reduction rounds to less than 0.01%.

Franklin Custodian FundsFinancial Highlights (continued)
92 | The accompanying notes are an integral part of these financial statements. | Annual Report
Franklin U.S. Government Securities Fund
Year Ended September 30,Class B 2008 2007 2006 2005 2004
Per share operating performance(for a share outstanding throughout the year)
Net asset value, beginning of year . . . . . . . . . . . . . . . . . . . . . . . . . $6.38 $6.42 $6.52 $6.67 $6.80
Income from investment operationsa:
Net investment incomeb . . . . . . . . . . . . . . . . . . . . . . . . . . . . . . . 0.27 0.27 0.26 0.25 0.24
Net realized and unrealized gains (losses) . . . . . . . . . . . . . . . . . . . 0.07 (0.01) (0.08) (0.11) (0.05)
Total from investment operations . . . . . . . . . . . . . . . . . . . . . . . . . . 0.34 0.26 0.18 0.14 0.19
Less distributions from net investment income . . . . . . . . . . . . . . . . (0.28) (0.30) (0.28) (0.29) (0.32)
Redemption feesc, d . . . . . . . . . . . . . . . . . . . . . . . . . . . . . . . . . . . . — — — — —
Net asset value, end of year . . . . . . . . . . . . . . . . . . . . . . . . . . . . . $6.44 $6.38 $6.42 $6.52 $6.67
Total returne . . . . . . . . . . . . . . . . . . . . . . . . . . . . . . . . . . . . . . . . . 5.61% 4.10% 2.87% 2.13% 2.92%
Ratios to average net assets
Expensesf . . . . . . . . . . . . . . . . . . . . . . . . . . . . . . . . . . . . . . . . . . 1.24% 1.25% 1.24% 1.25% 1.23%
Net investment income . . . . . . . . . . . . . . . . . . . . . . . . . . . . . . . . . 4.12% 4.25% 4.12% 3.76% 3.56%
Supplemental data
Net assets, end of year (000’s) . . . . . . . . . . . . . . . . . . . . . . . . . . . $284,649 $316,720 $388,807 $478,788 $568,276
Portfolio turnover rate . . . . . . . . . . . . . . . . . . . . . . . . . . . . . . . . . . 21.66% 12.34% 20.54% 29.14% 41.45%
aThe amount shown for a share outstanding throughout the period may not correlate with the Statement of Operations for the period due to the timing of sales and repurchases ofthe Fund shares in relation to income earned and/or fluctuating market value of the investments of the Fund.bBased on average daily shares outstanding.cAmount rounds to less than $0.01 per share.dEffective September 1, 2008, the redemption fee was eliminated.eTotal return does not reflect sales commissions or contingent deferred sales charges, if applicable.fBenefit of expense reduction rounds to less than 0.01%.

Franklin Custodian FundsFinancial Highlights (continued)
Annual Report | The accompanying notes are an integral part of these financial statements. | 93
Franklin U.S. Government Securities Fund
Year Ended September 30,Class C 2008 2007 2006 2005 2004
Per share operating performance(for a share outstanding throughout the year)
Net asset value, beginning of year . . . . . . . . . . . . . . . . . . . . . . . . . $6.36 $6.40 $6.50 $6.65 $6.78
Income from investment operationsa:
Net investment incomeb . . . . . . . . . . . . . . . . . . . . . . . . . . . . . . . 0.27 0.27 0.26 0.25 0.24
Net realized and unrealized gains (losses) . . . . . . . . . . . . . . . . . . . 0.07 (0.01) (0.08) (0.11) (0.05)
Total from investment operations . . . . . . . . . . . . . . . . . . . . . . . . . . 0.34 0.26 0.18 0.14 0.19
Less distributions from net investment income . . . . . . . . . . . . . . . . (0.28) (0.30) (0.28) (0.29) (0.32)
Redemption feesc, d . . . . . . . . . . . . . . . . . . . . . . . . . . . . . . . . . . . . — — — — —
Net asset value, end of year . . . . . . . . . . . . . . . . . . . . . . . . . . . . . $6.42 $6.36 $6.40 $6.50 $6.65
Total returne . . . . . . . . . . . . . . . . . . . . . . . . . . . . . . . . . . . . . . . . . 5.48% 4.12% 2.88% 2.14% 2.91%
Ratios to average net assets
Expensesf . . . . . . . . . . . . . . . . . . . . . . . . . . . . . . . . . . . . . . . . . . 1.24% 1.25% 1.23% 1.25% 1.23%
Net investment income . . . . . . . . . . . . . . . . . . . . . . . . . . . . . . . . . 4.12% 4.25% 4.13% 3.76% 3.56%
Supplemental data
Net assets, end of year (000’s) . . . . . . . . . . . . . . . . . . . . . . . . . . . $610,148 $418,951 $424,462 $508,539 $597,451
Portfolio turnover rate . . . . . . . . . . . . . . . . . . . . . . . . . . . . . . . . . . 21.66% 12.34% 20.54% 29.14% 41.45%
aThe amount shown for a share outstanding throughout the period may not correlate with the Statement of Operations for the period due to the timing of sales and repurchases ofthe Fund shares in relation to income earned and/or fluctuating market value of the investments of the Fund.bBased on average daily shares outstanding.cAmount rounds to less than $0.01 per share.dEffective September 1, 2008, the redemption fee was eliminated.eTotal return does not reflect sales commissions or contingent deferred sales charges, if applicable.fBenefit of expense reduction rounds to less than 0.01%.

Franklin Custodian FundsFinancial Highlights (continued)
94 | The accompanying notes are an integral part of these financial statements. | Annual Report
Franklin U.S. Government Securities Fund
Year Ended September 30,Class R 2008 2007 2006 2005 2004
Per share operating performance(for a share outstanding throughout the year)
Net asset value, beginning of year . . . . . . . . . . . . . . . . . . . . . . . . . . . . . $6.39 $6.43 $6.53 $6.68 $6.81
Income from investment operationsa:
Net investment incomeb . . . . . . . . . . . . . . . . . . . . . . . . . . . . . . . . . . . 0.28 0.28 0.27 0.26 0.25
Net realized and unrealized gains (losses) . . . . . . . . . . . . . . . . . . . . . . . 0.07 (0.01) (0.08) (0.11) (0.05)
Total from investment operations . . . . . . . . . . . . . . . . . . . . . . . . . . . . . . 0.35 0.27 0.19 0.15 0.20
Less distributions from net investment income . . . . . . . . . . . . . . . . . . . . (0.29) (0.31) (0.29) (0.30) (0.33)
Redemption feesc, d . . . . . . . . . . . . . . . . . . . . . . . . . . . . . . . . . . . . . . . — — — — —
Net asset value, end of year . . . . . . . . . . . . . . . . . . . . . . . . . . . . . . . . . $6.45 $6.39 $6.43 $6.53 $6.68
Total returne . . . . . . . . . . . . . . . . . . . . . . . . . . . . . . . . . . . . . . . . . . . . . 5.61% 4.25% 3.01% 2.29% 3.08%
Ratios to average net assets
Expensesf . . . . . . . . . . . . . . . . . . . . . . . . . . . . . . . . . . . . . . . . . . . . . . 1.09% 1.10% 1.09% 1.10% 1.08%
Net investment income . . . . . . . . . . . . . . . . . . . . . . . . . . . . . . . . . . . . . 4.27% 4.40% 4.27% 3.91% 3.71%
Supplemental data
Net assets, end of year (000’s) . . . . . . . . . . . . . . . . . . . . . . . . . . . . . . . $104,648 $74,537 $71,104 $65,790 $59,431
Portfolio turnover rate . . . . . . . . . . . . . . . . . . . . . . . . . . . . . . . . . . . . . . 21.66% 12.34% 20.54% 29.14% 41.45%
aThe amount shown for a share outstanding throughout the period may not correlate with the Statement of Operations for the period due to the timing of sales and repurchases ofthe Fund shares in relation to income earned and/or fluctuating market value of the investments of the Fund.bBased on average daily shares outstanding.cAmount rounds to less than $0.01 per share.dEffective September 1, 2008, the redemption fee was eliminated.eTotal return does not reflect sales commissions or contingent deferred sales charges, if applicable.fBenefit of expense reduction rounds to less than 0.01%.

Franklin Custodian FundsFinancial Highlights (continued)
Annual Report | The accompanying notes are an integral part of these financial statements. | 95
Franklin U.S. Government Securities Fund
Year Ended September 30,Advisor Class 2008 2007 2006 2005 2004
Per share operating performance(for a share outstanding throughout the year)
Net asset value, beginning of year . . . . . . . . . . . . . . . . . . . . . . . . . . $6.41 $6.45 $6.55 $6.69 $6.83
Income from investment operationsa:
Net investment incomeb . . . . . . . . . . . . . . . . . . . . . . . . . . . . . . . . 0.31 0.31 0.31 0.29 0.28
Net realized and unrealized gains (losses) . . . . . . . . . . . . . . . . . . . 0.08 (0.01) (0.09) (0.10) (0.06)
Total from investment operations . . . . . . . . . . . . . . . . . . . . . . . . . . 0.39 0.30 0.22 0.19 0.22
Less distributions from net investment income . . . . . . . . . . . . . . . . . (0.33) (0.34) (0.32) (0.33) (0.36)
Redemption feesc, d . . . . . . . . . . . . . . . . . . . . . . . . . . . . . . . . . . . . — — — — —
Net asset value, end of year . . . . . . . . . . . . . . . . . . . . . . . . . . . . . . $6.47 $6.41 $6.45 $6.55 $6.69
Total return . . . . . . . . . . . . . . . . . . . . . . . . . . . . . . . . . . . . . . . . . . 6.11% 4.75% 3.53% 2.95% 3.42%
Ratios to average net assets
Expensese . . . . . . . . . . . . . . . . . . . . . . . . . . . . . . . . . . . . . . . . . . . 0.59% 0.60% 0.59% 0.60% 0.58%
Net investment income . . . . . . . . . . . . . . . . . . . . . . . . . . . . . . . . . 4.77% 4.90% 4.77% 4.41% 4.21%
Supplemental data
Net assets, end of year (000’s) . . . . . . . . . . . . . . . . . . . . . . . . . . . . $612,026 $470,751 $387,239 $334,681 $340,279
Portfolio turnover rate . . . . . . . . . . . . . . . . . . . . . . . . . . . . . . . . . . 21.66% 12.34% 20.54% 29.14% 41.45%
aThe amount shown for a share outstanding throughout the period may not correlate with the Statement of Operations for the period due to the timing of sales and repurchases ofthe Fund shares in relation to income earned and/or fluctuating market value of the investments of the Fund.bBased on average daily shares outstanding.cAmount rounds to less than $0.01 per share.dEffective September 1, 2008, the redemption fee was eliminated.eBenefit of expense reduction rounds to less than 0.01%.

Franklin Custodian FundsStatement of Investments, September 30, 2008
96 | Annual Report
Franklin U.S. Government Securities Fund Principal Amount Value
Mortgage-Backed Securities 94.0%Government National Mortgage Association (GNMA) Fixed Rate 94.0%GNMA GP 30 Year, 8.25%, 3/15/17 - 10/15/17 . . . . . . . . . . . . . . . . . . . . . . . . . . . . . . . . $ 105,993 $ 115,723GNMA GP 30 Year, 9.25%, 5/15/16 - 12/15/16 . . . . . . . . . . . . . . . . . . . . . . . . . . . . . . . . 232,073 254,457GNMA GP 30 Year, 10.00%, 11/15/09 - 1/15/10 . . . . . . . . . . . . . . . . . . . . . . . . . . . . . . . 79,686 82,924GNMA GP 30 Year, 10.25%, 5/15/20 . . . . . . . . . . . . . . . . . . . . . . . . . . . . . . . . . . . . . . . . 10,211 11,735GNMA GP 30 Year, 11.00%, 1/15/10 - 12/15/10 . . . . . . . . . . . . . . . . . . . . . . . . . . . . . . . 193,181 205,739GNMA GP 30 Year, 11.25%, 7/15/13 - 1/15/16 . . . . . . . . . . . . . . . . . . . . . . . . . . . . . . . . 205,253 233,306GNMA GP 30 Year, 11.50%, 2/15/13 - 5/15/13 . . . . . . . . . . . . . . . . . . . . . . . . . . . . . . . . 32,046 36,132GNMA GP 30 Year, 11.75%, 7/15/13 - 8/15/13 . . . . . . . . . . . . . . . . . . . . . . . . . . . . . . . . 32,029 36,255GNMA GP 30 Year, 12.00%, 3/15/11 - 12/15/12 . . . . . . . . . . . . . . . . . . . . . . . . . . . . . . . 11,321 12,506GNMA GP 30 Year, 12.50%, 5/15/10 - 6/15/10 . . . . . . . . . . . . . . . . . . . . . . . . . . . . . . . . 18,039 19,476GNMA GP 30 Year, 12.75%, 5/15/14 . . . . . . . . . . . . . . . . . . . . . . . . . . . . . . . . . . . . . . . . 4,811 5,606GNMA I SF 15 Year, 6.50%, 5/15/18 . . . . . . . . . . . . . . . . . . . . . . . . . . . . . . . . . . . . . . . . 1,332,741 1,398,826GNMA I SF 15 Year, 7.00%, 10/15/09 . . . . . . . . . . . . . . . . . . . . . . . . . . . . . . . . . . . . . . . 58,716 59,014
aGNMA I SF 30 Year, 5.00%, 2/15/33 - 9/15/36 . . . . . . . . . . . . . . . . . . . . . . . . . . . . . . . . . 629,818,688 619,123,923GNMA I SF 30 Year, 5.50%, 5/15/28 - 8/15/38 . . . . . . . . . . . . . . . . . . . . . . . . . . . . . . . . . 1,152,291,323 1,156,387,423
aGNMA I SF 30 Year, 5.50%, 10/15/37 . . . . . . . . . . . . . . . . . . . . . . . . . . . . . . . . . . . . . . . 75,000,000 75,082,050aGNMA I SF 30 Year, 6.00%, 10/15/23 - 9/15/38 . . . . . . . . . . . . . . . . . . . . . . . . . . . . . . . . 1,458,260,023 1,483,249,866GNMA I SF 30 Year, 6.00%, 3/15/38 . . . . . . . . . . . . . . . . . . . . . . . . . . . . . . . . . . . . . . . . 70,282,035 71,438,028GNMA I SF 30 Year, 6.50%, 5/15/23 - 2/15/38 . . . . . . . . . . . . . . . . . . . . . . . . . . . . . . . . . 387,574,361 398,509,618GNMA I SF 30 Year, 6.75%, 3/15/26 - 4/15/26 . . . . . . . . . . . . . . . . . . . . . . . . . . . . . . . . . 69,110 72,513GNMA I SF 30 Year, 7.00%, 4/15/16 - 9/15/32 . . . . . . . . . . . . . . . . . . . . . . . . . . . . . . . . . 190,243,161 200,722,510GNMA I SF 30 Year, 7.25%, 11/15/25 - 1/15/26 . . . . . . . . . . . . . . . . . . . . . . . . . . . . . . . . 585,706 628,484GNMA I SF 30 Year, 7.50%, 7/15/16 - 8/15/32 . . . . . . . . . . . . . . . . . . . . . . . . . . . . . . . . . 46,697,705 50,376,933GNMA I SF 30 Year, 7.70%, 1/15/21 - 1/15/22 . . . . . . . . . . . . . . . . . . . . . . . . . . . . . . . . . 414,816 450,965GNMA I SF 30 Year, 8.00%, 11/15/15 - 9/15/30 . . . . . . . . . . . . . . . . . . . . . . . . . . . . . . . . 36,611,609 40,076,246GNMA I SF 30 Year, 8.25%, 3/15/27 . . . . . . . . . . . . . . . . . . . . . . . . . . . . . . . . . . . . . . . . 36,991 40,527GNMA I SF 30 Year, 8.50%, 12/15/09 - 6/15/25 . . . . . . . . . . . . . . . . . . . . . . . . . . . . . . . . 8,002,101 8,834,075GNMA I SF 30 Year, 9.00%, 12/15/08 - 7/15/23 . . . . . . . . . . . . . . . . . . . . . . . . . . . . . . . . 10,074,577 11,065,694GNMA I SF 30 Year, 9.50%, 5/15/09 - 8/15/22 . . . . . . . . . . . . . . . . . . . . . . . . . . . . . . . . . 6,046,942 6,730,963GNMA I SF 30 Year, 10.00%, 2/15/16 - 3/15/25 . . . . . . . . . . . . . . . . . . . . . . . . . . . . . . . . 7,936,285 9,061,750GNMA I SF 30 Year, 10.50%, 2/15/12 - 10/15/21 . . . . . . . . . . . . . . . . . . . . . . . . . . . . . . . 5,980,343 6,866,764GNMA I SF 30 Year, 11.00%, 12/15/09 - 5/15/21 . . . . . . . . . . . . . . . . . . . . . . . . . . . . . . . 4,635,885 5,243,778GNMA I SF 30 Year, 11.50%, 3/15/13 - 2/15/16 . . . . . . . . . . . . . . . . . . . . . . . . . . . . . . . . 1,221,917 1,391,969GNMA I SF 30 Year, 12.00%, 5/15/11 - 1/15/18 . . . . . . . . . . . . . . . . . . . . . . . . . . . . . . . . 5,937,640 6,880,277GNMA I SF 30 Year, 12.50%, 4/15/10 - 8/15/18 . . . . . . . . . . . . . . . . . . . . . . . . . . . . . . . . 4,721,707 5,401,049GNMA I SF 30 Year, 13.00%, 8/15/10 - 9/15/15 . . . . . . . . . . . . . . . . . . . . . . . . . . . . . . . . 5,117,412 5,900,096GNMA II GP 30 Year, 8.75%, 3/20/17 - 7/20/17 . . . . . . . . . . . . . . . . . . . . . . . . . . . . . . . . 42,159 45,862GNMA II GP 30 Year, 11.50%, 8/20/13 . . . . . . . . . . . . . . . . . . . . . . . . . . . . . . . . . . . . . . 13,208 14,841GNMA II SF 30 Year, 4.50%, 5/20/33 - 10/20/34 . . . . . . . . . . . . . . . . . . . . . . . . . . . . . . . 37,161,527 35,337,002GNMA II SF 30 Year, 5.00%, 7/20/33 - 7/20/38 . . . . . . . . . . . . . . . . . . . . . . . . . . . . . . . . 351,295,721 343,521,418GNMA II SF 30 Year, 5.00%, 9/20/33 . . . . . . . . . . . . . . . . . . . . . . . . . . . . . . . . . . . . . . . . 183,951,359 180,105,944GNMA II SF 30 Year, 5.50%, 6/20/34 - 8/20/38 . . . . . . . . . . . . . . . . . . . . . . . . . . . . . . . . 650,402,539 649,836,484GNMA II SF 30 Year, 5.50%, 12/20/34 . . . . . . . . . . . . . . . . . . . . . . . . . . . . . . . . . . . . . . . 131,316,603 131,242,946GNMA II SF 30 Year, 5.50%, 1/20/35 . . . . . . . . . . . . . . . . . . . . . . . . . . . . . . . . . . . . . . . . 77,762,616 77,699,384GNMA II SF 30 Year, 5.50%, 6/20/38 . . . . . . . . . . . . . . . . . . . . . . . . . . . . . . . . . . . . . . . . 112,315,617 112,180,183GNMA II SF 30 Year, 6.00%, 10/20/23 - 10/20/37 . . . . . . . . . . . . . . . . . . . . . . . . . . . . . . 490,549,633 497,819,784GNMA II SF 30 Year, 6.00%, 1/20/38 . . . . . . . . . . . . . . . . . . . . . . . . . . . . . . . . . . . . . . . . 73,915,489 75,004,573GNMA II SF 30 Year, 6.00%, 7/20/38 . . . . . . . . . . . . . . . . . . . . . . . . . . . . . . . . . . . . . . . . 73,795,789 74,883,109
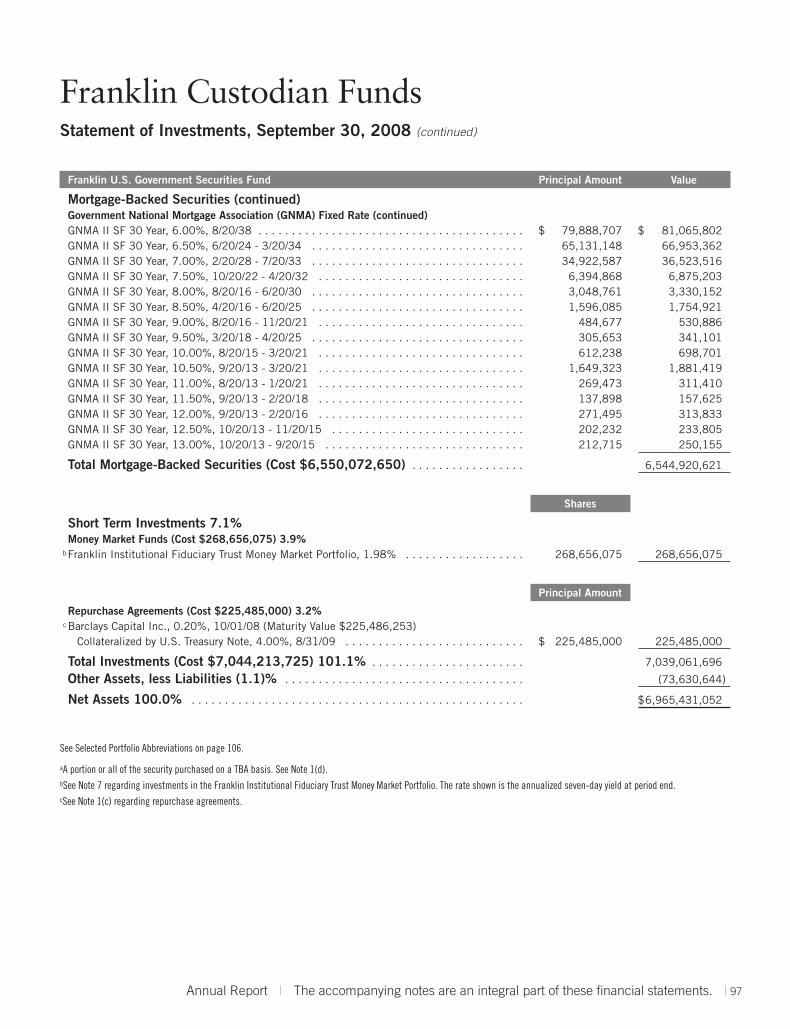
Franklin Custodian FundsStatement of Investments, September 30, 2008 (continued)
Franklin U.S. Government Securities Fund Principal Amount Value
Mortgage-Backed Securities (continued)
Annual Report | The accompanying notes are an integral part of these financial statements. | 97
Government National Mortgage Association (GNMA) Fixed Rate (continued)GNMA II SF 30 Year, 6.00%, 8/20/38 . . . . . . . . . . . . . . . . . . . . . . . . . . . . . . . . . . . . . . . . $ 79,888,707 $ 81,065,802GNMA II SF 30 Year, 6.50%, 6/20/24 - 3/20/34 . . . . . . . . . . . . . . . . . . . . . . . . . . . . . . . . 65,131,148 66,953,362GNMA II SF 30 Year, 7.00%, 2/20/28 - 7/20/33 . . . . . . . . . . . . . . . . . . . . . . . . . . . . . . . . 34,922,587 36,523,516GNMA II SF 30 Year, 7.50%, 10/20/22 - 4/20/32 . . . . . . . . . . . . . . . . . . . . . . . . . . . . . . . 6,394,868 6,875,203GNMA II SF 30 Year, 8.00%, 8/20/16 - 6/20/30 . . . . . . . . . . . . . . . . . . . . . . . . . . . . . . . . 3,048,761 3,330,152GNMA II SF 30 Year, 8.50%, 4/20/16 - 6/20/25 . . . . . . . . . . . . . . . . . . . . . . . . . . . . . . . . 1,596,085 1,754,921GNMA II SF 30 Year, 9.00%, 8/20/16 - 11/20/21 . . . . . . . . . . . . . . . . . . . . . . . . . . . . . . . 484,677 530,886GNMA II SF 30 Year, 9.50%, 3/20/18 - 4/20/25 . . . . . . . . . . . . . . . . . . . . . . . . . . . . . . . . 305,653 341,101GNMA II SF 30 Year, 10.00%, 8/20/15 - 3/20/21 . . . . . . . . . . . . . . . . . . . . . . . . . . . . . . . 612,238 698,701GNMA II SF 30 Year, 10.50%, 9/20/13 - 3/20/21 . . . . . . . . . . . . . . . . . . . . . . . . . . . . . . . 1,649,323 1,881,419GNMA II SF 30 Year, 11.00%, 8/20/13 - 1/20/21 . . . . . . . . . . . . . . . . . . . . . . . . . . . . . . . 269,473 311,410GNMA II SF 30 Year, 11.50%, 9/20/13 - 2/20/18 . . . . . . . . . . . . . . . . . . . . . . . . . . . . . . . 137,898 157,625GNMA II SF 30 Year, 12.00%, 9/20/13 - 2/20/16 . . . . . . . . . . . . . . . . . . . . . . . . . . . . . . . 271,495 313,833GNMA II SF 30 Year, 12.50%, 10/20/13 - 11/20/15 . . . . . . . . . . . . . . . . . . . . . . . . . . . . . 202,232 233,805GNMA II SF 30 Year, 13.00%, 10/20/13 - 9/20/15 . . . . . . . . . . . . . . . . . . . . . . . . . . . . . . 212,715 250,155
Total Mortgage-Backed Securities (Cost $6,550,072,650) . . . . . . . . . . . . . . . . . 6,544,920,621
Shares
Short Term Investments 7.1%Money Market Funds (Cost $268,656,075) 3.9%
bFranklin Institutional Fiduciary Trust Money Market Portfolio, 1.98% . . . . . . . . . . . . . . . . . . 268,656,075 268,656,075
Principal Amount
Repurchase Agreements (Cost $225,485,000) 3.2%cBarclays Capital Inc., 0.20%, 10/01/08 (Maturity Value $225,486,253)
Collateralized by U.S. Treasury Note, 4.00%, 8/31/09 . . . . . . . . . . . . . . . . . . . . . . . . . . . $ 225,485,000 225,485,000
Total Investments (Cost $7,044,213,725) 101.1% . . . . . . . . . . . . . . . . . . . . . . . 7,039,061,696
Other Assets, less Liabilities (1.1)% . . . . . . . . . . . . . . . . . . . . . . . . . . . . . . . . . . . . (73,630,644)
Net Assets 100.0% . . . . . . . . . . . . . . . . . . . . . . . . . . . . . . . . . . . . . . . . . . . . . . . . . . $6,965,431,052
See Selected Portfolio Abbreviations on page 106.
aA portion or all of the security purchased on a TBA basis. See Note 1(d).bSee Note 7 regarding investments in the Franklin Institutional Fiduciary Trust Money Market Portfolio. The rate shown is the annualized seven-day yield at period end.cSee Note 1(c) regarding repurchase agreements.
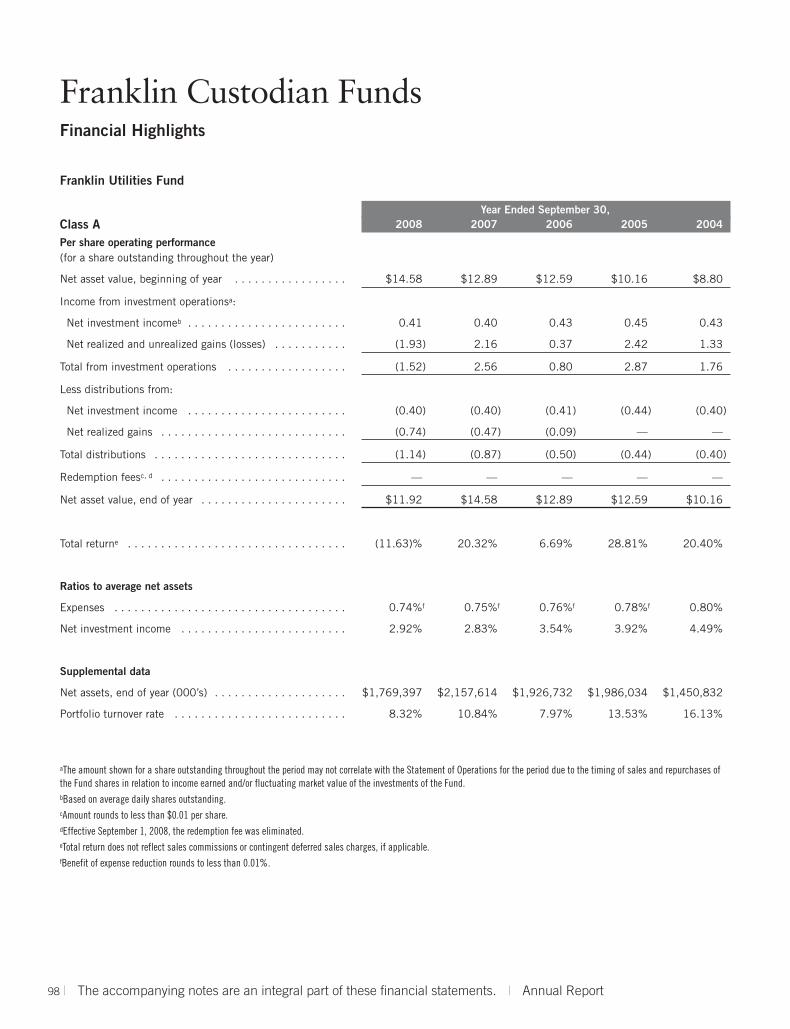
Franklin Custodian FundsFinancial Highlights
98 | The accompanying notes are an integral part of these financial statements. | Annual Report
Franklin Utilities Fund
Year Ended September 30,Class A 2008 2007 2006 2005 2004
Per share operating performance(for a share outstanding throughout the year)
Net asset value, beginning of year . . . . . . . . . . . . . . . . . $14.58 $12.89 $12.59 $10.16 $8.80
Income from investment operationsa:
Net investment incomeb . . . . . . . . . . . . . . . . . . . . . . . . 0.41 0.40 0.43 0.45 0.43
Net realized and unrealized gains (losses) . . . . . . . . . . . (1.93) 2.16 0.37 2.42 1.33
Total from investment operations . . . . . . . . . . . . . . . . . . (1.52) 2.56 0.80 2.87 1.76
Less distributions from:
Net investment income . . . . . . . . . . . . . . . . . . . . . . . . (0.40) (0.40) (0.41) (0.44) (0.40)
Net realized gains . . . . . . . . . . . . . . . . . . . . . . . . . . . . (0.74) (0.47) (0.09) — —
Total distributions . . . . . . . . . . . . . . . . . . . . . . . . . . . . . (1.14) (0.87) (0.50) (0.44) (0.40)
Redemption feesc, d . . . . . . . . . . . . . . . . . . . . . . . . . . . . — — — — —
Net asset value, end of year . . . . . . . . . . . . . . . . . . . . . . $11.92 $14.58 $12.89 $12.59 $10.16
Total returne . . . . . . . . . . . . . . . . . . . . . . . . . . . . . . . . . (11.63)% 20.32% 6.69% 28.81% 20.40%
Ratios to average net assets
Expenses . . . . . . . . . . . . . . . . . . . . . . . . . . . . . . . . . . . 0.74%f 0.75%f 0.76%f 0.78%f 0.80%
Net investment income . . . . . . . . . . . . . . . . . . . . . . . . . 2.92% 2.83% 3.54% 3.92% 4.49%
Supplemental data
Net assets, end of year (000’s) . . . . . . . . . . . . . . . . . . . . $1,769,397 $2,157,614 $1,926,732 $1,986,034 $1,450,832
Portfolio turnover rate . . . . . . . . . . . . . . . . . . . . . . . . . . 8.32% 10.84% 7.97% 13.53% 16.13%
aThe amount shown for a share outstanding throughout the period may not correlate with the Statement of Operations for the period due to the timing of sales and repurchases ofthe Fund shares in relation to income earned and/or fluctuating market value of the investments of the Fund.bBased on average daily shares outstanding.cAmount rounds to less than $0.01 per share.dEffective September 1, 2008, the redemption fee was eliminated.eTotal return does not reflect sales commissions or contingent deferred sales charges, if applicable.fBenefit of expense reduction rounds to less than 0.01%.

Franklin Custodian FundsFinancial Highlights (continued)
Annual Report | The accompanying notes are an integral part of these financial statements. | 99
Franklin Utilities Fund
Year Ended September 30,Class B 2008 2007 2006 2005 2004
Per share operating performance(for a share outstanding throughout the year)
Net asset value, beginning of year . . . . . . . . . . . . . . . . . . . . . . . . . . $14.56 $12.88 $12.57 $10.15 $8.80
Income from investment operationsa:
Net investment incomeb . . . . . . . . . . . . . . . . . . . . . . . . . . . . . . . . 0.33 0.33 0.37 0.39 0.38
Net realized and unrealized gains (losses) . . . . . . . . . . . . . . . . . . . (1.91) 2.15 0.38 2.42 1.33
Total from investment operations . . . . . . . . . . . . . . . . . . . . . . . . . . (1.58) 2.48 0.75 2.81 1.71
Less distributions from:
Net investment income . . . . . . . . . . . . . . . . . . . . . . . . . . . . . . . . (0.33) (0.33) (0.35) (0.39) (0.36)
Net realized gains . . . . . . . . . . . . . . . . . . . . . . . . . . . . . . . . . . . . (0.74) (0.47) (0.09) — —
Total distributions . . . . . . . . . . . . . . . . . . . . . . . . . . . . . . . . . . . . . (1.07) (0.80) (0.44) (0.39) (0.36)
Redemption feesc, d . . . . . . . . . . . . . . . . . . . . . . . . . . . . . . . . . . . . — — — — —
Net asset value, end of year . . . . . . . . . . . . . . . . . . . . . . . . . . . . . . $11.91 $14.56 $12.88 $12.57 $10.15
Total returne . . . . . . . . . . . . . . . . . . . . . . . . . . . . . . . . . . . . . . . . . (12.04)% 19.66% 6.25% 28.11% 19.71%
Ratios to average net assets
Expenses . . . . . . . . . . . . . . . . . . . . . . . . . . . . . . . . . . . . . . . . . . . 1.24%f 1.26%f 1.26%f 1.28%f 1.30%
Net investment income . . . . . . . . . . . . . . . . . . . . . . . . . . . . . . . . . 2.42% 2.32% 3.04% 3.42% 3.99%
Supplemental data
Net assets, end of year (000’s) . . . . . . . . . . . . . . . . . . . . . . . . . . . . $92,695 $127,587 $133,824 $154,277 $127,105
Portfolio turnover rate . . . . . . . . . . . . . . . . . . . . . . . . . . . . . . . . . . 8.32% 10.84% 7.97% 13.53% 16.13%
aThe amount shown for a share outstanding throughout the period may not correlate with the Statement of Operations for the period due to the timing of sales and repurchases ofthe Fund shares in relation to income earned and/or fluctuating market value of the investments of the Fund.bBased on average daily shares outstanding.cAmount rounds to less than $0.01 per share.dEffective September 1, 2008, the redemption fee was eliminated.eTotal return does not reflect sales commissions or contingent deferred sales charges, if applicable.fBenefit of expense reduction rounds to less than 0.01%.

Franklin Custodian FundsFinancial Highlights (continued)
100 | The accompanying notes are an integral part of these financial statements. | Annual Report
Franklin Utilities Fund
Year Ended September 30,Class C 2008 2007 2006 2005 2004
Per share operating performance(for a share outstanding throughout the year)
Net asset value, beginning of year . . . . . . . . . . . . . . . . . . . . . . . . . $14.53 $12.85 $12.55 $10.13 $ 8.78
Income from investment operationsa:
Net investment incomeb . . . . . . . . . . . . . . . . . . . . . . . . . . . . . . . 0.33 0.33 0.37 0.39 0.38
Net realized and unrealized gains (losses) . . . . . . . . . . . . . . . . . . . (1.91) 2.15 0.37 2.42 1.33
Total from investment operations . . . . . . . . . . . . . . . . . . . . . . . . . . (1.58) 2.48 0.74 2.81 1.71
Less distributions from:
Net investment income . . . . . . . . . . . . . . . . . . . . . . . . . . . . . . . . (0.33) (0.33) (0.35) (0.39) (0.36)
Net realized gains . . . . . . . . . . . . . . . . . . . . . . . . . . . . . . . . . . . (0.74) (0.47) (0.09) — —
Total distributions . . . . . . . . . . . . . . . . . . . . . . . . . . . . . . . . . . . . (1.07) (0.80) (0.44) (0.39) (0.36)
Redemption feesc, d . . . . . . . . . . . . . . . . . . . . . . . . . . . . . . . . . . . . — — — — —
Net asset value, end of year . . . . . . . . . . . . . . . . . . . . . . . . . . . . . $11.88 $14.53 $12.85 $12.55 $10.13
Total returne . . . . . . . . . . . . . . . . . . . . . . . . . . . . . . . . . . . . . . . . . (12.06)% 19.72% 6.19% 28.16% 19.76%
Ratios to average net assets
Expenses . . . . . . . . . . . . . . . . . . . . . . . . . . . . . . . . . . . . . . . . . . . 1.24%f 1.26%f 1.25%f 1.28%f 1.30%
Net investment income . . . . . . . . . . . . . . . . . . . . . . . . . . . . . . . . . 2.42% 2.32% 3.05% 3.42% 3.99%
Supplemental data
Net assets, end of year (000’s) . . . . . . . . . . . . . . . . . . . . . . . . . . . $339,247 $424,977 $391,509 $435,714 $283,747
Portfolio turnover rate . . . . . . . . . . . . . . . . . . . . . . . . . . . . . . . . . . 8.32% 10.84% 7.97% 13.53% 16.13%
aThe amount shown for a share outstanding throughout the period may not correlate with the Statement of Operations for the period due to the timing of sales and repurchases ofthe Fund shares in relation to income earned and/or fluctuating market value of the investments of the Fund.bBased on average daily shares outstanding.cAmount rounds to less than $0.01 per share.dEffective September 1, 2008, the redemption fee was eliminated.eTotal return does not reflect sales commissions or contingent deferred sales charges, if applicable.fBenefit of expense reduction rounds to less than 0.01%.

Franklin Custodian FundsFinancial Highlights (continued)
Annual Report | The accompanying notes are an integral part of these financial statements. | 101
Franklin Utilities Fund
Year Ended September 30,Class R 2008 2007 2006 2005 2004
Per share operating performance(for a share outstanding throughout the year)
Net asset value, beginning of year . . . . . . . . . . . . . . . . . . . . . . . . . . . . $14.54 $12.86 $12.57 $10.15 $ 8.79
Income from investment operationsa:
Net investment incomeb . . . . . . . . . . . . . . . . . . . . . . . . . . . . . . . . . . 0.36 0.35 0.39 0.43 0.39
Net realized and unrealized gains (losses) . . . . . . . . . . . . . . . . . . . . . (1.92) 2.16 0.36 2.40 1.34
Total from investment operations . . . . . . . . . . . . . . . . . . . . . . . . . . . . . (1.56) 2.51 0.75 2.83 1.73
Less distributions from:
Net investment income . . . . . . . . . . . . . . . . . . . . . . . . . . . . . . . . . . . (0.35) (0.36) (0.37) (0.41) (0.37)
Net realized gains . . . . . . . . . . . . . . . . . . . . . . . . . . . . . . . . . . . . . . (0.74) (0.47) (0.09) — —
Total distributions . . . . . . . . . . . . . . . . . . . . . . . . . . . . . . . . . . . . . . . (1.09) (0.83) (0.46) (0.41) (0.37)
Redemption feesc, d . . . . . . . . . . . . . . . . . . . . . . . . . . . . . . . . . . . . . . . — — — — —
Net asset value, end of year . . . . . . . . . . . . . . . . . . . . . . . . . . . . . . . . $11.89 $14.54 $12.86 $12.57 $10.15
Total returne . . . . . . . . . . . . . . . . . . . . . . . . . . . . . . . . . . . . . . . . . . . . (11.92)% 19.92% 6.29% 28.35% 20.02%
Ratios to average net assets
Expenses . . . . . . . . . . . . . . . . . . . . . . . . . . . . . . . . . . . . . . . . . . . . . . 1.09%f 1.11%f 1.11%f 1.13%f 1.15%
Net investment income . . . . . . . . . . . . . . . . . . . . . . . . . . . . . . . . . . . . 2.57% 2.47% 3.19% 3.57% 4.14%
Supplemental data
Net assets, end of year (000’s) . . . . . . . . . . . . . . . . . . . . . . . . . . . . . . $36,596 $41,845 $27,736 $14,649 $1,590
Portfolio turnover rate . . . . . . . . . . . . . . . . . . . . . . . . . . . . . . . . . . . . . 8.32% 10.84% 7.97% 13.53% 16.13%
aThe amount shown for a share outstanding throughout the period may not correlate with the Statement of Operations for the period due to the timing of sales and repurchases ofthe Fund shares in relation to income earned and/or fluctuating market value of the investments of the Fund.bBased on average daily shares outstanding.cAmount rounds to less than $0.01 per share.dEffective September 1, 2008, the redemption fee was eliminated.eTotal return does not reflect sales commissions or contingent deferred sales charges, if applicable.fBenefit of expense reduction rounds to less than 0.01%.

Franklin Custodian FundsFinancial Highlights (continued)
102 | The accompanying notes are an integral part of these financial statements. | Annual Report
Franklin Utilities Fund
Year Ended September 30,Advisor Class 2008 2007 2006 2005 2004
Per share operating performance(for a share outstanding throughout the year)
Net asset value, beginning of year . . . . . . . . . . . . . . . . . . . . . . . . . $14.64 $12.95 $12.64 $10.20 $ 8.84
Income from investment operationsa:
Net investment incomeb . . . . . . . . . . . . . . . . . . . . . . . . . . . . . . . 0.42 0.42 0.45 0.48 0.44
Net realized and unrealized gains (losses) . . . . . . . . . . . . . . . . . . . (1.92) 2.17 0.38 2.42 1.34
Total from investment operations . . . . . . . . . . . . . . . . . . . . . . . . . . (1.50) 2.59 0.83 2.90 1.78
Less distributions from:
Net investment income . . . . . . . . . . . . . . . . . . . . . . . . . . . . . . . . (0.42) (0.43) (0.43) (0.46) (0.42)
Net realized gains . . . . . . . . . . . . . . . . . . . . . . . . . . . . . . . . . . . (0.74) (0.47) (0.09) — —
Total distributions . . . . . . . . . . . . . . . . . . . . . . . . . . . . . . . . . . . . (1.16) (0.90) (0.52) (0.46) (0.42)
Redemption feesc, d . . . . . . . . . . . . . . . . . . . . . . . . . . . . . . . . . . . . — — — — —
Net asset value, end of year . . . . . . . . . . . . . . . . . . . . . . . . . . . . . $11.98 $14.64 $12.95 $12.64 $10.20
Total return . . . . . . . . . . . . . . . . . . . . . . . . . . . . . . . . . . . . . . . . . (11.45)% 20.43% 6.88% 29.00% 20.48%
Ratios to average net assets
Expenses . . . . . . . . . . . . . . . . . . . . . . . . . . . . . . . . . . . . . . . . . . . 0.59%e 0.61%e 0.61%e 0.63%e 0.65%
Net investment income . . . . . . . . . . . . . . . . . . . . . . . . . . . . . . . . . 3.07% 2.97% 3.69% 4.07% 4.64%
Supplemental data
Net assets, end of year (000’s) . . . . . . . . . . . . . . . . . . . . . . . . . . . $58,817 $86,823 $103,041 $110,249 $51,586
Portfolio turnover rate . . . . . . . . . . . . . . . . . . . . . . . . . . . . . . . . . . 8.32% 10.84% 7.97% 13.53% 16.13%
aThe amount shown for a share outstanding throughout the period may not correlate with the Statement of Operations for the period due to the timing of sales and repurchases ofthe Fund shares in relation to income earned and/or fluctuating market value of the investments of the Fund.bBased on average daily shares outstanding.cAmount rounds to less than $0.01 per share.dEffective September 1, 2008, the redemption fee was eliminated.eBenefit of expense reduction rounds to less than 0.01%.

Franklin Custodian FundsStatement of Investments, September 30, 2008
Annual Report | 103
Franklin Utilities Fund Country Shares Value
Common Stocks 95.9%Diversified Telecommunication Services 2.7%AT&T Inc. . . . . . . . . . . . . . . . . . . . . . . . . . . . . . . . . . . . . . . . . . . . . . . United States 1,200,000 $ 33,504,000Verizon Communications Inc. . . . . . . . . . . . . . . . . . . . . . . . . . . . . . . . . United States 900,000 28,881,000
62,385,000
Electric Utilities 49.7%Allegheny Energy Inc. . . . . . . . . . . . . . . . . . . . . . . . . . . . . . . . . . . . . . United States 300,000 11,031,000American Electric Power Co. Inc. . . . . . . . . . . . . . . . . . . . . . . . . . . . . . United States 1,300,000 48,139,000Cleco Corp. . . . . . . . . . . . . . . . . . . . . . . . . . . . . . . . . . . . . . . . . . . . . . United States 1,000,000 25,250,000Duke Energy Corp. . . . . . . . . . . . . . . . . . . . . . . . . . . . . . . . . . . . . . . . . United States 3,800,000 66,234,000Edison International . . . . . . . . . . . . . . . . . . . . . . . . . . . . . . . . . . . . . . United States 1,759,000 70,184,100Entergy Corp. . . . . . . . . . . . . . . . . . . . . . . . . . . . . . . . . . . . . . . . . . . . United States 1,750,000 155,767,500Exelon Corp. . . . . . . . . . . . . . . . . . . . . . . . . . . . . . . . . . . . . . . . . . . . . United States 2,200,000 137,764,000FirstEnergy Corp. . . . . . . . . . . . . . . . . . . . . . . . . . . . . . . . . . . . . . . . . . United States 1,700,000 113,883,000FPL Group Inc. . . . . . . . . . . . . . . . . . . . . . . . . . . . . . . . . . . . . . . . . . . United States 1,700,000 85,510,000Hawaiian Electric Industries Inc. . . . . . . . . . . . . . . . . . . . . . . . . . . . . . United States 400,000 11,604,000Northeast Utilities . . . . . . . . . . . . . . . . . . . . . . . . . . . . . . . . . . . . . . . . United States 1,000,000 25,650,000Pepco Holdings Inc. . . . . . . . . . . . . . . . . . . . . . . . . . . . . . . . . . . . . . . United States 1,300,000 29,783,000Pinnacle West Capital Corp. . . . . . . . . . . . . . . . . . . . . . . . . . . . . . . . . . United States 800,000 27,528,000Portland General Electric Co. . . . . . . . . . . . . . . . . . . . . . . . . . . . . . . . . United States 1,200,000 28,392,000PPL Corp. . . . . . . . . . . . . . . . . . . . . . . . . . . . . . . . . . . . . . . . . . . . . . . United States 2,000,000 74,040,000Progress Energy Inc. . . . . . . . . . . . . . . . . . . . . . . . . . . . . . . . . . . . . . . United States 1,400,000 60,382,000Sierra Pacific Resources . . . . . . . . . . . . . . . . . . . . . . . . . . . . . . . . . . . United States 4,500,000 43,110,000The Southern Co. . . . . . . . . . . . . . . . . . . . . . . . . . . . . . . . . . . . . . . . . United States 2,500,000 94,225,000UIL Holdings Corp. . . . . . . . . . . . . . . . . . . . . . . . . . . . . . . . . . . . . . . . United States 230,400 7,909,632Westar Energy Inc. . . . . . . . . . . . . . . . . . . . . . . . . . . . . . . . . . . . . . . . United States 1,080,600 24,897,024
1,141,283,256
Gas Utilities 1.5%AGL Resources Inc. . . . . . . . . . . . . . . . . . . . . . . . . . . . . . . . . . . . . . . . United States 800,000 25,104,000Southwest Gas Corp. . . . . . . . . . . . . . . . . . . . . . . . . . . . . . . . . . . . . . . United States 300,000 9,078,000
34,182,000
Multi-Utilities 38.5%Alliant Energy Corp. . . . . . . . . . . . . . . . . . . . . . . . . . . . . . . . . . . . . . . . United States 1,200,000 38,652,000Ameren Corp. . . . . . . . . . . . . . . . . . . . . . . . . . . . . . . . . . . . . . . . . . . . United States 1,200,000 46,836,000CenterPoint Energy Inc. . . . . . . . . . . . . . . . . . . . . . . . . . . . . . . . . . . . . United States 1,700,000 24,769,000CMS Energy Corp. . . . . . . . . . . . . . . . . . . . . . . . . . . . . . . . . . . . . . . . . United States 300,000 3,741,000Consolidated Edison Inc. . . . . . . . . . . . . . . . . . . . . . . . . . . . . . . . . . . . United States 800,000 34,368,000Dominion Resources Inc. . . . . . . . . . . . . . . . . . . . . . . . . . . . . . . . . . . . United States 2,300,000 98,394,000DTE Energy Co. . . . . . . . . . . . . . . . . . . . . . . . . . . . . . . . . . . . . . . . . . . United States 500,000 20,060,000GDF Suez . . . . . . . . . . . . . . . . . . . . . . . . . . . . . . . . . . . . . . . . . . . . . . France 700,000 35,941,186Integrys Energy Group Inc. . . . . . . . . . . . . . . . . . . . . . . . . . . . . . . . . . . United States 700,000 34,958,000National Grid PLC . . . . . . . . . . . . . . . . . . . . . . . . . . . . . . . . . . . . . . . . United Kingdom 4,987,755 63,302,955PG&E Corp. . . . . . . . . . . . . . . . . . . . . . . . . . . . . . . . . . . . . . . . . . . . . United States 2,400,000 89,880,000PNM Resources Inc. . . . . . . . . . . . . . . . . . . . . . . . . . . . . . . . . . . . . . . United States 855,720 8,762,573Public Service Enterprise Group Inc. . . . . . . . . . . . . . . . . . . . . . . . . . . . United States 2,200,000 72,138,000Puget Energy Inc. . . . . . . . . . . . . . . . . . . . . . . . . . . . . . . . . . . . . . . . . United States 1,725,000 46,057,500RWE AG . . . . . . . . . . . . . . . . . . . . . . . . . . . . . . . . . . . . . . . . . . . . . . . Germany 300,000 28,675,581

Franklin Custodian FundsStatement of Investments, September 30, 2008 (continued)
104 | Annual Report
Franklin Utilities Fund Country Shares Value
Common Stocks (continued)Multi-Utilities (continued)SCANA Corp. . . . . . . . . . . . . . . . . . . . . . . . . . . . . . . . . . . . . . . . . . . . United States 900,000 $ 35,037,000Sempra Energy . . . . . . . . . . . . . . . . . . . . . . . . . . . . . . . . . . . . . . . . . . United States 1,600,000 80,752,000United Utilities Group PLC . . . . . . . . . . . . . . . . . . . . . . . . . . . . . . . . . . United Kingdom 960,189 11,914,574Vectren Corp. . . . . . . . . . . . . . . . . . . . . . . . . . . . . . . . . . . . . . . . . . . . United States 600,000 16,710,000Wisconsin Energy Corp. . . . . . . . . . . . . . . . . . . . . . . . . . . . . . . . . . . . . United States 1,000,000 44,900,000Xcel Energy Inc. . . . . . . . . . . . . . . . . . . . . . . . . . . . . . . . . . . . . . . . . . United States 2,400,000 47,976,000
883,825,369
Oil, Gas & Consumable Fuels 3.0%Spectra Energy Corp. . . . . . . . . . . . . . . . . . . . . . . . . . . . . . . . . . . . . . . United States 1,900,000 45,220,000The Williams Cos. Inc. . . . . . . . . . . . . . . . . . . . . . . . . . . . . . . . . . . . . . United States 1,000,000 23,650,000
68,870,000
Water Utilities 0.5%American Water Works Co. Inc. . . . . . . . . . . . . . . . . . . . . . . . . . . . . . . . United States 500,000 10,750,000
Total Common Stocks (Cost $1,557,072,533) . . . . . . . . . . . . . 2,201,295,625
Convertible Preferred Stocks (Cost $13,497,475) 0.5%Electric Utilities 0.5%CMS Energy Trust I, 7.75%, cvt. pfd. . . . . . . . . . . . . . . . . . . . . . . . . . . United States 270,050 12,044,932
Principal Amounta Value
Corporate Bonds 3.3%Electric Utilities 1.6%MidAmerican Energy Holdings Co., senior note, 8.48%, 9/15/28 . . . . . . . United States $25,000,000 27,529,500Northeast Generation Co., senior secured note, B-1, 8.812%, 10/15/26 . . . . . . . . . . . . . . . . . . . . . . . . . . . . . . . . . . . . . . . . . . . . . United States 7,356,445 8,074,699
35,604,199
Independent Power Producers & Energy Traders 1.2%Energy Future Holdings Corp., senior note,
P, 5.55%, 11/15/14 . . . . . . . . . . . . . . . . . . . . . . . . . . . . . . . . . . . . United States 32,300,000 24,253,973R, 6.55%, 11/15/34 . . . . . . . . . . . . . . . . . . . . . . . . . . . . . . . . . . . . United States 5,700,000 3,524,128
27,778,101
Multi-Utilities 0.5%Aquila Inc., senior note,
9.95%, 2/01/11 . . . . . . . . . . . . . . . . . . . . . . . . . . . . . . . . . . . . . . . United States 6,000,000 6,217,3808.27%, 11/15/21 . . . . . . . . . . . . . . . . . . . . . . . . . . . . . . . . . . . . . . United States 6,100,000 5,961,225
12,178,605
Total Corporate Bonds (Cost $76,949,936) . . . . . . . . . . . . . . . . 75,560,905
Total Investments before Short Term Investments(Cost $1,647,519,944) . . . . . . . . . . . . . . . . . . . . . . . . . . . . . . . . . . 2,288,901,462

Franklin Custodian FundsStatement of Investments, September 30, 2008 (continued)
Annual Report | The accompanying notes are an integral part of these financial statements. | 105
Franklin Utilities Fund Country Shares Value
Short Term Investment (Cost $2,283,674) 0.1%Money Market Fund 0.1%
bFranklin Institutional Fiduciary Trust Money Market Portfolio, 1.98% . . . . United States 2,283,674 $ 2,283,674
Total Investments (Cost $1,649,803,618) 99.8% . . . . . . . . . . 2,291,185,136
Other Assets, less Liabilities 0.2% . . . . . . . . . . . . . . . . . . . . . . . . 5,567,551
Net Assets 100.0% . . . . . . . . . . . . . . . . . . . . . . . . . . . . . . . . . . . . . $2,296,752,687
aThe principal amount is stated in U.S. dollars unless otherwise indicated.bSee Note 7 regarding investments in the Franklin Institutional Fiduciary Trust Money Market Portfolio. The rate shown is the annualized seven-day yield at period end.
Franklin Custodian FundsStatement of Investments, September 30, 2008
106 | The accompanying notes are an integral part of these financial statements. | Annual Report
EUR - Euro ADR - American Depository ReceiptFHLB - Federal Home Loan BankFHLMC - Federal Home Loan Mortgage Corp.FNMA - Federal National Mortgage AssociationFRN - Floating Rate NoteGNMA - Government National Mortgage AssociationGP - Graduated PaymentMTN - Medium Term NotePIK - Payment-In-KindSF - Single Family
Currency Abbreviations Selected Portfolio Abbreviations

Franklin Custodian FundsFinancial Statements
Annual Report | The accompanying notes are an integral part of these financial statements. | 107
Statements of Assets and LiabilitiesSeptember 30, 2008
Franklin Franklin FranklinDynaTech Fund Growth Fund Income Fund
Assets:Investments in securities:
Cost - Unaffiliated issuers . . . . . . . . . . . . . . . . . . . . . . . . . . . . . . . . $251,742,286 $1,077,802,405 $ 52,876,329,339Cost - Non-controlled affiliated issuers (Note 10) . . . . . . . . . . . . . . . — — 1,866,793,008Cost - Sweep Money Fund (Note 7) . . . . . . . . . . . . . . . . . . . . . . . . . 21,757,500 1,560,596 268,661,516Cost - Repurchase agreements . . . . . . . . . . . . . . . . . . . . . . . . . . . . 12,228,168 — 1,864,985,975
Total cost of investments . . . . . . . . . . . . . . . . . . . . . . . . . . . . . . . . $285,727,954 $1,079,363,001 $56,876,769,838
Value - Unaffiliated issuers . . . . . . . . . . . . . . . . . . . . . . . . . . . . . . . $429,450,137 $2,341,737,593 $ 41,543,983,549Value - Non-controlled affiliated issuers (Note 10) . . . . . . . . . . . . . . — — 2,662,143,765Value - Sweep Money Fund (Note 7) . . . . . . . . . . . . . . . . . . . . . . . . 21,757,500 1,560,596 268,661,516Value - Repurchase agreements . . . . . . . . . . . . . . . . . . . . . . . . . . . . 12,228,168 — 1,864,985,975
Total value of investmentsa . . . . . . . . . . . . . . . . . . . . . . . . . . . . . . . 463,435,805 2,343,298,189 46,339,774,805Cash . . . . . . . . . . . . . . . . . . . . . . . . . . . . . . . . . . . . . . . . . . . . . . . . — 92,078 11,636,794Receivables:
Investment securities sold . . . . . . . . . . . . . . . . . . . . . . . . . . . . . . . — 1,358,440 729,144,737Capital shares sold . . . . . . . . . . . . . . . . . . . . . . . . . . . . . . . . . . . . . 380,224 2,109,578 63,311,100Dividends and interest . . . . . . . . . . . . . . . . . . . . . . . . . . . . . . . . . . 134,721 2,286,558 679,490,375
Total assets . . . . . . . . . . . . . . . . . . . . . . . . . . . . . . . . . . . . . . 463,950,750 2,349,144,843 47,823,357,811
Liabilities:Payables:
Investment securities purchased . . . . . . . . . . . . . . . . . . . . . . . . . . . 7,816,581 — 1,023,109,049Capital shares redeemed . . . . . . . . . . . . . . . . . . . . . . . . . . . . . . . . 656,151 4,952,662 212,372,950Affiliates . . . . . . . . . . . . . . . . . . . . . . . . . . . . . . . . . . . . . . . . . . . . 547,435 2,547,815 43,073,921Unaffiliated transfer agent fees . . . . . . . . . . . . . . . . . . . . . . . . . . . . 84,706 432,365 5,115,983
Payable upon return of securities loaned . . . . . . . . . . . . . . . . . . . . . . — — 29,080,893Unrealized depreciation on unfunded loan commitments (Note 9) . . . . — — 234,796Accrued expenses and other liabilities . . . . . . . . . . . . . . . . . . . . . . . . 71,743 232,777 3,014,908
Total liabilities . . . . . . . . . . . . . . . . . . . . . . . . . . . . . . . . . . . . 9,176,616 8,165,619 1,316,002,500
Net assets, at value . . . . . . . . . . . . . . . . . . . . . . . . . . . . . . $454,774,134 $2,340,979,224 $ 46,507,355,311
Net assets consist of:Paid-in capital . . . . . . . . . . . . . . . . . . . . . . . . . . . . . . . . . . . . . . . . $249,241,823 $1,083,490,921 $ 57,059,155,974Undistributed net investment income . . . . . . . . . . . . . . . . . . . . . . . . — 10,241,399 151,244,134Net unrealized appreciation (depreciation) . . . . . . . . . . . . . . . . . . . . . 177,707,851 1,263,935,188 (10,537,481,135)Accumulated net realized gain (loss) . . . . . . . . . . . . . . . . . . . . . . . . . 27,824,460 (16,688,284) (165,563,662)
Net assets, at value . . . . . . . . . . . . . . . . . . . . . . . . . . . . . . $454,774,134 $2,340,979,224 $ 46,507,355,311
aThe Franklin Income Fund includes $27,124,727 of securities loaned.

Franklin Custodian FundsFinancial Statements (continued)
108 | The accompanying notes are an integral part of these financial statements. | Annual Report
Statements of Assets and Liabilities (continued)September 30, 2008
Franklin Franklin FranklinDynaTech Fund Growth Fund Income Fund
Class A:Net assets, at value . . . . . . . . . . . . . . . . . . . . . . . . . . . . . . . . . . . . . $388,843,211 $1,708,612,045 $ 26,892,972,557
Shares outstanding . . . . . . . . . . . . . . . . . . . . . . . . . . . . . . . . . . . . . 15,632,510 45,967,776 13,612,330,541
Net asset value per sharea . . . . . . . . . . . . . . . . . . . . . . . . . . . . . . . . . $24.87 $37.17 $1.98
Maximum offering price per share (net asset value per share ÷ 94.25%, 94.25% and 95.75%, respectively) . . . . . . . . . . . . . . . . . . . . . . . . . $26.39 $39.44 $2.07
Class B:Net assets, at value . . . . . . . . . . . . . . . . . . . . . . . . . . . . . . . . . . . . . $ 10,703,816 $ 89,778,767 $ 2,428,765,169
Shares outstanding . . . . . . . . . . . . . . . . . . . . . . . . . . . . . . . . . . . . . 455,933 2,532,916 1,234,208,794
Net asset value and maximum offering price per sharea . . . . . . . . . . . . $23.48 $35.44 $1.97
Class B1:Net assets, at value . . . . . . . . . . . . . . . . . . . . . . . . . . . . . . . . . . . . . — — $ 224,712,648
Shares outstanding . . . . . . . . . . . . . . . . . . . . . . . . . . . . . . . . . . . . . — — 113,663,654
Net asset value and maximum offering price per sharea . . . . . . . . . . . . — — $1.98
Class C:Net assets, at value . . . . . . . . . . . . . . . . . . . . . . . . . . . . . . . . . . . . . $ 53,289,341 $ 255,425,099 $ 12,433,142,763
Shares outstanding . . . . . . . . . . . . . . . . . . . . . . . . . . . . . . . . . . . . . 2,294,150 7,268,101 6,249,871,016
Net asset value and maximum offering price per sharea . . . . . . . . . . . . $23.23 $35.14 $1.99
Class R:Net assets, at value . . . . . . . . . . . . . . . . . . . . . . . . . . . . . . . . . . . . . — $ 30,175,455 $ 267,955,857
Shares outstanding . . . . . . . . . . . . . . . . . . . . . . . . . . . . . . . . . . . . . — 818,448 137,082,084
Net asset value and maximum offering price per share . . . . . . . . . . . . — $36.87 $1.95
Advisor Class:Net assets, at value . . . . . . . . . . . . . . . . . . . . . . . . . . . . . . . . . . . . . $ 1,937,766 $ 256,987,858 $ 4,259,806,317
Shares outstanding . . . . . . . . . . . . . . . . . . . . . . . . . . . . . . . . . . . . . 77,829 6,898,141 2,166,945,698
Net asset value and maximum offering price per share . . . . . . . . . . . . $24.90 $37.25 $1.97
aRedemption price is equal to net asset value less contingent deferred sales charges, if applicable.

Franklin Custodian FundsFinancial Statements (continued)
Annual Report | The accompanying notes are an integral part of these financial statements. | 109
Statements of Assets and Liabilities (continued)September 30, 2008
FranklinU.S. Government FranklinSecurities Fund Utilities Fund
Assets:Investments in securities:
Cost - Unaffiliated issuers . . . . . . . . . . . . . . . . . . . . . . . . . . . . . . . . . . . . . . . . . . . . . . . $6,550,072,650 $1,647,519,944Cost - Sweep Money Fund (Note 7) . . . . . . . . . . . . . . . . . . . . . . . . . . . . . . . . . . . . . . . . 268,656,075 2,283,674Cost - Repurchase agreements . . . . . . . . . . . . . . . . . . . . . . . . . . . . . . . . . . . . . . . . . . . 225,485,000 —
Total cost of investments . . . . . . . . . . . . . . . . . . . . . . . . . . . . . . . . . . . . . . . . . . . . . . . $7,044,213,725 $1,649,803,618
Value - Unaffiliated issuers . . . . . . . . . . . . . . . . . . . . . . . . . . . . . . . . . . . . . . . . . . . . . . $6,544,920,621 $2,288,901,462Value - Sweep Money Fund (Note 7) . . . . . . . . . . . . . . . . . . . . . . . . . . . . . . . . . . . . . . . 268,656,075 2,283,674Value - Repurchase agreements . . . . . . . . . . . . . . . . . . . . . . . . . . . . . . . . . . . . . . . . . . . 225,485,000 —
Total value of investments . . . . . . . . . . . . . . . . . . . . . . . . . . . . . . . . . . . . . . . . . . . . . . . 7,039,061,696 2,291,185,136Cash . . . . . . . . . . . . . . . . . . . . . . . . . . . . . . . . . . . . . . . . . . . . . . . . . . . . . . . . . . . . . . . 3,618 —Receivables:
Investment securities sold . . . . . . . . . . . . . . . . . . . . . . . . . . . . . . . . . . . . . . . . . . . . . . — 5,012,592Capital shares sold . . . . . . . . . . . . . . . . . . . . . . . . . . . . . . . . . . . . . . . . . . . . . . . . . . . . 51,645,997 2,083,560Dividends and interest . . . . . . . . . . . . . . . . . . . . . . . . . . . . . . . . . . . . . . . . . . . . . . . . . 29,560,732 6,750,901
Total assets . . . . . . . . . . . . . . . . . . . . . . . . . . . . . . . . . . . . . . . . . . . . . . . . . . . . . 7,120,272,043 2,305,032,189
Liabilities:Payables:
Investment securities purchased . . . . . . . . . . . . . . . . . . . . . . . . . . . . . . . . . . . . . . . . . . 150,132,813 —Capital shares redeemed . . . . . . . . . . . . . . . . . . . . . . . . . . . . . . . . . . . . . . . . . . . . . . . — 5,808,087Affiliates . . . . . . . . . . . . . . . . . . . . . . . . . . . . . . . . . . . . . . . . . . . . . . . . . . . . . . . . . . . 3,531,786 1,960,331Unaffiliated transfer agent fees . . . . . . . . . . . . . . . . . . . . . . . . . . . . . . . . . . . . . . . . . . . 811,317 308,167
Accrued expenses and other liabilities . . . . . . . . . . . . . . . . . . . . . . . . . . . . . . . . . . . . . . . 365,075 202,917
Total liabilities . . . . . . . . . . . . . . . . . . . . . . . . . . . . . . . . . . . . . . . . . . . . . . . . . . . 154,840,991 8,279,502
Net assets, at value . . . . . . . . . . . . . . . . . . . . . . . . . . . . . . . . . . . . . . . . . . . . . $6,965,431,052 $2,296,752,687
Net assets consist of:Paid-in capital . . . . . . . . . . . . . . . . . . . . . . . . . . . . . . . . . . . . . . . . . . . . . . . . . . . . . . . . $7,375,477,253 $1,633,844,922Undistributed net investment income . . . . . . . . . . . . . . . . . . . . . . . . . . . . . . . . . . . . . . . 3,642,998 6,193,982Net unrealized appreciation (depreciation) . . . . . . . . . . . . . . . . . . . . . . . . . . . . . . . . . . . . (5,152,029) 641,371,032Accumulated net realized gain (loss) . . . . . . . . . . . . . . . . . . . . . . . . . . . . . . . . . . . . . . . . (408,537,170) 15,342,751
Net assets, at value . . . . . . . . . . . . . . . . . . . . . . . . . . . . . . . . . . . . . . . . . . . . . $6,965,431,052 $2,296,752,687

Franklin Custodian FundsFinancial Statements (continued)
110 | The accompanying notes are an integral part of these financial statements. | Annual Report
Statements of Assets and Liabilities (continued)September 30, 2008
FranklinU.S. Government FranklinSecurities Fund Utilities Fund
Class A:Net assets, at value . . . . . . . . . . . . . . . . . . . . . . . . . . . . . . . . . . . . . . . . . . . . . . . . . . . . $5,353,960,509 $1,769,397,237
Shares outstanding . . . . . . . . . . . . . . . . . . . . . . . . . . . . . . . . . . . . . . . . . . . . . . . . . . . . 829,532,460 148,425,313
Net asset value per sharea . . . . . . . . . . . . . . . . . . . . . . . . . . . . . . . . . . . . . . . . . . . . . . . . $6.45 $11.92
Maximum offering price per share (net asset value per share ÷ 95.75%) . . . . . . . . . . . . . . . $6.74 $12.45
Class B:Net assets, at value . . . . . . . . . . . . . . . . . . . . . . . . . . . . . . . . . . . . . . . . . . . . . . . . . . . . $ 284,648,740 $ 92,695,069
Shares outstanding . . . . . . . . . . . . . . . . . . . . . . . . . . . . . . . . . . . . . . . . . . . . . . . . . . . . 44,169,507 7,782,031
Net asset value and maximum offering price per sharea . . . . . . . . . . . . . . . . . . . . . . . . . . . $6.44 $11.91
Class C:Net assets, at value . . . . . . . . . . . . . . . . . . . . . . . . . . . . . . . . . . . . . . . . . . . . . . . . . . . . $ 610,147,602 $ 339,246,835
Shares outstanding . . . . . . . . . . . . . . . . . . . . . . . . . . . . . . . . . . . . . . . . . . . . . . . . . . . . 95,025,071 28,553,925
Net asset value and maximum offering price per sharea . . . . . . . . . . . . . . . . . . . . . . . . . . . $6.42 $11.88
Class R:Net assets, at value . . . . . . . . . . . . . . . . . . . . . . . . . . . . . . . . . . . . . . . . . . . . . . . . . . . . $ 104,648,407 $ 36,596,226
Shares outstanding . . . . . . . . . . . . . . . . . . . . . . . . . . . . . . . . . . . . . . . . . . . . . . . . . . . . 16,227,029 3,078,013
Net asset value and maximum offering price per share . . . . . . . . . . . . . . . . . . . . . . . . . . . . $6.45 $11.89
Advisor Class:Net assets, at value . . . . . . . . . . . . . . . . . . . . . . . . . . . . . . . . . . . . . . . . . . . . . . . . . . . . $ 612,025,794 $ 58,817,320
Shares outstanding . . . . . . . . . . . . . . . . . . . . . . . . . . . . . . . . . . . . . . . . . . . . . . . . . . . . 94,587,567 4,910,563
Net asset value and maximum offering price per share . . . . . . . . . . . . . . . . . . . . . . . . . . . . $6.47 $11.98
aRedemption price is equal to net asset value less contingent deferred sales charges, if applicable.

Franklin Custodian FundsFinancial Statements (continued)
Annual Report | The accompanying notes are an integral part of these financial statements. | 111
Statements of Operationsfor the year ended September 30, 2008
Franklin Franklin FranklinDynaTech Fund Growth Fund Income Fund
Investment income:Dividends:
Unaffiliated issuers . . . . . . . . . . . . . . . . . . . . . . . . . . . . . . . . . . . . . $ 3,653,727 $ 39,462,563 $ 1,164,911,091Non-controlled affiliated issuers (Note 10) . . . . . . . . . . . . . . . . . . . . . — — 181,060,531Sweep Money Fund (Note 7) . . . . . . . . . . . . . . . . . . . . . . . . . . . . . . 331,038 828,060 6,579,761
Interest . . . . . . . . . . . . . . . . . . . . . . . . . . . . . . . . . . . . . . . . . . . . . . 10,276 — 2,758,067,928Income from securities loaned . . . . . . . . . . . . . . . . . . . . . . . . . . . . . . 42,842 — 3,041,178
Total investment income . . . . . . . . . . . . . . . . . . . . . . . . . . . . . 4,037,883 40,290,623 4,113,660,489
Expenses:Management fees (Note 3a) . . . . . . . . . . . . . . . . . . . . . . . . . . . . . . . . 2,755,024 12,544,223 219,689,327Distribution fees: (Note 3c)
Class A . . . . . . . . . . . . . . . . . . . . . . . . . . . . . . . . . . . . . . . . . . . . . . 1,190,877 4,865,049 50,223,685Class B . . . . . . . . . . . . . . . . . . . . . . . . . . . . . . . . . . . . . . . . . . . . . . 145,709 1,160,677 32,557,482Class B1 . . . . . . . . . . . . . . . . . . . . . . . . . . . . . . . . . . . . . . . . . . . . . — — 2,092,799Class C . . . . . . . . . . . . . . . . . . . . . . . . . . . . . . . . . . . . . . . . . . . . . . 652,161 3,053,322 99,231,862Class R . . . . . . . . . . . . . . . . . . . . . . . . . . . . . . . . . . . . . . . . . . . . . . — 294,059 1,497,520
Transfer agent fees (Note 3e) . . . . . . . . . . . . . . . . . . . . . . . . . . . . . . . 1,135,236 4,528,767 42,660,610Custodian fees (Note 4) . . . . . . . . . . . . . . . . . . . . . . . . . . . . . . . . . . . 13,114 53,202 1,252,200Reports to shareholders . . . . . . . . . . . . . . . . . . . . . . . . . . . . . . . . . . . 86,463 396,386 5,112,111Registration and filing fees . . . . . . . . . . . . . . . . . . . . . . . . . . . . . . . . . 93,265 161,600 1,059,141Professional fees . . . . . . . . . . . . . . . . . . . . . . . . . . . . . . . . . . . . . . . . 32,615 56,575 530,022Trustees’ fees and expenses . . . . . . . . . . . . . . . . . . . . . . . . . . . . . . . . 3,438 16,704 317,614Other . . . . . . . . . . . . . . . . . . . . . . . . . . . . . . . . . . . . . . . . . . . . . . . . 31,675 41,683 1,411,825
Total expenses . . . . . . . . . . . . . . . . . . . . . . . . . . . . . . . . . . . . 6,139,577 27,172,247 457,636,198Expense reductions (Note 4) . . . . . . . . . . . . . . . . . . . . . . . . . . (443) (195) (565,564)
Net expenses . . . . . . . . . . . . . . . . . . . . . . . . . . . . . . . . . . . . 6,139,134 27,172,052 457,070,634
Net investment income (loss) . . . . . . . . . . . . . . . . . . . . . . . . (2,101,251) 13,118,571 3,656,589,855
Realized and unrealized gains (losses):Net realized gain (loss) from:
Investments:Unaffiliated issuers . . . . . . . . . . . . . . . . . . . . . . . . . . . . . . . . . . . . 43,424,048 93,114,666 (208,344,666)Non-controlled affiliated issuers (Note 10) . . . . . . . . . . . . . . . . . . . . — — 130,968,043
Realized gain distributions from REITs . . . . . . . . . . . . . . . . . . . . . . . — — 4,014,297Foreign currency transactions . . . . . . . . . . . . . . . . . . . . . . . . . . . . . . (40,773) 3,793 172,944
Net realized gain (loss) . . . . . . . . . . . . . . . . . . . . . . . . . . . . 43,383,275 93,118,459 (73,189,382)
Net change in unrealized appreciation (depreciation) on:Investments . . . . . . . . . . . . . . . . . . . . . . . . . . . . . . . . . . . . . . . . . . (169,942,555) (703,968,727) (16,753,477,846)Translation of other assets and liabilities denominated in foreign
currencies . . . . . . . . . . . . . . . . . . . . . . . . . . . . . . . . . . . . . . . . . . — — (340,310)
Net change in unrealized appreciation (depreciation) . . . . . . . (169,942,555) (703,968,727) (16,753,818,156)
Net realized and unrealized gain (loss) . . . . . . . . . . . . . . . . . . . . . . . . . (126,559,280) (610,850,268) (16,827,007,538)
Net increase (decrease) in net assets resulting from operations . . . . . . . . $(128,660,531) $(597,731,697) $(13,170,417,683)
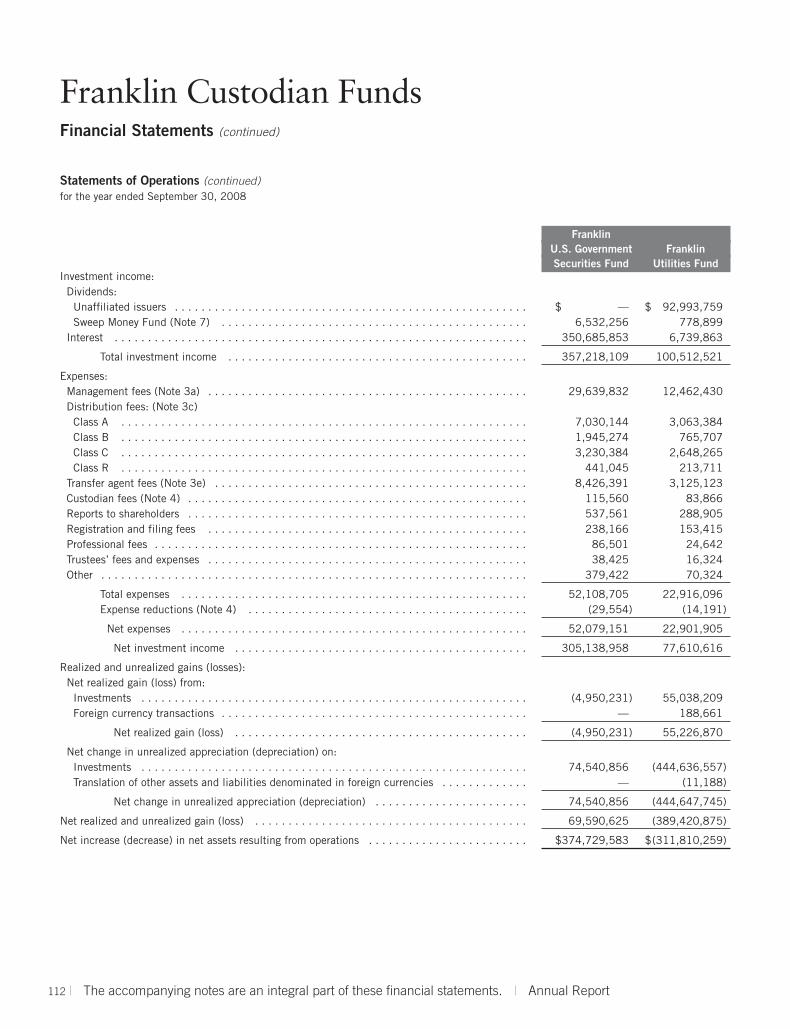
Franklin Custodian FundsFinancial Statements (continued)
112 | The accompanying notes are an integral part of these financial statements. | Annual Report
Statements of Operations (continued)for the year ended September 30, 2008
FranklinU.S. Government FranklinSecurities Fund Utilities Fund
Investment income:Dividends:
Unaffiliated issuers . . . . . . . . . . . . . . . . . . . . . . . . . . . . . . . . . . . . . . . . . . . . . . . . . . . . . $ — $ 92,993,759Sweep Money Fund (Note 7) . . . . . . . . . . . . . . . . . . . . . . . . . . . . . . . . . . . . . . . . . . . . . . 6,532,256 778,899
Interest . . . . . . . . . . . . . . . . . . . . . . . . . . . . . . . . . . . . . . . . . . . . . . . . . . . . . . . . . . . . . . 350,685,853 6,739,863
Total investment income . . . . . . . . . . . . . . . . . . . . . . . . . . . . . . . . . . . . . . . . . . . . . 357,218,109 100,512,521
Expenses:Management fees (Note 3a) . . . . . . . . . . . . . . . . . . . . . . . . . . . . . . . . . . . . . . . . . . . . . . . . 29,639,832 12,462,430Distribution fees: (Note 3c)
Class A . . . . . . . . . . . . . . . . . . . . . . . . . . . . . . . . . . . . . . . . . . . . . . . . . . . . . . . . . . . . . 7,030,144 3,063,384Class B . . . . . . . . . . . . . . . . . . . . . . . . . . . . . . . . . . . . . . . . . . . . . . . . . . . . . . . . . . . . . 1,945,274 765,707Class C . . . . . . . . . . . . . . . . . . . . . . . . . . . . . . . . . . . . . . . . . . . . . . . . . . . . . . . . . . . . . 3,230,384 2,648,265Class R . . . . . . . . . . . . . . . . . . . . . . . . . . . . . . . . . . . . . . . . . . . . . . . . . . . . . . . . . . . . . 441,045 213,711
Transfer agent fees (Note 3e) . . . . . . . . . . . . . . . . . . . . . . . . . . . . . . . . . . . . . . . . . . . . . . . 8,426,391 3,125,123Custodian fees (Note 4) . . . . . . . . . . . . . . . . . . . . . . . . . . . . . . . . . . . . . . . . . . . . . . . . . . . 115,560 83,866Reports to shareholders . . . . . . . . . . . . . . . . . . . . . . . . . . . . . . . . . . . . . . . . . . . . . . . . . . . 537,561 288,905Registration and filing fees . . . . . . . . . . . . . . . . . . . . . . . . . . . . . . . . . . . . . . . . . . . . . . . . 238,166 153,415Professional fees . . . . . . . . . . . . . . . . . . . . . . . . . . . . . . . . . . . . . . . . . . . . . . . . . . . . . . . . 86,501 24,642Trustees’ fees and expenses . . . . . . . . . . . . . . . . . . . . . . . . . . . . . . . . . . . . . . . . . . . . . . . . 38,425 16,324Other . . . . . . . . . . . . . . . . . . . . . . . . . . . . . . . . . . . . . . . . . . . . . . . . . . . . . . . . . . . . . . . . 379,422 70,324
Total expenses . . . . . . . . . . . . . . . . . . . . . . . . . . . . . . . . . . . . . . . . . . . . . . . . . . . . 52,108,705 22,916,096Expense reductions (Note 4) . . . . . . . . . . . . . . . . . . . . . . . . . . . . . . . . . . . . . . . . . . (29,554) (14,191)
Net expenses . . . . . . . . . . . . . . . . . . . . . . . . . . . . . . . . . . . . . . . . . . . . . . . . . . . . 52,079,151 22,901,905
Net investment income . . . . . . . . . . . . . . . . . . . . . . . . . . . . . . . . . . . . . . . . . . . . 305,138,958 77,610,616
Realized and unrealized gains (losses):Net realized gain (loss) from:
Investments . . . . . . . . . . . . . . . . . . . . . . . . . . . . . . . . . . . . . . . . . . . . . . . . . . . . . . . . . . (4,950,231) 55,038,209Foreign currency transactions . . . . . . . . . . . . . . . . . . . . . . . . . . . . . . . . . . . . . . . . . . . . . . — 188,661
Net realized gain (loss) . . . . . . . . . . . . . . . . . . . . . . . . . . . . . . . . . . . . . . . . . . . . (4,950,231) 55,226,870
Net change in unrealized appreciation (depreciation) on:Investments . . . . . . . . . . . . . . . . . . . . . . . . . . . . . . . . . . . . . . . . . . . . . . . . . . . . . . . . . . 74,540,856 (444,636,557)Translation of other assets and liabilities denominated in foreign currencies . . . . . . . . . . . . . — (11,188)
Net change in unrealized appreciation (depreciation) . . . . . . . . . . . . . . . . . . . . . . . 74,540,856 (444,647,745)
Net realized and unrealized gain (loss) . . . . . . . . . . . . . . . . . . . . . . . . . . . . . . . . . . . . . . . . . 69,590,625 (389,420,875)
Net increase (decrease) in net assets resulting from operations . . . . . . . . . . . . . . . . . . . . . . . . $374,729,583 $(311,810,259)

Franklin Custodian FundsFinancial Statements (continued)
Annual Report | The accompanying notes are an integral part of these financial statements. | 113
Statements of Changes in Net Assets
Franklin DynaTech Fund Franklin Growth FundYear Ended September 30, Year Ended September 30, 2008 2007 2008 2007
Increase (decrease) in net assets:Operations:
Net investment income (loss) . . . . . . . . . . . . . . $ (2,101,251) $ (2,484,227) $ 13,118,571 $ 7,383,921Net realized gain (loss) from investments
and foreign currency transactions . . . . . . . . . . 43,383,275 54,267,988 93,118,459 8,027,309Net change in unrealized appreciation
(depreciation) on investments . . . . . . . . . . . . . (169,942,555) 88,303,700 (703,968,727) 436,966,418
Net increase (decrease) in net assets resulting from operations . . . . . . . . . . . . (128,660,531) 140,087,461 (597,731,697) 452,377,648
Distributions to shareholders from:Net investment income:
Class A . . . . . . . . . . . . . . . . . . . . . . . . . . . . . — — (6,070,923) (4,596,420)Class R . . . . . . . . . . . . . . . . . . . . . . . . . . . . . — — (37,603) (7,075)Advisor Class . . . . . . . . . . . . . . . . . . . . . . . . . — — (1,821,203) (1,417,769)
Net realized gains:Class A . . . . . . . . . . . . . . . . . . . . . . . . . . . . . (11,692,397) — — —Class B . . . . . . . . . . . . . . . . . . . . . . . . . . . . . (381,099) — — —Class C . . . . . . . . . . . . . . . . . . . . . . . . . . . . . (1,631,082) — — —
Total distributions to shareholders . . . . . . . . . . . . (13,704,578) — (7,929,729) (6,021,264)
Capital share transactions: (Note 2)Class A . . . . . . . . . . . . . . . . . . . . . . . . . . . . . (43,399,423) (159,197,616) 15,676,618 111,946,191Class B . . . . . . . . . . . . . . . . . . . . . . . . . . . . . (2,207,134) (5,690,695) (23,505,949) (5,331,820)Class C . . . . . . . . . . . . . . . . . . . . . . . . . . . . . (13,103) (13,236,699) (17,756,728) 18,194,989Class R . . . . . . . . . . . . . . . . . . . . . . . . . . . . . — — (9,619,605) 8,345,533Advisor Class . . . . . . . . . . . . . . . . . . . . . . . . . 2,370,407 — (37,246,106) 34,972,750
Total capital share transactions . . . . . . . . . . . . . . (43,249,253) (178,125,010) (72,451,770) 168,127,643
Redemption fees . . . . . . . . . . . . . . . . . . . . . . . . 2,715 3,893 7,384 8,351
Net increase (decrease) in net assets . . . . . . . . . . . . . . . . . . . . . . . (185,611,647) (38,033,656) (678,105,812) 614,492,378
Net assets:Beginning of year . . . . . . . . . . . . . . . . . . . . . . . 640,385,781 678,419,437 3,019,085,036 2,404,592,658
End of year . . . . . . . . . . . . . . . . . . . . . . . . . . . . $ 454,774,134 $ 640,385,781 $2,340,979,224 $3,019,085,036
Undistributed net investment income included in net assets:End of year . . . . . . . . . . . . . . . . . . . . . . . . . . . . $ — $ — $ 10,241,399 $ 5,085,267

Franklin Custodian FundsFinancial Statements (continued)
114 | The accompanying notes are an integral part of these financial statements. | Annual Report
Statements of Changes in Net Assets (continued)
FranklinFranklin Income Fund U.S. Government Securities Fund
Year Ended September 30, Year Ended September 30,2008 2007 2008 2007
Increase (decrease) in net assets:Operations:
Net investment income . . . . . . . . . . . . . . $ 3,656,589,855 $ 2,885,381,172 $ 305,138,958 $ 301,720,105Net realized gain (loss) from investments,
realized gain distributions from REITs,and foreign currency transactions . . . . . . (73,189,382) 1,473,778,958 (4,950,231) (2,097,105)
Net change in unrealized appreciation (depreciation) on investments and translation of other assets and liabilities denominated in foreign currencies . . . . . (16,753,818,156) 2,517,987,350 74,540,856 (10,362,317)
Net increase (decrease) in net assets resulting from operations . . . . . . . . (13,170,417,683) 6,877,147,480 374,729,583 289,260,683
Distributions to shareholders from:Net investment income:
Class A . . . . . . . . . . . . . . . . . . . . . . . . (2,070,078,091) (1,687,207,815) (255,332,116) (264,748,989)Class B . . . . . . . . . . . . . . . . . . . . . . . . (175,223,876) (173,469,301) (13,147,734) (16,375,700)Class B1 . . . . . . . . . . . . . . . . . . . . . . . (18,498,215) (21,754,097) — —Class C . . . . . . . . . . . . . . . . . . . . . . . . (864,273,614) (694,869,015) (21,546,227) (19,237,012)Class R . . . . . . . . . . . . . . . . . . . . . . . . (17,491,311) (11,742,767) (3,921,392) (3,515,272)Advisor Class . . . . . . . . . . . . . . . . . . . . . (358,190,789) (280,791,335) (27,206,570) (22,110,321)
Net realized gains:Class A . . . . . . . . . . . . . . . . . . . . . . . . (800,081,992) (420,454,280) — —Class B . . . . . . . . . . . . . . . . . . . . . . . . (82,519,889) (56,272,957) — —Class B1 . . . . . . . . . . . . . . . . . . . . . . . (8,423,689) (6,844,643) — —Class C . . . . . . . . . . . . . . . . . . . . . . . . (363,101,410) (190,856,659) — —Class R . . . . . . . . . . . . . . . . . . . . . . . . (6,753,197) (2,957,517) — —Advisor Class . . . . . . . . . . . . . . . . . . . . (142,671,699) (62,928,530) — —
Total distributions to shareholders . . . . . . . . (4,907,307,772) (3,610,148,916) (321,154,039) (325,987,294)
Capital share transactions: (Note 2)Class A . . . . . . . . . . . . . . . . . . . . . . . . 1,818,347,709 6,982,490,371 236,684,954 (188,222,491)Class B . . . . . . . . . . . . . . . . . . . . . . . . (326,601,311) (237,976,392) (35,014,568) (69,804,640)Class B1 . . . . . . . . . . . . . . . . . . . . . . . (76,335,994) (91,477,067) — —Class C . . . . . . . . . . . . . . . . . . . . . . . . 1,004,888,472 3,211,521,930 189,199,415 (3,037,771)Class R . . . . . . . . . . . . . . . . . . . . . . . . 78,037,080 89,672,613 29,664,847 3,854,638Advisor Class . . . . . . . . . . . . . . . . . . . . (219,327,033) 2,131,138,371 136,835,144 85,580,325
Total capital share transactions . . . . . . . . . 2,279,008,923 12,085,369,826 557,369,792 (171,629,939)
Redemption fees . . . . . . . . . . . . . . . . . . . . 176,722 231,167 78,148 35,787
Net increase (decrease) in net assets . . . . . . . . . . . . . . . . . . . (15,798,539,810) 15,352,599,557 611,023,484 (208,320,763)
Net assets:Beginning of year . . . . . . . . . . . . . . . . . . . 62,305,895,121 46,953,295,564 6,354,407,568 6,562,728,331
End of year . . . . . . . . . . . . . . . . . . . . . . . $ 46,507,355,311 $62,305,895,121 $6,965,431,052 $6,354,407,568
Undistributed net investment income (distributions in excess of net investment income) included in net assets:End of year . . . . . . . . . . . . . . . . . . . . . . . $ 151,244,134 $ (9,898,818) $ 3,642,998 $ 4,662,479

Franklin Custodian FundsFinancial Statements (continued)
Annual Report | The accompanying notes are an integral part of these financial statements. | 115
Statements of Changes in Net Assets (continued)
Franklin Utilities Fund
Year Ended September 30, 2008 2007
Increase (decrease) in net assets:Operations:
Net investment income . . . . . . . . . . . . . . . . . . . . . . . . . . . . . . . . . . . . . . . . . . . . . . . . . . $ 77,610,616 $ 77,162,851Net realized gain (loss) from investments and foreign currency transactions . . . . . . . . . . . . . 55,226,870 122,861,109Net change in unrealized appreciation (depreciation) on investments and translation
of other assets and liabilities denominated in foreign currencies . . . . . . . . . . . . . . . . . . . . (444,647,745) 304,461,563
Net increase (decrease) in net assets resulting from operations . . . . . . . . . . . . . . . . . . (311,810,259) 504,485,523
Distributions to shareholders from:Net investment income:
Class A . . . . . . . . . . . . . . . . . . . . . . . . . . . . . . . . . . . . . . . . . . . . . . . . . . . . . . . . . . . . . (60,642,671) (60,045,625)Class B . . . . . . . . . . . . . . . . . . . . . . . . . . . . . . . . . . . . . . . . . . . . . . . . . . . . . . . . . . . . . (2,772,274) (3,213,589)Class C . . . . . . . . . . . . . . . . . . . . . . . . . . . . . . . . . . . . . . . . . . . . . . . . . . . . . . . . . . . . . (9,718,344) (10,097,373)Class R . . . . . . . . . . . . . . . . . . . . . . . . . . . . . . . . . . . . . . . . . . . . . . . . . . . . . . . . . . . . . (1,082,816) (958,675)Advisor Class . . . . . . . . . . . . . . . . . . . . . . . . . . . . . . . . . . . . . . . . . . . . . . . . . . . . . . . . (2,496,434) (2,754,192)
Net realized gains:Class A . . . . . . . . . . . . . . . . . . . . . . . . . . . . . . . . . . . . . . . . . . . . . . . . . . . . . . . . . . . . . (107,493,008) (68,750,277)Class B . . . . . . . . . . . . . . . . . . . . . . . . . . . . . . . . . . . . . . . . . . . . . . . . . . . . . . . . . . . . . (6,261,449) (4,691,564)Class C . . . . . . . . . . . . . . . . . . . . . . . . . . . . . . . . . . . . . . . . . . . . . . . . . . . . . . . . . . . . . (21,133,249) (14,079,324)Class R . . . . . . . . . . . . . . . . . . . . . . . . . . . . . . . . . . . . . . . . . . . . . . . . . . . . . . . . . . . . . (2,175,474) (1,073,396)Advisor Class . . . . . . . . . . . . . . . . . . . . . . . . . . . . . . . . . . . . . . . . . . . . . . . . . . . . . . . . (4,410,835) (2,861,866)
Total distributions to shareholders . . . . . . . . . . . . . . . . . . . . . . . . . . . . . . . . . . . . . . . . . . . . (218,186,554) (168,525,881)
Capital share transactions: (Note 2)Class A . . . . . . . . . . . . . . . . . . . . . . . . . . . . . . . . . . . . . . . . . . . . . . . . . . . . . . . . . . . . . 15,831,422 (21,840,975)Class B . . . . . . . . . . . . . . . . . . . . . . . . . . . . . . . . . . . . . . . . . . . . . . . . . . . . . . . . . . . . . (12,918,491) (23,358,533)Class C . . . . . . . . . . . . . . . . . . . . . . . . . . . . . . . . . . . . . . . . . . . . . . . . . . . . . . . . . . . . . (7,376,287) (17,678,674)Class R . . . . . . . . . . . . . . . . . . . . . . . . . . . . . . . . . . . . . . . . . . . . . . . . . . . . . . . . . . . . . 3,080,978 10,467,103Advisor Class . . . . . . . . . . . . . . . . . . . . . . . . . . . . . . . . . . . . . . . . . . . . . . . . . . . . . . . . (10,722,085) (27,554,529)
Total capital share transactions . . . . . . . . . . . . . . . . . . . . . . . . . . . . . . . . . . . . . . . . . . . . . . (12,104,463) (79,965,608)
Redemption fees . . . . . . . . . . . . . . . . . . . . . . . . . . . . . . . . . . . . . . . . . . . . . . . . . . . . . . . . 8,502 10,165
Net increase (decrease) in net assets . . . . . . . . . . . . . . . . . . . . . . . . . . . . . . . . . . . . (542,092,774) 256,004,199Net assets:
Beginning of year . . . . . . . . . . . . . . . . . . . . . . . . . . . . . . . . . . . . . . . . . . . . . . . . . . . . . . . 2,838,845,461 2,582,841,262
End of year . . . . . . . . . . . . . . . . . . . . . . . . . . . . . . . . . . . . . . . . . . . . . . . . . . . . . . . . . . . . $2,296,752,687 $2,838,845,461
Undistributed net investment income included in net assets:End of year . . . . . . . . . . . . . . . . . . . . . . . . . . . . . . . . . . . . . . . . . . . . . . . . . . . . . . . . . . . . $ 6,193,982 $ 5,263,467

Franklin Custodian FundsNotes to Financial Statements
116 | Annual Report
1. ORGANIZATION AND SIGNIFICANT ACCOUNTING POLICIES
Franklin Custodian Funds (Trust) is registered under the Investment Company Act of 1940, asamended, (1940 Act) as a diversified, open-end investment company, consisting of five funds(Funds). The classes of shares offered within each of the Funds are indicated below. EffectiveMay 15, 2008, the Franklin DynaTech Fund began offering a new class of shares, Advisor Class.Each class of shares differs by its initial sales load, contingent deferred sales charges, distributionfees, voting rights on matters affecting a single class and its exchange privilege.
Class A, Class B, Class A, Class B, Class C, Class A, Class B, Class B1,Class C & Advisor Class Class R & Advisor Class Class C, Class R & Advisor Class
Franklin DynaTech Fund Franklin Growth Fund Franklin Income Fund Franklin U.S. Government Securities FundFranklin Utilities Fund
The following summarizes the Funds’ significant accounting policies.
a. Security Valuation
Securities listed on a securities exchange or on the NASDAQ National Market are valued atthe last quoted sale price or the official closing price of the day, respectively. Over-the-countersecurities and listed securities for which there is no reported sale are valued within the range ofthe most recent quoted bid and ask prices. Securities that trade in multiple markets or on multipleexchanges are valued according to the broadest and most representative market. Investments inopen-end mutual funds are valued at the closing net asset value.
Corporate debt securities, government securities, mortgage pass-through securities, other mort-gage-backed securities, collateralized mortgage obligations and asset-backed securities generallytrade in the over-the-counter market rather than on a securities exchange. The Trust may utilizeindependent pricing services, quotations from bond dealers, and information with respect tobond and note transactions, to assist in determining a current market value for each security.The Trust’s pricing services may use valuation models or matrix pricing which considers infor-mation with respect to comparable bond and note transactions, quotations from bond dealers,or by reference to other securities that are considered comparable in such characteristics as rat-ing, interest rate and maturity date, option adjusted spread models, prepayment projections,interest rate spreads and yield curves, to determine current value.
Foreign securities are valued as of the close of trading on the foreign stock exchange on whichthe security is primarily traded, or the NYSE, whichever is earlier. If no sale is reported at thattime, the foreign security will be valued within the range of the most recent quoted bid and askprices. The value is then converted into its U.S. dollar equivalent at the foreign exchange rate ineffect at the close of the NYSE on the day that the value of the foreign security is determined.

Franklin Custodian FundsNotes to Financial Statements (continued)
Annual Report | 117
1. ORGANIZATION AND SIGNIFICANT ACCOUNTING POLICIES (continued)
a. Security Valuation (continued)
The Trust has procedures to determine the fair value of individual securities and other assets forwhich market prices are not readily available or which may not be reliably priced. Methods forvaluing these securities may include: fundamental analysis, matrix pricing, discounts frommarket prices of similar securities, or discounts applied due to the nature and duration ofrestrictions on the disposition of the securities. Due to the inherent uncertainty of valuationsof such securities, the fair values may differ significantly from the values that would have beenused had a ready market for such investments existed. Occasionally, events occur between thetime at which trading in a security is completed and the close of the NYSE that might call intoquestion the availability (including the reliability) of the value of a portfolio security held bythe fund. The investment manager monitors price movements following the close of trading inforeign stock markets through a series of country specific market proxies (such as baskets ofAmerican Depository Receipts, futures contracts and exchange traded funds). These price move-ments are measured against established trigger thresholds for each specific market proxy toassist in determining if an event has occurred. If such an event occurs, the securities may bevalued using fair value procedures, which may include the use of independent pricing services.All security valuation procedures are approved by the Trust’s Board of Trustees.
b. Foreign Currency Translation
Portfolio securities and other assets and liabilities denominated in foreign currencies are trans-lated into U.S. dollars based on the exchange rate of such currencies against U.S. dollars on thedate of valuation. Purchases and sales of securities, income and expense items denominated inforeign currencies are translated into U.S. dollars at the exchange rate in effect on the transac-tion date. Occasionally, events may impact the availability or reliability of foreign exchangerates used to convert the U.S. dollar equivalent value. If such an event occurs, the foreignexchange rate will be valued at fair value using procedures established and approved by theTrust’s Board of Trustees.
The Funds do not separately report the effect of changes in foreign exchange rates from changesin market prices on securities held. Such changes are included in net realized and unrealized gainor loss from investments on the Statement of Operations.
Realized foreign exchange gains or losses arise from sales of foreign currencies, currency gainsor losses realized between the trade and settlement dates on securities transactions and the dif-ference between the recorded amounts of dividends, interest, and foreign withholding taxesand the U.S. dollar equivalent of the amounts actually received or paid. Net unrealized foreignexchange gains and losses arise from changes in foreign exchange rates on foreign denominatedassets and liabilities other than investments in securities held at the end of the reporting period.

Franklin Custodian FundsNotes to Financial Statements (continued)
118 | Annual Report
1. ORGANIZATION AND SIGNIFICANT ACCOUNTING POLICIES (continued)
c. Repurchase Agreements
The Funds may enter into repurchase agreements. Repurchase agreements are accounted for as a loan by the fund to the seller, collateralized by securities which are delivered to the fund’s cus-todian. The market value, including accrued interest, of the initial collateralization is required to be at least 102% of the dollar amount invested by the funds, with the value of the underlyingsecurities marked to market daily to maintain coverage of at least 100%. The Funds may alsoenter into joint repurchase agreements whereby their uninvested cash balance is deposited into a joint cash account with other funds managed by the investment manager or an affiliate of theinvestment manager and is used to invest in one or more repurchase agreements. The value andface amount of the joint repurchase agreement are allocated to the funds based on their pro-ratainterest. All repurchase agreements held by the Funds at year end had been entered into onSeptember 30, 2008. Repurchase agreements are valued at cost.
d. Securities Purchased on a Delayed Delivery and TBA Basis
The Funds may purchase securities on a delayed delivery and to-be-announced (TBA) basis,with payment and delivery scheduled for a future date. These transactions are subject to mar-ket fluctuations and are subject to the risk that the value at delivery may be more or less thanthe trade date purchase price. Although the Funds will generally purchase these securities withthe intention of holding the securities, they may sell the securities before the settlement date.Sufficient assets have been segregated for these securities.
e. Foreign Currency Contracts
When the Funds purchase or sell foreign securities they may enter into foreign exchange contractsto minimize foreign exchange risk from the trade date to the settlement date of the transactions.A foreign exchange contract is an agreement between two parties to exchange different curren-cies at an agreed upon exchange rate at a future date. Realized and unrealized gains and losseson these contracts are included in the Statement of Operations.
The risks of these contracts include movement in the values of the foreign currencies relative tothe U.S. dollar and the possible inability of the counterparties to fulfill their obligations underthe contracts, which may be in excess of the amount reflected in the Statement of Assets andLiabilities.
f. Securities Lending
Certain funds may loan securities to certain brokers through a securities lending agent for whichthey receive initial cash collateral against the loaned securities in an amount equal to at least102% of the market value of the loaned securities. Collateral is maintained over the life of theloan in an amount not less than 100% of the market value of loaned securities, as determined at

Franklin Custodian FundsNotes to Financial Statements (continued)
Annual Report | 119
1. ORGANIZATION AND SIGNIFICANT ACCOUNTING POLICIES (continued)
f. Securities Lending (continued)
the close of fund business each day; any additional collateral required due to changes in securityvalues is delivered to the fund on the next business day. The collateral is invested in short-terminstruments as noted in the Statement of Investments. The fund receives interest income fromthe investment of cash collateral, adjusted by lender fees and broker rebates. The fund bears therisk of loss with respect to the investment of the collateral and the securities loaned. The securitieslending agent has agreed to indemnify the fund in the case of default of any securities borrower.
g. Senior Floating Rate Interests
Senior secured corporate loans pay interest at rates which are periodically reset by reference to abase lending rate plus a spread. These base lending rates are generally the prime rate offered bya designated U.S. bank or the London InterBank Offered Rate (LIBOR). Senior secured corpo-rate loans often require prepayment of principal from excess cash flows or at the discretion ofthe borrower. As a result, actual maturity may be substantially less than the stated maturity.
Senior secured corporate loans in which the fund invests are generally readily marketable, butmay be subject to some restrictions on resale.
h. Income Taxes
No provision has been made for U.S. income taxes because it is each fund’s policy to qualify as aregulated investment company under the Internal Revenue Code and to distribute to sharehold-ers substantially all of its taxable income and net realized gains.
The Funds have reviewed the tax positions, taken on federal income tax returns, for each of thethree open tax years and as of September 30, 2008, and have determined that no provision forincome tax is required in the Funds’ financial statements.
i. Security Transactions, Investment Income, Expenses and Distributions
Security transactions are accounted for on trade date. Realized gains and losses on security trans-actions are determined on a specific identification basis. Interest income and estimated expensesare accrued daily. Amortization of premium and accretion of discount on debt securities areincluded in interest income. Facility fees are recognized as income over the expected term of the loan. Dividend income is recorded on the ex-dividend date. Distributions to shareholders are recorded on the ex-dividend date and are determined according to income tax regulations(tax basis). Distributable earnings determined on a tax basis may differ from earnings recordedin accordance with accounting principles generally accepted in the United States of America.

Franklin Custodian FundsNotes to Financial Statements (continued)
120 | Annual Report
1. ORGANIZATION AND SIGNIFICANT ACCOUNTING POLICIES (continued)
i. Security Transactions, Investment Income, Expenses and Distributions (continued)
These differences may be permanent or temporary. Permanent differences are reclassified amongcapital accounts to reflect their tax character. These reclassifications have no impact on net assetsor the results of operations. Temporary differences are not reclassified, as they may reverse insubsequent periods.
Common expenses incurred by the Trust are allocated among the Funds based on the ratio ofnet assets of each fund to the combined net assets of the Trust. Fund specific expenses arecharged directly to the fund that incurred the expense.
Realized and unrealized gains and losses and net investment income, other than class specificexpenses, are allocated daily to each class of shares based upon the relative proportion of netassets of each class. Differences in per share distributions, by class, are generally due to differ-ences in class specific expenses.
j. Accounting Estimates
The preparation of financial statements in accordance with accounting principles generallyaccepted in the United States of America requires management to make estimates and assump-tions that affect the reported amounts of assets and liabilities at the date of the financialstatements and the amounts of income and expenses during the reporting period. Actual resultscould differ from those estimates.
k. Redemption Fees
A short term trading redemption fee was imposed, with some exceptions, on any fund sharesthat were redeemed or exchanged within seven calendar days following their purchase date. Theredemption fee was 2% of the amount redeemed. Such fees were retained by the Funds andaccounted for as an addition to paid-in capital. Effective September 1, 2008, the redemption feewas eliminated.
l. Guarantees and Indemnifications
Under the Trust’s organizational documents, its officers and trustees are indemnified by theTrust against certain liabilities arising out of the performance of their duties to the Trust.Additionally, in the normal course of business, the Trust, on behalf of the Funds, enters intocontracts with service providers that contain general indemnification clauses. The Trust’s maxi-mum exposure under these arrangements is unknown as this would involve future claims thatmay be made against the Trust that have not yet occurred. Currently, the Trust expects the riskof loss to be remote.
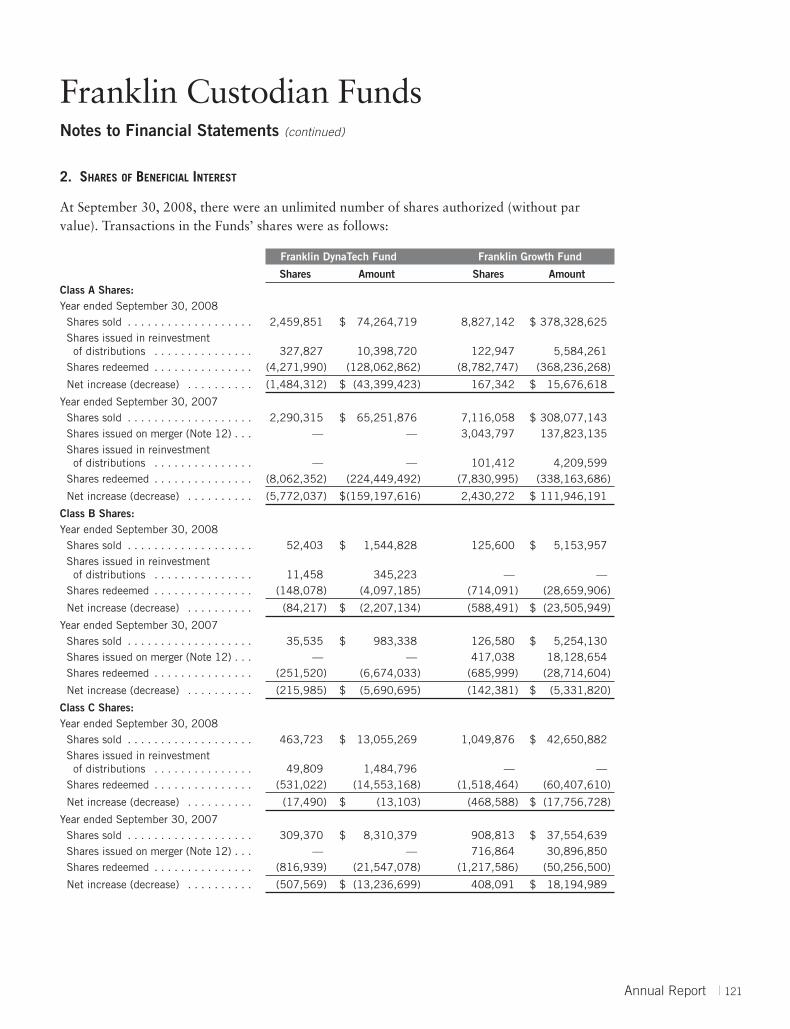
Franklin Custodian FundsNotes to Financial Statements (continued)
Annual Report | 121
2. SHARES OF BENEFICIAL INTEREST
At September 30, 2008, there were an unlimited number of shares authorized (without parvalue). Transactions in the Funds’ shares were as follows:
Franklin DynaTech Fund Franklin Growth Fund
Shares Amount Shares AmountClass A Shares:Year ended September 30, 2008
Shares sold . . . . . . . . . . . . . . . . . . . 2,459,851 $ 74,264,719 8,827,142 $ 378,328,625Shares issued in reinvestment
of distributions . . . . . . . . . . . . . . . 327,827 10,398,720 122,947 5,584,261Shares redeemed . . . . . . . . . . . . . . . (4,271,990) (128,062,862) (8,782,747) (368,236,268)
Net increase (decrease) . . . . . . . . . . (1,484,312) $ (43,399,423) 167,342 $ 15,676,618
Year ended September 30, 2007Shares sold . . . . . . . . . . . . . . . . . . . 2,290,315 $ 65,251,876 7,116,058 $ 308,077,143Shares issued on merger (Note 12) . . . — — 3,043,797 137,823,135Shares issued in reinvestment
of distributions . . . . . . . . . . . . . . . — — 101,412 4,209,599Shares redeemed . . . . . . . . . . . . . . . (8,062,352) (224,449,492) (7,830,995) (338,163,686)
Net increase (decrease) . . . . . . . . . . (5,772,037) $(159,197,616) 2,430,272 $ 111,946,191
Class B Shares:Year ended September 30, 2008
Shares sold . . . . . . . . . . . . . . . . . . . 52,403 $ 1,544,828 125,600 $ 5,153,957Shares issued in reinvestment
of distributions . . . . . . . . . . . . . . . 11,458 345,223 — —Shares redeemed . . . . . . . . . . . . . . . (148,078) (4,097,185) (714,091) (28,659,906)
Net increase (decrease) . . . . . . . . . . (84,217) $ (2,207,134) (588,491) $ (23,505,949)
Year ended September 30, 2007Shares sold . . . . . . . . . . . . . . . . . . . 35,535 $ 983,338 126,580 $ 5,254,130Shares issued on merger (Note 12) . . . — — 417,038 18,128,654Shares redeemed . . . . . . . . . . . . . . . (251,520) (6,674,033) (685,999) (28,714,604)
Net increase (decrease) . . . . . . . . . . (215,985) $ (5,690,695) (142,381) $ (5,331,820)
Class C Shares:Year ended September 30, 2008
Shares sold . . . . . . . . . . . . . . . . . . . 463,723 $ 13,055,269 1,049,876 $ 42,650,882Shares issued in reinvestment
of distributions . . . . . . . . . . . . . . . 49,809 1,484,796 — —Shares redeemed . . . . . . . . . . . . . . . (531,022) (14,553,168) (1,518,464) (60,407,610)
Net increase (decrease) . . . . . . . . . . (17,490) $ (13,103) (468,588) $ (17,756,728)
Year ended September 30, 2007Shares sold . . . . . . . . . . . . . . . . . . . 309,370 $ 8,310,379 908,813 $ 37,554,639Shares issued on merger (Note 12) . . . — — 716,864 30,896,850Shares redeemed . . . . . . . . . . . . . . . (816,939) (21,547,078) (1,217,586) (50,256,500)
Net increase (decrease) . . . . . . . . . . (507,569) $ (13,236,699) 408,091 $ 18,194,989
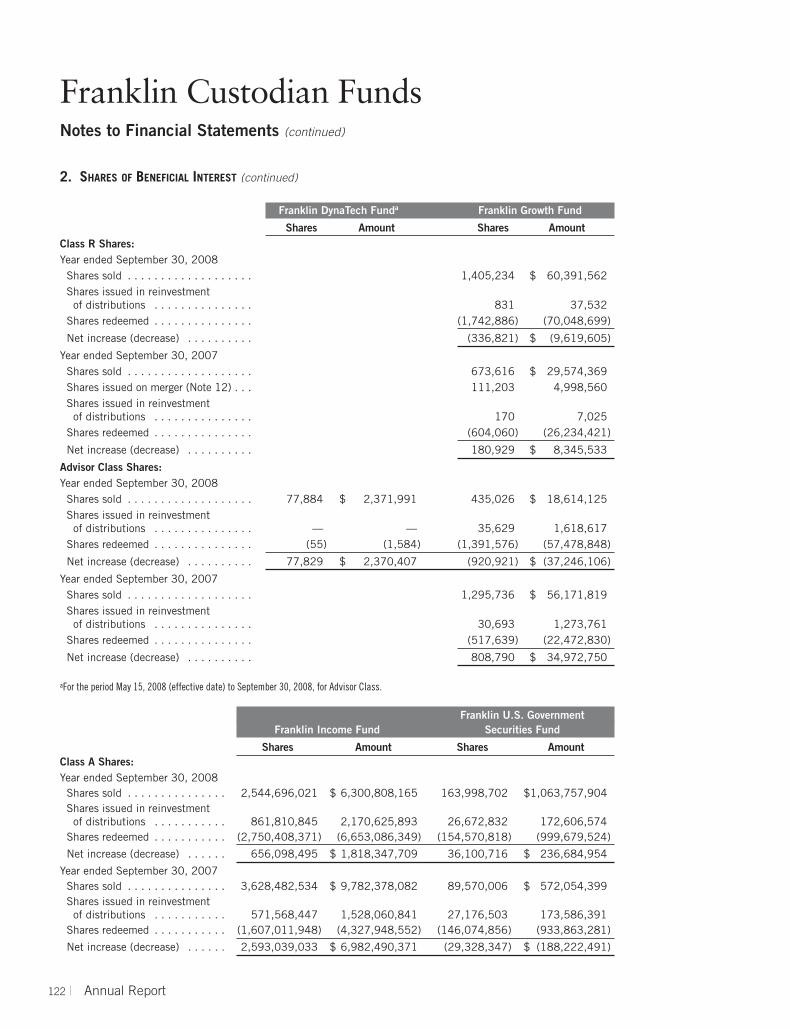
Franklin Custodian FundsNotes to Financial Statements (continued)
122 | Annual Report
2. SHARES OF BENEFICIAL INTEREST (continued)
Franklin DynaTech Funda Franklin Growth Fund
Shares Amount Shares AmountClass R Shares:Year ended September 30, 2008
Shares sold . . . . . . . . . . . . . . . . . . . 1,405,234 $ 60,391,562Shares issued in reinvestment
of distributions . . . . . . . . . . . . . . . 831 37,532Shares redeemed . . . . . . . . . . . . . . . (1,742,886) (70,048,699)
Net increase (decrease) . . . . . . . . . . (336,821) $ (9,619,605)
Year ended September 30, 2007Shares sold . . . . . . . . . . . . . . . . . . . 673,616 $ 29,574,369Shares issued on merger (Note 12) . . . 111,203 4,998,560Shares issued in reinvestment
of distributions . . . . . . . . . . . . . . . 170 7,025Shares redeemed . . . . . . . . . . . . . . . (604,060) (26,234,421)
Net increase (decrease) . . . . . . . . . . 180,929 $ 8,345,533
Advisor Class Shares:Year ended September 30, 2008
Shares sold . . . . . . . . . . . . . . . . . . . 77,884 $ 2,371,991 435,026 $ 18,614,125Shares issued in reinvestment
of distributions . . . . . . . . . . . . . . . — — 35,629 1,618,617Shares redeemed . . . . . . . . . . . . . . . (55) (1,584) (1,391,576) (57,478,848)
Net increase (decrease) . . . . . . . . . . 77,829 $ 2,370,407 (920,921) $ (37,246,106)
Year ended September 30, 2007Shares sold . . . . . . . . . . . . . . . . . . . 1,295,736 $ 56,171,819Shares issued in reinvestment
of distributions . . . . . . . . . . . . . . . 30,693 1,273,761Shares redeemed . . . . . . . . . . . . . . . (517,639) (22,472,830)
Net increase (decrease) . . . . . . . . . . 808,790 $ 34,972,750
aFor the period May 15, 2008 (effective date) to September 30, 2008, for Advisor Class.
Franklin U.S. GovernmentFranklin Income Fund Securities Fund
Shares Amount Shares AmountClass A Shares:Year ended September 30, 2008
Shares sold . . . . . . . . . . . . . . . 2,544,696,021 $ 6,300,808,165 163,998,702 $1,063,757,904Shares issued in reinvestment
of distributions . . . . . . . . . . . 861,810,845 2,170,625,893 26,672,832 172,606,574Shares redeemed . . . . . . . . . . . (2,750,408,371) (6,653,086,349) (154,570,818) (999,679,524)
Net increase (decrease) . . . . . . 656,098,495 $ 1,818,347,709 36,100,716 $ 236,684,954
Year ended September 30, 2007Shares sold . . . . . . . . . . . . . . . 3,628,482,534 $ 9,782,378,082 89,570,006 $ 572,054,399Shares issued in reinvestment
of distributions . . . . . . . . . . . 571,568,447 1,528,060,841 27,176,503 173,586,391Shares redeemed . . . . . . . . . . . (1,607,011,948) (4,327,948,552) (146,074,856) (933,863,281)
Net increase (decrease) . . . . . . 2,593,039,033 $ 6,982,490,371 (29,328,347) $ (188,222,491)

Franklin Custodian FundsNotes to Financial Statements (continued)
Annual Report | 123
2. SHARES OF BENEFICIAL INTEREST (continued)
Franklin U.S. GovernmentFranklin Income Fund Securities Fund
Shares Amount Shares AmountClass B Shares:Year ended September 30, 2008
Shares sold . . . . . . . . . . . . . . . 27,100,787 $ 66,950,743 5,348,092 $ 34,672,758Shares issued in reinvestment
of distributions . . . . . . . . . . . 69,806,922 176,086,346 1,444,414 9,335,318Shares redeemed . . . . . . . . . . . (235,941,388) (569,638,400) (12,232,414) (79,022,644)
Net increase (decrease) . . . . . . (139,033,679) $ (326,601,311) (5,439,908) $ (35,014,568)
Year ended September 30, 2007Shares sold . . . . . . . . . . . . . . . 26,283,586 $ 70,278,655 3,616,339 $ 23,020,104Shares issued in reinvestment
of distributions . . . . . . . . . . . 57,504,745 152,858,061 1,811,967 11,565,622Shares redeemed . . . . . . . . . . . (171,972,882) (461,113,108) (16,362,133) (104,390,366)
Net increase (decrease) . . . . . . (88,184,551) $ (237,976,392) (10,933,827) $ (69,804,640)
Class B1 Shares:Year ended September 30, 2008
Shares sold . . . . . . . . . . . . . . . 822,057 $ 2,065,334Shares issued in reinvestment
of distributions . . . . . . . . . . . 6,648,942 16,876,257Shares redeemed . . . . . . . . . . . (38,805,221) (95,277,585)
Net increase (decrease) . . . . . . (31,334,222) $ (76,335,994)
Year ended September 30, 2007Shares sold . . . . . . . . . . . . . . . 899,431 $ 2,413,953Shares issued in reinvestment
of distributions . . . . . . . . . . . 6,473,282 17,262,644Shares redeemed . . . . . . . . . . . (40,982,281) (111,153,664)
Net increase (decrease) . . . . . . (33,609,568) $ (91,477,067)
Class C Shares:Year ended September 30, 2008
Shares sold . . . . . . . . . . . . . . . 1,222,445,500 $ 3,049,617,623 48,720,410 $ 314,954,793Shares issued in reinvestment
of distributions . . . . . . . . . . . 334,651,278 849,748,929 2,414,820 15,553,869Shares redeemed . . . . . . . . . . . (1,188,226,292) (2,894,478,080) (21,953,511) (141,309,247)
Net increase (decrease) . . . . . . 368,870,486 $ 1,004,888,472 29,181,719 $ 189,199,415
Year ended September 30, 2007Shares sold . . . . . . . . . . . . . . . 1,644,870,588 $ 4,457,040,035 15,412,013 $ 97,975,806Shares issued in reinvestment
of distributions . . . . . . . . . . . 222,758,383 598,767,427 2,096,225 13,330,712Shares redeemed . . . . . . . . . . . (680,795,624) (1,844,285,532) (17,971,749) (114,344,289)
Net increase (decrease) . . . . . . 1,186,833,347 $ 3,211,521,930 (463,511) $ (3,037,771)

Franklin Custodian FundsNotes to Financial Statements (continued)
124 | Annual Report
2. SHARES OF BENEFICIAL INTEREST (continued)
Franklin U.S. GovernmentFranklin Income Fund Securities Fund
Shares Amount Shares AmountClass R Shares:Year ended September 30, 2008
Shares sold . . . . . . . . . . . . . . . 58,875,986 $ 144,210,207 9,784,662 $ 63,518,662Shares issued in reinvestment
of distributions . . . . . . . . . . . 8,993,345 22,370,464 589,231 3,808,045Shares redeemed . . . . . . . . . . . (36,526,510) (88,543,591) (5,812,499) (37,661,860)
Net increase (decrease) . . . . . . 31,342,821 $ 78,037,080 4,561,394 $ 29,664,847
Year ended September 30, 2007Shares sold . . . . . . . . . . . . . . . 53,585,214 $ 142,909,679 4,541,307 $ 28,992,426Shares issued in reinvestment
of distributions . . . . . . . . . . . 5,151,276 13,638,691 540,550 3,451,439Shares redeemed . . . . . . . . . . . (25,079,906) (66,875,757) (4,480,075) (28,589,227)
Net increase (decrease) . . . . . . 33,656,584 $ 89,672,613 601,782 $ 3,854,638
Advisor Class Shares:Year ended September 30, 2008
Shares sold . . . . . . . . . . . . . . . 150,837,000 $ 385,467,201 23,046,973 $ 149,358,584Shares issued in reinvestment
of distributions . . . . . . . . . . . 194,550,584 488,488,071 3,926,708 25,461,308Shares redeemed . . . . . . . . . . . (451,931,098) (1,093,282,305) (5,837,483) (37,984,748)
Net increase (decrease) . . . . . . (106,543,514) $ (219,327,033) 21,136,198 $ 136,835,144
Year ended September 30, 2007Shares sold . . . . . . . . . . . . . . . 769,652,986 $ 2,071,994,710 12,993,585 $ 83,208,714Shares issued in reinvestment
of distributions . . . . . . . . . . . 125,446,877 334,084,120 3,251,900 20,807,294Shares redeemed . . . . . . . . . . . (101,321,041) (274,940,459) (2,877,041) (18,435,683)
Net increase (decrease) . . . . . . 793,778,822 $ 2,131,138,371 13,368,444 $ 85,580,325
Franklin Utilities Fund
Shares AmountClass A Shares:Year ended September 30, 2008
Shares sold . . . . . . . . . . . . . . . . . . . . . . . . . . . . . . . . . . . . . . . . . . . . . . 16,043,525 $ 225,313,039Shares issued in reinvestment of distributions . . . . . . . . . . . . . . . . . . . . . . 9,557,544 137,168,657Shares redeemed . . . . . . . . . . . . . . . . . . . . . . . . . . . . . . . . . . . . . . . . . . (25,172,402) (346,650,274)
Net increase (decrease) . . . . . . . . . . . . . . . . . . . . . . . . . . . . . . . . . . . . . . 428,667 $ 15,831,422
Year ended September 30, 2007Shares sold . . . . . . . . . . . . . . . . . . . . . . . . . . . . . . . . . . . . . . . . . . . . . . 16,452,979 $ 234,790,574Shares issued in reinvestment of distributions . . . . . . . . . . . . . . . . . . . . . . 7,413,021 102,543,663Shares redeemed . . . . . . . . . . . . . . . . . . . . . . . . . . . . . . . . . . . . . . . . . . (25,346,996) (359,175,212)
Net increase (decrease) . . . . . . . . . . . . . . . . . . . . . . . . . . . . . . . . . . . . . . (1,480,996) $ (21,840,975)

Franklin Custodian FundsNotes to Financial Statements (continued)
Annual Report | 125
2. SHARES OF BENEFICIAL INTEREST (continued)
Franklin Utilities Fund
Shares AmountClass B Shares:Year ended September 30, 2008
Shares sold . . . . . . . . . . . . . . . . . . . . . . . . . . . . . . . . . . . . . . . . . . . . . . 520,447 $ 7,346,138Shares issued in reinvestment of distributions . . . . . . . . . . . . . . . . . . . . . . 385,638 5,555,107Shares redeemed . . . . . . . . . . . . . . . . . . . . . . . . . . . . . . . . . . . . . . . . . . (1,884,233) (25,819,736)
Net increase (decrease) . . . . . . . . . . . . . . . . . . . . . . . . . . . . . . . . . . . . . . (978,148) $ (12,918,491)
Year ended September 30, 2007Shares sold . . . . . . . . . . . . . . . . . . . . . . . . . . . . . . . . . . . . . . . . . . . . . . 350,265 $ 4,952,986Shares issued in reinvestment of distributions . . . . . . . . . . . . . . . . . . . . . . 336,830 4,638,541Shares redeemed . . . . . . . . . . . . . . . . . . . . . . . . . . . . . . . . . . . . . . . . . . (2,318,432) (32,950,060)
Net increase (decrease) . . . . . . . . . . . . . . . . . . . . . . . . . . . . . . . . . . . . . . (1,631,337) $ (23,358,533)
Class C Shares:Year ended September 30, 2008
Shares sold . . . . . . . . . . . . . . . . . . . . . . . . . . . . . . . . . . . . . . . . . . . . . . 4,526,897 $ 63,185,313Shares issued in reinvestment of distributions . . . . . . . . . . . . . . . . . . . . . . 1,256,000 18,036,872Shares redeemed . . . . . . . . . . . . . . . . . . . . . . . . . . . . . . . . . . . . . . . . . . (6,474,947) (88,598,472)
Net increase (decrease) . . . . . . . . . . . . . . . . . . . . . . . . . . . . . . . . . . . . . . (692,050) $ (7,376,287)
Year ended September 30, 2007Shares sold . . . . . . . . . . . . . . . . . . . . . . . . . . . . . . . . . . . . . . . . . . . . . . 4,165,031 $ 59,095,738Shares issued in reinvestment of distributions . . . . . . . . . . . . . . . . . . . . . . 944,817 12,995,547Shares redeemed . . . . . . . . . . . . . . . . . . . . . . . . . . . . . . . . . . . . . . . . . . (6,325,289) (89,769,959)
Net increase (decrease) . . . . . . . . . . . . . . . . . . . . . . . . . . . . . . . . . . . . . . (1,215,441) $ (17,678,674)
Class R Shares:Year ended September 30, 2008
Shares sold . . . . . . . . . . . . . . . . . . . . . . . . . . . . . . . . . . . . . . . . . . . . . . 1,413,654 $ 19,831,591Shares issued in reinvestment of distributions . . . . . . . . . . . . . . . . . . . . . . 223,864 3,206,653Shares redeemed . . . . . . . . . . . . . . . . . . . . . . . . . . . . . . . . . . . . . . . . . . (1,437,674) (19,957,266)
Net increase (decrease) . . . . . . . . . . . . . . . . . . . . . . . . . . . . . . . . . . . . . . 199,844 $ 3,080,978
Year ended September 30, 2007Shares sold . . . . . . . . . . . . . . . . . . . . . . . . . . . . . . . . . . . . . . . . . . . . . . 1,804,789 $ 25,896,475Shares issued in reinvestment of distributions . . . . . . . . . . . . . . . . . . . . . . 144,680 2,003,404Shares redeemed . . . . . . . . . . . . . . . . . . . . . . . . . . . . . . . . . . . . . . . . . . (1,227,664) (17,432,776)
Net increase (decrease) . . . . . . . . . . . . . . . . . . . . . . . . . . . . . . . . . . . . . . 721,805 $ 10,467,103
Advisor Class Shares:Year ended September 30, 2008Shares sold . . . . . . . . . . . . . . . . . . . . . . . . . . . . . . . . . . . . . . . . . . . . . . 2,965,799 $ 43,092,338Shares issued in reinvestment of distributions . . . . . . . . . . . . . . . . . . . . . . 392,475 5,664,728Shares redeemed . . . . . . . . . . . . . . . . . . . . . . . . . . . . . . . . . . . . . . . . . . (4,378,036) (59,479,151)
Net increase (decrease) . . . . . . . . . . . . . . . . . . . . . . . . . . . . . . . . . . . . . . (1,019,762) $ (10,722,085)
Year ended September 30, 2007Shares sold . . . . . . . . . . . . . . . . . . . . . . . . . . . . . . . . . . . . . . . . . . . . . . 2,917,605 $ 42,109,228Shares issued in reinvestment of distributions . . . . . . . . . . . . . . . . . . . . . . 339,912 4,731,472Shares redeemed . . . . . . . . . . . . . . . . . . . . . . . . . . . . . . . . . . . . . . . . . . (5,286,535) (74,395,229)
Net increase (decrease) . . . . . . . . . . . . . . . . . . . . . . . . . . . . . . . . . . . . . . (2,029,018) $ (27,554,529)

Franklin Custodian FundsNotes to Financial Statements (continued)
126 | Annual Report
3. TRANSACTIONS WITH AFFILIATES
Franklin Resources, Inc. is the holding company for various subsidiaries that together arereferred to as Franklin Templeton Investments. Certain officers and trustees of the Trust are alsoofficers and/or directors of the following subsidiaries:
Subsidiary Affiliation
Franklin Advisers, Inc. (Advisers) Investment managerFranklin Investment Advisory Services, LLC (Investment Advisory) Investment managerFranklin Templeton Services, LLC (FT Services) Administrative managerFranklin Templeton Distributors, Inc. (Distributors) Principal underwriterFranklin Templeton Investor Services, LLC (Investor Services) Transfer agent
a. Management Fees
Effective January 1, 2008, the Franklin Income Fund and the Franklin Utilities Fund pay aninvestment management fee to Advisers based on the month-end net assets of each of the fundsas follows:
Annualized Fee Rate Net Assets
0.625% Up to and including $100 million0.500% Over $100 million, up to and including $250 million0.450% Over $250 million, up to and including $7.5 billion0.440% Over $7.5 billion, up to and including $10 billion0.430% Over $10 billion, up to and including $12.5 billion0.420% Over $12.5 billion, up to and including $15 billion0.400% Over $15 billion, up to and including $17.5 billion0.380% Over $17.5 billion, up to and including $20 billion0.360% Over $20 billion, up to and including $35 billion0.355% Over $35 billion, up to and including $50 billion0.350% Over $50 billion, up to and including $65 billion0.345% Over $65 billion, up to and including $80 billion0.340% In excess of $80 billion
Effective January 1, 2008, the Franklin DynaTech Fund and the Franklin U.S. GovernmentSecurities Fund pay an investment management fee to Advisers, and the Franklin Growth Fundpays an investment management fee to Investment Advisory, based on the month-end net assetsof each of the funds as follows:
Annualized Fee Rate Net Assets
0.625% Up to and including $100 million0.500% Over $100 million, up to and including $250 million0.450% Over $250 million, up to and including $7.5 billion0.440% Over $7.5 billion, up to and including $10 billion0.430% Over $10 billion, up to and including $12.5 billion0.420% Over $12.5 billion, up to and including $15 billion0.400% Over $15 billion, up to and including $17.5 billion0.380% Over $17.5 billion, up to and including $20 billion0.360% Over $20 billion, up to and including $35 billion0.355% Over $35 billion, up to and including $50 billion0.350% In excess of $50 billion

Franklin Custodian FundsNotes to Financial Statements (continued)
Annual Report | 127
3. TRANSACTIONS WITH AFFILIATES (continued)
a. Management Fees (continued)
Prior to January 1, 2008, the Funds, except Franklin Growth Fund, paid fees to Advisers, andthe Franklin Growth Fund paid fees to Investment Advisory, based on the month-end net assetsof each of the funds as follows:
Annualized Fee Rate Net Assets
0.625% Up to and including $100 million0.500% Over $100 million, up to and including $250 million0.450% Over $250 million, up to and including $10 billion0.440% Over $10 billion, up to and including $12.5 billion0.420% Over $12.5 billion, up to and including $15 billion0.400% Over $15 billion, up to and including $17.5 billion0.380% Over $17.5 billion, up to and including $20 billion0.360% Over $20 billion, up to and including $35 billion0.355% Over $35 billion, up to and including $50 billion0.350% In excess of $50 billion
b. Administrative Fees
Under an agreement with Advisers and Investment Advisory, FT Services provides administrativeservices to the Funds. The fee is paid by Advisers and Investment Advisory based on averagedaily net assets, and is not an additional expense of the Funds.
c. Distribution Fees
The Trust’s Board of Trustees has adopted distribution plans for each share class, with theexception of Advisor Class shares, pursuant to Rule 12b-1 under the 1940 Act. Under theFunds’ Class A reimbursement distribution plans, the Funds reimburse Distributors for costsincurred in connection with the servicing, sale and distribution of each fund’s shares up to themaximum annual plan rate. Under the Class A reimbursement distribution plans, costs exceed-ing the maximum for the current plan year cannot be reimbursed in subsequent periods.
In addition, under the Funds’ compensation distribution plans, the Funds pay Distributors forcosts incurred in connection with the servicing, sale and distribution of each fund’s shares up tothe maximum annual plan rate for each class.
The maximum annual plan rates, based on the average daily net assets, for each class, are as follows:
FranklinFranklin Franklin Franklin U.S. Government Franklin
DynaTech Growth Income Securities UtilitiesFund Fund Fund Fund Fund
Reimbursement Plans:Class A . . . . . . . . . . . . . . . . . . . . . . . . . . 0.25% 0.25% 0.15% 0.15% 0.15%

Franklin Custodian FundsNotes to Financial Statements (continued)
128 | Annual Report
3. TRANSACTIONS WITH AFFILIATES (continued)
c. Distribution Fees (continued)
FranklinFranklin Franklin Franklin U.S. Government Franklin
DynaTech Growth Income Securities UtilitiesFund Fund Fund Fund Fund
Compensation Plans:Class B . . . . . . . . . . . . . . . . . . . . . . . . . 1.00% 1.00% 1.00% 0.65% 0.65%Class B1 . . . . . . . . . . . . . . . . . . . . . . . . — — 0.65% — —Class C . . . . . . . . . . . . . . . . . . . . . . . . . . 1.00% 1.00% 0.65% 0.65% 0.65%Class R . . . . . . . . . . . . . . . . . . . . . . . . . — 0.50% 0.50% 0.50% 0.50%
d. Sales Charges/Underwriting Agreements
Distributors has advised the Funds of the following commission transactions related to the salesand redemptions of the Funds’ shares for the year:
Franklin Franklin FranklinDynaTech Growth Income
Fund Fund Fund
Sales charges retained net of commissions paid to unaffiliated broker/dealers . . . . . . . . . . . . . . . . . . . . . . . . $71,001 $852,127 $15,139,949
Contingent deferred sales charges retained . . . . . . . . . . . . . . . . . . . $17,911 $100,295 $ 6,537,928
Franklin U.S. Government FranklinSecurities Utilities
Fund Fund
Sales charges retained net of commissions paid to unaffiliated broker/dealers . . . . . . . . . . . . . . . . . . . . . . . . $1,047,801 $365,618
Contingent deferred sales charges retained . . . . . . . . . . . . . . . . . . . $ 421,134 $107,434
e. Transfer Agent Fees
For the year ended September 30, 2008, the Funds paid transfer agent fees as noted in theStatements of Operations of which the following amounts were retained by Investor Services:
Franklin Franklin FranklinDynaTech Growth Income
Fund Fund Fund
Transfer agent fees . . . . . . . . . . . . . . . . . . . . . . . . . . . . . . . . . $822,856 $3,360,973 $22,820,164
Franklin U.S. Government Franklin
Securities UtilitiesFund Fund
Transfer agent fees . . . . . . . . . . . . . . . . . . . . . . . . . . . . . . . . . $5,433,324 $1,962,749
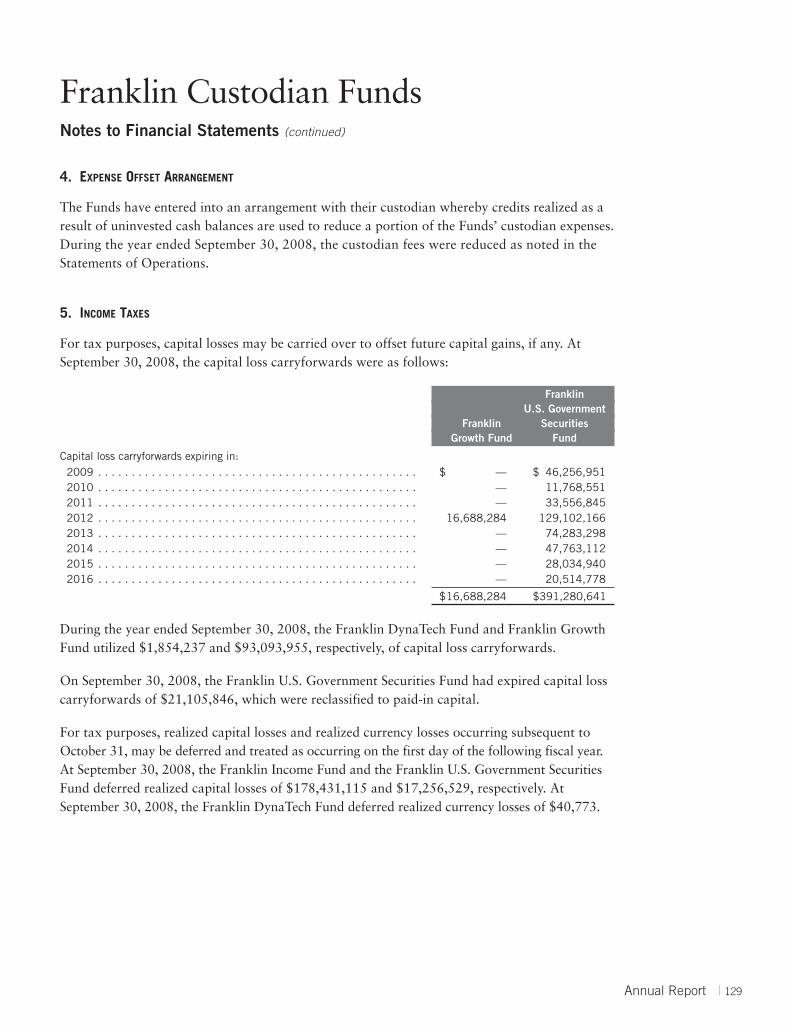
Franklin Custodian FundsNotes to Financial Statements (continued)
Annual Report | 129
4. EXPENSE OFFSET ARRANGEMENT
The Funds have entered into an arrangement with their custodian whereby credits realized as aresult of uninvested cash balances are used to reduce a portion of the Funds’ custodian expenses.During the year ended September 30, 2008, the custodian fees were reduced as noted in theStatements of Operations.
5. INCOME TAXES
For tax purposes, capital losses may be carried over to offset future capital gains, if any. AtSeptember 30, 2008, the capital loss carryforwards were as follows:
FranklinU.S. Government
Franklin SecuritiesGrowth Fund Fund
Capital loss carryforwards expiring in:2009 . . . . . . . . . . . . . . . . . . . . . . . . . . . . . . . . . . . . . . . . . . . . . . . . $ — $ 46,256,951 2010 . . . . . . . . . . . . . . . . . . . . . . . . . . . . . . . . . . . . . . . . . . . . . . . . — 11,768,551 2011 . . . . . . . . . . . . . . . . . . . . . . . . . . . . . . . . . . . . . . . . . . . . . . . . — 33,556,845 2012 . . . . . . . . . . . . . . . . . . . . . . . . . . . . . . . . . . . . . . . . . . . . . . . . 16,688,284 129,102,1662013 . . . . . . . . . . . . . . . . . . . . . . . . . . . . . . . . . . . . . . . . . . . . . . . . — 74,283,2982014 . . . . . . . . . . . . . . . . . . . . . . . . . . . . . . . . . . . . . . . . . . . . . . . . — 47,763,1122015 . . . . . . . . . . . . . . . . . . . . . . . . . . . . . . . . . . . . . . . . . . . . . . . . — 28,034,9402016 . . . . . . . . . . . . . . . . . . . . . . . . . . . . . . . . . . . . . . . . . . . . . . . . — 20,514,778
$16,688,284 $391,280,641
During the year ended September 30, 2008, the Franklin DynaTech Fund and Franklin GrowthFund utilized $1,854,237 and $93,093,955, respectively, of capital loss carryforwards.
On September 30, 2008, the Franklin U.S. Government Securities Fund had expired capital losscarryforwards of $21,105,846, which were reclassified to paid-in capital.
For tax purposes, realized capital losses and realized currency losses occurring subsequent toOctober 31, may be deferred and treated as occurring on the first day of the following fiscal year.At September 30, 2008, the Franklin Income Fund and the Franklin U.S. Government SecuritiesFund deferred realized capital losses of $178,431,115 and $17,256,529, respectively. AtSeptember 30, 2008, the Franklin DynaTech Fund deferred realized currency losses of $40,773.

Franklin Custodian FundsNotes to Financial Statements (continued)
130 | Annual Report
5. INCOME TAXES (continued)
The tax character of distributions paid during the years ended September 30, 2008 and 2007,was as follows:
Franklin DynaTech Fund Franklin Growth Fund
2008 2007 2008 2007Distributions paid from:
Ordinary income . . . . . . . . . $ — $ — $ 7,929,729 $ 6,021,264 Long term capital gain . . . . . 13,704,578 — — —
$ 13,704,578 $ — $ 7,929,729 $ 6,021,264
Franklin U.S. GovernmentFranklin Income Fund Securities Fund
2008 2007 2008 2007Distributions paid from:
Ordinary income . . . . . . . . . $3,900,167,557 $3,235,233,816 $321,154,039 $325,987,294 Long term capital gain . . . . . 1,007,140,215 374,915,100 — —
$4,907,307,772 $3,610,148,916 $321,154,039 $325,987,294
Franklin Utilities Fund
2008 2007Distributions paid from:
Ordinary income . . . . . . . . . $ 94,770,295 $ 95,172,967Long term capital gain . . . . . 123,416,259 73,352,914
$ 218,186,554 $ 168,525,881
At September 30, 2008, the cost of investments, net unrealized appreciation (depreciation),undistributed ordinary income and undistributed long term capital gains for income tax pur-poses were as follows:
Franklin Franklin FranklinDynaTech Fund Growth Fund Income Fund
Cost of investments . . . . . . . . . . . . . . . . . . . . . . $286,065,155 $1,081,960,404 $ 56,884,278,227
Unrealized appreciation . . . . . . . . . . . . . . . . . . . $192,241,695 $1,320,387,049 $ 2,473,631,624Unrealized depreciation . . . . . . . . . . . . . . . . . . . (14,871,045) (59,049,264) (13,018,135,046)
Net unrealized appreciation (depreciation) . . . . . . $177,370,650 $1,261,337,785 $(10,544,503,422)
Undistributed ordinary income . . . . . . . . . . . . . . $ — $ 10,241,400 $ 185,725,899Undistributed long term capital gains . . . . . . . . . 28,202,434 — —
Distributable earnings . . . . . . . . . . . . . . . . . . . . $ 28,202,434 $ 10,241,400 $ 185,725,899
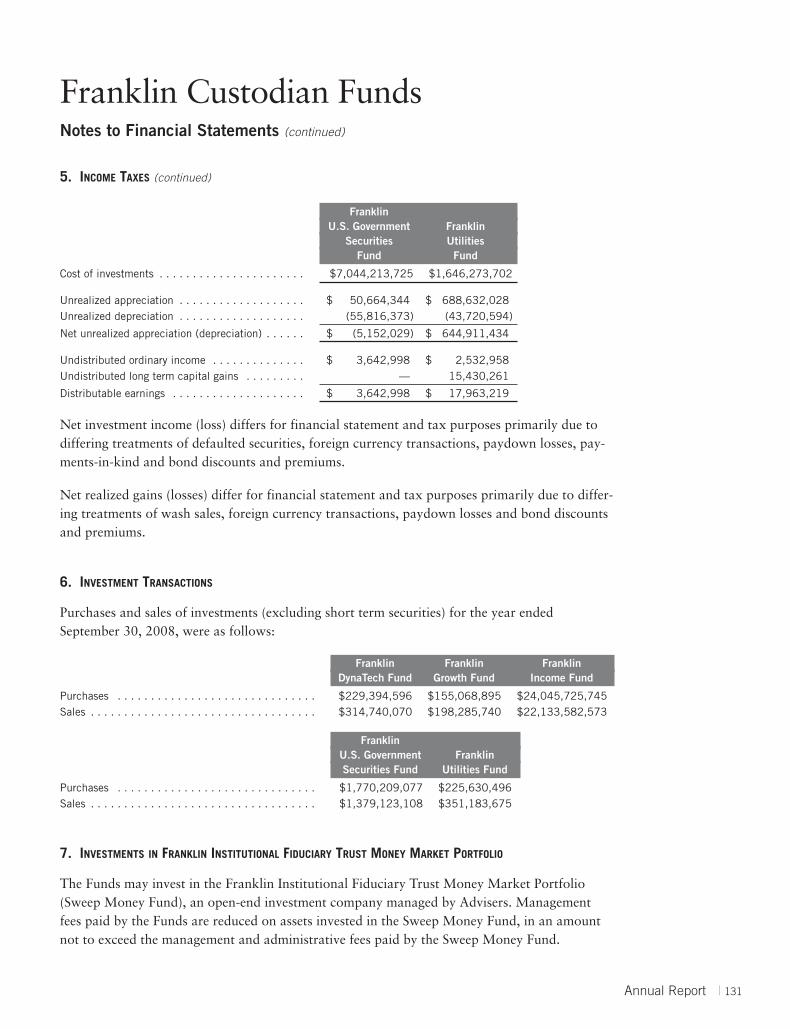
Franklin Custodian FundsNotes to Financial Statements (continued)
Annual Report | 131
5. INCOME TAXES (continued)
FranklinU.S. Government Franklin
Securities UtilitiesFund Fund
Cost of investments . . . . . . . . . . . . . . . . . . . . . . $7,044,213,725 $1,646,273,702
Unrealized appreciation . . . . . . . . . . . . . . . . . . . $ 50,664,344 $ 688,632,028Unrealized depreciation . . . . . . . . . . . . . . . . . . . (55,816,373) (43,720,594)
Net unrealized appreciation (depreciation) . . . . . . $ (5,152,029) $ 644,911,434
Undistributed ordinary income . . . . . . . . . . . . . . $ 3,642,998 $ 2,532,958Undistributed long term capital gains . . . . . . . . . — 15,430,261
Distributable earnings . . . . . . . . . . . . . . . . . . . . $ 3,642,998 $ 17,963,219
Net investment income (loss) differs for financial statement and tax purposes primarily due todiffering treatments of defaulted securities, foreign currency transactions, paydown losses, pay-ments-in-kind and bond discounts and premiums.
Net realized gains (losses) differ for financial statement and tax purposes primarily due to differ-ing treatments of wash sales, foreign currency transactions, paydown losses and bond discountsand premiums.
6. INVESTMENT TRANSACTIONS
Purchases and sales of investments (excluding short term securities) for the year endedSeptember 30, 2008, were as follows:
Franklin Franklin FranklinDynaTech Fund Growth Fund Income Fund
Purchases . . . . . . . . . . . . . . . . . . . . . . . . . . . . . . $229,394,596 $155,068,895 $24,045,725,745 Sales . . . . . . . . . . . . . . . . . . . . . . . . . . . . . . . . . . $314,740,070 $198,285,740 $22,133,582,573
FranklinU.S. Government FranklinSecurities Fund Utilities Fund
Purchases . . . . . . . . . . . . . . . . . . . . . . . . . . . . . . $1,770,209,077 $225,630,496 Sales . . . . . . . . . . . . . . . . . . . . . . . . . . . . . . . . . . $1,379,123,108 $351,183,675
7. INVESTMENTS IN FRANKLIN INSTITUTIONAL FIDUCIARY TRUST MONEY MARKET PORTFOLIO
The Funds may invest in the Franklin Institutional Fiduciary Trust Money Market Portfolio(Sweep Money Fund), an open-end investment company managed by Advisers. Managementfees paid by the Funds are reduced on assets invested in the Sweep Money Fund, in an amountnot to exceed the management and administrative fees paid by the Sweep Money Fund.

Franklin Custodian FundsNotes to Financial Statements (continued)
132 | Annual Report
8. CREDIT RISK AND DEFAULTED SECURITIES
The Franklin Income Fund has 46.2% of its portfolio invested in high yield, senior secured floating rate notes, or other securities rated below investment grade. These securities may be moresensitive to economic conditions causing greater price volatility and are potentially subject to agreater risk of loss due to default than higher rated securities.
The Franklin Income Fund held defaulted securities and/or other securities for which the incomehas been deemed uncollectible. At September 30, 2008, the aggregate value of these securitieswas $155,907,000, representing 0.34% of the fund’s net assets. The fund discontinues accruingincome on securities for which income has been deemed uncollectible and provides an estimatefor losses on interest receivable. The securities have been identified on the accompanyingStatement of Investments.
9. UNFUNDED LOAN COMMITMENTS
The Franklin Income Fund may enter into certain credit agreements, all or a portion of whichmay be unfunded. The fund is obligated to fund these loan commitments at the borrowers’ dis-cretion. Funded portions of credit agreements are presented on the Statement of Investments.
At September 30, 2008, unfunded commitments were as follows:
Unfunded Commitment
BorrowerFranklin Income FundBausch and Lomb Inc., Delayed Draw
Term Loan . . . . . . . . . . . . . . . . . . . . . . . . . . . $3,512,000
Unfunded loan commitments and funded portions of credit agreements are marked to marketdaily and any unrealized gain or loss is included in the Statement of Assets and Liabilities andStatement of Operations.

Franklin Custodian FundsNotes to Financial Statements (continued)
Annual Report | 133
10. HOLDINGS OF 5% VOTING SECURITIES OF PORTFOLIO COMPANIES
The 1940 Act defines “affiliated companies” to include investments in portfolio companies inwhich a fund owns 5% or more of the outstanding voting securities. Investments in “affiliatedcompanies” for the Franklin Income Fund for the year ended September 30, 2008, were asshown below.
Number of Number ofShares Shares RealizedHeld at Held at Value Capital
Beginning Gross Gross End at End Investment GainName of Issuer of Year Additions Reductions of Year of Year Income (Loss)
Franklin Income FundNon-Controlled AffiliatesAGL Resources Inc. . . . . . . . . . . . . . 500,000 3,500,000 — 4,000,000 $ 125,520,000 $ 3,145,000 $ —Ameren Corp . . . . . . . . . . . . . . . . . . 12,500,000 — — 12,500,000 487,875,000 31,750,000 —Canadian Oil Sands Trust . . . . . . . . 25,770,600 — 770,600 25,000,000 910,243,765 74,975,531 29,276,549 PG&E Corp. . . . . . . . . . . . . . . . . . . . 12,000,000 8,000,000 — 20,000,000 749,000,000 26,940,000 —Pinnacle West Capital Corp. . . . . . . 5,500,000 — — 5,500,000 189,255,000 11,550,000 —Public Service Enterprise Group Inc. . . . . . . . . . . . . . . . . . . . 13,500,000 — 3,500,000 20,000,000a —b 25,200,000 101,691,494
Puget Energy Inc. . . . . . . . . . . . . . . . 7,500,000 — — 7,500,000 200,250,000 7,500,000 —
Total Affiliated Securities (5.72% of Net Assets) . . . . . . . . . . . . . . . . . . . $ 2,662,143,765 $181,060,531 $130,968,043
aReflects a 2:1 stock split during the period. bAs of September 30, 2008, no longer an affiliate.
11. UPCOMING MERGERS
On July 10, 2008, the Board of Trustees for the Franklin Custodian Funds approved a proposalto merge the Franklin Global Communications Fund, the Franklin Global Health Care Fund,and the Franklin Technology Fund into the Franklin DynaTech Fund, subject to approval by theshareholders of the Franklin Global Communications Fund, the Franklin Global Health CareFund, and the Franklin Technology Fund.
12. MERGER
On June 15, 2007, the Franklin Growth Fund acquired the net assets of the Franklin Blue ChipFund pursuant to a plan of reorganization approved by the Franklin Blue Chip Fund’s share-holders. The merger was accomplished by a tax-free exchange of 3,043,797 Class A shares,417,038 Class B shares, 716,864 Class C shares, and 111,203 Class R shares of the FranklinGrowth Fund (valued at $45.28, $43.47, $43.10 and $44.95, respectively) for the net assets ofthe Franklin Blue Chip Fund which aggregate $191,847,199 and includes $49,120,531 of unre-alized appreciation (depreciation). The combined net assets of the Franklin Growth Fundimmediately after the merger were $2,955,373,004.

Franklin Custodian FundsNotes to Financial Statements (continued)
134 | Annual Report
13. REORGANIZATION TO A DELAWARE STATUTORY TRUST
On October 17, 2006, the Board of Trustees approved an Agreement and Plan of Reorganization(Agreement) whereby the Franklin Custodian Funds, Inc. would be reorganized and its domicilechanged from a Maryland corporation to a Delaware statutory trust. In connection with thesechanges, the Trust’s name was also changed to Franklin Custodian Funds, formerly known as theFranklin Custodian Funds, Inc. On April 11, 2007, shareholders of the Franklin Custodian Fundsapproved the agreement. The reorganization became effective on February 1, 2008.
14. NEW ACCOUNTING PRONOUNCEMENTS
In September 2006, the Financial Accounting Standards Board (FASB) issued FASB StatementNo. 157, “Fair Value Measurement” (SFAS 157), which defines fair value, establishes a frame-work for measuring fair value, and expands disclosures about fair value measurements. SFAS 157is effective for fiscal years beginning after November 15, 2007, and interim periods within thosefiscal years. The Trust believes the adoption of SFAS 157 will not have a material impact on itsfinancial statements.
In March 2008, FASB issued FASB Statement No. 161, “Disclosures about DerivativeInstruments and Hedging Activities, an amendment of FASB Statement No. 133” (SFAS 161),which expands disclosures about derivative investments and hedging activities. SFAS 161 iseffective for fiscal years and interim periods beginning after November 15, 2008. The Funds are currently evaluating the impact, if any, of applying the various provisions of SFAS 161.

Franklin Custodian FundsReport of Independent Registered Public Accounting Firm
Annual Report | 135
To the Board of Trustees and Shareholders of Franklin Custodian Funds
In our opinion, the accompanying statements of assets and liabilities, including the statements ofinvestments, and the related statements of operations and of changes in net assets and the finan-cial highlights present fairly, in all material respects, the financial position of Franklin DynaTechFund, Franklin Growth Fund, Franklin Income Fund, Franklin U.S. Government Securities Fundand Franklin Utilities Fund, separate portfolios of Franklin Custodian Funds, formerly FranklinCustodian Funds, Inc., (hereafter referred to as the “Funds”) at September 30, 2008, the resultsof each of their operations for the year then ended, the changes in each of their net assets for eachof the two years in the period then ended and the financial highlights for each of the periodspresented, in conformity with accounting principles generally accepted in the United States ofAmerica. These financial statements and financial highlights (hereafter referred to as “financialstatements”) are the responsibility of the Funds’ management. Our responsibility is to express anopinion on these financial statements based on our audits. We conducted our audits of these finan-cial statements in accordance with the standards of the Public Company Accounting OversightBoard (United States). Those standards require that we plan and perform the audit to obtainreasonable assurance about whether the financial statements are free of material misstatement.An audit includes examining, on a test basis, evidence supporting the amounts and disclosures inthe financial statements, assessing the accounting principles used and significant estimates madeby management, and evaluating the overall financial statement presentation. We believe that ouraudits, which included confirmation of securities at September 30, 2008 by correspondence withthe custodian and brokers, provide a reasonable basis for our opinion.
PricewaterhouseCoopers LLP
San Francisco, CaliforniaNovember 19, 2008

Franklin Custodian FundsTax Designation (unaudited)
136 | Annual Report
Under Section 852(b)(3)(C) of the Internal Revenue Code (Code), the Funds designate the maxi-mum amount allowable but no less than the following amounts as long term capital gaindividends for the fiscal year ended September 30, 2008:
Franklin Franklin FranklinDynaTech Fund Income Fund Utilities Fund
$13,704,578 $1,007,140,215 $123,416,259
Under Section 871(k)(2)(C) of the Code, the Funds designate the maximum amount allowablebut no less than the following amounts as short term capital gain dividends for purposes of thetax imposed under Section 871(a)(1)(A) of the Code for the fiscal year ended September 30, 2008:
Franklin FranklinIncome Fund Utilities Fund
$396,411,663 $17,983,826
Under Section 854(b)(2) of the Code, the Funds designate the following percentage amounts ofthe ordinary income dividends as income qualifying for the dividends received deduction for thefiscal year ended September 30, 2008.
Franklin Franklin FranklinGrowth Fund Income Fund Utilities Fund
100% 23.58% 86.81%
Under Section 854(b)(2) of the Code, the Funds designate the maximum amount allowable butno less than the following amounts as qualified dividends for purposes of the maximum rateunder Section 1(h)(11) of the Code for the fiscal year ended September 30, 2008.
Franklin Franklin FranklinGrowth Fund Income Fund Utilities Fund
$39,713,360 $978,458,233 $91,279,054
Distributions, including qualified dividend income, paid during calendar year 2008 will bereported to shareholders on Form 1099-DIV in January 2009. Shareholders are advised to checkwith their tax advisors for information on the treatment of these amounts on their individualincome tax returns.
Under Section 871(k)(1)(C) of the Code, the Funds designate the maximum amount allowablebut no less than the following amounts as interest related dividends for purposes of the taximposed under Section 871(a)(1)(A) of the Code for the fiscal year ended September 30, 2008.
FranklinFranklin Franklin U.S. Government Franklin
Growth Fund Income Fund Securities Fund Utilities Fund
$274,156 $2,551,645,846 $318,538,221 $7,512,021

Number of Portfolios inName, Year of Birth Length of Fund Complex Overseenand Address Position Time Served by Board Member* Other Directorships Held
Annual Report | 137
Franklin Custodian FundsBoard Members and Officers
The name, year of birth and address of the officers and board members, as well as their affiliations, positions held withthe Fund, principal occupations during the past five years and number of portfolios overseen in the Franklin TempletonInvestments fund complex are shown below. Generally, each board member serves until that person’s successor is electedand qualified.
Independent Board Members
Bar-S Foods (meat packing company).Harris J. Ashton (1932)One Franklin ParkwaySan Mateo, CA 94403-1906
Trustee Since 1976 144
Principal Occupation During Past 5 Years:Director of various companies; and formerly, Director, RBC Holdings, Inc. (bank holding company) (until 2002); and President, Chief ExecutiveOfficer and Chairman of the Board, General Host Corporation (nursery and craft centers) (until 1998).
Edith E. Holiday (1952)One Franklin ParkwaySan Mateo, CA 94403-1906
Trustee Since 1998 144
Principal Occupation During Past 5 Years:Director or Trustee of various companies and trusts; and formerly, Assistant to the President of the United States and Secretary of the Cabinet(1990-1993); General Counsel to the United States Treasury Department (1989-1990); and Counselor to the Secretary and Assistant Secretaryfor Public Affairs and Public Liaison-United States Treasury Department (1988-1989).
Hess Corporation (exploration andrefining of oil and gas), H.J. HeinzCompany (processed foods and alliedproducts), RTI International Metals,Inc. (manufacture and distribution of titanium), Canadian NationalRailway (railroad) and WhiteMountains Insurance Group, Ltd.(holding company).
NoneRobert F. Carlson (1928)One Franklin ParkwaySan Mateo, CA 94403-1906
Trustee Since 2007 122
Principal Occupation During Past 5 Years:Retired; and formerly, Vice President, senior member and President, Board of Administration, California Public Employees Retirement Systems(CALPERS) (1971-January 2008); member and Chairman of the Board, Sutter Community Hospitals; member, Corporate Board, Blue Shieldof California; and Chief Counsel, California Department of Transportation.
Chevron Corporation (global energycompany) and ICO GlobalCommunications (Holdings) Limited(satellite company).
Sam Ginn (1937)One Franklin ParkwaySan Mateo, CA 94403-1906
Trustee Since 2007 122
Principal Occupation During Past 5 Years:Private investor; and formerly, Chairman of the Board, Vodafone AirTouch, PLC (wireless company); Chairman of the Board and ChiefExecutive Officer, AirTouch Communications (cellular communications) (1993-1998) and Pacific Telesis Groups (telephone holding company)(1988-1994).
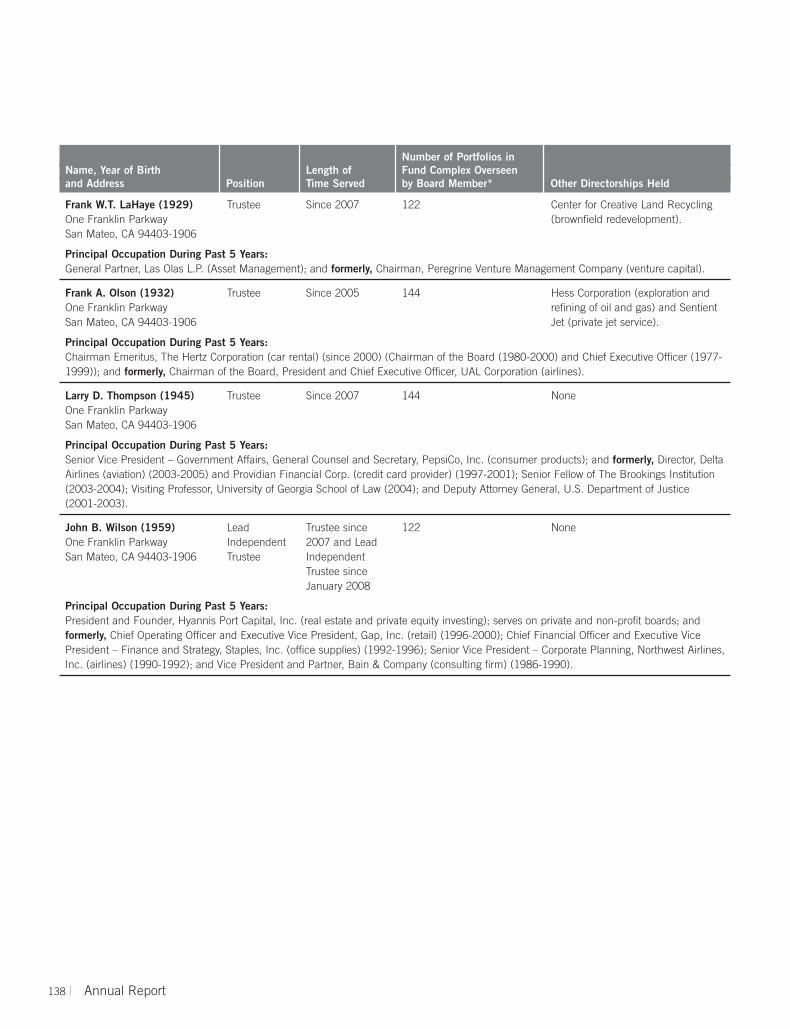
Number of Portfolios inName, Year of Birth Length of Fund Complex Overseenand Address Position Time Served by Board Member* Other Directorships Held
138 | Annual Report
Center for Creative Land Recycling(brownfield redevelopment).
Frank W.T. LaHaye (1929)One Franklin ParkwaySan Mateo, CA 94403-1906
Trustee Since 2007 122
Principal Occupation During Past 5 Years:General Partner, Las Olas L.P. (Asset Management); and formerly, Chairman, Peregrine Venture Management Company (venture capital).
Hess Corporation (exploration andrefining of oil and gas) and SentientJet (private jet service).
Frank A. Olson (1932)One Franklin ParkwaySan Mateo, CA 94403-1906
Trustee Since 2005 144
Principal Occupation During Past 5 Years:Chairman Emeritus, The Hertz Corporation (car rental) (since 2000) (Chairman of the Board (1980-2000) and Chief Executive Officer (1977-1999)); and formerly, Chairman of the Board, President and Chief Executive Officer, UAL Corporation (airlines).
NoneJohn B. Wilson (1959)One Franklin ParkwaySan Mateo, CA 94403-1906
LeadIndependentTrustee
Trustee since2007 and LeadIndependentTrustee sinceJanuary 2008
122
Principal Occupation During Past 5 Years:President and Founder, Hyannis Port Capital, Inc. (real estate and private equity investing); serves on private and non-profit boards; and formerly, Chief Operating Officer and Executive Vice President, Gap, Inc. (retail) (1996-2000); Chief Financial Officer and Executive VicePresident – Finance and Strategy, Staples, Inc. (office supplies) (1992-1996); Senior Vice President – Corporate Planning, Northwest Airlines,Inc. (airlines) (1990-1992); and Vice President and Partner, Bain & Company (consulting firm) (1986-1990).
NoneLarry D. Thompson (1945)One Franklin ParkwaySan Mateo, CA 94403-1906
Trustee Since 2007 144
Principal Occupation During Past 5 Years:Senior Vice President – Government Affairs, General Counsel and Secretary, PepsiCo, Inc. (consumer products); and formerly, Director, DeltaAirlines (aviation) (2003-2005) and Providian Financial Corp. (credit card provider) (1997-2001); Senior Fellow of The Brookings Institution(2003-2004); Visiting Professor, University of Georgia School of Law (2004); and Deputy Attorney General, U.S. Department of Justice (2001-2003).

Annual Report | 139
Not ApplicableJames M. Davis (1952)One Franklin ParkwaySan Mateo, CA 94403-1906
ChiefComplianceOfficer andVice President– AMLCompliance
Chief ComplianceOfficer since 2004and Vice President– AMLCompliance since2006
Not Applicable
Principal Occupation During Past 5 Years:Director, Global Compliance, Franklin Resources, Inc.; officer of some of the other subsidiaries of Franklin Resources, Inc. and of 46 of theinvestment companies in Franklin Templeton Investments; and formerly, Director of Compliance, Franklin Resources, Inc. (1994-2001).
None**Rupert H. Johnson, Jr. (1940)One Franklin ParkwaySan Mateo, CA 94403-1906
Trustee andVice President
Since 1983 56
Principal Occupation During Past 5 Years:Vice Chairman, Member – Office of the Chairman and Director, Franklin Resources, Inc.; Director, Franklin Advisers, Inc. and TempletonWorldwide, Inc.; Senior Vice President, Franklin Advisory Services, LLC; and officer and/or director or trustee, as the case may be, of some of the other subsidiaries of Franklin Resources, Inc. and of 44 of the investment companies in Franklin Templeton Investments.
Not ApplicableLaura F. Fergerson (1962)One Franklin ParkwaySan Mateo, CA 94403-1906
Treasurer,Chief FinancialOfficer andChiefAccountingOfficer
Treasurer since2004, ChiefFinancial Officerand ChiefAccounting Officersince February2008
Not Applicable
Principal Occupation During Past 5 Years:Vice President, Franklin Templeton Services, LLC; officer of 46 of the investment companies in Franklin Templeton Investments; and formerly,Director and member of Audit and Valuation Committees, Runkel Funds, Inc. (2003-2004); Assistant Treasurer of most of the investmentcompanies in Franklin Templeton Investments (1997-2003); and Vice President, Franklin Templeton Services, LLC (1997-2003).
None**Charles B. Johnson (1933)One Franklin ParkwaySan Mateo, CA 94403-1906
Trustee,President andChiefExecutiveOfficer –InvestmentManagement
Trustee since1969, Presidentsince 1984 andChief ExecutiveOfficer –InvestmentManagementsince 2002
144
Principal Occupation During Past 5 Years:Chairman of the Board, Member – Office of the Chairman and Director, Franklin Resources, Inc.; Director, Templeton Worldwide, Inc.; andofficer and/or director or trustee, as the case may be, of some of the other subsidiaries of Franklin Resources, Inc. and of 42 of the invest-ment companies in Franklin Templeton Investments.
Interested Board Members and Officers
Number of Portfolios inName, Year of Birth Length of Fund Complex Overseenand Address Position Time Served by Board Member* Other Directorships Held
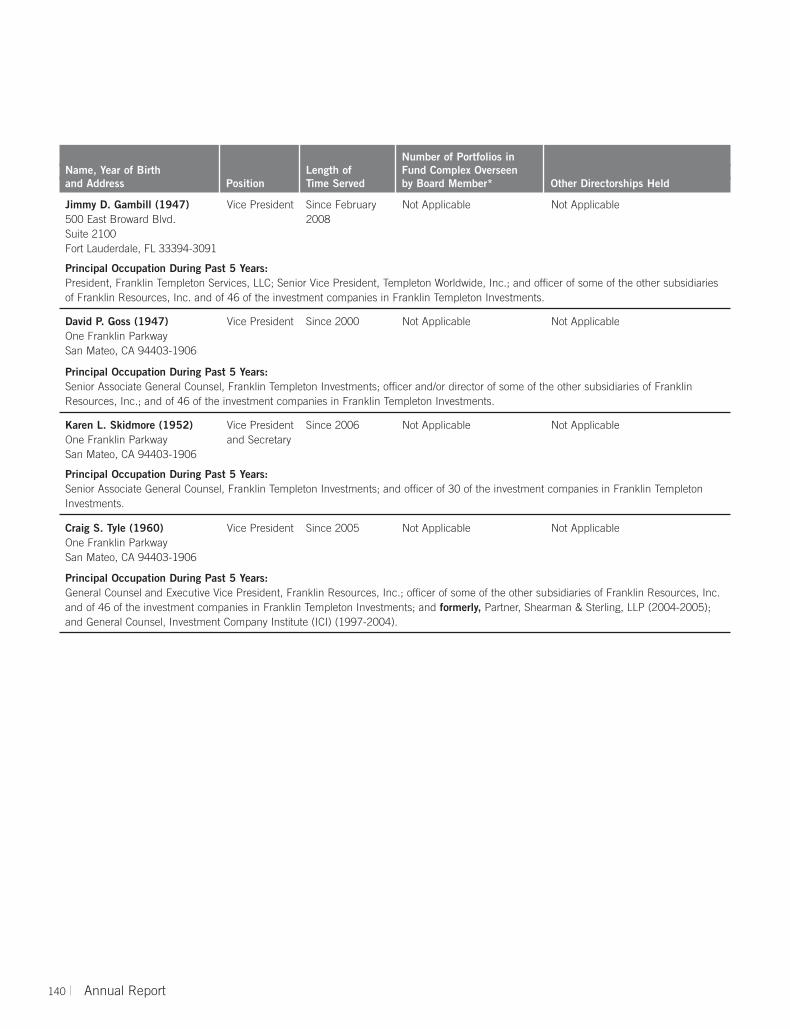
Number of Portfolios inName, Year of Birth Length of Fund Complex Overseenand Address Position Time Served by Board Member* Other Directorships Held
140 | Annual Report
Not ApplicableDavid P. Goss (1947)One Franklin ParkwaySan Mateo, CA 94403-1906
Vice President Since 2000 Not Applicable
Principal Occupation During Past 5 Years:Senior Associate General Counsel, Franklin Templeton Investments; officer and/or director of some of the other subsidiaries of FranklinResources, Inc.; and of 46 of the investment companies in Franklin Templeton Investments.
Not ApplicableJimmy D. Gambill (1947)500 East Broward Blvd.Suite 2100Fort Lauderdale, FL 33394-3091
Vice President Since February2008
Not Applicable
Principal Occupation During Past 5 Years:President, Franklin Templeton Services, LLC; Senior Vice President, Templeton Worldwide, Inc.; and officer of some of the other subsidiariesof Franklin Resources, Inc. and of 46 of the investment companies in Franklin Templeton Investments.
Not ApplicableKaren L. Skidmore (1952)One Franklin ParkwaySan Mateo, CA 94403-1906
Vice Presidentand Secretary
Since 2006 Not Applicable
Principal Occupation During Past 5 Years:Senior Associate General Counsel, Franklin Templeton Investments; and officer of 30 of the investment companies in Franklin TempletonInvestments.
Not ApplicableCraig S. Tyle (1960)One Franklin ParkwaySan Mateo, CA 94403-1906
Vice President Since 2005 Not Applicable
Principal Occupation During Past 5 Years:General Counsel and Executive Vice President, Franklin Resources, Inc.; officer of some of the other subsidiaries of Franklin Resources, Inc.and of 46 of the investment companies in Franklin Templeton Investments; and formerly, Partner, Shearman & Sterling, LLP (2004-2005);and General Counsel, Investment Company Institute (ICI) (1997-2004).

Number of Portfolios inName, Year of Birth Length of Fund Complex Overseenand Address Position Time Served by Board Member* Other Directorships Held
Annual Report | 141
Not ApplicableGalen G. Vetter (1951)500 East Broward Blvd.Suite 2100Fort Lauderdale, FL 33394-3091
Senior VicePresident andChiefExecutiveOfficer –Finance andAdministration
Since February2008
Not Applicable
Principal Occupation During Past 5 Years:Senior Vice President, Franklin Templeton Services, LLC; officer of some of the other subsidiaries of Franklin Resources, Inc. and of 46 of theinvestment companies in Franklin Templeton Investments; and formerly, Managing Director, RSM McGladrey, Inc. (1999-2004); and Partner,McGladrey & Pullen, LLP (1979-1987 and 1991-2004).
*We base the number of portfolios on each separate series of the U.S. registered investment companies within the Franklin Templeton Investments fund complex. These portfolioshave a common investment manager or affiliated investment managers.
**Charles B. Johnson and Rupert H. Johnson, Jr. are considered to be interested persons of the Fund under the federal securities laws due to their positions as officers and directorsand major shareholders of Franklin Resources, Inc., which is the parent company of the Fund’s investment manager and distributor.
Note 1: Charles B. Johnson and Rupert H. Johnson, Jr. are brothers.
Note 2: Officer information is current as of the date of this report. It is possible that after this date, information about officers may change.
The Sarbanes-Oxley Act of 2002 and Rules adopted by the Securities and Exchange Commission require the Fund to disclose whether the Fund’s Audit Committee includes at least one member who is an audit committee financial expert within the meaning of such Act and Rules. The Fund’s Board has determined that there is at least one suchfinancial expert on the Audit Committee and has designated John B. Wilson as its audit committee financial expert. The Board believes that Mr. Wilson qualifies as such anexpert in view of his extensive business background and experience, including service as chief financial officer of Staples, Inc. from 1992 to 1996. Mr. Wilson has been aMember and Chairman of the Fund’s Audit Committee since 2006. As a result of such background and experience, the Board believes that Mr. Wilson has acquired an under-standing of generally accepted accounting principles and financial statements, the general application of such principles in connection with the accounting estimates,accruals and reserves, and analyzing and evaluating financial statements that present a breadth and level of complexity of accounting issues generally comparable to thoseof the Fund, as well as an understanding of internal controls and procedures for financial reporting and an understanding of audit committee functions. Mr. Wilson is anindependent Board member as that term is defined under the relevant Securities and Exchange Commission Rules and Releases.
The Statement of Additional Information (SAI) includes additional information about the board members and is available, without charge, upon request. Shareholders maycall (800) DIAL BEN / (800) 342-5236 to request the SAI.

Franklin Custodian FundsShareholder Information
142 | Annual Report
Proxy Voting Policies and Procedures
The Fund’s investment manager has established Proxy Voting Policies and Procedures (Policies) thatthe Fund uses to determine how to vote proxies relating to portfolio securities. Shareholders mayview the Fund’s complete Policies online at franklintempleton.com. Alternatively, shareholders mayrequest copies of the Policies free of charge by calling the Proxy Group collect at (954) 527-7678or by sending a written request to: Franklin Templeton Companies, LLC, 500 East BrowardBoulevard, Suite 1500, Fort Lauderdale, FL 33394, Attention: Proxy Group. Copies of the Fund’sproxy voting records are also made available online at franklintempleton.com and posted on theU.S. Securities and Exchange Commission’s website at sec.gov and reflect the most recent 12-monthperiod ended June 30.
Quarterly Statement of Investments
The Fund files a complete statement of investments with the U.S. Securities and Exchange Commissionfor the first and third quarters for each fiscal year on Form N-Q. Shareholders may view the filedForm N-Q by visiting the Commission’s website at sec.gov. The filed form may also be viewed andcopied at the Commission’s Public Reference Room in Washington, DC. Information regarding theoperations of the Public Reference Room may be obtained by calling (800) SEC-0330.

This page intentionally left blank.

This page intentionally left blank.

Literature RequestLiterature Request. To receive a brochure and prospectus, please call us at (800) DIAL BEN/(800) 342-5236 or visit
franklintempleton.com. Investors should carefully consider a fund’s investment goals, risks, charges and expenses before
investing. The prospectus contains this and other information. Please carefully read the prospectus before investing. To ensure
the highest quality of service, we may monitor, record and access telephone calls to or from our service departments. These
calls can be identified by the presence of a regular beeping tone.
Franklin Templeton FundsVALUE
Franklin All Cap Value FundFranklin Balance Sheet Investment FundFranklin Large Cap Value FundFranklin MicroCap Value Fund1
Franklin MidCap Value FundFranklin Small Cap Value FundMutual Beacon FundMutual Qualified FundMutual Recovery Fund4
Mutual Shares Fund
BLEND
Franklin Focused Core Equity FundFranklin Large Cap Equity FundFranklin Rising Dividends Fund
GROWTH
Franklin Capital Growth FundFranklin Flex Cap Growth FundFranklin Growth FundFranklin Growth Opportunities Fund2
Franklin Small Cap Growth Fund3
Franklin Small-Mid Cap Growth Fund
SECTOR
Franklin Biotechnology Discovery FundFranklin DynaTech FundFranklin Global Real Estate FundFranklin Gold and Precious Metals FundFranklin Natural Resources FundFranklin Real Estate Securities FundFranklin Utilities FundMutual Financial Services Fund
GLOBAL
Mutual Discovery FundTempleton Global Long-Short FundTempleton Global Opportunities TrustTempleton Global Smaller Companies Fund1
Templeton Growth FundTempleton World Fund
INTERNATIONAL
Franklin India Growth FundFranklin International Growth FundFranklin International Small Cap Growth FundMutual European FundTempleton BRIC FundTempleton China World FundTempleton Developing Markets TrustTempleton Emerging Markets Small Cap FundTempleton Foreign FundTempleton Foreign Smaller Companies Fund1
Templeton Frontier Markets Fund
HYBRID
Franklin Balanced FundFranklin Convertible Securities FundFranklin Equity Income FundFranklin Income FundTempleton Income Fund
ASSET ALLOCATION
Franklin Templeton Corefolio® Allocation FundFranklin Templeton Founding Funds Allocation FundFranklin Templeton Perspectives Allocation FundFranklin Templeton Conservative Target FundFranklin Templeton Growth Target FundFranklin Templeton Moderate Target FundFranklin Templeton 2015 Retirement Target FundFranklin Templeton 2025 Retirement Target FundFranklin Templeton 2035 Retirement Target FundFranklin Templeton 2045 Retirement Target Fund
FIXED INCOME
Franklin Adjustable U.S. Government Securities Fund5
Franklin Floating Rate Daily Access FundFranklin High Income FundFranklin Limited Maturity U.S. Government
Securities Fund5
Franklin Low Duration Total Return FundFranklin Real Return FundFranklin Strategic Income Fund
Franklin Strategic Mortgage PortfolioFranklin Templeton Hard Currency FundFranklin Total Return FundFranklin U.S. Government Securities Fund5
Templeton Global Bond FundTempleton Global Total Return FundTempleton International Bond Fund
TAX-FREE INCOME6
National FundsDouble Tax-Free Income FundFederal Tax-Free Income FundHigh Yield Tax-Free Income FundInsured Tax-Free Income Fund7
Limited-/Intermediate-Term FundsCalifornia Intermediate-Term Tax-Free Income FundFederal Intermediate-Term Tax-Free Income FundFederal Limited-Term Tax-Free Income FundNew York Intermediate-Term Tax-Free Income Fund
State-Specific
1. The fund is closed to new investors. Existing shareholders and select retirement plans cancontinue adding to their accounts.2. Effective 11/1/07, Franklin Aggressive Growth Fund changed its name to Franklin GrowthOpportunities Fund. The fund’s investment goal and strategy remained the same.3. Effective 3/31/08, Franklin Small Cap Growth Fund II changed its name to Franklin SmallCap Growth Fund. The fund’s investment goal and strategy remained the same.4. The fund is a continuously offered, closed-end fund. Shares may be purchased daily; thereis no daily redemption. However, each quarter, pending board approval, the fund will authorizethe repurchase of 5%–25% of the outstanding number of shares. Investors may tender all ora portion of their shares during the tender period.
5. An investment in the fund is neither insured nor guaranteed by the U.S. government or byany other entity or institution.6. For investors subject to the alternative minimum tax, a small portion of fund dividends maybe taxable. Distributions of capital gains are generally taxable.7. The fund invests primarily in insured municipal securities.8. These funds are available in four or more variations, including long-term portfolios,intermediate-term portfolios, portfolios of insured securities, a high-yield portfolio (CA only)and money market portfolios.9. The funds of the Franklin Templeton Variable Insurance Products Trust are generallyavailable only through insurance company variable contracts.
11/08 Not part of the annual report
AlabamaArizonaCalifornia8
ColoradoConnecticutFloridaGeorgiaKentuckyLouisianaMarylandMassachusetts7
Michigan7
Minnesota7
MissouriNew JerseyNew York8
North CarolinaOhio7
OregonPennsylvaniaTennesseeVirginia
INSURANCE FUNDS
Franklin Templeton Variable Insurance Products Trust9

An
nu
al
Re
po
rt a
nd
Sh
are
ho
lde
r L
ett
er
Fr
an
kli
n C
ust
od
ian
Fu
nd
s
Inve
stm
en
t M
an
ag
er
Fran
klin
Adv
iser
s, I
nc.
Dis
trib
uto
r
Fran
klin
Tem
plet
on D
istr
ibut
ors,
Inc
.(8
00)
DIA
L B
EN®
fran
klin
tem
plet
on.c
om
Sh
are
ho
lde
r S
erv
ice
s
(800
) 63
2-23
01
Aut
horiz
ed fo
r di
strib
utio
n on
ly w
hen
acco
mpa
nied
or
prec
eded
by
a pr
ospe
ctus
.In
vest
ors
shou
ld c
aref
ully
con
side
r a
fund
’s in
vest
men
t goa
ls, r
isks
, cha
rges
and
expe
nses
bef
ore
inve
stin
g. T
he p
rosp
ectu
s co
ntai
ns th
is a
nd o
ther
info
rmat
ion;
plea
se r
ead
it ca
refu
lly b
efor
e in
vest
ing.
To e
nsur
e th
e hi
ghes
t qua
lity
of s
ervi
ce, t
elep
hone
cal
ls to
or
from
our
ser
vice
dep
artm
ents
may
be
mon
itore
d, r
ecor
ded
and
acce
ssed
. The
se c
alls
can
be
iden
tifie
d by
the
pres
ence
of a
reg
ular
bee
ping
tone
.
FCF
A20
08 1
1/08
One
Fra
nklin
Par
kway
San
Mat
eo,
CA
944
03-1
906
Wan
t to
rec
eive
thi
s do
cum
ent FA
STE
Rvi
a em
ail?
Elig
ible
sha
reho
lder
s ca
n si
gn u
p fo
r eD
eliv
ery
atfr
ankl
inte
mpl
eton
.com
. Se
e in
side
for
det
ails
.