Embed Size (px)
Citation preview

Frankfurt (Germany), 6-9 June 2011
Ying Wang – China – Session2– Paper 0587
Voltage Sag Frequency Assessment Considering Customer Satisfaction Degree
Ying Wang
Sichuan University ,China
E-mail:[email protected]

Frankfurt (Germany), 6-9 June 2011
Contents
1. Introduction 1. Introduction
2. Customer Satisfaction degree and its Interval Characteristic2. Customer Satisfaction degree and its Interval Characteristic
3. Voltage Sag Assessment Under Interval Measure 3. Voltage Sag Assessment Under Interval Measure
4. Proposed Analytical Method 4. Proposed Analytical Method
5. Case Studies5. Case Studies
6. Conclusions 6. Conclusions

Frankfurt (Germany), 6-9 June 2011
What is purpose of
the utilities?
For money? Supply light or heat?
Power the machines?

Frankfurt (Germany), 6-9 June 2011
To meet customer satisfaction is the main concern for the utilities and customers
Especially, when smart grid becomes a household name
What is customer satisfaction degree (CSD) ?

Frankfurt (Germany), 6-9 June 2011
Voltage sag classical assessment methods
1
2
Statistic methodStatistic method
Modeling methodModeling method
reliabledirect
Long monitoring Costly installation
Analytical method
Fuzzy method
Probabillity method
Other uncertainty method

Frankfurt (Germany), 6-9 June 2011
2. Customer Satisfaction degree (CSD)and its Interval Characteristic
2. Customer Satisfaction degree (CSD)and its Interval Characteristic
% 100% 100%s s
s c t
T TS
T T T
Sets the total operation time is Tt;the normal operation time as Ts; the abnormal operation time as Tc; Tt= Ts + Tc,
The CSD presented by S % is:

Frankfurt (Germany), 6-9 June 2011
2. Customer Satisfaction degree (CSD)and its Interval Characteristic
2. Customer Satisfaction degree (CSD)and its Interval Characteristic
Satisfaction area
Satisfaction degree uncertainty area
Un-satisfaction area
Curve 2
Curve 1
U/p.u.
Umax
Umin
Tmax Tmin T/ms
presented by an interval data
based on the upper and lower thresholds of equipment voltage tolerance.
CSD varies in a range
outside the curve 1--- operates normally
inside curve 2 ---un-satisfaction area
between the curve 1 and 2 is the uncertainty area.

Frankfurt (Germany), 6-9 June 2011
Equipment types
Umin
(%)
Umax
(%)
Tmin
(ms)
Tmax
(ms)
PLC 30 90 20 400
ASD 59 71 15 175
PC 46 63 40 205
2. Customer Satisfaction degree (CSD)and its Interval Characteristic
2. Customer Satisfaction degree (CSD)and its Interval Characteristic
Tab. 1 the uncertain ranges of sensitive equipments
B. Description of the contents
satisfaction area
S%=100
unsatisfaction area
S%=0
uncertainty area
S%=[0,100 ]

Frankfurt (Germany), 6-9 June 2011
3. Voltage Sag Assessment Under Interval Measure 3. Voltage Sag Assessment Under Interval Measure
1-x
m
Power supply system
nf
i
x
(1 )k k kif im inZ x Z xZ
2(1 ) 2 (1 ) (1 )k k k k kff mm nn mn mnZ x Z xZ x x Z x x z
( )pf pf pf pff m n mV V V V x
pfmV pf
nVwhere, and are pre-fault voltage at bus m and n. 0 1 2
0 1 2
if if ifpf pfi i f
ff ff ff
Z Z ZV V V
Z Z Z
The voltage sag frequency is an interval range depending on CSD. The interval number of voltage sag is:
[ , ]i c c uN N N N
Frankfurt (Germany), 6-9 June 2011
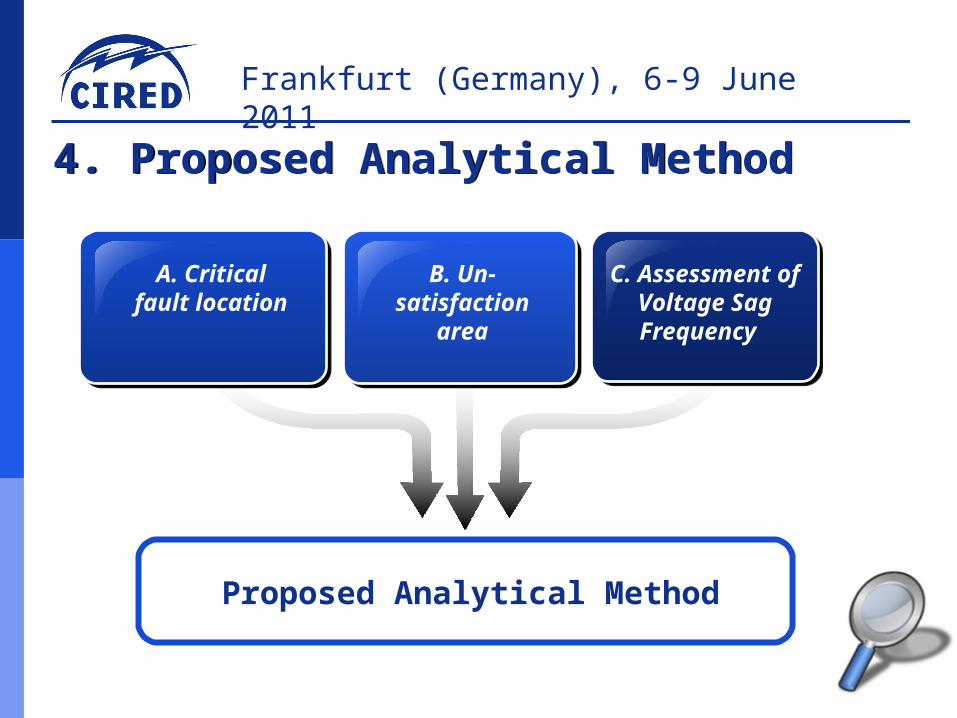
4. Proposed Analytical Method 4. Proposed Analytical Method
A. Critical fault
location
B. Un-satisfaction
area
C. Assessment of Voltage Sag
Frequency
Proposed Analytical Method

Frankfurt (Germany), 6-9 June 2011
4-A. Critical fault location
( ) 0crit th if x V V
Vth is the limit voltage , The fault position xcrit is the critical fault point
Using Newton iteration method, the iteration equation is:
1
( )nn n
n
f xx x
f x
( )( 0,1,2 )n
where the xn , xn+1 are iteration values
11
11
( )3 ( ) 4 ( ) ( )
2
n nn n n
n nn n
x xx x f x
x xf x f f x

Frankfurt (Germany), 6-9 June 2011
4-B. Un-satisfaction areaVL is short for “voltage limit ”,VSM is short for “voltage sag magnitude ”
SA is short for “satisfaction area”, U-SA is short for“ un-satisfaction area”
Step I
Step IIStep II
Step IIIStep III
Step IVStep IV
if the VL is less than the VSM both in the fault line beginning and the end, the bus is in the SA.
if the VL is more than the VSM in all the point , the bus is in the U-SA.
the VL is between the VSM in the bus beginning and the end, there is a critical fault point and the line is partly in the U-SA.
if the VL is less than the maximum in all the point, and more than the VSM both in the beginning and the end, there are two critical fault points and the line have two parts in the U-SA.

Frankfurt (Germany), 6-9 June 2011
4-C. Assessment of Voltage Sag Frequency Based on Un-satisfaction area Uniform distribution of fault position along the transmission line was assumed, the sag frequency is:
1
n
i j jj
N l
where δj and lj are the fault rate and fault line length in customer un-satisfaction area; n is the bus number.

Frankfurt (Germany), 6-9 June 2011
5. Case StudiesA five-bus power system shown in the Figure
j0.025
j0.025
j0.01
j0.10 j0.05
j0.02 j0.045
2
1 5 4 3
Tab.2 Voltage sags per year at various busses
BussNumber
Proposed
Method
Fault Positions Method
P=10 P=100 P=1000
2 22.23 24.4 22.52 22.252
4 4.115 5.6 4.28 4.116
5 6.676 8.4 6.92 6.7
Buss Number
Proposed Method
Secant Iteration Method
2 9 18
4 8 12
5 8 11
Tab.3 The numbers of iteration at various busses

Frankfurt (Germany), 6-9 June 2011
5. Case StudiesThe simulated system shown in Figure. It consists of 6 generator units, 30 buses interconnected by 37 lines and 4 transformers.

Frankfurt (Germany), 6-9 June 2011
5. Case Studies
Buss
Number
PC PLC ASD
Monte Carlo
Simulation
Proposed Method
Monte Carlo
Simulation
Proposed Method
Monte Carlo
Simulation
Proposed Method
7[5.2848,
9.4808]
[5.2767, 9.4815]
[2.6157, 27.568]
[2.5829, 27.591]
[8.4264, 11.880]
[8.4242, 11.882]
15[1.6674,
8.2391]
[1.6521, 8.2443]
[0.9309, 32.217]
[0.9107, 32.225]
[5.5859, 14.150]
[5.5851, 14.155]
21[3.4316,
10.545]
[3.4297, 10.548]
[1.5520, 34.203]
[1.5481, 34.207]
[8.2879, 16.052]
[8.2822, 16.054]
26[6.5614,
14.086]
[6.5612, 14.075]
[1.6654, 36.070]
[1.6478, 36.081]
[12.367, 19.909]
[12.358, 19.933]
30[8.5904,
14.284]
[8.5902, 14.288]
[4.9952, 36.111]
[4.9606, 36.118]
[12.408, 18.510]
[12.400, 18.511]
Tab.4 Voltage sags per year for different assessment methods
Frankfurt (Germany), 6-9 June 2011
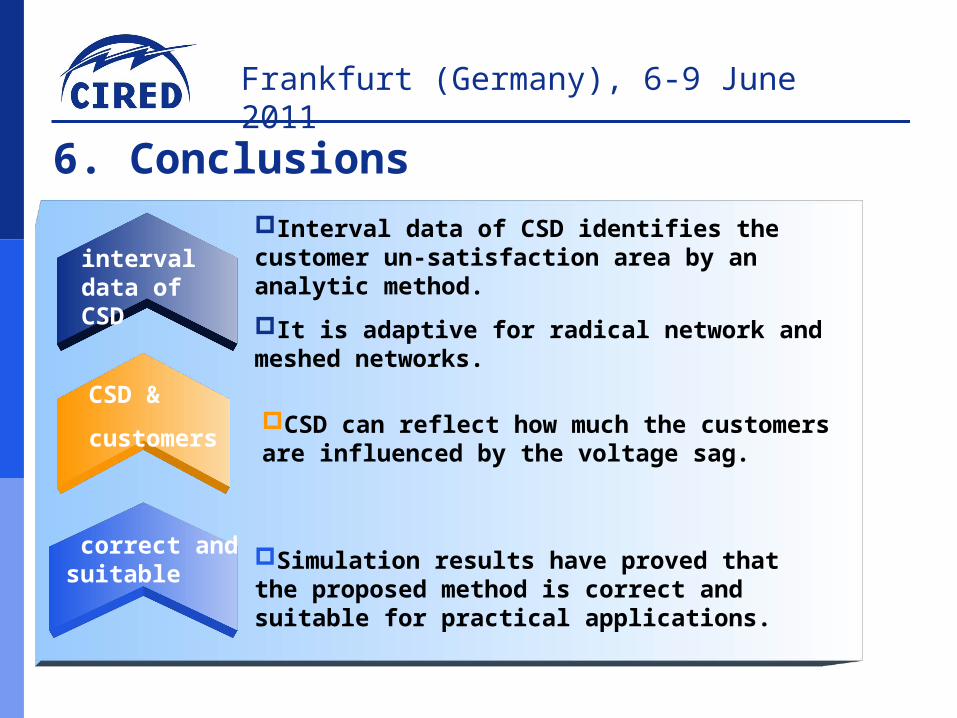
6. Conclusions
interval data of CSD
CSD &
customers
correct and suitable
Interval data of CSD identifies the customer un-satisfaction area by an analytic method.
It is adaptive for radical network and meshed networks.
Simulation results have proved that the proposed method is correct and suitable for practical applications.
CSD can reflect how much the customers are influenced by the voltage sag.

Frankfurt (Germany), 6-9 June 2011