Embed Size (px)
Citation preview
Press Conference 2011
Frankfurt am Main, 29.03.2011
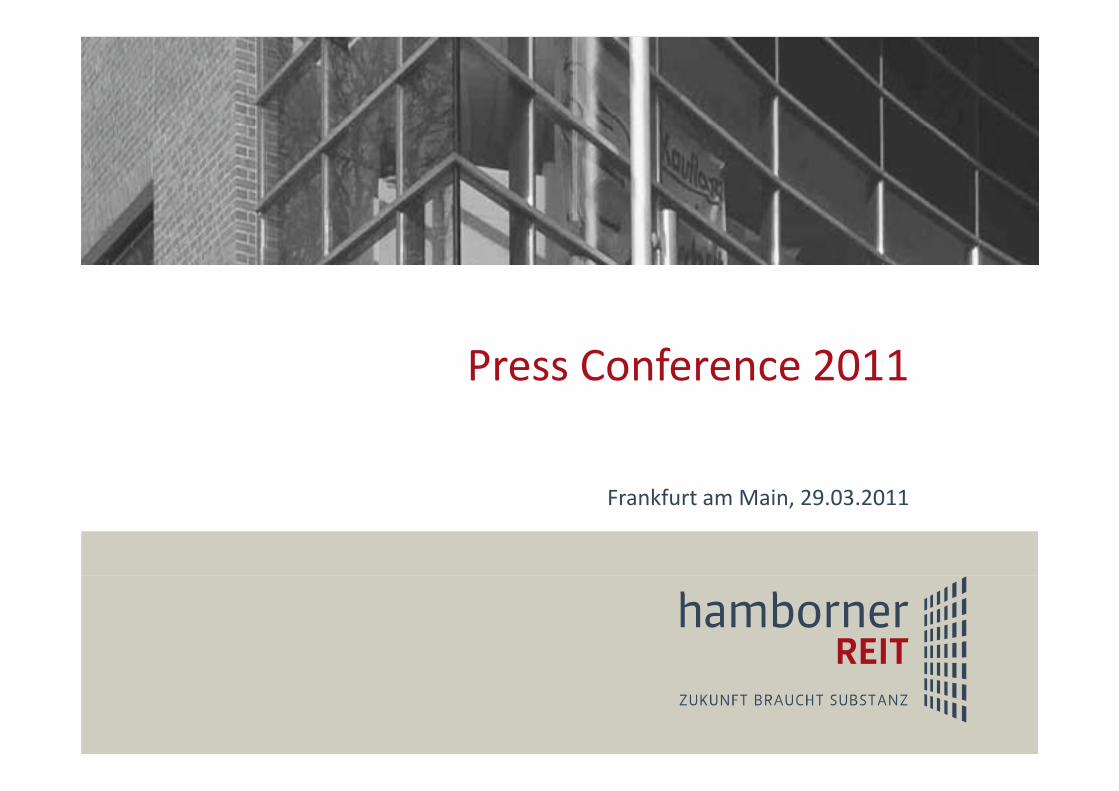
Significant key figures 2010
Key figures 2010 2009 Change
Rental revenues € 25.0 million € 22.5 million + 11 %
Operating result € 12.3 million € 10.4 million + 18 %
Profit for the year € 5.5 million € 5.1 million + 8 %
REIT equity ratio 74.9 % 67.1 % + 7.8 %‐points
Loan to Value (LTV) according to EPRA 19.2 % 22.9 % ‐ 3.7 %‐points
Funds from Operations € 12.0 million € 9.6 million + 25 %
Funds from Operations (FFO) per share 0.35 € 0.42 € ‐
Net Asset Value (NAV) per share 8.80 € 10.37 € ‐ 15 %
Dividend per share 0.37 € 0.37 € +/‐ 0 %
2Press conference, 29.03.2011
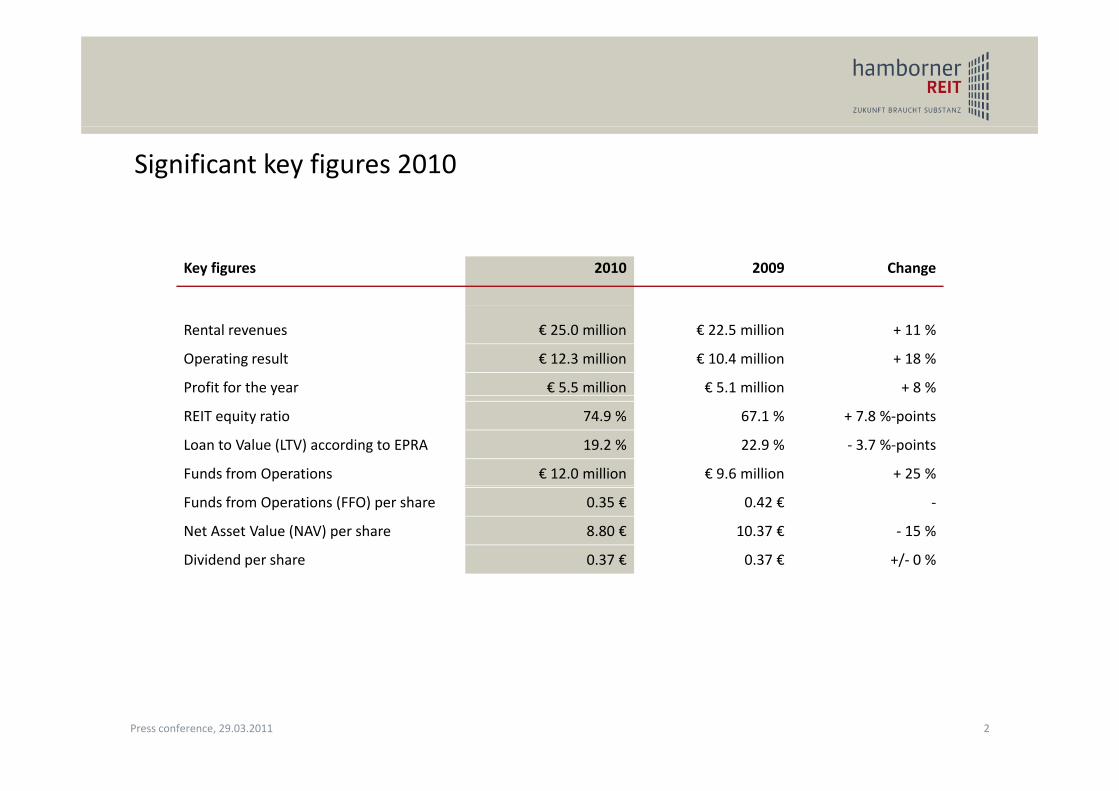
Financial year 2010
→ Positive operational business development
→ 11.5 % increase in rents
→ Vacancy rate 2.5% (including income from rent guarantees 1.5%)
→ Active asset management
→ Acquisition of 12 objects with a volume of approx. € 160 million:
Transfer of ownership 2010 ‐ € 65 million (purchase price): objects in Erlangen, Hilden, Kamp‐Lintfort, Stuttgart, Lemgo and Ingolstadt
Transfer of ownership 2011 ‐ € 98 million (purchase price): objects in Bad Homburg, Leipzig, Brunnthal, Regensburg, Erlangen, Freiburg
→ Sale of a smaller high‐street building in Hamm that do not conform with strategy (€ 1 million)
d 2 1 illi d l d (€ 2 8 illi )and 2.1 million sqm undeveloped area (€ 2.8 million)
→ External valuation of the property portfolio
→ Portfolio value of € 376 million→ Portfolio value of € 376 million
→ Conservative balancing to acquisition and construction costs:
→ appreciation € 2.1 million
→ extraordinary depreciation € 0.3 million→ extraordinary depreciation € 0.3 million
3Press conference, 29.03.2011
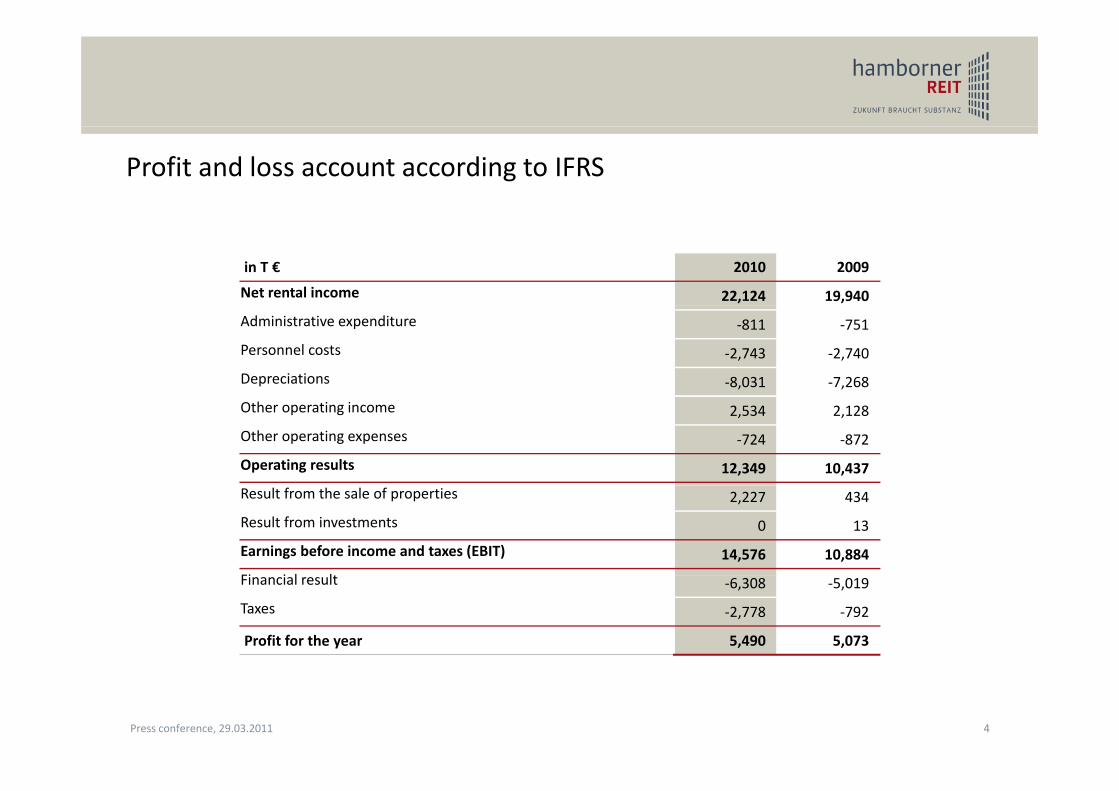
Profit and loss account according to IFRS
in T € 2010 2009
Net rental income 22,124 19,940
Administrative expenditure ‐811 ‐751
Personnel costs ‐2,743 ‐2,740
Depreciations ‐8,031 ‐7,268
Other operating income 2,534 2,128
Other operating expenses ‐724 ‐872
Operating results 12,349 10,437
Result from the sale of properties 2,227 434
Result from investments 0 13
Earnings before income and taxes (EBIT) 14,576 10,884
Fi i l lFinancial result ‐6,308 ‐5,019
Taxes ‐2,778 ‐792
Profit for the year 5,490 5,073
4Press conference, 29.03.2011
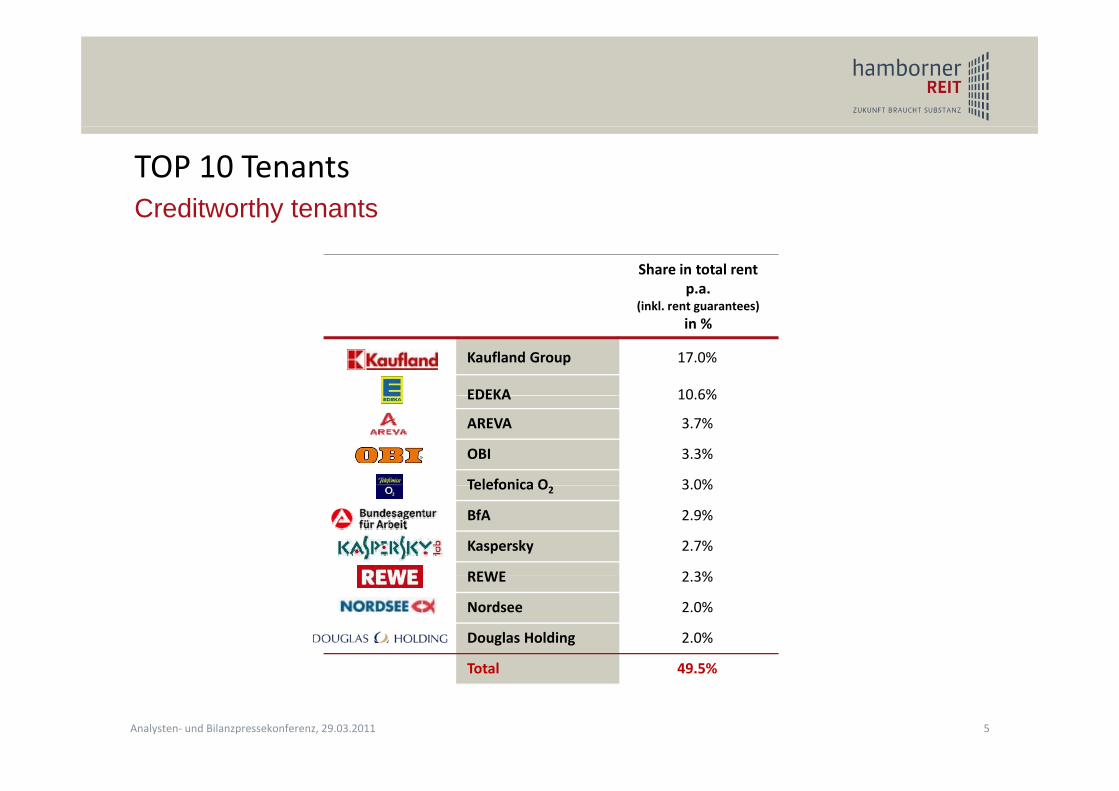
TOP 10 TenantsCreditworthy tenants
Share in total rent p.a.
(inkl rent guarantees)
Creditworthy tenants
(inkl. rent guarantees) in %
Kaufland Group 17.0%
EDEKA 10 6%EDEKA 10.6%
AREVA 3.7%
OBI 3.3%
Telefonica O 3 0%Telefonica O2 3.0%
BfA 2.9%
Kaspersky 2.7%
REWE 2 3%REWE 2.3%
Nordsee 2.0%
Douglas Holding 2.0%
T t l 49 5%
5Analysten‐ und Bilanzpressekonferenz, 29.03.2011
Total 49.5%
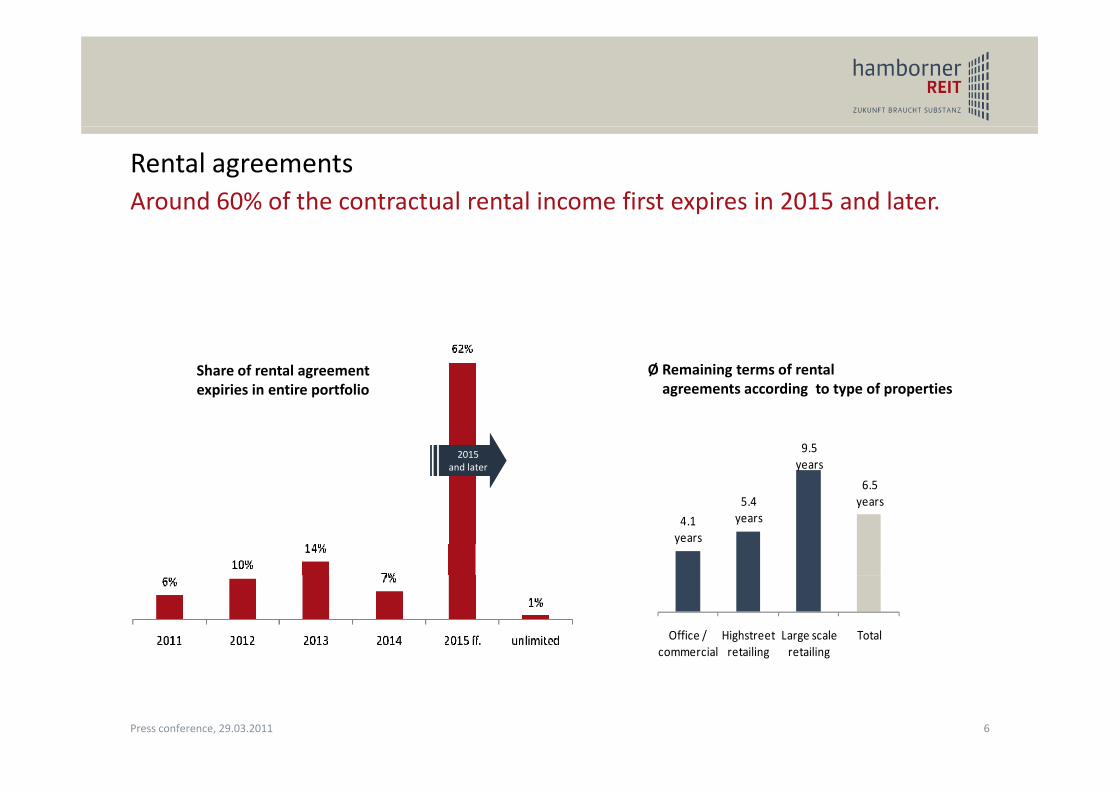
Rental agreementsAround 60% of the contractual rental income first expires in 2015 and later.
Share of rental agreement expiries in entire portfolio
Ø Remaining terms of rental agreements according to type of properties
9.5years
6 5
p p
2015 and later
g g yp p p
4.1years
5.4years
6.5years
Office / commercial
Highstreet retailing
Large scale retailing
Total
6Press conference, 29.03.2011
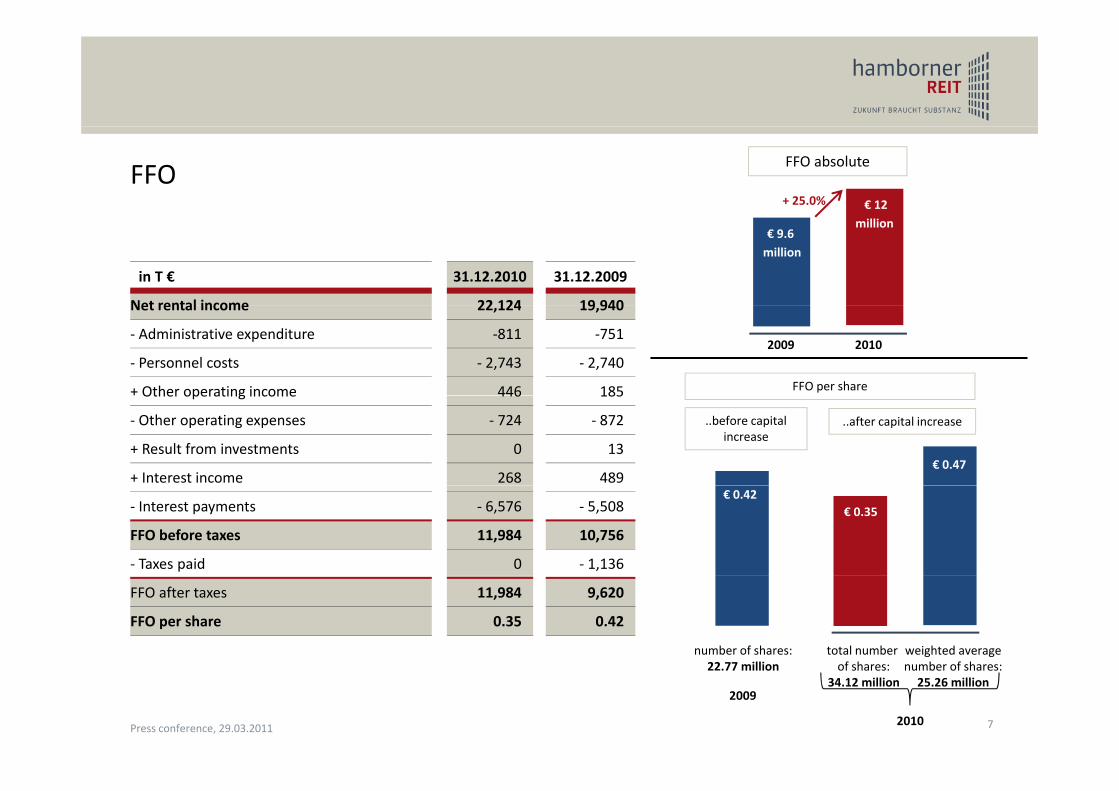
FFO€ 12+ 25.0%
FFO absolute
in T € 31.12.2010 31.12.2009
Net rental income 22 124 19 940
million€ 9.6 million
Net rental income 22,124 19,940
‐ Administrative expenditure ‐811 ‐751
‐ Personnel costs ‐ 2,743 ‐ 2,740
+ Other operating income 446 185
20102009
FFO per share Other operating income 446 185
‐ Other operating expenses ‐ 724 ‐ 872
+ Result from investments 0 13
+ Interest income 268 489€ 0.47
..after capital increase..before capital increase
‐ Interest payments ‐ 6,576 ‐ 5,508
FFO before taxes 11,984 10,756
‐ Taxes paid 0 ‐ 1,136
€ 0.35€ 0.42
FFO after taxes 11,984 9,620
FFO per share 0.35 0.42
total number of shares:
weighted averagenumber of shares:
number of shares:22 77 million
72010
of shares:34.12 million
number of shares:25.26 million
2009
22.77 million
Press conference, 29.03.2011
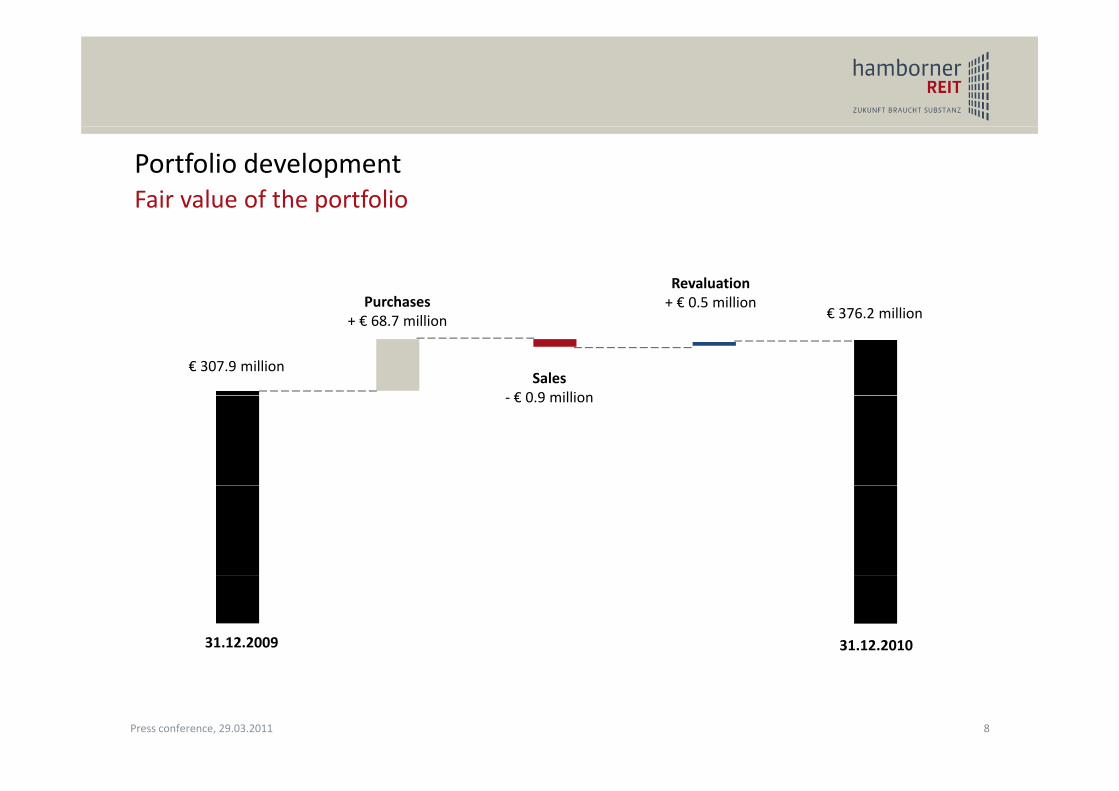
Portfolio developmentFair value of the portfolio
PurchasesRevaluation + € 0.5 million
€ 307.9 million
€ 376.2 millionPurchases
+ € 68.7 million
Sales€ 0 9 million
+ € 0.5 million
‐ € 0.9 million
31.12.2009 31.12.2010
8Press conference, 29.03.2011
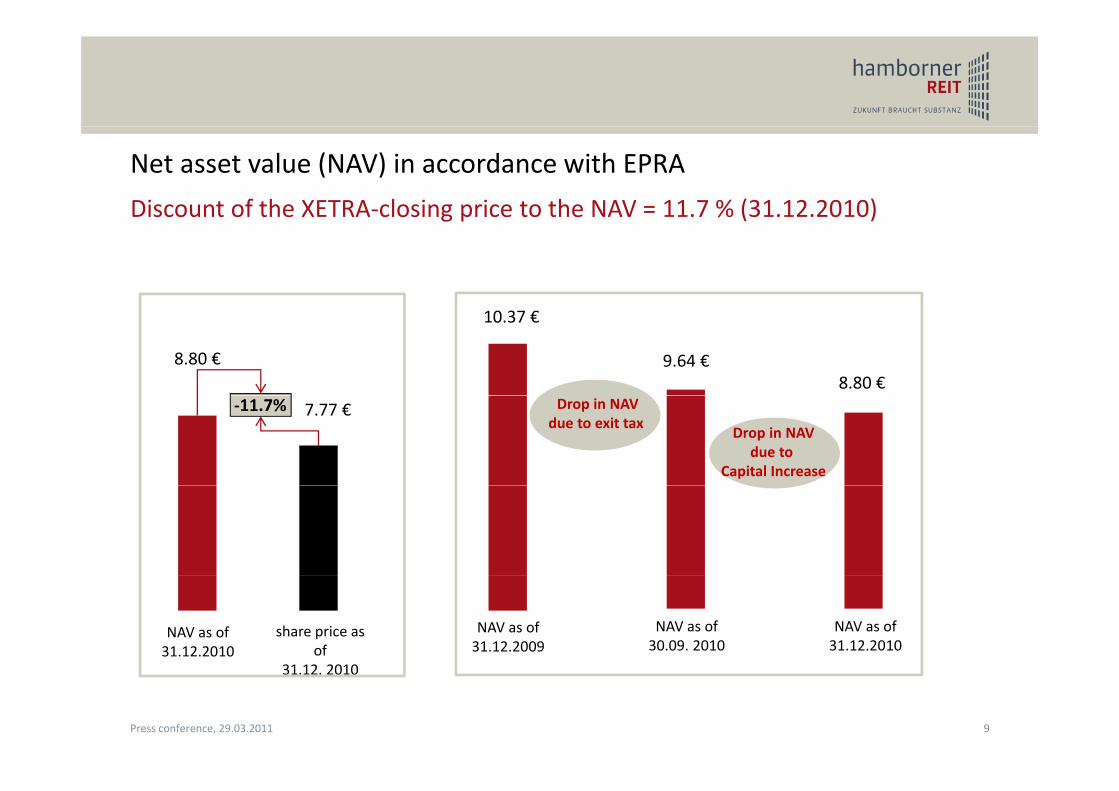
Net asset value (NAV) in accordance with EPRA
Discount of the XETRA‐closing price to the NAV = 11.7 % (31.12.2010)Discount of the XETRA closing price to the NAV 11.7 % (31.12.2010)
8.80 €8.80 €
10.37 €
9.64 €
7.77 €‐11.7% Drop in NAVdue to exit tax
Drop in NAVdue to
Capital Increase
NAV as of 31.12.2010
share price as of
31 12 2010
NAV as of 31.12.2009
NAV as of 31.12.2010
NAV as of 30.09. 2010
31.12. 2010
9Press conference, 29.03.2011
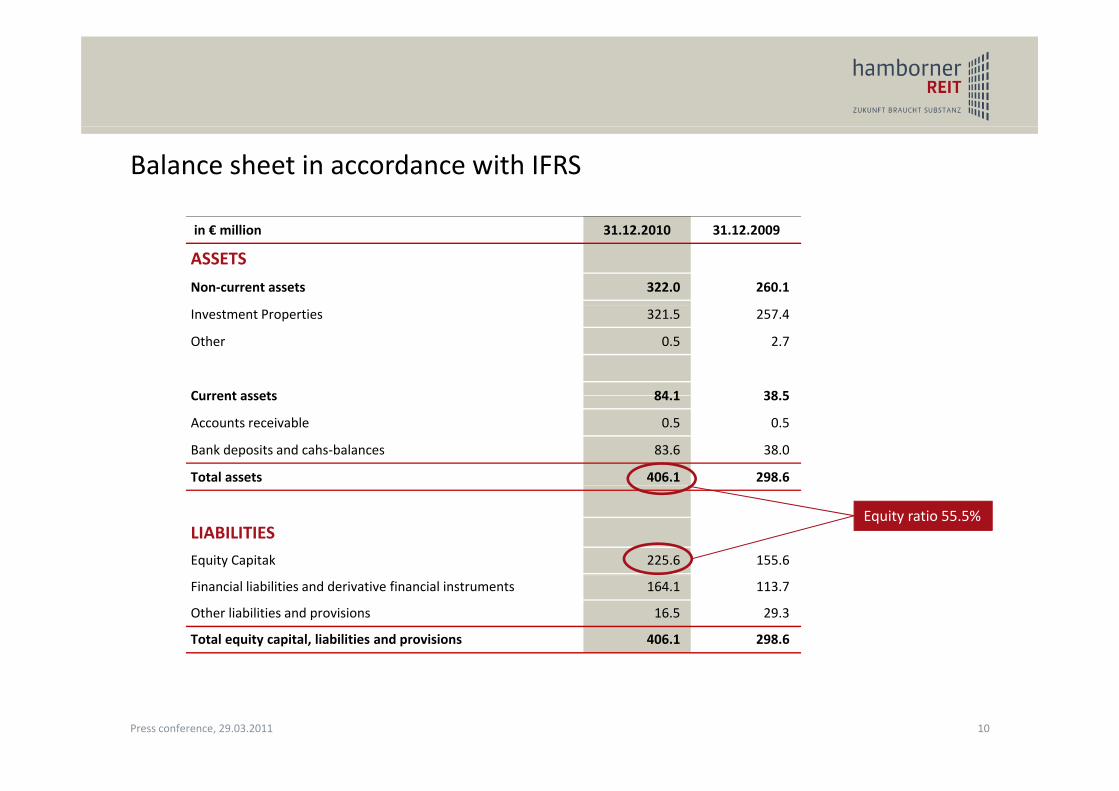
Balance sheet in accordance with IFRS
in € million 31.12.2010 31.12.2009
ASSETS
Non‐current assets 322.0 260.1
Investment Properties 321.5 257.4
Other 0.5 2.7
Current assets 84 1 38 5Current assets 84.1 38.5
Accounts receivable 0.5 0.5
Bank deposits and cahs‐balances 83.6 38.0
Total assets 406.1 298.6
LIABILITIESEquity Capitak 225.6 155.6
Equity ratio 55.5%
Financial liabilities and derivative financial instruments 164.1 113.7
Other liabilities and provisions 16.5 29.3
Total equity capital, liabilities and provisions 406.1 298.6
10Press conference, 29.03.2011
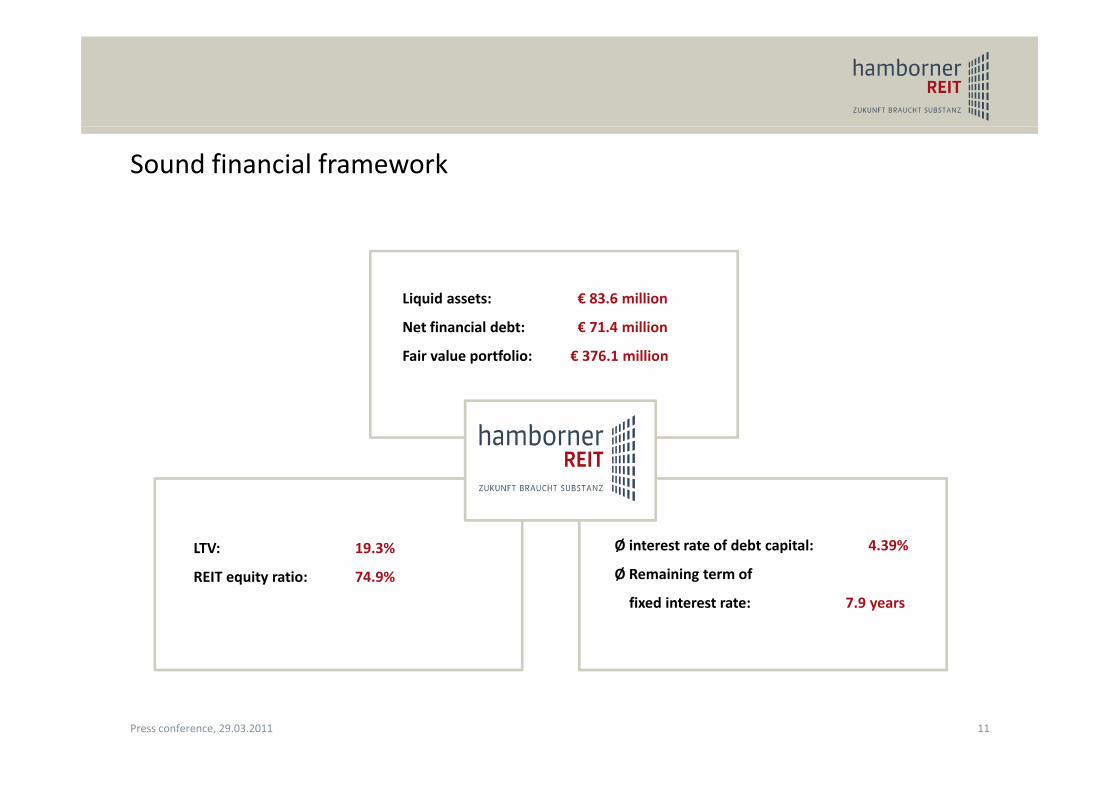
Sound financial framework
Liquid assets: € 83.6 millionq
Net financial debt: € 71.4 million
Fair value portfolio: € 376.1 million
LTV: 19.3%
REIT equity ratio: 74 9%
Ø interest rate of debt capital: 4.39%
Ø Remaining term ofREIT equity ratio: 74.9% Ø Remaining term of
fixed interest rate: 7.9 years
11Press conference, 29.03.2011
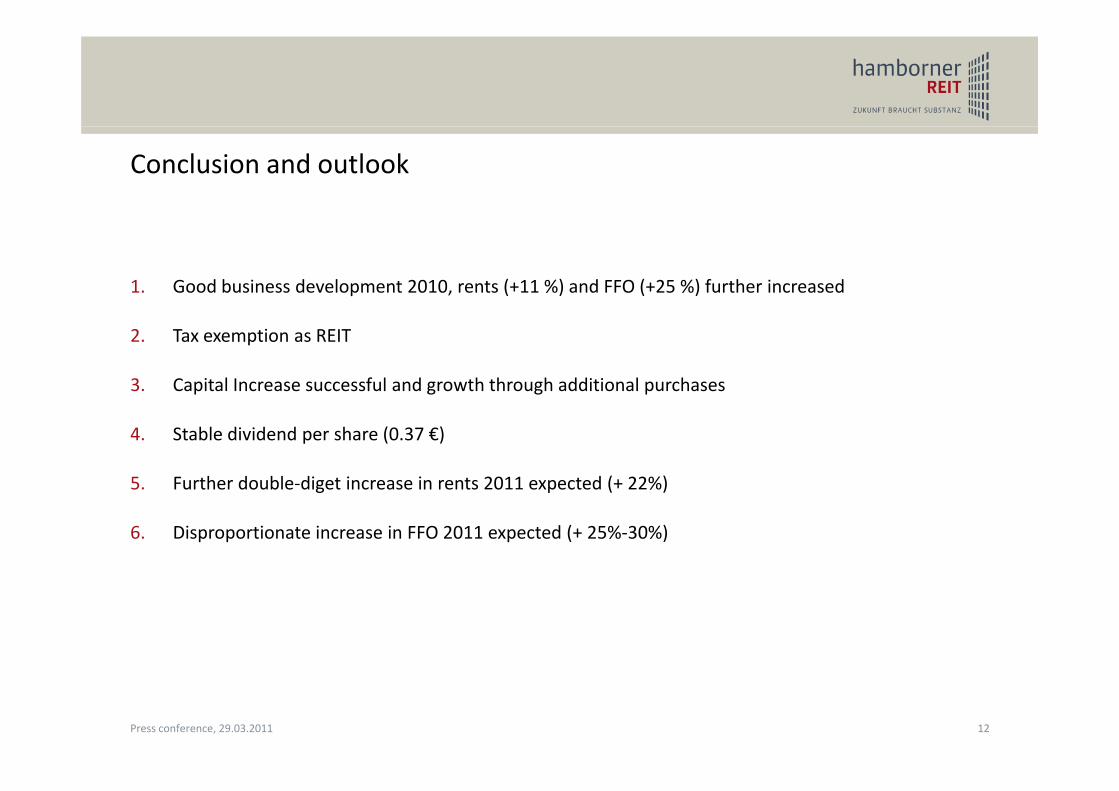
Conclusion and outlook
1. Good business development 2010, rents (+11 %) and FFO (+25 %) further increased
2. Tax exemption as REIT
3. Capital Increase successful and growth through additional purchases
4. Stable dividend per share (0.37 €)
5 Further double‐diget increase in rents 2011 expected (+ 22%)5. Further double diget increase in rents 2011 expected (+ 22%)
6. Disproportionate increase in FFO 2011 expected (+ 25%‐30%)
12Press conference, 29.03.2011
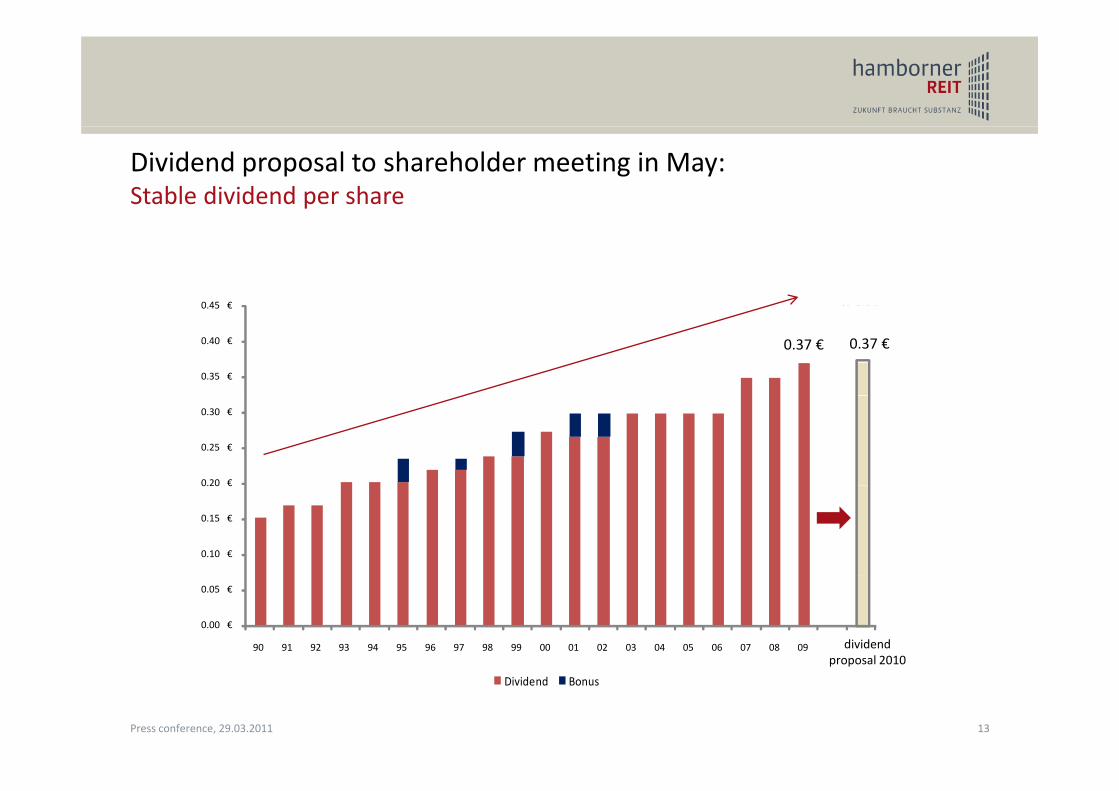
Dividend proposal to shareholder meeting in May: Stable dividend per share
0 42 €0 45 €
0.37 €
0.42 €
0.35 €
0.40 €
0.45 €
0.37 €
0.20 €
0.25 €
0.30 €
0.10 €
0.15 €
0.20 €
0.00 €
0.05 €
90 91 92 93 94 95 96 97 98 99 00 01 02 03 04 05 06 07 08 09 FFO* 2010
dividendproposal 2010
Dividend Bonus
p p
13Press conference, 29.03.2011
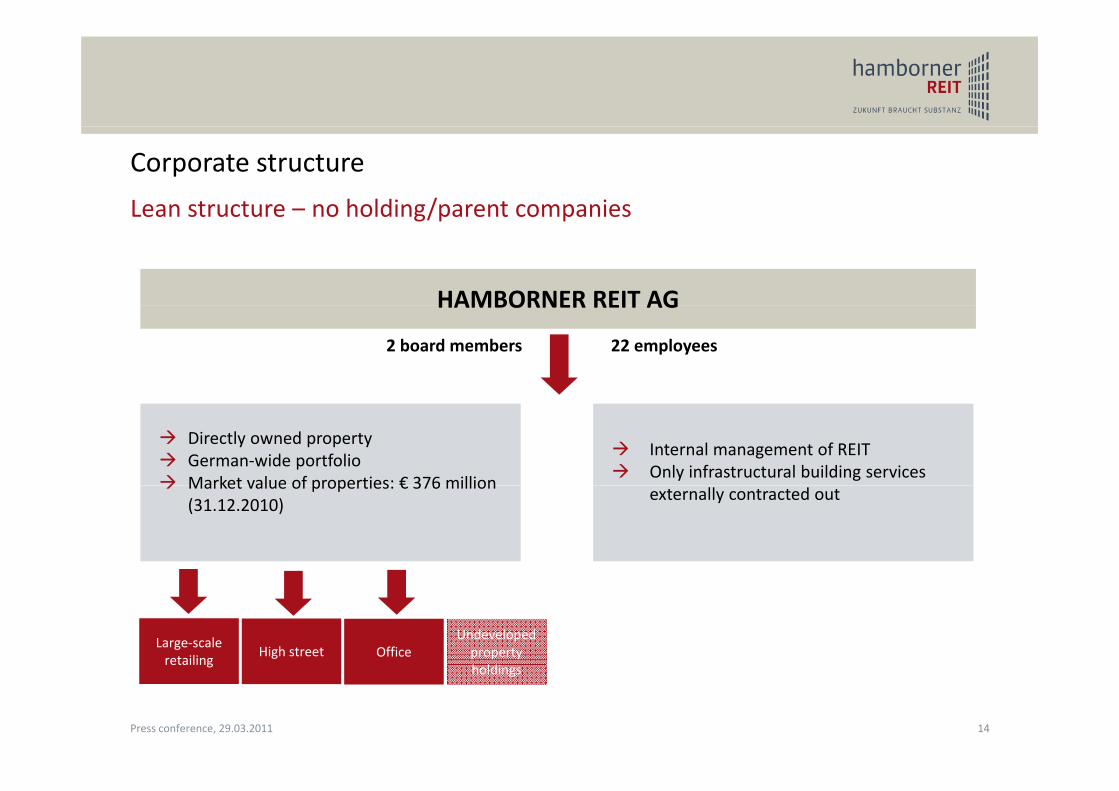
Corporate structure
Lean structure – no holding/parent companiesLean structure no holding/parent companies
HAMBORNER REIT AGHAMBORNER REIT AG
22 employees2 board members
Directly owned propertyGerman‐wide portfolioMarket value of properties: € 376 million
Internal management of REITOnly infrastructural building services
Market value of properties: € 376 million(31.12.2010)
externally contracted out
High street OfficeLarge‐scale retailing
Undeveloped property h ldi
gholdings
14Press conference, 29.03.2011
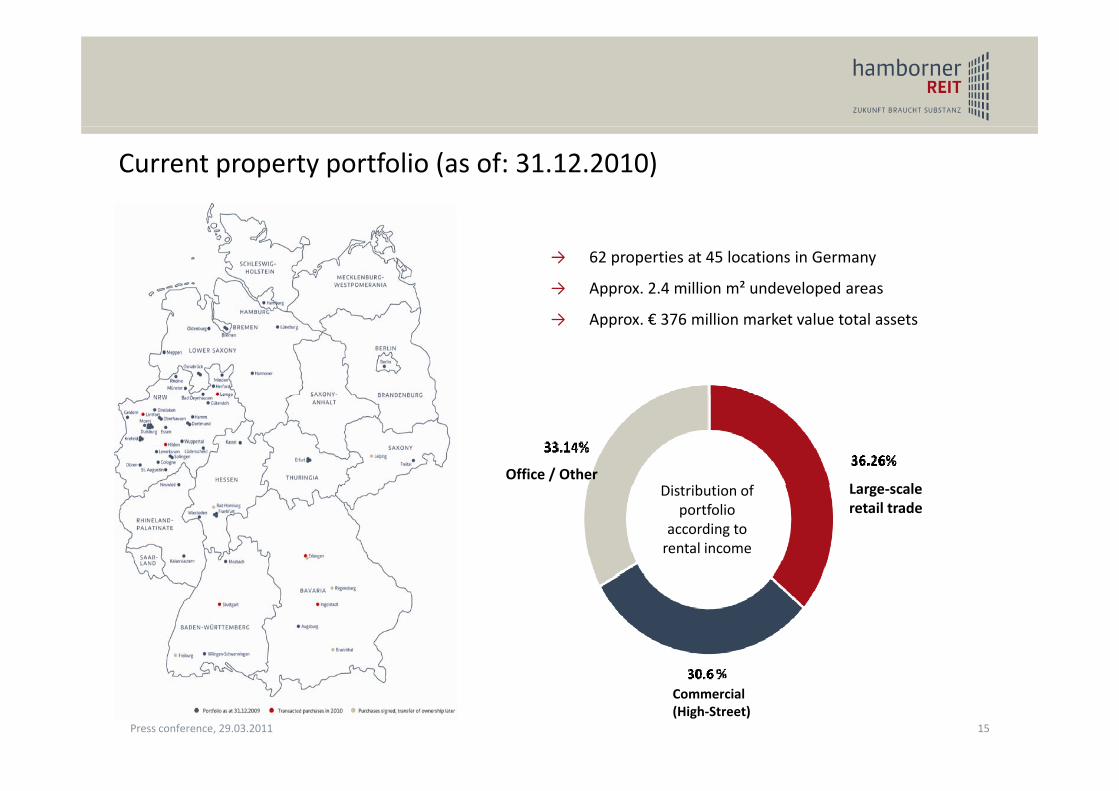
Current property portfolio (as of: 31.12.2010)
→ 62 properties at 45 locations in Germany
→ Approx. 2.4 million m² undeveloped areas
→ Approx. € 376 million market value total assets
i ib i fOffice / Other
L lDistribution of portfolio
according to rental income
Large‐scaleretail trade
Ingolstadt
Commercial (High‐Street)
15Press conference, 29.03.2011
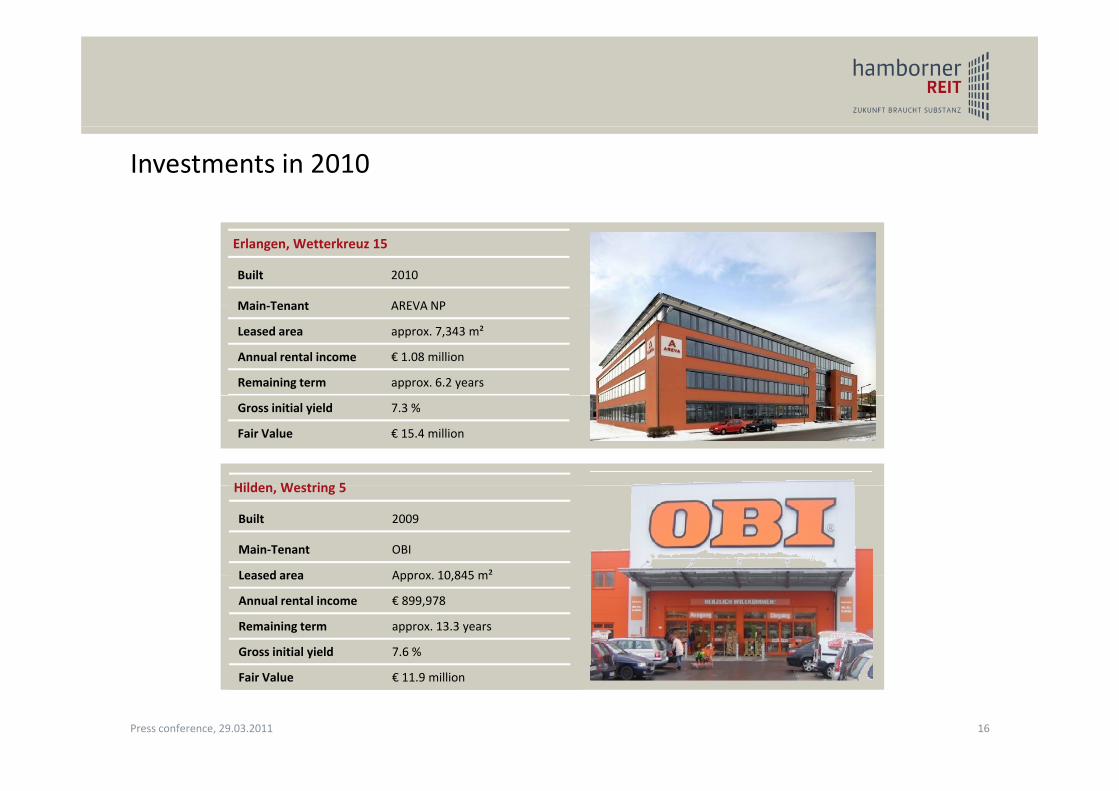
Investments in 2010
Erlangen, Wetterkreuz 15
Built 2010
Main Tenant AREVA NPMain‐Tenant AREVA NP
Leased area approx. 7,343 m²
Annual rental income € 1.08 million
Remaining term approx. 6.2 years
Gross initial yield 7.3 %
Fair Value € 15.4 million
Hilden Westring 5Hilden, Westring 5
Built 2009
Main‐Tenant OBI
Leased area Approx 10 845 m²Leased area Approx. 10,845 m
Annual rental income € 899,978
Remaining term approx. 13.3 years
Gross initial yield 7.6 %
Fair Value € 11.9 million
16Press conference, 29.03.2011
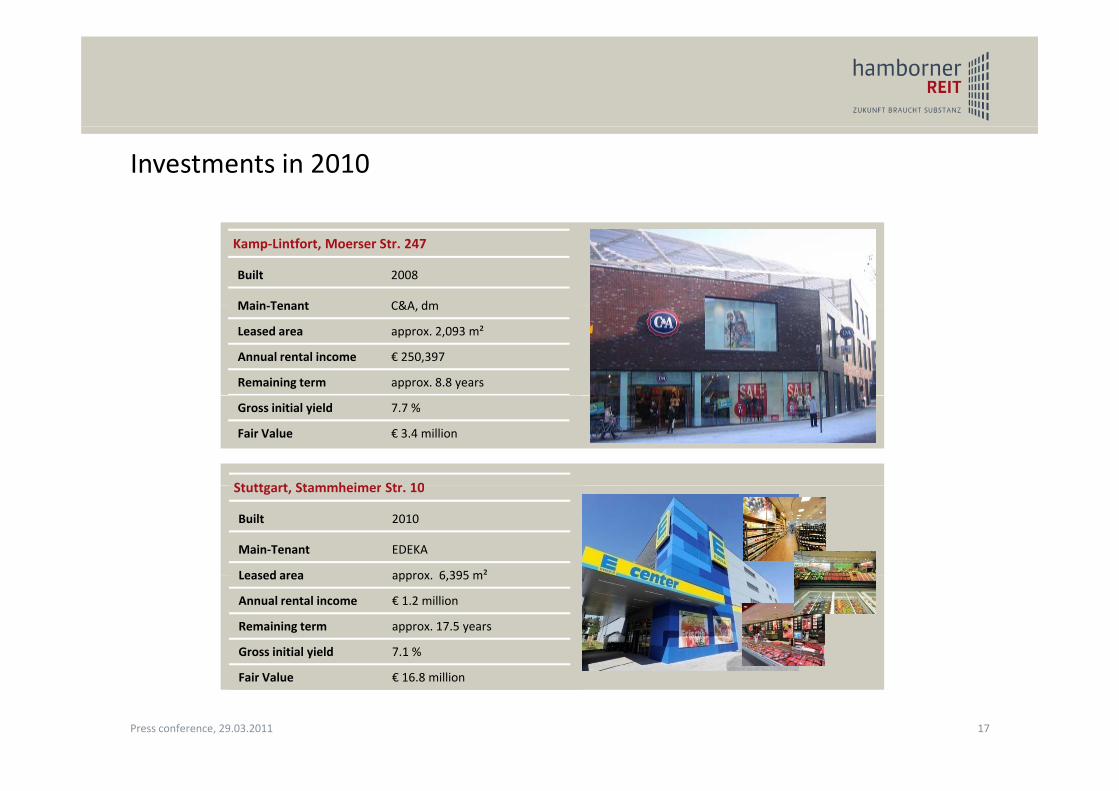
Investments in 2010
Kamp‐Lintfort, Moerser Str. 247
Built 2008
Main‐Tenant C&A dmMain‐Tenant C&A, dm
Leased area approx. 2,093 m²
Annual rental income € 250,397
Remaining term approx. 8.8 years
Gross initial yield 7.7 %
Fair Value € 3.4 million
Stuttgart Stammheimer Str 10Stuttgart, Stammheimer Str. 10
Built 2010
Main‐Tenant EDEKA
Leased area approx 6 395 m²Leased area approx. 6,395 m
Annual rental income € 1.2 million
Remaining term approx. 17.5 years
Gross initial yield 7.1 %
Fair Value € 16.8 million
17Press conference, 29.03.2011
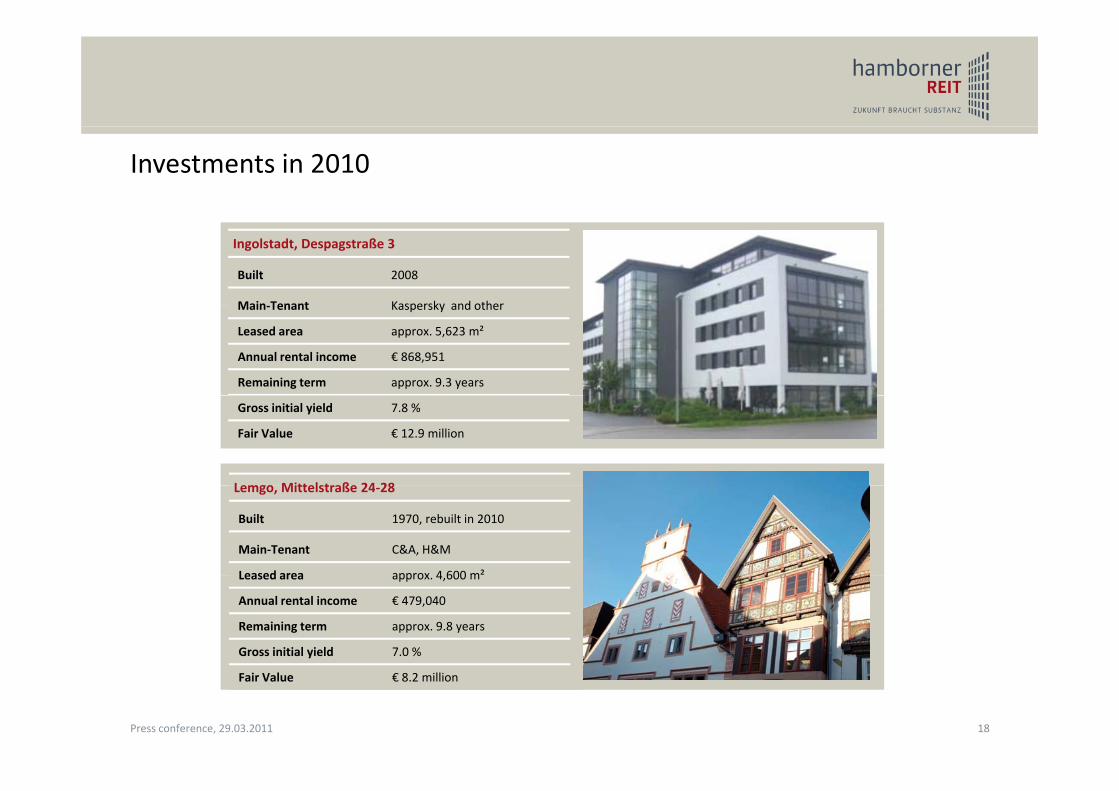
Investments in 2010
Ingolstadt, Despagstraße 3
Built 2008
Main‐Tenant Kaspersky and otherMain‐Tenant Kaspersky and other
Leased area approx. 5,623 m²
Annual rental income € 868,951
Remaining term approx. 9.3 years
Gross initial yield 7.8 %
Fair Value € 12.9 million
Lemgo Mittelstraße 24 28Lemgo, Mittelstraße 24‐28
Built 1970, rebuilt in 2010
Main‐Tenant C&A, H&M
Leased area approx 4 600 m²Leased area approx. 4,600 m
Annual rental income € 479,040
Remaining term approx. 9.8 years
Gross initial yield 7.0 %
Fair Value € 8.2 million
18Press conference, 29.03.2011
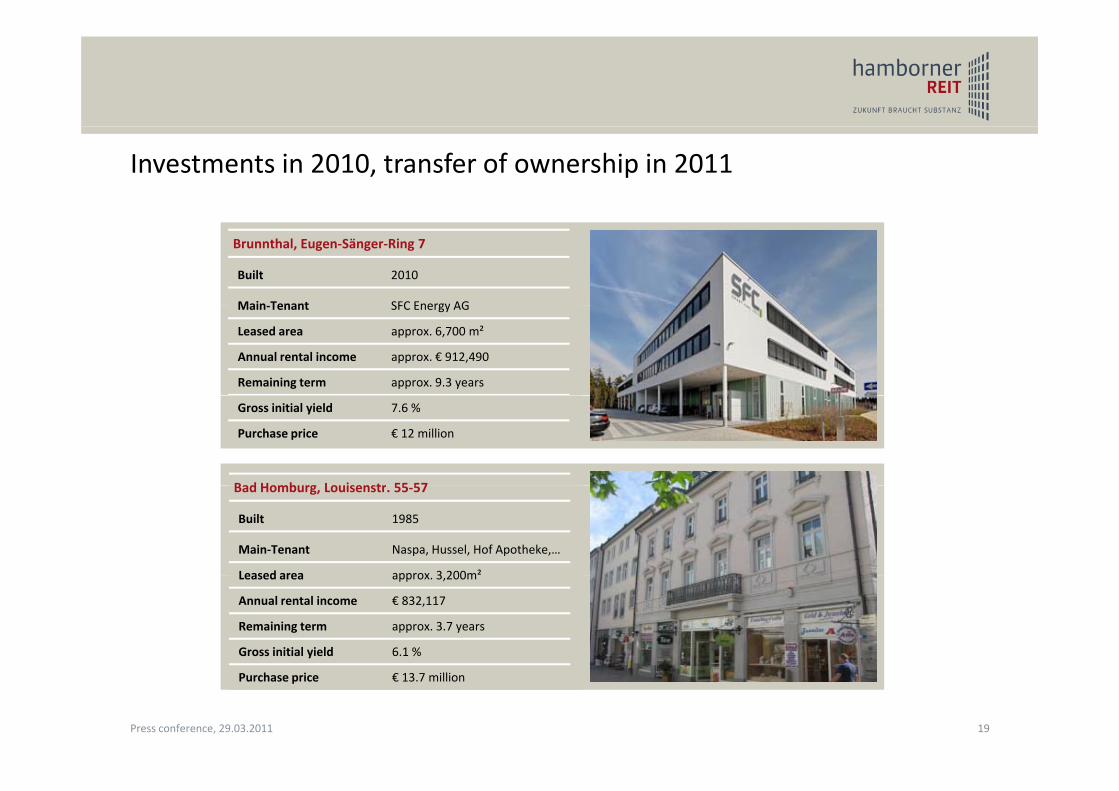
Investments in 2010, transfer of ownership in 2011
Brunnthal, Eugen‐Sänger‐Ring 7
Built 2010
Main‐Tenant SFC Energy AGMain‐Tenant SFC Energy AG
Leased area approx. 6,700 m²
Annual rental income approx. € 912,490
Remaining term approx. 9.3 years
Gross initial yield 7.6 %
Purchase price € 12 million
Bad Homburg Louisenstr 55 57Bad Homburg, Louisenstr. 55‐57
Built 1985
Main‐Tenant Naspa, Hussel, Hof Apotheke,…
Leased area approx 3 200m²Leased area approx. 3,200m
Annual rental income € 832,117
Remaining term approx. 3.7 years
Gross initial yield 6.1 %
19
Purchase price € 13.7 million
Press conference, 29.03.2011
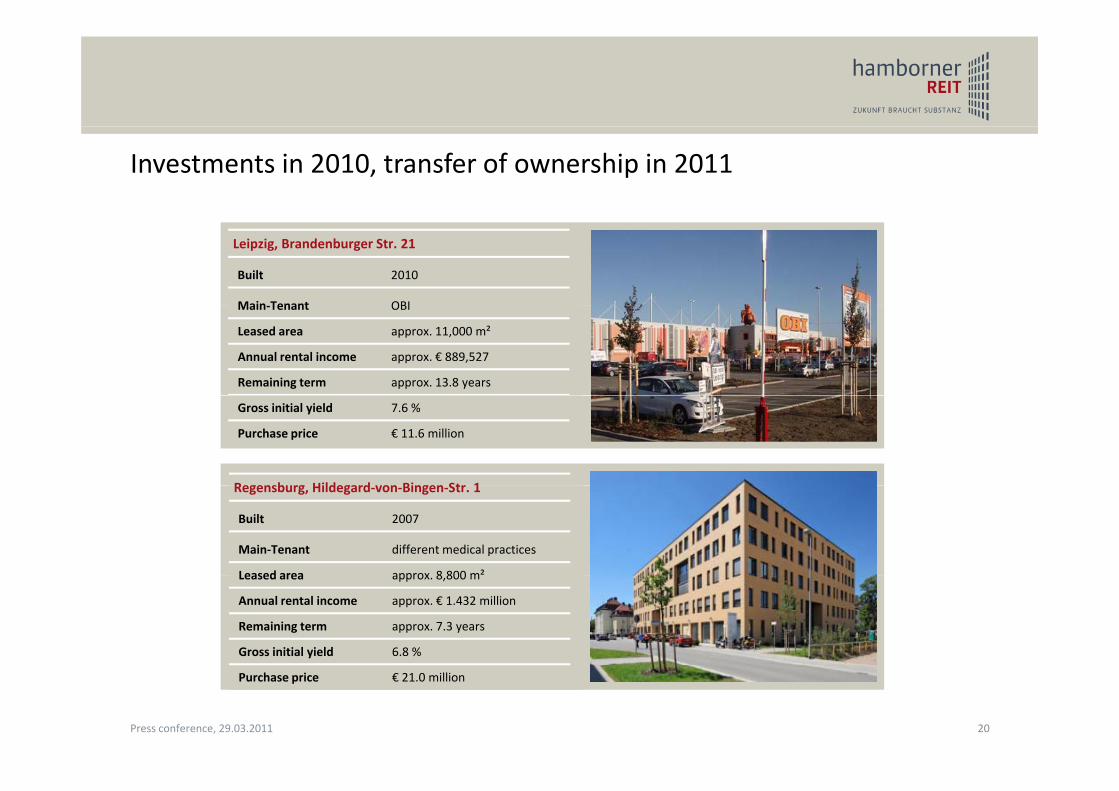
Investments in 2010, transfer of ownership in 2011
Leipzig, Brandenburger Str. 21
Built 2010
Main‐Tenant OBIMain‐Tenant OBI
Leased area approx. 11,000 m²
Annual rental income approx. € 889,527
Remaining term approx. 13.8 years
Gross initial yield 7.6 %
Purchase price € 11.6 million
Regensburg Hildegard von Bingen Str 1Regensburg, Hildegard‐von‐Bingen‐Str. 1
Built 2007
Main‐Tenant different medical practices
Leased area approx 8 800 m²Leased area approx. 8,800 m
Annual rental income approx. € 1.432 million
Remaining term approx. 7.3 years
Gross initial yield 6.8 %
20
Purchase price € 21.0 million
Press conference, 29.03.2011
l ll ö h lh i k
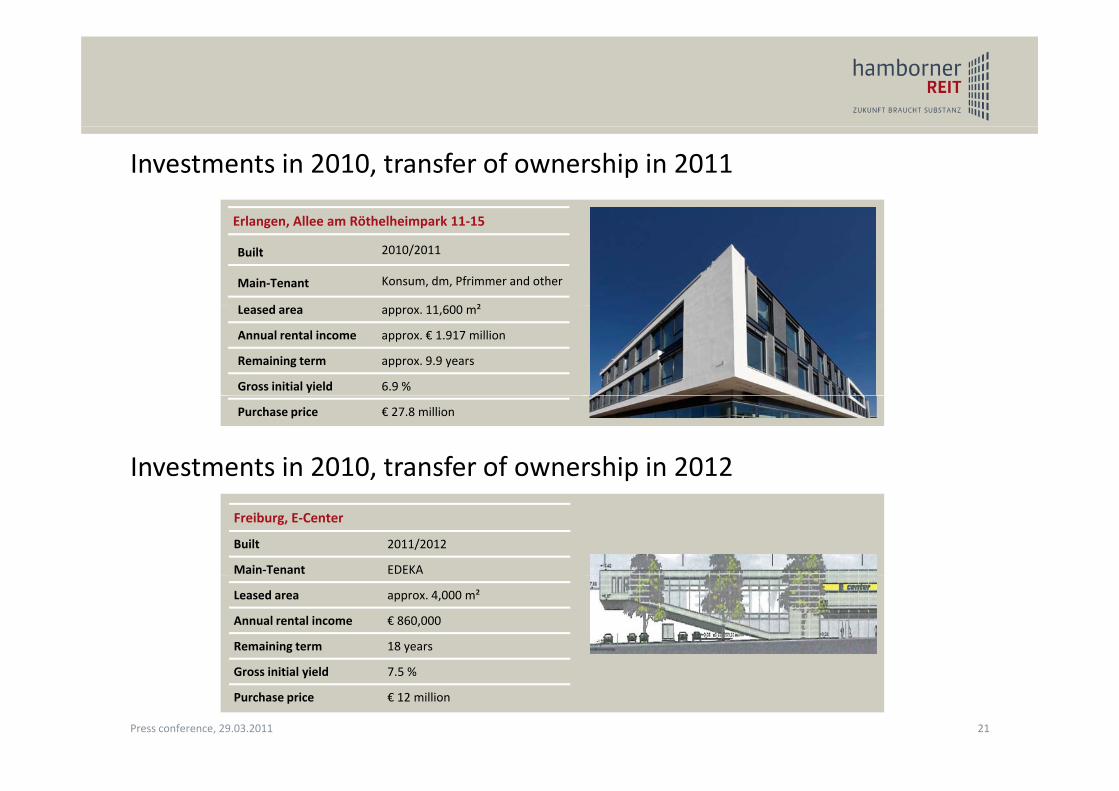
Investments in 2010, transfer of ownership in 2011
Erlangen, Allee am Röthelheimpark 11‐15
Built 2010/2011
Main‐Tenant Konsum, dm, Pfrimmer and other
L d 11 600 ²Leased area approx. 11,600 m²
Annual rental income approx. € 1.917 million
Remaining term approx. 9.9 years
Gross initial yield 6.9 %
Purchase price € 27.8 million
Investments in 2010, transfer of ownership in 2012
Freiburg, E‐Center
Built 2011/2012
Main‐Tenant EDEKA
Leased area approx. 4,000 m²
Annual rental income € 860,000
Remaining term 18 years
Gross initial yield 7.5 %
Purchase price € 12 million
21Press conference, 29.03.2011
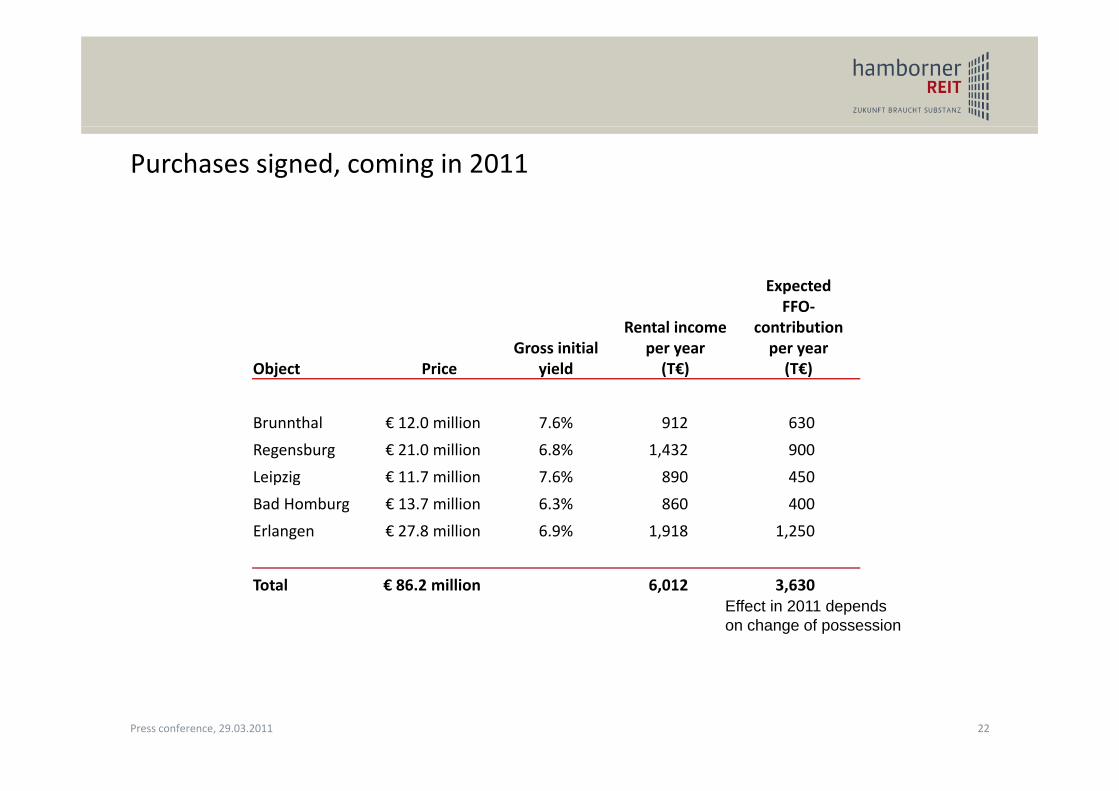
Purchases signed, coming in 2011
ExpectedFFO
Object PriceGross initial
yield
Rental incomeper year(T€)
FFO‐contributionper year(T€)
Brunnthal € 12.0 million 7.6% 912 630
Regensburg € 21.0 million 6.8% 1,432 900
Leipzig € 11.7 million 7.6% 890 450
Bad Homburg € 13.7 million 6.3% 860 400
Erlangen € 27.8 million 6.9% 1,918 1,250
Total € 86.2 million 6,012 3,630Effect in 2011 depends on change of possession
22Press conference, 29.03.2011
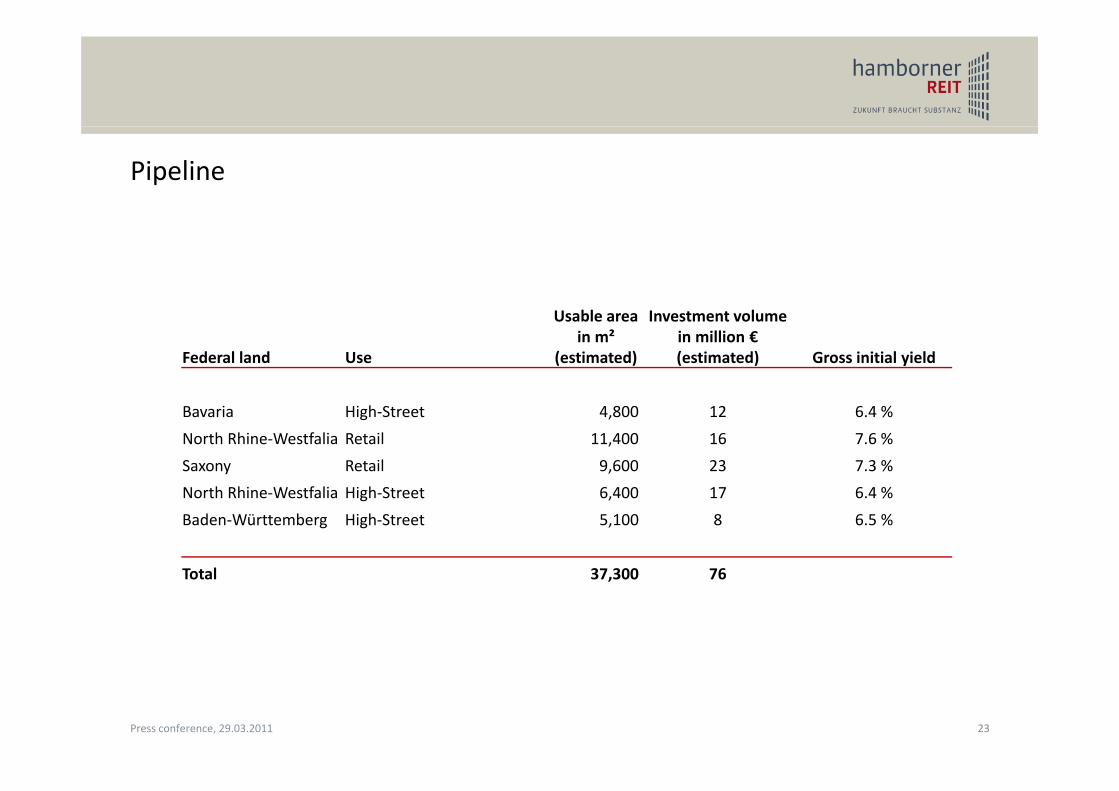
Pipeline
Federal land Use
Usable areain m²
(estimated)
Investment volumein million €(estimated) Gross initial yield
Bavaria High‐Street 4,800 12 6.4 %
North Rhine‐Westfalia Retail 11,400 16 7.6 %
Saxony Retail 9,600 23 7.3 %
North Rhine‐Westfalia High‐Street 6,400 17 6.4 %
Baden‐Württemberg High‐Street 5,100 8 6.5 %
Total 37 300 76Total 37,300 76
23Press conference, 29.03.2011
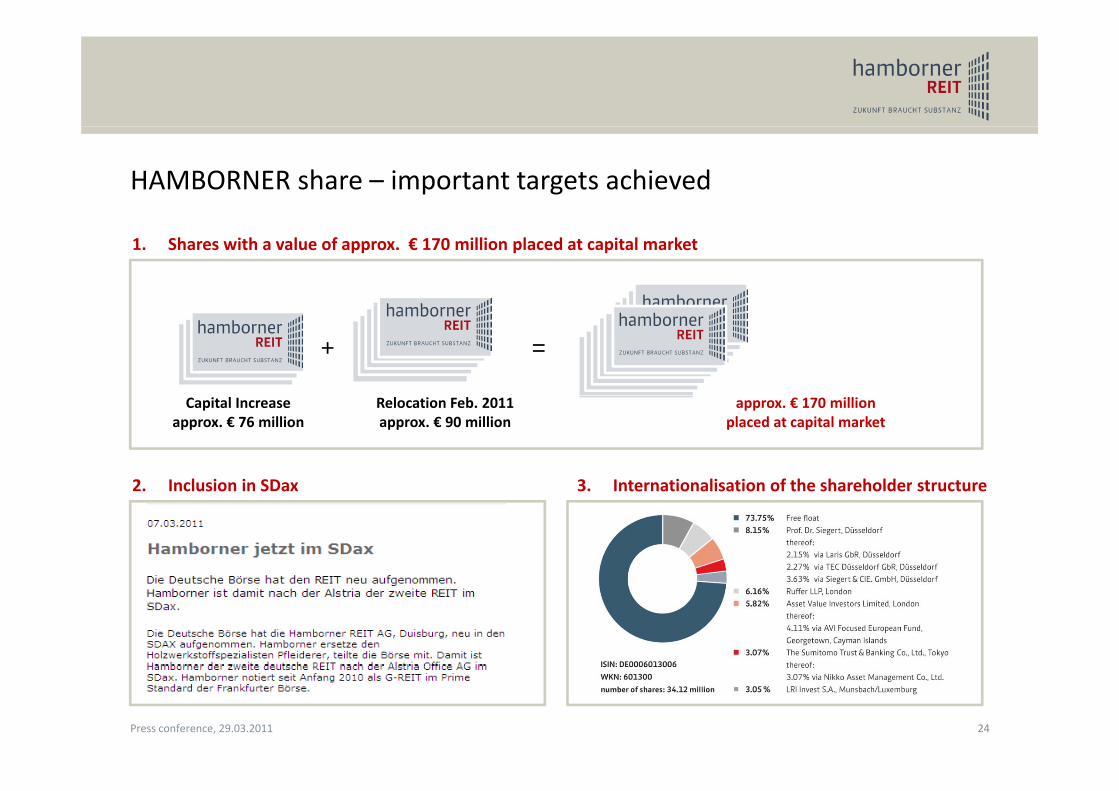
HAMBORNER share – important targets achieved
1. Shares with a value of approx. € 170 million placed at capital market
+ =
Capital Increaseapprox. € 76 million
Relocation Feb. 2011approx. € 90 million
approx. € 170 millionplaced at capital market
2 Inclusion in SDax 3 Internationalisation of the shareholder structure2. Inclusion in SDax 3. Internationalisation of the shareholder structure
24Press conference, 29.03.2011
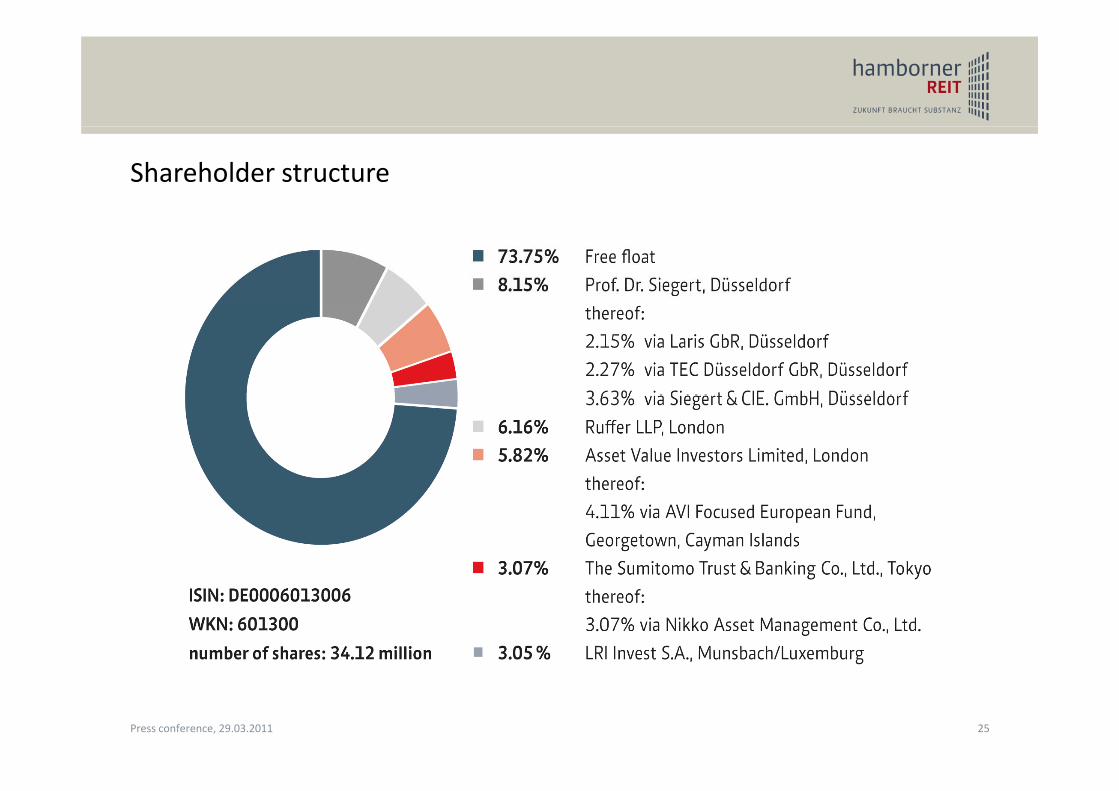
Shareholder structure
25Press conference, 29.03.2011
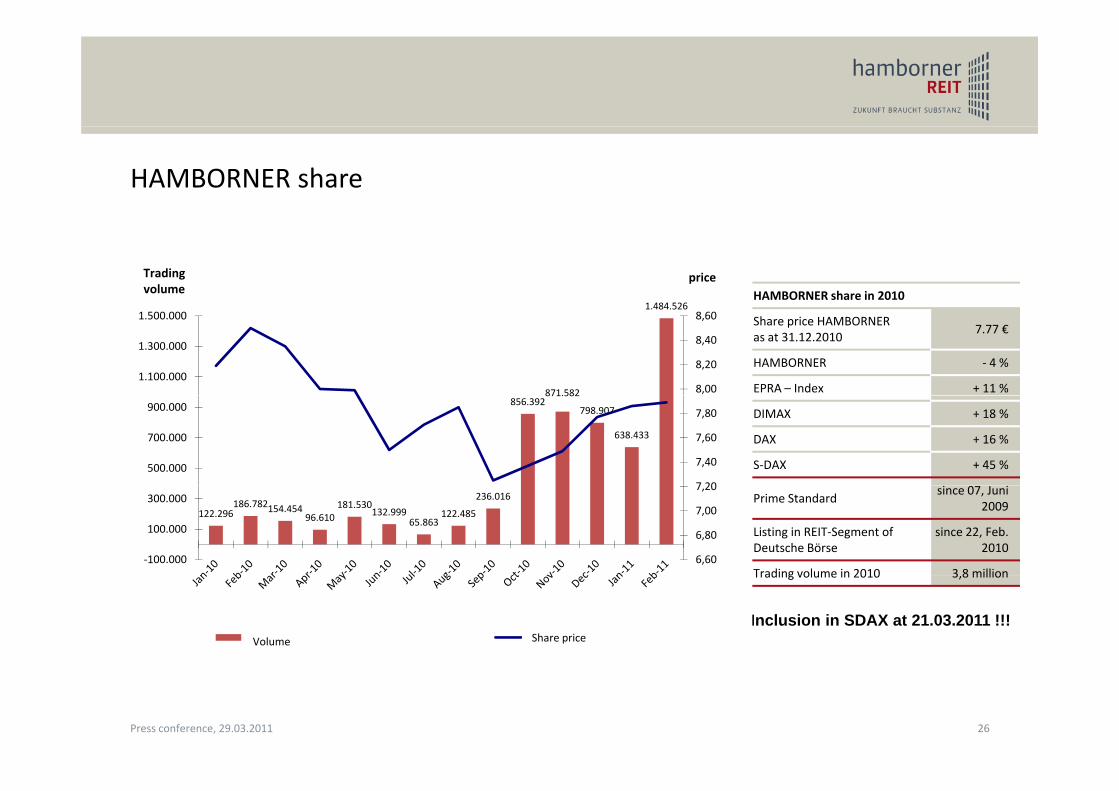
HAMBORNER share
HAMBORNER share in 2010Kurs1 484 526
Trading volume
price
Share price HAMBORNER as at 31.12.2010
7.77 €
HAMBORNER ‐ 4 %
EPRA – Index + 11 %871.582
1.484.526
8,00
8,20
8,40
8,60
1.100.000
1.300.000
1.500.000
DIMAX + 18 %
DAX + 16 %
S‐DAX + 45 %
856.392871.582
798.907
638.433
7 20
7,40
7,60
7,80
500.000
700.000
900.000
Prime Standardsince 07, Juni
2009
Listing in REIT‐Segment of Deutsche Börse
since 22, Feb.2010
Trading volume in 2010 3 8 million
122.296186.782154.454
96.610181.530
132.99965.863
122.485
236.016
6,60
6,80
7,00
7,20
‐100.000
100.000
300.000
Trading volume in 2010 3,8 million
Inclusion in SDAX at 21.03.2011 !!!Volumen in Stück Aktien (alle Börsen) Schlusskurs (alle Börsen)Volume Share price
26Press conference, 29.03.2011
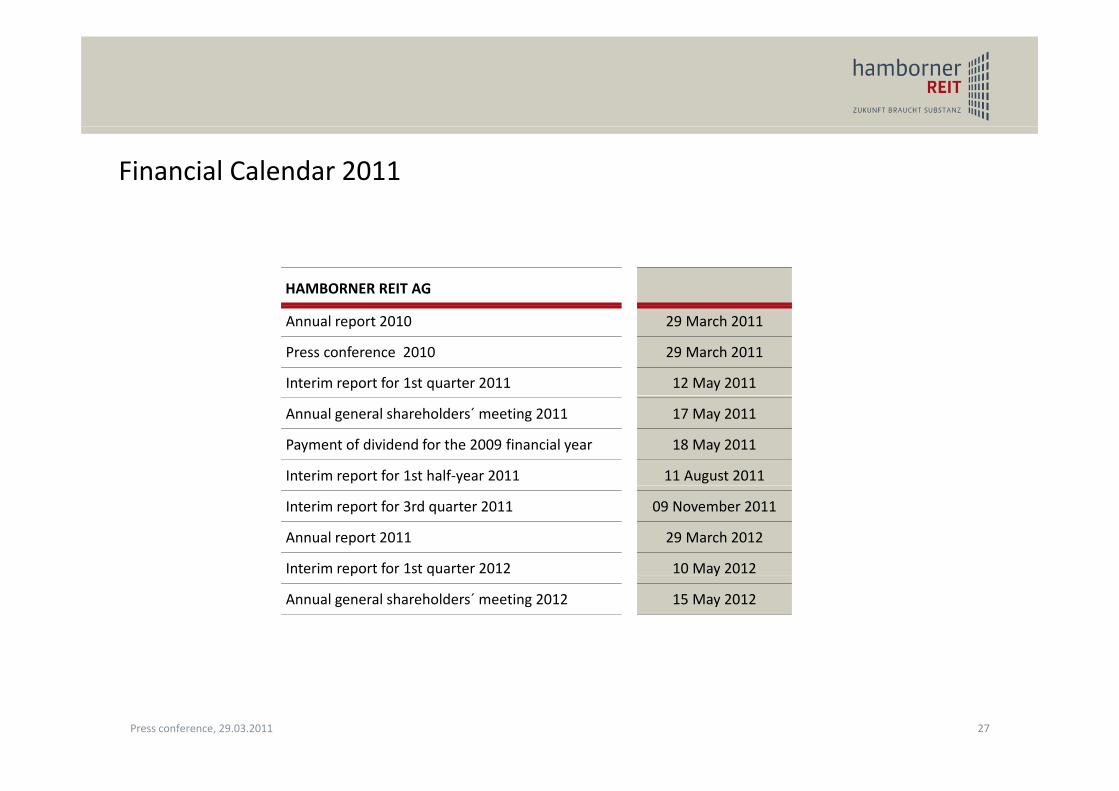
Financial Calendar 2011
HAMBORNER REIT AG
Annual report 2010 29 March 2011
Press conference 2010 29 March 2011
Interim report for 1st quarter 2011 12 May 2011
Annual general shareholders´ meeting 2011 17 May 2011
Payment of dividend for the 2009 financial year 18 May 2011
Interim report for 1st half‐year 2011 11 August 2011
Interim report for 3rd quarter 2011 09 November 2011
Annual report 2011 29 March 2012
Interim report for 1st quarter 2012 10 May 2012p q y
Annual general shareholders´ meeting 2012 15 May 2012
27Press conference, 29.03.2011
Contact
Dr. Rüdiger Mrotzek – Managing Board
P +49 (0)203 / 54405-55
Hans Richard Schmitz – Managing Board
P +49 (0)203 / 54405-21
M h h it @h b dM [email protected]
Sybille Albeser – Investor Relations
P +49 (0)203 / 54405-32
28Press conference, 29.03.2011