Embed Size (px)
Citation preview

8/11/2019 Frank Clemente Presentation
http://slidepdf.com/reader/full/frank-clemente-presentation 1/35
C
90
120
150TWh of Electricity Generation
Coal
1
0
30
60
Massachusetts Connecticut New Jersey New York Texas
AllSources
AllSources
AllSourcesAll
Sources
Source: EIA; The Washington Post, March 7, 2014

8/11/2019 Frank Clemente Presentation
http://slidepdf.com/reader/full/frank-clemente-presentation 2/35
2
. .
2014

8/11/2019 Frank Clemente Presentation
http://slidepdf.com/reader/full/frank-clemente-presentation 3/35

8/11/2019 Frank Clemente Presentation
http://slidepdf.com/reader/full/frank-clemente-presentation 4/35
20C
44

8/11/2019 Frank Clemente Presentation
http://slidepdf.com/reader/full/frank-clemente-presentation 5/35
What America Looked Like Before Electricity
5

8/11/2019 Frank Clemente Presentation
http://slidepdf.com/reader/full/frank-clemente-presentation 6/35
C C : , B ,
: , 2010 6

8/11/2019 Frank Clemente Presentation
http://slidepdf.com/reader/full/frank-clemente-presentation 7/35
Global Electricity Depends onFossil Fuels, Especially Coal,
30000
40000
TWh
7
0
10000
20000
1970 1990 2011 2035
Coa l
Oil
Gas
Sources: IEA, WEO, 2002, 2013

8/11/2019 Frank Clemente Presentation
http://slidepdf.com/reader/full/frank-clemente-presentation 8/35
8/11/2019 Frank Clemente Presentation
http://slidepdf.com/reader/full/frank-clemente-presentation 9/35
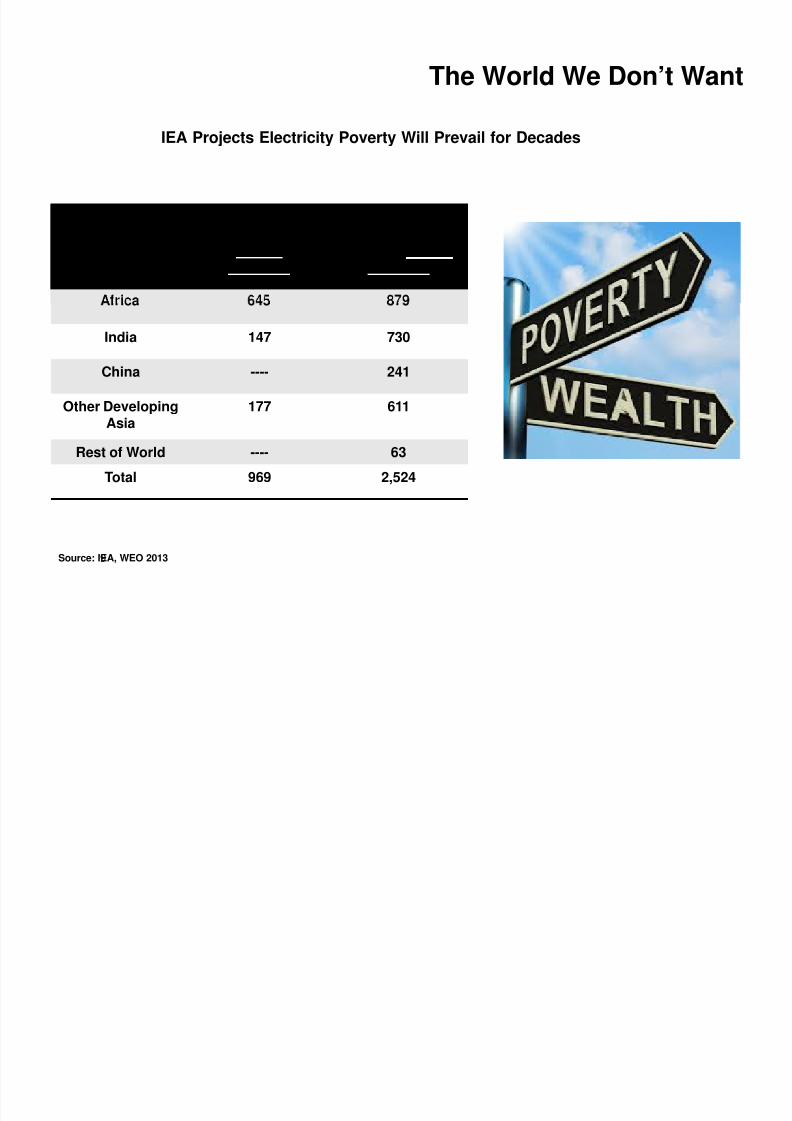
The World We Don’t Want
IEA Projects Electricity Poverty Will Prevail for Decades
Country/Region No Access toElectricity
in 2030(millions)
No Access toClean Cooking
Facilities in 2030(millions)
9
India 147 730
China ---- 241
Other Developing
Asia
177 611
Rest of World ---- 63
Total 969 2,524
Source: IEA, WEO 2013

8/11/2019 Frank Clemente Presentation
http://slidepdf.com/reader/full/frank-clemente-presentation 10/35

8/11/2019 Frank Clemente Presentation
http://slidepdf.com/reader/full/frank-clemente-presentation 11/35
11

8/11/2019 Frank Clemente Presentation
http://slidepdf.com/reader/full/frank-clemente-presentation 12/35
12Source: UN

8/11/2019 Frank Clemente Presentation
http://slidepdf.com/reader/full/frank-clemente-presentation 13/35
15
1313
8/11/2019 Frank Clemente Presentation
http://slidepdf.com/reader/full/frank-clemente-presentation 14/35
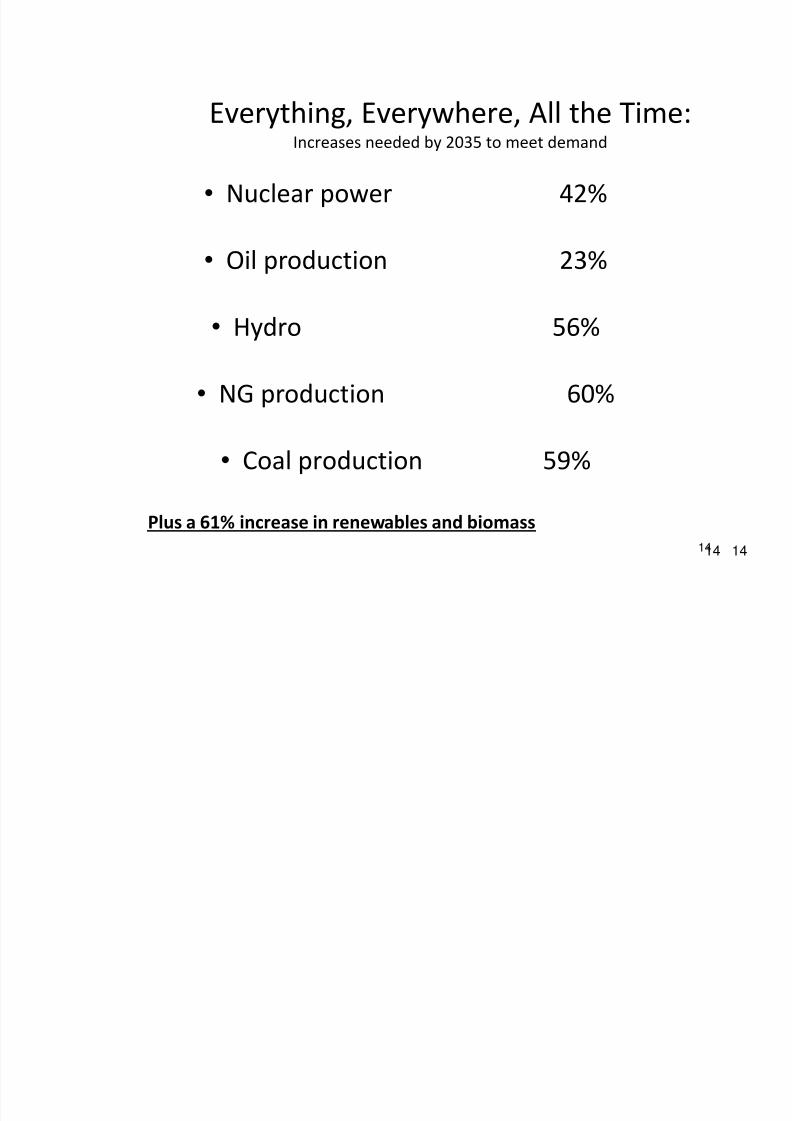
, , A : 2035
• 42%
• 23%
1414
• 56%
• 60%
• C 59%
61% 14
8/11/2019 Frank Clemente Presentation
http://slidepdf.com/reader/full/frank-clemente-presentation 15/35
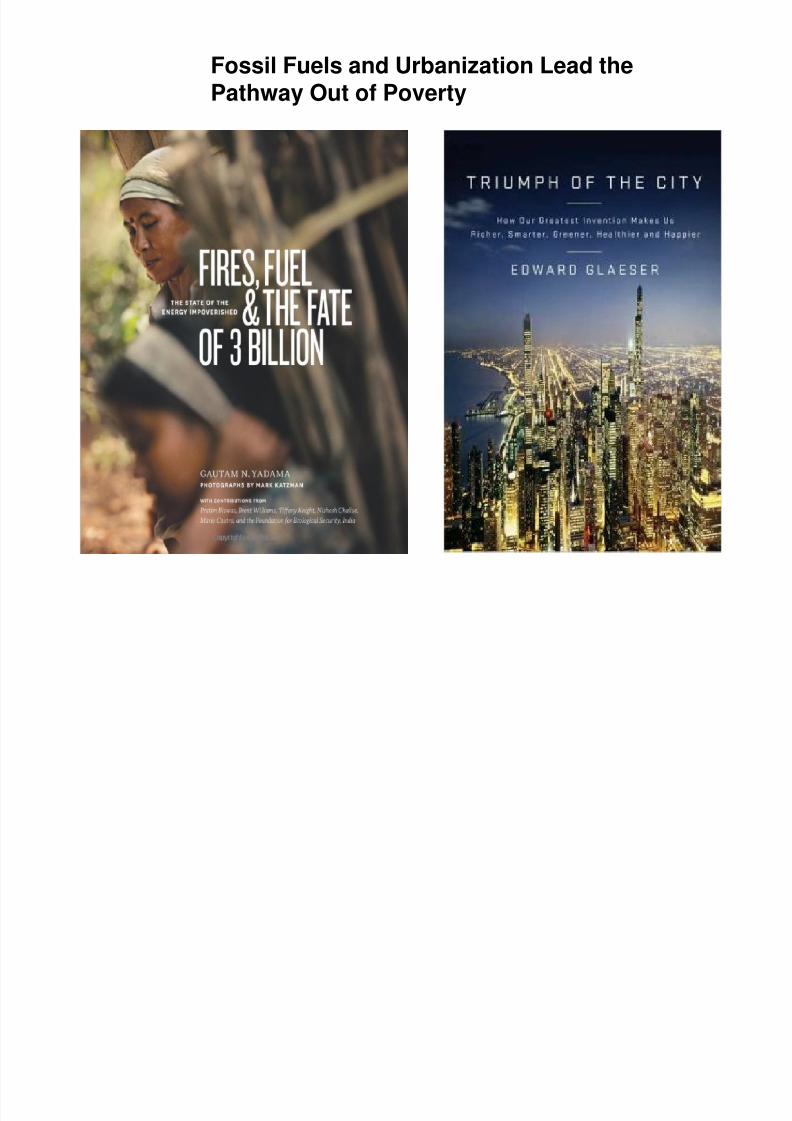
Fossil Fuels and Urbanization Lead thePathway Out of Poverty

8/11/2019 Frank Clemente Presentation
http://slidepdf.com/reader/full/frank-clemente-presentation 16/35
Unprecedented urbanization drives demand for fossilfuel—especially power and steel from coal

8/11/2019 Frank Clemente Presentation
http://slidepdf.com/reader/full/frank-clemente-presentation 17/35
2500
3000
3500
3000
4000
C
UrbanMillions
kWh perCapita
0
500
1000
15002000
0
1000
2000
190019101920193019401950196019701980199020002012
17Sources: United Nations, World Bank
Urban

8/11/2019 Frank Clemente Presentation
http://slidepdf.com/reader/full/frank-clemente-presentation 18/35
Out of Poverty: China Used Coal-Based
Electricity to Lift Hundreds of Millions
“Coal hasunderpinned …
an economic
18
miracle”InternationalEnergy Agency
Sources: IEA, WEO 2013; Business Insider, November 21, 2013
1990Now

8/11/2019 Frank Clemente Presentation
http://slidepdf.com/reader/full/frank-clemente-presentation 19/35
India is Using Coal to Cut Electricity Depri
580
487 715 700
800
500
600
E l e c t r i c i t y
T er aw a t t H o u
From 2002-2011, a 70% increase in coal power reduced India’s electricity deprivation by 47%
306
424
537
400
500
600
200
300
400
2002 2007 2011*
Without Electricity Coal-Based Electricity
M i l l i o n s w
i t h N o
r s of
C o al P ow er
Source: IEA, WEO, 2002, 2007, 2013
* 2011 is the atest IEA data available

8/11/2019 Frank Clemente Presentation
http://slidepdf.com/reader/full/frank-clemente-presentation 20/35
The Rise of Coal Power in ASEAN
600
800
1000
h ) o f G e n e r a t i o n
TWh Through 2035
Coal
Gas
800
0
200
400
1990 2011 2020 2035
T e r a w a t t H o u r s (
T
Other
Hydro
Source: IEA, Southeast Asia Energy Outlook, pg. 37, 2013
2050
8/11/2019 Frank Clemente Presentation
http://slidepdf.com/reader/full/frank-clemente-presentation 21/35
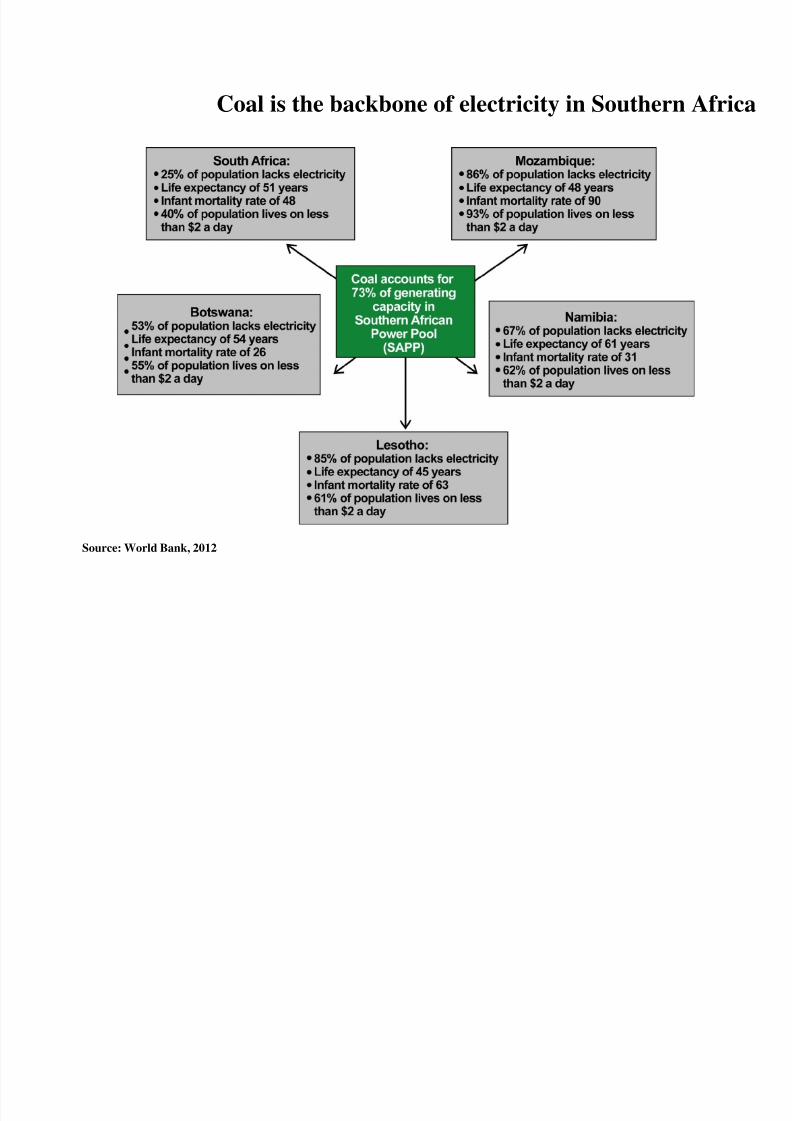
Coal is the backbone of electricity in Southern Africa
Source: World Bank, 2012
8/11/2019 Frank Clemente Presentation
http://slidepdf.com/reader/full/frank-clemente-presentation 22/35

8/11/2019 Frank Clemente Presentation
http://slidepdf.com/reader/full/frank-clemente-presentation 23/35
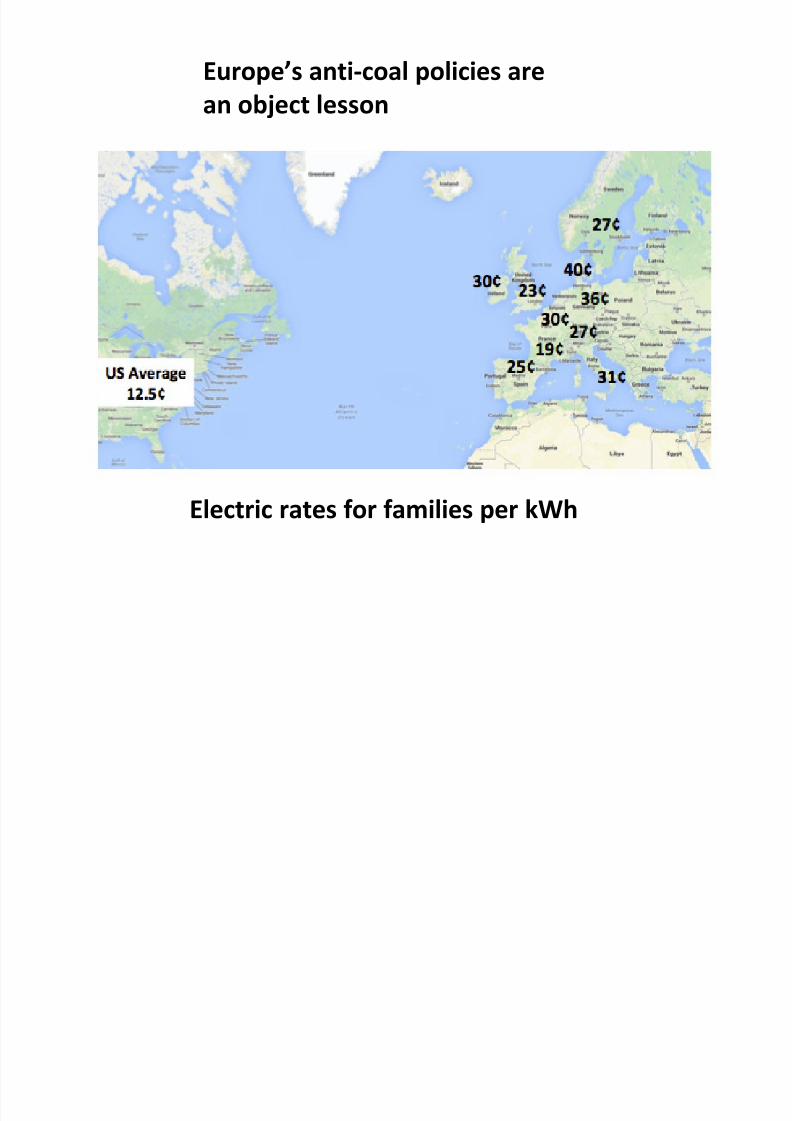
25
30 AEMC Projections for 2013/14
2011/12 prices @ exchange rates
0
5
10
15
20
Australia Japan EuropeanUnion
U.S. Canada
23
: C , 2012.

8/11/2019 Frank Clemente Presentation
http://slidepdf.com/reader/full/frank-clemente-presentation 24/35
Decline in Ontario’s Coal Generation MeantRise in Electric Rates
37 TWh$181
$160
$200
24
32
40
n e r a t i o n ( T
W h ) R
e si d en
t i al E l e
"Someday, peoplewill realize the load ofbull they’ve been
sold by their
0 TWh
$97
$80
$120
0
8
16
2002 2004 2008 2012 2015 C o a l - B a s e d
P o w e r
G
t r i cB i l l a t 1 , 0
0 0 k Wh
* Monthly bill. Adapted from Dewees, 2012; Toronto Star, June 26, 2013
energy," Lorrie
Goldstein, columnist ,Toronto Sun, June,
2013
8/11/2019 Frank Clemente Presentation
http://slidepdf.com/reader/full/frank-clemente-presentation 25/35
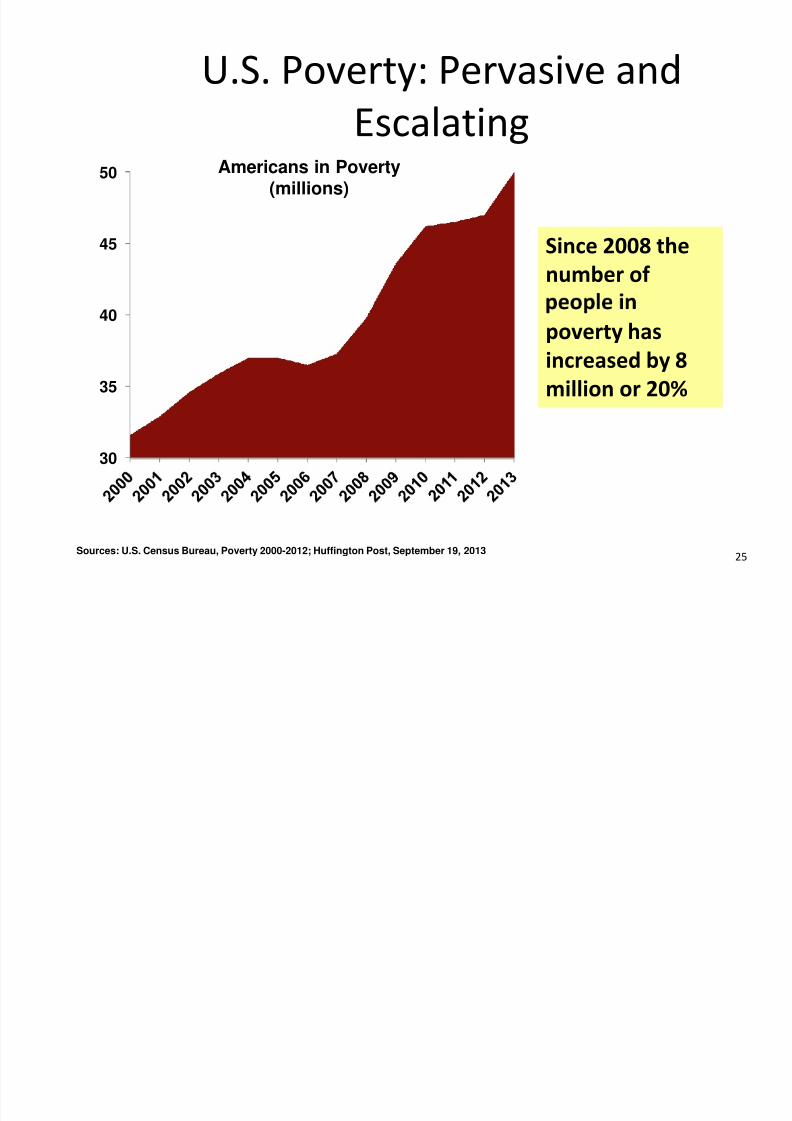
. . :
45
50 Americans in Poverty(millions)
2008
30
35
40
25Sources: U.S. Census Bureau, Poverty 2000-2012; Huffington Post, September 19, 2013
8
20%

8/11/2019 Frank Clemente Presentation
http://slidepdf.com/reader/full/frank-clemente-presentation 26/35
Higher Electricity Rates
Lead to More Poverty
42
46
50
9
9.5
10
10.5
k W h
ElectricityPrice
M
30
34
38
6.5
7
7.5
88.5
C e n
t s P e
Americans inPoverty
l l i on
s
26Sources: EIA, State Electricity Profiles, Electric Power Monthly, February 2013; U.S. Census Bureau, Poverty 2000-2012

8/11/2019 Frank Clemente Presentation
http://slidepdf.com/reader/full/frank-clemente-presentation 27/35
A ?
22
# of times mentioned in the text inEPA’s 128-page proposed carbon rule
27
76
5
California Oregon Washington New York average U.S.State
<1
Source: EPA, Federal Register, Carbon Pollution Emission Guidelines for Existing Stationary Sources: ElectricUtility Generating Units; Proposed Rule, June 18, 2014: Note: Contiguous U.S.

8/11/2019 Frank Clemente Presentation
http://slidepdf.com/reader/full/frank-clemente-presentation 28/35
A . .
339# of times mentioned in
EPA’s 128-page proposedcarbon rules For impact on
minorities, elderly, andlow income, EPA only
considers Climate
28
5 1 0 0
efficiency ordemand side
poor economicgrowth
poverty lower rates orprices
Source: EPA, Federal Register, Carbon Pollution Emission Guidelines for Existing Stationary Sources: ElectricUtility Generating Units; Proposed Rule, June 18, 2014
Change, not the impact
of higher electricityprices.

8/11/2019 Frank Clemente Presentation
http://slidepdf.com/reader/full/frank-clemente-presentation 29/35
Why Do Californians UsLess Electricity?
82%18%
EfficiencyPrograms
77%EfficiencyPrograms
23%
6%
EfficiencyPrograms
77%94%“It turns out, however, that most
of those apparent savings [forUnique Factors:
higher home electricityprices, climate, industrial
shift, householdsize & mix
Unique Factors:household characteristics,
climate,fuel choice,
appliance patterns
Sources: Mitchell, et al., “Stabilizing California’s Demand,” March 2009, Energy Economics; Arik Levinson, Jan. 29, 2013,“California Energy Efficiency: Lessons for the Rest of the World, or Not?,” Georgetown University
Unique Factors:household characteristics,
population trends,climate
a orn a can e exp a ne y
long run trends unrelated toenergy efficiency,” Arik Levinson,
Professor of EconomicsGeorgetown University

8/11/2019 Frank Clemente Presentation
http://slidepdf.com/reader/full/frank-clemente-presentation 30/35
30% Fewer Cooling Degree Days than Average
2,2212,434 2,686 2,714
2000
2500
3000
Cooling Degree Days
3030
994 1,0291,172
0
500
1000
1500
CA WV IL OK LA TX AZ
Source: NCDC
Note: U.S = 1,356 cooling degree days

8/11/2019 Frank Clemente Presentation
http://slidepdf.com/reader/full/frank-clemente-presentation 31/35
C A C
12
13
14
15
r k W h
California• Already has the highest
electric rates west of theMississippi*
• Electric rates areprojected to rise 47%
California
6
7
8
9
10
2001 2003 2005 2007 2009 2011 2013
C e n t s
P
U.S.
Sources: EIA, State Electricity Profiles, Electric Power Monthly, February 2014;UT San Diego, July 28, 2012; LA Times, April 26, 2014 *Contiguous U.S.
• Has 12% of the U.S.population but 34% ofAmericans on welfare.
• More children in povertythan Nebraska haspeople.
31

8/11/2019 Frank Clemente Presentation
http://slidepdf.com/reader/full/frank-clemente-presentation 32/35
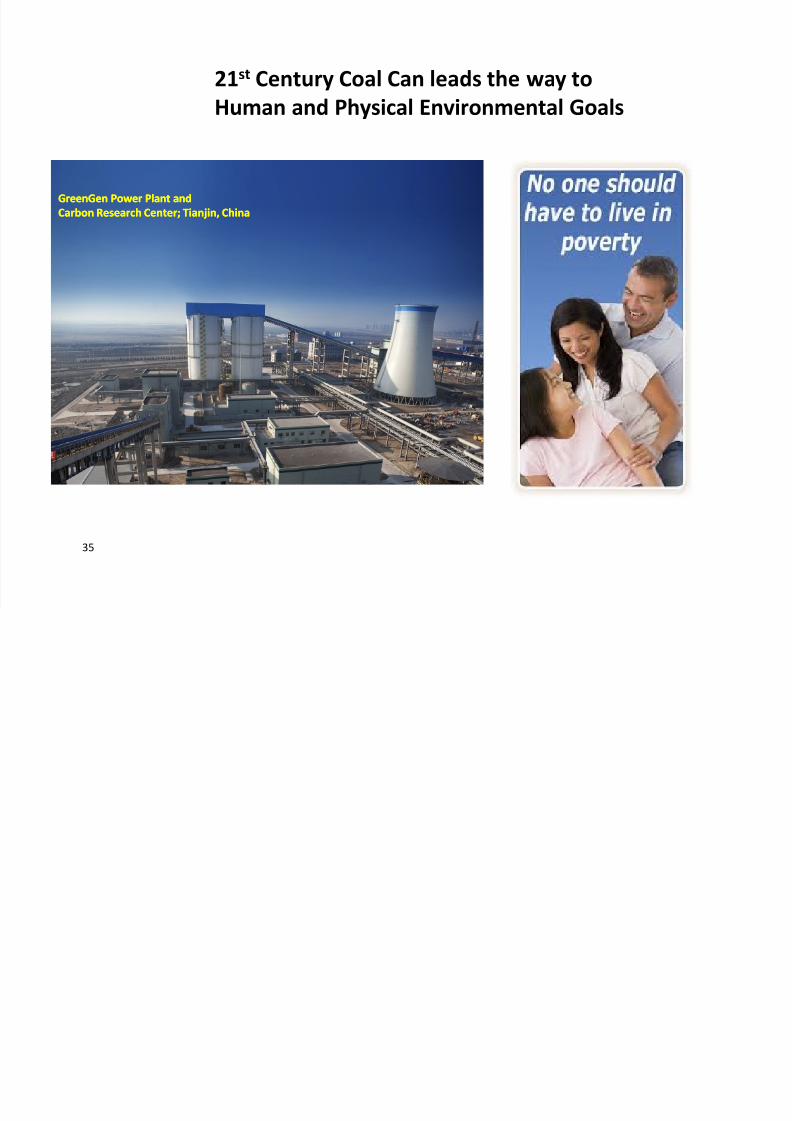
Clean Coal Works
% %
32
Sources: EIA, Electricity, Generation & Thermal Output, Electricity Net Generation, Electric Power Sector, 1949-
2011; USDA (Shane), GDP per Capita Historical; NETL, June 2012, Fossil Energy Research Benefits, Clean CoalTechnology Demonstration Program
8/11/2019 Frank Clemente Presentation
http://slidepdf.com/reader/full/frank-clemente-presentation 33/35
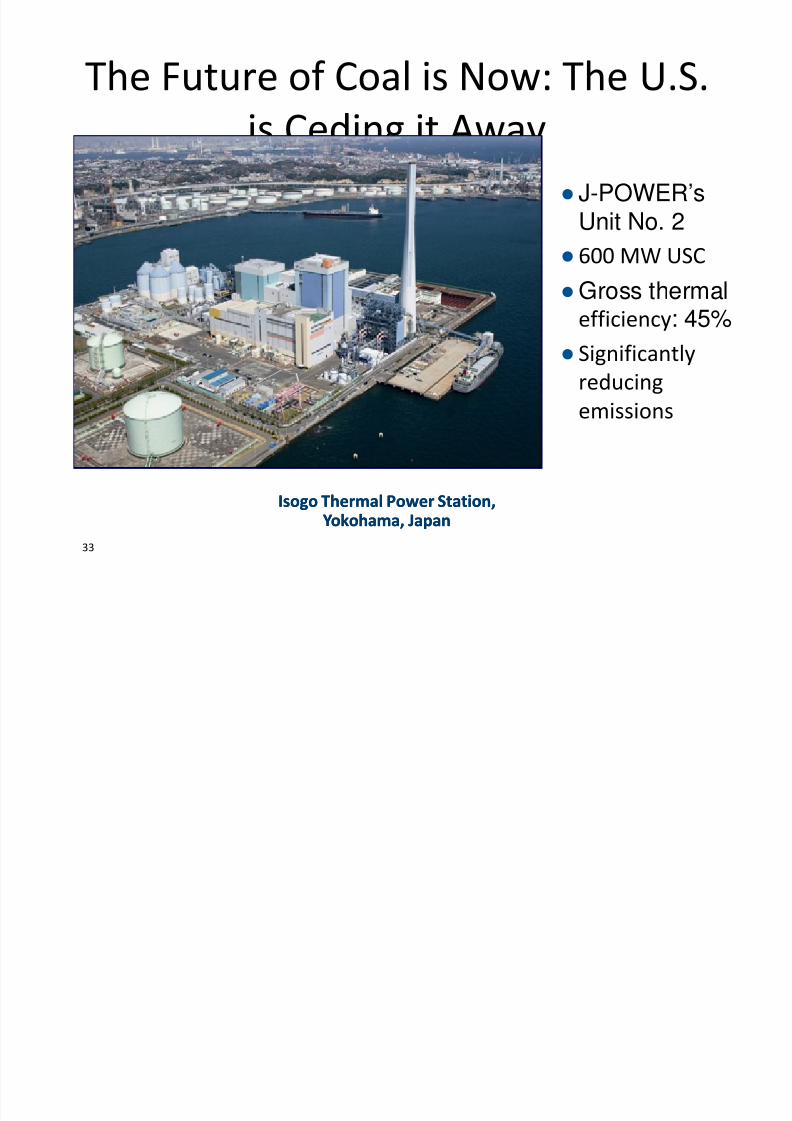
C : . . C A
J-POWER’s
Unit No. 2600 C
Gross thermal
33
, ,, ,
: 45%

8/11/2019 Frank Clemente Presentation
http://slidepdf.com/reader/full/frank-clemente-presentation 34/35
:
87
C 2
34
:14 C2
7 C
Source: National Energy Technology Laboratory, U.S. Department of Energy, “Storing CO 2 and Producing Domestic Crude Oil
with Next Generation CO 2-EOR Technology,” Jan. 9, 2009; International Energy Agency: “Coal-Fired Power Generation:Replacement/Retrofitting Older Plants,” 2008; Management Information Services and Peabody analysis. : / 2012/1540 1.5.
8/11/2019 Frank Clemente Presentation
http://slidepdf.com/reader/full/frank-clemente-presentation 35/35