Embed Size (px)
Citation preview

TITLE PAGE
EXPLORING MARKETING MANAGERS’ USE OF
ACCOUNTING INFORMATION:
A CASE STUDY OF
THE PORTUGUESE FASHION RETAIL SECTOR
A thesis submitted to The University of Manchester for the degree of
Doctor of Business Administration
in the Faculty of Humanities
2014
RAFAEL ANTÓNIO SERRALHEIRO FRANCO
MANCHESTER BUSINESS SCHOOL

2

3
LIST OF CONTENTS
TITLE PAGE......................................................................................................................1
LIST OF CONTENTS .......................................................................................................3
LIST OF TABLES..............................................................................................................7
LIST OF FIGURES............................................................................................................8
LIST OF APPENDICES....................................................................................................8
ABSTRACT........................................................................................................................9
DECLARATION..............................................................................................................11
COPYRIGHT STATEMENT .........................................................................................13
ACKNOWLEDGEMENTS.............................................................................................15
LIST OF ABBREVIATIONS..........................................................................................17
CHAPTER 1 INTRODUCTION................................................................................19
1.1 Background of the Research ..............................................................................19
1.2 Research Objectives ...........................................................................................24
1.3 Research Questions and Methodology...............................................................27
1.4 Structure of Dissertation ....................................................................................28
CHAPTER 2 LITERATURE REVIEW....................................................................31
2.1 Introduction ........................................................................................................31
2.2 Accounting Information .....................................................................................32
2.3 Accounting Information: Management Accounting Perspectives .....................37
2.3.1 Cost Management.......................................................................................37
2.3.2 Strategic Management Accounting ............................................................40
2.3.2.1 Strategic Cost Management ...................................................................40
2.3.2.2 Activity-based Costing...........................................................................44
2.3.2.3 Customer Profitability Analysis.............................................................47

4
2.3.3 Planning and Control Systems................................................................... 49
2.3.3.1 Budgeting............................................................................................... 49
2.3.3.2 Performance Measurement .................................................................... 51
2.3.3.3 Strategic Control Systems...................................................................... 53
2.4 Accounting Information: Marketing Management Perspectives ....................... 58
2.5 Managers of Marketing and Accounting Information ....................................... 64
2.5.1 Marketing Performance Measurement....................................................... 64
2.5.2 Financial Metrics in Marketing.................................................................. 70
2.5.3 Marketing and Accounting Interaction ...................................................... 74
2.6 Conclusion ......................................................................................................... 79
CHAPTER 3 RESEARCH METHODOLOGY ....................................................... 87
3.1 Introduction........................................................................................................ 87
3.2 Qualitative Research .......................................................................................... 87
3.3 Case Study Method............................................................................................ 91
3.4 Selection of Cases .............................................................................................. 96
3.5 Data Collection .................................................................................................. 97
3.6 Data Analysis ................................................................................................... 101
CHAPTER 4 FASHION RETAIL IN PORTUGAL .............................................. 105
4.1 Introduction...................................................................................................... 105
4.2 The Fashion Retail in Portugal ........................................................................ 105
4.3 The Major Companies in the Portuguese Fashion Retail ................................ 106
4.4 The Selected Companies.................................................................................. 108
CHAPTER 5 FIRST CASE STUDY: DIMODA..................................................... 111
5.1 Introduction...................................................................................................... 111
5.2 The Grupo Regojo ........................................................................................... 111
5.2.1 The History of Grupo Regojo .................................................................. 111
5.2.2 Mission, Culture and Vision of Grupo Regojo ........................................ 113
5.2.3 Objectives and Strategy of Grupo Regojo ............................................... 114
5.2.4 The Dimoda Business Unit at Grupo Regojo .......................................... 117
5.3 Dimoda Business Unit ..................................................................................... 119
5.3.1 Business Profitability............................................................................... 120
5.3.2 Business Objectives of Dimoda............................................................... 121
5
5.3.3 Accounting System and Marketing Management ....................................124
5.3.3.1 Marketing Managers’ Demand of Accounting Information ................124
5.3.3.2 Factors Influencing the Use of Accounting Information .....................141
5.3.4 Dimoda Marketing Department ...............................................................153
5.3.4.1 Marketing Department Planning and Budgeting..................................154
5.3.4.2 Marketing Accountability ....................................................................156
5.3.4.3 Marketing Department Stature and Influence ......................................161
5.4 Conclusion .......................................................................................................166
CHAPTER 6 SECOND CASE STUDY: MODALFA ............................................169
6.1 Introduction ......................................................................................................169
6.2 The Sonae Group..............................................................................................169
6.2.1 The History of Sonae ...............................................................................171
6.2.2 Mission, Culture and Values of Sonae.....................................................173
6.2.3 Objectives and Strategy of Sonae ............................................................174
6.2.4 The Modalfa Business Unit at Sonae .......................................................176
6.3 Modalfa Business Unit.....................................................................................177
6.3.1 Business Profitability ...............................................................................178
6.3.2 Business Objectives of Modalfa ..............................................................181
6.3.3 Accounting System and Marketing Management ....................................185
6.3.3.1 Marketing Managers’ Demand of Accounting Information ................185
6.3.3.2 Factors Influencing the Use of Accounting Information .....................213
6.3.4 Modalfa Marketing Department...............................................................239
6.3.4.1 Marketing Department Planning and Budgeting..................................239
6.3.4.2 Marketing Accountability ....................................................................240
6.3.4.3 Marketing Department Stature and Influence ......................................242
6.4 Conclusion .......................................................................................................246
CHAPTER 7 ANALYSIS AND DISCUSSION.......................................................251
7.1 Introduction ......................................................................................................251
7.2 Factors Influencing the Use of Accounting Information .................................251
7.2.1 The Dimoda Case.....................................................................................252
7.2.2 The Modalfa Case ....................................................................................253
7.3 Managers’ Demand of Accounting Information ..............................................255
7.3.1 The Dimoda Case.....................................................................................255
6
7.3.2 The Modalfa Case.................................................................................... 255
7.4 Marketing Managers’ Demand for Marketing Metrics.................................... 257
7.4.1 The Dimoda Case..................................................................................... 257
7.4.2 The Modalfa Case.................................................................................... 258
7.5 The Contribution of Management Accounting Departments .......................... 259
7.6 Communication of Accounting Information.................................................... 261
7.6.1 The Dimoda Case..................................................................................... 261
7.6.2 The Modalfa Case.................................................................................... 263
7.7 Factors Influencing the Use of Accounting Information ................................. 264
7.7.1 Structural Factors ..................................................................................... 264
7.7.2 Functional Factors.................................................................................... 266
7.8 Managers’ Demand of Accounting Information.............................................. 268
7.8.1 Accounting Information for Diagnosis and Control ................................ 268
7.8.2 Accounting Information for Management Action ................................... 271
7.9 Marketing Department Situation: Comparative Analysis................................ 275
7.10 Conclusion ....................................................................................................... 279
CHAPTER 8 CONCLUSION .................................................................................. 283
8.1 Summary of Findings....................................................................................... 283
8.2 Contributions of the Research.......................................................................... 290
8.3 Limitations of the Research ............................................................................. 294
8.4 Suggestions for Further Research .................................................................... 295
APPENDICES................................................................................................................ 297
REFERENCES............................................................................................................... 317
Keywords: accounting, case study, clothing, fashion apparel, management accounting, management control, marketing management, marketing strategy, performance measurement, planning, Portugal, qualitative research, retailing. Word count (including footnotes): 104,692
7
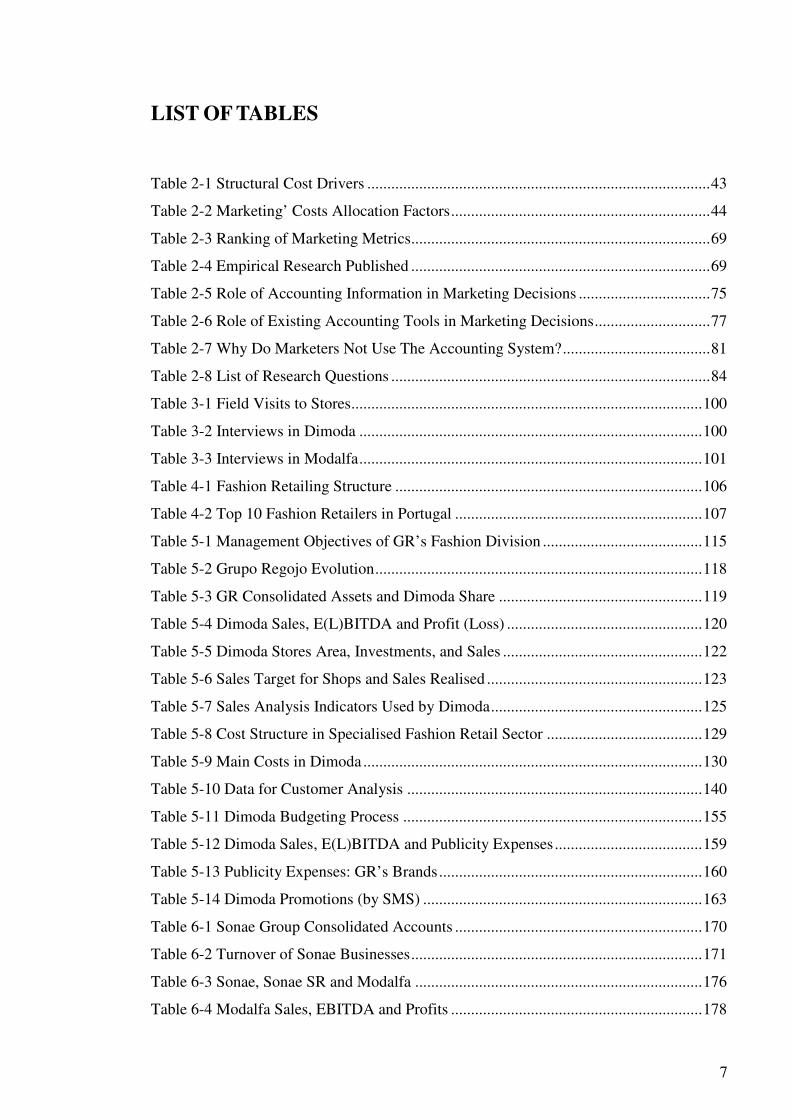
LIST OF TABLES
Table 2-1 Structural Cost Drivers ......................................................................................43
Table 2-2 Marketing’ Costs Allocation Factors.................................................................44
Table 2-3 Ranking of Marketing Metrics...........................................................................69
Table 2-4 Empirical Research Published ...........................................................................69
Table 2-5 Role of Accounting Information in Marketing Decisions .................................75
Table 2-6 Role of Existing Accounting Tools in Marketing Decisions.............................77
Table 2-7 Why Do Marketers Not Use The Accounting System?.....................................81
Table 2-8 List of Research Questions ................................................................................84
Table 3-1 Field Visits to Stores........................................................................................100
Table 3-2 Interviews in Dimoda ......................................................................................100
Table 3-3 Interviews in Modalfa......................................................................................101
Table 4-1 Fashion Retailing Structure .............................................................................106
Table 4-2 Top 10 Fashion Retailers in Portugal ..............................................................107
Table 5-1 Management Objectives of GR’s Fashion Division ........................................115
Table 5-2 Grupo Regojo Evolution..................................................................................118
Table 5-3 GR Consolidated Assets and Dimoda Share ...................................................119
Table 5-4 Dimoda Sales, E(L)BITDA and Profit (Loss) .................................................120
Table 5-5 Dimoda Stores Area, Investments, and Sales ..................................................122
Table 5-6 Sales Target for Shops and Sales Realised ......................................................123
Table 5-7 Sales Analysis Indicators Used by Dimoda.....................................................125
Table 5-8 Cost Structure in Specialised Fashion Retail Sector .......................................129
Table 5-9 Main Costs in Dimoda.....................................................................................130
Table 5-10 Data for Customer Analysis ..........................................................................140
Table 5-11 Dimoda Budgeting Process ...........................................................................155
Table 5-12 Dimoda Sales, E(L)BITDA and Publicity Expenses.....................................159
Table 5-13 Publicity Expenses: GR’s Brands..................................................................160
Table 5-14 Dimoda Promotions (by SMS) ......................................................................163
Table 6-1 Sonae Group Consolidated Accounts ..............................................................170
Table 6-2 Turnover of Sonae Businesses.........................................................................171
Table 6-3 Sonae, Sonae SR and Modalfa ........................................................................176
Table 6-4 Modalfa Sales, EBITDA and Profits ...............................................................178

8
Table 6-5 Modalfa Objectives ......................................................................................... 184
Table 6-6 Modalfa Stores, Sales and Employees ............................................................ 184
Table 6-7 Modalfa Sales and Publicity Expenses............................................................ 203
Table 6-8 Marketing Department’s Staff KPIs................................................................ 210
Table 7-1 Factors Influencing Managers’ Use of Accounting Information .................... 264
Table 7-2 Managers’ Demand of Accounting Information ............................................. 274
Table 8-1 Summary of Findings: Dimoda vs. Modalfa ................................................... 286
Table A-1 Publicity Expenses of Major Fashion Brands ................................................ 299
Table A-2 Sales, Profitability and Publicity Expenditures of Major Fashion Brands ..... 299
Table A-3 Dimoda Stores in 2010 ................................................................................... 312
Table A-4 Chronology of New Businesses...................................................................... 315
LIST OF FIGURES
Figure 2-1 Management Control System........................................................................... 33
Figure 8-1 Accounting System Design Circles................................................................ 285
Figure A-1 Statistical Correlations Between Concepts ................................................... 307
Figure A-2 Marketing Management: The Big Picture..................................................... 309
Figure A-3 Grupo Regojo Businesses Structure (2011) .................................................. 311
Figure A-4 Sonae Businesses Structure (2011) ............................................................... 313
LIST OF APPENDICES
Appendix 1 Publicity Expenses of Major Fashion Brands .............................................. 299
Appendix 2 Concepts’ Definitions .................................................................................. 301
Appendix 3 Statistical Correlations Between Concepts .................................................. 307
Appendix 4 The Big Picture Framework......................................................................... 309
Appendix 5 Grupo Regojo Businesses ............................................................................ 311
Appendix 6 Sonae Businesses Structure.......................................................................... 313
Appendix 7 Chronology of Sonae Businesses ................................................................. 315
9
ABSTRACT
The management accounting literature (e.g., Cooper and Kaplan 1988b; Shillinglaw 1982) argues that cost information is beneficial for marketing management in order to improve the business profitability. Accounting for strategic management also proposes the use of accounting information on cost drivers, business strategy, market and competitors (e.g., Shank and Govindarajan 1993). In the accounting and control literature it is also suggested that a company gains if it includes interactive control systems, with the participation of the various functional areas, including marketing, in addition to the traditional diagnostic systems (Simons 1995b). Moreover, the marketing literature states that there is a loss of influence and stature of the marketing department (Webster Jr et al. 2005) and relates this in part to the lack of performance measures (see Ambler 2003b; McGovern et al. 2004; Nath and Mahajan 2008), particularly the financial ones (e.g., Schultz and Gronstedt 1997). The marketing literature also recognises the usefulness of cost accounting information (e.g., Dunne and Wolk 1977; Kirpalani and Shapiro 1973; Winter 1979), in particular the information from the activity-based costing systems for marketing management (e.g., Goebel et al. 1998; Lere 2001). Although the literature in both accounting and marketing note benefits from using accounting information, the interaction, communication and the exchange of information between marketing and accounting departments is poor (Phillips and Halliday 2008; Srivastava et al. 1998) and little researched (De Ruyter and Wetzels 2000; McManus and Guilding 2008).
The purpose of this research is to understand what influences the ability of the accounting system to meet the managers’ demand of accounting information, as well as why and how marketing managers are demanding accounting information. In keeping with the exploratory and explanatory research nature of the research an interpretative case study was conducted (see Lukka and Modell 2010; Mason 2002; Yin 2009). Two companies were selected from the Portuguese fashion retail sector (cf. Perloff and Salop 1985; Snyder 1989; Swartz 1983). The data was collected through semi-structured interviews, observation, and documents.
The analysis and comparison of these two cases revealed that the use of accounting information was influenced by both structural and functional factors. From the structural point of view, it was important for the two companies to have very detailed accounting information in the system and have the financial and non-financial databases integrated. The mentality of the management control staff – oriented towards the real needs of the managers – was also a key factor. From the functional point of view, it was observed that two complementary forms of transmission of accounting information contributed to the effectiveness of its use. The self-service access to updated information and both automated and customised reports, contributed the accounting information being frequently accessed and interpreted by all managers – particularly commercial and sales managers. The face-to-face presentation and discussion of management accounting reports positively influenced the collective use of accounting information – in order to diagnose problems, find solutions and align the various managers in the implementation of plans. As a result, these interactions were still opportunities for mutual learning. Managers learned the potential of the accounting system and accountants perceived the specific needs of each manager. Therefore, it enabled both financial and management accountants to create and to maintain the management accounting system adapted to the managers' demand. Managers in both companies seek information to analyse sales, control costs and manage profitability. In one of the companies the information was also used strategically – the cost drivers, the market situation and the competitors’ accounting information were analysed. In one company, the accounting information was also used to protect the marketing department, i.e., the accounting information was used to maintain or increase the funds allocated to the marketing budget. In this particular case of marketing performance measurement, the unit of analysis was the marketing project and the metric was the contribution to profits. In conclusion, the marketing managers in these companies do seek management accounting information. Regular face-to-face, multi-functional and multi-hierarchical interaction is a key factor for the use of the accounting system; this is where managers learn the potential of the accounting system and accountants understand the real managers’ needs of accounting information.

10

11
DECLARATION
No portion of the work referred to in the thesis has been submitted in support of an
application for another degree or qualification from this or any other university or other
institute of learning.

12
13
COPYRIGHT STATEMENT
Copyright and Ownership of Intellectual Property Rights
i. The author of this thesis (including any appendices and/or schedules to this
thesis) owns certain copyright or related rights in it (the “Copyright”) and he has given
The University of Manchester certain rights to use such Copyright, including for
administrative purposes.
ii. Copies of this thesis, either in full or in extracts and whether in hard or
electronic copy, may be made only in accordance with the Copyright, Designs and Patents
Act 1988 (as amended) and regulations issued under it or, where appropriate, in
accordance with licensing agreements which the University has from time to time. This
page must form part of any such copies made.
iii. The ownership of certain Copyright, patents, designs, trade marks and
other intellectual property (the “Intellectual Property”) and any reproductions of
copyright works in the thesis, for example graphs and tables (“Reproductions”), which
may be described in this thesis, may not be owned by the author and may be owned by
third parties. Such Intellectual Property and Reproductions cannot and must not be made
available for use without the prior written permission of the owner(s) of the relevant
Intellectual Property and/or Reproductions.
iv. Further information on the conditions under which disclosure, publication
and commercialisation of this thesis, the Copyright and any Intellectual Property and/or
Reproductions described in it may take place is available in the University IP Policy (see
http://www.campus.manchester.ac.uk/medialibrary/policies/intellectual-property.pdf), in
any relevant Thesis restriction declarations deposited in the University Library, The
University Library’s regulations (see http://www.manchester.ac.uk/library/aboutus/regula
tions) and in The University’s policy on presentation of Theses.

14
15
ACKNOWLEDGEMENTS
I would like to thank my supervisors, Ted O'Leary and Jodie Moll, for their dedication,
their patience in correcting me and guidance.
Thanks to my wife, Sofia, who has showed the utmost understanding and support,
both tangible and intangible. I thank my children, Marta, Raquel, José, João and Tomás,
who have always had a smiling face and understood my absences. I would also like to
thank my parents and in-laws for the tireless support given throughout. Special thanks is
extended to Aunt Beli for her great support, including logistics.
I would also like to thank AESE and the companies cooperating in the
investigation – I am very grateful to José Dias Ferreira and Isabel Cantista who
contributed decisively to my access to the businesses observed in this research.
To all the students who shared their ideas with me – in particular those from the
AESE Executive MBA – and co-workers I am truly indebted for their constant support.
My sincere thanks to all who had the patience to listen to me and read what I wrote:
Adrian Caldart, André Morgado, Eugénio Viassa Monteiro, Fátima Carioca, José Miguel
Pinto dos Santos, José Ramalho Fontes, Martin Ferreira, Paulo Lopes Marcelo and
Ramiro Martins. Thanks is also extended to Antonio Dávila and Albert Fernández for
their support. Finally, I express profound gratitude to the "un-Known Soldier", as we say
in Portugal, i.e., the One who helped me before I was aware of it.
I dedicate this work to both my parents and Ted – who passed away suddenly. I
admired Ted very much. He offered great support in difficult situations. His words were
always calm, friendly, supportive and enlightening. It was a privilege having him as a
supervisor.

16
17
LIST OF ABBREVIATIONS ABC – Activity-Based Costing 1.2
BP – Business Performance 2.1
CAPEX – Capital Expenditures 2.2
CEO – Chief Executive Officer 2.5
CLV – Customer Lifetime Value 2.5.2
CMO – Chief Marketing Officer 2.5
CRM – Customer Relationship Management 2.5.1
DCF – Discounted Cash Flow 2.2
EBIT – Earnings Before Interest and Tax 6.3.2
EBITDA – Earnings Before Interest, Tax, Depreciation and Amortisation 5.2.3
GR – Grupo Regojo 1.3
IT – Information Technology 5.3.3.2.1.2
KPI – Key Performance Indicator 6.3.3.1.2
LBITDA – Loss Before Interest, Tax, Depreciation and Amortisation 5.2.3
MAS – Management Accounting System 1.1
MD – Marketing Department 1.1
MI – Marketing Influence 2.1
MPM – Marketing Performance Measurement 1.4
PAR – Plan of Actions and Resources 6.3.3.1.8
PCG – Planning and Management Control Department
“Planeamento e Controlo de Gestão” in Portuguese 6.3.3.2.2.7
ROE – Return on Equity 4.3
ROI – Return on Investment 4.3
SBU – Strategic Business Unit 2.5.1
SCM – Strategic Cost Management 1.2
SMA – Strategic Management Accounting 2.3.2.1
SMS – Short Message Service 5.3.3.1.4
TMT- Top Management Team 2.5.1
TOC – Theory of Constraints 2.3.1

18
19
CHAPTER 1 INTRODUCTION
This chapter describes the scope of the research, its objectives, the methodology used and
how the dissertation is organised. The first section contextualises the research based on a
review of the extant literature, while the second section lists the research objectives. The
research questions are presented in the third section, as well as the methodology. The
chapter concludes with an explanation as to how the dissertation is organised.
1.1 Background of the Research
This is an empirical research on the use of accounting information by managers of
marketing (i.e., marketing, sales and operations managers) through the study of two cases
in fashion retail. The research explores the relevance of accounting information for the
management of marketing. It begins by identifying the proposals made in the accounting
literature which are potentially useful for marketing managers. Afterwards, the marketing
literature is reviewed to identify the applications the accounting information may have
from the marketing management perspective. Then the literature is reviewed in what
concerns the collaboration between accounting and marketing, i.e., opportunities,
problems and challenges.
The interest in studying these topics stems from various situations encountered in
the business literature: (1) the accounting literature proposes a number of potentially
useful tools and techniques – from the perspective of management accounting – for
marketing management both in the short and long run (e.g., Anthony et al. 2010; Drury
2009; Pereira et al. 2010; Robinson 1990); (2) the marketing literature refers to the
importance of accounting information in evaluating marketing performance, in order to
preserve the image and the influence of the marketing department (MD) within the
company (e.g., O'Sullivan and Abela 2007; Verhoef et al. 2011); (3) the related literature
refers to the existence of an accounting “information gap” in marketing managers, i.e.,
there are differences between what marketing managers would like to have in terms of
accounting information and what they actually have and use (see Foster and Gupta 1994,
p. 65; McManus and Guilding 2008); and (4) the factors that may be limiting the use of
accounting information by marketing managers or the reasons why there are
communication gaps between marketing and accounting have not been researched so far
(see De Ruyter and Wetzels 2000; McManus and Guilding 2008).

CHAPTER 1
20
From the perspective of management accounting, this research seeks to explore
both the marketing managers’ demand for accounting information and the factors that
influence the ability of the accounting system to meet this demand. This focus responds to
two challenges derived from the accounting literature. First, there are calls for more
research on accounting in practice (Anderson 2008; Hall 2010; Jönsson 1998; Merchant
and Van der Stede 2006). The accounting literature indicates that one function of
accounting, in particular management accounting, is to support the managerial work with
accounting information (see Horngren 2004; Johnson and Kaplan 1987; Pereira et al.
2010). Moreover, that accounting information helps to increase the knowledge that
managers have of their business (Birnberg et al. 2006; Sprinkle 2003), assists them to
make operational decisions, e.g., price, product specifications and operations management
(Banker and Hughes 1994; Baxendale et al. 2006; Lere 2001), and contributes to strategic
decision making (Kaplan and Cooper 1988; Shank and Govindarajan 1993). In addition,
all these applications of accounting information – proposed by management accounting –
are useful for the management of marketing (Goebel et al. 1998; Lere 2001). In this
respect, Goebel et al. (1998, p. 498) state:
“The traditional role of managerial accounting is to provide financial information for managerial decision making. Marketing has a long history of using accounting information, primarily contribution margins, to improve decision making in segment profitability, marketing mix profitability, and break-even analysis. In addition, accounting information is relevant to product introduction and abandonment and pricing decisions. In all cases, cost accounting information, along with anticipated selling price and volume numbers, is used to provide estimates of the potential profit from a marketing decision.”
and Roslender and Hart (2003, p. 255) note:
“SMA [Strategic Management Accounting] is best understood as a generic approach to accounting for strategic positioning. It is defined by an attempt to integrate insights from management accounting and marketing management within a strategic management framework.”
However, though some authors suggest that management accounting has made
progress in adapting to the evolving business landscape and meets the needs of managers
in terms of accounting information to support management (see Kaplan and Anderson
2004; Lukka and Granlund 2002), other studies report that accounting is not progressing
at the pace of business (cf. Bromwich 2000; Bromwich and Bhimani 1994), and that
organisations resist change in their accounting systems, particularly when the changes are
INTRODUCTION
21
revolutionary (see Burns and Vaivio 2001; Jermias 2001). Still others suggest that the
costs to implement and maintain more complex management accounting systems (MAS)
– e.g., cost management in products or services of high customisation – do not justify the
benefits (Drury and Tayles 2005, p. 61). There are also studies reporting that the SMA
has not evolved as expected and has had little application in practice (Bromwich and
Bhimani 1994; Langfield-Smith 2008; McManus and Guilding 2008; Shank 2006).
Therefore, there are differences between what is discussed and proposed in theory and
what is used in practice (Baldvinsdottir et al. 2010; Johnson and Kaplan 1987, p. 172;
Lucas and Rafferty 2008; Ratnatunga et al. 1988). Consequently, in the accounting
literature there are calls for more research on management accounting in practice
(Anderson 2008; Hall 2010; Jönsson 1998; Merchant and Van der Stede 2006).
Second, the accounting literature refers to the need to gain better knowledge into
how the accounting information is collected, transmitted and used by managers (see
Anderson 2008; Hall 2008, 2010). Although there are a small number of studies that
examine the use of accounting information in practice (e.g., Ahrens and Chapman 2007;
McKinnon and Bruns 1992; Preston 1986) none of them observe how marketing
managers demand and use accounting information in particular. In this respect, Hall
(2010, p. 302) notes:
“There is also much to learn about how managers engage with accounting information because there are remarkably few studies of what information managers actually use or might use”
This research is also linked to topics discussed in the marketing literature. First,
there are calls for research on marketing and accounting interface (De Ruyter and Wetzels
2000; McManus and Guilding 2008). It is suggested in the marketing literature that the
use of accounting information can improve decision making in marketing (Goebel et al.
1998; Kumar et al. 2008; Lere 2001; Thomas et al. 2004) and it is useful in evaluating the
performance of marketing departments (Barwise and Farley 2004; Gao 2010; Morgan et
al. 2002; Srivastava et al. 1998). The theory supports the perspective in which firms may
improve their profits if marketing managers make decisions (e.g., on prices, product mix
or advertising) using cost accounting information (cf. Cabral 2000; Dubé et al. 2005). It is
also reported in the related literature that firms would benefit if there were more
interaction between marketing and accounting (cf. Phillips and Halliday 2008; Srivastava
et al. 1998).
CHAPTER 1
22
In this respect, Philips and Halliday (2008, p. 766) comment:
“We consider that the synergy that could come from the marketing-accounting space being transformed into a genuine interface has the potential to provide the necessary information for much improved, strategic, decision-making.”
However, the marketing literature suggests that marketing managers make little
use of accounting information and have little interaction with financial staff (Adler 1967;
Ambler 2003a; Barwise and Farley 2004; De Ruyter and Wetzels 2000; Gleaves et al.
2008; O'Sullivan and Abela 2007). An explanation offered in the related literature notes
that this is not due to a lack of accounting information, but due to the fact that marketing
managers do not know how to use and interpret accounting information, for example,
McGovern et al. (2004, p. 74) note:
“[M]arketing executives need (but often lack) a solid grasp of corporate finance to align marketing strategy with financial goals.”
Although there is speculation on the causes for weak interaction between
marketing and accounting (see Section 2.5.3), there are few empirical studies in the
concerning literature about this interaction (De Ruyter and Wetzels 2000; McManus and
Guilding 2008).
Second, there are calls in the marketing literature for more empirical research on
the use of financial metrics (e.g., Barwise and Farley 2004; Lehmann 2004; Srivastava et
al. 1998) and on its application in measuring marketing performance. There are references
to conceptual disparities and interpretation differences in marketing and accounting
textbooks, related to financial metrics with application in marketing management, e.g.,
customer profitability analysis (Gleaves et al. 2008). There are also references to the
absence of marketing financial metrics in management accounting textbooks, but referred
to in marketing textbooks (Bates and Whittington 2009). In this context, there is a call
for more research on this topic, and specifically on measuring marketing performance
with financial metrics (Gao 2010; Lehmann 2004). For example, Srivastava et al. (1998,
p. 14) suggest:
“Theories of marketing must be extended and broadened to include developments in finance, as indeed, theories of finance must be extended and broadened to include recent developments in marketing.”
INTRODUCTION
23
Finally, the marketing literature refers to the need to investigate the mediators and
explain – using qualitative studies – the statistical relationships identified in extant
quantitative studies between marketing performance measurement and MD influence
(e.g., O'Sullivan et al. 2009; Verhoef et al. 2011). The concept of MD influence “is seen
as the marketing function’s ability to persuade others to develop, shape and implement
strategies based on its advice” (Merlo 2011, p. 1153). Some authors state that marketing
has been losing power and influence within the organisation (e.g., Schultz 2003, 2005;
Webster Jr et al. 2005); i.e., the marketing executives cease to be invited to participate in
the senior management meetings, they leave the top management teams, or their
importance is not being recognised by other managers or general managers (see Ambler
2003a; McGovern et al. 2004). This loss of the MD’s influence has been linked to a lack
of ability to measure marketing activities’ return, particularly in using financial metrics
(see Lehmann 2004; Moorman and Rust 1999; O'Sullivan and Abela 2007; O'Sullivan et
al. 2009; Rust et al. 2004; Schultz and Gronstedt 1997; Seggie et al. 2007; Verhoef and
Leeflang 2009; Verhoef et al. 2011; Webster Jr et al. 2005). It is also suggested that this
produces negative impacts on each firm’s performance (see Cano et al. 2004; Kirca et al.
2005; Verhoef and Leeflang 2009; Verhoef et al. 2011). In this regard, Phillips and
Halliday (2008, p. 752), commenting on the recommendations of Kotler (2006, p. 17),
say:
“Kotler is currently telling marketers that to have the influence that the function is due, they must respond to ‘‘increasing pressure for financial accountability’’ with ‘‘smarter marketing’’.”
In conclusion, it is suggested in the literature that marketing managers, and the
company as a whole, would benefit from using accounting information; however, it is
also reported that marketing managers do not use, do not know how to use, or do not
know how to interpret accounting information. This research aims to contribute towards
an improved understanding of how managers use and communicate accounting
information. It will also seek to understand the factors that influence the ability of the
accounting system to meet the managers’ need of accounting information. The research
focuses on two specific cases from the Portuguese fashion retail sector. In the next section
the research objectives are described and explained.

CHAPTER 1
24
1.2 Research Objectives
The aim of this research is to explore how accounting information is relevant – in theory
and in practice – to management and in particular to the management of marketing. This
research starts by identifying the proposals potentially relevant for the management of
marketing in the literature of management accounting. Then the marketing literature is
explored in order to find references to the relevance of accounting information for
marketing management.
It is stated in the accounting literature that there are differences between what is
discussed and suggested in theory and what is used in practice (Baldvinsdottir et al. 2010;
Lucas and Rafferty 2008; Ratnatunga et al. 1988). Although many applications from the
accounting system to current and strategic management are proposed in the related
literature, it is also reported that in practice many of these proposals have not been
implemented or maintained in operation (Bromwich and Bhimani 1994; Langfield-Smith
2008; McManus and Guilding 2008; Shank 2006). It is also reported that marketing
managers have difficulties in both using accounting information and interacting with the
accounting department (Bates and Whittington 2009; Gleaves et al. 2008; McManus and
Guilding 2008; Roslender and Hart 2010). Although some studies propose (hypothetical)
explanations for both the low utilisation of the accounting system (see Table 2-7) and the
weak interaction between accounting and marketing (Foster and Gupta 1994; McGovern
et al. 2004; O'Sullivan et al. 2009; Schultz 2003; Verhoef and Leeflang 2009), none of
these explanations comes from research that observes and interprets management
accounting in practice. De Ruyter and Wetzels (2000, p. 209) note:
“Not much is known about the relationship between marketing and finance departments. Yet, this interface seems particularly relevant as it is viewed as instrumental to the firm’s efficiency and profitability. Strong interdependences between marketing and finance exist. For instance, the marketing-finance interface has a direct impact on such issues as: product-investment decisions, brand valuation, and working capital.”
In this context, the aim of the research is to understand the factors that influence
the ability of the accounting system to meet the managers’ demands in terms of
accounting information. That is, to realise in practice what prevents information from
being communicated and used by marketing managers in particular. The aim is to capture
the perceptions of managers and accountants regarding the use of the accounting system.
Another motivation is to understand which organisational factors may boost the relevance

INTRODUCTION
25
of accounting information in managers' work, in the context of management accounting
systems (see Ambler 2003b; Chenhall 2008; Johnson 1992; Johnson and Kaplan 1987;
Wall and Greiling 2011).
On the importance of investigating management accounting techniques and
methods, considering their importance for accounting in practice, Baldvinsdottir et al.
(2010, pp. 79-80) state that “there is a need to retain a focus on the technical core of
practice” in management accounting research, and conclude:
“Over recent years, management accounting has become an innovative practice and consequently the potential exists for the researcher to play a supportive role in the development of the discipline at a practical level, at least, by assessing the new practices being introduced.”
The research has other objectives derived from both this first one and the literature
review. One objective is to understand what kind of information is sought by managers,
particularly marketing managers. This objective relates to the fact that although it is said
that, potentially, the accounting system has useful information for marketing management
(from the perspective of accounting), there is little use of accounting information by
marketing managers (Bates and Whittington 2009; Gleaves et al. 2008; McManus and
Guilding 2008; Roslender and Hart 2010). Therefore, this research aims to find out if in
practice managers seek information that is not being prepared by the accounting system.
Another aim is to understand the perspective of accountants in relation to their
role in supporting management, and to what extent it affects both the production of
accounting information geared to management and their relationships with managers,
particularly with marketing managers. In realising the perspective of accountants, one can
also better understand why accounting in practice differs from accounting in theory and
why there are difficulties in the interaction between marketing and accounting staff
(Gleaves et al. 2008; McManus and Guilding 2008; Srivastava et al. 1998). On the
difficulties between finance and marketing disciplines, Srivastava et al. (1998, p. 3) state:
“[T]he marketing community historically has found it difficult, if not nearly impossible, to identify, measure, and communicate to other disciplines and top management the financial value created by marketing activities. [...] At the same time, the finance literature has all but ignored the contribution of marketing activities to the creation of shareholder value. Consequently, financial appraisals of marketing strategy seldom involve trying to value long-term marketing strategies with uncertain outcomes.”
CHAPTER 1
26
Finally, another objective is to understand what kind of financial metrics
marketing managers seek in practice. This objective relates to the fact that in the literature
it is stated that the marketing discipline is more interested in financial metrics that the
accounting discipline (see Bates and Whittington 2009; McManus and Guilding 2008).
This study, originating in the discipline of accounting, tries to identify the needs of
marketing managers regarding the financial metrics for marketing performance
measurement. It is a contribution to the current literature of accounting, as no study was
found on what marketing managers seek in terms of financial metrics for performance
evaluation. Although there are quantitative studies (surveys) that research the financial
and non-financial metrics actually used in marketing (e.g., Ambler et al. 2004; Barwise
and Farley 2004), there are no qualitative studies exploring the interest of marketing
managers regarding accounting information, financial metrics and performance
measurement. In this regard, McManus and Guilding (2008) suggest that further research
should be made – from the accounting perspective – on the use of financial metrics in
marketing. In addition, Verhoef et al. (2011) and Verhoef and Leeflang (2009) call for
more research in order to complement existing quantitative studies on the topic of
marketing performance measurement, MD’s influence, and the relationship between these
two topics with business performance and its mediators.
For the aforementioned reasons and as an exploratory study it also meets other
challenges made in the accounting literature. For example, Johnson and Kaplan (1987, p.
172) mention “that the major developments in cost accounting and cost control” occurred
in practice and suggest that there should be further studies of what is used in practice by
making reference to “systems actually in use” or to the “systems installed in well-known
[organisations]”. These authors call for more research on management accounting
systems tested on or developed for actual enterprises. Johnson (1992) states that the
influence of the methodology used in economics and psychology has led research in
management to seek the rigor of theoretical models, based on quantitative studies on large
samples, and away from concrete realities with all their richness and specificities, thereby
losing its relevance to business management. Johnson (1992, p. 180) notes:
“[T]he emphasis on mathematical modeling and large-sample statistics drove business school research farther and farther away from studying the problems of real business organizations and real business people.”
Merchant and Van der Stede (2006) also note that statistical analysis can give
wrong explanations of cause and effect and that the major advances in management
INTRODUCTION
27
accounting came from practice, e.g., activity-based costing (ABC), strategic cost
management (SCM), Japanese management practices, non-financial measures of
performance and balanced scorecards, economic-value added (EVA) and economic profit.
And Lucas and Rafferty (2008, p. 149) “called for further research, using case studies, to
provide insights into why accounting practice differs from accounting theory”.
To conclude, the research objectives develop from two aspects found in the
literature:
• First, while the extant literature proposes several applications of
accounting information in marketing management, it also reports
difficulties both in marketing managers using accounting information (e.g.,
McGovern et al. 2004) and accountants producing marketing oriented
accounting information (e.g., McManus and Guilding 2008). This study
aims to explore the situation and to understand the factors that may
influence the ability of accounting systems to meet the managers’ demand
of accounting information;
• Second, there is a lack of empirical research on how managers use and
communicate accounting information (Hall 2010); and, in the accounting
literature, there are calls for exploratory empirical research to explain and
understand management accounting in practice (cf. Johnson 1992, p. 180;
Johnson and Kaplan 1987, p. 172; Merchant and Van der Stede 2006).
The following section describes the research questions and methodology.
1.3 Research Questions and Methodology
This research aims to answer five questions. They are:
1. What factors influence the ability of the accounting system to meet the
information demand of marketing managers?
2. Why are (not) managers of marketing demanding accounting information?
3. How are accountants supporting managers with accounting information?
4. How is accounting information communicated?
5. How do marketing managers want to measure marketing performance?
To answer these questions, an exploratory qualitative method was chosen. The
literature suggests that the qualitative method is most suitable when one attempts to
CHAPTER 1
28
understand and explain social phenomena in a holistic manner, considering the
environment in which it operates, with all its richness and details (Mason 2002).
This research attempts to understand the perspective of managers regarding the
usefulness of accounting information and the perspective of accountants in their role of
supporting management of marketing. Access to this information was obtained through
conversations with managers and accountants through face-to-face in-depth interviews,
thus seeking to understand the managers’ perspective regarding the social reality in which
they participate and which they construct. Beyond this, the present study also tries to
understand the factors that influence the ability of the accounting system to meet the
managers’ demand of accounting information. It is an exploratory approach as it seeks to
identify aspects not defined a priori; these are aspects that result from both an extrinsic
interpretation of observations and the interpretation of the participants in their social
reality.
Regarding the choice of the sector and the companies observed, the fact that the
literature suggests that the product differentiation, branding, advertising and price
management are characteristics of clothing industry – and are therefore considered in the
marketing management of fashion retail – was taken into account (cf. Keller 2002;
McCracken and Roth 1989; Snyder 1989; Sun 2005; Swartz 1983). Therefore, two
companies were chosen from the fashion retail sector, to observe how the managers of
marketing used the accounting information in that context. The first case is Dimoda
Difusão Internacional, Lda., a Portuguese family owned company that has been operating
since 1984 in the fashion retail industry. It belongs to a conglomerate of companies
owned by the Grupo Regojo (GR), which has been operating in Portugal since 1919. The
second case is Modalfa Comércio e Serviços, S.A., another Portuguese company that has
been operating in the fashion retail industry since 1995. The company belongs to the
Grupo Sonae. Sonae is a retail company with shopping centres, real estate and
telecommunications interests. Twenty interviews were carried out in these organisations
between February 2011 and March 2013. Documents were also collected, and four visits
to stores were made between June 2011 and April 2012.
1.4 Structure of Dissertation
This dissertation is organised in eight chapters. The next chapter contains a review of the
extant literature on (1) management accounting and control systems for marketing
management, (2) marketing management perspectives on accounting information

INTRODUCTION
29
applications, and (3) marketing and accounting interaction. The third chapter is devoted to
explaining the methodology used. It describes the qualitative method used, the criterion
for the selection of cases, and how the data were collected and analysed. The fourth
chapter describes the fashion retail sector in Portugal in order to contextualise the two
cases chosen. In chapters 5 and 6, the cases are described. Both chapters have the same
structure, to facilitate comparison and analysis. They begin by describing the economic
groups that own the companies studied, their objectives and strategies. This is followed
by details of each company in terms of profitability and business objectives. Afterwards,
the focus is on the uses that marketing managers gave accounting information, and the
factors that influence the ability of the accounting system to provide accounting
information according managers’ demand. The cases also include a description of what
was observed as regards the MD influence in each organisation. Chapter 7 analyses and
compares the cases. It begins by summarising, for each case, the factors that influenced
the managers’ use of accounting information, the managers’ demands of accounting
information, the demand for marketing metrics, and the communication of accounting
information. Comparative analyses were also conducted for the same topics as well as for
the role of the accounting department, and the influence of each MD. Chapter 8 contains
the conclusions, which begins with a summary of the findings, followed by the
contributions of the research, its limitations, and suggestions for future research.

CHAPTER 1
30
31
CHAPTER 2 LITERATURE REVIEW
2.1 Introduction
In this chapter the topic of management accounting information for marketing
management is explored and reviewed. In the management literature it is considered that
one of the objectives of management accounting is its contribution of accounting
information for decision making (Anthony 1960; Cardinaels et al. 2004; Horngren 1962;
Kaplan and Anderson 2004; Shillinglaw 1959), and that the management of marketing
involves accounting information (Goebel et al. 1998; Lere 2001). One may expect,
therefore, that there will be some overlap between the two disciplines; i.e., the marketing
literature discussing the usefulness of accounting information in the management of
marketing (e.g., Beik and Buzby 1973; Farris et al. 2010; Lambert and Sterling 1987;
Petersen et al. 2009), and the management accounting literature proposing tools and
systems to support marketing management (e.g., Cooper and Kaplan 1988b; Kaplan and
Anderson 2004; Shank and Govindarajan 1993; Simons 1995b). This literature review
seeks to compare the perspectives of marketing and accounting regarding the relevance of
accounting information for the management of marketing and to identify the topics that
deserve further research.
This literature review on accounting focuses on the usefulness of the accounting
system for management. More specifically, it examines how the management accounting
systems are understood to contribute towards business management. It begins by
reviewing the literature on management accounting and by identifying the proposals made
by the discipline over the past fifty years to support management. Next, a review of the
literature in marketing and sales is provided which focuses on how accounting can be
useful for marketing management. After identifying the possible areas of intersection and
collaboration between the two disciplines, the literature is reviewed seeking to understand
to what extent the interaction and interdisciplinarity exists in theory and practice, in order
to identify questions and topics deserving further study and reflection.
The accounting literature in the past fifty years has led us to two major and
distinct focuses. One is the focus on management accounting, which developed in the
period between 1950 and 1980 and replaced the previous perspective that focused
primarily on cost accounting (e.g., standard costs, valuation of inventories and allocation
of indirect costs) with a “historical” and “internal to the company” cost analysis
perspective (Shank 2006, p. 355). This perspective of management accounting is geared
CHAPTER 2
32
essentially towards looking at the decisions within the company (Shank 2006, p. 356). It
aims, among other topics, to analyse pricing decisions in marketing, making or buying
decisions in operations, and responsibility accounting in organisational behaviour (Shank
2006, p. 356). The second focus, which developed after 1980 is more “strategic”, i.e.,
develops from a perspective that goes beyond the company boundaries; it looks outwards,
to the customers and the competitors (Simmonds 1981, p. 26). One explanation given by
Ferrara (in Robinson 1990, p. 1) for this change of perspective is related to changes in
industry and the global competitive environment. It aims to use the accounting system to
strengthen the firm's competitive position in the market in which the firm operates (see
Shank, in Robinson 1990, p. 20).
Both perspectives of management accounting – managerial and strategic – include
proposals for the use of accounting information potentially valuable for marketing. The
first ones help to improve the short-run outcomes; the second ones contribute to
strengthening the competitive position in the long run. Both perspectives seek to ensure
the survival and growth of business profitably. The following sections discuss both
perspectives in detail.
The literature review is structured as follows: first, the literature that addresses the
issue of accounting information, its usefulness and how it is used by managers is
reviewed, in order to realise what is mentioned in the literature regarding the relevance of
accounting information for management. Then, the literature on management accounting
is reviewed, covering the topics of cost management, strategic cost management, planning
and control – by identifying the proposals made in the last fifty years with potential
interest for marketing management. Then, following what is suggested as the functions of
management accounting, the marketing literature is reviewed to verify how accounting
information is useful for “score keeping”, “problem solving” and “attention direction” in
marketing management, from the perspective of marketing. In the last section the various
perspectives are related and discussed, as well as the aspects that deserve further research
are identified.
2.2 Accounting Information
Information is defined in the literature as “the communication or reception of intelligence
or knowledge” (Simons 2000, p. 57). Managers, being responsible for a range of activities
and resources within the organisation, need information to manage and achieve their goals
(see Simons 2000, pp. 57-74). Business activities can be represented on an input, process
LITERATURE REVIEW
33
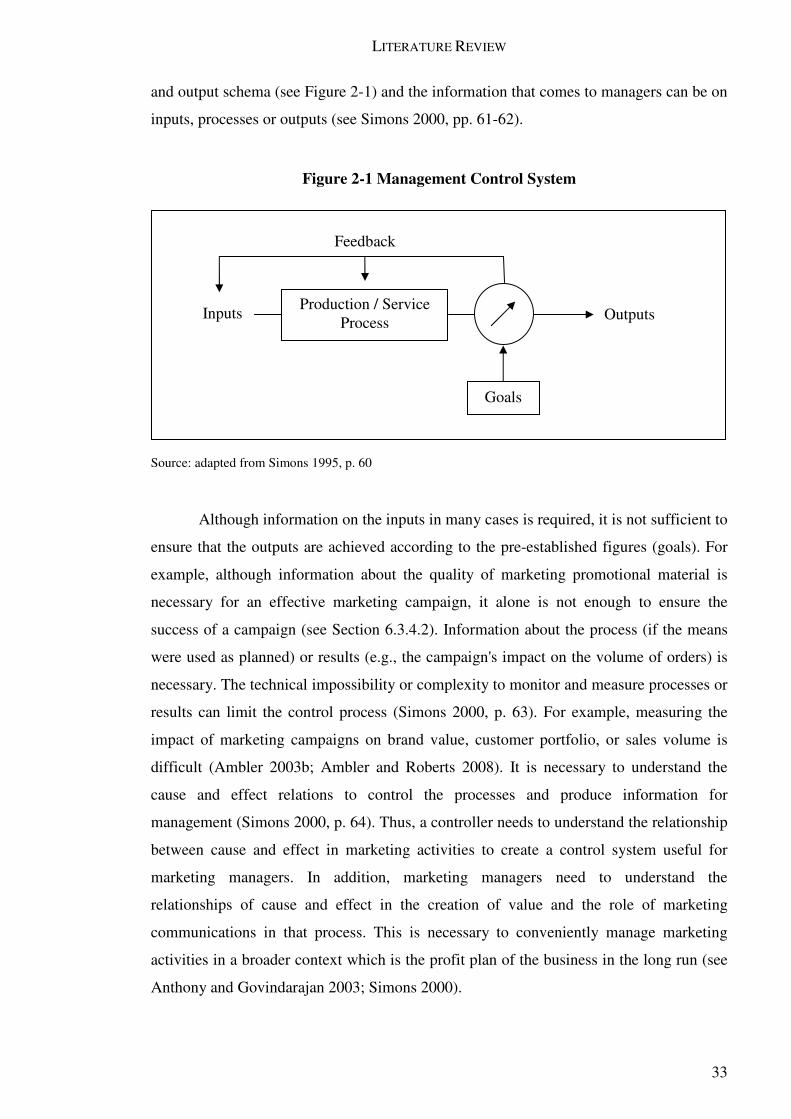
and output schema (see Figure 2-1) and the information that comes to managers can be on
inputs, processes or outputs (see Simons 2000, pp. 61-62).
Figure 2-1 Management Control System
Source: adapted from Simons 1995, p. 60
Although information on the inputs in many cases is required, it is not sufficient to
ensure that the outputs are achieved according to the pre-established figures (goals). For
example, although information about the quality of marketing promotional material is
necessary for an effective marketing campaign, it alone is not enough to ensure the
success of a campaign (see Section 6.3.4.2). Information about the process (if the means
were used as planned) or results (e.g., the campaign's impact on the volume of orders) is
necessary. The technical impossibility or complexity to monitor and measure processes or
results can limit the control process (Simons 2000, p. 63). For example, measuring the
impact of marketing campaigns on brand value, customer portfolio, or sales volume is
difficult (Ambler 2003b; Ambler and Roberts 2008). It is necessary to understand the
cause and effect relations to control the processes and produce information for
management (Simons 2000, p. 64). Thus, a controller needs to understand the relationship
between cause and effect in marketing activities to create a control system useful for
marketing managers. In addition, marketing managers need to understand the
relationships of cause and effect in the creation of value and the role of marketing
communications in that process. This is necessary to conveniently manage marketing
activities in a broader context which is the profit plan of the business in the long run (see
Anthony and Govindarajan 2003; Simons 2000).
Inputs Outputs
Goals
Production / Service Process
Feedback
CHAPTER 2
34
Simons (2000, pp. 67-70) states that management information can be used for
various purposes, and outlines five broad categories: “decision making” on planning and
coordinating; “control” of inputs, processes and outputs; “signalling” what is important
for top management – as “everyone watches what the boss watches”; “education and
learning” through an understanding of the drivers of performance and relations of cause
and effect in the process of value creation; and “external communication” with the firm’s
stakeholders. Commenting on the importance of accounting information related to
management control, Simons (2000, p. 69) states:
“Information in the form of output goals, such as profit plan goals or performance targets, can be a powerful tool to motivate employees to adjust inputs, processes, and outputs to achieve organizational goals.”
Recognising the importance of studying communication and use of accounting
information in practice, Jönsson (1998) argues that management accounting research
should be more aligned with the managerial work. Moreover, he suggests research should
observe how the managerial communication – which is central in the managerial work,
characterised by “brevity, variety and fragmentation” (Jönsson 1998, p. 411) – uses
accounting information. Hall (2010) argues that much is to be learned about the role of
accounting information in the managerial work because few studies covered the
managers’ use of accounting information in their work. While there is research observing
the use of accounting information in very specific situations, i.e., specific problem solving
situations, the managerial work comprises much more than specific problem-solving
situations (see Hales 1986; Isenberg 1984; Kotter 1982; Mintzberg 1980; Stewart 1988;
Whitely 1985). Managerial work is diverse and is characterised by “different durations,
rhythms, degrees of uncertainty, and origins” (Hales 1986, p. 95). Senior managers rely
on though processes such as “using intuition; managing a network of interrelated
problems; dealing with ambiguity, inconsistency, novelty, and surprise” (Isenberg 1984,
p. 85). Therefore, research that observes how managers use accounting information as it
is proposed in theory, e.g., in very specific problem solving situations, specific
applications, and delimited contexts, may be restrictive, as managers – including the
marketing managers – can use accounting information in dynamic contexts, complex
situations, and for distinct purposes (see Hall 2010, p. 302). March (1987) argues that, as
managers make decisions in contexts of ambiguity, the microeconomic theories of choice
may be incomplete and misleading for designing both the information and the accounting
systems. Therefore, more research is required to understand how accounting information

LITERATURE REVIEW
35
is collected, organised, demanded, and used by different managers in different contexts.
Anderson (2008) suggests that while information gathering is central in organisational
behavioural theories, the research on how managers collect and use information is
underdeveloped. For example, while Ahrens and Chapman (2007) observed that the use
of management control information contributed to the alignment of functional members
with the organisation objectives, they failed to observe in detail how the accounting
information was collected, processed, organised and used by managers. Research that
covers the organisational-level role of accounting information may be limited in
understanding how the accounting information is specifically collected, shared and used –
individually or in teams – by different functional managers (Hall 2008).
The interpretative research, by focusing in detail on how accounting information
is used and flows between managers, can produce relevant contributions towards
understanding and explaining the factors (see Lukka and Modell 2010) – e.g., a financial
accounting system tailored to meet the internal clients’ needs – that influence the use of
accounting information by managers (e.g., Alves 2010; McKinnon and Bruns 1992;
Preston 1986; Simon et al. 1954). For example, Simon et al. (1954) observed the
consequences of centralisation and decentralisation in the organisation of controllers’
departments and the use of accounting information in the managerial decisions at seven
companies. They observed that the same accounting information, in some cases, was used
by different managers in distinct ways for distinct purposes. Some operational managers
used it as a score card, for checking whether they were operating correctly and meeting
the targets, other intermediate level managers used it for attention guiding and problem
identification; finally others, e.g., general managers, used accounting information for
optimising decision-making in strategic issues, e.g., capital expenditures (CAPEX) and
price policy. Simon et al.’s (1954) field research also discovered as critical the expertise
and autonomy of management account staff in three distinct areas: accounting
bookkeeping and reporting, analysis of accounting information, and special reports for
decision making. Another example, Preston (1986), in a year-long field study at a plastics
containers division located in England, interviewed and observed how the managers
collected and used information. He concluded that managers gathered and shared
accounting information through informal sources (e.g., observation, personal interactions,
and personal records) as the formal information system was insufficient for the managers’
requirements (e.g., relevance, timeliness and accuracy) being considered, however, useful
as a confirmation of previous informal collected information, as a historical background
for daily decision-making, or as a general trend guide. Consequently, Preston (1986)

CHAPTER 2
36
argues that the informal information system is used not because of the failure or
limitations of the formal system, but as a complement to it. The other example,
McKinnon and Bruns (1992), in their field study covering twelve manufacturing
companies from the US and Canada, interviewed managers from different functional
areas (e.g., plant managers, marketing directors, accountants and sales directors) to
understand which types of information they used for controlling their activities and why.
These authors realised that accounting information was a minor element in a vast
portfolio of information, such as observations, intuitions, gut feelings and personal
interactions. They observed in detail which decisions were made, by different functional
managers, and the specific information (financial and non-financial) that supported each
type of managerial decision. Finally, Alves (2010) performed a field study using semi-
directive (structured) interviews to understand how accounting information was used in
the different phases of decision making – she used the four decision phases proposed by
Simon (1960): identifying the problem, listing the alternatives, analysing and choosing an
alternative, and implementing the decision – covering sales, marketing and production
managers, from six Portuguese companies. She observed that accounting information was
more relevant, from the users’ perspective, in the three first phases of decision making –
identifying the problem, listing the alternatives, and analysing and choosing an alternative
– moreover, the use of accounting information was most intensive during the first phase
of problem identification.
These four examples of field-based research observed the practice of management
and the use of accounting information in the workplace. They enlightened previous
understandings about the management accounting role within the firm and brought new
perspectives besides the conceptual frameworks that were focused on score keeping,
problem solving, attention direction and decision-making processes. They allowed to
understand that different contexts require different accounting systems, and that different
managers may use the same information in different forms for different purposes.
Following the previous research line of enquiry, the present research observes in
particular how and for what purposes the managers of marketing use accounting
information (see Table 2-8). In addition to focusing on how managers (marketing, sales
and operations) use accounting information, this study seeks to understand what kinds of
accounting information managers (users) seek. Besides understanding how the tools,
techniques or methodologies proposed in the management accounting literature in the past
fifty years have been applied and used, the demand of marketing managers in relation to
the accounting system is also studied; all these aspects are not sufficiently explored in the
LITERATURE REVIEW
37
extant literature reviewed (see Hall 2010; McManus and Guilding 2008; Morgan et al.
2002).
The main proposals from management accounting discipline over the past fifty
years, related to accounting information for management, are described in the following
sections – in particular for marketing and sales management.
2.3 Accounting Information: Management Accounting Perspectives
2.3.1 Cost Management
One function of the accounting department is to contribute with cost accounting
information – that can be specific for each company and distinct from the financial
accounting – to support the management of the business, e.g., marketing and sales
management (see Clark 1923, pp. 233-244; Johnson and Kaplan 1987, p. 155).
Management accounting is defined in the literature (Anthony et al. 2010, p. 456) as:
“[T]he process within an organization that provides information used by an organization’s managers in planning, implementing, and controlling the organization’s activities.”
It is suggested in the management accounting literature that an adequate
identification of costs (e.g., distinguishing what are variable costs and fixed costs, direct
costs and indirect costs, contribution margins and relevant costs for decision making) and
its use in decision making (e.g., new products, customer and product mix, sales volume
and making or buying decisions) contributes to improving the profitability of the business
(see Anthony et al. 2010; Drury 2009).
First, in the short run, proper marketing and sales management considering the
contribution margins of each product or service (price less unit variable costs) leads to
optimal decisions from the economic point of view (Anthony et al. 2010; Beik and
Buzby 1973). In both this direct variable costing perspective and optimisation through
contribution margins, it is recommended to separate fixed costs – those that do not vary
with the level of production in the short run – from variable costs, i.e., costs that have a
proportionality and vary with production levels, e.g., materials, direct labour and
eventually an estimate for variable overheads (see Anthony et al. 2010; Robinson 1990).
From the perspective of direct costing, indirect fixed costs are not allocated to products
and profitability is managed by considering the contribution margin of each product or

CHAPTER 2
38
service (see Beyer and Trawicki 1972; Keller 1967; Marple 1967; McFarland 1966). It is
considered that fixed costs are irrelevant to decision making at the product level (see
Anthony et al. 2010; Robinson 1990). It is also suggested in the literature that profitability
analysis – using the contribution margin concept – can be at the unit of product sold or by
unit of scarce resource – aiming at maximising the contribution by the resource that is
limiting the business activity (see Drury 2009, pp. 84-85). This perspective on costs also
contributes to certain forms of budgeting – flexible budgets – and variance analysis, for
the analysis of new business situations – differential cost analysis – and in making or
buying decisions (see Anthony et al. 2010). Moreover, the contribution margins at
different hierarchies of indirect costs can be calculated, e.g., by unit, by product line, by
strategic business unit, by division or at the overall company level (Marple 1967). This
approach allows also to manage the marketing and sales efforts by identifying break-even
points, i.e., it identifies the sales volume level that delivers a contribution margin
(revenues - variable costs) sufficient to cover the fixed costs (see Anthony et al. 2010, pp.
486-491).
Another perspective from Goldratt and Cox (1986) radicalises the perspective of
direct costing and contribution margin. According to Goldratt and Cox (1986, p. 41) the
company's aim is “to make money”. Therefore, the authors argue that the important thing
is to increase the throughput through sales promotion – in that behind every sale there is a
contribution to the fixed costs. This more radical perspective of contribution margin is
defined as the difference between price and cost of purchased materials and other external
services arising from the sale. Under this perspective – the Optimised Production
Technology and the Theory of Constraints (TOC) – there are three critical values to
manage: throughput, inventories and operating costs. It is a cash flow perspective
analysis, i.e., the rate at which money moves “in” and “out” of the company is considered
as relevant for decision making as well as how the resources are used (operating
expenses) to convert stocks in throughput (see Goldratt and Cox 1986; Kaplan, in
Robinson 1990, p. 3). The contribution margins are increased by acting on the factors that
limit the rate of throughput. It is essentially a tool of profit optimisation in the short run
(see Kaplan, in Robinson 1990, p. 3). In this approach there is no concern about assigning
structural costs to products, whether the costs are associated with the marketing and sales
department, or fixed direct labour costs. The aim is to eliminate the bottlenecks that limit
the rate of throughput. In summary, in this model the focus is on increasing sales, where
each sale produces a commercial margin (price less material costs) which, in turn,
contributes to the fixed operating costs that are supporting the business and sales force.
LITERATURE REVIEW
39
According to several authors, these perspectives for analysis and decision-making
(which consider relevant in all circumstances only the variable costs) are imperfect and
lead to management errors with negative consequences in the long run (see Robinson
1990). It is with this justification that other authors (Cooper and Kaplan 1988a, b)
propose a cost analysis with a strategic and long-term perspective where all costs are
relevant for decision making. Kaplan (quoted, in Robinson 1990, p. 4) summarises his
perspective on decision-making that take into account only the price paid by customers
and the related variable costs:
“The problem with the direct costing approach, in both its traditional and TOC versions, is that the fixed costs keep growing. In fact, if you look back over the last two or three decades, the costs that have increased the most within organizations have been those that cost and management accountants have called fixed.”
Despite the arguments in favour of using the direct cost analysis and contribution
margin in management decisions, companies continue to use the concept of full costing
(i.e., direct costs and allocated indirect costs); the situation is explained in part due to the
requirements of financial accounting to calculate the value (full cost) of inventories and
the cost of goods manufactured (see Johnson and Kaplan 1987; Kaplan, in Robinson
1990, p. 4). While it makes sense to use the contribution margin for short-run analysis and
decision making – as the indirect costs were committed and did not change as a
consequence of the particular decision – it was also felt that the allocation of indirect
costs were relevant for strategic decision making about processes, products and services
in the long run (Cooper and Kaplan 1988b). However, the forms used to allocate indirect
costs to products, product lines, customers, market segments or business units make no
sense in many cases – because they are based on single cost drivers as direct labour rates,
value of materials or quantities (see Goebel et al. 1998, p. 499; Lere 2001, p. 589).
Although they were sufficient to value stocks, report and analyse aggregated financial
data, they were “misleading and irrelevant for strategic product decisions” (Cooper and
Kaplan 1988b; Johnson and Kaplan 1987, p. 126).
Finally, it is suggested in the management accounting literature (e.g., Clark 1923;
Garrison et al. 2003; Boer, in Robinson 1990, p. 26) that there is no single way to identify
and calculate costs for universal applications. Each marketing decision requires specific
cost information adjusted to that particular decision (Cardinaels et al. 2004; Goebel et al.
1998; Lere 2001), and “different strategies demand different cost perspectives” (Shank
1989, p. 54).
CHAPTER 2
40
As notes Boer (Boer, citing Clark, in Robinson 1990, pp. 26-27):
“Clark [(1923)] says that the decision facing a manager determines which costs are relevant. In other words, a manager can define a cost only in the context of a specific situation. There is no such thing as an absolute cost: a cost value exists only in relation to a decision. […] Management accounting systems should produce a variety of unit costs to fit the different decisions managers make, and accountants do a disservice to managers when they force the system to produce only a single value for product cost.”
In the following section the proposals in the literature for cost management from a
strategic perspective is reviewed. Particularly, internal and external factors are considered
in the analysis and management of costs – market, customers, suppliers and competitors –
as well as more sophisticated forms to allocate indirect costs. It is argued that it produces
more useful accounting information for both current and strategic marketing management
(Cooper and Kaplan 1988a; Shank and Govindarajan 1988a).
2.3.2 Strategic Management Accounting
2.3.2.1 Strategic Cost Management
Linking management accounting to strategic management comes up in Simmonds (1981,
p. 26) when referring to strategic management accounting (SMA) as:
“[T]he provision and analysis of management accounting data about a business and its competitors, for use in developing and monitoring business strategy.”
In this context, and based on Porter’s (1980, 1985) strategic perspective, Shank
(1989, pp. 50-55) proposes a model for cost analysis which helps to formulate,
communicate, implement and monitor the business strategy (strategic management cycle)
using the concepts of “Value Chain”, “Strategic Positioning” and “Cost Driver”. Shank
(1989, p. 54) also states that “different strategies demand different cost perspectives”. In
this context, Shank (1989, p. 50) defines “Strategic Cost Management” as:
“[T]he managerial use of cost information explicitly directed at one or more of the four stages of the strategic management cycle.”
The first time the concept of strategic cost management is used in the literature is

LITERATURE REVIEW
41
in a case study (see Shank and Govindarajan 1988a). It is a business situation consisting
of a contract to produce an own-brand product, for one year, renewable up to three years.
The conclusions arising from a traditional short-run cost analysis – relevant costing,
break-even and contribution margin analysis – differ from the conclusions derived from a
strategic cost analysis. In the short-run perspective the deal would be accepted by the
contribution margin that it generates; however, the long-run strategic risks and economic
consequences lead to reject the deal. A strategic cost analysis of this case incorporates
concepts from the discipline of marketing and sales: for example, the reaction of the
firm’s wholesale distributors and retailers, the value perceived by the customers, the
reaction of competitors, price positioning, differentiation, cost structure, among others.
Firstly, Shank (1989, p. 50) using the concept of “value chain” from Porter’s
(1980) model, proposes a strategic cost analysis that incorporates this concept. In Porter's
(1980) model it is suggested that the company's competitive position could be
strengthened through the provision of a specific value to the client for a lower price (cost
leadership); or, for the same price (cost), offer the customer more value (product
differentiation). In Shank’s (1989) perspective, the cost analysis goes beyond the internal
concept of “Value Added” and an analysis that incorporates elements of cost and revenue
relating to suppliers and customers is proposed. The costs and prices are managed by
looking out of the border of the company. As explained by Shank (1989, p. 51):
“[The] ‘value chain’ concept is fundamentally different from the ‘value added’ concept. From a strategic perspective, the value added concept has two big problems; it starts too late and stops too soon. Starting cost analysis with purchases misses all the opportunities for exploiting linkages with the firm’s suppliers. Such opportunities can be dramatically important to a firm.”
The strategic cost management “value chain” concept involves analysing the
complete value chain, from raw materials to the final product or service. It considers the
cost (benefit) from the perspective of suppliers and the benefit (cost) from the perspective
of customers, aiming at managing (minimising) costs and (benefits from) opportunities
across the complete value chain. Linking this concept of strategic cost analysis to
customers, Shank (1989, p. 52) relates it to the concept of “life cycle costing”, i.e., the full
cost to the customer throughout the life cycle of the product from the customer’s
perspective – purchase price, start-up costs, and maintenance. In this respect, Forbis and
Mehta (1981, pp. 32-33) illustrate how the concept of “life-cycle costs” and “economic
value to the customer” help to segment the market, to develop products, to improve
CHAPTER 2
42
quality, performance and competitive position. Hergert and Morris (1989, p. 187) also
advocate the use of the “value chain” concept for cost management, and mention its
application in marketing management :
“One of the strengths of the value chain analysis is that it forces managers to think about which activities create profits, to choose a generic strategy for each product and to ask of each item of expenditure ‘how does it add value to buyers?’.”
Secondly, Shank (1989, p. 54) argues that just as the generic strategies of cost
leadership or differentiation – suggested by Porter (1980) – assume different “mindsets”
they also imply “different cost analysis perspectives” (see also Ambler 2003b, p. 141).
For example, it is suggested that the concept of standard cost – and manufacturing cost
variance analysis – is more important in a mature industry with strategies focused on
lower cost than in a strategy of differentiation in dynamic growing markets. It is also
suggested that the analysis of marketing costs is more relevant in a differentiation strategy
than in a cost leadership strategy. While the information on costs – about both the
company itself and its competitors – is important for pricing in a company that follows a
cost leadership strategy, this information is less important when the organisation follows a
strategy of product differentiation (Govindarajan 1986; Shank 1989). The authors also
suggest that the analysis of marketing costs is “critical to success” in situations where the
strategic emphasis is on product differentiation, while in situations of cost leadership the
analysis is “often not done at all on a formal basis” (Govindarajan 1986; Shank 1989, p.
55).
Finally, Shank (1989, p. 56) argues that analysing cost behaviour in terms of units,
e.g., “fixed versus variable cost, average cost versus marginal cost, cost-volume-profit
analysis, break-even analysis, flexible budgets, and contribution margin” does not capture
the full complexity of the variability of costs and does not explain them completely.
Combining the concepts of cost drivers present in the Riley (1987) strategy literature and
the concepts of Scherer (1980) in industrial economics, Shank (1989, p. 56) proposes the
distinction between “structural” drivers and “executional” drivers to explain the
behaviour of costs and thus support strategic cost analysis and strategic decisions. The
five structural strategic choices with cost implications are in Table 2-1. It is said that any
of these structural strategic decisions can be in ascending or descending order, depending
on the chosen strategy; as regards the “executional” drivers, having them in a greater
degree is more favourable for the performance of the organisation (Shank 1989, p. 57).
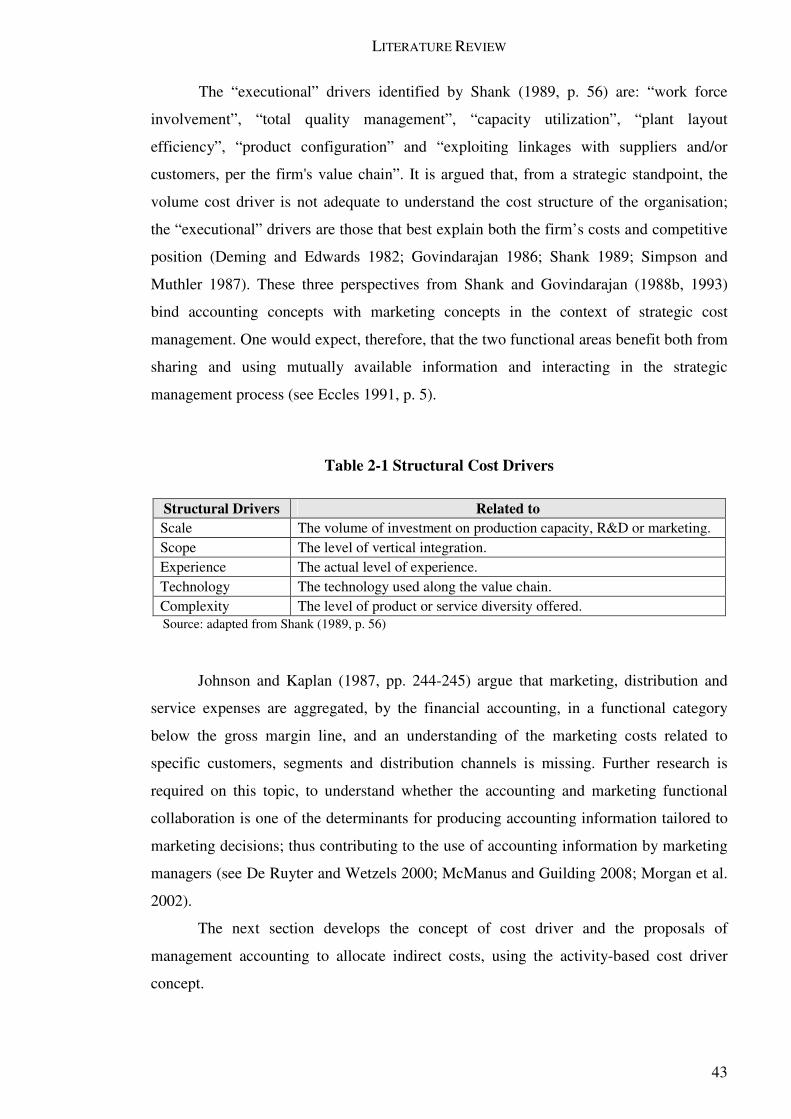
LITERATURE REVIEW
43
The “executional” drivers identified by Shank (1989, p. 56) are: “work force
involvement”, “total quality management”, “capacity utilization”, “plant layout
efficiency”, “product configuration” and “exploiting linkages with suppliers and/or
customers, per the firm's value chain”. It is argued that, from a strategic standpoint, the
volume cost driver is not adequate to understand the cost structure of the organisation;
the “executional” drivers are those that best explain both the firm’s costs and competitive
position (Deming and Edwards 1982; Govindarajan 1986; Shank 1989; Simpson and
Muthler 1987). These three perspectives from Shank and Govindarajan (1988b, 1993)
bind accounting concepts with marketing concepts in the context of strategic cost
management. One would expect, therefore, that the two functional areas benefit both from
sharing and using mutually available information and interacting in the strategic
management process (see Eccles 1991, p. 5).
Table 2-1 Structural Cost Drivers
Structural Drivers Related to Scale The volume of investment on production capacity, R&D or marketing. Scope The level of vertical integration. Experience The actual level of experience. Technology The technology used along the value chain. Complexity The level of product or service diversity offered.
Source: adapted from Shank (1989, p. 56)
Johnson and Kaplan (1987, pp. 244-245) argue that marketing, distribution and
service expenses are aggregated, by the financial accounting, in a functional category
below the gross margin line, and an understanding of the marketing costs related to
specific customers, segments and distribution channels is missing. Further research is
required on this topic, to understand whether the accounting and marketing functional
collaboration is one of the determinants for producing accounting information tailored to
marketing decisions; thus contributing to the use of accounting information by marketing
managers (see De Ruyter and Wetzels 2000; McManus and Guilding 2008; Morgan et al.
2002).
The next section develops the concept of cost driver and the proposals of
management accounting to allocate indirect costs, using the activity-based cost driver
concept.

CHAPTER 2
44
2.3.2.2 Activity-based Costing
Attempts to relate the indirect overhead costs to the levels of the firm’s activity, which
would not simply be the units produced – due to the simplicity of that driver – go back to
1936. Dean (1936, p. 9) states:
“[M]arginal cost has many dimensions in addition to the more emphasized output dimension. Since total cost is a function of many variables, cost may be regarded as marginal with respect to each of these variables. Increasing the number of new styles, for example, has a marginal cost analogous to that resulting from increasing the number of units of output.”
Other authors have been referring to this form of explaining the behaviour of
indirect costs (by activity), particularly the costs of marketing, distribution and sales. For
example, Longman and Schiff (1955) refer to functional costing. It is introduced in the
context of marketing management. It includes both the allocation of marketing costs and
the analysis of sales and profitability by customer or market segment. Another reference
to the activity-based costing perspective includes the concept of “traceability” in
Shillinglaw (1961) or the concept of “activity costing” in Staubus (1971). Schiff and
Mellman (1962) make such references to systems used in practice aimed at assigning
indirect costs to products, customer groups or territories on the basis of the activities.
Schiff and Benninger (1963, p. 565) list “marketing expense budget and apportionment”
with certain factors related to the level of activity (see Foster and Gupta 1994, p. 53), for
example:
Table 2-2 Marketing’ Costs Allocation Factors
Function Factor of Variability Selling - Salaries - Travelling
Calls Miles
Advertising - Direct mail - Publication
Pieces Sales value
Take Order Orders Deliver Cwt. Bill Lines billed
Source: adapted from Foster and Gupta (1994, p. 53)
However, it was Cooper and Kaplan (1988a) who began a more systematic study
on activity-based costing and proposed accounting tools to understand and explain the
causes of costs in terms of support activities – outside the scope of unit costs – for
LITERATURE REVIEW
45
example, procurement, manufacturing support activities, marketing, sales and after-sales
service. In the first article on activity-based costing from Cooper and Kaplan (1988a, p.
27) it is said:
“Other costs, however, particularly those arising from overhead support and marketing departments, vary with the diversity and complexity of the product line. The variability of these costs is best explained by the incidence of transactions to initiate the next stage in the production, logistics, or distribution process. A comprehensive product cost system, incorporating the long-term variable costs of manufacturing and marketing each product or product line, should provide a much better basis for managerial decisions on pricing, introducing, discontinuing, and reengineering product lines. The cost system may even become strategically important for running the business and creating sustainable competitive advantages for the firm.”
Also in 1988 (September) Cooper and Kaplan (1988b) published a second article
where they apply the concept of activity-based costing to a particular marketing
management situation. They show the difference between assigning indirect marketing
costs based on a generic driver (sales volume) and assigning the same indirect marketing
costs using an activity driver, i.e., the consumption each product line makes from
different marketing and sales support activities (resources). The profitability analysis of
each product line using the revised activity allocation base (ABC) is very different from
that depicted by the traditional approach (Goebel et al. 1998, p. 499; Lere 2001, p. 589).
The more complex or customised products – low volume products – consume relatively
more resources than simple or high volume products. It is suggested that this new cost
information would contribute to improving operational decisions (redesigning products or
processes), marketing decisions (raising prices of complex or customised products) and
strategic or long-run decisions, for example, product mix, customer mix, technology and
scale (see Goebel et al. 1998; Lere 2001). Proponents of this system (e.g., Cardinaels et
al. 2004; Goebel et al. 1998; Lere 2001) argue that the company knowing the true
consumption of resources – and the cost associated with each aspect of the value chain –
can assess the extent to which the firm’s value proposal is equally valued by the
customers. In this analysis, there are products that due to their complexity (or low
volume) can be sold for significantly higher prices than those derived from a traditional
costing system. These complex products (or services) may still be purchased by
customers who consider them valuable in the customer’s own value chain. On the other
hand, there are products that will no longer be sold because of the resulted increased
CHAPTER 2
46
prices (and the low value from customers’ perspective); so these will also cease to be
unprofitable products for the firm (see Goebel et al. 1998, p. 505).
The proponents of activity-based costing (e.g., Cooper and Kaplan 1988b; Smith
and Dikolli 1995) argue that this system can better identify the profitable customers and
segments through an appropriate indirect costs allocation system. It considers different
consumptions of resources and distinguishes different hierarchies of costs (e.g., unit level
costs, batch level, product level, customer level, segment level, and factory level costs).
Therefore, the more demanding customers and the more complex products – which
require more of a firm’s resources – will have more costs allocated. The activity-based
costing can also identify some customer and segment specific related costs that the
traditional accounting systems consider as indirect selling, general and administrative
business unit costs (cf. Goebel et al. 1998; Johnson 1992, pp. 141-149).
Foster and Gupta (1994, pp. 53-54) refer to the concept of activity-based costing
and propose a refinement of the concept in the context of marketing costs allocation. They
suggest that the logic of the ABC cost hierarchy (see Cooper and Kaplan 1991, p. 32),
i.e., the unit level costs, setup costs, product level costs and costs at the business unit
level, be applied in the marketing costs hierarchy. This proposal for assigning marketing
costs by hierarchies – e.g., the costs of coupons at the level of units, cost of promotions at
the level of campaigns, marketing costs related to product lines, and umbrella brand type
costs – would allow improved marketing budgets and more rigorous variance analysis
compared with the flexible budgets (discussed in sections 2.3.1 and 2.3.3.1) that use the
dichotomy of fixed costs and variable costs (see Foster and Gupta 1994).
This proposal from management accounting to allocate indirect costs to products
and services was disruptive to previous methodologies (Gosselin 2006; Innes and
Mitchell 1997). It allowed to make decisions in operations, marketing and sales that align
the consumption of resources (and the incurred cost for the company) with the perceived
value by the customer. However, although this proposal itself seems attractive
(particularly for marketing and sales managers) it has not been adopted widely and many
companies abandoned it after few years of experience (Gosselin 1997, 2006). Gosselin
(2006, p. 666) commenting on the use of ABC states:
“After all, the ABC paradox remains (Gosselin, 1997): Regardless of the inclusion of ABC in most management accounting textbooks, the large number of ABC seminars, the consulting activities, the ABC softwares, and the large number of articles published on ABC, why firms are not implementing ABC and furthermore why some that have adopted ABC, have decided to abandon it.”

LITERATURE REVIEW
47
In Section 2.4 some applications of ABC from marketing management perspective
and to what extent it helped to improve the firm's performance in the short and long run is
reviewed. Another proposal from management accounting, potentially useful for
marketing management, is reviewed in the next section.
2.3.2.3 Customer Profitability Analysis
The customer profitability analysis involves the use of accounting information on costs
and it is important for the management of marketing (see Foster and Gupta 1994; Hope
and Fraser 2003a, p. 85). For example, Shapiro et al. (1987, p. 106) comment:
“Companies with poor cost accounting systems have no way to determine order, customer, product, or market segment profitability. Consequently, their cost control and management systems will be weak, and the result is likely to be above-average dispersion of costs. The sales manager of a large office equipment supplier who lacked adequate cost information described his situation thus: ‘‘It's management by anecdote. Salespeople regularly make passionate pleas for price relief on specific orders. When I press them for reasons, they say ‘threat of competitive entry’. When I ask them if a cutback in service would be acceptable to make up for the price decrease, they give me a resounding no! What choice do you have in the absence of cost data, except to go by your judgment of the salesperson's credibility? I've wrongly accepted as many bad price relief requests as I've rejected.’’ ”
It is frequently said in the literature that not all customers are profitable and, in
many cases, 20% of customers (the best ones) generate 80% of profits and 20% of
customers (the worst ones) are unprofitable (see Foster and Gupta 1994; Gupta and
Zeithaml 2006). On the other hand, it is also said that in many cases companies do not
abandon “unprofitable” customers because the revenue they contribute is greater than the
costs which would be saved if the customer ceased to buy (Foster and Gupta 1994). Thus,
Foster and Gupta (1994, p. 56) propose to improve the study of the variable costs related
to customers and “their drivers”. They also propose to investigate to what extent the
weight of the variable costs in the total costs of customers changes as it broadens the time
horizon of analysis. The authors suggest this refinement on the concept of customer
profitability analysis because, they say, usually the customer profitability reports assume
that “all costs are variable customer costs, and all costs can be assigned to individual
customers”; and the analyses are done for a single transaction (or several transactions) on
a limited period of time (Foster and Gupta 1994, pp. 55-56). Specifically, Foster and
Gupta (1994) suggest improving the customer profitability analysis by making it from the
CHAPTER 2
48
perspective of the customer life cycle, including after-sales costs, customer satisfaction
and customer retention information. They exemplify using the insurers’ case in
calculating the price of life insurance in order to offer competitive entry prices to attract
customers. The insurance companies achieve profitability throughout the customer life
cycle through retention and dilution of initial acquisition costs.
The long-run perspective that relates profitability to customer satisfaction –
through customer retention and repeating purchases – lead to calculate the value of the
retained customer base by calculating the present value of cash flows generated by those
customers during their active life (see Foster and Gupta 1994; Gleaves et al. 2008; Kumar
et al. 2008). This is a subject widely discussed and proposed in the marketing literature
(see Ambler 2003b, p. 33). However, there has been resistance from the financial
accounting regarding its adoption and inclusion in the balance sheet as an intangible asset,
e.g., the customer equity or brand equity concepts (see Ambler 2003b, p. 209; Blattberg
1993; Foster and Gupta 1994; Guilding and Moorhouse 1992). As stated by Foster and
Gupta (1994, p. 58), “The CM/MA [cost management/management accounting] literature
contains limited discussion of asset or liability valuation of marketing-related assets or
liabilities”. One reason for that is that accounting standards regulate the registration of
marketing expenses as period expenses in the period in which they occur and not its
capitalisation as intangible assets (see Johnson and Kaplan 1987; Morgan et al. 2002).
Foster and Gupta (1994) suggest identifying and distinguishing marketing expenses with
short-run effects, such as point of sale promotions or discounts, from branding expenses
which produce effects for longer, e.g., advertising. One proposal in the accounting
literature is to capitalise the long-run marketing expenses – with prolonged effects – and
amortise them (considering it a cost) over the period corresponding to its effect on
revenues (see Foster and Gupta 1994; Peles 1970). In this respect Peles (1970, p. 131)
who studied advertising and subsequent demand in three industries, suggests:
“Advertising expenditures of beer and cigarette firms should be amortized by a declining balance method with an annual rate of amortization of 40-50 percent for beer and 35-45 percent for cigarettes. In the car industry practically all the current expenditures for advertising should be considered expenses in the year of incurrence.”
The failure to capitalise some marketing expenses – considering them as period
expenses – leads to a level of marketing expenditure below the desired level (see Foster
and Gupta 1994; Rayburn 1986; Wilson 1986). The analysis of both marketing
performance and returns on marketing spend remains challenging in theory and in
LITERATURE REVIEW
49
practice (see Lehmann 2004; McGovern et al. 2004; Verhoef et al. 2011). It continues to
be researched and ways are discussed to analyse the cost and benefit of marketing
activities in order to manage the mix of marketing outlays (see Morgan et al. 2002). More
research is requested to understand the durability of the effect of advertising campaigns in
each specific context – industry, type of marketing campaign and duration – in order to
properly register in the firm’s accounts what is cost and what is “investment” in
marketing (see Foster and Gupta 1994; Persson and Ryals 2010; Seggie et al. 2007).
In the following sections the accounting proposals in the field of planning and
management control systems with connection to managers of marketing is reviewed.
2.3.3 Planning and Control Systems
2.3.3.1 Budgeting
Management accounting proposes the budget instrument or profit plan (see Rosanas
2005) – annual or pluri-annual – for planning and management control for both current
and strategic management (Anthony and Govindarajan 2003; Simons 2000). The budget
may have multiple roles for marketing management (Foster and Gupta 1994). In its
simplest form it can be to budget and control marketing costs when the MD is a cost
centre – configured as a centre of responsibility (see Anthony and Govindarajan 2003).
The budget can also be used for the purpose of planning, to identify opportunities and
problems, to innovate, and to test and communicate the strategy from the perspective of
management control and strategic alignment (Simons 1995b, p. 92, 2000). Simons (2000,
p. 108) says that “[t]he profit plan describes business strategy in economic terms”, and
Anthony and Govindarajan (2003, p. 410) say that the “budget is a planning and control
tool”. It is a tool allowing to express in numbers the various possible business strategies.
It contributes to selecting the most appropriate one for both the short and the long run.
Although several authors (e.g., Hope and Fraser 2003b; Howell 2004; Jensen 2001;
Simons 1987b; Stewart 1990) criticise the traditional way of using the budget as a tool of
command and control – and as a basis for rewarding performance – they still prescribe the
budget as a tool for short and long-run planning. For example, it is useful to communicate
objectives within the organisation, to challenge the line directors, to review and align
strategies, to learn collectively, to understand competitors, to anticipate customer demand,
and to innovate (see Hope and Fraser 2003b; Howell 2004; Jensen 2001; Simons 1987b;
Stewart 1990).

CHAPTER 2
50
The literature proposes two other techniques directly related to planning,
budgeting and cost management in marketing management: target costing and lifetime
budgeting (see Foster and Gupta 1994).
The technique of target costing (see Cooper 1996a; Sakurai and Keating 1994;
Tanaka 1993) aims at to design the product, to define the materials and technology in
order to not exceed the target cost that allows proper returns at the market price point –
considering other competitors’ offers for an identical product, considering its quality and
functionality. It is a technique that requires interaction between management accounting,
production, product development and marketing (see Cooper and Slagmulder 2004).
Initially it requires information about the price point of each product that is to be
launched, but it is also considered the product positioning in the market, the perceived
quality and the product functionality. In order to calculate the target cost, all expenses
needed to deliver the product to the market (e.g., taxes, marketing and distribution costs)
and the desired profit are deducted form the price point. The target cost is thus a cost that
enables marketing to launch the product ensuring the desired profitability. It is with target
costing information that the product is designed in order to obtain a production cost
compatible with a profitable placement of the product in the market (Cooper 1996a).
Cooper and Slagmulder (2004, p. 46) summarise the objective of target costing as:
“This technique is applied during the design stage as a feed-forward mechanism through which engineers retool the design of a new product to reduce the costs while maintaining a desired level of product functionality and quality.”
In the management literature it is reported that the technique is used along with
other cost techniques (e.g., product-specific kaizen costing, general kaizen costing and
functional group management) in the context of cost management (see Cooper and
Slagmulder 2004). It is used throughout the life cycle of the product (from manufacturers’
perspective) with results both in terms of cost reduction in the design phase and cost
containment during the production phase (see Cooper and Slagmulder 2004). When, for
example, a product launch is not viable due to its cost being over the target cost, then it is
suggested that an analysis be done comprising the entire product life cycle (from launch
until the withdrawal from the market) in order to evaluate the benefit of subsequent cost
savings (kaizen costing) throughout the lifecycle of the product. In this perspective, the
longer the product lifecycle, the greater the opportunities to reduce costs and make the
product profitable – even considering further reductions in selling price over the product
LITERATURE REVIEW
51
life cycle. In other cases a strategic analysis can be taken in order to justify the product
launch despite its low profitability in the short and long run (e.g., flagship products) (see
Cooper and Slagmulder 2004). This proposal from management accounting is made to
improve the strategic marketing decisions. These techniques combine information
originating in the accounting system and information originating in the marketing and
sales department. Although the planning and budgeting of product costs under target
costing focuses on marketing and customers – and therefore may be considered useful in
strategic management – it focuses mainly on materials and workmanship cost
management (Foster and Gupta 1994, p. 50). The literature states that the technique
stimulates and intensifies effort to reduce costs and increase competitiveness (Shank and
Fisher 1999); however this effort to manage and minimise costs focuses primarily on the
design phase and production, and does not exploit the application of this technique in the
domain of marketing costs (Foster and Gupta 1994, p. 50).
When addressing the topic of the marketing budget in the literature, that focuses
on cost budgeting – as the MD is usually considered in the literature as a cost centre (see
Anthony and Govindarajan 2003; Foster and Gupta 1994). Foster and Gupta (1994, pp.
51-52) review the accounting literature on marketing budgeting techniques and although
they note some references to the costs of marketing it “rarely focuses on this area [of
marketing costs] in any detail”. Therefore the authors conclude “the accounting literature
contains very little discussion of approaches to refine marketing budgeting methods”. The
authors also found that the decisions on the marketing media mix budgeting (e.g.,
advertising, sales promotion or price allowances) is very little investigated and suggest
further research on this topic in particular on the calculation of the contribution margins
related to different budgeting models in marketing.
In the next section the management accounting perspective for performance
measurement is reviewed. It is another aspect that can connect management accounting
and marketing.
2.3.3.2 Performance Measurement
Measuring marketing performance – effectiveness and efficiency – is a much debated
topic in marketing and accounting literature (e.g., Foster and Gupta 1994; Lehmann 2004;
Moorman and Rust 1999; O'Sullivan and Abela 2007; Verhoef et al. 2011) and it is a
topic that can bring the two disciplines closer, both in theory and in practice (see Gleaves
et al. 2008). It is so, to the extent that accounting information relating to revenues, costs
CHAPTER 2
52
and profits – both in the short run and in the long run – may be relevant for marketing
performance analysis. Effectiveness relates to the achievement of objectives, outcomes or
goals proposed; efficiency refers to the ratio of outputs to inputs and processes, i.e., how
to achieve the goals with minimum consumption of resources (Foster and Gupta 1994).
Although traditionally marketing is able to control its effectiveness, it has more difficulty
controlling efficiency (see Lehmann 2004; McGovern et al. 2004; Seggie et al. 2007;
Webster Jr et al. 2005). It is reported in the literature that marketing measures its
performance by using information on the volume of orders, volume of sales or market
shares, but there is less information about costs and profitability (see Foster and Gupta
1994; Lehmann 2004; Seggie et al. 2007). In this context, there are proposals in the
accounting literature to measure marketing performance in terms of efficiency, i.e.,
including information on both costs and profits. For example, Foster and Gupta (1994, pp.
61-62) suggests the use of benchmarking, both internal and external, to the level of
marketing costs, i.e., comparing the marketing costs structure of the business unit with the
marketing costs structure of other business units, from both organisation’s and
competitors. The use of relative measures of performance – as preferable to the analysis
of absolute budget variances – is also proposed by Hope and Fraser (2003b). It is a
perspective for performance evaluation that considers the impact of the economic context
– be it positive or negative – and the performance of competitors. Hope and Fraser
(2003b) suggest not to assess the absolute performance by comparing it to apriori defined
or negotiated targets, but evaluating the performance in a competing context, aiming at
improving the firm’s competitiveness. Foster and Gupta (1994, p. 62) state that the
perspective of the relative-to-competition analysis of marketing costs – external
benchmarking – was already used in marketing discipline when the “Sales and Marketing
Management” published the annual “Survey of Selling Costs”:
“These surveys report average cost data for individual selling cost items based on member survey reports, e.g., lodging and meals. This cost data can be used to classify the costs of a salesperson as above or bellow average.”
The literature of accounting, besides suggesting the importance of financial
accounting information on costs and profitability for the assessment of marketing
performance, also proposes the use of non-financial indicators and control systems for
marketing management – using a strategic perspective (see Anthony and Govindarajan
2003; Simons 1995b). This topic is developed in the next section.
LITERATURE REVIEW
53
2.3.3.3 Strategic Control Systems
The management accounting and control literature, in addition to what was said earlier on
the various applications of accounting information for marketing management, also refers
that the financial reports, profit plans, analysis of variances and critical performance
indicators – as a system of diagnosis or as a system of performance evaluation – are not
enough to manage the business in a balanced and sustainable way in the long run (see
Simons 1995b). Especially when there is strategic uncertainty, changes of context or
changes in the underlying management paradigm of the organisation. Simons (2000)
refers to the need to include other forms of control (levers) that hinged together create
tensions that balance innovation and learning with control and efficiency. Simons (2000,
p. 311) comments on the limitations of traditional planning, performance measurement
and diagnosis systems:
“To sustain growth, entrepreneurs must first install effective profit plans to support management needs for decision making and control. Other diagnostic control systems linked to critical performance variables must also be established, and incentives should be tied formally to the achievement of diagnostic targets. Top managers can then rely on exception reports and strategic variance analysis to monitor the achievement of key outputs and profit plan targets. As managers introduce these new systems, however, they must also be aware of the risks that they are creating.”
Simons (1995b, 2000) mentions three particular types of risks. The first is of
managers while defending their own interests harm the interests of the organisation. For
example, managers can adversely affect the organisation by appropriation or misuse of
company resources, using them for their personal gain. A second risk is the dispersion of
management attention and management time caused by unlimited opportunities and
limited management time. For example, losing focus on what managers do being
distracted by other business opportunities. Third, there is the risk of managers not
contributing with new ideas and innovations to business management. For example,
focusing on the present (to meet annual budgets, profitability, or performance indicators)
forgetting the long-run vision, the changes in context (customers, competitors and market)
and the strategic uncertainties. On the basis of Simons’ (1995b) strategic control system
remains the idea that the important for managers is to maximise the return on
management, since opportunities are limitless and management attention is limited.

CHAPTER 2
54
It is also considered a model of human behaviour with the following
characteristics (Simons 2000, p. 307):
“Humans value contribution and commitment but also exhibit traits of self-interest. In the absence of leadership and purpose, individuals will inevitably become self-interested and work for their own benefit with little regard to the goals of the organization. [...] The model of human behavior adopted in this book reconciles these two views by assuming that people desire (1) to achieve and contribute, (2) to do right, and (3) to create and innovate. We assume lapses in these behaviors are due primarily to organizational blocks, rather than a misspecification of the basic nature of people working inside organizations.”
Simons (1995b, p. 5) refers to control as “the formal, information based routines
and procedures managers use to maintain or alter patterns in organizational activities” and
proposes four control levers to use simultaneously: “beliefs systems”, “boundary
systems”, “diagnostic control systems”, and “interactive control systems” (Simons 1995b,
p. 7).
The belief systems aim, without limiting, to guide and inspire employees,
challenging them to contribute ideas and find solutions (Marginson 2002; Mundy 2010).
It regards the strategy as a perspective and communicates through the vision and mission
statements. It is based on a system of values and seeks to transmit them to the
organisation (Simons 1995b). Roberts (1990) shows that the transmission of values and
plans can also be communicated through extended conferences to all staff of the
organisation. It is broad and comprehensive, since the aim is to broaden horizons. It can
be focused on the customer, quality of service or product, the long-run relations,
innovation, and social responsibility. The belief systems besides bearing the planned
strategies (intended strategies) contribute to the formation of emergent strategies,
stimulating creativity and the employees’ desire to contribute.
Considering the risk of dispersion associated with inspiration and desire to
contribute encouraged by the belief systems, Simons (1995b, p. 7) proposes one lever of
control that limits the boundaries of creativity and action, i.e., the “boundary systems”. It
controls the strategy as a positioning – for certain products, technologies, markets or
market segments (see Simons 1995b). It is the tension between these two levers – beliefs
systems and boundary systems – that provides a context of directed creativity by
exploring new opportunities, avoiding, at the same time, strategic risks or wastage of
resources. It ensures that “realized strategies fall within the acceptable domain of activity”
(Simons 2000, p. 303) and “maximizes ROM”, i.e., “return-on-management” (Simons
LITERATURE REVIEW
55
1995b, p. 17). They are concepts, ways of acting, or parameters, placed on the negative
form – bans – which if exceeded result in sanctions. This system can be communicated
through codes of conduct, “strategic planning systems and operating directives with
minimum acceptable bounds” (Hoque and Chia 2012, p. 128). The aim is not to prescribe
what should be done, but to enumerate a number of aspects to avoid; it gives freedom to
both creativity and innovation, out of the danger zone (Simons 1995b). For example, the
financial measures in the boundary systems are used to “address financial risks” and non-
financial measures are used to “emphasize strategic boundaries” (Tuomela 2005, p. 300).
Simons (1995b) includes other tools – budgets, key performance indicators, profit
plans, and balanced scorecards among others – as elements of diagnostic control systems.
The underlying idea is to manage by exception and variance analysis, therefore, to free
management time and maximise the “return-on-management” (Mundy 2010; Simons
1995b, p. 17, 2000). The diagnostic control system lever controls the strategy as a plan
and contributes to the intended strategy being carried out. The aim is to ensure that the
results are obtained, either at the business unit or at the individual level (Simons 2000, p.
303). It is closer to the traditional control systems (see Figure 2-1) as it compares the
outcomes with the goals – on inputs, processes or outputs – and controls what is most
appropriate in each circumstance in order to achieve the pre-established objectives (Fisher
1995). The control is more on output than processes if one aims at innovation and
creativity; the control is more on inputs and processes if one desires safety and risk
minimisation (see Simons 2000, p. 65). It is an information system that allows managers
to compare the results with plans and budgets as well as establishing appropriate rewards
if the performances were achieved (Abernethy and Brownell 1999; Simons 1995b, 1999,
2000). For example, the financial measures can be used to control that “the selected
strategy leads to the achievement of financial goals” and nonfinancial measures to control
that “performance in critical success factors of strategy is acceptable” (Tuomela 2005, p.
300). The diagnostic control systems are not viewed as only a means of control, limiting
or conditioning behaviour. They are also considered as a means of learning, resulting in
better decisions and motivating factors for managers to achieve their objectives (Emsley
2001; Ittner and Larcker 1998; Kato et al. 1995; Mundy 2010; Norman 2001). Henri
(2006) observes that the diagnostic control system is presented as a negative force for two
reasons. First, because it focuses on the errors of the processes or results that deviate from
established standards. Second, because it uses a feedback process that seeks to correct
processes to minimise errors and deviations (Henri 2006, p. 533). However, the
CHAPTER 2
56
diagnostic control system can also be used as a tool for identifying opportunities for
improvement (Simons 1995b); this is seen further on.
The other lever of control with positive forces – and has the potential to connect
the various functional areas including accounting and marketing – is the interactive
control system. The instruments may be the same as that of the diagnostic control systems
but it is proposed to be used differently – with formal debate and communication –
aiming at encouraging “experimentation” and “opportunity-seeking” (Simons 2000, p.
303). It is done through multi-hierarchical interaction and face-to-face debate and
discussion. It is suggested in the literature that “[m]echanisms such as face-to-face
meetings and ‘‘strategydays’’ can be used to discuss and resolve problems, rather than to
apportion blame” (Mundy 2010, p. 501). It is still a mean that “forces dialogue” and
“focuses attention throughout the organization” by the signals sent by top management
(Henri 2006, p. 533). The budgeting process and performance measurement if used
interactively and discussed among the various hierarchical levels, enable information
sharing, strategic “learning and adaptation” and reduce the “knowledge gaps” (Abernethy
and Brownell 1999, p. 199; De Haas and Kleingeld 1999; Mundy 2010, p. 501; Shields
and Shields 1998). It contributes to explaining the numbers, identifying strategic
uncertainties and establishing coordinated action plans. It allows different people to bring
different information about the organisation and its activities (Abernethy and Lillis 1995;
Mundy 2010; Speklé 2001). Mundy (2010, p. 501) notes:
“The interactive use of MCS consists of formal two-way processes of communication between managers and subordinates at different levels of the organisation.”
Simons (2000, p. 303) suggests that this system is related to the strategy as a
“pattern of action” and contributes to the realisation of the emerging strategy:
“Tactical day-to-day actions and creative experiments can be welded into a cohesive pattern that responds to strategic uncertainties and may, over time, become realized strategy.”
The greater the strategic uncertainties (changes in the assumptions that led to the
formulation of the intended strategy) the more useful this lever of control is (Simons
1995b). The budget can be used as an element of the interactive control system if it is
debated, discussed and reviewed in a systematic way (e.g., Simons 1987b). This lever can
decisively contribute to the strategic renewal, focusing on context, customers, market and
LITERATURE REVIEW
57
competitors (Simons 1995b). The interactive control is more oriented towards learning
than to control (Tuomela 2005), and Jönsson (1998) notes the importance of dialogue and
the words used between organisational actors in the monitoring process, to determine
what business conditions remain valid. Vaivio (2004) mentions the potential of non-
financial information to provoke discussion and, through verbalisation, turning tacit
knowledge into explicit knowledge with benefits and advantage to the entire organisation.
Being an interactive method, it has more costs, it is more management time consuming,
but it has a “positive effect on firm performance” (Widener 2007, p. 757).
The whole management control model of Simons (1995b) is a model that inspires
and guides behaviours. It contributes to communicating the mission and the vision of the
business (through the core values and beliefs systems) and captures the attention of
managers to changes of context – with particular attention to customers and competitors
(strategic uncertainties and interactive control systems). From a positive perspective it
stimulates innovation and action. It is also a model that, considering the limited
management time, controls the business strategy as a positioning and an action plan. It
determines boundaries for action (risks to be avoided and boundary systems) and uses
critical success indicators and balanced scorecards to communicate and implement
strategy (critical performance variables and diagnostic control systems); managing by
exception it maximises the return-on-management time. Managing the tension between
limiting and inspiring forces, between the search for new opportunities and the efficiency
of current plans (with internal and external focus), it is a proposal for strategic
management control that implies the involvement and interaction of diverse functional
areas, e.g., marketing and accounting among others. There are studies on the joint use of
diagnostic and interactive control systems that conclude on their complementarity and
their importance to business performance and to the success in competitive environments
(e.g., Bisbe and Otley 2004; Henri 2006; Hoque and Chia 2012; Tuomela 2005; Widener
2007).
The integrated control model proposed by Simons (1995b) can also contribute to
cross-functional learning in that the interactive dialogue systems assume discussion and
dialogue (Vaivio 2004). The functional interaction proposed by the model would allow
the functional area of marketing to learn concepts and relationships from the field of
accounting, and accounting to learn the concepts and challenges from the area of
marketing and sales. The interaction proposed by the model can therefore help to bring
together both functional areas and increase the use of accounting information and the role
of the controller in the organisational learning process (see Vaivio 2004).

CHAPTER 2
58
The interaction, debate and dialogue in the design phase of planning, control and
diagnostic systems, contribute to the creation and implementation of marketing
performance metrics – financial and non-financial – understood and aligned by the two
functional areas (De Haas and Kleingeld 1999; Hope and Fraser 2003a).
Finally, the diagnostic control systems, in addition to serving to identify errors in
processes or negative deviations in the results – acting by the negative – may also serve to
identify process improvements or abnormally positive deviations, generating
opportunities for improvement – with replication in other units business – and “cost
management opportunities” (Shank 1989, p. 52).
The next section is a review of the literature on the roles and responsibilities of
marketing managers, and the extent to which these managers can benefit from using
accounting information in their work.
2.4 Accounting Information: Marketing Management Perspectives
In this section the marketing literature is reviewed to understand what the role of
marketing managers is and what their responsibilities are. It is also explored the extent
accounting information may be relevant to the management of marketing. Webster Jr et
al. (2005) in commenting on marketing management responsibilities state that the
responsibilities of marketing have evolved from a support function, e.g., sales and brand
management responsibilities, to strategic level decisions, e.g., market segmentation,
product positioning, customer targeting, product management and pricing (see Appendix
2). In this respect, Webster Jr et al. (2005, p. 36) note:
“In its earliest organisational forms, beginning in the 1920s, marketing had developed in field sales support and as product and brand-management activities in consumer packaged-goods companies. It would be another three decades before it emerged as a full-blown function in its own right, heralded by the customer-oriented ‘‘marketing concept’’ articulated by management scholar Peter Drucker in the 1950s. Marketing management evolved to include key strategic decisions in market segmentation and targeting, product management, pricing, communication (including product positioning and branding) and distribution channels.”
Drucker (1954) considered marketing – as well as innovation – to play a key role
in business management, in that he sees the business, as a whole, being geared towards
customer service and depending on the customer.
LITERATURE REVIEW
59
Drucker (1954, pp. 37-39) states:
“A business enterprise is an organ of society. There is only one valid definition of business purpose: to create a customer. […] It is the customer who determines what the business is. For it is the customer, and he alone, who through being willing to pay for a good or service, converts economic resources into wealth, things into goods. […] The customer is the foundation of a business and keeps it in existence. He alone gives employment. […] Because it is its purpose to create a customer, any business enterprise has two – and only these two – basic functions: marketing and innovation. […] Actually marketing is so basic that it is not just enough to have a strong sales department and to entrust marketing to it. Marketing is not only much broader than selling, it is not a specialized activity at all. It is the whole business seen from the point of view of its final result, that is, from the customer's point of view.”
By applying the marketing concept to the functions of marketing management,
Kotler (1977) suggests that the responsibilities of marketing managers are:
• Profit planning through product and customer mix decisions aiming at
market share and profitable sale volumes;
• Long-run trends, threads and opportunities;
• Customer types and segment differences, aiming to add more value to the
profitable customer segments;
• Good planning and control systems with market analysis.
There are other definitions for marketing in the literature (see Appendix 2), e.g.,
meeting needs profitably (Kotler and Keller 2006); “the creation and harvesting of inward
cash flow” (Ambler 2003b, p. 5); satisfying customers and thereby maximising net
inward cash flow (Ambler and Roberts 2008); or a set of values and processes which are
implemented by the whole organisation (Moorman and Rust 1999). These perspectives on
the marketing function make explicit references to concepts originating from the
accounting and management control systems, e.g., “profitable”, “cash flow”, “planning”
and “control”. In the literature there are still studies that report a direct link between the
use of accounting information in marketing decisions and positive impacts on
profitability, arguing about the benefit of using accounting information in the marketing
management (e.g., Dubé et al. 2005; Storbacka 1997; Viscolani 1994; Zhang et al. 2008).
For example, marketing decisions about price, promotions, brand image, quantities and
costs produce changes in both the market equilibrium and business profitability (Cabral
2000; Hirshleifer 1984; Nueno and Simon 1999; Sloman 2003); i.e., there are optimal
CHAPTER 2
60
decisions (e.g., about pricing) that maximise profits in specific time horizons (e.g., short
run and long run) for specific market contexts (see Banker and Hughes 1994; Cooper and
Kaplan 1988b; Nueno and Simon 1999).
In the marketing literature, Little (1975) suggests that price, promotion (not price
promotions, nor advertising), distribution (e.g., merchandising at the point of sale and
customer service) and advertising have independent impacts on sales. Little (1975) argues
that adequate marketing management produces positive impacts on business profitability.
The model proposed by Little was tested in specific markets (see five examples bellow)
and the empirical results confirm the hypotheses of the model. In the first example, Dubé
et al. (2005) developed a model of dynamic advertising competition and applied it to the
Frozen Entree industry; the results confirm the positive impact of advertisement (i.e.,
pulse-advertisement) on business profitability. Pauwels et al. (2004) applied a
multivariate time-series model to the automobile industry; they claim that both the
introduction of new products and promotions are significant performance drivers. Zhang
et al. (2008) provide an analytical model for optimising decisions about price, promotions
and stock replenishment; the authors demonstrate analytically that, under the assumptions
proposed by Little (1975), the firm’s profitability can be maximised through the
coordination of these three variables. Nijs et al. (2001) performed a multivariate time-
series analysis into the effects of price, promotions, new product introduction and
advertising, covering 560 consumer products categories over four years in the
Netherlands. They claim that the promotions produce short-run effects on demand, but
these effects rarely persist; on the other hand, the introduction of new products increase
the demand in the product category in a persistent form. Finally, Krasnikov and
Jayachandran (2008) perform a meta-analysis on studies about capability-performance
relationship; they conclude that the marketing capability, i.e., skills and knowledge for
understanding and forecasting customer‘s needs, linking it to the firm’s offers, has a
strong positive impact on the firm’s performance.
These relationships are particularly strong in monopolistic competition situations,
i.e., where product differentiation exists and the brand influences buying decisions (cf.
Nueno and Simon 1999, pp. 153-205; Sloman 2003, pp. 170-173). The clothing business
is an example where differentiation and brand management is relevant in marketing
management (McCracken and Roth 1989; Swartz 1983). When the consumers are buying
clothes, they are looking for personalised and differentiated articles (Snyder 1989; Swartz
1983). In this case study the companies are from the fashion retail sector.

LITERATURE REVIEW
61
The economics theory, as explained below, also suggests that adequate marketing
management can improve business profitability. The methodology requires the use of cost
accounting information and interactions with management accounting for revenue and
profitability analysis (cf. Johnson 1992, p. 141; Johnson and Kaplan 1987, pp. 219-
221,233,244,247). It is suggested that firms can maximise profit through marketing
decisions – e.g., quantities offered, product mix, pricing, advertisements and promotions –
and that there is a negative relationship between price and quantity demanded, i.e., in
normal conditions, the higher the price, the lower the quantity demanded (see Nueno and
Simon 1999, pp. 54-56; Sloman 2003, pp. 30-35). The economic theory also suggests
positive impacts of brand image and differentiation on quantities demanded (e.g., through
advertisement), i.e., the same quantities can be sold at higher prices, or, at the same
prices, more quantities are demanded (see Cabral 2000, pp. 223-235; Sloman 2003, p.
33).
In normal situations, i.e., with decreasing returns, it is suggested in the economics
literature that the profit is maximised when the marginal revenue – in competitive markets
this is the price, in monopoly or monopolistic competition this is represented by the
relation1 )1
1(, px
pε
+ (cf. Cabral 2000; Robinson 1932) – equals the marginal cost (i.e., the
cost of one extra unit), as long as the marginal cost is above the average total cost (Nueno
and Simon 1999, pp. 83-88).
In the economics literature (e.g., Sloman 2003, pp. 121-125) the firm’s short-run
cost function is presented as: (1) linear, i.e., the total cost of production increases
proportionally to the produced quantities; (2) decreasing (increasing returns), i.e., when
the marginal cost decreases with increasing quantities; or (3) increasing (decreasing
returns), i.e., when the marginal costs are crescent. Therefore, following this economics
theory, firms gain from identifying costs and revenues and decide about marketing
accordingly, e.g., price, promotions, distribution and placement, brand advertising,
inventories, customer selection and product mix.
It is also suggested in the literature that the support of accounting information for
marketing managers’ decisions on price, promotions, brand activation (brand
advertisement), products and customers, is very important (see Andon et al. 2001;
Cardinaels et al. 2004; Howell and Soucy 1990; Petty and Goodman 1996; Thomas et al.
2004). For example, Nordhielm (2006, p. x) proposes a framework for marketing
management that links different types of marketing managers’ decisions (see Appendix 4) 1 Key: p is the price; εx,p is the price elasticity of demand
CHAPTER 2
62
with accounting information. She notes that marketing decisions are taken on
segmentation, targeting and positioning (see Appendix 2), followed by decisions about
the product or service, pricing, distribution and promotion (see Appendix 4) and require
the existence of both financial and non-financial indicators. These indicators (1) allow
the diagnosis of the situation of the business; (2) support the planning and control of
marketing activities, e.g., setting the spending on research and development, promotional
campaigns, advertising, and distribution; and (3) measure the performance of marketing
management decisions. In this respect Nordhielm (2006, pp. 200-207) notes:
“In selecting an adequate customer definition, the firm should take into consideration the estimated profitability of serving its customers. While this may be difficult to do initially, over time, the company should develop a customer definition that describes a profitable customer relationship. [...] Also, in the Marketing Objective Module, we will perform a retention/acquisition audit, where we analyze our current budgetary allocations against the revenue contribution of our retention and acquisition activities to determine the optimal level of retention and acquisition spend, current purchases processes, and so forth.”
In the marketing literature it is also argued that companies benefit from adjusting
the indirect costs allocating systems to the characteristics of the business: namely, when
there is complexity and diversity of products or services, as well as complexity of
customers or market changes. For example, in the marketing literature, Lere (2001)
proposes the use of ABC when the products have different complexities, or when various
activities consume shared resources (overheads) in different degrees. He states that this
cost allocation method allows for a better understanding of the profitability of each
product and thus direct marketing investments to the most profitable products. It also
improves the productivity of marketing because the information on profitability is more
reliable than in the traditional systems (e.g., plant-wide cost drivers or departmental cost
drivers) and contributes to understand the cost of non-productive activities; he notes, for
example, that by using ABC it is easier to identify the drivers of customer service and
distribution costs, distinguishing them from the manufacturing costs. Lere (2001) also
notes that marketers may have an important role in the design of the cost allocation
system. He argues that marketers can provide information to accounting staff on the
comparison of firm’s prices with the competitors’ prices and thereby help to find flaws in
the calculation of the unit costs (in situations where the price is calculated based on the
unit cost).

LITERATURE REVIEW
63
Also in the marketing literature, Goebel et al. (1998) with reference to the
accounting literature (e.g., Cooper and Kaplan 1988a, b; Reeve 1991; Robinson 1990;
Shank and Govindarajan 1988b) note the benefits of ABC in improving the management
of marketing and increasing marketing productivity. Specifically, in relating the causes of
costs with the activities performed, it places the origin of the costs not only within the
factory but also on the marketing decisions (e.g., products, distribution channels,
customers and market segments). This contributes to better marketing decisions, in
particular through a cost benefit analysis in expenses related to customer relationship
management by identifying the profitable customers that deserve the investments, and the
unprofitable ones that do not. It also contributes to better decisions at the product, the
distribution channels and the market segmentation levels, insofar as margins can be
calculated for these units of analysis individually (cost hierarchies). Comparing ABC with
the traditional methods (based on units or on volume and not on transactions) Goebel et
al. (1998, p. 500) consider that the traditional costing systems are limited in “providing
the accuracy or detail necessary for maximizing effective marketing decision making”
and note that from the perspective of marketers, the costs must relate to products or
product families – which are the objects of marketing decisions – not to volume or units.
Goebel et al. (1998) also note that the ABC is what best serves a market-oriented
organisation. Though they acknowledge the gains associated with market orientation, they
note that it is important to have a cost benefit analysis that considers the resources
consumed to support a market oriented organisation and the benefits derived from it.
According to the authors the ABC method is the one that best supports this analysis.
Goebel et al. (1998, pp. 500, 501, 509) discussing the appropriateness of the ABC system
for the management of marketing, state:
“[In ABC] [c]ost objects include products, channels, and individual customers, the three core elements with which marketers are most concerned. [...] The emergence of ABC requires that marketers fundamentally rearrange their thinking regarding fixed and variable expenses and the margins that drive marketing decision making. [...] It is our view that only with ABC information can companies fully determine if market-orientated activities are providing the desired benefits in an efficient and effective manner.”
In the next section what the marketing literature discusses about the usefulness of
accounting information for marketing management is reviewed.
CHAPTER 2
64
2.5 Managers of Marketing and Accounting Information
2.5.1 Marketing Performance Measurement
This section reviews the marketing literature regarding the measurement of marketing
performance. The marketing literature states that there is a relationship between the
marketing performance measurement ability and both the influence of the MD and the
business performance (O'Sullivan and Abela 2007; Verhoef et al. 2011). This leads one to
believe it is in the interest of marketing managers to use the accounting system
information to measure the marketing performance. It is therefore expected that the
marketing managers demand accounting information from the management accounting
system.
In the marketing literature, references to accounting information are frequent with
regards to the topic of marketing performance measurement. It is argued that marketing
departments and companies would benefit from measuring the marketing departments’
performance, particularly with financial metrics. The marketing literature suggests that
marketing performance measurement leads to higher marketing influence and stature
(e.g., Lehmann 2004; Seggie et al. 2007), higher marketing influence at the board level
(Webster Jr et al. 2005) and better business performance (Verhoef et al. 2011). There are
several arguments in the literature offering explanations for the relationship between the
use of accounting information in marketing performance measurement and both
marketing and business performance (see O'Sullivan and Abela 2007).
Firstly, as suggested in the management literature, “what you measure is what you
get” (Johnson 1992, p. 105), “companies, by and large, achieve what they measure”
(Ambler 2003b, p. 29), “what gets measured gets done” (O'Sullivan and Abela 2007, p.
80), and “you can’t manage what you don’t measure” (Petersen et al. 2009, p. 95).
Secondly, in the absence of marketing performance measurement the influence and the
role of the MD in strategic decisions is negatively affected; without a marketing “centre
of excellence” the potential customers and customer needs are not properly identified and
the firm will be less effective in creating value, communicating and delivering it to the
customers (Webster Jr et al. 2005, p. 36). Thirdly, marketing performance measurement
helps managers to learn how to better allocate the resources and also enables them to
demonstrate, to the corporate level managers, the marketing input-output relations which
enable the distinction between what is “expenditure” and what is “investment” in
marketing; these factors contribute to improving a firm’s performance (Morgan et al.

LITERATURE REVIEW
65
2002, p. 373). With respect to marketing investments, Johnson and Kaplan (1987, pp.
201-202) argue that the rules for financial accounting reporting – both for profit
calculation and intangible assets in the balance sheet – lead to reductions in discretionary
and intangible marketing investments, e.g., promotion, distribution and customer
relations. They argue that when near-term profit targets are at risk, the managers cut the
expenditures in the discretionary items, not considering the negative impact on the value
of the discretionary and intangible assets – not included in the balance sheet by the
financial accounting – therefore “sacrificing the company’s long-term competitive
position” and “sacrificing long-term economic health” (see Johnson and Kaplan 1987, p.
201). Fourthly, the performance feedback is considered a stimulus to managerial attitudes
and behaviours (Curren et al. 1992). It is suggested that, knowing that the managers will
be taking an assessment, they then will be more motivated in the efforts, resulting in
better performance (O'Sullivan and Abela 2007; Ouchi 1979). Fifthly, the feedback about
attaining the goals produces strong effects on motivation which, in turn, strongly
encourages the firm to meet the goals (Locke and Latham 1990). Finally, the
measurement of performance improves the decision making, thus improving a firm’s
performance (Ambler et al. 2004; Morgan et al. 2002).
Several studies report a decrease in relevance of marketing function, marketing
departments and marketing managers, attributing this to the lack of marketing
performance measurement using financial metrics (see Ambler 2003b, pp. 96-97).
McGovern et al. (2004, p. 74) argue that the MD is usually managed by “creative
thinkers” who are not experts in numbers or analytics. A caricature of marketing staff is
that “they love to spend money and hate to assess the results of that spending” (e.g., Adler
1967; O'Sullivan and Abela 2007, p. 79).
Webster Jr et al. (2005) interviewed Chief Executive Officers (CEO) and senior
marketing executives in a diversified group of twelve businesses,2 and held a two-day
interactive forum with 40 senior marketing executives and academics. The discussions
focused on the experience of marketing managers regarding the functions of marketing
within the organisation. The analysis of interviews and conversations reveals that
marketing function is losing importance within the organisation. Webster Jr et al. (2005,
p. 35) summarise:
“In many companies, the marketing function is in steep decline. Over the last decade in particular, there has been a marked fall-off in the influence, stature and significance of the corporate marketing department. The trend
2 The nationality of the companies was not disclosed.
CHAPTER 2
66
toward integrated marketing – much discussed in earlier decades – seems to have been overtaken by a counter trend toward disintegration.”
Ambler (2003b) also suggests that the topic of marketing is occupying a small part
of the executives’ agendas at meetings, and Selden and MacMillan (2006, p. 3) note that
marketing has been seen as a channel of “propaganda” instead of a department focused on
customer understanding. Two other studies conclude that marketing managers are not
participating in strategic decisions and are being confined to tactical activities such as
advertising, sales support and institutional communication (see Sheth and Sisodia 2005;
Verhoef and Leeflang 2009).
Others, over the past three decades, have found that marketing, as an academic
discipline, has also lost influence, by not having devoted attention and participated in
research topics related to strategic planning and control (e.g., Anderson 1982; Day 1992;
Wind and Robertson 1983). Still others argue that the way marketing has been recognised
inside the organisation has driven the marketing functional unit down in the hierarchy and
out of the boardroom (Brown et al. 2005; McGovern et al. 2004; Sheth and Sisodia 2002,
2005, 2006). Spencer Stuart, a global executive search firm, estimated that the Chief
Marketing Officers (CMO), in the apparel sector, have on average a tenure of 19.4
months, while the CEOs stay in their position for an average of 52 months (cf. Welch
2004).
In another study, Baker and Holt (2004) used focus groups, semi-structured
interviews and interactive approaches, involving 81 non-marketing senior managers,
largely from UK companies, over a period of three years, to carry out research regarding
the image of marketing staff. They conclude that marketing staff are perceived by the
senior managers within the organisation as “unaccountable, untouchable, slippery and
expensive” (Baker and Holt 2004, p. 557). Commenting on the low reputation of
marketing managers, Schultz (2003) gives an explanation for the perception that senior
managers have regarding the marketing staff. Schultz (2003, p. 7) claims:
• Marketing has no defined processes nor measures, becoming, therefore,
“unaccountable”;
• Marketing justifies the failure of marketing activities by a lack of
involvement of other units, thus being seen as “untouchable”;
LITERATURE REVIEW
67
• The marketing criteria for rating the top brands is their budget size,
without taking into account the return on investment, and therefore
considered “expensive” by other non-marketing executives;
• Marketing over-promises and under-delivers, thus seems “slippery”.
Similarly, McGovern et al. (2004) offer an explanation for the decreasing
importance of marketing, saying that CEOs delegate to CMO the responsibility of
marketing decisions, and, with a lack of marketing accountability, the financial returns of
marketing investments are difficult to track and marketing becomes abstract to both the
board and the CEO. McGovern et al. (2004, p. 73) argue:
“With a high-profile CMO in place, business unit managers may lose control of or, at best, share responsibility for the marketing communications that touch their customers. CEOs expect their CMOs to drive marketing decisions, but no one is singularly accountable for the results. This lack of accountability makes it very difficult to track the financial impact of marketing investments. And so marketing becomes abstract to both the CEO and board.”
The tendency to the loss of recognition and to the loss of marketing influence
within the organisation suggested by the studies cited above, was not confirmed in two
other situations. For example, Homburg et al. conducted a survey covering marketing
managers from strategic business units (SBU) in three industry sectors (i.e., consumer
packed goods, electrical equipment and components, and mechanical machinery)
operating in Germany and the US, and found that the CMO influence inside the company
was substantial. It was very influential in advertising messages, customer satisfaction
measurement and customer satisfaction improvement programs. It was also strongly
influential on decisions about expansion to new geographic markets, strategic directions
of the business unit, distribution strategies, choices of strategic partners, new product
development and design of customer service.
Another study that covered 167 companies3 revealed that although the CMO were
not always present in top management teams (TMT), the likelihood to be present was
associated with “innovation, differentiation, branding strategy, the CEOs operational
experience in the firm, the diversification strategy and size of a firm, and, to some extent,
the TMT’s functional experience [in marketing]” (Nath and Mahajan 2008, p. 76). Other
authors argue that the marketing influence is associated with its ability to demonstrate the
3 Multi-industries from the COMPUSTAT database with a turnover above $250 million, over a period of five years, i.e., 2000-2004.
CHAPTER 2
68
contribution of marketing activities to the firm’s profitability (Lehmann 2004; Moorman
and Rust 1999; Verhoef et al. 2011). Verhoef and Leeflang (2009) suggest that the lack of
an adequate marketing performance measurement reduces the possibility of reporting (to
the top management) the contribution of marketing tactics to the business performance;
and that an adequate marketing performance measurement could improve the perception
of marketing productivity. McGovern et al. (2004) also argue that summarising and
communicating the main performance indicators to the other executive directors can
bridge the distance between the various functional departments. However, Ambler
(2003b, p. 24) argues that “what marketers can be expected to change should be assessed
within the context of what they cannot”.
Marketing performance measurement is defined in the marketing literature as the
assessment of “the relationship between marketing activities and business performance”
(Clark and Ambler 2001, p. 231). Most of the research on this topic is quantitative, i.e.,
surveys (Gao 2010). Some studies find a direct positive relationship between marketing
performance measurement ability and business performance (O'Sullivan and Abela 2007;
Verhoef et al. 2011); other studies find an indirect positive relationship between
marketing performance measurement ability and business performance – mediated by
marketing influence (Moorman and Rust 1999; Verhoef and Leeflang 2009).
In a survey at the European high-tech sector, O’Sullivan et al. (2009, p. 850) –
motivated by the pressure to account for the marketing contribution to firm performance
in the sector – find a positive relationship between “[marketing performance
measurement] MPM ability” and both “firm performance” (objective and subjective) and
“CEO satisfaction with marketing” (marketing stature and influence). Moorman and Rust
(1999) suggest that the MD can improve its contribution to the company if it goes beyond
the customer-product approach and moves towards accountability with financial metrics.
They claim that the marketing’s ability to manage the connection between the customer
and the financial accountability contributes to the perceived value of MD within the firm.
Moorman and Rust (1999) consider the marketing customer-financial accountability
connection concept as the marketing knowledge, skills, ability and effectiveness to link
customer satisfaction and retention rates with financial outcomes. In this respect, Verhoef
and Leeflang (2009) conducted a two-stage research project covering Dutch firms. In the
first stage, they applied qualitative methods, interviewing 25 marketing and finance
executives; in the second stage, they used a quantitative analysis method. Verhoef and
Leeflang (2009, p. 20) claim that marketing “accountability appears to be a particularly
important driver of marketing influence”.

LITERATURE REVIEW
69
O’Sullivan and Abela (2007, p. 80) consider the ability to measure marketing
performance as “the ability to measure performance across a range of marketing
activities”4 (see Appendix 2). The literature review, on the metrics used in marketing
performance measurement, identified a list of thirteen metrics (see Table 2-3), of which
five are financial (see Ambler et al. 2004; Barwise and Farley 2004; Rust et al. 2004;
Srinivasan and Hanssens 2009).
Table 2-3 Ranking of Marketing Metrics
Financial Used by Non-Financial Used by 1. Profit/Profitability 92% 4. Brand Awareness 78% 2. Sales, Value and/or Volume 91% 5. Market Share, Volume or Value 78% 3. Gross Margin 81% 6. Number of New Products 73% 7. Relative Price 70% 8. Number of Customer Complaints 69% 12. Marketing Spend 65% 9. Customer Satisfaction 68% 10. Distribution/Availability 66% 11. Total Number of Customers 66% 13. Perceived Quality 64% 14. Customer Loyalty/Retention 64% 15. Relative Perceived Quality 63%
Source: Ambler et al. (2004) (This is a sample from the UK, in 2004)
Table 2-4 Empirical Research Published
Research Industry Country or Region
Foster and Gupta (1994)
Chemical, Steel, Timber, Edible Oil, Cotton Processing, Wine, Defence Products, Pharmaceuticals, Haulage, Electricity, Natural Gas, Software, Banking, Consulting, Legal, and Health Care
Australia, Canada, United Kingdom, and the United States
Homburg et al. (1999) Consumer Package Goods, Electrical Equipment and Components, and Mechanical Machinery
United States and Germany
Moorman and Rust (1999) n.a. United States O'Sullivan and Abela (2007) High-technology United States O'Sullivan et al. (2009) High-technology Europe Verhoef and Leeflang (2009) n.a. Netherlands
Verhoef et al. (2011) n.a.
Netherlands, United States, United Kingdom, Germany, Sweden, Israel, Australia
4 e.g., marketing planning, branding, advertising, direct mail/email campaigns, telemarketing and contact management, web site and Internet presence, tradeshows and events, promotions, sales and marketing collateral, public relations and internal communications, analyst and stakeholder relationships, channel marketing, customer relationship management (CRM) systems, market research, and budgeting.
CHAPTER 2
70
In conclusion, since it is suggested that the measurement of marketing
performance is related to the recognition of the MD within the company and to its
influence on marketing management, it is expected, therefore, that marketing managers
have an incentive to measure their performance. It is also expected that marketing
managers make use of accounting information in order to be able to use financial metrics
in marketing performance measurement. However, Barwise and Farley (2004) refer to the
limited use of financial metrics and Gleaves et al. (2008) identify problems in the
marketing and accounting interface. Little research focuses on the implementation of
marketing performance measurement systems. Most of the published research on this
subject consists of theoretical constructs (e.g., Clark 1999; Gupta and Zeithaml 2006;
Morgan et al. 2002; Rust et al. 2004). Moreover, the empirical research published focuses
on a particular industry or region (see Table 2-4). No quantitative or qualitative research
was found on how marketing managers are using accounting information in marketing
performance measurement, nor any research on what factors influence the use of
accounting information by managers of marketing.
One of the main topics in marketing performance measurement is marketing
metrics (see Barwise and Farley 2004; Winer 2000). In the following section the financial
metrics in marketing are reviewed.
2.5.2 Financial Metrics in Marketing
The demand for research in marketing accountability and financial metrics for marketing
performance measurement has increased since 1999 (Doyle 2000; Morgan et al. 2002;
Rust et al. 2004) and it was set as a top priority by the Marketing Science Institute
(Cambridge, MA) between 2002 and 2008 (Ambler 2003b; Gao 2010; O'Sullivan et al.
2009).
Verhoef and Leeflang (2009) claim that there is a lack of financial metrics to
evaluate marketing decisions with long-term effects (e.g., investments in brand) and that
this has negative impacts on the image of the MD and influence. Verhoef and Leeflang
(2009, p. 18) explain:
“[A] short-term emphasis impedes product/service innovations and reduces investments in brands, customers, and new business development, which in turn should decrease the influence of the marketing department, which is usually responsible for securing long-term benefits.”
LITERATURE REVIEW
71
McGovern et al. (2004, p. 74) argue marketing managers do not know “what to
measure or how to interpret the results”. McGovern et al. (2004, p. 74) argue:
“It's not that managers are short on measurement tools or that marketing metrics lack utility. The problem is that these managers don't know what to measure or how to interpret the results. They may collect all manner of plausible performance metrics – such as customer satisfaction scores and customer retention rates – but if these can't be correlated to marketing activities and revenue results, the data aren't very helpful.”
The marketing literature discusses and proposes different metrics to assess the
financial contribution of marketing activity, e.g., customer lifetime value (CLV) (Gupta et
al. 2004); market capitalisation (Joshi and Hanssens 2004); firm’s systematic risk
(McAlister et al. 2007); stock market performance (Pauwels et al. 2004) and abnormal
returns to stock prices (Tellis and Johnson 2007).
Barwise and Farley (2004) surveyed 697 CMOs from the leading advertiser
companies located in five industrial countries – the US, Japan, Germany, the UK and
France, which, they argue, account for almost two thirds of world marketing expenditures
– and found that the most used marketing financial metrics were customer or segment
profitability analysis (used by 64% businesses) and actual/potential customer/segment
lifetime value (40%). These financial indicators were much less used than the non-
financial ones, e.g., market share (79%) and perceived quality (77%).
The use of financial metrics in marketing, as proposed in the marketing literature,
requires interactions between marketing and accounting both in theory and in practice
(Gleaves et al. 2008). For example, Gleaves et al. (2008) claim that the calculation of
customer profitability analysis and CLV requires interactions between accounting and
marketing departments, and connects the marketing and accounting disciplines in
researching on financial metrics for MPM.
The customer profitability analysis is the customer accounting practice that is most
referred to in the marketing literature. It is related to the calculation of profit earned by a
specific customer, based on the costs and sales of that customer. It is also referred to as
“customer account profitability” by Guilding and McManus (2002, p. 46), who, in a
survey that covered chief accountants and marketing managers of 251 of the top 300
Australian listed companies, found that the use of customer accounting was much higher
than they initially expected. Their surprise arose because of the little regard given to the
customer accounting topic in the accounting literature; a fact that could, in practice, limit
the use of these tools by managers.
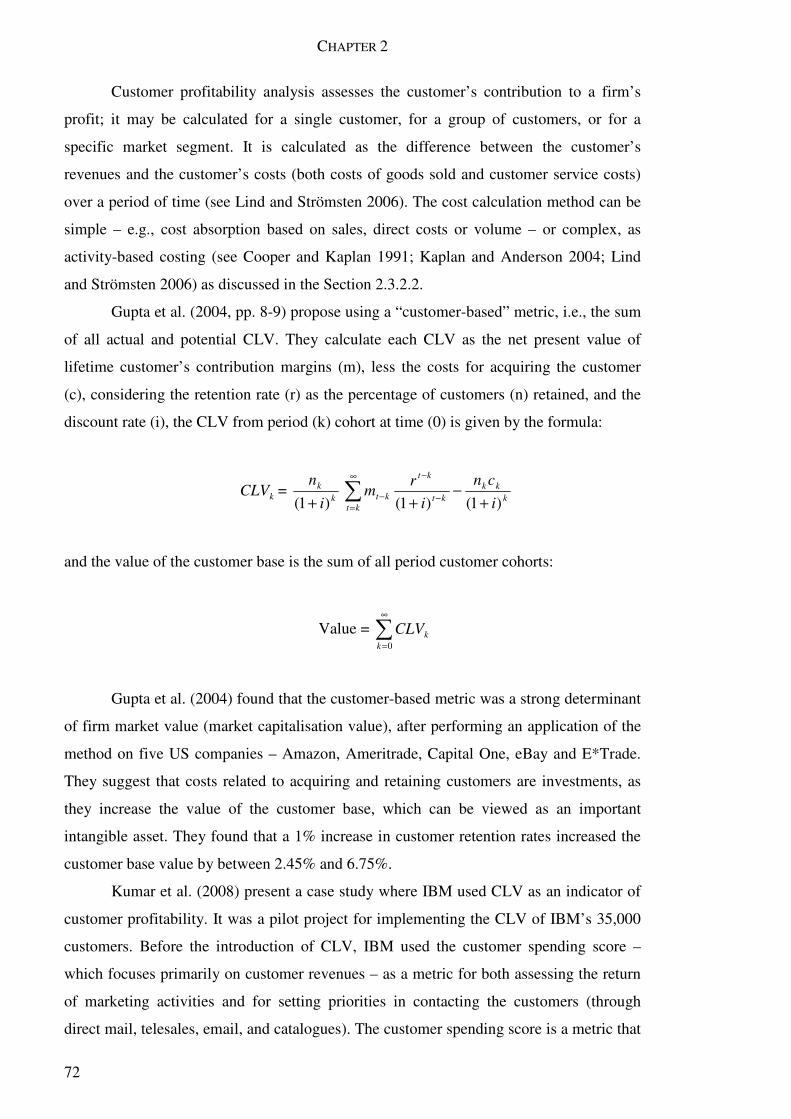
CHAPTER 2
72
Customer profitability analysis assesses the customer’s contribution to a firm’s
profit; it may be calculated for a single customer, for a group of customers, or for a
specific market segment. It is calculated as the difference between the customer’s
revenues and the customer’s costs (both costs of goods sold and customer service costs)
over a period of time (see Lind and Strömsten 2006). The cost calculation method can be
simple – e.g., cost absorption based on sales, direct costs or volume – or complex, as
activity-based costing (see Cooper and Kaplan 1991; Kaplan and Anderson 2004; Lind
and Strömsten 2006) as discussed in the Section 2.3.2.2.
Gupta et al. (2004, pp. 8-9) propose using a “customer-based” metric, i.e., the sum
of all actual and potential CLV. They calculate each CLV as the net present value of
lifetime customer’s contribution margins (m), less the costs for acquiring the customer
(c), considering the retention rate (r) as the percentage of customers (n) retained, and the
discount rate (i), the CLV from period (k) cohort at time (0) is given by the formula:
kCLV = k
k
i
n
)1( +k
kk
ktkt
kt
kti
cn
i
rm
)1()1( +
−
+∑
∞
=
−
−
−
and the value of the customer base is the sum of all period customer cohorts:
Value = ∑∞
=0k
kCLV
Gupta et al. (2004) found that the customer-based metric was a strong determinant
of firm market value (market capitalisation value), after performing an application of the
method on five US companies – Amazon, Ameritrade, Capital One, eBay and E*Trade.
They suggest that costs related to acquiring and retaining customers are investments, as
they increase the value of the customer base, which can be viewed as an important
intangible asset. They found that a 1% increase in customer retention rates increased the
customer base value by between 2.45% and 6.75%.
Kumar et al. (2008) present a case study where IBM used CLV as an indicator of
customer profitability. It was a pilot project for implementing the CLV of IBM’s 35,000
customers. Before the introduction of CLV, IBM used the customer spending score –
which focuses primarily on customer revenues – as a metric for both assessing the return
of marketing activities and for setting priorities in contacting the customers (through
direct mail, telesales, email, and catalogues). The customer spending score is a metric that
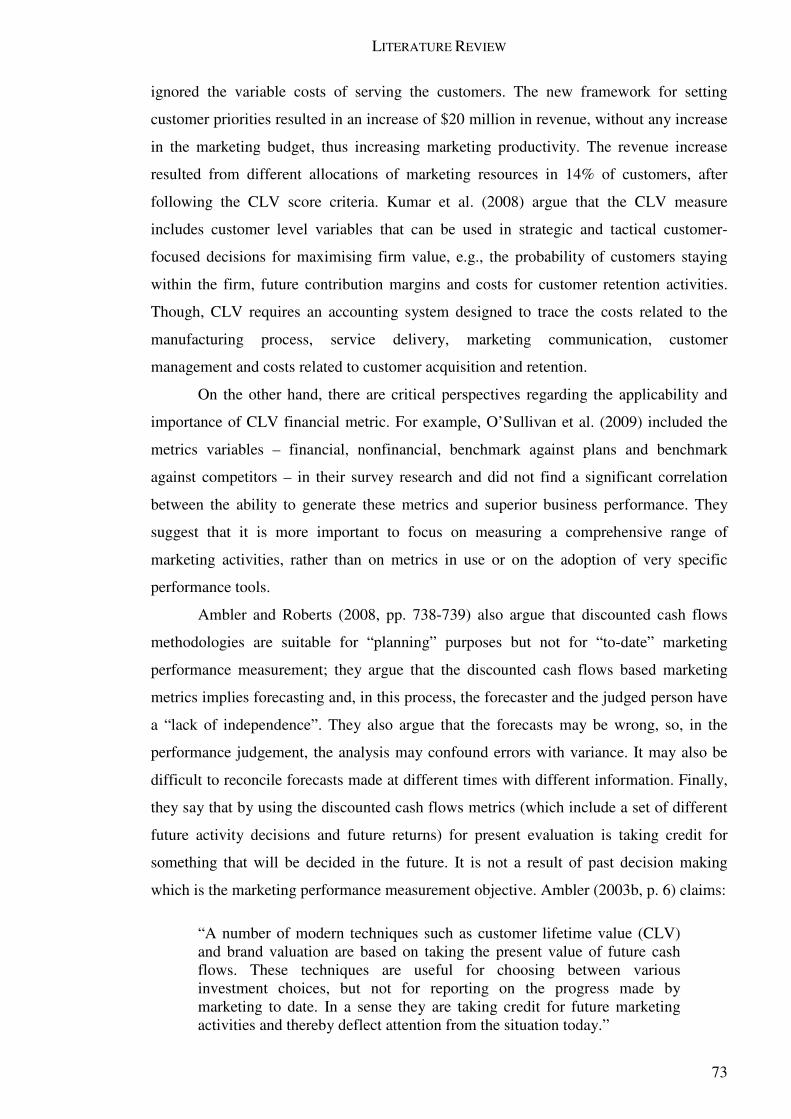
LITERATURE REVIEW
73
ignored the variable costs of serving the customers. The new framework for setting
customer priorities resulted in an increase of $20 million in revenue, without any increase
in the marketing budget, thus increasing marketing productivity. The revenue increase
resulted from different allocations of marketing resources in 14% of customers, after
following the CLV score criteria. Kumar et al. (2008) argue that the CLV measure
includes customer level variables that can be used in strategic and tactical customer-
focused decisions for maximising firm value, e.g., the probability of customers staying
within the firm, future contribution margins and costs for customer retention activities.
Though, CLV requires an accounting system designed to trace the costs related to the
manufacturing process, service delivery, marketing communication, customer
management and costs related to customer acquisition and retention.
On the other hand, there are critical perspectives regarding the applicability and
importance of CLV financial metric. For example, O’Sullivan et al. (2009) included the
metrics variables – financial, nonfinancial, benchmark against plans and benchmark
against competitors – in their survey research and did not find a significant correlation
between the ability to generate these metrics and superior business performance. They
suggest that it is more important to focus on measuring a comprehensive range of
marketing activities, rather than on metrics in use or on the adoption of very specific
performance tools.
Ambler and Roberts (2008, pp. 738-739) also argue that discounted cash flows
methodologies are suitable for “planning” purposes but not for “to-date” marketing
performance measurement; they argue that the discounted cash flows based marketing
metrics implies forecasting and, in this process, the forecaster and the judged person have
a “lack of independence”. They also argue that the forecasts may be wrong, so, in the
performance judgement, the analysis may confound errors with variance. It may also be
difficult to reconcile forecasts made at different times with different information. Finally,
they say that by using the discounted cash flows metrics (which include a set of different
future activity decisions and future returns) for present evaluation is taking credit for
something that will be decided in the future. It is not a result of past decision making
which is the marketing performance measurement objective. Ambler (2003b, p. 6) claims:
“A number of modern techniques such as customer lifetime value (CLV) and brand valuation are based on taking the present value of future cash flows. These techniques are useful for choosing between various investment choices, but not for reporting on the progress made by marketing to date. In a sense they are taking credit for future marketing activities and thereby deflect attention from the situation today.”
CHAPTER 2
74
Barwise and Farley (2004) also consider CLV as a complex metric and a kind of
derived estimative rather than something that is directly measured. However, from their
survey, covering the CMOs of five G7 industrial countries, they expect that the use of
CLV will increase as a reporting metric to the board.
Finally, Johnson (1992, p. 1) argues that the use of accounting-based performance
metrics to measure the company’s relationships with customers “can trigger behaviour
that impairs long-run competitiveness and profitability”. He argues that the top-down
accounting-based control motivates the employees to manipulate the business processes
to attain the financial targets and harm the long-run profitability. Johnson (1992) proposes
a bottom-up information system – based on direct observation – that empowers the
workforce to control the business’s processes, aiming at customer satisfaction. He claims
that “[i]t is quite proper, however, to use cost accounting information to plan and to guide
marketing decisions” (Johnson 1992, p. 141).
2.5.3 Marketing and Accounting Interaction
This section reviews the literature with regard to the interaction between accounting and
marketing to understand to what extent the two areas share information and use it to their
advantage, as suggested in the previous sections.
Srivastava et al. (1998) suggest that the inter-functional cooperation between
marketing and finance and the multidisciplinary working-teams are beneficial for
business management – in addition to what has been said in the previous sections on the
interest of the MD using accounting information and management accounting to
incorporate marketing elements. It occurs through the marketing-finance collaboration in
identifying and managing market-based assets (Lehmann 2004; Srivastava et al. 1998).
Srivastava et al. (1998) argue that if the market-based assets management (e.g., customer
relationships, distribution channel relationships, and business partner relationships)
includes the marketing-financial interactions, it can reduce the cash flows volatility,
therefore improving the cash flows and generating a positive impact on the shareholders’
value. However, Foster and Gupta (1994, p. 65) identify an accounting “information gap”
in marketing executives (see Table 2-5).
Foster and Gupta (1994) interviewed 40 marketing managers and marketing
controllers from Australia, Canada, the United Kingdom and the United States. They also
sent a questionnaire to 220 marketing executives and obtained 50 valid responses. Several
industries were represented, and included manufacturing, service, merchandising and

LITERATURE REVIEW
75
non-profit sector. The interviews were conducted to first identify the marketing decisions
for which the accounting information could be valuable. The questionnaires used that
information, and, for each marketing decision5, Foster and Gupta (1994, p. 64) asked: (1)
“How valuable accounting information potentially is to your decisions[?]”, and, (2) “How
valuable information from your existing accounting system is to your decisions[?]”
(italics in original). Foster and Gupta (1994, p. 64) sought responses on a scale of 1 “not
valuable at all” to 5 “very valuable” and identified significant differences between the
responses to the first and the second question – for each type of marketing decision (see
Table 2-5).
Table 2-5 Role of Accounting Information in Marketing Decisions
Marketing Decisions
Indicate how valuable
accounting information
potentially is to your decisions
Indicate how valuable
information from your
existing accounting system is to
your decisions
Information
Gap
(weighted)
Pricing decisions 4.13 2.87 5.20
Decisions related to the % of total
costs devoted to marketing outlays 3.95 2.88 4.23
Decisions related to how to allocate
the total marketing budget among
individual marketing categories
3.93 2.68 4.91
Product mix 3.86 2.81 4.05
New product development 3.83 2.71 4.29
Customer mix 3.80 2.73 4.07
Source: adapted from Foster and Gupta (1994, p. 65) Key: 1 - “not valuable at all”; 5 - “very valuable”.
5 The 12 areas questioned by Foster and Gupta Foster, G. and Gupta, M. 1994. Marketing, cost management and management accounting. Journal of Management Accounting Research 6, pp. 43-77. were: “1. Marketing/business Decisions A. Pricing decisions B. Customer mix C. Product mix D. New product development E. Distribution channels”; “2. Decisions related to the % of total costs devoted to marketing outlays”; “3. Decisions related to how to allocate the total marketing budget among individual marketing categories”; and “4. Decisions related to individual marketing categories A. Advertising B. Sales promotions C. Sales force management D. Brand management E. Product packaging”.

CHAPTER 2
76
They concluded therefore that there is an “information gap” among the marketing
managers. Although managers consider the accounting information potentially “valuable”
to their decisions (e.g., for pricing decisions, marketing outlays, product mix or customer
mix), the information that the “existing accounting system” offers was not as “valuable”
(Foster and Gupta 1994, pp. 64-65).
Foster and Gupta (1994, pp. 66-67) also researched the interest of marketing
managers in the accounting tools and to what extent these tools were used by them; they
concluded that here too there was an “information gap”. The marketing managers
considered the tools offered by accounting potentially valuable (especially those relating
to sales); however, they did not use the tools available in their accounting systems
accordingly. The questionnaires used the accounting tools offered by the accounting
literature reviewed by the authors in 1994. For each accounting tool6, Foster and Gupta
(1994, p. 66) asked: (1) “How important an accounting tool potentially is to your
decisions[?]”; and, (2) “How frequently you currently use an accounting tool from your
existing accounting system[?]”. Foster and Gupta (1994, p. 66) sought responses on a
scale of 1 “not important at all” to 5 “very important” and identified significant
differences between the responses to the first and the second question – for each type of
marketing decision (see Table 2-6).
There is little research on the causes for the poor interaction between marketing
and accounting (De Ruyter and Wetzels 2000; Gleaves et al. 2008; McManus and
Guilding 2008). Some explain it through weaknesses in the academic education of each
functional area (e.g., Gleaves et al. 2008; McManus and Guilding 2008), others through
the relational attitude between marketing and accounting staff (e.g., De Ruyter and
Wetzels 2000).
Gleaves et al. (2008) after studying forty textbooks in marketing and accounting
disciplines, conclude that the concepts related to customer profitability, used by
marketing and accounting, do not coincide. There are also differences in both language
and methods used by both disciplines. The concept of customer lifetime value and
customer equity are not addressed in the main management accounting textbooks.
Although referred to in marketing textbooks, it is in different forms. Gleaves et al. (2008)
6 The 17 tools questioned by Foster and Gupta Ibid. were: “1. Fixed vs. variable cost breakdowns”; “2. Cost volume profit analysis”; “3. Fixed budgets”; “4. Flexible budgets”; “5. Product profitability analysis A. With only incremental costs allocated or traced to products B. With full costs allocated or traced to products”; “Customer profitability analysis A. With only incremental costs allocated or traced to customers B. With full costs allocated or traced to customers”; “7. Sales to expense ratio analysis”; “Standards and variance analysis for sales and revenue A. Sales mix B. Sales volume C. Market share D. Market size”; and “9. Standards and variance analysis for marketing costs A. Advertising costs B. Sales promotion costs C. Salesforce management costs D. Product specific marketing costs”.

LITERATURE REVIEW
77
argue that the situation limits communication, interaction and development of knowledge
between accounting and marketing and applications in practice. Furthermore, they note
that there is a silo mentality in both professions and a common language for customer
profitability analysis would help to overcome this situation (see also Ambler 2003b, p.
64)
Table 2-6 Role of Existing Accounting Tools in Marketing Decisions
Accounting Tool
Indicate how important each
of these accounting
tools potentially is to your decisions
Indicate how frequently you currently use
these accounting
tools from your accounting
systems
Information
Gap
(weighted)
Product profitability analysis with
full costs allocated or traced to
products
4.07 2.89 4.80
Standards and variance analysis for
sales and revenue: Sales volume 4.00 3.00 4.00
Sales to expense ratio analysis 4.00 3.02 3.92
Cost volume profit analysis 3.98 2.82 4.62
Standards and variance analysis for
sales and revenue: Sales mix 3.93 2.80 4.44
Fixed vs. variable cost breakdowns 3.89 2.84 4.08
Source: adapted from Foster and Gupta (1994, p. 67) Key: 1 - “not important at all”; 5 - “very important”.
McManus and Guilding (2008) also studied the customer accounting topic in
accounting and marketing literature. They identified significant differences between the
two literatures. They note that the marketing discipline is more interested in the topic of
customer accounting than the accounting discipline is. Accounting focuses more on
products, services and geographical areas than on customers. Accounting has a historical
perspective (looks at the past) and is inward oriented, which limits its ability to include
performance indicators focused on the customer, such as customer satisfaction and
customer loyalty. These differences in perspectives and language limit the interaction
CHAPTER 2
78
between the two functional areas. The authors suggest that a shift towards the “Horizontal
Organisation” (see Chenhall 2008) from functional structures to customer centred team-
based multi-functional teams can approach both disciplines.
De Ruyter and Wetzels (2000), in a survey covering 162 marketing and finance
managers from the Netherlands, tried to verify whether the relational attitudes between
marketing and finance managers had any bearings on other variables. They were
interested in the managers’ attitudes in the relations between financial and marketing
managers because, they argue, not a great deal is known about their interactions and this
functional interface is crucial for product-investment decisions, brand valuation, and
working capital, with impacts on a firm’s efficiency and profitability. De Ruyter and
Wetzels (2000, p. 210) identify various barriers to the marketing-finance interface:
• “focused on different stakeholders” – marketing focuses on customers,
suppliers, and competitors; finance focuses on the shareholders and on
other sources of capital;
• “brand valuation” – marketing managers like to include brand equity in the
assets and it results in lower returns on the capital employed;
• “capital budgeting” – many investment decisions are based on discounted
cash flows (DCF) criteria and, as marketing DCF are volatile due to
market turbulence, it reduces the capital investments in marketing;
• “working capital” – as marketing pushes for higher stocks – to avoid
disruptions in serving customers – it requires more working capital
investments, resulting in higher financing costs.
De Ruyter and Wetzels (2000) claim that the marketing-finance attitude is
positively related to mutual resources dependence (e.g., information, tasks or skills),
procedure fairness (e.g., impartiality and consistency in decisions) and negatively related
to inter-functional rivalry (e.g., budget discussions). The results do not support two other
initial hypotheses, i.e., the negative relationships between relational attitude and
communication difficulties or inter-functional physical distances. The finding that
communication difficulty is not a significant barrier to relational attitudes between
marketing and accounting functions contradicts the argumentation from other research
(Gleaves et al. 2008; McManus and Guilding 2008).
In conclusion, the above described studies suggest that there are difficulties in the
interaction between marketing and accounting and that businesses would benefit if these
LITERATURE REVIEW
79
two functional areas collaborate more assiduously. It also notes the lack of qualitative
studies that explain how the two functional areas interact, as well as the barriers for the
marketing-accounting interaction.
In the following section a summary of the main topics reviewed in the literature of
both management accounting and marketing is presented.
2.6 Conclusion
This research is in line with the research of Foster and Gupta (1994), Hall (2010) and
O’Sullivan et al. (2009). It has three objectives which complement previous research: (1)
to update the knowledge about the marketing managers' perspective regarding the
usefulness of accounting information; (2) to gain knowledge about the perspective of
accountants – both financial and managerial – regarding their role and their responsibility
in supporting the managers of marketing with accounting information as well as how the
information is communicated; and (3) to explain which factors are in practice preventing
the use of accounting information by managers, including marketing and sales managers –
i.e., to explain the “information gap” identified by Foster and Gupta (1994, p. 65)
between the desire to use accounting information (and tools) and its actual use by
marketing executives.
The review of the literature suggests that further research is needed to understand
why and how marketing managers are communicating and using accounting information
in managerial work (see Simons 1995b, p. 11). This is so because there are few empirical
studies covering the use of accounting information by managers, and none of these
existing studies focus on how marketing managers, in particular, are using accounting
information (see Hall 2010).
It is also concluded, from the literature review, that more research is required to
understand the role and responsibility of the accounting department in the process of
generating, communicating and analysing accounting information oriented to marketing
management (see Foster and Gupta 1994; Gleaves et al. 2008; Hall 2010). There is a need
to understand the process of communicating the accounting information, and to
understand the importance of verbal communication and interactive analysis of data –
with the involvement of different functional managers, including those from marketing
and accounting departments (see Hall 2010; Simons 2000).
The concept of management accounting emerged with Simon et al. (1954) and was
characterised at that time as having the function of “scorekeeping”, “problem solving”
CHAPTER 2
80
and “attention direction” (Shank 1989). Over the past 25 years it has intended to
contribute systematically to support the strategic management of the business (see
Bromwich and Bhimani 1994; Kaplan 1983; Kaplan and Norton 1996a, b; Roslender and
Hart 2002; Shank and Govindarajan 1992, 1993; Simons 1987a, 1990). These
developments, in addition to developing business planning techniques, cost management
and management control oriented within the company (Cooper and Kaplan 1988b;
Johnson 1992; Kaplan and Norton 1996a; Simons 1995b), also stimulated the
management accounting to look outside the firm, i.e., competitors, customers and market
(Bromwich and Bhimani 1989, 1994; Govindarajan and Shank 1992; Shank 1989; Shank
and Govindarajan 1988a, 1993). As a result of this research and management education
orientation – particularly in the area of management accounting and management control
systems – one would expect that both the market orientation and strategic management
perspective were present in management accounting in practice (Lord 1996).
Consequently, interdisciplinarity and interaction would also be expected (Roslender and
Hart 2002) – in research and management education – between the functional areas of
accounting and marketing (Bromwich and Bhimani 1994; Roslender and Hart 2002,
2010; Wilson 1995).
However, several studies report three situations that deviate from the foregoing.
First, that accounting in practice still continues with a traditional perspective, i.e., focused
within the company and essentially analysing the past events (Bromwich and Bhimani
1994; Langfield-Smith 2008; McManus and Guilding 2008; Shank 2006). Second, there
is little interaction between accounting and other functional areas (e.g., marketing) and
accounting is still very much like a silo culture (Shank 2006). Third, although marketing
discipline shows an interest in including more financial metrics in performance
measurement (Barwise and Farley 2004; Lehmann 2004; Stewart 2009; Webster Jr et al.
2005), accounting has not progressed at the same pace (Bates and Whittington 2009;
McManus and Guilding 2008). The interaction between these two areas has been difficult,
both in theory and in practice (Bates and Whittington 2009; Gleaves et al. 2008;
McManus and Guilding 2008; Roslender and Hart 2010). As a result of all that has been
said, there is a difference between what marketing managers would like to have in terms
of accounting information (for performance measurement or for decision support) and
what they have available and actually use (see Table 2-5 and Table 2-6) (Foster and
Gupta 1994). The situation contrasts strongly with the proposals very much present in the
accounting literature (see Section 2.3) and it seems to have forgotten the “motto” or the
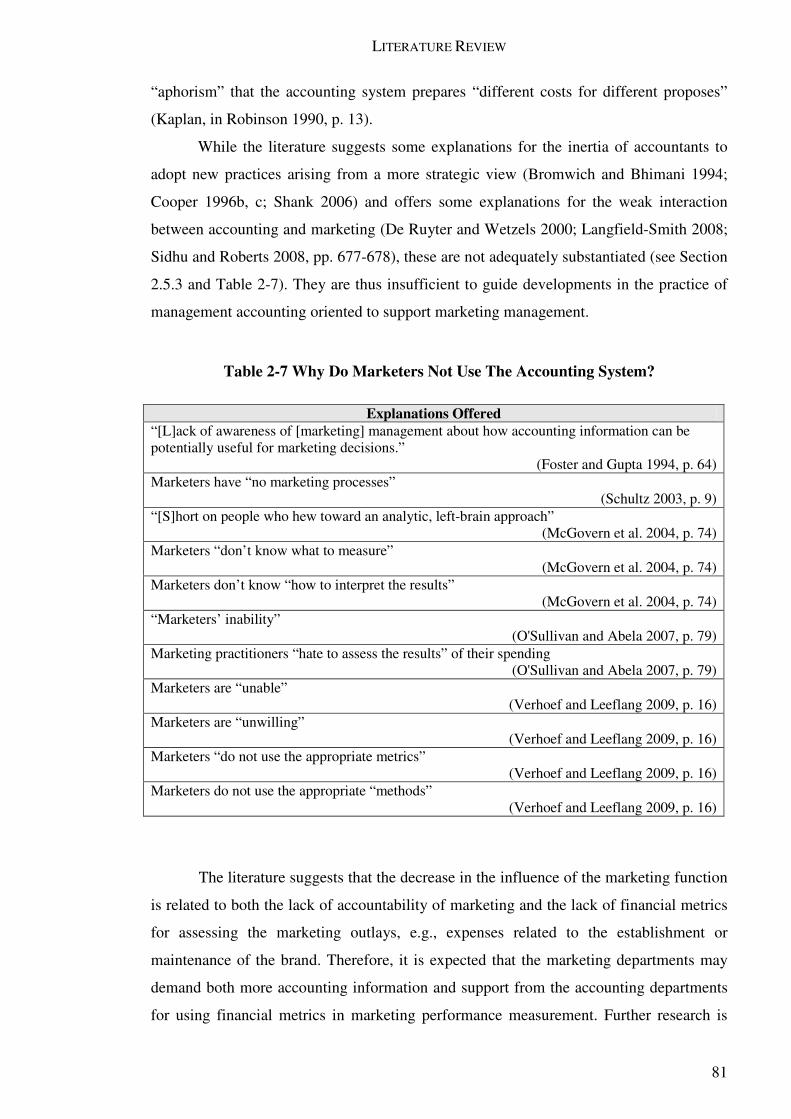
LITERATURE REVIEW
81
“aphorism” that the accounting system prepares “different costs for different proposes”
(Kaplan, in Robinson 1990, p. 13).
While the literature suggests some explanations for the inertia of accountants to
adopt new practices arising from a more strategic view (Bromwich and Bhimani 1994;
Cooper 1996b, c; Shank 2006) and offers some explanations for the weak interaction
between accounting and marketing (De Ruyter and Wetzels 2000; Langfield-Smith 2008;
Sidhu and Roberts 2008, pp. 677-678), these are not adequately substantiated (see Section
2.5.3 and Table 2-7). They are thus insufficient to guide developments in the practice of
management accounting oriented to support marketing management.
Table 2-7 Why Do Marketers Not Use The Accounting System?
Explanations Offered “[L]ack of awareness of [marketing] management about how accounting information can be potentially useful for marketing decisions.”
(Foster and Gupta 1994, p. 64) Marketers have “no marketing processes”
(Schultz 2003, p. 9) “[S]hort on people who hew toward an analytic, left-brain approach”
(McGovern et al. 2004, p. 74) Marketers “don’t know what to measure”
(McGovern et al. 2004, p. 74) Marketers don’t know “how to interpret the results”
(McGovern et al. 2004, p. 74) “Marketers’ inability”
(O'Sullivan and Abela 2007, p. 79) Marketing practitioners “hate to assess the results” of their spending
(O'Sullivan and Abela 2007, p. 79) Marketers are “unable”
(Verhoef and Leeflang 2009, p. 16) Marketers are “unwilling”
(Verhoef and Leeflang 2009, p. 16) Marketers “do not use the appropriate metrics”
(Verhoef and Leeflang 2009, p. 16) Marketers do not use the appropriate “methods”
(Verhoef and Leeflang 2009, p. 16)
The literature suggests that the decrease in the influence of the marketing function
is related to both the lack of accountability of marketing and the lack of financial metrics
for assessing the marketing outlays, e.g., expenses related to the establishment or
maintenance of the brand. Therefore, it is expected that the marketing departments may
demand both more accounting information and support from the accounting departments
for using financial metrics in marketing performance measurement. Further research is

CHAPTER 2
82
required – particularly qualitative research – to understand if marketing managers are
demanding and using accounting information and how they do so.
Though the interpretative research contributes towards explaining (thick
explanations) how a priori relationships – identified in this chapter – work in specific
contexts (e.g., why marketing managers demand or do not demand accounting
information for marketing management), it has the potential to explore other
unanticipated reasons for marketing managers to use or not to use accounting information
and the role and contribution of the management accounting department (see Johnson and
Kaplan 1987, pp. 169-172; Lukka and Modell 2010). In addition to monitoring whether
the causes given in the literature, for the low interaction between marketing and
accounting, occur in these particular cases, it also has the potential to explore other
contextual and organisational factors that influence the use of accounting information by
managers of marketing.
The five quantitative studies covering marketing performance measurement,
marketing influence and business performance, analysed specific industries and particular
locations: business organisations from the US, high-tech firms from North America and
Europe, for-profit firms from the Netherlands and profit-based middle and large size firms
from seven industrialised countries (see Table 2-4). This qualitative research
(interpretative) complements the quantitative research published on these topics. It
compares two fashion retailing firms operating in Portugal, i.e., Dimoda and Modalfa,
observing and explaining how the marketing managers use accounting information and
how it contributes to the marketing role within these organisations. It is a contribution for
the extant literature as it explores the relevance of accounting information for marketing
management in two companies from the fashion retail sector (see Ambler 2003b, pp. 31-
32).
Moreover, it is interesting to note that in the accounting literature the perspective
of management accounting is to provide accounting information for current and strategic
decisions (e.g., Horngren 2004, p. 207). In proposing their tools and their models, the aim
is to improve the firm’s profitability and competitive position. On the other hand, in the
marketing literature, accounting information is perceived as a means for marketing to be
more influential; and through that influence, it positively contributes to the company's
performance by managing marketing activities – without however involving the use of
accounting information to directly identify opportunities and solve problems. The
marketing focus is on marketing performance measurement. Although it is noted that this
leads to better decisions, the underlying idea is to control the outcomes, not inputs or
LITERATURE REVIEW
83
processes. The marketing outlook for accounting information is more for control and less
for decision support (see Horngren 2004, p. 207). It is a subject that deserves more
research to understand the causes of the lack of focus on accounting information as a way
of contributing to problem diagnosis and decision support. There seems to be different
functional perspectives in the literature – marketing vs. accounting – on the role of
accounting information for marketing management.
It is also interesting to note that the first references to activity-based costing – to
manage costs and profitability – included concepts from marketing and sales. Apparently
these are proposals that could be of interest to marketing managers. It is curious that the
marketing literature does not develop these concepts and does not apply them in the
marketing domain. It is an aspect that motivates further research to understand if in
practice these proposals from management accounting are actually useful for current and
strategic marketing management or if there are other marketing management needs that
accounting has not perceived nor reciprocated.
When reviewing marketing literature, one gets the idea that it is important to use a
financial metric to calculate the value of the customer base (e.g., customer lifetime value
or customer base value). However, paying attention to both the findings of O'Sullivan et
al. (2009) and Simons’ (1995b) model, one is left with a different idea. It may be more
important to use a diverse set of indicators (O'Sullivan et al. 2009) that dynamically
adjusts to the business context, i.e., interactive control systems (Simons 1995b). This is a
topic that is not clear in the literature and which this research can contribute to: the extent
to which accounting should focus on developing financial metrics based on discounted
cash flows to assess marketing performance, or develop holistic, flexible and adaptive key
performance indicators as suggested in Simons’ (1995b) model.
Finally, there is a need of more practical research in strategic management
accounting (see Simons 1995b, p. 11). Tillmann and Goddard (2008, p. 81) note that
studies conducted in the framework of strategic management accounting “throw little
light on how SMA practices are implemented and used in practice and provide no
theoretical explanation of such practices”.
Summarising, the research topic of this dissertation (see Table 2-8) follows and it
is justified by three independent pathways. First, there is need to understand what is
limiting, in practice, the development of accounting with a strategic perspective and
constrains the use of accounting information by marketing managers. Second, there is a
need to better understand how accounting information is produced, transmitted and used
by managers, particularly managers of marketing. Third, how marketing managers want
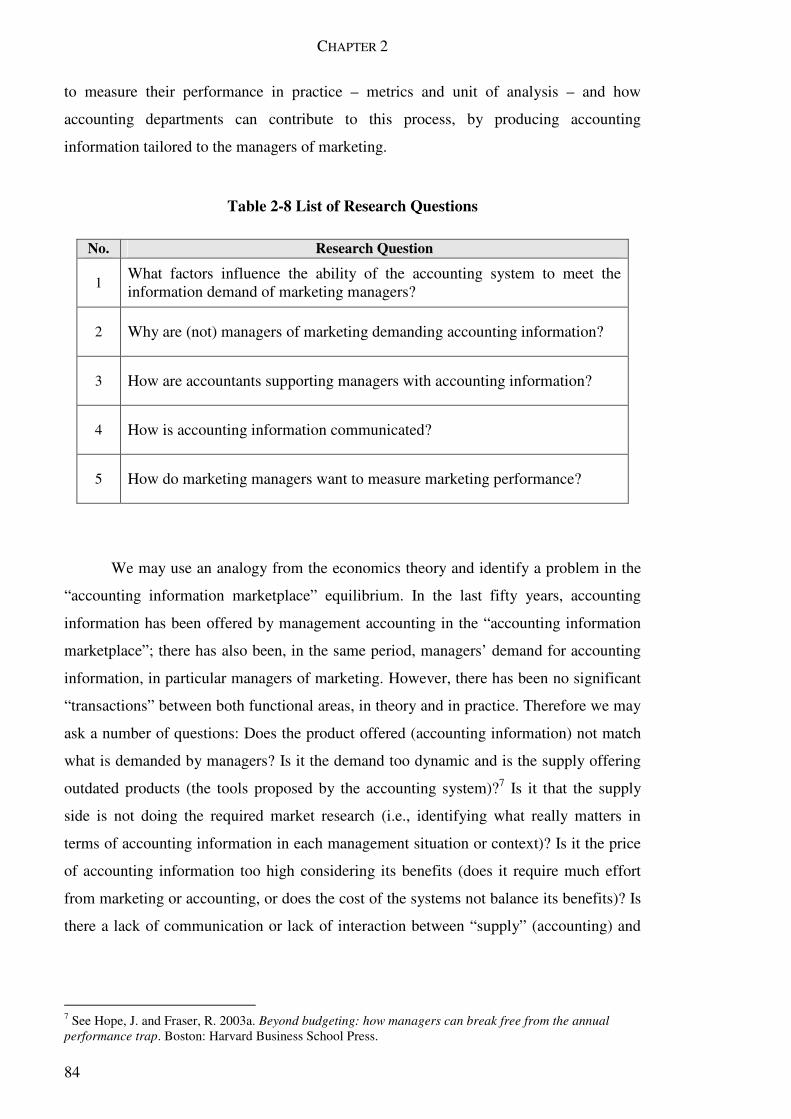
CHAPTER 2
84
to measure their performance in practice – metrics and unit of analysis – and how
accounting departments can contribute to this process, by producing accounting
information tailored to the managers of marketing.
Table 2-8 List of Research Questions
No. Research Question
1 What factors influence the ability of the accounting system to meet the information demand of marketing managers?
2 Why are (not) managers of marketing demanding accounting information?
3 How are accountants supporting managers with accounting information?
4 How is accounting information communicated?
5 How do marketing managers want to measure marketing performance?
We may use an analogy from the economics theory and identify a problem in the
“accounting information marketplace” equilibrium. In the last fifty years, accounting
information has been offered by management accounting in the “accounting information
marketplace”; there has also been, in the same period, managers’ demand for accounting
information, in particular managers of marketing. However, there has been no significant
“transactions” between both functional areas, in theory and in practice. Therefore we may
ask a number of questions: Does the product offered (accounting information) not match
what is demanded by managers? Is it the demand too dynamic and is the supply offering
outdated products (the tools proposed by the accounting system)?7 Is it that the supply
side is not doing the required market research (i.e., identifying what really matters in
terms of accounting information in each management situation or context)? Is it the price
of accounting information too high considering its benefits (does it require much effort
from marketing or accounting, or does the cost of the systems not balance its benefits)? Is
there a lack of communication or lack of interaction between “supply” (accounting) and
7 See Hope, J. and Fraser, R. 2003a. Beyond budgeting: how managers can break free from the annual
performance trap. Boston: Harvard Business School Press.
LITERATURE REVIEW
85
“demand” (marketing managers), and therefore no opportunity for “negotiation”?8 These
are the sort of questions that motivate the formulation of the research questions (see Table
2-8) of this empirical study in the domain of management accounting and marketing
management.
8 See Shank, J. K. 2006. Strategic cost management: upsizing, downsizing, and right (?) sizing. In: Bhimani, A. ed. Contemporary issues in management accounting. Oxford: Oxford University Press, pp. 355-379.

CHAPTER 2
86
87
CHAPTER 3 RESEARCH METHODOLOGY
3.1 Introduction
In this chapter, the research methodology used to answer the research questions is
described and justified, while the manner in which the data was gathered and analysed
through the field work is also explained. Section 3.2 explains why a qualitative research
approach was followed. The Section 3.3 explains why both the use of comparative case
studies and interpretative research were considered as the most appropriate methods for
understanding why and how marketing managers use accounting information, their
motivations and the factors that contribute or hinder use of the accounting system. The
last sections explain why the two companies (Dimoda and Modalfa) were selected
(Section 3.4), the data collection techniques (Section 3.5) and the process for analysing
the data (Section 3.6).
3.2 Qualitative Research
Qualitative research is “grounded in a philosophical position which is broadly
‘‘interpretivist’’ in the sense that it is concerned with how the social world is interpreted,
understood, experienced, produced or constituted” (Mason 2002, p. 3). The data is
collected and analysed considering the social contexts where it is produced and involves a
holistic analysis of phenomena with its contextual details and complexities (see Mason
2002). Denzin and Lincoln (2011, p. 3) define qualitative research as:
“[A] situated activity that locates the observer in the world. Qualitative research consists of a set of interpretative, material practices that make the world visible. These practices transform the world. They turn the world into a series of representations, including field notes, interviews, conversations, photographs, recordings, and memos to the self. At this level, qualitative research involves an interpretative, naturalistic approach to the world. This means that qualitative researchers study things in their natural settings, attempting to make sense of or interpret phenomena in terms of the meanings people bring to them.”
The aim of the present research is to understand the motivations of the marketing
managers to use accounting information, how they use the accounting information and
how the accounting departments contribute to it. The research attempts to understand the
perspective of the agents (accounting and marketing managers) regarding the usefulness
CHAPTER 3
88
of accounting information for management (“emic”), however, at the same time to
explain the external factors that influence (cause) the agents to use (or not use) accounting
information (“etic”) (Kakkuri-Knuuttila et al. 2008). Qualitative (interpretative) research
was considered the most appropriate for answering these research questions because only
by observing and establishing conversation with these managers, from the marketing and
accounting departments, it would be possible to understand their motivations, experiences
and personal interactions – with all their richness, complexities and particularities. Mason
(2002, p. 1) enumerates the advantages of qualitative research in this respect:
“Through qualitative research we can explore a wide array of dimensions of the social world, including the texture and weave of everyday life, the understandings, experiences and imaginings of our research participants, the ways that social processes, institutions, discourses or relationships work, and the significance of the meanings that they generate. We can do all of this qualitatively by using methodologies that celebrate richness, depth, nuance, context, multi-dimensionality and complexity rather than being embarrassed or inconvenienced by them. Instead of editing these elements out in search of the general picture or the average, qualitative research factors them directly into its analyses and explanations. This means that it has an unrivalled capacity to constitute compelling arguments about how things work in particular contexts. More than that though, while not all qualitative researchers are on a mission to produce ‘‘the general picture’’ of how things work, the qualitative habit of intimately connecting context with explanation means that qualitative research is capable of producing very well-founded cross-contextual generalities, rather than aspiring to more flimsy de-contextual versions.” (emphasis in original)
The exploratory nature of this research requires a methodology not limited by pre-
conceived concepts and hypothetical relationships, which is a characteristic of the
quantitative (functionalist) research studies published on this topic (e.g., O'Sullivan et al.
2009; Verhoef et al. 2011). While quantitative research may be useful for testing theories
in controlled (natural science) contexts, it is very much limited in producing new
perspectives, theories or explanations in social contexts (social actors produced realities).
The ontological perspective of this study is that the social reality exists; and its existence
is independent of the mind of researchers or their actors. However, the social reality is
produced (constructed) by the social actors and influenced by the researchers, being so
dynamic and changing in space and time. The knowledge about social reality (potentially
changing) is obtained by interpretation; interpreted both by the social actors (social reality
felt and revealed by its constituent) and by the researcher – through observation and
reasoning about knowledge revealed by the observed social actors.
RESEARCH METHODOLOGY
89
Quantitative methods produce findings based mainly on statistical relationships,
and their explanations are based on a theory validated by statistical evidence, which does
not consider the human behaviour patterns as qualitative methods do (Thomas 2003).
Furthermore, Johnson (1992, p. 180) argues:
“One consequence of business school scholars borrowing the theories and research paradigms of social scientists in other disciplines was their failure to develop an indigenous theory of business practice. They applied to business questions a theory that caricatured (badly) the dynamics of business.”
Still on the limitations of mathematical, statistical, or logical models to explain
social realities and their interactions, Ratzinger (2004, pp. 159-160) argues:
“For if the supreme point in the world's design is a freedom that upholds, wills, knows, and loves the whole world as freedom, then this means that together with freedom the incalculability implicit in it is an essential part of the world. Incalculability is an implication of freedom; the world can never – if this is the position – be completely reduced to mathematical logic.”
Generalisation is an aim of quantitative research, for it has the ability to produce
statistical generalisations (in determined contexts) from a representative sample. It is a
limitation sometimes attributed to qualitative research, due to the interpretative and
contextual perspective and the lack of both standardisation and potential for replication
(see May 1997; Zikmund 2010). However, Scapens (1990, p. 269) argues that case
studies can produce theoretical generalisations in a similar manner to experiments:
“Consequently, it is probably more appropriate to compare case studies with experiments, than with surveys; and to apply the logic of replication, rather than sampling logic, to case study research. This means viewing case study research as a method by which theories are used to explain observations. The theories which provide convincing explanations will be retained and used in other case studies, whereas theories which do not explain will be modified or rejected. The objective of individual case studies will be to explain the particular circumstances of the case, and the objective of a research programme to generate theories capable of explaining all the observations which have been made.”
Bryman and Bell (2007) argue that social sciences cannot use the same methods
as the natural sciences: the theories should come from the research (inductive, qualitative
research, interpretivism and constructionism), not something that precedes the research
(deductive, quantitative research, positivism and objectivism). As the aim of this research

CHAPTER 3
90
is to understand why and how marketing managers are using accounting information (the
agents’ understanding), the interpretative research (case study) was considered the most
appropriate for answering these types of questions (Kakkuri-Knuuttila et al. 2008); and
the semi-structured interviews an appropriate means for collecting data in organisational
contexts (see Yin 2009). Moreover, Merchant and Van der Stede (2006), using the
arguments of Kasanen et al. (1993) and Flyvbjerg (2001), suggest that field work, even in
small organisations, has the potential to identify innovations and contribute to the
generation of new theories in the field of management accounting. In this regard,
Merchant and Van der Stede (2006, pp. 123-124) say:
“All of these advances to the management accounting field originated in practice. To a large extent, they were developed either by company participants or consultants. They were later discovered by academics who engaged in scholarly writings about their applicability and value-adding potential. This observation is consistent with Kasanen et al.’s (1993) conclusion that most management accounting innovations have come from practice or consultants and not from academic research. It is also consistent with Flyvbjerg’s (2001, 83) conclusion that ‘‘small-N qualitative research is most often at the forefront of theoretical development.’’ As such, the contributions of small-N studies stem from describing the innovations in rich detail, challenging the rhetoric and assertions of practitioners, and linking the innovations to the greater existing body of knowledge.”
Further, regarding the potential of qualitative research, specially in case studies,
for the production of knowledge and new theories in management accounting, Cooper
and Morgan (2008, p. 159) claim:
“Examples of case study research in managerial accounting, auditing, and financial accounting illustrate the strengths of case studies for theory development and their potential for generating new knowledge.”
Finally, regarding criticisms made about empirical research, Merchant and Van
der Stede (2006, p. 131), referring to Zimmerman (2001, pp. 419-420), comment:
“Even the harsh field research critic Zimmerman (2001, 419–420) observes that ‘‘probably the single biggest factor hampering empirical managerial research is the lack of consistent data about what firms do internally.’’ But where will the needed data come from? Companies will generally not publish their internal data unless they are legally mandated to do so. They may reveal some of it by completing questionnaires, but most managers do not like to spend time completing questionnaires. If these data are to be discovered, then most will have to be mined by researchers going to the companies and digging it out. This is exactly the field research process.”

RESEARCH METHODOLOGY
91
In this investigation, the research followed a qualitative methodology, for there
was a set of open questions but no hypothesis to validate. The generation of new
explanations or hypothesis – for why marketing managers demand accounting
information – was considered more important than testing existing theories. The
techniques used, i.e., semi-structured in-depth interviews, documents, archives and direct
observation, were in line with qualitative research (cf. Denzin and Lincoln 2011). The
data collected were detailed in nature – related to the factors that influence the ability of
the accounting system to meet the marketing managers’ demand of accounting
information, the MD’s power to influence decision making and the interactions between
the accounting and marketing departments – and captured by locally based fact gathering.
The process started with the recording of in-depth interviews in which the
marketing managers use of accounting information, the MI and the accounting
department’s support for the MD was explored. The in-depth semi-structured interviews
permitted the discovery and exploration of the motivations of the marketing managers to
use accounting information, and how they used it (understanding objective). It also
contributed to understand the interactions between marketing and accounting
departments, and the role of the accounting department in the use of accounting
information in marketing management. The writing of the case study was performed as
soon as all the interviews were completed. It enabled the use of visual memory and
inspirations from the site visits, and body language expressions noted during the
interviews.
There was an effort to be “richly detailed and descriptive of the context” with
“minimal editorial comments” (see Martin and Turner 1986, p. 145). This contributed to
the generation and identification of concepts, linking them to the extant theory whenever
appropriate. The concept discovery is a strategic process; it moves from real data to
abstract categories, labels or concepts. It is the placement of real life incidents in
constructed categories (see Martin and Turner 1986).
In the following section the choice of comparative case studies is justified, while
in Section 3.5, the data collection process is described.
3.3 Case Study Method
This research, in addition to seeking to understand the reasons that marketing managers
have to use accounting information, i.e., “Why is she/he demanding it?” – the manager’s
motivations for using the information from the accounting system (understanding); also
CHAPTER 3
92
seeks to explain the factors that influence the ability of the accounting system to meet the
managers’ demand of accounting information (explanation), i.e., “Why is she/he using
accounting information in that organisation?”, “Which organisational factors are
influencing the use of accounting information by marketing managers?” – reasons
external to the user and linked with the company’s structure, organisational behaviour,
values and culture. Therefore, the research seeks to understand the ways in which
information is used in practice and why – considering the personal motivations and the
organisational context. Scapens (1990, p. 264) suggest that case studies are appropriate in
these circumstances, saying:
“Case studies offer us the possibility of understanding the nature of management accounting in practice; both in terms of the techniques, procedures, systems, etc. which are used and the way in which they are used.”
And Kakkuri-Knuuttila et al. (2008) say:
“The interpretively oriented researchers often stress the value of storytelling as a natural way of communicating rich meaning structures and therefore value detailed narratives over general and abstract models.”
Bryman & Bell (2007) suggest that the epistemological nature of a particular
piece of research, in business management, can follow the constructionism perspective –
looking at the organisation as a product of dynamic interactions, in permanent
construction – or objectivism – looking at the organisation as a stable identity with a set
of values and rules lasting for long periods of time (a lifetime identity). In this research,
the ontological perspective adopted is constructionism, i.e., understanding each
organisation as a social construction, operating in a specific context oriented for particular
aims. In this regard, the investigation started without defining, at the outset, best practices
in the use of accounting information. The aim was to understand, during the interviews,
why managers had certain practices in the use of accounting information, their personal
explanations for this, and how they interpreted their relationships with the accounting
system. For example, when referring that they used the contribution margin to analyse the
profitability of sales, the interviewer sought to know what they defined as contribution
margin and what the purpose of their use was, how the calculation was made, the logic of
each manager, which were their personal interpretations. In another example, the non-
allocation of indirect costs to the level of product lines, the reasons for not doing this and
what they regarded as indirect cost were attempted to be understood, without prejudging
RESEARCH METHODOLOGY
93
during the interview with pre-established rules on the use of accounting information (see
Section 2.3.1). This approach enabled the discovery and identification of new forms of
using the accounting information in the practice of marketing management, in addition to
what is described in theory. In this regard, Merchant and Van der Stede (2006, p. 126)
state:
“We argue that field research can have a particularly valuable impact by either identifying new ideas or enhancing their scholarly exploration, or both, thereby furthering our understanding of relevant phenomena and better linking our research with practice.”
Qualitative research, using the case study method, is considered most appropriate
for analysing organisational systems and processes in the context where they operate, i.e.,
understanding specific business configurations in particular contexts, each one with its
own idiosyncrasies (cf. Scapens 1990; Yin 2009). The case study comparison was
selected, aiming at understanding and comparing how marketing managers from the two
organisations use accounting information, their motivations and the organisational
influences in the process of using accounting information by marketing managers (see
Table 2-8). This type of research has a potential to allow theoretical generalisations – e.g.,
about the use of accounting information by the marketing managers in specific contexts,
e.g., fashion retailing – which can be tested later on other settings and using the same
methods. In this respect, following Scapens’ (1990) classification,9 the present case study
research is exploratory; nevertheless with some explanatory power. Scapens (1990, p.
265) suggests that case studies are used as exploratory when:
“[c]ase studies can be used to explore reasons for particular accounting practices. As such, they represent preliminary investigations which are intended to generate ideas and hypotheses for rigorous empirical testing at a later stage. The objective is to produce generalisations about the reasons for accounting practices. The exploratory case study is a first step in such a project.”
And used as explanatory when (Scapens 1990, p. 265):
“[s]uch case studies attempt to explain the reasons for accounting practices. The focus of the research is on the specific case. Theory is used in order to understand and explain the specific, rather than to produce generalisations. If available theories do not provide convincing explanations, it may be necessary to modify them.”
9 Scapens (1990, p. 265) suggests that case studies can be used as “descriptive”, “illustrative”, “experimental”, “exploratory” or “explanatory”.
CHAPTER 3
94
Although it is considered in this research that the accounting department has the
responsibility to produce and communicate the accounting information – following what
is suggested by the accounting literature (cf. Drury 2009) – there is also the perspective
that the management accounting information results from the interactions between the
accounting department and different functional teams, organisational culture, institutional
and social contexts (cf. Agbejule and Jokipii 2009; Chenhall 2008; Tillmann and Goddard
2008). This conceptualisation of management accounting reinforces the choice of
qualitative research and the semi-structured interviews were consistent with the
epistemological (interpretivist) and ontological (constructionist) perspectives. Although
there was an initial list of questions, the richness of the method obtained new insights into
the use of accounting information by the marketing managers. The respondents often
answered the question asked, and then developed commentaries to issues that were not
foreseen at the outset of the question, but related to it, talking about their experiences,
perspectives, interpretations and expectations about the functioning of the accounting
system. For example, in this research, the case study method permitted the identification
of accounting practices – prescribed by the organisation – that were not seen as adequate
or best practice by the staff in their managerial work. In one case, the management
accounting department was focused on budgeting and cost control, but did not focus on
supporting operational decision making and profitability analysis – as it was desired by
the business unit manager.
The research questions (see Table 2-8) are of the type of “how” and “why”
questions, i.e., the research aims at understanding what factors influence the ability of the
accounting system to meet the managers’ demand of accounting information (Why are
marketing managers demanding accounting information? How are accountants supporting
managers with accounting information? How is accounting information communicated?).
For these types of questions, the case study is an adequate research method as referred by
Yin (2009, p. 4):
“There’s no formula, but your choice depends in larger part on your research question(s). The more that your question seeks to explain some present circumstance (e.g., ‘‘how’’ or ‘‘why’’ some social phenomenon works), the more that the case study method will be relevant. The method is also relevant the more that your questions require an extensive and ‘‘in-depth’’ description of some social phenomenon.”
Merchant and Van der Stede (2006) in this respect also suggest that the field
research gives an understanding of how things work, in addition to describing or

RESEARCH METHODOLOGY
95
identifying the causes of phenomena. In this regard Merchant and Van der Stede (2006, p.
118) say:
“Field research can be used to go beyond the questions of what (identification) and how (explanation) and into the question as to understanding why certain phenomena exist.”
When choosing the case study methodology, its limitations were borne in mind, in
particular the risks of validity and reliability (McKinnon 1988). The first was the
possibility of biased observations (Yin 2009). In this regard, the interviews were fully
recorded and the questions and answers were fully transcribed. The answers were
transcribed verbatim at the writing of the case studies; the intention was to clearly show
the original data collected. In the case studies chapters, i.e., chapters 5 and 6, the strategy
of being descriptive and oriented to answering the research questions was followed. The
comparison of cases and analysis is presented in Chapter 7.
The other possible bias, i.e., the interviewees’ bias, occurs while answering the
questions (see McKinnon 1988). In this regard, the strategy of multiple observations and
the tactic of probe questions were used. In each organisation, the same types of questions
were asked to other interviewees and the same question asked in two or three different
forms to the same interviewee, in order to obtain confirmation of the answer.
Documentary data – management reports and website information – were also used to
confirm the answers, whenever appropriate. The four anonymous visits to the stores were
also opportunities to check the validity of some answers related to the management of
marketing, e.g., products traded, promotions, prices, store decoration, number of
customers visiting the store and customer service. In some situations, the second
interview – after an interval of four months and full access to the external source of
information, i.e., the Informa DB's database – were the other strategies to counter the
third threat of data access limitations.
The research method, of multiple case-studies – using theoretical replication – was
not primarily designed to look for generalisation; it was designed at aiming to obtain a
deep understanding (exploring) about the use of accounting information by marketing
managers. Yin (2009, pp. 60-61), commenting about the multiple-case design, suggests:
“The first word of advice is that, although all designs can lead to successful case studies, when you have the choice (and resources), multiple-case designs may be preferred over single-case designs. Even if you can do a ‘‘two-case’’ case study, your chances of doing a good case study will be better than using a single-case design. Single-case designs are vulnerable if
CHAPTER 3
96
only because you will have put ‘‘all your eggs in one basket’’. More important, the analytic benefit from having two (or more) cases may be substantial.”
In the next section, the process of selection of cases is discussed and explained.
3.4 Selection of Cases
The cases of Dimoda and Modalfa were selected for several reasons. Firstly, they
belonged to a sector where the marketing function is relevant, i.e., the clothing sector (see
Ailawadi et al. 2009; Auty 1998; Webster and Weng 2008). Secondly, the possibility to
have access to and support from the companies’ senior managers. Thirdly, the
interviewer’s professional experience and expertise in both the apparel industry and
retailing. Finally the head offices and the management decision centres were located in
Portugal, therefore all functional directors – marketing, sales, and accounting – could be
accessed personally and interviewed face-to-face or on the phone whenever necessary.
Both companies, Dimoda and Modalfa, shared some characteristics that allowed a
comparison: (1) both companies were family based, though Sonae – the shareholder of
Modalfa – is a stock exchange listed company; (2) both business units belonged to a
group of companies; therefore, there was the possibility of comparing two cases with
professionalised management and delegation of responsibilities; (3) both Dimoda and
Modalfa had autonomy at the management level, i.e., the business unit directors were
responsible for the business unit management (in both companies, the business unit
directors proposed the budget to the board directors and managed the business by
objectives); and, (4) both companies were operating in very similar markets, i.e.,
women’s and men’s clothing, located on the outskirts of big towns.
It should however be noted that although the Dimoda case has a fragile financial
situation when compared with Modalfa, this was taken into account by both the
interviewees and the case narrative. This situation enriches the research as it allows the
comparative analysis of two companies in different financial situations – theoretical
replication. It also provides a richer learning – as we both learn from success and failure
situations. It also facilitates both the theoretical replication in further research and the
relevance of theoretical generalisation, as the business reality is formed by both
successful and unsuccessful cases.
RESEARCH METHODOLOGY
97
3.5 Data Collection
The data were collected through semi-structured in-depth interviews, emails, phone calls,
documental archives, management reports and direct observation. Twenty interviews
were performed10 and eighteen of them were tape recorded. Seventeen were face-to-face,
two, i.e., the M0111 and M09, were through video call, and one interview was through
phone call, i.e. the M10 (cf. Table 3-2 and Table 3-3).
The interviews were booked after obtaining authorisation from the company’s
CEO. The starting interviewees in each company were the business unit director, the
marketing director and the management accountant (i.e., the controller, as titled in the
observed companies). These managers were chosen first because they were the managers
who were related to the accounting system and the management of marketing; they were
therefore the principal object of research. These senior managers were interviewed to
obtain answers that could contribute to understanding how the marketing managers used
accounting information, how the accounting department contributed to it and the
perspective of the general manager regarding the MD’s responsibilities and performance.
The remaining interviews followed a respondent-driven sampling – i.e., snowball
sampling. It was decided after each interview which person would be interviewed next,
either for being considered relevant, or for complementing the data collected, or for
confirming – triangulate – the previous data collected. For example, if the interviewee –
the management accountant or the marketing and sales manager – mentioned that the
information system was a problem, and hindered both communication and the use of
accounting information, then an interview was organised with the director of information
systems. When the marketing manager stated that the connection with operations was
very important, then an interview with the director of operations was organised, and so
on. In Modalfa, the Brand Manager was contacted and interviewed, to supply additional
data, by indication of the Marketing Director who was substituted in June 2012 (see Table
3-3).
The process of interviewing and data collection started by contacting by email the
director-general (the general manager or the CEO) to schedule an exploratory meeting or
phone conversation where the research project was explained. The email explained that
the research focused on the interaction between marketing and accounting, and that the
aim of the research was to understand how marketing was using accounting information
10 Total time of interviews: 19 hours and 44 minutes 11 All interviews are coded. M01 is the interview with the Sonae’s Fashion Division Director-General
CHAPTER 3
98
in marketing management. Then, permission was asked to interview the marketing
director, the management accountant and the business unit director or sales director
(hereafter referred to as the commercial director, as he is called in the observed
companies). After the request, the director-general confirmed the acceptance of the
research and informed about the details for meeting the marketing director, the
management accountant and the business unit director. Interviews with the director-
general and the board member were also arranged in order to obtain a more
comprehensive view of the business and the strategic choices, as well as to triangulate
with the remaining interviews and thus increase the research reliability. The other
interviews developed according to respondent-driven sampling.
At the beginning of the meeting, the interviewer introduced himself and informed
those being interviewed about the interview time duration – it was said to be between 60
and 75 minutes, however this depended on interviewee willingness and availability to
speak – and the purpose of the interview. Specific details about the research aim,
methodology and expected results were not given – so as not to influence the
interviewees’ answers. They were informed that the research focused on the interaction
between accounting and marketing, and the management and the use of accounting and
marketing information by both departments.
Those being interviewed were assured that the dialogue given at the interview
would only be used for academic purposes. After the introduction, which lasted
approximately fifteen minutes, the interviewer asked permission from the interviewee to
record the conversation. All interviewees gave permission to record it. The interviews
started by asking the interviewee to say his or her name, position and function at the
organisation. They were also asked to briefly describe their typical working week and the
kind of decisions and issues handled; the aim of this was to understanding the context
where the manager worked and the problems she or he usually faced. During the
conversation, the aim was to obtain answers – directly or indirectly – to the following
questions:
- What are the business objective(s)? Why?
- What is your strategy? How do you justify it?
- What are the typical decisions that you make?
- What kinds of market information (from customers or competitors) do
you consider in your decision making process? Why?
RESEARCH METHODOLOGY
99
- Do you use accounting information? What types of information do you
use? Why? How often is that information provided?
- Do you control your activity? Why? How?
- Is the level of inter-functional interaction enough? Why?
- Do you control on whether the current decisions are aligned with
strategy? How? Why?
- How do you plan your activity? Why in this way?
- Did you recently change the information system? Why? What were the
results of this change?
After the interview, the interviewer briefly checked whether all the questions were
answered and further clarifications could be made regarding some particular questions.
The interviewer then asked those interviewed to express any other ideas, comments or
recommendations that they would like to contribute to the research. They were also asked
whether they considered the topic of the research relevant for management practice and
why. This was asked to obtain further insights from the context where the accounting
information was used. This interviewing strategy obtained new insights into the use of
accounting information by marketing managers, while guaranteeing an answer to the
research questions at the outset. The list had a number of core questions, but was flexible
enough to include other questions considered relevant in following the exploratory nature
of the research. The documents and reports were obtained from two main sources. The
detailed financial accounting information,12 from both the observed companies and their
competitors, was obtained through Informa DB.13 The other source was the companies’
archives. The management reports – produced annually to explain and complement the
financial accounts – were obtained through the management controller in each
organisation.
Four field visits to stores were made (see Table 3-1) in order to confirm that the
marketing decisions discussed in the interviews were implemented: two visits to the
Dimoda stores (Olivais and Freeport) and two visits to the Modalfa stores (Freeport and
Odivelas). These were anonymous visits which included buying experiences (see Table
3-1). The aim of these visits was to see the shop decoration, customer service, products,
price levels, promotions, affluence and type of customers. These experiences also helped
to better contextualise the topics discussed during the interviews. The design of data
12 Covering the fiscal years between 2006 and 2009 13 Member of the D&B WorldWide Network

CHAPTER 3
100
collection aimed at obtaining evidence which could support the analysis in order to
answer the research questions (see Table 2-8).
Table 3-1 Field Visits to Stores
Code Store Date Ticket Items V1 Modalfa Arroja 05/06/2011 160889 4 V2 Dimoda Spacio Shopping 21/11/2011 n.a. 2 V3 Modalfa Freeport 24/04/2012 089061 1 V4 Dimoda Freeport 24/04/2012 n.a. 0
Total 4 3 7
The first interviews in each organisation were scheduled to obtain information
directly related to the research questions. However, other executives could also be
included if they were considered to be relevant as a consequence of data collected during
the first interviews. At Dimoda, the Information System Director and the Non-Executive
Board Member were included, while at Modalfa, the Operations Manager and the
Commercial Manager were included. A second interview with the same interviewee was
booked in cases where the first interview was rushed, because of the interviewee’s
agenda, e.g., Modalfa Controller’s interview, or further evidence were required as a
consequence of the interviews with other managers, e.g., in the Dimoda Marketing
Manager, Controller and Business Unit Director interviews.
Table 3-2 Interviews in Dimoda
Code Position Date Archive Duration D01 Business Unit Director 28/02/2011 Recorded 39 min. D02 Marketing Manager 16/03/2011 Recorded 48 min. D03 Financial Accountant 16/03/2011 Recorded 72 min. D04 Controller 16/03/2011 Recorded 64 min. D05 Information System Director 01/04/2011 Recorded 82 min. D06 Retail Director-General 01/04/2011 Recorded 118 min. D07 Business Unit Director 12/07/2011 Recorded 49 min. D08 Marketing Manager 19/07/2011 Recorded 58 min. D09 Controller 02/11/2011 memos n.a. D10 Non-Executive Board Member 16/11/2011 Recorded 81 min. Total 10h 11m

RESEARCH METHODOLOGY
101
The interviews at Dimoda were conducted between February and November 2011
(see Table 3-2). The interviews at Modalfa took place between November 2011 and
September 2012 (see Table 3-3).
The interviewer made a conscious effort to intervene much less during the
interviews, giving the interviewees more time to answer “why” and “how” questions.
This practice resulted in interviews that added new insights into the use of accounting
information and its impact on marketing management. On some occasions, direct and
closed questions were used to confirm the content of earlier answers. In these situations,
the “how” and “why” questions were not used, for the explanations had already been
gained through spontaneous conversation.
Table 3-3 Interviews in Modalfa
Code Position Date Archive Duration M01 Director-General 23/11/2011 Recorded 68 min. M02 Marketing Director 13/12/2011 Recorded 89 min. M03 Fashion Controller 13/12/2011 Recorded 35 min. M04 Commercial Director 12/01/2012 Recorded 49 min. M05 Operations Director 18/01/2012 Recorded 108 min. M06 Financial Director 09/08/2012 Recorded 49 min. M07 Financial Accounting Director 21/09/2012 Recorded 95 min. M08 Fashion Controller 21/09/2012 Recorded 22 min. M09 Management Control Director 24/09/2012 Recorded 58 min. M10 Brand Manager 20/03/2013 memos n.a. Total 9h 33m
3.6 Data Analysis
The data analysed in this research were the interviews recordings, memos, management
reports, financial accounts, companies’ web sites and visits to the physical stores.
The audio records were indexed, transcribed, and translated. The indexes were
conducted by time line, for the topics and questions, and by questions according to the
topics of the research questions. In the time index, all topics discussed in the interview
were listed in a time line sequence, i.e., by minute and second (e.g., M05.0214). The
questions index was constructed using the full list of questions, identifying the specific
14 “M05.02” refers to the conversation in the interview M05 (Modalfa Operations Director) at minute 02.

CHAPTER 3
102
interview and the minute when the question was asked (e.g., D04.1915). These indexes
were useful for finding both the answers to specific types of questions and the
spontaneous observations from the interviewees, e.g., following the topic’s index.
At the first listening of the interviews’ records, it was written up all the topics
discussed during the conversation and created an indexed system. At the second listening,
it was written up all the questions asked – those planned and those that arose
spontaneously during the conversation – and created another index. Then the topics
covered in the interviews were grouped into distinct categories and four main groups were
analysed: the group of factors influencing the ability of the accounting system to meet the
information needs of managers; the group of the managers’ use of accounting
information; the group of marketing performance measurement topics; and the group of
the situation of the MD within the organisation. Finally, interviews were again listened to
confirm that all relevant answers and interpretations from the respondents were included
in the cases and considered in the analysis. This last listening of the interviews made it
also possible to check whether the explanations offered in the conclusion – resulting from
the analysis – were aligned with the evidence and the interviewees’ interpretations
collected during the fieldwork.
Two case studies were produced based on both the collected documental
information and interviews. The structure of both cases – linear-analytic and theory
building (see Yin 2009, pp. 176-178) – is very similar, which enabled a direct comparison
of the situations. In each case the shareholder company is identified and the overall
business group’s history, mission, culture, values, objectives and strategy are described.
Afterwards, the observed business unit is described, focusing on the marketing
management’s use of accounting information and MD’s influence in marketing
management. In both areas the links to the use of accounting information in each context
are identified. The business profitability, business objectives, accounting information for
marketing management and the factors influencing the use of accounting information
were considered in the area of the marketing management. The area related to the MD
situation included the MD’s organisation, planning, budgeting, assessment, stature and
influence within the organisation. The role of the accounting department and its
interactions with the MD were described throughout the cases.
A copy of the Modalfa case was sent to the Director-General of Modalfa, and a
copy of the Dimoda case was sent to the Non-Executive Board Member of Dimoda. Both
directors have confirmed, by email, the accuracy of the description. The verification and 15 “D04.19” refers to the question in interview D04 (Dimoda Controller) at minute 19

RESEARCH METHODOLOGY
103
confirmation, by senior executives of each organisation, of the authenticity and accuracy
of the facts reported and information transmitted, contributed to strengthen the reliability
of the case studies and the validity of the information reported.
The next three chapters contain the data collected. In Chapter 4, a description is
given of the fashion retail sector in Portugal in order to frame the two case studies in the
Portuguese fashion retail industry’s competitive context. In chapters 5 and 6, the case
studies are presented.

CHAPTER 3
104
105
CHAPTER 4 FASHION RETAIL IN PORTUGAL
4.1 Introduction
This chapter provides background information about the fashion retail sector in Portugal
in order to demonstrate its relative size and importance in the Portuguese economy. Next,
the chapter identifies and describes the business environment of the companies that are
the focus of empirical examination. In doing so, the chapter contributes to an
understanding of the competitive environment in fashion retail and contextualises the
tactical and strategic aspects discussed in each case that are observed and described in
chapters 5 and 6. Section 4.2 describes the fashion retail industry in the Portuguese
economy and its macroeconomic relevance. In the Section 4.3 the structure of the fashion
industry, the major companies, the market shares and sales growth are described. The
market dynamics and the changes taking place in the retailing sector are also described.
4.2 The Fashion Retail in Portugal
In 2010, the Portuguese gross domestic product was €172.5 billion and the private
consumption €115.2 billion;16 from this amount, €27 billion was private consumption of
non-durable and non-food goods, €53 billion of services, and €20.4 billion of food and
beverages.17 The activity from wholesale and retail trade, repair of motor vehicles and
motorcycles contributed with €20 billion.18 The clothing retail sales amounted to €4.1
billion,19 representing 15% of the Portuguese private consumption of non-durable non-
food goods and 2.4% of gross domestic product, in 2010.
In 2008 there were 13,954 companies operating in this sector.20 The sector
configuration changed between 2008 and 2010, becoming much more concentrated (see
Table 4-1). The concentration of the sector is explained by three main factors.21 Firstly,
the economic recession led to a drop in demand, which caused pressure on selling prices,
causing reductions in the average price, reductions in sales volumes and lower profit
margins, thereby occurring the closure of isolated and less competitive shops. Secondly,
competition from low-cost international brands, supermarkets and hypermarkets displaced
customers from sole trader street shops to specialised chain stores and hypermarkets; and, 16 Bank of Portugal, 2010 Annual Report 17 INE (Statistics National Institute of Portugal) 18 INE (Statistics National Institute of Portugal) 19 DBK Sectorial Report, 5th Ed., January 2011 20 DBK Sectorial Report, 5th Ed., January 2011
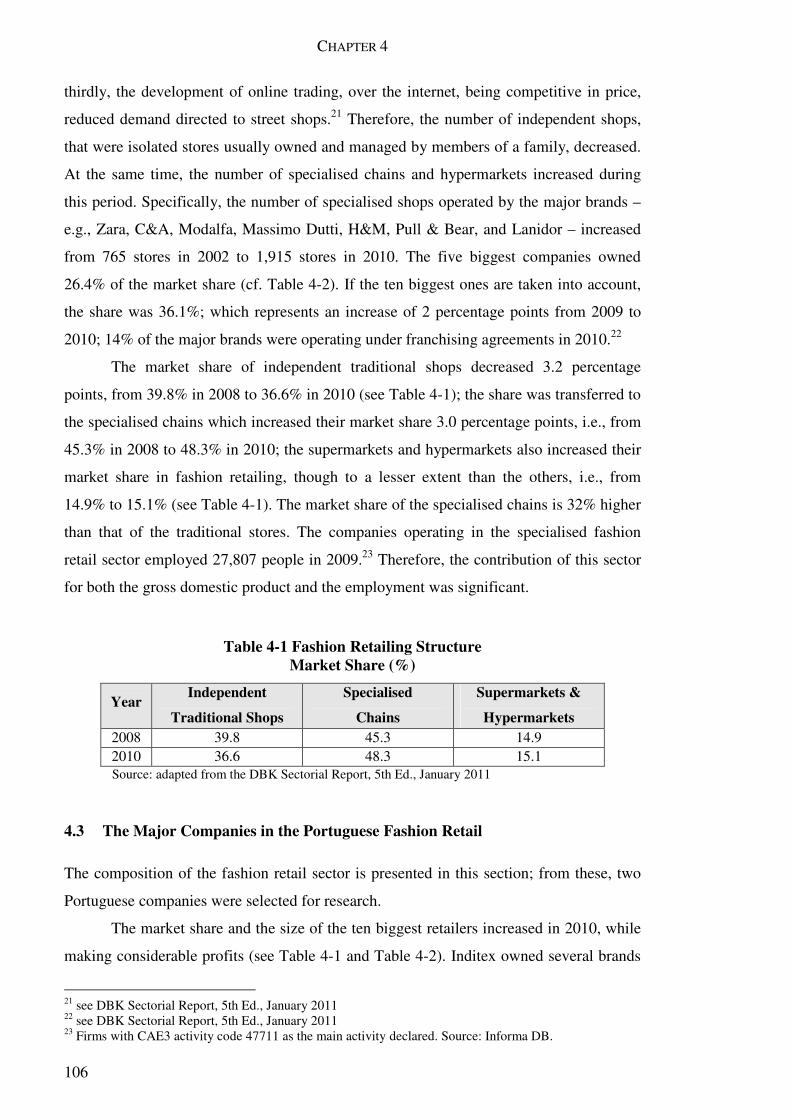
CHAPTER 4
106
thirdly, the development of online trading, over the internet, being competitive in price,
reduced demand directed to street shops.21 Therefore, the number of independent shops,
that were isolated stores usually owned and managed by members of a family, decreased.
At the same time, the number of specialised chains and hypermarkets increased during
this period. Specifically, the number of specialised shops operated by the major brands –
e.g., Zara, C&A, Modalfa, Massimo Dutti, H&M, Pull & Bear, and Lanidor – increased
from 765 stores in 2002 to 1,915 stores in 2010. The five biggest companies owned
26.4% of the market share (cf. Table 4-2). If the ten biggest ones are taken into account,
the share was 36.1%; which represents an increase of 2 percentage points from 2009 to
2010; 14% of the major brands were operating under franchising agreements in 2010.22
The market share of independent traditional shops decreased 3.2 percentage
points, from 39.8% in 2008 to 36.6% in 2010 (see Table 4-1); the share was transferred to
the specialised chains which increased their market share 3.0 percentage points, i.e., from
45.3% in 2008 to 48.3% in 2010; the supermarkets and hypermarkets also increased their
market share in fashion retailing, though to a lesser extent than the others, i.e., from
14.9% to 15.1% (see Table 4-1). The market share of the specialised chains is 32% higher
than that of the traditional stores. The companies operating in the specialised fashion
retail sector employed 27,807 people in 2009.23 Therefore, the contribution of this sector
for both the gross domestic product and the employment was significant.
Table 4-1 Fashion Retailing Structure Market Share (%)
Year Independent
Traditional Shops
Specialised
Chains
Supermarkets &
Hypermarkets 2008 39.8 45.3 14.9 2010 36.6 48.3 15.1
Source: adapted from the DBK Sectorial Report, 5th Ed., January 2011
4.3 The Major Companies in the Portuguese Fashion Retail
The composition of the fashion retail sector is presented in this section; from these, two
Portuguese companies were selected for research.
The market share and the size of the ten biggest retailers increased in 2010, while
making considerable profits (see Table 4-1 and Table 4-2). Inditex owned several brands
21 see DBK Sectorial Report, 5th Ed., January 2011 22 see DBK Sectorial Report, 5th Ed., January 2011 23 Firms with CAE3 activity code 47711 as the main activity declared. Source: Informa DB.

FASHION RETAIL IN PORTUGAL
107
in Portugal (Zara, Pull & Bear, Bershka, Stradivarius, Oysho, and Uterqüe) and was the
market leader with 13.4% of market share, selling €555 million in 2010 (cf. Table 4-2).
The Grupo Regojo (the owner of Dimoda) came in the seventh position with €85 million
of consolidated sales and 2.1% of the market share in 2010 (cf. Table 4-2). However the
1% return on investment24 (ROI) ranked among the lowest, and the €-6.63 million of net
profit (loss) was the worst in this group of companies.
The group of the five companies with the highest returns on both investment and
equity was comprised of three multinationals, i.e., Inditex, C&A and H&M and two
Portuguese companies, i.e., Modalfa (the second case study) and Lanidor (see Table 4-2).
Table 4-2 Top 10 Fashion Retailers in Portugal
Company
Sales
2010
€ million
Sales
Growth
2010
%
Market
Share
2010
%
Publicity
Expenses
% Sales
2009
ROI
2009
%
ROE
2009
%
Inditex 555 4.6 13.4 0.0425 1825 54.325 El Corte Inglés 180 5.9 4.4 n.a. 3.2 2.4 Modalfa 120 4.3 2.9 2.37 32.4 66.5 C&A 12026 7.7 2.9 1.27 24.6 72.5 Cortefiel 115 14.3 2.8 1.33 n.a. n.a. Continente 95 10.5 2.3 n.a. 3.9 4.1 Grupo Regojo 85 2.6 2.1 0.6127 1.0 n.a. H&M 80 14.3 2.0 n.a. 29.3 51.1 Lanidor 70 2.9 1.7 1.80 9.9 6.1 Calzedonia 65 3.8 1.6 1.64 0.9 -5.0
Source: adapted from the Informa DB database
The biggest brands, among the specialised chains of the fashion business, had a
very different pattern of publicity expenses as percentage of sales, i.e., from 0.04% in
Zara to 2.37% in Modalfa. Among the Portuguese brands (see Appendix 1), the two
extremes were Dimoda with the lowest (0.8%) and Modalfa with the highest (2.37%).
The selection of the two cases for this research (i.e., Dimoda and Modalfa) resulted from
a “theoretical replication” (see Yin 2009, p. 54) which selected two companies that show
some contrast in publicity expenses, growth and ROI.
24 ROI = (Operational Profit + Interest Received) / Total Assets 25 At Zara brand. 26 It is different from the amount reported by Modalfa’s 2010 Management Report. 27 At Massimo Dutti brand.

CHAPTER 4
108
4.4 The Selected Companies
The companies were selected taking into account that the various functional managers
(director-general, business unit director, marketing and commercial directors,
administrative services director, financial accountant and management controller) should
be available for face-to-face interviews. The frequent access to the facilities, both stores
and head-office, was also considered a critical aspect for the field work. Two companies
located in Portugal were therefore chosen. If, instead, the boardroom directors of the
business were located outside the Portuguese territory, it would have been more difficult
to accede to them and interview the executives responsible for strategic choices and
organisational structure, e.g., decisions regarding the marketing mix (see Appendix 2),
decisions on the MD structure, or decisions related to financial accounting processes and
management accounting reporting.
Two companies were selected: one company with the maximum of publicity
expenses, another with the minimum – when compared to other companies from the
fashion retail sector. The selection was conducted as such in order to understand whether
the levels of publicity expenses were explained by the capacity of the marketing managers
to negotiate with the general managers the amounts of the marketing budget (see
O'Sullivan et al. 2009, p. 856). While using the publicity expenses, the research aimed at
understanding, in the observed cases, the relationships between the size of the marketing
budget, the MD influence (see Appendix 2), and the capacity of the MD to use accounting
information to measure the marketing performance, e.g., the contribution of the MD
activities (see Appendix 2) to the firm’s profitability (see O'Sullivan et al. 2009, p. 856).
The first case, Dimoda Difusão Internacional, Lda., is a Portuguese family owned
company that has been operating in the fashion retail industry since 1984. It belongs to a
conglomerate of companies from the GR, which has been operating in Portugal since
1919. In 2009, the group was the seventh biggest fashion conglomerate in Portugal,
holding 2.1% of the market share with a turnover of €85 million, while managing €94.2
million of net assets. The sales at the Dimoda business unit increased by 75% in the
period from 2005 to 2010; however, there was an enormous decline in profitability in
both 2009 and 2010 (cf. Table 5-4). In 2011, the company was struggling to increase sales
and produce cash flow.
The second case, Modalfa Comércio e Serviços, S.A. is a Portuguese company
that has been operating in the fashion retail industry since 1995. The company belongs to
the Grupo Sonae, which is a retail company with two major partnerships in shopping
FASHION RETAIL IN PORTUGAL
109
centres, real estate and telecommunications. In 2011, the company had a presence in 44
countries with 43,268 employees. Sonae was the food retail market leader in Portugal in
2010, with a turnover of €3,274 million; while in non-food stores the turnover was €1,272
million. Sonae is a partner of Grosvenor (UK) in the shopping centres real estate business.
The Modalfa business unit had a turnover of €107 million in 2009, which represented
2.9% of the market share; it employed 840 people and had 66.5% return on equity. The
annual average sales growth of the business unit between 2006 and 2009 was 13%.
The companies selected turned out to be quite different in several respects, notably
in: (1) the organisation and functioning of financial accounting; (2) the responsibility and
functions of the management accounting department; (3) the responsibility and autonomy
of the MD; (4) the use of accounting information; and (5) the sales growth and
profitability. This is described in chapters 5 and 6, and discussed in Chapter 7.

CHAPTER 4
110

111
CHAPTER 5 FIRST CASE STUDY: DIMODA
5.1 Introduction
In this chapter the Dimoda business is described. The chapter begins with a brief
contextualisation of Dimoda within the holding company, i.e., the GR. The Section 5.2
includes a brief history of the GR, followed by the description of GR’s mission, culture,
values, objectives and strategy. Afterwards, the relative position of Dimoda inside the GR
is described. After these sections, the business unit’s profitability and objectives are
described, and how managers of marketing use accounting information is explored. How
the MD is organised and controlled is also reported. Finally, the influence of the MD on
marketing management is discussed.
The main aim of this chapter is to understand how Dimoda managers of marketing
use accounting information, their motivations for using specific types of accounting
information and the factors that influence the ability of the management accounting
system to meet the managers’ demand of accounting information.
5.2 The Grupo Regojo
The GR is a family owned business. The head office is located in Lisbon, Portugal. The
core business is fashion retail (see Appendix 5). In the following sub-sections the history
of the group and the situation of the company in 2011 are described.
5.2.1 The History of Grupo Regojo
The GR was founded by José Regojo Rodriguez in 1919. He came to Lisbon at the age of
14 years old, from the Spanish region of Galiza, at the beginning of the 20th century. He
set up a company named J. R. Rodriguez and started manufacturing men’s shirts in a two-
storey workshop, employing 8 people. The business was developed and they also started
manufacturing pyjamas and polo shirts, increasing the number of employees to 300. In
1972 a new manufacturing company Confecções Regojo Velasco was founded by Mr.
Rodriguez’s son in law, Jaime Regojo Velasco. The new company started the production
of women’s clothing while launching the Dali brand. Mr. Jaime Regojo Velasco died in
1980 and his wife, Mrs. Teresa Regojo, has run the business since then. She set up a new
CHAPTER 5
112
company, Aissela, obtaining the representation of the Pierre Cardin (France) brand in
Portugal.
In 1984 the sons of Jaime and Teresa started the Dimoda business. Its main
activity was to represent and distribute several international fashion brands in Portugal. In
the 1990’s, faced with increasing competition both from the manufactured products in the
Far East and from the international brands that have franchise operations in Portugal,
Dimoda changed its business model. The company stopped selling as a wide multi-brand
shop and decided to sell a very limited number of brands – both franchised and their own
ones. In 1996, Dimoda opened mono-brand shops under the Pierre Cardin brand. In 2000,
the original women Dali brand started to be sold through Dimoda stores and, in 2005,
after closing the Pierre Cardin mono-brand shops, the Pierre Cardin brand was included in
the Dimoda stores too.
Other brands were managed in Portugal by the GR, e.g., Elena Miró, Massimo
Dutti (hereafter referred to as Dutti), Wesley, and Mango. In 2006 the Elena Miró shops
were sold to the international brand owner, Miróglio Group and the Mango business was
sold in 2007. In 2005 the group started a joint venture in order to represent the footwear
Hakei brand in Portugal; this business was sold off in 2007. The group acquired the
master franchise from Orchestra, i.e., baby clothing, selling it off in 2009. In 2006 the GR
acquired a significant share of Fashion Park, which traded the Nike Women and the Punt
Roma brands. Punt Roma was sold in 2008, and the GR started that same year the
Friday’s Project and the Nike Concept shops. The reasons for divesting in these brands
were diverse. The GR Non-Executive Board Member (hereafter referred to as Board
Member) explained:
“It was due to many factors. But we may have two big factors. […] First, it may be because these products do not fit the Portuguese market or are outdated; second, the excessive number of shopping centres; and the Grupo Regojo lost a lot with this. Suddenly, it was discovered in Portugal that the shopping centres were fabulous. Everyone started to build shopping centres, e.g., in Paços de Ferreira, Oliveira de Azemeis, Espinho, Aveiro,28 there are lots of shopping centres. If you are managing a brand, you have one doubt: Should I lose the opportunity to be in this centre? But if you are, you may not have enough market to sell in Aveiro and Oliveira de Azemeis [which are two nearby towns] at the same time; [e.g.,] we opened a Nike at Oliveira de Azemeis and it was a complete failure.”29
28 These are small and medium size cities, located on the country side. Inhabitants: Paços de Ferreira (56,327); Oliveira de Azeméis (68,825); Espinho (31,796); Aveiro (78,463). Source: INE, Census 2011 29 Interview with the Non-Executive Board Member on 16/11/2011 (D10.52)
FIRST CASE STUDY: DIMODA
113
The changes in business from multi-brand style stores to both mono-brand stores
and ownership of brands, resulted in a context where more involvement is expected from
the MD to support the brands owned by GR. The MD is expected to manage the brand
positioning and the communication of promotional activities, and the Marketing Manager
commented:
“Here [the marketing communication] is not about cost-benefit analysis. It is related rather to the brand image.”30
In the next section, the mission, culture and vison of GR is summed up.
5.2.2 Mission, Culture and Vision of Grupo Regojo
The company presented their mission as “We want to create and invest in businesses that
contribute to the construction of a fairer, human and civil society.”31 Aligned with this
mission, the GR aims at selling useful goods and services; at promoting the personal
development of employees; at creating economic value and stable jobs; at respecting the
environment, and supporting social projects.32 The Board Member clarified that a reason
for not closing some unprofitable businesses was more than a sentimental question, it was
to do with the core values of the company. The Board Member explained:
“In fact, we support the idea of sustaining, in a positive sense, as far as it will be possible, the manufacturing employees. Some are retiring, leaving for this reason. Probably in 2014 we will not have a manufacturing activity. We are neither renewing the equipment, nor people. The people are in their 60s, and as the seamstresses are retiring, we’ll gradually finish the manufacturing.”33
The organisation is based on a family business culture. The company desires to
stimulate, among the managers and directors, an attitude of responsibility, respecting the
managers’ autonomy.34 They expect that, through this culture, the managers become
empowered with motivation for managing the business “as if it were their own
business”.35 However, the autonomy of the departments was sometimes impaired because
of the economic interests at the level of the group's headquarters. For example, in the case
30 Interview with the Marketing Manager on 16/03/2011 (D02.23) 31 www.regojo.pt (accessed on 15/10/2011) 32 www.regojo.pt (accessed on 15/10/2011) 33 Interview with the Non-Executive Board Member on 16/11/2011 (D10.37) 34 www.regojo.pt (accessed on 15/10/2011) 35 www.regojo.pt (accessed on 15/10/2011)
CHAPTER 5
114
of Dimoda, the Board Member explained that the idea of autonomy for managing the
business units caused much discussion at the boardroom level. The Board Member
expressed:
“There are complicated issues here. The opening of a Dimoda shop [in a certain location] because we had there a Hakei or an Orchestra, which closed – and we had a contract with [landlord] Dolce Vita or Sonae Sierra, or any other – is related to the Group’s interest. It clashes many times with the business unit director [interest]. The business director would say ‘‘I would never open a shop here. It is not profitable’’ but the Group says ‘‘We have got this shop. We have to pay a monthly rent, which is not small. We can not close the shop because we may be sued. We need to put something here. We have not any other brand, [therefore] put Dimoda here.’’ ”36
The company presents its values as “[a]cting with justice, veracity and
professionalism. Having a passion for being industrious; respecting our commitments;
and, based on loyalty and solidarity, working with unity and harmony.”37 This working
environment was observed during the field visits: some managers showed their great joy
at working for the GR. For instance, the Marketing Manager said:
“I very much like being part of Grupo Regojo. I entered as an assistant for communication in 2001, I have been promoted and I believe that the board likes my work. I like Grupo Regojo very much; it has been 10 years [not 10 days].”38
Similarly, the Dimoda Business Unit Director declared: “This business and
working with my team is my passion!”39
5.2.3 Objectives and Strategy of Grupo Regojo
The main objectives of the GR’s Retail Director-General40 were both earnings before
interest, tax, depreciation and amortisation (EBITDA) and sales. The Director-General
stated:
“My objectives are: always getting EBITDA at the various retailing businesses (this is the main objective); in some starting brands the objective is the volume of sales.”41
36 Interview with the Non-Executive Board Member on 16/11/2011 (D10.16) 37 www.regojo.pt (accessed on 15/10/2011) 38 Interview with the Marketing Manager on 16/03/2011 (D02.08) 39 Interview with the Business Unit Director on 28/02/2011 (D01.03) 40 Hereafter, in this case study, referred to as Director-General
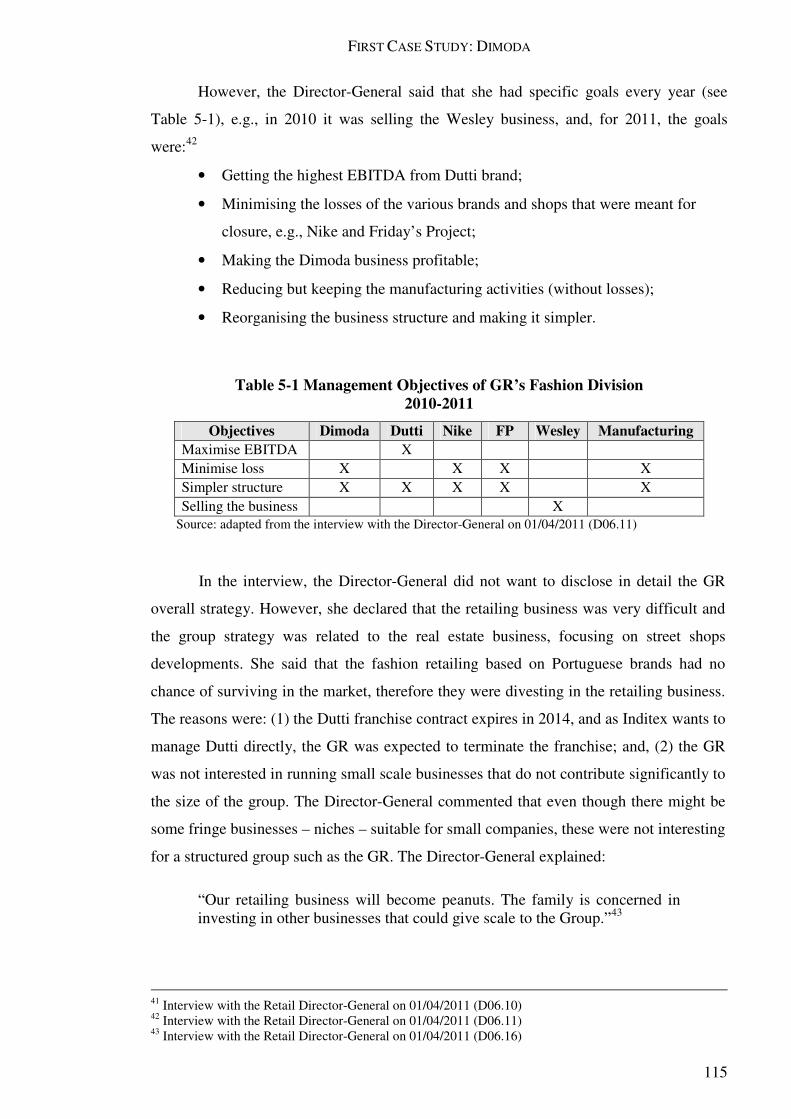
FIRST CASE STUDY: DIMODA
115
However, the Director-General said that she had specific goals every year (see
Table 5-1), e.g., in 2010 it was selling the Wesley business, and, for 2011, the goals
were:42
• Getting the highest EBITDA from Dutti brand;
• Minimising the losses of the various brands and shops that were meant for
closure, e.g., Nike and Friday’s Project;
• Making the Dimoda business profitable;
• Reducing but keeping the manufacturing activities (without losses);
• Reorganising the business structure and making it simpler.
Table 5-1 Management Objectives of GR’s Fashion Division 2010-2011
Objectives Dimoda Dutti Nike FP Wesley Manufacturing Maximise EBITDA X Minimise loss X X X X Simpler structure X X X X X Selling the business X
Source: adapted from the interview with the Director-General on 01/04/2011 (D06.11)
In the interview, the Director-General did not want to disclose in detail the GR
overall strategy. However, she declared that the retailing business was very difficult and
the group strategy was related to the real estate business, focusing on street shops
developments. She said that the fashion retailing based on Portuguese brands had no
chance of surviving in the market, therefore they were divesting in the retailing business.
The reasons were: (1) the Dutti franchise contract expires in 2014, and as Inditex wants to
manage Dutti directly, the GR was expected to terminate the franchise; and, (2) the GR
was not interested in running small scale businesses that do not contribute significantly to
the size of the group. The Director-General commented that even though there might be
some fringe businesses – niches – suitable for small companies, these were not interesting
for a structured group such as the GR. The Director-General explained:
“Our retailing business will become peanuts. The family is concerned in investing in other businesses that could give scale to the Group.”43
41 Interview with the Retail Director-General on 01/04/2011 (D06.10) 42 Interview with the Retail Director-General on 01/04/2011 (D06.11) 43 Interview with the Retail Director-General on 01/04/2011 (D06.16)
CHAPTER 5
116
At the same time, the Dimoda business unit has been focused on maintaining the
business, and in 2011 the aim was to achieve a positive cash flow, regardless of how
slight it might be, as in previous years this had been negative. In 2009 and 2010 the loss
before interest, tax, depreciation and amortisation (LBITDA) was €196,000 and €256,000
respectively. The Director-General explained the objectives for Dimoda in 2011:
“The objectives for Dimoda this year [2011] are: attaining a specific volume of sales and having a balanced cash flow [from operations]. The strategy for achieving this is to close some shops that are unprofitable, to reduce rents, to reduce some services in order to decrease their associated costs, and to promote exports.”44
The Director-General saw Dimoda as a brand which was selling in medium-low
rent shopping areas. She said that Dimoda was a brand that was not able to grow and
acquire larger market share. She commented that there was potential for growing, but
only in developing export markets, where brands like Dimoda could gain acceptance. She
explained that the company was competing with multinationals, and, in times of
economic difficulties, the multinationals are the only companies that can support margin
reductions, e.g., C&A, Inditex, Benetton, and H&M. These were the brands that were
experiencing high growth in the Portuguese market. One reason for this, she said, was that
these companies could offer very attractive promotions, out of the sales seasons, all year
round, because they has synergies and economies-of-scale. She gave the example of
Inditex which has teams of several designers working for the worldwide market. Talking
about the advantages of the competitors of Dimoda, the Director-General commented:
“They can also push the suppliers much more strongly than any other brand. They win by their size.”45
The Board Member considered the creation of a strong brand to be very difficult
in those circumstances. He explained that it was not viable, for the GR, to create a strong
brand in Portugal, because it is a small market and is flooded with strong international
brands. The Board Member also said that the GR did not have the resources to create
another brand like the strongest Portuguese ones, e.g., Lanidor or Salsa, because the GR
was not linked to the industry, as it was before, and as Salsa has been.
44 Interview with the Retail Director-General on 01/04/2011 (D06.13) 45 Interview with the Retail Director-General on 01/04/2011 (D06.21)
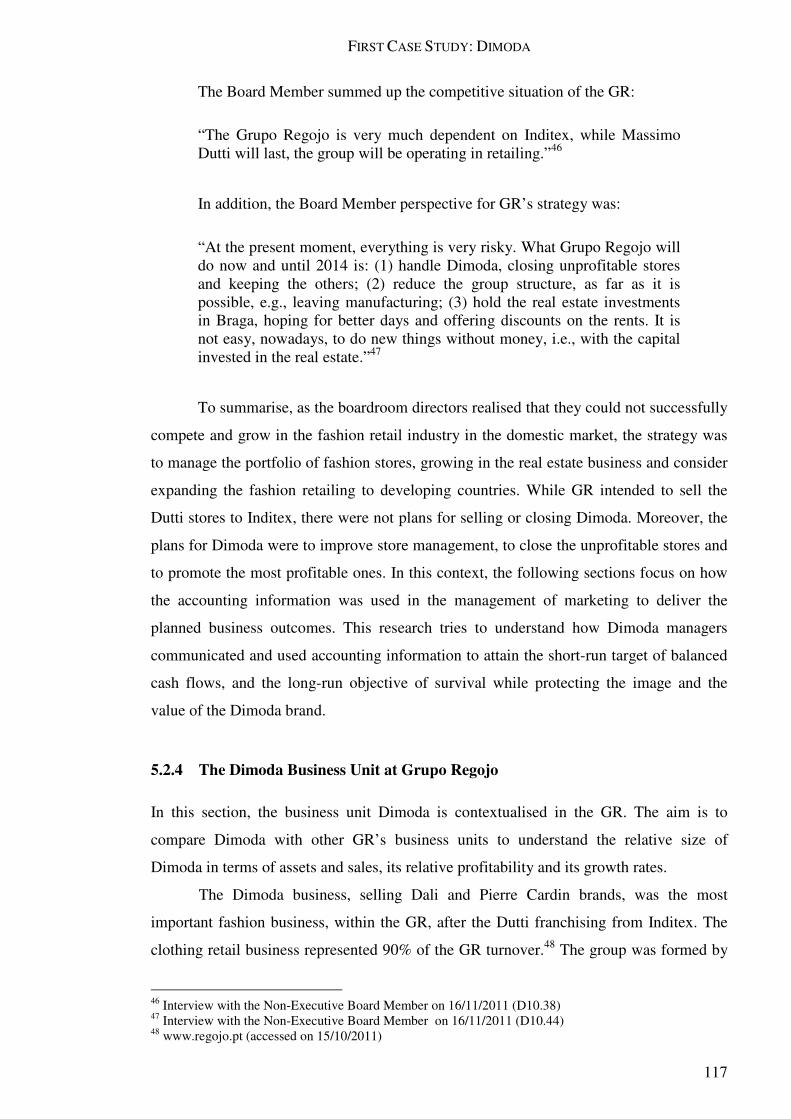
FIRST CASE STUDY: DIMODA
117
The Board Member summed up the competitive situation of the GR:
“The Grupo Regojo is very much dependent on Inditex, while Massimo Dutti will last, the group will be operating in retailing.”46
In addition, the Board Member perspective for GR’s strategy was:
“At the present moment, everything is very risky. What Grupo Regojo will do now and until 2014 is: (1) handle Dimoda, closing unprofitable stores and keeping the others; (2) reduce the group structure, as far as it is possible, e.g., leaving manufacturing; (3) hold the real estate investments in Braga, hoping for better days and offering discounts on the rents. It is not easy, nowadays, to do new things without money, i.e., with the capital invested in the real estate.”47
To summarise, as the boardroom directors realised that they could not successfully
compete and grow in the fashion retail industry in the domestic market, the strategy was
to manage the portfolio of fashion stores, growing in the real estate business and consider
expanding the fashion retailing to developing countries. While GR intended to sell the
Dutti stores to Inditex, there were not plans for selling or closing Dimoda. Moreover, the
plans for Dimoda were to improve store management, to close the unprofitable stores and
to promote the most profitable ones. In this context, the following sections focus on how
the accounting information was used in the management of marketing to deliver the
planned business outcomes. This research tries to understand how Dimoda managers
communicated and used accounting information to attain the short-run target of balanced
cash flows, and the long-run objective of survival while protecting the image and the
value of the Dimoda brand.
5.2.4 The Dimoda Business Unit at Grupo Regojo
In this section, the business unit Dimoda is contextualised in the GR. The aim is to
compare Dimoda with other GR’s business units to understand the relative size of
Dimoda in terms of assets and sales, its relative profitability and its growth rates.
The Dimoda business, selling Dali and Pierre Cardin brands, was the most
important fashion business, within the GR, after the Dutti franchising from Inditex. The
clothing retail business represented 90% of the GR turnover.48 The group was formed by
46 Interview with the Non-Executive Board Member on 16/11/2011 (D10.38) 47 Interview with the Non-Executive Board Member on 16/11/2011 (D10.44) 48 www.regojo.pt (accessed on 15/10/2011)
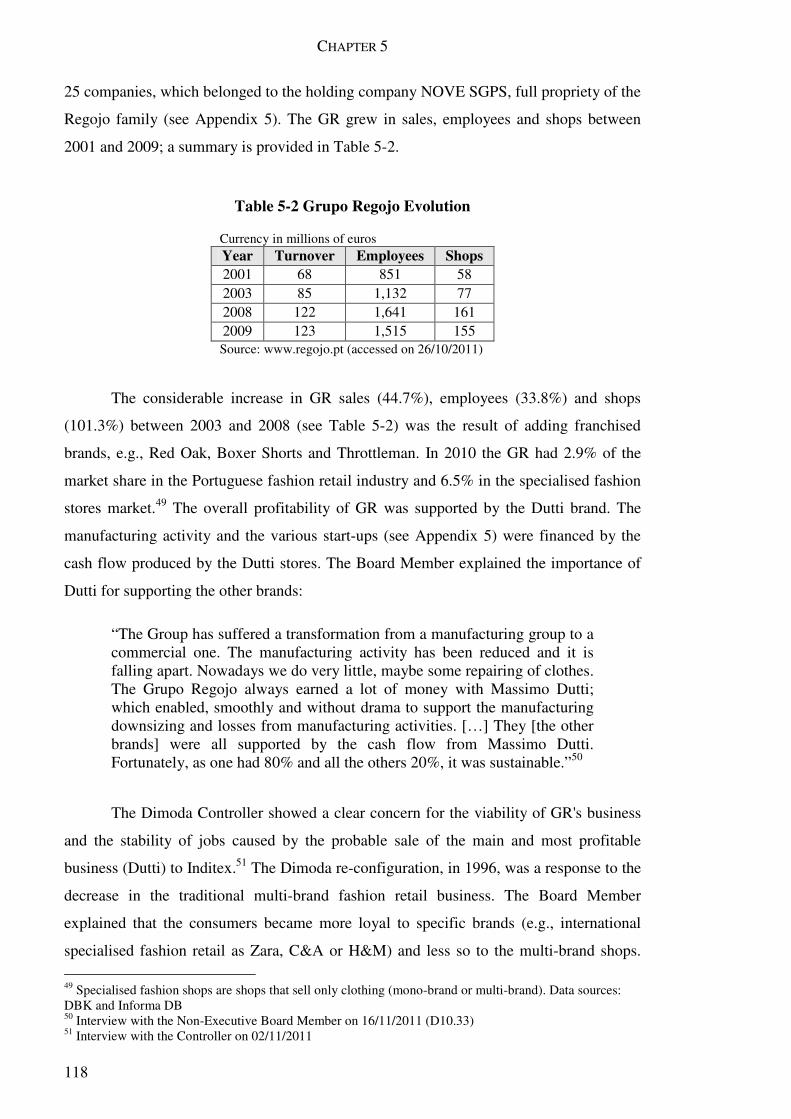
CHAPTER 5
118
25 companies, which belonged to the holding company NOVE SGPS, full propriety of the
Regojo family (see Appendix 5). The GR grew in sales, employees and shops between
2001 and 2009; a summary is provided in Table 5-2.
Table 5-2 Grupo Regojo Evolution
Currency in millions of euros Year Turnover Employees Shops 2001 68 851 58 2003 85 1,132 77 2008 122 1,641 161 2009 123 1,515 155
Source: www.regojo.pt (accessed on 26/10/2011)
The considerable increase in GR sales (44.7%), employees (33.8%) and shops
(101.3%) between 2003 and 2008 (see Table 5-2) was the result of adding franchised
brands, e.g., Red Oak, Boxer Shorts and Throttleman. In 2010 the GR had 2.9% of the
market share in the Portuguese fashion retail industry and 6.5% in the specialised fashion
stores market.49 The overall profitability of GR was supported by the Dutti brand. The
manufacturing activity and the various start-ups (see Appendix 5) were financed by the
cash flow produced by the Dutti stores. The Board Member explained the importance of
Dutti for supporting the other brands:
“The Group has suffered a transformation from a manufacturing group to a commercial one. The manufacturing activity has been reduced and it is falling apart. Nowadays we do very little, maybe some repairing of clothes. The Grupo Regojo always earned a lot of money with Massimo Dutti; which enabled, smoothly and without drama to support the manufacturing downsizing and losses from manufacturing activities. […] They [the other brands] were all supported by the cash flow from Massimo Dutti. Fortunately, as one had 80% and all the others 20%, it was sustainable.”50
The Dimoda Controller showed a clear concern for the viability of GR's business
and the stability of jobs caused by the probable sale of the main and most profitable
business (Dutti) to Inditex.51 The Dimoda re-configuration, in 1996, was a response to the
decrease in the traditional multi-brand fashion retail business. The Board Member
explained that the consumers became more loyal to specific brands (e.g., international
specialised fashion retail as Zara, C&A or H&M) and less so to the multi-brand shops.
49 Specialised fashion shops are shops that sell only clothing (mono-brand or multi-brand). Data sources: DBK and Informa DB 50 Interview with the Non-Executive Board Member on 16/11/2011 (D10.33) 51 Interview with the Controller on 02/11/2011
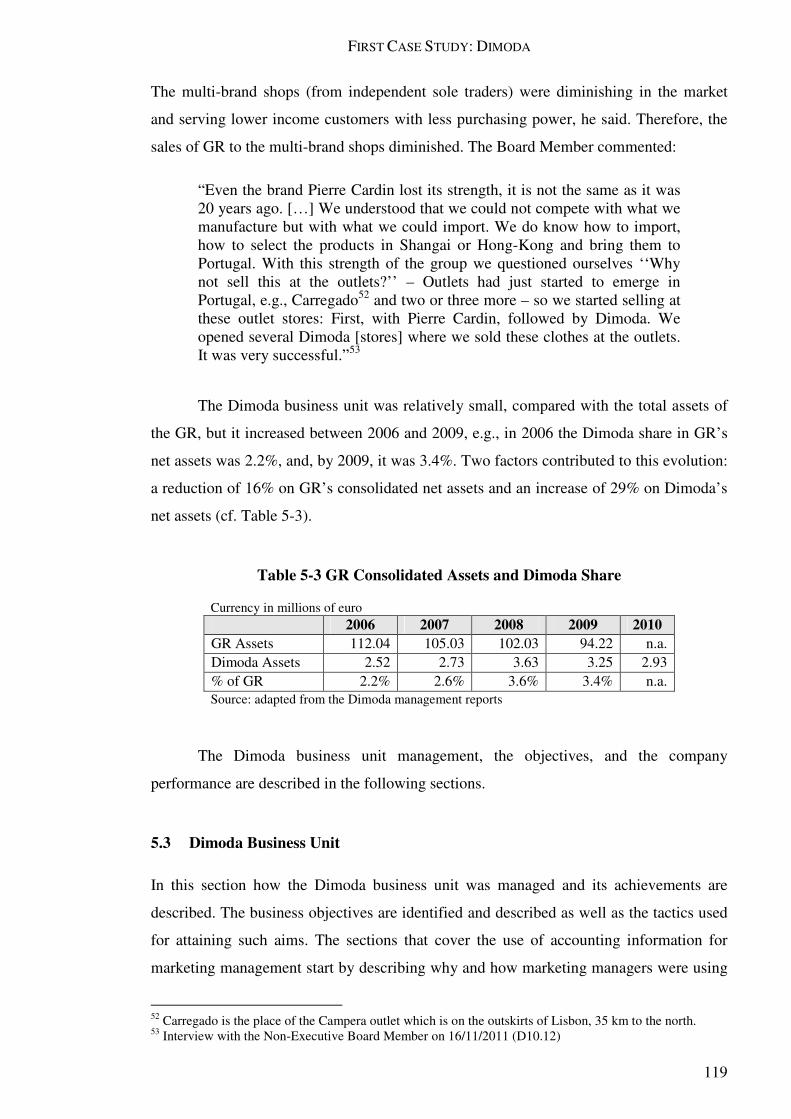
FIRST CASE STUDY: DIMODA
119
The multi-brand shops (from independent sole traders) were diminishing in the market
and serving lower income customers with less purchasing power, he said. Therefore, the
sales of GR to the multi-brand shops diminished. The Board Member commented:
“Even the brand Pierre Cardin lost its strength, it is not the same as it was 20 years ago. […] We understood that we could not compete with what we manufacture but with what we could import. We do know how to import, how to select the products in Shangai or Hong-Kong and bring them to Portugal. With this strength of the group we questioned ourselves ‘‘Why not sell this at the outlets?’’ – Outlets had just started to emerge in Portugal, e.g., Carregado52 and two or three more – so we started selling at these outlet stores: First, with Pierre Cardin, followed by Dimoda. We opened several Dimoda [stores] where we sold these clothes at the outlets. It was very successful.”53
The Dimoda business unit was relatively small, compared with the total assets of
the GR, but it increased between 2006 and 2009, e.g., in 2006 the Dimoda share in GR’s
net assets was 2.2%, and, by 2009, it was 3.4%. Two factors contributed to this evolution:
a reduction of 16% on GR’s consolidated net assets and an increase of 29% on Dimoda’s
net assets (cf. Table 5-3).
Table 5-3 GR Consolidated Assets and Dimoda Share
Currency in millions of euro 2006 2007 2008 2009 2010
GR Assets 112.04 105.03 102.03 94.22 n.a. Dimoda Assets 2.52 2.73 3.63 3.25 2.93 % of GR 2.2% 2.6% 3.6% 3.4% n.a.
Source: adapted from the Dimoda management reports
The Dimoda business unit management, the objectives, and the company
performance are described in the following sections.
5.3 Dimoda Business Unit
In this section how the Dimoda business unit was managed and its achievements are
described. The business objectives are identified and described as well as the tactics used
for attaining such aims. The sections that cover the use of accounting information for
marketing management start by describing why and how marketing managers were using
52 Carregado is the place of the Campera outlet which is on the outskirts of Lisbon, 35 km to the north. 53 Interview with the Non-Executive Board Member on 16/11/2011 (D10.12)
CHAPTER 5
120
accounting information, followed by the identification of factors that influenced the
ability of the accounting system to meet the managers’ demand of accounting
information. The section ends by describing the situation of the MD, i.e., how it was
organised, planned, controlled and influencing marketing management.
5.3.1 Business Profitability
Dimoda reported considerable losses in 2009 and 2010 (see Table 5-4). The accounts in
2010 revealed that the company was technically bankrupt, i.e., €2.9 million of net assets
for €3.1 million of liabilities. While the sales increased 5.2% in 2010, reaching €5.36
million, the LBITDA was €256,000, i.e., 30.6% higher than the 2009’s LBITDA of
€196,000. The 2009 and 2010 net losses were €836,21254 and €453,154 respectively (cf.
Table 5-4).
Table 5-4 Dimoda Sales, E(L)BITDA and Profit (Loss)
Thousands of euro 2005 2006 2007 2008 2009 2010 Sales 3,071 3,328 5,264 5,401 5,099 5,361 E(L)BITDA 441 404 744 558 -196 -256 Net Profit (Loss) 360 133 329 137 -83654 -453 Net Profit (Loss) % sales 11.7 4.0 6.3 2.5 -16.4 -8.5
Source: adapted from the Dimoda management reports
Attempts to increase business profitability focused on both reduction of costs and
sales growth.55 The Dimoda management reports (between 2006 and 2009) enumerated
the following actions for increasing profitability:
• Reducing the labour costs through better allocation of employees in each shop,
reducing them to the minimum;
• Controlling the costs related to inventory losses (max. 0.3% on 2008-2009);
• Increasing the gross margin through better buying, i.e., lower costs of goods sold;
• Looking for new suppliers, to avoid delays in deliveries, rupture of stocks and
negative impact on sales;
• Looking for new shops locations with favourable rent contracts.
54 An amount of € -278,000 loss at the 2009 period was related to accounting adjustments for the new Portuguese accounting standards (SNC), i.e., negative adjustments on fixed assets net values. 55 Dimoda Management Report (2006, p. 14)
FIRST CASE STUDY: DIMODA
121
Increases in sales and profits were also aimed at by promoting the total amount of
sales at each customer visit – by increasing the number of items or the average price. The
management reports suggest that in 2006 Dimoda aimed at increasing the average value
of transactions from €57 to €60; however, the average amount has decreased since then.
For example, in 2008 the average value of transaction was €47. For 2009 it was targeted
at €50, and for 2010 it was targeted at €23 (for card-holder customers).
The other instrument used to increase the business profitability was the number of
pieces sold by transaction. Dimoda intended to increase this sales index, though, without
success. In 2007 the index was 1.88;56 Dimoda targeted 2.00 for the year 2008, but in
2008 it was 1.78; for 2009 they targeted 1.80, however, in 2009 and 2010 the report did
not mention the observed values.
The low profitability and losses combined with the inability to achieve the
business goals suggest that measures taken had had little or no effect. The next section
explains the business objectives set by Dimoda.
5.3.2 Business Objectives of Dimoda
The interviews with Dimoda senior managers suggested that the main objective of the
company was to ensure its survival. The Director-General said that Dimoda would
continue operating as long as it supported the historic sales level (see Eccles 1991, p. 4),
and explained:
“Decreasing the sales 10% this year [2011] is impossible. We delayed the budgeting because of that.57 Decreasing the sales so much is impossible. The business would not survive. We must struggle to keep the sales level. We can not accept a decrease in sales. If the sales decrease we must close shops. If the business is not above what was budgeted, which is -10% of 2010’s sales, the business makes no sense. It is not worth continuing with the business.”58
The business configuration of 2011 started in the year 2000. It was based on the
idea of selling quality clothes at affordable prices. The idea was inspired in the factory
outlet store concept. Aiming at a sustainable sales increase, through the increment of
points of sale, Dimoda expanded to lower-cost shopping centres (see Table A-3 in
Appendix 5).
56 This index value means that, in 2007, the average number of pieces by transaction was 1.88 57 See Hope, J. and Fraser, R. 2003a. Beyond budgeting: how managers can break free from the annual
performance trap. Boston: Harvard Business School Press. pp. 71-72 58 Interview with the Retail Director-General on 01/04/2011 (D06.28)
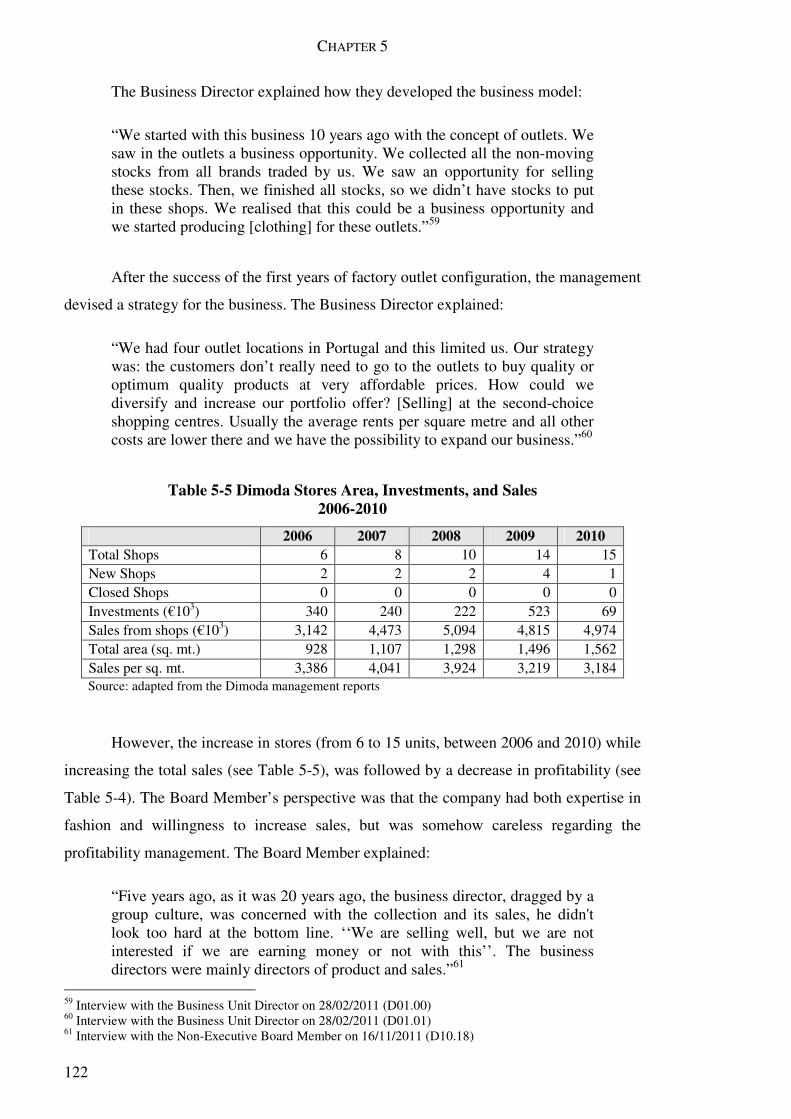
CHAPTER 5
122
The Business Director explained how they developed the business model:
“We started with this business 10 years ago with the concept of outlets. We saw in the outlets a business opportunity. We collected all the non-moving stocks from all brands traded by us. We saw an opportunity for selling these stocks. Then, we finished all stocks, so we didn’t have stocks to put in these shops. We realised that this could be a business opportunity and we started producing [clothing] for these outlets.”59
After the success of the first years of factory outlet configuration, the management
devised a strategy for the business. The Business Director explained:
“We had four outlet locations in Portugal and this limited us. Our strategy was: the customers don’t really need to go to the outlets to buy quality or optimum quality products at very affordable prices. How could we diversify and increase our portfolio offer? [Selling] at the second-choice shopping centres. Usually the average rents per square metre and all other costs are lower there and we have the possibility to expand our business.”60
Table 5-5 Dimoda Stores Area, Investments, and Sales 2006-2010
2006 2007 2008 2009 2010 Total Shops 6 8 10 14 15 New Shops 2 2 2 4 1 Closed Shops 0 0 0 0 0 Investments (€103) 340 240 222 523 69 Sales from shops (€103) 3,142 4,473 5,094 4,815 4,974 Total area (sq. mt.) 928 1,107 1,298 1,496 1,562 Sales per sq. mt. 3,386 4,041 3,924 3,219 3,184
Source: adapted from the Dimoda management reports
However, the increase in stores (from 6 to 15 units, between 2006 and 2010) while
increasing the total sales (see Table 5-5), was followed by a decrease in profitability (see
Table 5-4). The Board Member’s perspective was that the company had both expertise in
fashion and willingness to increase sales, but was somehow careless regarding the
profitability management. The Board Member explained:
“Five years ago, as it was 20 years ago, the business director, dragged by a group culture, was concerned with the collection and its sales, he didn't look too hard at the bottom line. ‘‘We are selling well, but we are not interested if we are earning money or not with this’’. The business directors were mainly directors of product and sales.”61
59 Interview with the Business Unit Director on 28/02/2011 (D01.00) 60 Interview with the Business Unit Director on 28/02/2011 (D01.01) 61 Interview with the Non-Executive Board Member on 16/11/2011 (D10.18)
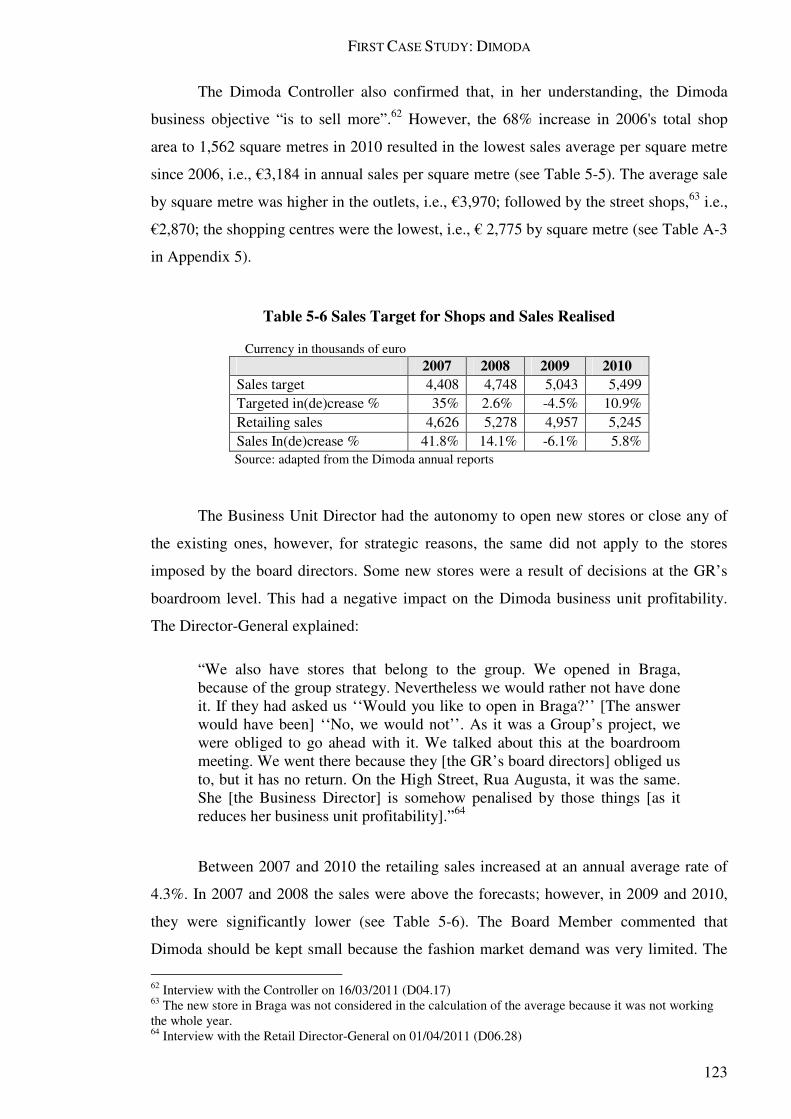
FIRST CASE STUDY: DIMODA
123
The Dimoda Controller also confirmed that, in her understanding, the Dimoda
business objective “is to sell more”.62 However, the 68% increase in 2006's total shop
area to 1,562 square metres in 2010 resulted in the lowest sales average per square metre
since 2006, i.e., €3,184 in annual sales per square metre (see Table 5-5). The average sale
by square metre was higher in the outlets, i.e., €3,970; followed by the street shops,63 i.e.,
€2,870; the shopping centres were the lowest, i.e., € 2,775 by square metre (see Table A-3
in Appendix 5).
Table 5-6 Sales Target for Shops and Sales Realised
Currency in thousands of euro 2007 2008 2009 2010 Sales target 4,408 4,748 5,043 5,499 Targeted in(de)crease % 35% 2.6% -4.5% 10.9% Retailing sales 4,626 5,278 4,957 5,245 Sales In(de)crease % 41.8% 14.1% -6.1% 5.8%
Source: adapted from the Dimoda annual reports
The Business Unit Director had the autonomy to open new stores or close any of
the existing ones, however, for strategic reasons, the same did not apply to the stores
imposed by the board directors. Some new stores were a result of decisions at the GR’s
boardroom level. This had a negative impact on the Dimoda business unit profitability.
The Director-General explained:
“We also have stores that belong to the group. We opened in Braga, because of the group strategy. Nevertheless we would rather not have done it. If they had asked us ‘‘Would you like to open in Braga?’’ [The answer would have been] ‘‘No, we would not’’. As it was a Group’s project, we were obliged to go ahead with it. We talked about this at the boardroom meeting. We went there because they [the GR’s board directors] obliged us to, but it has no return. On the High Street, Rua Augusta, it was the same. She [the Business Director] is somehow penalised by those things [as it reduces her business unit profitability].”64
Between 2007 and 2010 the retailing sales increased at an annual average rate of
4.3%. In 2007 and 2008 the sales were above the forecasts; however, in 2009 and 2010,
they were significantly lower (see Table 5-6). The Board Member commented that
Dimoda should be kept small because the fashion market demand was very limited. The
62 Interview with the Controller on 16/03/2011 (D04.17) 63 The new store in Braga was not considered in the calculation of the average because it was not working the whole year. 64 Interview with the Retail Director-General on 01/04/2011 (D06.28)
CHAPTER 5
124
Board Member explained:
“Dimoda must stay at a small dimension. There is no willingness to open 50 Dimoda stores, perhaps 5 or 10 stores. There are no assigned locations, no customers, no people.”65
The next section describes how Dimoda planned, managed and controlled the
business, using the accounting system, from the perspective of marketing management.
5.3.3 Accounting System and Marketing Management
This section provides a description of how Dimoda’s marketing managers demanded and
used accounting information. The factors which influenced the communication and use of
accounting information are also identified. There were two managers making marketing
decisions, one was responsible for marketing communication and the other was the
director of the business unit, i.e., the marketing and sales manager. The objective of this
section is to contribute to answering the research questions presented in Chapter 2 (see
Table 2-8).
5.3.3.1 Marketing Managers’ Demand of Accounting Information
Both the Business Unit Director and the Marketing Manager were managing marketing,
however, the Dimoda Marketing Manager said that the MD was functioning at an
operational level and only managing marketing communication. Decision making was
carried out by the Business Unit Director. The marketing manager explained:
“What is being done is not at all decided in this department. It is decided by the director of marketing and business.”66
The Board Member explained that Dimoda was completely different from the
other franchises managed by the GR, because all production factors were in the hands of
the Business Unit Director:
“She [the Business Unit Director] knows where she buys. She designs. She decides. She negotiates. She negotiates the prices and the quantities with the supplier from Shanghai. She manages the vessel containers. She clears the goods from customs. She sets the selling price as she wants.”67
65 Interview with the Non-Executive Board Member on 16/11/2011 (D10.61) 66 Interview with the Marketing Manager on 19/07/2011 (D08.55) 67 Interview with the Non-Executive Board Member on 16/11/2011 (D10.23)

FIRST CASE STUDY: DIMODA
125
Thus, at Dimoda, the marketing decisions were taken by these two managers, i.e.,
the Business Unit Director and the Marketing Manager, and the following paragraphs
describe how and why these two managers used and communicated accounting
information in their work.
5.3.3.1.1 Accounting Information for Sales Revenue Analysis
The Marketing Manager did not exchange information with the department of accounting
and control on a regular basis; however, she said that in the past when she had had the
commercial software running, she analysed the sales trends and the average prices (see
Table 5-7 and Table 5-10). The Marketing Manager was carrying out an analysis of
revenue, without considering the costs, and explained her ability to analyse the sales, and
how she used the accounting information produced by the commercial software:
“I am not able [to know the profitability of the women and men segments] because the software platform has not been working for six months. In the past, we were able to analyse the average price per visit and the average price per ticket. We did not [analyse costs and profitability]. It is the Business Unit Director that does this. I do not [exchange information with the accounting department].”68
Table 5-7 Sales Analysis Indicators Used by Dimoda
Column by line Returns Top Sales Price Discounts Sales Article (Qt) T/S T/S Article (€) T/S T/S T Reference (Qt) T/S T/S Reference (€) T/S T/S T Article Collections T Article by Colour T Interval of discounts T Article Family T Article Group T Article Line T Article Gender T Article Size T
Source: adapted from a Marketing Manager’s email on 20/07/2011 Key: T-Total, S-Store
The Controller said that the information about sales forecasts was produced by the
commercial department, i.e., the Business Unit Director, and it was with this collaboration
68 Interview with the Marketing Manager on 16/03/2011 (D02.12)
CHAPTER 5
126
that the annual budget was developed (see Anthony and Govindarajan 2003, pp. 420-
421). She explained:
“[The commercial department] makes the sales forecast [for the annual budget] [...] on a monthly basis [...] for they are the ones who have the perception of what they will sell.”69
The Director-General also confirmed the commercial department's focus on sales
analysis and limited use of information on costs and profitability (see Goebel et al. 1998,
p. 498). The sales analysis was made at the customer level; to that end, the marketing and
commercial departments used data that the customer card system provided (see Johnson
1992, p. 65). The Director-General explained:
“There are several types of segments [of customers]. We are now talking about the men and women in Dimoda. But we could also be talking about men and women clothes, referring to several segments or sub-segments, e.g., trousers and jackets. This is analysed by the Business Unit Director. She analyses in terms of sales, not in terms of [profit] margin. The margin is total [store by store] … The Business Director takes all of these [accounting] printouts. […] If I or the control department wants to get the costing information, then it is more complicated. It is at the commercial department level that they work with all this information. To know what is selling more, what is selling less; she [the Business Unit Director] has many printouts for supporting [the commercial analysis].”70
The executives who managed marketing, both from the MD and the business unit,
did not receive the accounting information in a systematic and automatic way from the
accounting department. Information on sales were managed and produced by the
marketing software, in particular through the software related to the loyalty card. The
Director-General described the calculations made by the marketing and commercial
managers, related to revenue analysis at the customer level:
“About the profitability of customers: through the loyalty card, we know who the customers are who buy more. We do these statistics of purchases both for [loyalty] cards and without [loyalty] cards; we have printouts, made by the marketing management, with all this management of loyalty card [sales]. But only for those that have loyalty cards, those that don't we do not know. We analyse, e.g., the customers who have more sales.”71
69 Interview with the Controller (04.12) 70 Interview with the Retail Director-General on 01/04/2011 (D06.45) 71 Interview with the Retail Director-General on 01/04/2011 (D06.55)

FIRST CASE STUDY: DIMODA
127
The marketing software was separate from the accounting software. Thus,
although the marketing managers had information about the business’ profitability, the
costs that were considered in the analysis were estimated and had a significant margin of
error. The following section describes how the marketing managers used the information
to analyse profitability.
5.3.3.1.2 Accounting Information for Profitability Analysis
The Marketing Manager did not analyse the business’ profitability. Her concern was to
control costs and meet the department's budget (see Hope and Fraser 2003a, p. xviii).
However, the Business Unit Director was very keen to analyse the profitability. The
Business Unit Director expressed interest in the analysis of profitability due to her
training in business management and the aim of business survival. The Business Director
explained:
“[The profitability information] is extremely important, I follow very closely the profitability of my business, I am very concerned about it, the role of accounting and control departments are fundamental, in any business. […] I am graduated in business management. I never saw finance as being apart of the sales department. I see the business as a whole. For me it is unthinkable to work exclusively on sales management without knowing what I am spending in my sales department. Why should I do wonderful things, if six months later someone will tell me to close the doors and ask me to leave because it does not work?”72
However, the interest of the Business Unit Director in accounting information
regarding profitability was not adequately supported by the department of accounting and
control. The Business Unit Director acknowledged that there was a margin of error in her
analysis and described her methodology:
“I have a monthly printout that enables me to analyse my margins against my sales, cost of goods sold, and margins. It is an analysis made by the system, which is not 100% reliable, as I know it has 1% or 2% variances because it does not have the [indirect] cost percentages. It is an analysis made by me. It does not have the [indirect] costs allocated… I do my own calculations and the role of management control.”73
The Financial Accountant felt there was no need to provide regular and structured
accounting information to the Business Director. From the Financial Accountant’s
72 Interview with the Business Unit Director on 28/02/2011 (D01.04) 73 Interview with the Business Unit Director on 28/02/2011 (D01.28)
CHAPTER 5
128
viewpoint, the information was sufficient and the Business Unit Director had all the
information she needed to analyse the business profitability. The Financial Accountant
referred to this matter as:
“The commercial manager goes and looks, every day, at her sales and she knows her margins. This commercial manager knows exactly how much rent she pays for each shop. She has the notion of fixed costs that she has beyond rents; that is, what has the most impact. She knows perfectly well the expenses related to staff. She has this information. She is conscientious of her prices, because she does her purchases.”74
The Director-General also considered adequate how the Business Unit Director
had access to accounting information and produced her profitability analysis. She
acknowledged that nothing was formalised: the business unit directors go to the head
office every month to meet the general manager and the controller; they discuss the
monthly reports produced by the management control, which included some financial
indicators, e.g., sales, sales per square metre, and the monthly results. She noted that
whenever the Business Unit Director needed and requested accounting information, it was
sent by the control and accounting department.
The perspective of the Business Unit Director was different. She noted that the
accounting and control should be more proactive both in producing information and
interacting with her (see Johnson and Kaplan 1987, p. 4). She expressed:
“The [accounting] information is enough. I am satisfied. But, not completely satisfied. Why? Because we only get the information if we ask for it from the accounting [department]. I think that it should be the accounting department or the management control department to give us, monthly, the costs that they know are important for our functioning, and could say, here is your budget for 2010, here is where you are, analyse your variances and see whether you can manage it by improving it before the end of the year. I feel this disconnection [between us and accounting], and wish it were closer…. I think that these are two important departments and both should give information without the necessity to ask for it.”75
In Dimoda, managers responsible for marketing management also used accounting
information for controlling and managing costs; this is discussed in the following section.
74 Interview with the Financial Accountant on 16/03/2011 (D03.56) 75 Interview with the Business Unit Director on 28/02/2011 (D01.18)

FIRST CASE STUDY: DIMODA
129
5.3.3.1.3 Accounting Information for Cost Management
The business strategy – offering quality products at affordable prices at convenient
scattered locations – required that “Dimoda had to be developed through very tight cost
control.”76 said the Business Unit Director. She justified this, saying that Dimoda was a
company managed through costs centres and these should be very well controlled.
Dimoda has the ownership of the brand and set the final price using a mark-up on all
accumulated costs.77 The Director-General also justified the need for controlling the costs
with the economic slowdown of 2008 and the business’ weaker results. She explained that
the costs were being very well managed by the Business Unit Director, through the tight
control of budget variances and cost containment in supplies (see Hope and Fraser 2003a,
p. xviii; Johnson and Kaplan 1987, p. 33) such as energy and telecommunications, and
not much could be reduced:
“This brand is managed almost at penny level. Its return is very weak. It already had higher returns before, but the crisis started and the years 2008, 2009 and 2010 were weaker. She needs to pay close attention to all costs. […] She [Business Director] is hardworking, very much motivated, she strives for the objectives […] costs are [already] too tight; we have not much to do with costs.”78
The business income and cost structure of Dimoda was different from the average
of the companies operating in the sector79 (see Table 5-8). The major unfavourable
differences were concerned with supplies, services and labour costs. While there was a
concern to reduce costs, Dimoda did not compare their cost structure (see Table 5-9) with
that of its competitors.
Table 5-8 Cost Structure in Specialised Fashion Retail Sector
% of sales Dimoda Average Top 50 Top 10 Cost of goods sold 54.7% 56.1% 54.6% 54.7% Supplies and services 24.0% 19.7% 20.1% 20.2% Labour costs 22.7% 14.6% 12.6% 11.1% Depreciation 4.3% 3.7% 3.8% 3.3% Net profit (loss) -10.8% 1.1% 4.3% 5.6% Net Assets (€ 103) 3,526 549 18,092 46,722 Sales (€ 103) 5,098 630 31,081 94,062 Source: adapted from the Informa DB database (2009)
76 Interview with the Business Unit Director on 12/07/2011 (D07.01) 77 Interview with the Business Unit Director on 28/02/2011 (D01.01) 78 Interview with the Retailing Director-General (06.02) 79 CAE 47711 – specialised retail for adult clothing stores
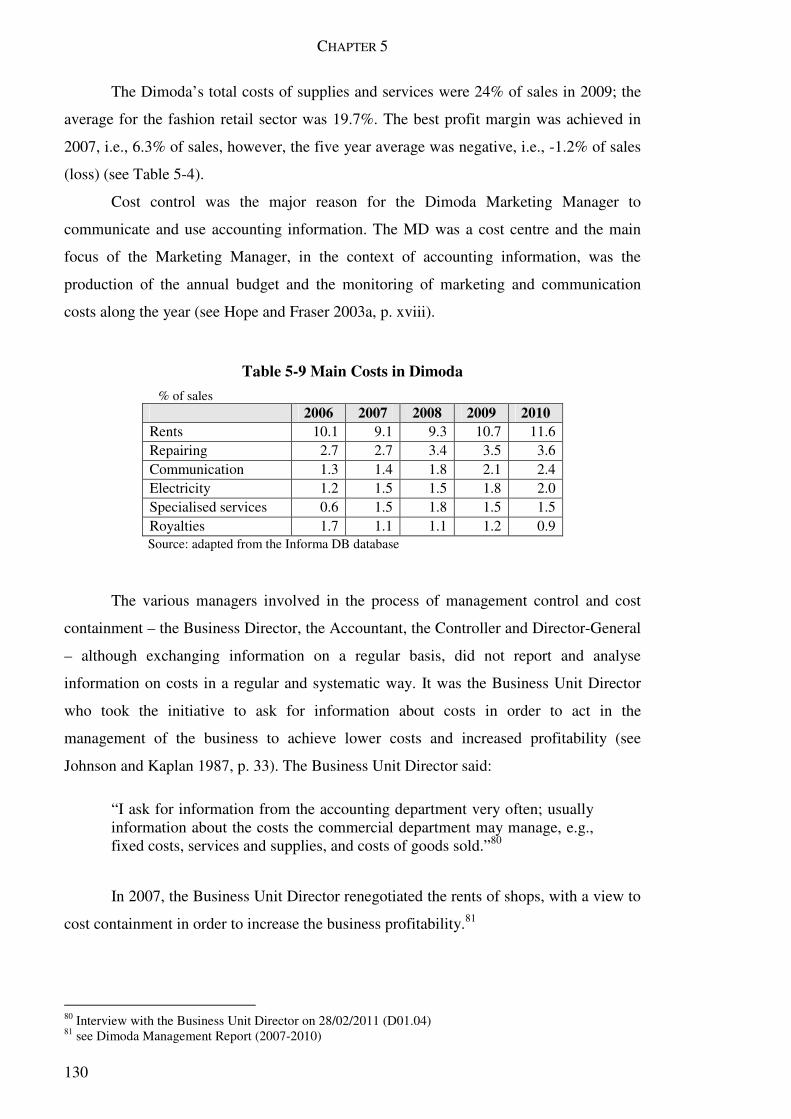
CHAPTER 5
130
The Dimoda’s total costs of supplies and services were 24% of sales in 2009; the
average for the fashion retail sector was 19.7%. The best profit margin was achieved in
2007, i.e., 6.3% of sales, however, the five year average was negative, i.e., -1.2% of sales
(loss) (see Table 5-4).
Cost control was the major reason for the Dimoda Marketing Manager to
communicate and use accounting information. The MD was a cost centre and the main
focus of the Marketing Manager, in the context of accounting information, was the
production of the annual budget and the monitoring of marketing and communication
costs along the year (see Hope and Fraser 2003a, p. xviii).
Table 5-9 Main Costs in Dimoda
% of sales 2006 2007 2008 2009 2010 Rents 10.1 9.1 9.3 10.7 11.6 Repairing 2.7 2.7 3.4 3.5 3.6 Communication 1.3 1.4 1.8 2.1 2.4 Electricity 1.2 1.5 1.5 1.8 2.0 Specialised services 0.6 1.5 1.8 1.5 1.5 Royalties 1.7 1.1 1.1 1.2 0.9
Source: adapted from the Informa DB database
The various managers involved in the process of management control and cost
containment – the Business Director, the Accountant, the Controller and Director-General
– although exchanging information on a regular basis, did not report and analyse
information on costs in a regular and systematic way. It was the Business Unit Director
who took the initiative to ask for information about costs in order to act in the
management of the business to achieve lower costs and increased profitability (see
Johnson and Kaplan 1987, p. 33). The Business Unit Director said:
“I ask for information from the accounting department very often; usually information about the costs the commercial department may manage, e.g., fixed costs, services and supplies, and costs of goods sold.”80
In 2007, the Business Unit Director renegotiated the rents of shops, with a view to
cost containment in order to increase the business profitability.81
80 Interview with the Business Unit Director on 28/02/2011 (D01.04) 81 see Dimoda Management Report (2007-2010)

FIRST CASE STUDY: DIMODA
131
In 2010 other measures were proposed in order to reduce costs, thus increasing
profitability:82
• Move the inventories to a cheaper store;
• Remove the mobile phones from the shops;
• Reduce the transaction costs related to credit and debit cards;
• Reduce the packaging costs;
• Close the least profitable shops.
The board directors instilled this cost containment attitude and included these
indicators in the reward system. There was an effort to stimulate the business directors to
have a comprehensive view of the business instead of focusing only on sales. The
Director-General explained their efforts:
“We have five main indicators [for calculating the rewards]: EBITDA is always [important], and [there are] other interesting issues that we want to improve. Dimoda has also [targets of] closure of stores, rent reductions, transportation costs reductions, and sometimes we include sales. There are many strategic objectives; we include some of them in the incentive system.”83
The Financial Accountant testified that the concerns of the director of the business
unit were to inquire about the costs, with the aim of reducing or deciding on the closure of
certain stores. However, it was evident from the views of the Financial Accountant that
the effort to obtain this information came from the Business Unit Director, and that the
Financial Accountant's participation in this process was passive and reactive. The
Financial Accountant explained how she interacted with the Dimoda Business Unit
Director:
“There is a sharing of information. The person [director] of Dimoda is able to request information from me: how can we, or where can we reduce [costs] in your opinion? For example, a short while ago, the Business Director and the administrator came to me, and then we looked at a specific business unit, to see how much it would be worth keeping the business unit. We did simulations in terms of cash flows for the business unit, i.e., a shop. We checked the accounts [to determine] which one was the major, or which one we could reduce [its costs].”84
82 see Dimoda Management Report (2010) 83 Interview with Retail Director-General on 01/04/2011 (D06.82) 84 Interview with the Financial Accountant on 16/03/2011 (D03.27)

CHAPTER 5
132
When questioned about the information available to control costs, the Director-
General reported that accounting information existed and was regularly sent to the
directors of the businesses. She said that they had accounting indicators, e.g., the
percentages of the cost of the goods sold, the percentages of staff cost and the percentage
of variable costs. The Director-General explained that they obtained the information from
the monthly operating account, and the management controller sent it to the business unit
managers. However, the Business Unit Director, while knowing that the information
existed at the level of the general management, said that the information was highly
aggregated. It lacked the detail necessary to identify where costs were rising, and did not
allow for the identification of opportunities for improvement. The printouts and reports
produced automatically – although useful for the top management – were insufficient to
support the commercial directors (see Anthony and Govindarajan 2003, pp. 416-417).
The Business Unit Director explained the situation:
“I am sure [that the accounting information exists at the board level]. It is not detailed. It may show the changes in services and supply expenses from one year to another. The board directors are aware of it. However, if you ask ‘‘Why has it increased? Where has it increased? Where can we improve?’’ [there is no answer]. This detailed work must be done between sales and management control. This relationship should be improved.”85
The Controller, when confronted with the situation, acknowledged that her
interaction with the commercial department was insufficient. She noted that the
construction of the 2011 budget was a team effort with the commercial department, and
considered it the most appropriate methodology (Anthony and Govindarajan 2003, pp.
420-421); more than building the budget based on historical values (see Hope and Fraser
2003a, p. 4). She noted that by developing the budget in collaboration with the director of
the business unit, it facilitated subsequent monitoring of costs in coordination with the
commercial manager of the business unit. The Controller revealed that she intended to
increase her interaction with the commercial department in addition to the usual reporting
to the board directors of the GR. The Controller commented:
“[The contact with the business unit directors] will be part of my duties. Every time I identify important deviations, I will start reporting to the business unit managers besides passing information to the Director-General. [I will do so] also because this year there was interconnection in budgeting; it wasn't simply based on historical data. We cooperated [to set the budget] at the level of costs.”86
85 Interview with the Business Unit Director on 28/02/2011 (D01.35) 86 Interview with the Controller on 16/03/2011 (D04.16)
FIRST CASE STUDY: DIMODA
133
Besides the objective of cost management at the marketing and sales department –
e.g., finding opportunities to reduce operating costs through changes in operations or
renegotiating the contracts with suppliers or stores' landlords – accounting information
was also used to control marketing management through the annual budget. The
following section discusses this topic.
5.3.3.1.4 Accounting Information for Marketing Management Control
In the MD, accounting information was primarily used to ensure that the level of
expenditures would not exceed what was budgeted and to verify that all suppliers’
invoices were recorded (see Hope and Fraser 2003a, p. xviii). The motivation for using
the information in this way was primarily related to financial accounting. The Director-
General explained how and why the Marketing Manager used the accounting information:
“The marketing [department] makes the budget, all costs are detailed, and she [the Marketing Manager] makes her own controls that are sent to the Business Unit Director or to me. We have a certain budget and all the [actual] costs, for checking that nothing [related to costs] is missing. From each [marketing] action, we get the cost [information], i.e., the budgeted amount and the detailed costs.”87
Attempts were made to control marketing through measuring its performance in
financial terms. The methodology used was to compare the level of sales before and after
specific marketing campaigns, e.g., sending promotional messages by short message
service (SMS). The Director-General explained how the Marketing Manager carried out
these measurements and the difficulties that they encountered:
“[Do we measure] the return? Marketing does so. When they do an activity, they attempt, whenever possible, to measure the return, in terms of visibility.88 Dimoda makes very few actions [sponsored social events]. The only thing that is measured is: we send SMSs to customers, for promotions, and we see how that relates in terms of increased sales; compared to the previous year's sales, or [compared] to what was being done previously. We do not have a lot of tools, we cannot measure exactly. This is always a difficulty for them [in marketing]: evaluating the return of campaigns.”89
The director of the business unit confirmed the use of this methodology – the
87 Interview with the Retail Director-General on 01/04/2011 (D06.58) 88 Visibility return means the amount saved in the media space cost, i.e., by passing a note about the social event, sponsored by the brand, instead of paying publicity. 89 Interview with the Retail Director-General on 01/04/2011 (D06.56)
CHAPTER 5
134
measurement of the volume of sales after the campaigns – and reported that it was very
complicated to measure the performance of marketing in financial terms. The Business
Director explained:
“It is very complicated [to measure the marketing return]. The only way to do it is to compare the sales of this weekend with the sales of the same weekend one year before, and to analyse whether the cardholders’ sales increased or not.”90
The marketing manager and the business unit director reported that they
participated in the construction of the annual budget for marketing (see Anthony and
Govindarajan 2003, pp. 420-421). The Business Unit Director, who performed the
functions of marketing and sales manager, decided on the overall budget amount (see
Hope and Fraser 2003a, p. 21). She fixed the sales target and assigned the amounts to the
costs in communication and marketing. The Marketing Manager, based on the amounts
assigned to the MD, decided on actions to develop and allocated the marketing budget to
the various marketing activities. The Business Unit Director, who did not participate
actively in the marketing planning process, described the involvement of the Marketing
Manager in budgeting:
“[In setting the marketing budget] we look at the TV presenters that we will continue to dress according to each season. We calculate, each season, the value allocated to any of them, depending on the number of times that each one will appear on their television programme. By calculating the cost allocated to each, we consider the acquisition cost of the goods used. We also look at the number of SMS campaigns carried out in the previous year to set the budget for the next year, analysing if an increase is needed, in a specific month, the number of campaigns.”91
The Marketing Manager confirmed that she was not responsible for decisions on
the total amount attributed to the marketing budget. It was the Business Unit Director who
decided the total budgeted amount spent on communication, the Marketing Manager said.
Moreover, she commented that many of the activities that were planned within budget,
were not carried out (see Hope and Fraser 2003a, p. 4). The Marketing Manager
explained that this was due to the low motivation of the Business Unit Director to develop
initiatives related to marketing and communication (see Ambler 2003b, p. 253).
90 Interview with the Business Unit Director on 12/07/2011 (D07.13) 91 Interview with the Business Unit Director on 12/07/2011 (D07.07)

FIRST CASE STUDY: DIMODA
135
The Marketing Manager expressed:
“The budget is this, but then we can never carry out all the actions, or those that are planned. A series of actions planned are then not performed, because the director of the brand [does not want to carry them out]. It is the director of the business who gives the money, she says: ‘‘We have a certain amount to communicate for marketing this year.’’ ”92
The Director-General explained that the Business Unit Director monitored the
compliance with the budget only in terms of sales and cost of goods sold. For the other
overheads, budgetary control was carried out by the management control department and
discussed monthly at the boardroom level (see Hope and Fraser 2003a, p. xviii). Referring
to this, the Director-General explained:
“[The Business Unit Director] only develops the budget for [articles] purchases and sales. She does not have the budget perspective for the overall business structure. This is the point: she doesn’t compare the budget with the true costs [regarding the overall budget].”93
The Business Unit Director said that, in addition to the motivations directly related
to cost management, accounting information also contributed to a better understanding of
the business as a whole, and motivated structural changes (see Johnson and Kaplan 1987,
p. 4). The next sections explore this use of accounting information for identifying
improvement opportunities.
5.3.3.1.5 Accounting Information for Identifying Improvement Opportunities
The Dimoda Business Unit Director said that accounting information was helpful for her
to identify both problems and opportunities for improvement. She inferred that it
complemented other information and helped to guide the practice of marketing
management, even if the information did not inform particular decisions. She explained
why a closer relationship to the department of accounting and control was desirable:
“The closeness of all these departments [i.e., accounting and control] with the board directors and with those who direct the business is extremely important for daily decision making. Though it may not influence 100% of the decision making or the direction of the business, it can contribute to deciding a route that is more advantageous to the enterprise.”94
92 Interview with the Marketing Manager on 19/07/2011 (D08.05) 93 Interview with the Retail Director-General on 01/04/2011 (D06.50) 94 Interview with the Business Unit Director on 28/02/2011 (D01.08)
CHAPTER 5
136
In the case of Dimoda, the Business Unit Director identified two factors that
hindered the use of accounting information in her work as manager. Firstly, the reports
that the management control produced were aimed essentially at an assessment of the
overall business performance and were directed to senior management. Therefore, the
Business Unit Director had no regular or automatic access to accounting information.
This meant the information was often outdated and not helpful in decision making. The
Business Unit Director explained how the accounting information flow could be
improved:
“The [management control] information is produced. It is not communicated. We ask for the information until it is delivered to us. I think that this is wrong. The management control should send, quarterly, to the responsible person, not only to the board directors, the [accounting] information about what is wrong; this would enable him [the business unit director] to work and change things, if needed be.”95
Secondly, the Business Unit Director mentioned the need for accounting
information to be discussed verbally with those who produce it. She suggested that the
reports of accounting, despite being available whenever they were required, were not
sufficient to identify opportunities for improvement and checking on what was good and
flawed in the business. The Business Unit Director suggested that there would be
advantages in communicating information face-to-face, to create opportunities of
interaction between managers and controllers. The Business Unit Director explained her
viewpoint:
“I am sure that the information related to what was budgeted and executed is produced monthly and presented to the board directors. I am sure. We have monthly board meetings. The information regarding sales and variances is provided. But I think that it should also be provided to the business manager. To sit down and discuss with the business manager what can be improved, what is right and what is not right. This is important.”96
Finally, the Business Unit Director reported how useful it was to receive the
information from the department of accounting and control to perform her job as business
unit manager:
“We need to cut [costs]. We are in cost containment. We may go this way or another. We need to see where we can improve. Are we going to use our marketing, conduct some sales promotions and increase the sales revenue?
95 Interview with the Business Unit Director on 28/02/2011 (D01.25) 96 Interview with the Business Unit Director on 28/02/2011 (D01.34)

FIRST CASE STUDY: DIMODA
137
[Therefore] it is important that the [accounting] information is made available and better discussed. It is really very important. [The interaction between sales and accounting] does not exist and this is very important, I am sure about it.”97
The accounting information also contributed to strategic marketing management
and this topic is discussed in the next section.
5.3.3.1.6 Accounting Information for Strategic Marketing Management
The Controller, the Business Unit Director (responsible for marketing and sales
management) and the Director-General, commented that accounting information was used
to support strategic decisions. For example, in projecting sales to five years, they assessed
(1) the interest of maintaining certain shops in operation; (2) in setting limits on the cost
of long-term leases; and (3) in managing income and expenses aimed at the long-run
survival of the business. The Controller explained her interaction with the Business Unit
Director and how the accounting information generated inputted into strategic decisions
related to the closure of stores:
“Sales [forecasts] are made together with the commercial [director]. The commercial [director] does [the forecast] based on historical [sales]. She uses the historical data, and then, depending on her perception of the market, she gives us the information [in the form of] an estimate for the following year. We have also, in some cases, a 5 year plan; in the case of Dimoda this was also done to see the results of the stores for 5 years, and whether it was better to close some [stores] or not.”98
Likewise, the accounting information was taken into account to determine what
kind of stores could be rented and what fixed cost structure was consistent with the
Dimoda’s brands positioning (see Appendix 2) in the clothing retail, because the
management had set a maximum allowable cost for the rent per square metre. The
Director-General gave an example of using accounting information in strategic decisions:
“We know that Dimoda cannot pay more than 15 euros per square metre, because we have to do promotions. To ensure a certain profit margin we have to have very low costs because the [customer’s] appetite for our products is not fantastic. To be profitable, we have to have certain low fixed costs.”99
97 Interview with the Business Unit Director on 28/02/2011 (D01.26) 98 Interview with the Controller on 16/03/2011 (D04.47) 99 Interview with the Retail Director-General on 01/04/2011 (D06.100)
CHAPTER 5
138
Finally, when the Business Unit Director was questioned about the future of
Dimoda, she noted the importance of being well informed by the department of
accounting and management control to be able to manage costs. In her opinion, the
viability of the business demanded a constant alertness to find new opportunities for cost
reductions (see Johnson and Kaplan 1987, p. 33):
“How do I see the future? We have to continue cutting what we can [on costs] out there, so we can have some others [revenue and profit] growing more. I see the future as being very complicated.”100
The accounting information, in addition to contributing to the debate on strategic
issues, also served to determine prices. This topic is covered in the following section.
5.3.3.1.7 Accounting Information for Price Management
The Business Unit Director said that accounting information was used to determine prices
by adding a margin over the purchasing cost of the items which included the materials,
transportation and customs clearance costs, limited by a maximum acquisition price.
Referring to the importance of accounting information, she said:
“[The accounting information] is important [for setting the prices]. […] It is a mark-up on all previous costs. We have a close relationship [with accounting information].”101
The pricing policy at Dimoda was dependent on the product, the competition and
the price positioning. The Business Unit Director described the business proposal as
“products with quality or optimum quality at very affordable prices”102 and the Marketing
Manager explained how they did the price positioning:
“We select a set of articles as well as the brands that compete with us, those having prices, equally higher, or equally lower than ours. We go to their stores, we check the prices, the point of sale; we check everything, product, store, promotions, and changes made.”103
The Business Unit Director had a cost ceiling for each item category, which was
calculated considering the price point deducted from the targeted margin – the fixed costs
100 Interview with the Business Unit Director on 12/07/2011 (D07.43) 101 Interview with the Business Unit Director on 28/02/2011 (D01.09) 102 Interview with the Business Unit Director on 28/02/2011 (D01.01) 103 Interview with the Marketing Manager on 16/03/2011 (D02.35)
FIRST CASE STUDY: DIMODA
139
were allocated using a unitary average fixed cost. The Business Unit Director explained
how she used the target costing technique:
“I can not go above this cost for each product category. I have a ceiling for each category e.g., I can not buy a polo shirt originally at €19. My final customer will not recognise the value; the market will not buy that product at this price. I have a ceiling price for each product category; to which I may work up to. I need this margin in order to keep the business alive; therefore I go back and look for products according to my conditions.”104
In addition to price management, accounting information was also important in
customer analysis. This is addressed in the following section.
5.3.3.1.8 Accounting Information for Customer Analysis
The Business Unit Director said that she resorted to the accounting records of specific
customers with loyalty card, to realise when and how often the customer buys, and the
value of each purchase. She said the analysis allowed a better understanding of the
configuration of the client portfolio, and also allowed an understanding of how customers
react to promotions by SMS. The Business Unit Director explained why she used
accounting information for customer analysis (see Johnson 1992, p. 65):
“Sometimes I like to look at the list of customers, open some customer records, from several customers, and understand in which periods the customers buy. Is it a customer that only comes in the sales season? Is it a customer that doesn’t react to my SMS? Is it a customer that buys during the season and does not care about the campaigns I carry out? This is something very interesting to look at, because we understand that we have customers that only come to the store after receiving a SMS. This is necessary and possible to do, but, as the system is, it is a complicated situation.”105
The Marketing Manager also said that she had access to information related to
customers with loyalty cards. She revealed that she was not looking at the profit margins
of the products sold: she analysed the number of purchasing transactions and the total
sales amount (see Table 5-10). She said that this form of analyses allowed her to assess
the impact of the campaigns and described the information she had access to:
“So much information. We could do a number of things – based on the records of clients with cards and without. Our campaigns are always
104 Interview with the Business Unit Director on 28/02/2011 (D01.12) 105 Interview with the Business Unit Director on 12/07/2011 (D07:28)
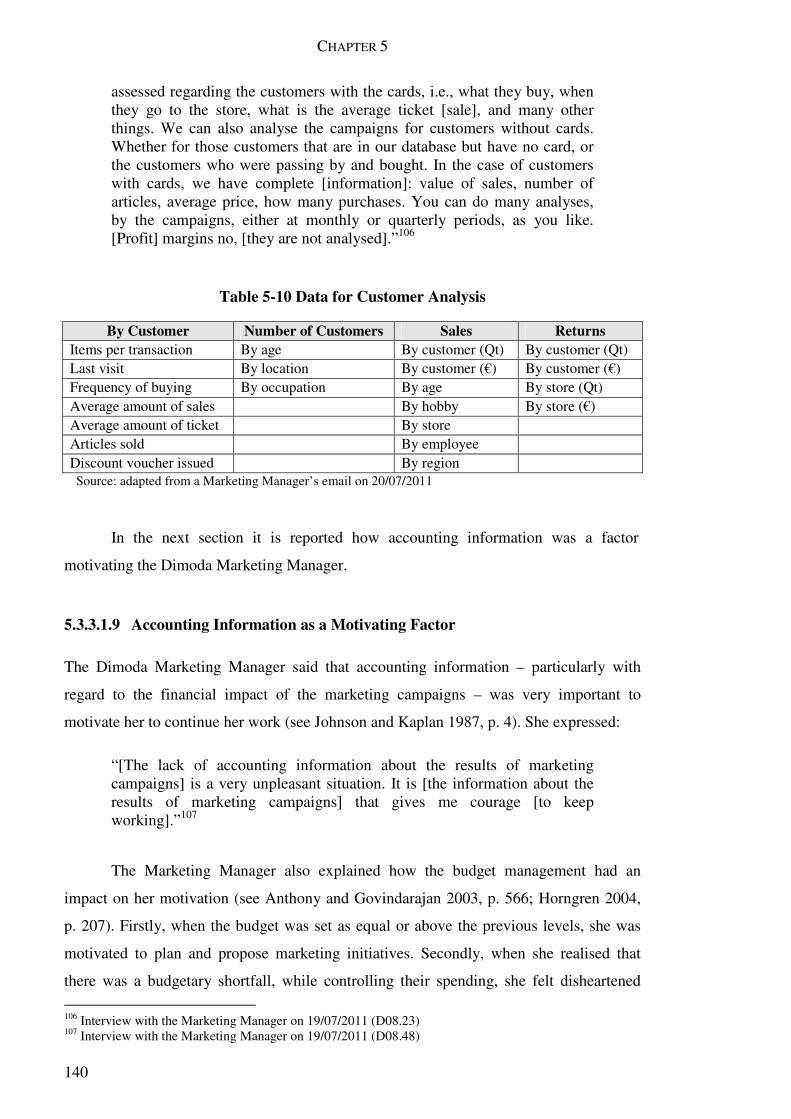
CHAPTER 5
140
assessed regarding the customers with the cards, i.e., what they buy, when they go to the store, what is the average ticket [sale], and many other things. We can also analyse the campaigns for customers without cards. Whether for those customers that are in our database but have no card, or the customers who were passing by and bought. In the case of customers with cards, we have complete [information]: value of sales, number of articles, average price, how many purchases. You can do many analyses, by the campaigns, either at monthly or quarterly periods, as you like. [Profit] margins no, [they are not analysed].”106
Table 5-10 Data for Customer Analysis
By Customer Number of Customers Sales Returns Items per transaction By age By customer (Qt) By customer (Qt) Last visit By location By customer (€) By customer (€) Frequency of buying By occupation By age By store (Qt) Average amount of sales By hobby By store (€) Average amount of ticket By store Articles sold By employee Discount voucher issued By region
Source: adapted from a Marketing Manager’s email on 20/07/2011
In the next section it is reported how accounting information was a factor
motivating the Dimoda Marketing Manager.
5.3.3.1.9 Accounting Information as a Motivating Factor
The Dimoda Marketing Manager said that accounting information – particularly with
regard to the financial impact of the marketing campaigns – was very important to
motivate her to continue her work (see Johnson and Kaplan 1987, p. 4). She expressed:
“[The lack of accounting information about the results of marketing campaigns] is a very unpleasant situation. It is [the information about the results of marketing campaigns] that gives me courage [to keep working].”107
The Marketing Manager also explained how the budget management had an
impact on her motivation (see Anthony and Govindarajan 2003, p. 566; Horngren 2004,
p. 207). Firstly, when the budget was set as equal or above the previous levels, she was
motivated to plan and propose marketing initiatives. Secondly, when she realised that
there was a budgetary shortfall, while controlling their spending, she felt disheartened
106 Interview with the Marketing Manager on 19/07/2011 (D08.23) 107 Interview with the Marketing Manager on 19/07/2011 (D08.48)

FIRST CASE STUDY: DIMODA
141
because she interpreted the fact as a lack of recognition on the part of her director. In this
regard the Marketing Manager commented:
“The Dimoda [marketing] budget remained the same, more or less the same, or increased a bit by chance. But between the increase and the performed [activities] … The budget is this, but then we can never do all the actions, or those that are planned. […] I do not see it as spending and hope that the Business Director also does not see it as an expense, but as an investment.”108
The Director-General said that the GR top management made an effort to motivate
the business unit directors to manage the profit and loss account up to the operating
income line. She said that the commercial directors, interested by the numbers of the
operating account – not just sales as usual – sought improvements in the business unit.
She explained how both the changes and the growing commercial managers’ interest in
accounting information impacted on business management motivation:
“Here, we were [managing] too much as salesmen, and the main concern was to sell more. Then we began structuring everything, so to worry about the costs and profitability, either wholly or detailed [by brand], in order to get more results and monetise each brand. It has been an evolutionary process. Moreover, as the business unit directors came from sales, then it was more about sales. Little by little we are encouraging them and now all directors of business units go and look at the numbers, and ask for the numbers, and see where they can improve this and that. This concern exists at the moment.”109
Considering what has been stated in previous sections, marketing and sales
managers at Dimoda were interested in accounting information and used it for various
purposes. However, they did not have the necessary support from both the information
systems and the departments of financial accounting and management control (see
Ambler 2003b, p. 253). The following sections describe the factors that influenced the
communication and use of accounting information by managers of marketing.
5.3.3.2 Factors Influencing the Use of Accounting Information
In this section are presented some factors that influenced the use of accounting
information in Dimoda. The causes were organised separating those with structural
characteristics from those with functional characteristics. Structural causes refer to how
108 Interview with the Marketing Manager on 19/07/2011 (D08.05) 109 Interview with the Retail Director-General on 01/04/2011 (D06.15)

CHAPTER 5
142
information was organised and stored, as well as to how the accounting system was
designed (see Johnson and Kaplan 1987, p. 14). The functional (behavioural) causes
refers to how information flowed, i.e., how it was transmitted, analysed and interpreted
(see Hall 2010).
5.3.3.2.1 Structural Factors
5.3.3.2.1.1 Managers’ Mindset
One of the reasons given by the Dimoda Business Unit Director for the weak interaction
between accounting and other departments, and the poor use of accounting information by
managers of marketing was the company's culture. The Business Unit Director
commented:
“It was the culture across all enterprises [of this group] that created this situation [i.e., the disconnection between the accounting department and the commercial departments].”110
The Controller also said that her weak interaction with other departments was due
to the general policy of the company (see Hope and Fraser 2003a, p. 110). She said that
the board directors did not promote communication and interaction between the
department of management control and other functional managers, on a regular and
systematic basis. In this regard she said:
“It derives from the company policy. We do not have a policy of meetings and connections between departments. I am trying it now [regular meetings with the business directors]. […] It is not an established practice; it has not been established [regular communication between departments]. I think that very often each department is considered almost like a [sole] business. Instead of being a whole, i.e., instead of all departments being one whole [a well-connected team], they are not. Each of the various departments is its own world. There is a certain difficulty in communication between some departments. However the situation has improved. There is often... a lack of dialogue between departments. In order to develop the budget, the management control department should interface with all departments.”111
The Information System Director (hereafter referred to as IT Director) shared
these perspectives and commented that the departments of accounting and management
control were largely autonomous, and did not communicate with other departments (see
110 Interview with the Business Unit Director on 28/02/2011 (D01.23) 111 Interview with the Controller on 16/03/2011 (D04.06)
FIRST CASE STUDY: DIMODA
143
Hope and Fraser 2003a, p. 34). In this regard, he added that the departments were “small
islands. Small business units very closed in themselves.”112
The Business Unit Director explained that the size of the company – with many
and diverse business units – and limited resources in terms of management accounting,
also contributed negatively to the availability of accounting information to support
marketing management (see Ambler 2003b, p. 253).
The Marketing Manager revealed that the usefulness of accounting information
was not evident to her. She noted that, although she did not see the need to ask for
information from the accounting department, she would welcome any accounting
information that they could send and might be useful to her. She commented:
“If there is anything that the financial department can give me then it is super. I do not ask for anything [any accounting information] from them. We do not [discuss the management accounting reports].”113
The Director-General said that the commercial directors did not have a habit of
looking at and analysing all the headings of the income statement. The tradition in GR
was that the commercial and marketing directors were just focused on the volume of sales
(see Goebel et al. 1998, p. 498). The Director-General explained:
“The business directors were commercial directors [previously]. We are trying to ensure that they increasingly have the notion of the [whole] business. Previously they only cared about sales. The other things were our concern. […] Now, I think that all business managers are concerned with the bottom line.114 […] It has been an evolutionary process […] We began to structure everything so they started worrying about the costs and profitability, either wholly or in detail, in order to get more profits and monetise each brand.”115
The organisational structure and the limitations of information systems also
limited the use of accounting information by marketing and business managers. This
topic is covered in the next section.
5.3.3.2.1.2 Organisation and Information Technology
The Dimoda managers – from marketing, accounting, information technology and the
112 Interview with the Information System Director on 01/04/2011 (D05.42) 113 Interview with the Marketing Manager on 16/03/2011 (D02.46) 114 The bottom line of the profit and loss account, i.e., the net profit 115 Interview with the Retail Director-General on 01/04/2011 (D06.15)
CHAPTER 5
144
Director-General – reported that the processing of accounting information took too long.
On average, each monthly management report took two months to develop. The delay
was related to two factors. First, there were two information systems that were
independent and disconnected, one from the accounting department, the other from the
commercial department; second, the management accounting reports were produced after
the financial accounting terminated the VAT116 account – a process that took two months,
the Controller said.
The Controller explained that she initiated the preparation of budgets in October,
starting with calculations for the personnel costs. Throughout the year the Controller
analysed the variances on a regular monthly basis. The flaw that the Controller identified
was the delay in the process. The Controller explained:
“We do the monthly analysis – [however] we depend on the accounting department, and the bookkeeping closes at the time of submission of the declaration of VAT, i.e., in the second month. Usually we run with two months of information [not yet reported]. […] There are companies that close [the accounts] on the 4th or 5th day. We have some difficulty here in terms of time within that period. When we deliver the VAT [statement], the accounting closes and then we do the analysis of deviations and afterwards report it to the administration.”117
The Financial Accountant identified another flaw in the organisation and flow of
accounting information. She said the cost that produced large impacts on earnings was
the cost of goods sold. In this respect, the Financial Accountant said she had no
information about the costs of goods sold. It was the commercial department that
calculated the cost of goods sold and reported to the financial accounting department. She
also noted that this process caused delays and inaccuracies in accounting information and
reporting. The Financial Accountant stated:
“What has greater weight here [in the profit and loss account]? […] What has great weight here is the costing of materials. We have situations where we have not yet processed the data. We are unable to inform correctly because we depend on them [the commercial department]. Also, because they do not have time to make this information available as we would like.”118
The Director-General said that before the changes to the information system, the
accounting department had direct access to costs and profit margins and reported monthly 116 VAT represents the initials of value added tax 117 Interview with the Controller on 16/03/2011 (D04.02) 118 Interview with the Financial Accountant on 16/03/2011 (D03.58)
FIRST CASE STUDY: DIMODA
145
profit margins by each product. The Director-General described the changes:
“These days they are not working well with this program and I no longer have that information. [Before the changes] I had margins by each product and I always knew the cost of the goods [sold]. I always had [the profitability] by each product and could join – provided that the product code allowed it – by [product] categories.”119
The Controller noted that she had a colleague in the department of management
control who was dedicated to making an estimate of sales. The situation was motivated by
two factors. Firstly, the control department wanted to report information about sales to the
board directors. Secondly, there was a lack of financial data about sales caused by the two
months delay in financial accounting. The Controller said that it was provisional
information, obtained from the commercial manager. The Controller explained:
“[My colleague from the control department] makes the monthly sales control to report to the board, it is not done daily [...] because we have this two months delay in [financial] accounting, we haven’t got the sales data in [the system]. He uses other mechanisms [to obtain the data]: he goes to the commercial [manager], asking for information from the commercial [department]. It is provisional [information].”120
The Marketing Manager said that when the software allowing the analysis was
functioning she analysed the marketing campaigns and proposed new activities to the
business directors based on analyses of accounting information. In addition to the
analysis, the Marketing Manager produced reports for both the Marketing Director and
the Business Unit Director. The managers who were directly related to the entry and the
processing of accounting information were aware of these problems. And the Financial
Accountant commented that her main goal was to reorganise the financial accounting
procedures in order to gain synergies, in particular avoiding the duplication of clerical
tasks. The Financial Accountant explained:
“My ultimate goal is to gain maximum synergies between departments. Even within the [accounting] department we have to gain synergies. Why? Because there is a lot of work which, in my opinion – and I think in the opinion of my colleagues – is duplicated. This is because we have some flaws in the information systems – in terms of computer systems. In the commercial [department] they have at their disposal the AS400 [from IBM] we [the accounting department] have the NAV [from Microsoft].”121
119 Interview with the Retail Director-General on 01/04/2011 (D06.45) 120 Interview with the Controller on 16/03/2011 (D04.23) 121 Interview with the Financial Accountant on 16/03/2011 (D03.02)

CHAPTER 5
146
The IT Director acknowledged the existence of a problem in terms of the
adequacy of information systems for managerial decision making (see Eccles 1991, p. 4).
He said it was clear to him that the software had not kept up with the momentum of the
business, and that many directors were wasting their time manipulating data to get the
information, instead of focusing on their core businesses (see Hope and Fraser 2003a, p.
6). Due to financial constraints, and lack of support from the board directors he was not
able to solve the problem. The IT Director summed up the situation:
“There is too much manual work that could be avoided. They waste too much time in operational work, not in the analysis. The marketing and sales [departments] instead of focusing on analysing information focus on producing information. They spend 80% of their time producing information and 10% analysing. The information should be produced automatically by the IT and they should focus 80% on analysing.”122
The IT Director justified the situation by saying that the financial constraints of
the company had limited investments in new marketing and sales software, compatible
with the existing administrative and financial accounting software. The Dimoda IT
Director said that the decision not to invest in new commercial and management
accounting software came from the board directors and it was related to cost containment.
Nevertheless, he also said that the board was not conscious about the importance of
information technology (IT) resources to support decision making (see Hope and Fraser
2003a, p. 135; Johnson 1992, p. 65), e.g., in marketing and commercial management. The
IT Director commented:
“There is a cost reduction policy which leads to fewer resources […] The board decision, I am out of it, was to upgrade only the financial module […] The Board does not have yet the perception that a good IT tool is fundamental in the business.123 […] The board decision, I am out of it, was upgrading only the financial module [aiming at external financial reporting]. Our IT department sees that it should be a global infrastructure where all areas can communicate among themselves, speaking the same language. [It was only a partial upgrade because of] costs. Only [because of] costs. [...] The lag between the IT available tools and decision making is widening, […] In 5 or 6 years, we have not been able to answer [to business dynamics]. [...] This gap is increasing. It is problematic, it requires an urgent decision.”124
The Director-General said that the company had a strong reason for not changing
122 Interview with the Information System Director on 01/04/2011 (D05.63) 123 Interview with the Information System Director on 01/04/2011 (D05.06) 124 Interview with the Information System Director on 01/04/2011 (D05.24/44)

FIRST CASE STUDY: DIMODA
147
the management control system and the organisation of accounting information; that
reason was financial. She said they had no evidence that the gains from implementing a
system of stricter control outweighed the added costs of fixing the control system (see
Horngren 2004, p. 207). The Director-General rationalised her perspective on that:
“Controlling this aspect, in terms of sales? It would be difficult to allocate a person for this role. Because what you said about the Business Director carrying out the control on her own is true. But the cost of control has to justify the advantages. We felt no need to do so. Nowadays we have thought about that, [but] as we have to cut down on costs; there are situations [investments] that are not worth it.”125
The Marketing Manager also affirmed that she did not see financial viability in
renewing the software for marketing analysis. She commented:
“Nowadays we do not do [the measurement of marketing campaigns] because the MicroStrategy platform is not working. […] The MicroStrategy, seven or eight years ago [in 2003], cost more than 25,000 euros. Nowadays it is not worth investing so much money in a [CRM] platform only for us. We thought about it, but would have huge costs.”126
The Marketing Manager said that both the marketing budget and Dimoda had no
scale to pay for such a large investment and that the scope of their responsibilities did not
justify the investment. The Marketing Manager explained:
“These platforms and these systems are expensive. The budget of communication, that we have, cannot afford this software. Number two, to bring in this platform has to be something that has to be leveraged and monetised for the other group brands; ideally, hasn’t it? You cannot make such an investment only for a brand, when you can enjoy this same platform for other brands. No way, mainly for the first reason, the budget.”127
However, the Marketing Manager said that the lack of information to evaluate
marketing campaigns reduced her capacity to propose new marketing investments and the
realisation of new campaigns. The Marketing Manager summed up:
“If I have no way to analyse [the returns of campaigns] I cannot make proposals. I cannot justify and prove [that it is worthwhile]. [...] What is
125 Interview with the Retail Director-General on 01/04/2011 (D06.51) 126 Interview with the Marketing Manager on 19/07/2011 (D08.20) 127 Interview with the Marketing Manager on 19/07/2011 (D08.19)

CHAPTER 5
148
being done [in marketing] is not decided in this department; it is decided by the marketing and business director.”128
How the lack of communication between the various departments as well as other
functional aspects of Dimoda hindered access to accounting information is described in
the next sections.
5.3.3.2.2 Functional Factors
5.3.3.2.2.1 Communication Between Departments
One of the reasons given by Dimoda managers to explain why accounting information
was not regularly used by the marketing and sales departments was the lack of systematic
and regular communication between departments. For example, both the Business Unit
Director and the Controller said that they did not have systematic and frequent reporting
to the departmental managers, e.g., no management control reports were sent to the
marketing and commercial departments. The situation prevented the accounting
information from been taken into account in the commercial and marketing management.
Though the Business Unit Director and the Controller reported that communication
existed, it was not transmitted automatically, i.e., only when the managers asked for
information, it was provided by the department of accounting and management control.
The Business Unit Director explained:
“We only obtain information if we ask for it from the accounting department. I think it should be up to the accounting or control department to give us the cost information on a monthly basis which is important for our functioning, e.g., here is your budget for 2010, here is your actual position, analyse your variances, and check the variables you can manage to improve until the end of the year. I feel that there is this disconnection [between departments] and it would be a good thing if they could be more closely linked.”129
In this regard, the Controller explained how she behaved:
“When we need [information] we ask for it. There are no meetings for us to speak about it. Only when I need it I go to the department concerned, and vice-versa. The sales department also asks me, very often, e.g., ‘‘How much did we spend on this? How much did we spend on packing?’’ Some [departments] ask more questions than others. It is sporadic, it is not
128 Interview with the Marketing Manager on 19/07/2011 (D08.49/56) 129 Interview with the Business Unit Director on 28/02/2011 (D01.18)
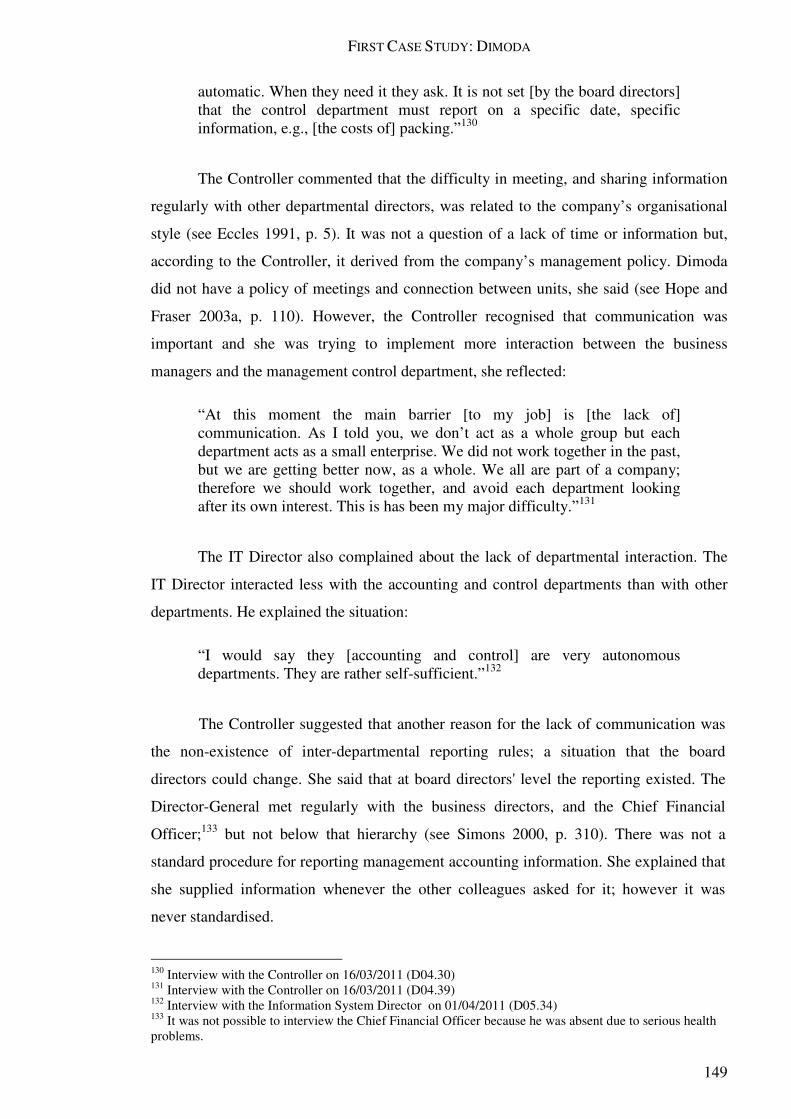
FIRST CASE STUDY: DIMODA
149
automatic. When they need it they ask. It is not set [by the board directors] that the control department must report on a specific date, specific information, e.g., [the costs of] packing.”130
The Controller commented that the difficulty in meeting, and sharing information
regularly with other departmental directors, was related to the company’s organisational
style (see Eccles 1991, p. 5). It was not a question of a lack of time or information but,
according to the Controller, it derived from the company’s management policy. Dimoda
did not have a policy of meetings and connection between units, she said (see Hope and
Fraser 2003a, p. 110). However, the Controller recognised that communication was
important and she was trying to implement more interaction between the business
managers and the management control department, she reflected:
“At this moment the main barrier [to my job] is [the lack of] communication. As I told you, we don’t act as a whole group but each department acts as a small enterprise. We did not work together in the past, but we are getting better now, as a whole. We all are part of a company; therefore we should work together, and avoid each department looking after its own interest. This is has been my major difficulty.”131
The IT Director also complained about the lack of departmental interaction. The
IT Director interacted less with the accounting and control departments than with other
departments. He explained the situation:
“I would say they [accounting and control] are very autonomous departments. They are rather self-sufficient.”132
The Controller suggested that another reason for the lack of communication was
the non-existence of inter-departmental reporting rules; a situation that the board
directors could change. She said that at board directors' level the reporting existed. The
Director-General met regularly with the business directors, and the Chief Financial
Officer;133 but not below that hierarchy (see Simons 2000, p. 310). There was not a
standard procedure for reporting management accounting information. She explained that
she supplied information whenever the other colleagues asked for it; however it was
never standardised.
130 Interview with the Controller on 16/03/2011 (D04.30) 131 Interview with the Controller on 16/03/2011 (D04.39) 132 Interview with the Information System Director on 01/04/2011 (D05.34) 133 It was not possible to interview the Chief Financial Officer because he was absent due to serious health problems.
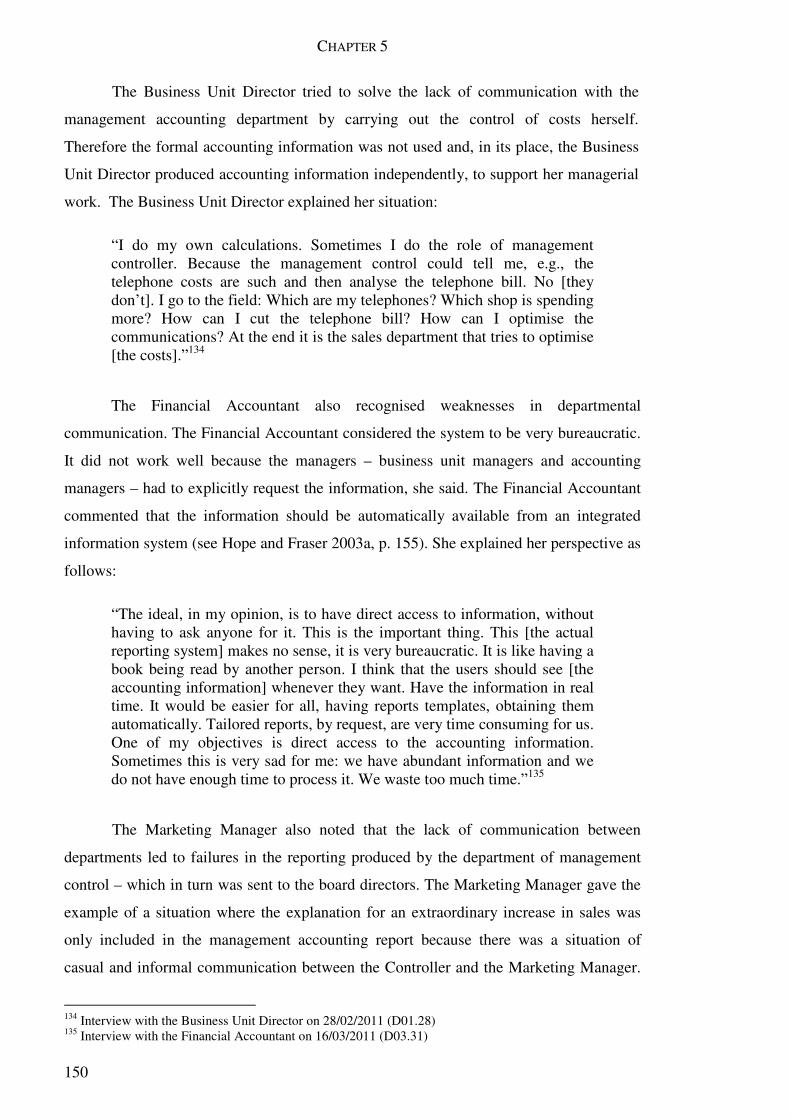
CHAPTER 5
150
The Business Unit Director tried to solve the lack of communication with the
management accounting department by carrying out the control of costs herself.
Therefore the formal accounting information was not used and, in its place, the Business
Unit Director produced accounting information independently, to support her managerial
work. The Business Unit Director explained her situation:
“I do my own calculations. Sometimes I do the role of management controller. Because the management control could tell me, e.g., the telephone costs are such and then analyse the telephone bill. No [they don’t]. I go to the field: Which are my telephones? Which shop is spending more? How can I cut the telephone bill? How can I optimise the communications? At the end it is the sales department that tries to optimise [the costs].”134
The Financial Accountant also recognised weaknesses in departmental
communication. The Financial Accountant considered the system to be very bureaucratic.
It did not work well because the managers – business unit managers and accounting
managers – had to explicitly request the information, she said. The Financial Accountant
commented that the information should be automatically available from an integrated
information system (see Hope and Fraser 2003a, p. 155). She explained her perspective as
follows:
“The ideal, in my opinion, is to have direct access to information, without having to ask anyone for it. This is the important thing. This [the actual reporting system] makes no sense, it is very bureaucratic. It is like having a book being read by another person. I think that the users should see [the accounting information] whenever they want. Have the information in real time. It would be easier for all, having reports templates, obtaining them automatically. Tailored reports, by request, are very time consuming for us. One of my objectives is direct access to the accounting information. Sometimes this is very sad for me: we have abundant information and we do not have enough time to process it. We waste too much time.”135
The Marketing Manager also noted that the lack of communication between
departments led to failures in the reporting produced by the department of management
control – which in turn was sent to the board directors. The Marketing Manager gave the
example of a situation where the explanation for an extraordinary increase in sales was
only included in the management accounting report because there was a situation of
casual and informal communication between the Controller and the Marketing Manager.
134 Interview with the Business Unit Director on 28/02/2011 (D01.28) 135 Interview with the Financial Accountant on 16/03/2011 (D03.31)

FIRST CASE STUDY: DIMODA
151
The Marketing Manager explained:
“One problem that we have in this company is the lack of [formal] communication. I learn [and communicate] during lunches and informal situations. For example, in a certain month in 2009, we had an extraordinary increase in the sales on the Friday’s Project,136 because we did a very important campaign that attracted people to the stores – the objective was a ticket of €100. We had an objective of 30 people, and more than 55 appeared, across all national stores. The monthly sales report mentioned that the increase in sales was explained, in part, by the marketing campaign… [However] I usually don’t pass on this information [related to the campaigns]. Is it supposed to be given? I had the information, I commented on it informally during the lunch and after that [the controller included it in the monthly reports]!”137
At the same time, the Controller reported that she had no information from
business departments and complained not having an automatic system enabling the
flowing of information from the managers of marketing and sales to the management
accounting department. The Controller observed:
“If I want a piece of information then I must ask directly [to the commercial managers]; I do not have access to the commercial [information system] either.”138
The Controller noted that while she provided all the information asked from her,
she felt the need to interact more with managers. She explained that the business
managers were aware of all the business details and so they were essential for planning
and budgeting (see Anthony and Govindarajan 2003, pp. 420-421). The Controller
commented:
“I do not [have frequent meetings with my colleagues from other departments]. Now, during the budget, I tried – in this case with the Dimoda Business Director – to prepare certain items in the operating account while talking to them and ask them what they thought. Because it is they who know about the business, e.g., how much they intend to spend on the transportation of staff, or how much they intend to set for the phone call costs; this kind of situation.”139
136 Friday’s Project was a trademark owned by the Grupo Regojo 137 Interview with the Marketing Manager on 16/03/2011 (D02.13) 138 Interview with the Controller on 16/03/2011 (D04.41) 139 Interview with the Controller on 16/03/2011 (D04.04)
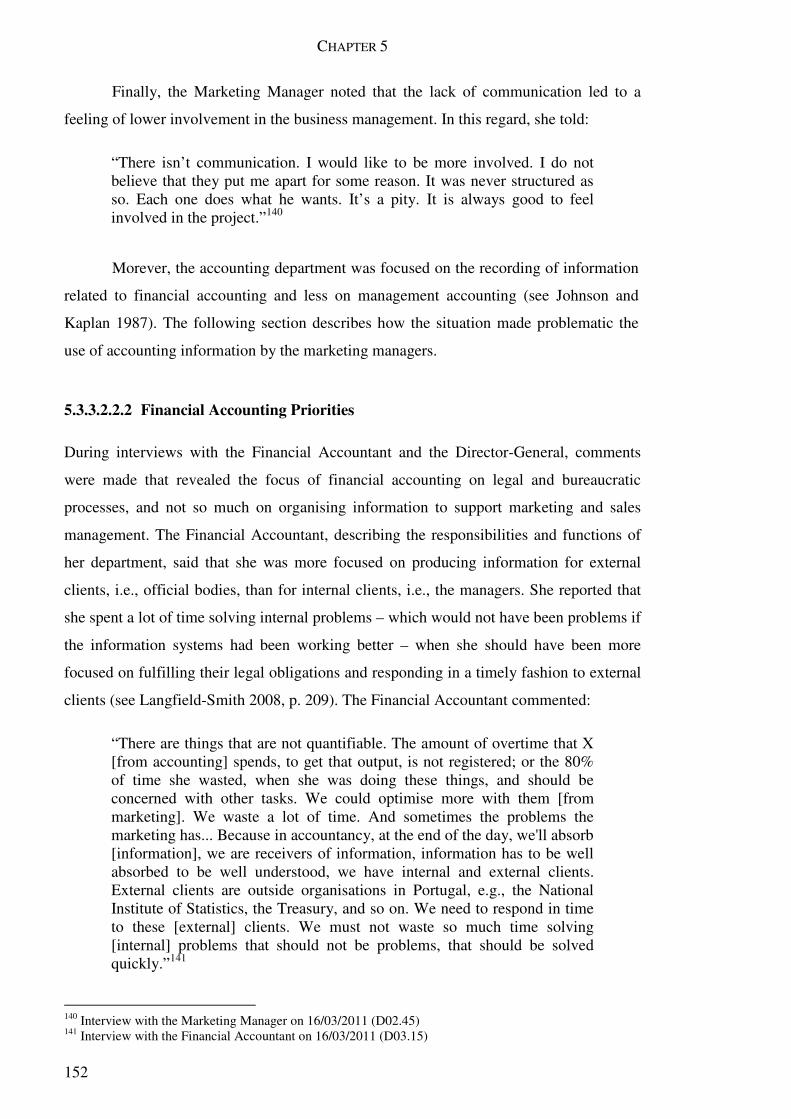
CHAPTER 5
152
Finally, the Marketing Manager noted that the lack of communication led to a
feeling of lower involvement in the business management. In this regard, she told:
“There isn’t communication. I would like to be more involved. I do not believe that they put me apart for some reason. It was never structured as so. Each one does what he wants. It’s a pity. It is always good to feel involved in the project.”140
Morever, the accounting department was focused on the recording of information
related to financial accounting and less on management accounting (see Johnson and
Kaplan 1987). The following section describes how the situation made problematic the
use of accounting information by the marketing managers.
5.3.3.2.2.2 Financial Accounting Priorities
During interviews with the Financial Accountant and the Director-General, comments
were made that revealed the focus of financial accounting on legal and bureaucratic
processes, and not so much on organising information to support marketing and sales
management. The Financial Accountant, describing the responsibilities and functions of
her department, said that she was more focused on producing information for external
clients, i.e., official bodies, than for internal clients, i.e., the managers. She reported that
she spent a lot of time solving internal problems – which would not have been problems if
the information systems had been working better – when she should have been more
focused on fulfilling their legal obligations and responding in a timely fashion to external
clients (see Langfield-Smith 2008, p. 209). The Financial Accountant commented:
“There are things that are not quantifiable. The amount of overtime that X [from accounting] spends, to get that output, is not registered; or the 80% of time she wasted, when she was doing these things, and should be concerned with other tasks. We could optimise more with them [from marketing]. We waste a lot of time. And sometimes the problems the marketing has... Because in accountancy, at the end of the day, we'll absorb [information], we are receivers of information, information has to be well absorbed to be well understood, we have internal and external clients. External clients are outside organisations in Portugal, e.g., the National Institute of Statistics, the Treasury, and so on. We need to respond in time to these [external] clients. We must not waste so much time solving [internal] problems that should not be problems, that should be solved quickly.”141
140 Interview with the Marketing Manager on 16/03/2011 (D02.45) 141 Interview with the Financial Accountant on 16/03/2011 (D03.15)
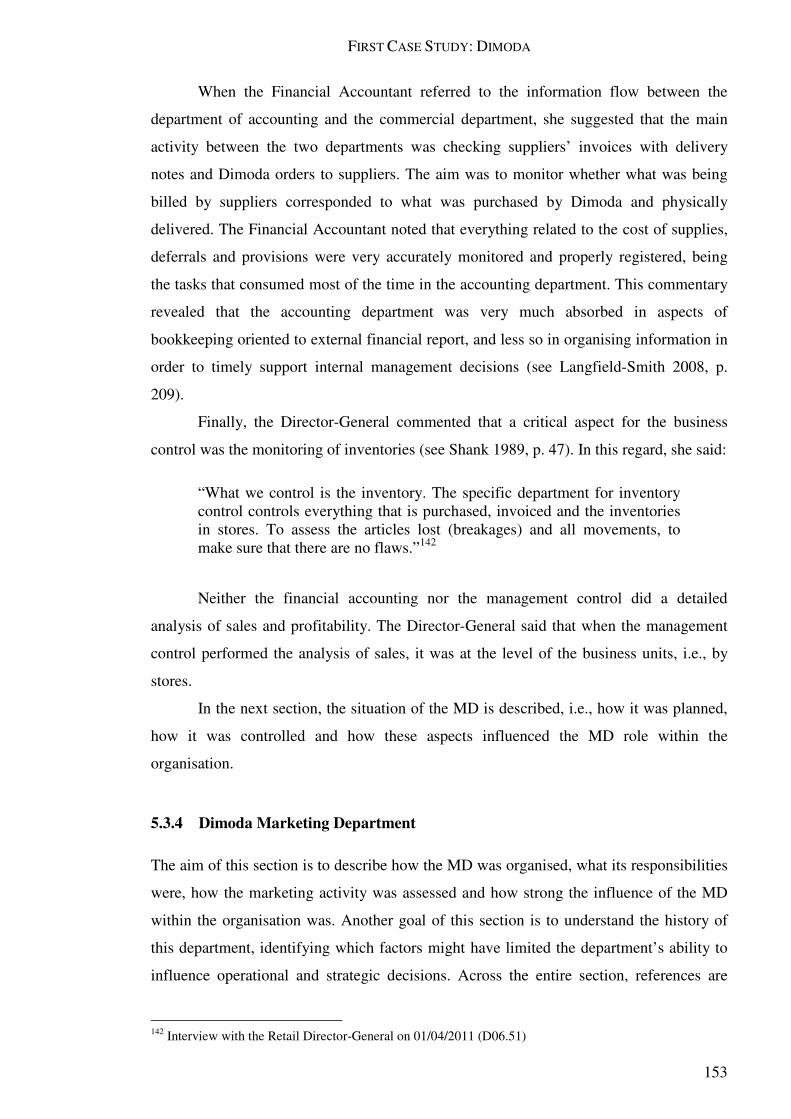
FIRST CASE STUDY: DIMODA
153
When the Financial Accountant referred to the information flow between the
department of accounting and the commercial department, she suggested that the main
activity between the two departments was checking suppliers’ invoices with delivery
notes and Dimoda orders to suppliers. The aim was to monitor whether what was being
billed by suppliers corresponded to what was purchased by Dimoda and physically
delivered. The Financial Accountant noted that everything related to the cost of supplies,
deferrals and provisions were very accurately monitored and properly registered, being
the tasks that consumed most of the time in the accounting department. This commentary
revealed that the accounting department was very much absorbed in aspects of
bookkeeping oriented to external financial report, and less so in organising information in
order to timely support internal management decisions (see Langfield-Smith 2008, p.
209).
Finally, the Director-General commented that a critical aspect for the business
control was the monitoring of inventories (see Shank 1989, p. 47). In this regard, she said:
“What we control is the inventory. The specific department for inventory control controls everything that is purchased, invoiced and the inventories in stores. To assess the articles lost (breakages) and all movements, to make sure that there are no flaws.”142
Neither the financial accounting nor the management control did a detailed
analysis of sales and profitability. The Director-General said that when the management
control performed the analysis of sales, it was at the level of the business units, i.e., by
stores.
In the next section, the situation of the MD is described, i.e., how it was planned,
how it was controlled and how these aspects influenced the MD role within the
organisation.
5.3.4 Dimoda Marketing Department
The aim of this section is to describe how the MD was organised, what its responsibilities
were, how the marketing activity was assessed and how strong the influence of the MD
within the organisation was. Another goal of this section is to understand the history of
this department, identifying which factors might have limited the department’s ability to
influence operational and strategic decisions. Across the entire section, references are
142 Interview with the Retail Director-General on 01/04/2011 (D06.51)
CHAPTER 5
154
made to the interactions between the marketing and the management accounting
departments, whenever these interactions existed. The qualitative study of these two
aspects – the dynamics of the influence of the MD and the evaluation of its performance –
is intended to complement existing quantitative studies on the same topic (e.g., O'Sullivan
et al. 2009; Verhoef et al. 2011).
The first section describes how the MD was organised, and how the planning and
budgeting of its activities were done. The second section explores whether a cost and
benefit analysis of marketing activities existed, whether a measurement of marketing
performance was realised, and the impact of both practices on marketing management.
The final section describes the MD influence within the organisation.
5.3.4.1 Marketing Department Planning and Budgeting
The GR’s MD consisted of two people: one manager and one assistant. The number of
staff at the MD decreased in 2009. Before 2009, the department employed four people:
one director, one manager, and two assistants.
The Board Member said that the MD was always a complicated problem in the
company, because the MD was operating from the head office and the group structure
was very unbalanced. The first issue was that one brand (Dutti) had 80% of sales, and the
others, even when they had five or six brands (see Appendix 5), on the whole sold less
than 20% of the total, the Board Member said. Secondly, from all these brands, only one
brand was created by the GR, which was Wesley. While Dimoda was at the lower end of
the market, Wesley was at the top. Wesley was operating with much higher margins,
much more expensive products and with much more capacity to spend money on
marketing. The Marketing Manager shared the Board Member’s perspective. In her
opinion the reduction in the MD staff was not only a result of the decreasing number of
brands managed but also the result of a decrease in the workload. She explained that this
was not necessarily proportional to the number of brands, because some brands did more
marketing than others. Between 2006 and 2010 the group sold six brands: Elena Miró
(2006), Mango (2007), Hakei (2007), Punt Roma (2008), Orchestra (2009) and Wesley
(2010); having added two, i.e., Nike (2006) and Friday’s Project (2008).
The marketing budget used to be proposed for approval, by the Business Unit
Director, to the board directors, during the annual budgeting process (see Table 5-11).
After approval, the Marketing Manager planned the activities, having in mind the ceiling
amount to be spent (see Hope and Fraser 2003a, p. 21).
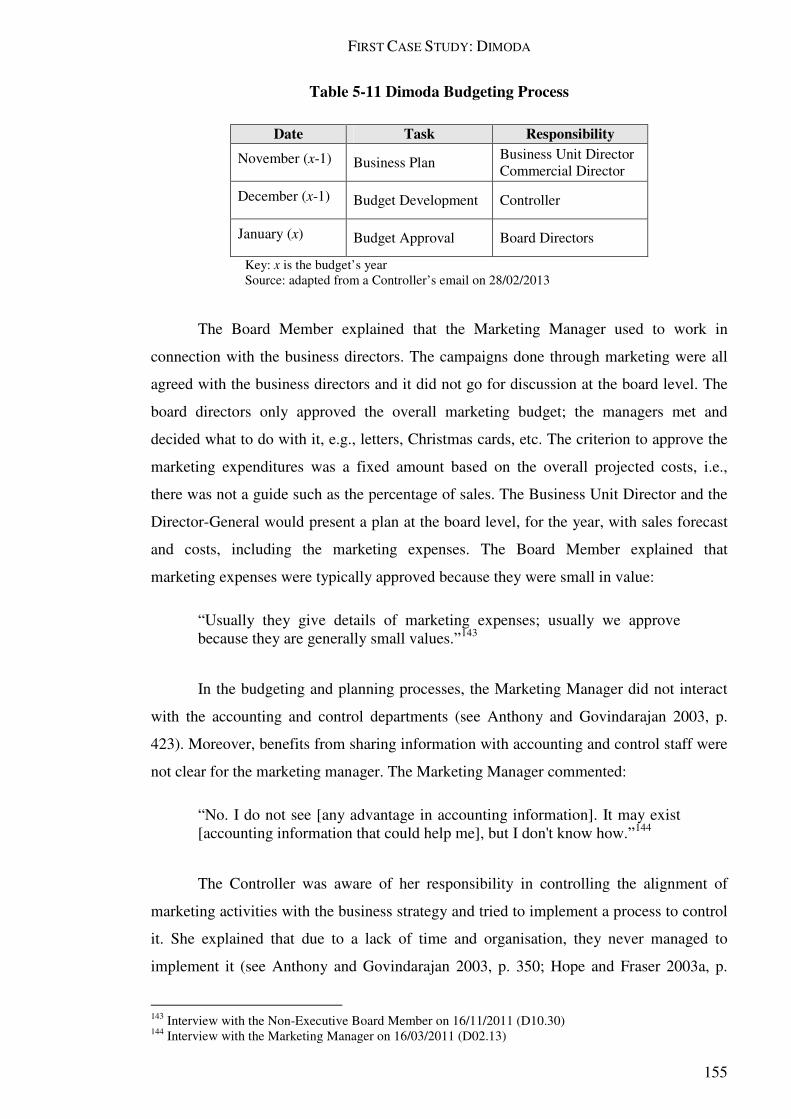
FIRST CASE STUDY: DIMODA
155
Table 5-11 Dimoda Budgeting Process
Date Task Responsibility
November (x-1) Business Plan Business Unit Director Commercial Director
December (x-1) Budget Development Controller
January (x) Budget Approval Board Directors
Key: x is the budget’s year Source: adapted from a Controller’s email on 28/02/2013
The Board Member explained that the Marketing Manager used to work in
connection with the business directors. The campaigns done through marketing were all
agreed with the business directors and it did not go for discussion at the board level. The
board directors only approved the overall marketing budget; the managers met and
decided what to do with it, e.g., letters, Christmas cards, etc. The criterion to approve the
marketing expenditures was a fixed amount based on the overall projected costs, i.e.,
there was not a guide such as the percentage of sales. The Business Unit Director and the
Director-General would present a plan at the board level, for the year, with sales forecast
and costs, including the marketing expenses. The Board Member explained that
marketing expenses were typically approved because they were small in value:
“Usually they give details of marketing expenses; usually we approve because they are generally small values.”143
In the budgeting and planning processes, the Marketing Manager did not interact
with the accounting and control departments (see Anthony and Govindarajan 2003, p.
423). Moreover, benefits from sharing information with accounting and control staff were
not clear for the marketing manager. The Marketing Manager commented:
“No. I do not see [any advantage in accounting information]. It may exist [accounting information that could help me], but I don't know how.”144
The Controller was aware of her responsibility in controlling the alignment of
marketing activities with the business strategy and tried to implement a process to control
it. She explained that due to a lack of time and organisation, they never managed to
implement it (see Anthony and Govindarajan 2003, p. 350; Hope and Fraser 2003a, p.
143 Interview with the Non-Executive Board Member on 16/11/2011 (D10.30) 144 Interview with the Marketing Manager on 16/03/2011 (D02.13)
CHAPTER 5
156
xvii). Dimoda did not have a balanced scorecard and did not use qualitative information
in the management control system (see Ambler 2003b, p. 26). The Controller only used
the budget for controlling marketing management (see Hope and Fraser 2003a, p. xviii).
The Controller explained:
“We are improving; we intend to include these topics. Earlier, the information system was not flexible enough; it didn't give any information. With the new accounting software and improvement in cost knowledge, we have time to analyse other topics and interesting issues. [We started] to think about setting a balanced scorecard. We want not only to consider expenses and income, but to include other realities, e.g., customers.”145
The Controller also said that the costs of the MD were considered an overhead and
allocated them to the business units proportionally to the sales. The specific marketing
campaigns were invoiced directly to the business units.
The following section describes the process of marketing performance
measurement and accountability in Dimoda.
5.3.4.2 Marketing Accountability
One of the major decisions about the MD’s structure was the reduction of marketing staff.
The causes for dismissing the Marketing Director were not known by either the Business
Unit Director or the Marketing Manager. The Business Unit Director commented:
“She left in 2009 or beginning of 2010. [The reason for her leaving] I am not able to tell you. I do not know [whether the reason was related to cost]. The decision to reduce or not to reduce the marketing [resources] came from the board directors. We have no input on this.”146
The Board Member commented that the dismissal of the Marketing Director was
due to economic reasons, i.e., lack of money for marketing, and the Marketing Director
salary was considered to be high. He also explained that the secretary of the former
Marketing Director was appointed to the marketing manager position. The decision
involved, mainly, a cost analysis and the Board Member commented that he was not
aware of the returns on marketing activities: “No, definitely, I have no knowledge of
[criteria for evaluating the marketing actions]!”147
145 Interview with the Controller on 16/03/2011 (D04:21) 146 Interview with the Business Unit Director on 12/07/2011 (D07.13) 147 Interview with the Non-Executive Board Member on 16/11/2011 (D10.32)

FIRST CASE STUDY: DIMODA
157
The Director-General confirmed that she always had difficulty in measuring the
return on marketing investments, and it was traced to poor information technology. The
Business Unit Director explained:
“There is no way of measuring the impact of marketing campaigns. We have no tools that allow for that.”148
The Business Unit Director gave the example of SMS messages: they tried to
understand customer behaviour, checking whether after receiving the SMS messages they
made a store visit, but the system could not provide this information (see Johnson 1992,
p. 65). The Marketing Manager also reported that the impact of the marketing activities
could not be measured because the CRM software was not working, she explained:
“Since the beginning of March [2011] we have been doing several campaigns; I think, that they are indeed very interesting campaigns. Unfortunately, we can not analyse them; we can not do an analytical assessment because the CRM tools are down. We can grasp the numbers by comparing [the actual sales] with those of the previous year [sales]. Mother's Day went well, Women's Day went well, and Father's Day (this weekend) is having good indicators. This is what we have up to date. We do not have an analytical assessment, we don't do that.”149
The lack of appropriate IT tools limited the capacity of the MD to propose new
activities. The Marketing Manager explained that until 2008, with the CRM platform
stable, they were able to propose the activities to the business directors. Although the plan
was scheduled for the full year, they adapted the plan throughout the year. She gave the
example when they observed, using appropriate software, that at Dimoda – a multi-brand
for men and women – 75% of their customer database was composed of men. Therefore
they proposed an action member-get-member to acquire further female customers.
Without appropriate CRM software, the MD could not identify the marketing
opportunities and propose the responses to the board level, as they had proposed in the
past. The Marketing Manager explained:
“Until 2008, with the CRM platform stable, we were able to propose, we always do so, propose the activities to the business directors. Although the plan is scheduled for the full year, we need to adapt the plan throughout the year.”150
148 Interview with the Business Unit Director on 12/07/2011 (D07.10) 149 Interview with the Marketing Manager on 16/03/2011 (D02.03) 150 Interview with the Marketing Manager on 16/03/2011 (D02.10)
CHAPTER 5
158
Before 2010, it was also possible to measure some marketing outputs, e.g.,
cardholders’ purchases, average ticket amounts, and number of articles purchased at each
visit. The inadequate computer software was impairing the capacity to assess the results
of the 2010 and 2011 campaigns. For the Marketing Manager it was clear that the absence
of marketing measurement was harming the brand. She said that the lack of tools “hurt
the brand, not the department”.151 She explained that the department existed to serve the
brand and the lack of tools with which to measure the return of campaigns had a
profoundly adverse effect on the brand when proposing new activities (see Ambler
2003b). The Business Unit Director also argued that it was very difficult to evaluate the
return of marketing expenditures and, in this context, any expenditure in marketing
domain needed to be carefully planned. For example, the decision to supply clothing for
television presenters was related to the lower costs of this communication channel. The
Business Unit Director justified this choice using a cost-benefit analysis:
“If we had bought these cards, or invested in publicity, the cost would have been much higher than the cost of clothes supplied in exchange for it.”152
The Dimoda methodology for assessing the “value” of campaigns involved
looking at the market value of the communication media space, and not on the impact of
the campaigns on the business profitability. The Marketing Manager explained how they
measured the value of campaigns:
“I do reports not from marketing but from communication activities. We make an investment in media, e.g., partnerships and publicity exchanges with television channels, the return for our expense of €X is the appearance of #X cards of brand publicity. Therefore, we can measure the return in this way: we invest €X, e.g., €5.000 and we have a return of €50.000, in case we have to pay that publicity [it would cost €50.000].”153
Regarding billboards, the Business Unit Director vehemently rejected that
communication channel due to the lack of financial metrics for assessing the net impact
on profitability:
“I would love [to use street billboards], it is where I would do [publicity]; but it is something totally unthinkable, totally unthinkable, and hugely expensive. We are speaking about 30, 40, 50 or 60,000 euros for a set of billboards, from which half a dozen may have a good location but the rest
151 Interview with the Marketing Manager on 19/07/2011 (D08.48) 152 Interview with the Business Unit Director on 12/07/2011 (D07:04) 153 Interview with the Marketing Manager on 19/07/2011 (D08.56)
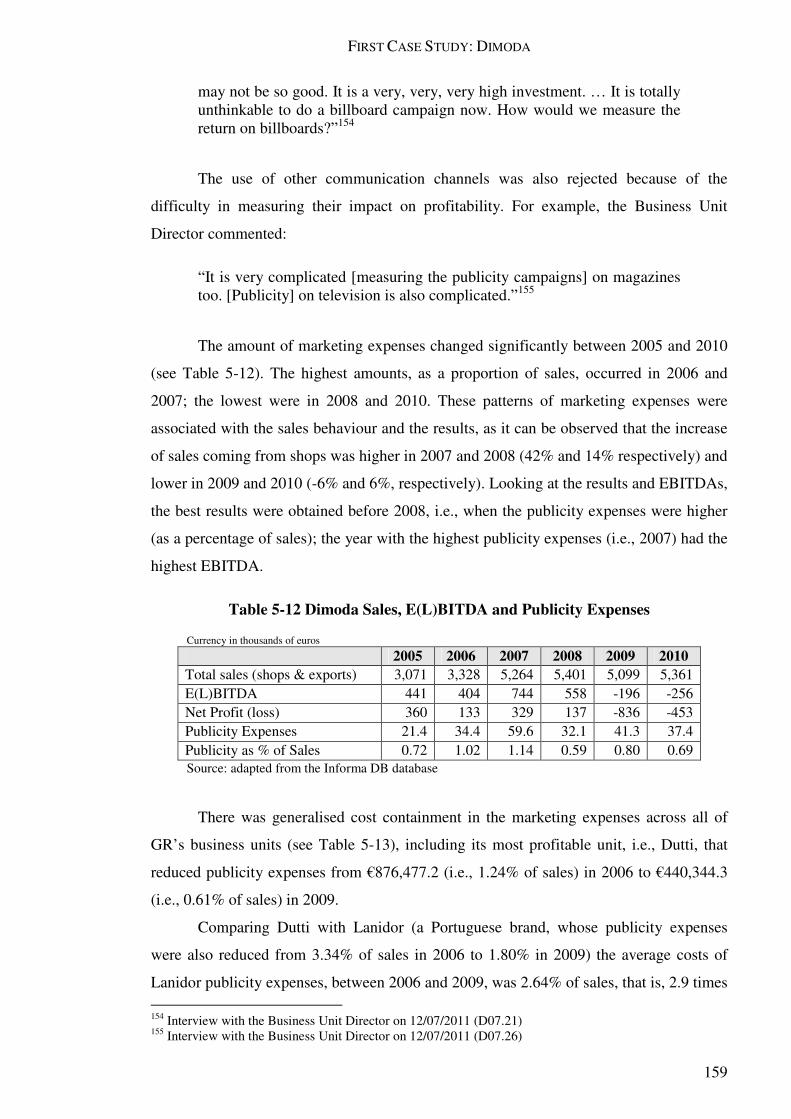
FIRST CASE STUDY: DIMODA
159
may not be so good. It is a very, very, very high investment. … It is totally unthinkable to do a billboard campaign now. How would we measure the return on billboards?”154
The use of other communication channels was also rejected because of the
difficulty in measuring their impact on profitability. For example, the Business Unit
Director commented:
“It is very complicated [measuring the publicity campaigns] on magazines too. [Publicity] on television is also complicated.”155
The amount of marketing expenses changed significantly between 2005 and 2010
(see Table 5-12). The highest amounts, as a proportion of sales, occurred in 2006 and
2007; the lowest were in 2008 and 2010. These patterns of marketing expenses were
associated with the sales behaviour and the results, as it can be observed that the increase
of sales coming from shops was higher in 2007 and 2008 (42% and 14% respectively) and
lower in 2009 and 2010 (-6% and 6%, respectively). Looking at the results and EBITDAs,
the best results were obtained before 2008, i.e., when the publicity expenses were higher
(as a percentage of sales); the year with the highest publicity expenses (i.e., 2007) had the
highest EBITDA.
Table 5-12 Dimoda Sales, E(L)BITDA and Publicity Expenses
Currency in thousands of euros
2005 2006 2007 2008 2009 2010 Total sales (shops & exports) 3,071 3,328 5,264 5,401 5,099 5,361 E(L)BITDA 441 404 744 558 -196 -256 Net Profit (loss) 360 133 329 137 -836 -453 Publicity Expenses 21.4 34.4 59.6 32.1 41.3 37.4 Publicity as % of Sales 0.72 1.02 1.14 0.59 0.80 0.69
Source: adapted from the Informa DB database
There was generalised cost containment in the marketing expenses across all of
GR’s business units (see Table 5-13), including its most profitable unit, i.e., Dutti, that
reduced publicity expenses from €876,477.2 (i.e., 1.24% of sales) in 2006 to €440,344.3
(i.e., 0.61% of sales) in 2009.
Comparing Dutti with Lanidor (a Portuguese brand, whose publicity expenses
were also reduced from 3.34% of sales in 2006 to 1.80% in 2009) the average costs of
Lanidor publicity expenses, between 2006 and 2009, was 2.64% of sales, that is, 2.9 times 154 Interview with the Business Unit Director on 12/07/2011 (D07.21) 155 Interview with the Business Unit Director on 12/07/2011 (D07.26)
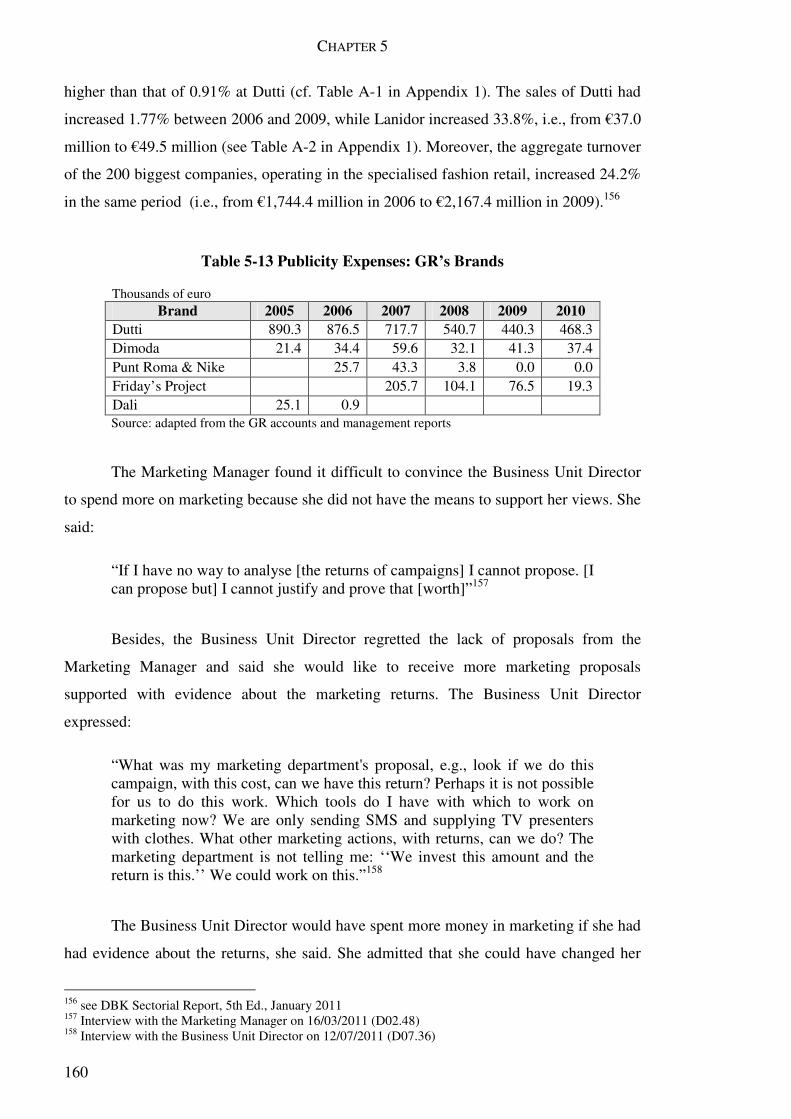
CHAPTER 5
160
higher than that of 0.91% at Dutti (cf. Table A-1 in Appendix 1). The sales of Dutti had
increased 1.77% between 2006 and 2009, while Lanidor increased 33.8%, i.e., from €37.0
million to €49.5 million (see Table A-2 in Appendix 1). Moreover, the aggregate turnover
of the 200 biggest companies, operating in the specialised fashion retail, increased 24.2%
in the same period (i.e., from €1,744.4 million in 2006 to €2,167.4 million in 2009).156
Table 5-13 Publicity Expenses: GR’s Brands
Thousands of euro Brand 2005 2006 2007 2008 2009 2010
Dutti 890.3 876.5 717.7 540.7 440.3 468.3 Dimoda 21.4 34.4 59.6 32.1 41.3 37.4 Punt Roma & Nike 25.7 43.3 3.8 0.0 0.0 Friday’s Project 205.7 104.1 76.5 19.3 Dali 25.1 0.9 Source: adapted from the GR accounts and management reports
The Marketing Manager found it difficult to convince the Business Unit Director
to spend more on marketing because she did not have the means to support her views. She
said:
“If I have no way to analyse [the returns of campaigns] I cannot propose. [I can propose but] I cannot justify and prove that [worth]”157
Besides, the Business Unit Director regretted the lack of proposals from the
Marketing Manager and said she would like to receive more marketing proposals
supported with evidence about the marketing returns. The Business Unit Director
expressed:
“What was my marketing department's proposal, e.g., look if we do this campaign, with this cost, can we have this return? Perhaps it is not possible for us to do this work. Which tools do I have with which to work on marketing now? We are only sending SMS and supplying TV presenters with clothes. What other marketing actions, with returns, can we do? The marketing department is not telling me: ‘‘We invest this amount and the return is this.’’ We could work on this.”158
The Business Unit Director would have spent more money in marketing if she had
had evidence about the returns, she said. She admitted that she could have changed her
156 see DBK Sectorial Report, 5th Ed., January 2011 157 Interview with the Marketing Manager on 16/03/2011 (D02.48) 158 Interview with the Business Unit Director on 12/07/2011 (D07.36)

FIRST CASE STUDY: DIMODA
161
perspective towards the expenditures in marketing, e.g., billboards, had she had financial
metrics to support her decision. The Business Unit Director expressed:
“We already did it [billboards] once with the Dali brand, but we didn't have the expected impact, the expected return. […] If you tell me that we had an expenditure of €50,000 over the last 15 days and the sales increased 40% over the following 2 months, then we could conclude that the sales increase was a consequence of billboards. […] We could do a long-term analysis that could change this perspective, but we do not have the tools for it. It is very complicated nowadays and we do not have the financial resources for it.”159
However, the Marketing Manager considered, in some situations, not appropriate
to use a simple cost and benefit analysis in marketing management. She gave the example
of marketing notices in stores. She said it was not about cost-benefit analysis, but it was
more related to the brand image. She argued as follows:
“If we want to push the brand we need to push it up, never down. The good thing about this brand is that it has quality in its segment. [Dimoda] has a known brand, [i.e.,] Pierre Cardin, which attracts many people; it has nice window displays, well looked after shops, but uses details as paper sheets glued on windows. It can't be like this.”160
Finally, the next section describes how the Dimoda marketing department
influenced business management.
5.3.4.3 Marketing Department Stature and Influence
The Marketing Manager suggested that she was frustrated, unhappy and unmotivated. She
acknowledged that she was not informed about the business strategy, objectives and
performance (see Anthony and Govindarajan 2003, p. 350; Hope and Fraser 2003a, p. 49;
Simons 1995b, p. 117). She expressed herself as someone that only had operational duties
but had no participation in business marketing decisions and strategy formulation (see
Low and Mohr 2000; Stewart 2009). The Marketing Manager expressed:
“Nowadays I am a little sad, because I would like to be more linked to the [marketing] strategic issues and less with the operational [marketing]. Nowadays I am only and exclusively operational.”161
159 Interview with the Business Unit Director on 12/07/2011 (D07.21) 160 Interview with the Marketing Manager on 16/03/2011 (D02.24) 161 Interview with the Marketing Manager on 16/03/2011 (D02.07)
CHAPTER 5
162
The Marketing Manager said that, in the past, she already had power to influence
decisions at the board level. When the MD had new ideas, e.g., the customer support line,
these were approved at the board level and implemented. However, she said, it changed
and the MD had then less influence at the board level. She commented that it was also
related to the budgets and when the budgets decrease there is less money for more actions
(see Webster Jr et al. 2005, p. 39). Therefore, “they restricted it to the basic needs, to the
strictly necessary” (see Simons 1995b, p. 54).162 She commented:
“[The marketing department is losing its importance] it is not just financial, it is cultural. It's cultural. When I say cultural, look, I'm talking about the Business Director. […] The Grupo Regojo never stopped believing in communication and, as you say, there were never significant cuts in other budget brands, quite the contrary […]. Therefore, the group always believed and never stopped believing in communication; or marketing and communication.”163
About the size and level of responsibility of the MD, the Director-General said
that the MD had ceased to be an autonomous unit in terms of decision-making and
became a unit that coordinates the activities of communication and marketing. She
explained:
“Earlier, the marketing [department] was a principal department, but the Marketing Director left. And now it is not even a department, it is a coordination – a level still below [...] Our group is shrinking.”164
The Marketing Manager commented that she did not understand the marketing and
communication strategy of the Business Unit Director. The Marketing Manager
considered that the images of the brands traded by Dimoda (Pierre Cardin and Dali) were
not properly communicated, and the image of Dimoda shops was badly managed. For
instance, the Marketing Manager did not understand why the Business Unit Director used
very low quality paper, poorly posted, at the front store’s windows for communicating
marketing messages (see Ambler 2003b, p. 253).
The Marketing Manager argued that the massive use of SMS was ill-fitted to the
customers’ profile (see Table 5-14). The Marketing Manager also commented that she did
not have “knowledge” of Dimoda brand.
162 Interview with the Marketing Manager on 19/07/2011 (D08.28) 163 Interview with the Marketing Manager on 19/07/2011 (D08.39) 164 Interview with the Retail Director-General on 01/04/2011 (D06.08)
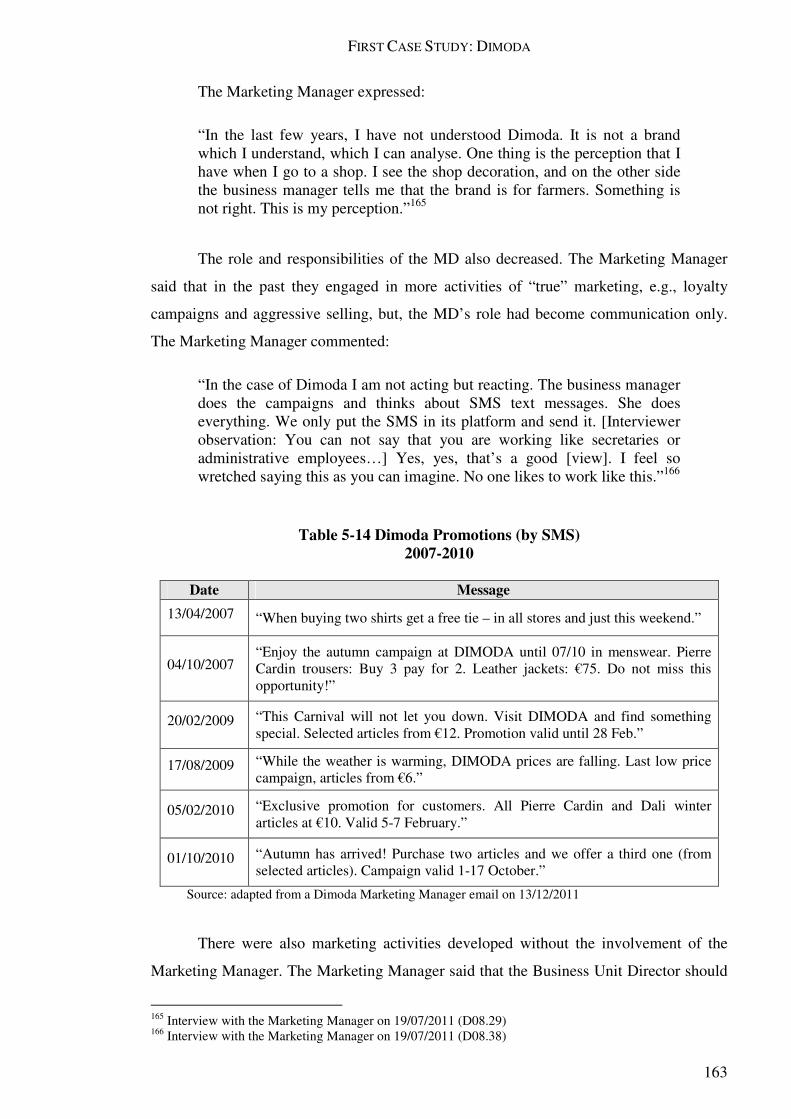
FIRST CASE STUDY: DIMODA
163
The Marketing Manager expressed:
“In the last few years, I have not understood Dimoda. It is not a brand which I understand, which I can analyse. One thing is the perception that I have when I go to a shop. I see the shop decoration, and on the other side the business manager tells me that the brand is for farmers. Something is not right. This is my perception.”165
The role and responsibilities of the MD also decreased. The Marketing Manager
said that in the past they engaged in more activities of “true” marketing, e.g., loyalty
campaigns and aggressive selling, but, the MD’s role had become communication only.
The Marketing Manager commented:
“In the case of Dimoda I am not acting but reacting. The business manager does the campaigns and thinks about SMS text messages. She does everything. We only put the SMS in its platform and send it. [Interviewer observation: You can not say that you are working like secretaries or administrative employees…] Yes, yes, that’s a good [view]. I feel so wretched saying this as you can imagine. No one likes to work like this.”166
Table 5-14 Dimoda Promotions (by SMS) 2007-2010
Date Message
13/04/2007 “When buying two shirts get a free tie – in all stores and just this weekend.”
04/10/2007 “Enjoy the autumn campaign at DIMODA until 07/10 in menswear. Pierre Cardin trousers: Buy 3 pay for 2. Leather jackets: €75. Do not miss this opportunity!”
20/02/2009 “This Carnival will not let you down. Visit DIMODA and find something special. Selected articles from €12. Promotion valid until 28 Feb.”
17/08/2009 “While the weather is warming, DIMODA prices are falling. Last low price campaign, articles from €6.”
05/02/2010 “Exclusive promotion for customers. All Pierre Cardin and Dali winter articles at €10. Valid 5-7 February.”
01/10/2010 “Autumn has arrived! Purchase two articles and we offer a third one (from selected articles). Campaign valid 1-17 October.”
Source: adapted from a Dimoda Marketing Manager email on 13/12/2011
There were also marketing activities developed without the involvement of the
Marketing Manager. The Marketing Manager said that the Business Unit Director should
165 Interview with the Marketing Manager on 19/07/2011 (D08.29) 166 Interview with the Marketing Manager on 19/07/2011 (D08.38)
CHAPTER 5
164
communicate more and consider others’ opinions. She explained:
“There is another puzzling input related to Dimoda, I would even say problematic. We should have communication between the Business Director and us, e.g., [the Business Director could say] ‘‘Look, we have this problem with this polo shirt line, it is not selling well, think about a campaign’’ but no, the Business Director immediately says what she wants, e.g., ‘‘Send a SMS tomorrow morning at 10 a.m.’’ with the campaign details: ‘‘Polo shirts starting at €5.’’ Finish, the campaign is done.”167
The Marketing Manager was not informed about the brand concept and showed
disagreement with the promotions made by the Business Director. She considered the
frequent price promotions not advantageous for the brand (see Table 5-14). She
commented that “the [Dimoda] brand gives itself the luxury of always being,
systematically, doing [price] promotions shamelessly”168 (see Johnson 1992, p. 24). The
Marketing Manager also said that when someone asked her about the brand concept she
improvised or “invented” (see Simons 1995b, p. 117).169 She acted in this manner because
it was for the outside world and she had internal approval, she explained:
“What is the brand strategy? To me… it was never communicated to me, what is the strategy of the brand or what the brand concept is. I should not invent when someone asks me ‘‘Say a few words here about the concept of the [Dimoda] brand.’’ [However] I invent, but it is because it is for outside and I have the internal approval. But that is not what people think. I'd like to know what people think.”170
Moreover, the Marketing Manager was not asked to contribute to decisions about
new markets, business strategy or new products (see Simons 1995b, p. 54). The Business
Unit Director did not talk about strategy with the Marketing Manager and the Marketing
Manager did not know the strategy of the business (see Anthony and Govindarajan 2003,
p. 350; Hope and Fraser 2003a, p. xvii; Simons 1995b, p. 117). The Marketing Manager
reported:
“I don’t know [the strategy], but I would like to know. There isn’t communication. I would like to be more involved. I do not believe that they put me apart for any reason. It was never structured as so.”171
167 Interview with the Marketing Manager on 19/07/2011 (D08.09) 168 Interview with the Marketing Manager on 16/03/2011 (D02.02) 169 Interview with the Marketing Manager on 19/07/2011 (D08.53) 170 Interview with the Marketing Manager on 19/07/2011 (D08.53) 171 Interview with the Marketing Manager on 16/03/2011 (D02.45)
FIRST CASE STUDY: DIMODA
165
The Director-General recognised that communication was important and more
should be done to increase the quality and frequency of communication. She would like
managers to communicate more with each other, she said. The Director-General
recognised that she could have implemented more frequent reporting to solve the issue,
e.g., on the intranet on a monthly basis. The Director-General said:
“[They do not communicate more due to different] personality traits. Sometimes, one person or another is more complicated and creates friction in the system. […] It limits the synergies. […] It is not at departmental level but at personal levels.”172
Besides, the Marketing Manager commented that the Business Unit Director did
not recognise the “true value of marketing” and did not have the “due respect” towards
communication and the marketing functions either. The Marketing Manager said that it
was not a personal issue but a functional level one, i.e., between the communication
function level and the Business Unit Director. The Marketing Manager expressed:
“The business unit manager is too commercial. Someone that is directing a brand must have a vision of the business. She must look ahead. She must have a strategy. In my view, Dimoda doesn't have one. I understand that we must have this commercial perspective; for it is this that pays our wages. However, we need to create a brand. We need to create a concept. This is not being created [in Dimoda]. It is the director of business that does not adequately value or does not have the proper respect for communication and marketing, it is more of this. Not for me, manager of marketing, but more at the level of communication. It has to be well made. It is not [valued the marketing department]. The other businesses are more aware that communication and marketing are important. I think that the other [directors] appreciate my marketing department. I think they have a bigger concern [about marketing].”173
The reduction of marketing stature and influence within the organisation was also
evident in strategic decisions about brand positioning and segmentation (see Appendix 2).
The Marketing Manager affirmed that she was in total disagreement with the Business
Unit Director regarding the promotional messages (see Table 5-14). The Marketing
Manager explained:
“We have many farmers, many mechanics, but we also have lawyers, economists, business managers; and I think that we should communicate well, especially with the latter ones. But the brand director does not think so. She wants to use simple language and a simple way to communicate, so
172 Interview with the Retail Director-General on 01/04/2011 (D06.68) 173 Interview with the Marketing Manager on 19/07/2011 (D08.13)
CHAPTER 5
166
simple that, in my opinion, sometimes it is offensive to the eyes. If she wants this for her brand… she orders. We are here to supply a service. We feel that we should suggest, but if the brand director does not accept the suggestion and wants to do it her own way by communicating with farmers in this way, bombarding them with messages, then we have to do so.”174
5.4 Conclusion
Dimoda is a fashion retail company, selling men’s and women’s quality clothing at
affordable prices. They manage 15 stores: 4 outlet stores, 6 stores at shopping centres and
5 street shops. The business was profitable, while operating the outlet stores, but
produced huge losses in both 2009 and 2010, becoming technically bankrupt in December
of 2010. The company’s annual turnover was 5.37 million euros in 2010. Dimoda belongs
to a fashion retailing group, GR, which had a turnover of 85 million and the profit and
loss accounts balanced in 2010. The GR has been operating in fashion retail since 1919.
The Dimoda business began in 1984 and evolved, over the last 30 years, from
representing foreign brands (wholesale activity) to a business which is proprietary of both
their own brands and retail stores. The retail stores have been located both in the second
line commercial spaces (with lower rents) and in outlets. The company seeks to compete
on price, though not neglecting quality.
The Dimoda business is in a difficult economic situation and its main objective is
survival. Although the GR has divested in the retail business and has sold several brands,
they want to keep the Dimoda business – as long as the operating cash flows are positive.
The management objectives are therefore maintaining sales revenues, EBITDA and cost
savings. Its strategy is to close unprofitable stores, reduce costs and increase exports.
The Group is organised into relatively independent business units. Each business
unit has a head which is given autonomy in management. The business units share
common central services (e.g., administrative, financial and marketing). The business
units and the shared services are controlled through the annual budget.
The accounting system is dysfunctional and it is worsening mainly due to
financial constraints which hinders the marketing and sales management. One aspect that
hinders the operation of the control system (and prevents the use of accounting
information) is the lack of regular, systematic and face-to-face communication between
managers and management accounting staff. This lack of frequent and systematic
communication limits the flow of information, limits the identification of errors and
reduces the opportunities for improvement. It also limits both the ability of the accounting
174 Interview with the Marketing Manager on 19/07/2011 (D08.00)
FIRST CASE STUDY: DIMODA
167
system to produce reports tailored to the specific needs of each manager and the inclusion
of non-financial information related to the business activity in the management
accounting reports. Another aspect that contributes to the dysfunction of the accounting
system in Dimoda is the separation of the financial and commercial databases. This
separation prevents individual managers from accessing accounting information online
which is useful for daily management. It also prevents the production of periodic and
timely management reports with detailed unit-level accounting information. Finally, the
lack of automatic reports based on templates tailored to the managers’ demand, also limits
the ability of the accounting system to meet the needs of managers. Consequently,
Dimoda managers occupy much of their time producing reports leaving little time to
analyse the information.
In GR, managers traditionally sought accounting information primarily related to
sales, in both an aggregated and detailed form. Stimulated by top management, the
situation evolved and the managers also started to look for information related to the costs
and profits. Thus, recently the director of Dimoda has been very attentive to information
related to the costs and her focus has been on controlling the budget and finding
opportunities to reduce costs (see Johnson and Kaplan 1987, p. 33).
In a context of financial difficulties and focus on reducing costs, Dimoda limited
its investments in two specific areas: marketing and information system. This decision
limited the ability of the accounting system in responding to the information needs of
managers (explained above) thus hindering their work. It also hindered the work of the
MD to communicate and protect the brand image. These two factors have limited the
performance of the business unit, made it more difficult to achieve the objectives of
improved financial results and resulted in further efforts to reduce costs (therefore, they
risk entering in a spiral of minimisation).
A strong interest from the marketing and sales director in the accounting system
information was also observed; there were, however, major constraints on the accounting
system to meet this demand in a timely manner for the reasons mentioned above. The
marketing manager, on the other hand, had no awareness of the usefulness of accounting
information for marketing decisions. She was nevertheless receptive to receiving
information from the accounting system if its usefulness was explained to her. The
controller also showed much interest in interacting and exchanging information with
marketing and sales managers, particularly at the stage of budgeting and deviations
analysis. In this case, what was limiting the ability of the accounting system in meeting
the needs of managers was the lack of interactive procedures established by senior
CHAPTER 5
168
management. The Dimoda managers reported that they lacked boardroom instructions for
systematic reporting directed at hierarchic levels below the board-roam level. They also
lacked multi-functional interactions and face-to-face discussions between managers and
management control staff.
Marketing managers at Dimoda desired to have essentially two types of
accounting information for marketing management. Firstly, detailed sales information per
customer to understand the buying behaviour of each customer (not to analyse customer
profitability as it is suggested in the literature). Secondly, they demanded information on
the impact of each marketing activity on sales volume in order to analyse the relationship
between cost and benefit of each type of marketing activity. The absence of financial
information (cash inflows) related to specific marketing activities discouraged the
business director from considering marketing outlays.
In Dimoda, the financial accountant’s perspective is that her responsibility was to
primarily serve the external customers (e.g., inland revenue service, banks, and statistics
institute). The prospect of the controller was that her main responsibility was to produce
reports for the boardroom – in particular the budgets and analysis of variances. The
perspective of the information system director was that information technology had not
followed the evolution of business – due to financial constraints. In this context, managers
had very limited access to accounting information to support management: there was no
staff focused on serving them in terms of accounting information, and they did not have
direct access to accounting information due to IT limitations. In conclusion, there was
much stored accounting information but very little was used.

169
CHAPTER 6 SECOND CASE STUDY: MODALFA
6.1 Introduction
This chapter starts with a brief description of Sonae175 company, which is the owner of
Modalfa. In the first three sections the history of Sonae, its values, mission, objectives
and strategy are reported. This contributes to the understanding of the management
culture, the size, and the relevance of Sonae in the Portuguese economy, and the origins
of the Modalfa business unit. The subsequent sections cover the Modalfa business unit.
These begin by explaining how the Modalfa business unit fits into the Sonae Group, and
its weight in terms of sales, EBITDA and profit. Subsequently, there is a description of
Modalfa’s profitability, objectives, and accounting and marketing management. These
sections are focused on explaining why and how managers demanded, communicated and
used accounting information, and what factors influenced the ability of the accounting
system to meet the managers’ demand of accounting information. The final sections cover
the MD situation. In particular, these sections describe how the MD was organised and
how it planned its activities. It is also described how the MD carried out its performance
measurement and how the MD influenced both business management and business
strategy. This research on the relationships between the marketing accountability and the
MD situation based on interpretative case study seeks to complement existing quantitative
studies on the topic, thus contributing to new understandings and explanations on
marketing performance measurement and accountability in practice.
6.2 The Sonae Group
The core business of Sonae is retailing.176 By the end of 2010 Sonae was running
1,019 retail shops, with an average of 3.9 million customer visits weekly.177 Sonae
employed 43,268 people in 2010, creating 3,454 new jobs in the same year. Sonae
allocated €412 million on CAPEX in 2010, i.e., 7% of its €5,914 million of turnover and
60% of its €690 million of EBITDA. The net profits were €233 million in 2010, an
increase of 22.3% compared with 2009 (see Table 6-1).
The core business – retailing – is done by two companies: Sonae Modelo
Continente (hereafter referred to as Sonae MC), which operates in food retailing; and
175 Sonae - Sociedade Nacional de Estratificados 176 Sonae Institutional Brochure (2011) 177 Sonae Management Report (2010)
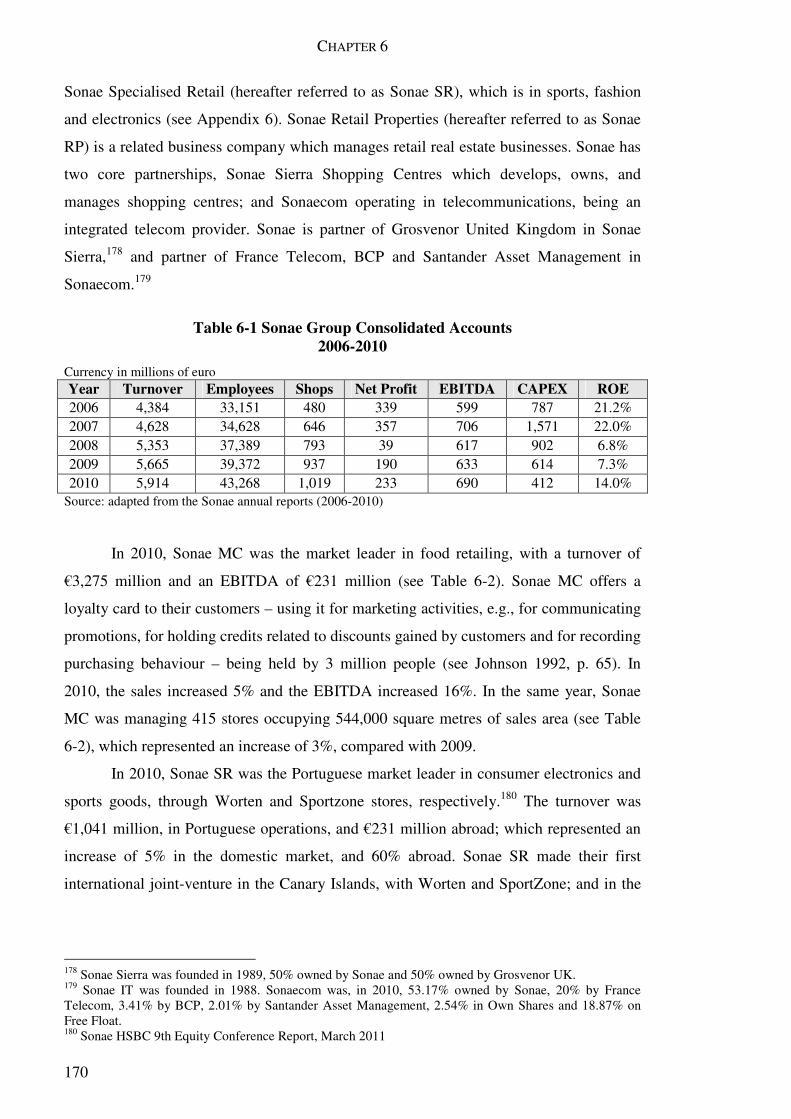
CHAPTER 6
170
Sonae Specialised Retail (hereafter referred to as Sonae SR), which is in sports, fashion
and electronics (see Appendix 6). Sonae Retail Properties (hereafter referred to as Sonae
RP) is a related business company which manages retail real estate businesses. Sonae has
two core partnerships, Sonae Sierra Shopping Centres which develops, owns, and
manages shopping centres; and Sonaecom operating in telecommunications, being an
integrated telecom provider. Sonae is partner of Grosvenor United Kingdom in Sonae
Sierra,178 and partner of France Telecom, BCP and Santander Asset Management in
Sonaecom.179
Table 6-1 Sonae Group Consolidated Accounts 2006-2010
Currency in millions of euro Year Turnover Employees Shops Net Profit EBITDA CAPEX ROE 2006 4,384 33,151 480 339 599 787 21.2% 2007 4,628 34,628 646 357 706 1,571 22.0% 2008 5,353 37,389 793 39 617 902 6.8% 2009 5,665 39,372 937 190 633 614 7.3% 2010 5,914 43,268 1,019 233 690 412 14.0%
Source: adapted from the Sonae annual reports (2006-2010)
In 2010, Sonae MC was the market leader in food retailing, with a turnover of
€3,275 million and an EBITDA of €231 million (see Table 6-2). Sonae MC offers a
loyalty card to their customers – using it for marketing activities, e.g., for communicating
promotions, for holding credits related to discounts gained by customers and for recording
purchasing behaviour – being held by 3 million people (see Johnson 1992, p. 65). In
2010, the sales increased 5% and the EBITDA increased 16%. In the same year, Sonae
MC was managing 415 stores occupying 544,000 square metres of sales area (see Table
6-2), which represented an increase of 3%, compared with 2009.
In 2010, Sonae SR was the Portuguese market leader in consumer electronics and
sports goods, through Worten and Sportzone stores, respectively.180 The turnover was
€1,041 million, in Portuguese operations, and €231 million abroad; which represented an
increase of 5% in the domestic market, and 60% abroad. Sonae SR made their first
international joint-venture in the Canary Islands, with Worten and SportZone; and in the
178 Sonae Sierra was founded in 1989, 50% owned by Sonae and 50% owned by Grosvenor UK. 179 Sonae IT was founded in 1988. Sonaecom was, in 2010, 53.17% owned by Sonae, 20% by France Telecom, 3.41% by BCP, 2.01% by Santander Asset Management, 2.54% in Own Shares and 18.87% on Free Float. 180 Sonae HSBC 9th Equity Conference Report, March 2011
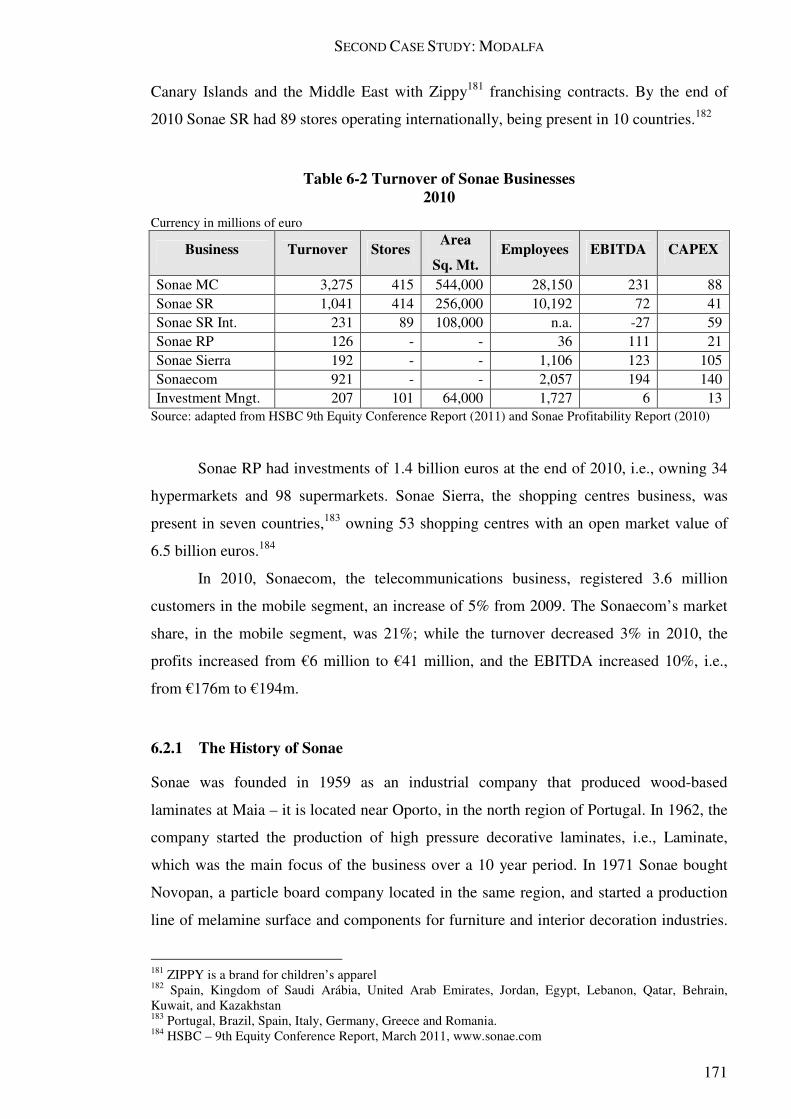
SECOND CASE STUDY: MODALFA
171
Canary Islands and the Middle East with Zippy181 franchising contracts. By the end of
2010 Sonae SR had 89 stores operating internationally, being present in 10 countries.182
Table 6-2 Turnover of Sonae Businesses 2010
Currency in millions of euro
Business Turnover Stores Area
Sq. Mt. Employees EBITDA CAPEX
Sonae MC 3,275 415 544,000 28,150 231 88 Sonae SR 1,041 414 256,000 10,192 72 41 Sonae SR Int. 231 89 108,000 n.a. -27 59 Sonae RP 126 - - 36 111 21 Sonae Sierra 192 - - 1,106 123 105 Sonaecom 921 - - 2,057 194 140 Investment Mngt. 207 101 64,000 1,727 6 13
Source: adapted from HSBC 9th Equity Conference Report (2011) and Sonae Profitability Report (2010)
Sonae RP had investments of 1.4 billion euros at the end of 2010, i.e., owning 34
hypermarkets and 98 supermarkets. Sonae Sierra, the shopping centres business, was
present in seven countries,183 owning 53 shopping centres with an open market value of
6.5 billion euros.184
In 2010, Sonaecom, the telecommunications business, registered 3.6 million
customers in the mobile segment, an increase of 5% from 2009. The Sonaecom’s market
share, in the mobile segment, was 21%; while the turnover decreased 3% in 2010, the
profits increased from €6 million to €41 million, and the EBITDA increased 10%, i.e.,
from €176m to €194m.
6.2.1 The History of Sonae
Sonae was founded in 1959 as an industrial company that produced wood-based
laminates at Maia – it is located near Oporto, in the north region of Portugal. In 1962, the
company started the production of high pressure decorative laminates, i.e., Laminate,
which was the main focus of the business over a 10 year period. In 1971 Sonae bought
Novopan, a particle board company located in the same region, and started a production
line of melamine surface and components for furniture and interior decoration industries.
181 ZIPPY is a brand for children’s apparel 182 Spain, Kingdom of Saudi Arábia, United Arab Emirates, Jordan, Egypt, Lebanon, Qatar, Behrain, Kuwait, and Kazakhstan 183 Portugal, Brazil, Spain, Italy, Germany, Greece and Romania. 184 HSBC – 9th Equity Conference Report, March 2011, www.sonae.com
CHAPTER 6
172
Four years later, Sonae started operating in the chemical industry, producing melamine
and phenolic resins. In 1984 Sonae acquired Agloma company, becoming the leading
particleboard manufacturer in Portugal.185 In 1987 two other Portuguese manufacturing
companies were bought by Sonae: Siaf and Paivopan. Two years later, in 1989, Sonae
bought Spanboard, a particleboard manufacturer from Northern Ireland. The international
expansion continued through the acquisition of other manufacturing companies abroad,
e.g., Tafisa (Spain, 1993), Glunz (Germany, 2000), Isoroy (France, 2000), Ifloma
(Mozambique, 1999), Sappi Novobord (South Africa, 2000), Hornitex (Germany, 2006),
and Darbo (France, 2006), and setting brand new plants abroad, e.g., Canada (1994),
Spain (1998), South Africa (1998), and U.K. (1998). In 1998 Sonae integrated vertically
its industrial activity, entering in wood pulp and paper sector through the acquisition of
8.3% of the capital of Portucel (Portugal), a cellulose producer, and Soporcel (Portugal), a
manufacturer of paste and paper.
The international acquisitions and investments abroad permitted Sonae to become
the world leader in the manufacture of wood-based panels186 also offering new products
such as particleboard, medium density fibreboard, hardboard, and oriented strand board.
In 2005, Sonae Manufacturing established a spin off from Sonae. On December
2010, Sonae Industria’s187 workforce was 4,800 people, working on 27 production sites,
in seven countries, with a consolidated turnover of 1.3 billion euros.
Sonae has diversified its activities, from the wood-based industry, through
acquisitions, partnerships and starting up new businesses. Since 1984, Sonae entered food
retailing, specialised retailing, telecommunications, shopping centres management and
real estate (see Appendix 7). The diversification from the first core business, i.e., wood-
based industry, has focused on another core business, i.e., retailing, which has become the
principal source of turnover in 2010 (€4.5 billion in retailing vs. €1.3 billion in
manufacturing). As Sonae’s diversification strategy was focused on retail activities, i.e.,
related diversification (see Anthony and Govindarajan 2003), it benefited from the
synergies related to logistics, operations and marketing.188
The next sections summarise the Sonae’s culture, mission, values, objectives and
strategy.
185 www.sonaeindustria.com (accessed on 22/01/2012) 186 www.sonaeindustria.com (accessed on 22/01/2012) 187 Sonae Industria is the manufacturing division of Sonae 188 Sonae Institutional Brochure (2011, p. 21)

SECOND CASE STUDY: MODALFA
173
6.2.2 Mission, Culture and Values of Sonae
The company’s mission statement was presented as:
“To create long-term economic and social value, bringing the benefits of progress and innovation to an ever increasing number of people.”189
Sonae’s founder and chairman, Mr. Belmiro de Azevedo – he left the position of
CEO in 2006 – suggested that the organisation’s culture was based on meritocracy and
focused on employees and customers (see Johnson 1992, p. 105). He commented:
“I often say that my main role is to help to develop leaders who will be better than me. This very strong desire is behind this new reorganisation initiative, which continues the formula that has brought so much success to the Group: a combination of shareholder stability and the appointment of highly professional management teams. […] To my employees, with whom I share ambitions and challenges, I would like to say that I will now change functions – the “Zig Zag” career applies to everybody in the organisation – and, more importantly, that I am sincerely grateful for your capacity, day-by-day, to build your skills and be ever more enthusiastic in fulfilling our customers needs, by improving the quality of our products and also increasingly the quality of our services. I am totally confident of your success, which will be, as I have said, the best reward for me, the best dividend for this manager who has been dedicated to Sonae for the last 42 years.”190
In this regard, the company’s management, in its 2008 annual report, proposed to
the employees:
“Working at Sonae means contributing to the performance of a fast moving, innovative, proactive and exciting Group, where current and future employees may expect: (i) career development opportunities, where meritocracy is promoted and discrimination is not tolerated; (ii) lifelong training; and (iii) both a demanding and friendly work environment.”191
The company enumerated seven core values: 188
• “Ethics and trust”: guiding the long-run value creation and the relationship
with all stakeholders;
• “People”: considered the centre of success – the company considered
employees as a distinguishing factor, promoting an attitude of constant
challenge and readiness for change; 189 Sonae Institutional Brochure (2011, p. 18) 190 Report and Accounts 2006 – Sonae SGPS, S.A., (2007, pp. 6-7) 191 Report and Accounts 2008 – Sonae SGPS, S.A., (2009, p. 38)

CHAPTER 6
174
• “Ambition”: as a guiding force for its continuous bold and resilient
attitude, aiming at leadership in all sectors where the company operates;
• “Innovation”: aiming at balancing successes with errors in the path for
constant learning and customer service improvements;
• “Social responsibility”: contributing to the development of human
knowledge, the environment and the underprivileged within the
communities where Sonae operates;
• “Frugality and efficiency”: aiming at optimise the usage of resources,
maximising their return through operational efficiency and being always
cost conscious; and
• “Cooperation and independence”: in relation to the government, both local
and central.
6.2.3 Objectives and Strategy of Sonae
In the management report for 2010, the Sonae’s CEO declared that the objectives were
growth, return on equity and debt reduction. He said:
“We want to grow rapidly and in new international markets, we want a high return on equity and rapid improvement of financial ratios not just through increased profitability, but also through debt reduction in absolute terms. Above all, we want to do this by providing better prices and services to our customers.”192
Another Sonae’s objective was to be market leader in every sector in which they
operate. These objectives were based on the company’s core value of ambition.193
Basically, the company aimed at growth and profitability while fostering innovative
practices, competitive prices and entrepreneurship from employees at all levels (see
Simons 1995b, p. 16). In this regard, the company institutional brochure stated:
“We continuously set ambitious goals, that are inspired but not limited by benchmarks or best practices and that stretch our current competencies and demand a bold and entrepreneurial attitude from our managers.”194
The corporate strategy of Sonae was reformulated in 2009, two years after the
change in the administration of the company and the new CEO, successor of the founder
192 CEO’s Letter at the 2010 Sonae’s Management Report (2010, p. 23) 193 Sonae’s Institutional Brochure (2011, pp. 23-24) 194 Sonae’s Institutional Brochure (2011, p. 23)
SECOND CASE STUDY: MODALFA
175
of Sonae, assumed functions. The new strategy aimed at continuous growth and value
creation, therefore transforming Sonae into a major multinational retailing corporation.195
The strategy of Sonae comprised three main actions:196
• “Internationalisation”: a top strategic priority, centred on the core
businesses, i.e., retailing, shopping centres and telecom. The focus was on
geographies with economic growth, e.g., Eastern Europe, Mediterranean
Basin and Brazil, or in mature economies where Sonae could be more
efficient than the incumbents. The aim was to reach 25% of turnover, and
35% of assets in the international operations by the end of 2012.
• “Diversification of investment style”: by entering in new businesses with
majority stakes – where Sonae had the resources and competences to lead
the business – or with minority stakes – where Sonae could benefit from
third parties to achieve superior value creation. Sonae aimed at dedicating,
in minority stakes, more than 10% of their capital employed.
• “Leveraging [… the] asset base in Portugal”: at looking for new business
opportunities. The new business opportunities should have a path for
internationalisation, attractive profitability levels, and meet the global
trends. It would benefit and reinforce both Sonae’s competencies and
strategic assets. The opportunities should also have potential for becoming
large businesses, i.e., with market values above €100 million.
The strategic priorities for 2011, while confirming the previous aims, focused on
internationalisation, leadership and innovation. In this respect, the Sonae’s CEO stated:
“Our top strategic priority [for 2011] is to continue to enlarge our international footprint and transform Sonae into a large international corporation. We will do so at the same time that we strengthen our leadership and core competences in home markets and continue to innovate in business models, store formats and business processes.”197
In the following section the Modalfa business unit is contextualised within Sonae.
195 Sonae’s Management Report (2009) 196 Sonae’s Institutional Brochure (2011, pp. 24-25) 197 CEO’s Letter at the 2010 Sonae’s Management Report (2010, p. 24)
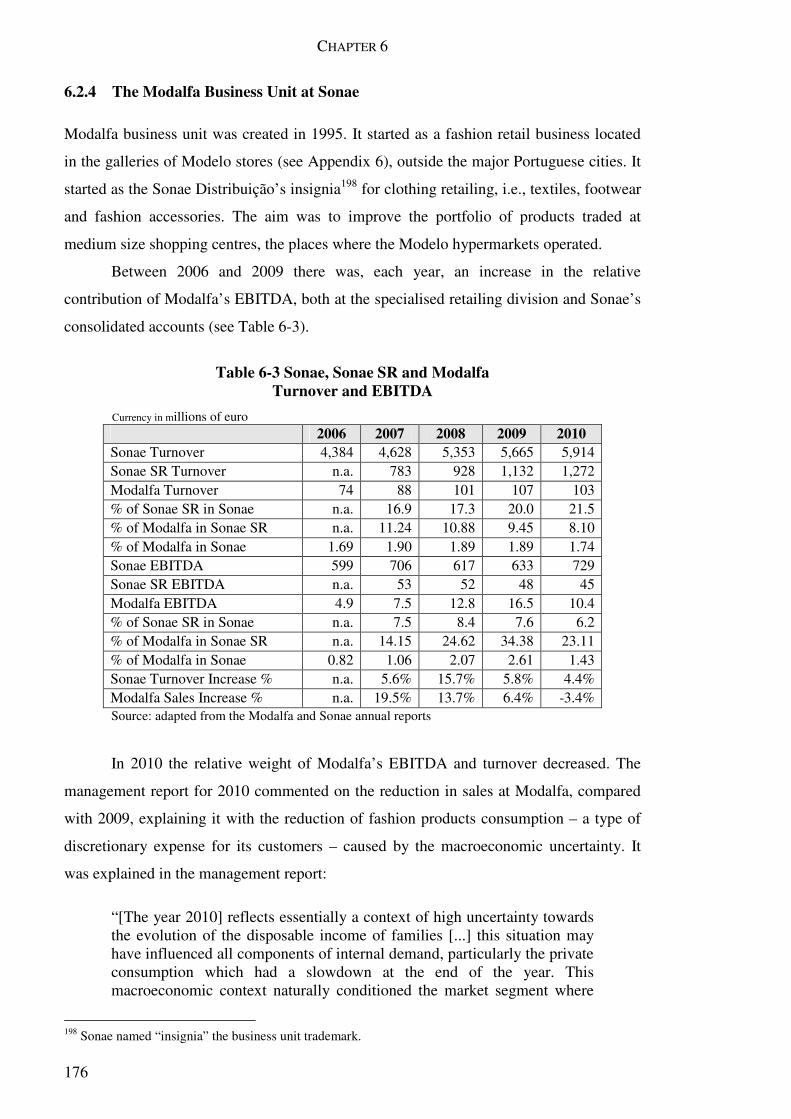
CHAPTER 6
176
6.2.4 The Modalfa Business Unit at Sonae
Modalfa business unit was created in 1995. It started as a fashion retail business located
in the galleries of Modelo stores (see Appendix 6), outside the major Portuguese cities. It
started as the Sonae Distribuição’s insignia198 for clothing retailing, i.e., textiles, footwear
and fashion accessories. The aim was to improve the portfolio of products traded at
medium size shopping centres, the places where the Modelo hypermarkets operated.
Between 2006 and 2009 there was, each year, an increase in the relative
contribution of Modalfa’s EBITDA, both at the specialised retailing division and Sonae’s
consolidated accounts (see Table 6-3).
Table 6-3 Sonae, Sonae SR and Modalfa
Turnover and EBITDA
Currency in millions of euro 2006 2007 2008 2009 2010 Sonae Turnover 4,384 4,628 5,353 5,665 5,914 Sonae SR Turnover n.a. 783 928 1,132 1,272 Modalfa Turnover 74 88 101 107 103 % of Sonae SR in Sonae n.a. 16.9 17.3 20.0 21.5 % of Modalfa in Sonae SR n.a. 11.24 10.88 9.45 8.10 % of Modalfa in Sonae 1.69 1.90 1.89 1.89 1.74 Sonae EBITDA 599 706 617 633 729 Sonae SR EBITDA n.a. 53 52 48 45 Modalfa EBITDA 4.9 7.5 12.8 16.5 10.4 % of Sonae SR in Sonae n.a. 7.5 8.4 7.6 6.2 % of Modalfa in Sonae SR n.a. 14.15 24.62 34.38 23.11 % of Modalfa in Sonae 0.82 1.06 2.07 2.61 1.43 Sonae Turnover Increase % n.a. 5.6% 15.7% 5.8% 4.4% Modalfa Sales Increase % n.a. 19.5% 13.7% 6.4% -3.4% Source: adapted from the Modalfa and Sonae annual reports
In 2010 the relative weight of Modalfa’s EBITDA and turnover decreased. The
management report for 2010 commented on the reduction in sales at Modalfa, compared
with 2009, explaining it with the reduction of fashion products consumption – a type of
discretionary expense for its customers – caused by the macroeconomic uncertainty. It
was explained in the management report:
“[The year 2010] reflects essentially a context of high uncertainty towards the evolution of the disposable income of families [...] this situation may have influenced all components of internal demand, particularly the private consumption which had a slowdown at the end of the year. This macroeconomic context naturally conditioned the market segment where
198 Sonae named “insignia” the business unit trademark.

SECOND CASE STUDY: MODALFA
177
Modalfa operates as far as the goods traded by Modalfa have a clear discretionary characteristic and consumers easily postpone the buying decisions.”199
The Operations Director also explained the decrease in Modalfa turnover with
customer’s postponing buying decisions. She said:
“People are being much more rational while buying – despite the efforts of salesmen offering counselling and purchasing support – the customers say ‘‘it's enough, next time I will take more, now it's enough’’. Even people that can afford it, those who are economically healthy. We felt this pressure, and stronger in 2011.”200
Even though there was a decrease at the specialised retail’s EBITDA, the share of
Sonae SR (see Appendix 6) at Sonae’s consolidated EBITDA was 6.2%, and Modalfa’s
share at Sonae SR’s EBITDA was 23.1% in 2010 (see Table 6-3). Analysing the turnover
of Sonae SR, it increased 62.5% between 2007 and 2010, and the share in Sonae’s
consolidated turnover was 21.5% in 2010 compared with 16.9% in 2007 (cf. Table 6-3).
In 2010, the EBITDA from the Modalfa business was significantly lower, nevertheless,
between 2006 and 2010, the Modalfa's EBITDA increased 112%, while that of Sonae’s
consolidated accounts increased 21.7% (see Table 6-3). Moreover, the Sonae’s CEO
recognised the relevance of Sonae SR division for attaining the corporate objectives:
“In Sonae SR, the weight of international operations is growing at a fast pace – 20% for the full year. Spain was the main focus of our expansion where we opened 46 company operated stores, more than doubling the total number at the end of 2009. We also signed several franchise and joint-venture agreements and opened the first 5 franchised Zippy stores in Saudi Arabia.”201
After describing the Sonae group, its objectives and its strategy, the next sections
focuses on the Modalfa business unit. There are four main sections: the profitability of
the business unit; the business objectives and strategies; the accounting system; and,
finally, a focus on the Modalfa MD situation.
6.3 Modalfa Business Unit
In this section it is described how the Modalfa business unit was managed and its
199 Modalfa Management Report and Accounts (2010, p. 2) 200 Interview with the Operations Director on 18/01/2012 (M05.02) 201 CEO’s Letter at the 2010 Sonae’s Management Report (2010, p. 23)
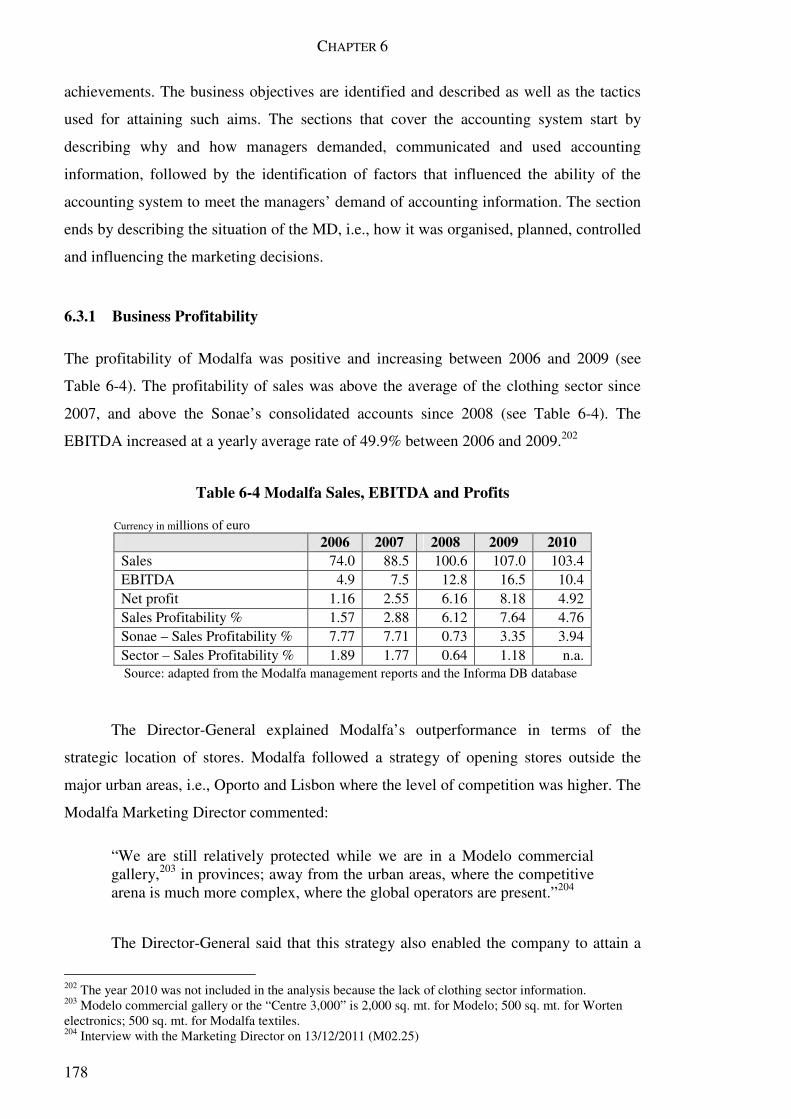
CHAPTER 6
178
achievements. The business objectives are identified and described as well as the tactics
used for attaining such aims. The sections that cover the accounting system start by
describing why and how managers demanded, communicated and used accounting
information, followed by the identification of factors that influenced the ability of the
accounting system to meet the managers’ demand of accounting information. The section
ends by describing the situation of the MD, i.e., how it was organised, planned, controlled
and influencing the marketing decisions.
6.3.1 Business Profitability
The profitability of Modalfa was positive and increasing between 2006 and 2009 (see
Table 6-4). The profitability of sales was above the average of the clothing sector since
2007, and above the Sonae’s consolidated accounts since 2008 (see Table 6-4). The
EBITDA increased at a yearly average rate of 49.9% between 2006 and 2009.202
Table 6-4 Modalfa Sales, EBITDA and Profits
Currency in millions of euro 2006 2007 2008 2009 2010 Sales 74.0 88.5 100.6 107.0 103.4 EBITDA 4.9 7.5 12.8 16.5 10.4 Net profit 1.16 2.55 6.16 8.18 4.92 Sales Profitability % 1.57 2.88 6.12 7.64 4.76 Sonae – Sales Profitability % 7.77 7.71 0.73 3.35 3.94 Sector – Sales Profitability % 1.89 1.77 0.64 1.18 n.a.
Source: adapted from the Modalfa management reports and the Informa DB database
The Director-General explained Modalfa’s outperformance in terms of the
strategic location of stores. Modalfa followed a strategy of opening stores outside the
major urban areas, i.e., Oporto and Lisbon where the level of competition was higher. The
Modalfa Marketing Director commented:
“We are still relatively protected while we are in a Modelo commercial gallery,203 in provinces; away from the urban areas, where the competitive arena is much more complex, where the global operators are present.”204
The Director-General said that this strategy also enabled the company to attain a
202 The year 2010 was not included in the analysis because the lack of clothing sector information. 203 Modelo commercial gallery or the “Centre 3,000” is 2,000 sq. mt. for Modelo; 500 sq. mt. for Worten electronics; 500 sq. mt. for Modalfa textiles. 204 Interview with the Marketing Director on 13/12/2011 (M02.25)
SECOND CASE STUDY: MODALFA
179
critical size in terms of market share very quickly, which was very important in the initial
growth stages of the company. In 2011, Modalfa was running 107 stores.205 This provided
many consumers, who previously did not have this option to buy in large commercial
centres, updated products at low cost. The Director-General explained:
“Before, the people – in order to acquire these types of products – needed to go to Oporto and Lisbon. One of the reasons for Modalfa's success was the great location of our stores outside the traditional places, i.e., Oporto and Lisbon. While others were struggling in Oporto and Lisbon territory, we went to the remainder of the country. Our strategy of growth, enabling us to get dimension through locales which were not saturated, was very important in the beginning.” 206
The purchasing power of Modalfa – supported by the magnitude of its business –
also contributed to its profitability. Modalfa was able to compete on price because it had
size to go to the buying market in the Far East, with bargaining power. The Director-
General explained the importance of the firm’s size (see Shank 1989, p. 56):
“We have got a relevant magnitude in the national market. It is very difficult, coming from zero, positioning oneself in the price competitive [segment], as Modalfa, due to buying power. In fashion, the market share in the buying market and buying power is more important than the market share in the selling market. We were able to obtain a size that gave us a minimum market share in buying, e.g., we go to Bangladesh and we can do the minimum quantities of production [that they require]. If one starts from zero, it is impossible to be in these markets [e.g., Bangladesh]. If we are not in these buying markets, we can not have the selling prices with the aimed profitability. We gained a presence in areas less competitive which gave us a stronger framework for competing in other markets.”207
The Commercial Director gave the same explanation for the observed success of
the Modalfa’s business model, adding to it the contribution of the back-office
organisational competences (see Johnson 1992, p. 9). He said:
“The essential factors [for the Modalfa success] are: the coverage of the territory where we are, i.e. a huge dispersion, acting as a proximity offer to the customers of each region; and an adequate supply, i.e. prices and modernity, according to what people seek. This explains the enormous success of Modalfa; supported, obviously, by a back-office structure that permits the evolution of concepts, renovation of stores, renovation of processes, implementation capabilities, organisation, methods, etc.”208
205 The Modalfa stores were located next to the supermarkets Modelo, which also belonged to Sonae. 206 Interview with Sonae Fashion Division Director-General on 23/11/2011 on 23/11/2011 (M01.55) 207 Interview with the Director-General on 23/11/2011 (M01.58) 208 Interview with the Commercial Director on 12/01/2012 (M04.29)

CHAPTER 6
180
According to the Operations Director, the factor of success was also the store’s
image and the management accounting tools used to follow both the stores and its results,
e.g., team's competences, training on selling and products, and store management. As
Modalfa created specific analysis at the store level (they used accounting information for
that) the stores were able to know exactly, every week, which products were losing or
gaining in sales share when compared with the overall Modalfa business unit, she said.
While conducting the weekly analysis of sales at stores, they used the sales indicator,
without cost information (see Kaplan, in Robinson 1990, p. 3); therefore, the profitability
or the contribution to the fixed costs were not calculated (see Shank, in Robinson 1990, p.
16). In this regard, the Operations Director observed:
“Nowadays, the store is able to know, exactly, every week, in which products it is losing or has gaining opportunities, when compared with the [Modalfa] insignia; [for an analysis of] sales, at stores we use the sales indicator without the cost. We believe that when the sales team is dedicated to selling, the rest will follow and the [profit] return will come […] We are totally conscious that in difficult conjectures, the costs [management] assume a more important role, for they have more weight. [However] it is not the focus. If the first-line isn't done, i.e., sales, we can reduce whatever we may want, but we will never have a happy final account; if we do not generate sales, there is no point in containing and contain [costs], because we reach a minimum limit.”209
The planning and management control department (hereafter referred to as the
PCG210) gave support to the various departments (see Eccles 1991, p. 5), informing them
about the performance of Modalfa’s competitors (see Ambler 2003b, p. 253). This
practice allowed Modalfa to align its performance with that of its competitors and
stimulated a competitive attitude and continuous improvement inside the company (see
Ambler 2003b, p. 138; Hope and Fraser 2003a, p. 55). The PCG looked at other
competitors’ performance – from data collected by specialised agencies in business
information, e.g., Informa DB – and supplied the accounting information to the business
managers (see Anthony and Govindarajan 2003, p. 468; Shank 2006, p. 356). The PCG
tried to benchmark at all levels, comparing their competitors’ performance with
Modalfa’s performance, e.g., profitability, EBITDAs, and sales per square metre, said the
Fashion Controller (see Eccles 1991, pp. 4-5; Hope and Fraser 2003a, p. 123; Simons
1995b, p. 94).211 This topic is discussed in more detail in Section 6.3.3.1.17.
209 Interview with the Operations Director on 18/01/2012 (M05.39/53) 210 PCG is an abbreviation for “Planeamento e Controlo de Gestão” (Portuguese) 211 Interview with the Fashion Controller on 13/12/2011 (M03.23)
SECOND CASE STUDY: MODALFA
181
6.3.2 Business Objectives of Modalfa
Although the company had its earnings before interest and tax (EBIT) and EBITDA as
the main objectives, other objectives were set at different levels and in different
departments (see Anthony and Govindarajan 2003, p. 416). In this respect, the Director-
General commented that the objective of marketing was attracting people to the stores,
while the objective of operations and sales was converting visitors into buyers. He
explained:
“If I am able to put more people inside the shops – we used to say that this is indeed the principal role of marketing – then, the merchandising and the operations come next. That is what assures we have the correct products, to convert visitors into customers. And being customers now, they do buy the maximum possible amounts.”212
The Marketing Director explained that the financial objectives were clear to him,
however, for him, the financial results were a result of a job well done. He said he tried to
identify the critical factors that contributed to attaining the final financial results:
“Nowadays, in Modalfa business, we have numeric objectives, e.g., ratios, very well established. We know very well what we must attain and what we want to attain in numeric terms. At the bottom line is EBIT. However, we see the numeric part as a result of a job well done. Therefore, we must look at the very specific variables of the fashion business; and work [these variables] for reaching numeric results in a sustained form”213
The Marketing Director said that one of the most important tactical objectives was
attracting customers to stores. The Modalfa managers’ perspective was that marketing
had two main objectives: to construct the brand image – which was working for the
customer mindset – and the tactical objectives, e.g., promotions, product campaigns and
price discounts – which were expected to produce immediate effects on sales and
profitability. Both objectives were important; one aimed at brand positioning, with long-
term returns, and intangible value creation; the other was more operational, looking for
immediate returns, and giving support for arguing in favour of the MD budgets. The
Marketing Director explained his perspective on this topic:
“We have got two dimensions for acting: creating brand value and the promotional. The promotional because in the limit we are a ratio of sales. For the survival of the brand, and for our survival as a department, we do
212 Interview with the Director-General on 23/11/2011 (M01.46) 213 Interview with Marketing Director on 13/12/2011 (M02.24)
CHAPTER 6
182
need to put customers inside the store. We assume this function clearly: the capacity to generate visits [to stores]”214
Modalfa was intended to be a benchmark in the retail business of fashion;
however, the directors recognised that it was going to be difficult for Modalfa to become
market leader, a position that in 2011 was won by Zara. Modalfa’s directors said they
wanted to consolidate the sub-leader position and to expand internationally, particularly
to the markets culturally close to Portugal.
The different departments had their objectives aligned (see Anthony and
Govindarajan 2003, p. 416). All considered Modalfa as aiming at being one of the major
companies, offering quality clothing for families at competitive prices, and following
conservative fashion across the entire Portuguese market. This alignment of perspectives
on the objectives of the business unit – it is discussed in Section 6.3.4.1 – was reflective
of a management control system that focused on communication and interaction between
the various departments. The periodic meetings – led by the PCG (see Eccles 1991, p. 5)
– where activity analysis, diagnosis of problems and corrective measures were made,
contributed to the strategic and operational alignment (see Ambler 2003b, p. 143; Hope
and Fraser 2003a, pp. 24-26). For example, the Director-General’s perspective was:
“Our objective is – through market research and customer feedback – to work on each of these components: family, fashion and price. [We work] with more emphasis on those [areas] where we have more difficulty [in being recognised by customers as such].”215
The Marketing Director also considered as one of the main characteristics of the
brand, its family orientation. He highlighted the importance of being aligned with the
fashion trends, without being avant-garde. As most of the customers were coming from
areas outside the major urban centres, the products were chosen so as to adapt to more
conservative tastes. The Marketing Director explained:
“In Modalfa we need to have fashion, for this is what the people want; I am not saying a vanguard fashion, which is a space already occupied by others. We tend to be more conservative in fashion, while incorporating in our collections the last tendencies, e.g., colour, and fitting; though not doing Modalfa a trend setter. We do have the family concept [in our offer].”216
214 Interview with the Marketing Director on 13/12/2011 (M02.10) 215 Interview with the Director-General on 23/11/2011 (M01.62) 216 Interview with the Marketing Director on 13/12/2011 (M02.26)
SECOND CASE STUDY: MODALFA
183
The Controller also summarised the objectives of Modalfa, focusing on family
and geographical coverage:
“The objective of Modalfa is to be a major nationwide chain of clothing, a clothing chain for families in particular; becoming the main national player. Being a family solution because it supplies clothing for adults and children too. It is directed to the family as a whole.”217
The Commercial Director also mentioned the three key features of the brand
Modalfa – family, fashion and price – confirming what other managers had already said.
He stated:
“Regarding the branded product strategy, we are a family store; aiming at an updated product, at the best possible price, for all the family.”218
Finally, the Operations Director, beyond reconfirming what was said earlier about
the objectives of the business unit, added customer service and sustainability. She
expressed:
“The principal focus of Modalfa is the family. We were born with this [focus] and it will always guide us. We aim at offering the latest fashion trends, price-quality opportunities, customer service, sustainability, and geographic coverage.”219
There were other operational and organisational objectives rendered evident in the
management reports between 2006 and 2009. Most of them were focused on customer
service and processes efficiency (see Table 6-5).
Summarising, the value proposition offered by Modalfa was “developing products
which fit the customer’s lifestyle, meeting the latest fashion trends, with optimum
relationship between quality and price”,220 and Modalfa attained the ultimate objectives of
profitability and growth. Between 2006 and 2010, the number of stores increased at an
annual average rate of 11.4%, and the total shopping area increased at an average rate of
13.6% (see Table 6-6). Between 2008 and 2010, the Modalfa’s profitability of sales was
always above the average of the clothing sector, and also above the overall Sonae’s
profitability of sales (see Table 6-4).
217 Interview with the Fashion Controller on 13/12/2011 (M03.05) 218 Interview with the Commercial Director on 12/01/2012 (M04.20) 219 Interview with the Operations Director on 18/01/2012 (M05.17) 220 Modalfa Annual Report (2008, p. 2); (2009, p. 4); (2010, p. 3).

CHAPTER 6
184
Table 6-5 Modalfa Objectives
Objectives 2006 2007 2008 2009 2010
Expansion, increasing the number of shops, selecting localisations
X X
Consolidating the strong market position X
Reinforce the operational profitability through organisation processes improvement and information technology systems
X
Increase the value proposition to the customer updating the stores
X
Customer focus X
Innovation X
Processes efficiency X
Product quality through product testing X X X
Customer service through employee training X X X
Source: adapted from both the Modalfa interviews and the Modalfa management reports
Table 6-6 Modalfa Stores, Sales and Employees 2006-2009
2006 2007 2008 2009 2010 Total Shops 68 81 87 99 105 New Shops 12 1 6 13 7 Closed Shops 0 0 0 1 1 Investments (€103) 5,603 9,375 6,964 1,874 1,394 Sales from shops (€103) 74,015 88,463 100,606 107,035 103,430 Total area (sq. mt.) 33,000 38,000 41,000 51,000 55,000 Sales per sq. mt. (€103) 2.25 2.32 2.45 2.10 1.88 Employees 481 711 802 844 n.a.
Source: adapted from the Modalfa annual reports (2006-2010)
The following sections describe how and why Modalfa managers demanded,
communicated and used accounting information.

SECOND CASE STUDY: MODALFA
185
6.3.3 Accounting System and Marketing Management
This section describes how the Modalfa’s accounting system supported the managers of
marketing. The first section describes why and how the Modalfa marketing managers
demanded, communicated and used accounting information, while the second section
explores the factors that influenced the ability of the accounting system to meet the
managers’ demand of accounting information.
6.3.3.1 Marketing Managers’ Demand of Accounting Information
The reasons why Modalfa managers of marketing demanded, communicated and used
accounting information are described in this section. The topics are presented in the same
order as in the previous case, being then added alongside with other motivations that
Modalfa managers had for using accounting information (not found in the Dimoda case).
6.3.3.1.1 Accounting Information for Sales Revenue Analysis
The Financial Accounting Director reported that the analysis of sales was a very
important aspect of business in Modalfa (see Kaplan, in Robinson 1990, p. 3). He added
that the reports were daily and that this information was passed on to managers. He
explained:
“Sales are daily, the sales report is daily, everyday management has information on what is happening in the stores, how sales are – sales are the most important variable in this business – everything else comes afterwards. If sales do not work the rest is also not working.”221
The Commercial Director confirmed his interest in using the accounting
information related to sales, adding that he analysed it daily. He said:
“I look for sales and margins, every day. I compare the sales with the historic registries, the sales compared with the budget, the distribution [of sales] by categories, by store, I do this every day.”222
In addition to the daily analysis of sales – which was made by consulting the
computer systems directly – the Controller said that she also produced reports of activity
weekly and monthly (see Anthony and Govindarajan 2003, p. 566). The monthly report,
221 Interview with the Financial Accounting Director on 21/09/2012 (M07.79) 222 Interview with the Commercial Director on 12/01/2012 (M04.12)

CHAPTER 6
186
which included a detailed analysis of sales, was sent to all directors, including sales and
marketing, and later discussed at a meeting dedicated to the analysis of business activity.
The Controller commented that the sharing of information was important for managers to
be informed about the business activity (see Eccles 1991, p. 5; Hope and Fraser 2003a,
pp. 24-26). She also said that the Marketing Director was interested in information about
sales and profit margins (see Simons 1995b, p. 147). The Controller explained:
“This [to meet one morning or one full day to review the monthly activity] is compensated because it is also a way for everybody to be aligned in Modalfa’s performance as a whole. For example, it is obvious that the Marketing Director possesses the information, but it is in this way that he shares all that concerns Modalfa, like new stores, sales performance, how we are in terms of margins. I mean, he [the Marketing Director] does not look exclusively at the [cost] line of marketing.”223
The following section describes how the Modalfa marketing managers used
accounting information for profitability analysis.
6.3.3.1.2 Accounting Information for Profitability Analysis
The Modalfa Commercial Director said that one of his main responsibilities was the
operating account of the business, in particular the sales margin (see Shank, in Robinson
1990, p. 16). In this sense, the Commercial Director commented that he was in the habit
of analysing the daily profit and loss account. Referring to the importance of sales and
sales margins he said:
“I am responsible for the business operating account, the sales line – shared with all other teams, obviously – and much in line with the profit margin, or contribution margin, as we call it – it is the price, less cost [of goods sold], less sales discounts, less fails [on inventories], less provisions, […] [There are] many variables.”224
The Marketing Director also said that the profitability of the business was very
important to him, specifically the EBITDA. He began by noting that this indicator and the
sales margin were the main objectives of the business (see Simons 1995b, p. 66):
“Everything ends in EBITDA, however we have [other aims as] sales, and sales margins – it is also an objective and a key performance indicator
223 Interview with the Fashion Controller on 21/09/2012 (M08.10) 224 Interview with the Commercial Director on 12/01/2012 (M04.04)

SECOND CASE STUDY: MODALFA
187
(KPI) of my commercial colleague [the Commercial Director].”225
The Marketing Director also mentioned the importance of planning marketing
activities by taking into account the contribution of each of them to the development of
profitability and sales. It was also a way to protect his department within the organisation.
He referred to this topic in this way:
“There is space for innovation, but it must be focused on an objective. If we put these skills to the service of EBITDA, customers, increase of sales, i.e., participating in the efforts of the whole organisation, then marketing will be very well assessed and cared for by the whole organisation. We all want the same, increasing the sales. This must be the focus. In these times we cannot miss the target, even if it [to be out of the target] is very pleasant.”226
The cost management also motivated the use of accounting information. This is
described in the following section.
6.3.3.1.3 Accounting Information for Cost Management
Reflecting on the changes in the market as a result of the recession, the Director-General
commented that in 2010 and 2011 the sector faced increasing costs of raw materials and a
reduction in consumer demand. As it was very difficult to increase the prices to the final
customers, the control of costs was paramount for sustaining the business’ profitability,
he said. The Director-General explained:
“In the past year and a half, we went through a perfect storm, using the expression of the last International Retail Conference in Berlin, i.e., something like ‘‘Garment retail: a perfect storm’’. Because we are putting everything together: a decrease in consumption, due to the economic difficulties which we are experiencing; an increase in raw material prices, electricity costs and store's overheads; and mostly related to increases in cotton prices, which were completely crazy, e.g., last year [2010] the cotton price rose 150%, while having market pressure for not increasing the selling prices, caused by low consumptions. Fashion retailers have been caught in a perfect storm: reduction in top line consumption and a significant increase in raw material prices. Hence, we have nowadays the preoccupation of controlling costs in the textile retail.”227
225 Interview with the Marketing Director on 13/12/2011 (M02.33) 226 Interview with the Marketing Director on 13/12/2011 (M02.86) 227 Interview with the Director-General on 23/11/2011 (M01.07)
CHAPTER 6
188
The cost management at Sonae was characterised by the spirit of frugality.228 One
of the core values of Sonae was cost consciousness (see Section 6.2.2). The Operations
Director said that in Sonae they were always very rational and objective when deciding
about costs. She explained:
“We manage the costs by anticipation. From the first day of the year we start to apply the measures of the budget guaranteeing that the shops are taking these correct measures; analysing the deviations and correcting them; identifying the most expensive stores – looking for the causes, [because] sometimes it is justifiable. Correcting them [the expenses whenever necessary]. We are never spendthrifts or unconcerned about costs. [...] We use the frugality concept. Always assessing very well where the money is spent.”229
The costs were budgeted and controlled throughout the year (see Horngren 2004,
p. 210). There was a monthly meeting where all executive directors got together and
discussed the performed activities of the business, the results and the challenges (see
Anthony and Govindarajan 2003, pp. 420-421). The Controller prepared a weekly
profitability report, and, throughout the year, the real performance was followed,
comparing it with the defined targets; in every budgeted item the performance was
tracked,230 the Controller said. The cost analysis was done by all directors in the
organisation, looking for the details, and opportunities of improvement (see Horngren
2004, p. 210). The Marketing Director commented that he used the accounting
information, produced monthly by management control, to act at the level of corrective
actions in his department (see Simons 1995b, p. 123). The Marketing Director explained:
“Nowadays [we have] an effective and detailed cost control; all of us look at it [costs]. Each one looks at his department’s costs. Every month we look at the global business accounts, line by line, checking whether there are variances, and why they occur; also, which corrective measures are necessary. […] We have, therefore, numeric, quantitative information, for supporting decisions or options that we will take; and corrections that are needed, in each department. This is done on a monthly basis. Every first-line director [participates], the management control, and the CEO.”231
However, regarding cost reduction practices, the Operations Director reported that
they never cut what was critical for the business operations, customers or employees, e.g.,
they did not save on the visits to the stores, in fuel, or in vehicles for following up the
228 Interview with the Operations Director on 18/01/2012 (M05.54) 229 Interview with the Operations Director on 18/01/2012 (M05.54) 230 Interview with the Fashion Controller on 13/12/2011 (M03.06) 231 Interview with the Marketing Director on 13/12/2011 (M02.33/60)

SECOND CASE STUDY: MODALFA
189
operations (see Johnson 1992, p. 13). However, they chose the routes for visiting stores –
aiming at making shorter distances – and the most reasonably priced hotels. The
Operations Director explained the criterion for cost management:
“We don't choose the 4 or 5 stars [hotels]; it is one night [only], we arrive at 10 p.m. and go straight to bed, we don't need a hotel with a spa. We are rational in these types of expenses […] However, in the shops, we do not cut the air conditioning, or lighting; we do not cut anything that delivers comfort to the customers and to the employees too. If we need to cut the air conditioning, then we analyse when it is not necessary, e.g., if the warm weather starts at 11 a.m., then we turn on the air conditioning at 10 a.m; in the early morning, at 8 a.m., it is not warm in Évora; you save two hours, which in 365 days a year, is equal to 107 times [stores].”232
The cost management in Modalfa included the improvement of the business
operational processes, to yield cost savings (see Johnson 1992, p. 9), or the elimination of
expenses with non-core activities (see Johnson and Kaplan 1987, pp. 33-34). The
Director-General said that for 2012, the cost reduction was one of their objectives and
explained:
“For the next year, we are looking at where we can cut [expenses] e.g., improving the processes aiming at reductions of direct labour, or leaving some things, like the ones nice-to-have [but not essential].”233
For example, in 2010, there was a focus on innovation, looking for new processes,
questioning the working methodologies, aiming at productivity gains (see Johnson 1992,
p. 9). The Operations Director explained that they aimed at reducing hours spent on tasks
– not manpower – to give more service to customers. She said that Modalfa worked
together with the Kaizen Institute Portugal,234 and were awarded a prize by that institute
for new methods that were implemented for goods separation.
Beyond the scope of cost control, the Marketing Director also resorted to
accounting information to assess his marketing campaigns from the financial perspective.
This facet, the use of accounting information to evaluate the activity of marketing, is
explained in the next section.
232 Interview with the Operations Director on 18/01/2012 (M05.56) 233 Interview with the Director-General on 23/11/2011 (M01.20) 234
The Kaizen Institute is a global organisation which provides consulting services to companies worldwide. The Kaizen Institute supports companies of all sizes and industrial segments as well as private and public service organisations (see pt.kaizen.com).
CHAPTER 6
190
6.3.3.1.4 Accounting Information for Measuring Marketing Performance
The Director-General, the Controller, and the Marketing Director reported that they
measured the performance of marketing campaigns using accounting information. They
said that the most used was the total value of sales, comparing it before and after
campaigns or in different locations, i.e., some locations with campaigns and others
without. The Director-General explained the methodology:
“If I do a publicity campaign for a promotion at the entrance of Norte Shopping,235 and not at the entrance of Colombo,236 I can see the changes in the number of transactions, and in the value of transactions, of Norte Shopping versus Colombo, as the control group. I can measure, ceteris paribus, what the effect of the campaign is.”237
The Director-General and the Marketing Director noted that one reason for further
increases in the number of these measurements was the economic crisis. They said that
they needed to know the extent to which expenses incurred in marketing, produced
positive impacts on the revenue, and were justified in the context of cost reduction. The
Director-General commented:
“We do it indeed [to measure the marketing operational promotions] more and more. The [macro-economic] crisis is the cause of it.”238
However, the perspective of the Commercial Director was that there was a
difference between the indicators used by the MD and the indicators used by the
commercial department. He said that while marketing typically used more operational
indicators in order to measure the effectiveness of campaigns, the commercial department
used mostly the financial ones. The Commercial Director explained:
“Marketing and ourselves; whenever we do a [marketing] action, we always try to measure. The marketing [department] measures using IRP [independent research providers], if it is communication, television, etc., and brand awareness. These are the marketing measures. We measure based on sales. If we put a campaign on television, how does it impact [on sales]? We have historic registers that it impacted two times [on sales]; or, if we offer 30% [discount] instead of 50%, how does it impact on inventory rotation and sales? We have got some points of reference that we use for assessing the performance of campaigns.”239
235 The Norte Shopping is a commercial space located near Oporto 236 The Colombo Shopping is a commercial space located in Lisbon (i.e., 320 km from the Norte Shopping) 237 Interview with the Director-General on 23/11/2011 (M01.19) 238 Interview with the Director-General on 23/11/2011 (M01.20) 239 Interview with the Commercial Director on 12/01/2012 (M04.30)

SECOND CASE STUDY: MODALFA
191
The Controller, who was dedicated to the fashion division, said that increasingly
these analyses had been made, using financial metrics and accounting information, to
measure the performance of marketing activities. Moreover, the departments of
accounting and management control produced the information; she explained how she
was involved in the process of MPM and how she did the analysis (see Hope and Fraser
2003a, p. 37):
“We have been doing this type of analysis [of MPM]. Our objective was doing more, indeed; we have some on the waiting list. This year we have already done several analyses. It was done at Zippy240 but it could be at Modalfa too, this exercise can be done on any [brand]. A set of shops did a certain [marketing] action, the other set of shops did another [marketing] action; we identified the costs of each action and the impact of each one on sales, and profitability, aiming at obtaining the value generated by each [marketing] campaign. The fashion division has been doing these different marketing actions to test which type of action is better suited to the customer’s needs, and produces better responses in terms of sales and profitability. We, management control, are helping them [marketing] to assess the post-campaign impacts. This year, in particular, we have this role of assessing the performance of [marketing] campaigns.”241
In addition to accounting information being used to assess the return of the
marketing campaigns, it was also used to generate improvement opportunities (see
Simons 1995a, p. 86). This is described in the following section.
6.3.3.1.5 Accounting Information for Improving Marketing Management at Stores
The Director-General explained that the accounting information regarding sales, and the
number of commercial transactions, when compared with the number of store´s visitors,
allowed the calculation of the conversion rate of visitors into customers, e.g., how many
transactions per one hundred visitors. He explained that after comparing these ratios
between the various stores, they could understand which shops were successful in
converting visitors into customers, and the stores with poorer performances (see Anthony
and Govindarajan 2003, p. 468). The Director-General said that the analysis stimulated
further research to understand the causes of success (or failure), using it, afterwards, to
serve as a stimulus for improving stores with lower performances (see Hope and Fraser
2003a, p. 61).
240 ZIPPY is a brand for children’s apparel 241 Interview with the Fashion Controller on 13/12/2011 (M03.17)
CHAPTER 6
192
The Director-General explained how accounting information was useful in this
process:
“These ratios are useful not only for tuning [selecting] the products but also for the service. The operations team has a close eye on the stores, looking for the productivity of each shop. They say to them, ‘‘We do not want you to have 150 or 200 transactions, but we want a success rate of store entries of x% because you are below the average which is y% and you have here a way to do this. Your colleagues from other shops, with the same articles, are transforming more people entries into customers.’’ It is a work of competition between stores242 which generates continuous improvements.”243
The Operations Director explained how she used accounting information in the
management of stores: she reviewed the performance of each shop on a weekly basis,
supported by the management control department and the information system (see Shank
2006, p. 363). She said that she compared each shop performance with the regional
average, the insignia average, and the historical performances (see Hope and Fraser
2003a, p. 61). This allowed her to identify best practices or innovative procedures and
replicate them in the network of 107 stores (see Ambler 2003b, p. 201; Simons 1995b, p.
5). She noted that the potential gains arising from this method were considerable. The
Operations Director explained how she used the methodology (see Hope and Fraser
2003a, p. 148):
“[When a store,] e.g., Vila do Conde is doing a spectacular performance, i.e., 112% compared with the insignia average of 93%, we need to go there and understand which initiative the store's manager had, passing it to all other stores. Sometimes there are small details, like a highlighting of a particular product, which we were not betting on; and that resulted very well. If so, let us replicate this event in the 107 stores, projecting it in the total. We do this [analysis] weekly. The management control informs us that everything is integrated and we process the reports [automatically]. [The connection with the management control] is very good indeed.”244
Information was prepared comparing the various Sonae insignias (retail brands), to
understand what Modalfa was like when compared to the other Sonae insignias (see Hope
and Fraser 2003a, pp. 33, 61). Afterwards, the performance of Modalfa in each region
was compared with the national performance of Modalfa. Finally, each Modalfa store and
242 See Hope, J. and Fraser, R. 2003a. Beyond budgeting: how managers can break free from the annual
performance trap. Boston: Harvard Business School Press. p. 134 243 Interview with the Director-General on 23/11/2011 (M01.53) 244 Interview with the Operations Director on 18/01/2012 (M05.41)
SECOND CASE STUDY: MODALFA
193
each product category was compared with the aggregate values of Modalfa. The
Controller said that the shops with relatively worse performances had an opportunity for
improvement, and that was the focus of directors and store managers after the analysis. In
this regard, the Operations Director commented that the customer service at stores was
also a differentiation factor from other competitors (see Johnson 1992, pp. 72, 77):
“The way the people will look at the brands will be very affective; which will differentiate, at an equal [buying] opportunity. If both [brands] have a good price and a good product, my [perceived] difference will be for the one with the better smile. The store where I am made to feel special. [At operations] we feel the customer service is the most difficult [thing to do]; and we want this as the differentiating factor in our stores, the people [working at stores] is the great difference. For me, the most difficult thing in the present time, that is, where I am concentrating all the efforts, is the development of team capabilities.”245
The Controller commented that she took a proactive approach towards the
business, i.e., identifying improvement opportunities (see Hope and Fraser 2003a, p. 107).
She explained that Modalfa had a monthly trade meeting – in addition to the monthly
activity analysis meeting. It was a meeting for brainstorming and for discussing the
business and market context (see Ambler 2003b, pp. 26-31; Shank 2006, p. 356; Simons
1995b, p. 15). The Controller explained why she considered her participation in this trade
meeting to be very important:
“In order to follow the business closely, it makes sense that we understand it, because everyone has his defined role within it. The Director-General, all first-line directors, and some eventual guests are present [in the meeting]. We discuss several issues, e.g., changes in sourcing process, changes in store's merchandising, changes in logistics, i.e., issues more related to the business itself, not necessarily related to planning and management control. I am always invited to be present at these meetings and I usually am. […] Usually, the management control function is policing. We do not want to be so; it is obvious that we want to control – for this is our role – but mostly [we want to] follow-up the business. The better we understand the business, the better we do our job as controllers.”246
Apart from using accounting information to find opportunities for improvements,
Modalfa managers also used it for strategic planning; this is described in the next section.
245 Interview with the Operations Director on 18/01/2012 (M05.29) 246 Interview with the Fashion Controller on 13/12/2011 (M03.10/14)
CHAPTER 6
194
6.3.3.1.6 Accounting Information for Strategic Decisions
Both the Marketing Director and the Controller reported that the accounting information
was demanded and used to decide and to plan strategically (see Shank 1989, p. 50). The
Marketing Director said that to propose changes to his team, e.g., recruiting more people,
he had to justify that the proposal would bring a positive contribution to the financial
results of the company; otherwise his proposals could be rejected. He mentioned that
when he was able to show the contribution, in terms of quality and results, his proposals
were accepted. In this regard the Marketing Director said:
“At Sonae, one of the good things we have is that we must be able to propose rationally; when proposing any increase, any change in our team, it has to be based on some rationality. Since we are able to demonstrate this to our board, then it often happens, i.e., demonstrate what must be done, to get the things completed with quality, while guaranteeing the [financial] results.”247
An example given by the Marketing Director was the decision not to launch the
customer loyalty card in Modalfa. He argued that the decision was made and justified
using financial reasons. He commented that the profit margins of the business did not
allow the launching of the customer discount card; the margins did not permit large
discounts. Thus, an analysis based on accounting information was the basis for not
launching a strategic marketing activity, i.e., a loyalty program associated with the
customer card. The Marketing Director explained:
“Our business, our price positioning, does not generate sufficient margins for us to have a loyalty program.”248
The Controller noted that the availability of accounting information, the
interaction between the various directors, the analysis and the discussion of this
information, produced medium and long-term strategic effects (see Simons 1995b, p. 29).
The first example was the analysis of the return on marketing campaigns, which permitted
to plan and to design new campaigns, correcting what was wrong and focusing on what
they had done well (see Simons 1995b, p. 92, 2000, p. 316). The Controller explained:
“We analysed specific situations [from marketing campaigns]. We were able to tell the correct direction for improving sales, also to help future
247 Interview with the Marketing Director on 13/12/2011 (M02.57) 248 Interview with the Marketing Director on 13/12/2011 (M02.28)
SECOND CASE STUDY: MODALFA
195
decisions. We analyse not only at the time of campaign but also in the subsequent time period, checking the post-event effects.”249
In October 2012 Modalfa joined the Continente customer card network (see
Section 6.2). The Brand Manager said that the MD used accounting information regularly
to evaluate the marketing promotions, and the analysis also provided input into strategic
decisions, e.g., related to customer segmentation (see Johnson 1992, p. 65; Shank 1989,
p. 50). The Brand Manager explained:
“Regarding the support from the accounting information […] we analyse the promotional campaigns (now made through Continente customer card, with whom we have been partners since last October) with a focus on variables such as: customers who used the [discount] coupon; new customers who were acquired; contagious effect on the sale of other articles without promotion; customer return rate in the days following the campaign; and customer segment, for more targeted campaigns.”250
The second example was the use of accounting information in the process of
setting five-year goals and action plans. The Controller commented that the budgeting
process, in addition to incorporating the business goals, also contributed to its definition
(see Horngren 2004, p. 210). Every year, in addition to making the next year's budget,
Modalfa’s managers revised the business plan for the following five years (see Hope and
Fraser 2003a, p. 78; Simons 1987b, p. 4). The Controller gave an example:
“We just close the whole process of building the budget for the next year [2012] and incorporate, defined in each business, what are the expectations and objectives – either for the next year or for the other coming years. We outline each year, we review every year, the five-year business plan.”251
Finally, the departments of accounting and management control also actively
participated in the expansion projects, i.e., the management control department was
responsible for preparing the business plan of the new commercial projects, e.g., new
stores related to the internationalisation strategy (see Section 6.2.3).
The next section covers the topic of accounting information for marketing
decisions related to pricing and promotions.
249 Interview with the Fashion Controller on 13/12/2011 (M03.19) 250 Email from the Brand Manager on 19/03/2013 251 Interview with the Fashion Controller on 13/12/2011 (M03.03)
CHAPTER 6
196
6.3.3.1.7 Accounting Information for Setting Prices and Promotions
The positioning of Modalfa brand (see Appendix 2) was to be perceived by customers as
having the most competitive prices. The Director-General explained why the price
management was becoming increasingly important:
“Nowadays, the price has acquired an importance that, two or three years ago, it did not have. The price is a strong point [of Modalfa], recognised by all customers. In the past, we looked at it on a comparative basis, i.e., we needed to be the cheapest. Nowadays, with the retraction on consumption, more than being the cheapest, we need to be cheap enough for the customer to feel the necessity to buy. When the economy was growing, it was enough to be the cheapest. The customers were comparing the shops from which to buy. Nowadays, it is not a problem of choosing where to buy, it is a question of just not buying. We need to reinforce this point [the price] and tell people that they should not feel bad for buying in our shops because it is so cheap that it is worth it.”252
The Marketing Director said that the was very central to the business strategy and
“a vector of positioning and affirmation of Modalfa brand”.253 It was so in a wide range of
products, which they called the basic and permanent base, e.g., lingerie, jeans, polos, tops,
T-shirts, shirts, and ties, where they intend to be the most competitive. In these core
products the brand maintained much of its positioning, the Marketing Director said.
Compared to its competitors, the Marketing Director affirmed that the quality/price ratio
of Modalfa brand was superior (see Johnson 1992, p. 101). The Marketing Director
commented:
“We have better value for money than our competitors, including Zara and H&M. These are usually covered in the market research. In these particular products, we have better quality/price ratio than our competitors; told by our customers, obviously.”254
The price competitive position was attained through: (1) sourcing in the Far East;
(2) management of synergies (shared services); (3) buying bargaining power (scale); and,
(4) permanent cost reduction practices (business process innovation), said the Director-
General (see Shank 1989).
Even though the prices were set by the commercial department, they were filtered
and validated by the MD before being turned public through fashion magazines. The
252 Interview with the Director-General on 23/11/2011 (M01.63) 253 Interview with the Marketing Director on 13/12/2011 (M02.52) 254 Interview with the Marketing Director on 13/12/2011 (M02.54)
SECOND CASE STUDY: MODALFA
197
Marketing Director said that his department had the role of representing the customer
within the organisation, along with the other departments and the directors of business
(see Johnson 1992, p. 67). He explained that it was the MD that was listening both to the
customers and to the market research. The MD managed the brand image, while filtering
the prices, i.e., any change on pricing policy might have implications on brand positioning
if not well done, he said.255 The MD selected and required the articles from the
commercial department, along with the prices, for submitting to publication. Afterwards,
the MD analysed the ratio quality/price of products, comparing them with those from
competitors, and, whenever appropriate, suggested price changes to the commercial
department (see Simons 1995b, p. 94). The Marketing Director explained what was the
role of the MD in price management:
“Looking at the price, we need to check if it is suitable to appear on the same page as other; if it [price] defends us at the perceived price positioning in the market. If it is not the case, we speak immediately to the commercial department to reduce the price. We need to explain the request. If the argument is valid – usually it is so – the commercial unit immediately assumes that it is worth it. We all must be coherent with the price image that we pass to the market.”256
The Marketing Director referred to other situations where the role of the MD was
very important for protecting the price positioning. In 2010 and 2011, the volume of sales
was lower because of the macroeconomic context; in this context the profitability could
be protected through higher prices. However the Marketing Director was aware of the risk
of the negative impact of higher prices on brand positioning, alerting other departments
about it (see Johnson 1992, pp. 65-69). The Marketing Director explained:
“We need to pay much attention and be very zealous about all variables that sustain our positioning, e.g., we may want to increase prices, to protect the margins at lower volumes; however we need to do this very carefully. We created a price positioning over many years and we need to defend it. We need to be very much alert internally, be sure that we do not trespass some borders. Otherwise we will damage the work already done by all of us. Marketing has a critical role to play in these [difficult] conjunctures, absolutely. We represent the voice of the customer. Coming from marketing or not, it [the voice of customer] must be listened to, whenever it is relevant.”257
255 Interview with the Marketing Director on 13/12/2011 (M02.16) 256 Interview with the Marketing Director on 13/12/2011 (M02.17) 257 Interview with the Marketing Director on 13/12/2011 (M02.65)
CHAPTER 6
198
The Marketing Director said that decisions about prices and promotions were
conditioned by two factors, both demanding accounting information. First, the deals were
conditioned by the objective of achieving certain profit margins that allowed proper
remuneration to shareholders. Second, the prices needed to be attractive enough to enable
an appropriate inventory turnover. He explained how these two financial indicators
determined pricing and promotions:
“Ultimately, for the customer it is very good [promotions and price discounts], but for those who manage the trading account… you need the ability to reconcile the discounts with sufficient margins for the shareholders. Also, we cannot only protect the profit margin because we have a stock to drain.258 […] There are variables that have to be reconciled, it is not easy.”259
The Director-General explained that the price management also aimed at assuring
the existence of special low prices, in some articles, to attract customers to shops.
However, the low priced items should be balanced with other profitable products,
properly arranged on the shop floor, to construct the overall store’s profitability. The
Director-General explained how Modalfa managed pricing and placement, using
accounting information, in coordination with marketing staff:
“We know that we have products supplying a good service to the brand, in terms of price positioning and promotion; both attract customers to the store and to have the store well up in one’s mind for buying specific articles. However if we only sell these products we will have serious profitability problems. We also need to have profitable products for assuring [store level] profitability. We need to manage the product placement [merchandising] well in order that the customers buy both the highest number of articles and the desired mix. We analyse the impact of both pricing, and putting certain products on a table or on a wall, and the number of transactions, the products sold to each customer and the overall store profitability at the end of the day. The merchandising team looks for this balance, led by someone from the marketing department.”260
In Modalfa accounting information was also a key element in the process of
marketing planning. This is discussed in the following section.
258 See Johnson, H. T. and Kaplan, R. S. 1987. Relevance lost: The rise and fall of management accounting. Boston: Harvard Business School Press. p. 41 259 Interview with the Marketing Director on 13/12/2011 (M02.45) 260 Interview with the Director-General on 23/11/2011 (M01.47)

SECOND CASE STUDY: MODALFA
199
6.3.3.1.8 Accounting Information for Marketing Planning and Budgeting
The Director-General commented that the MD had the responsibility to propose activities
for the following year. These were defended at the annual meeting – where the actions
and the necessary resources were planned, i.e., the plan of actions and resources (PAR)
meeting (see Anthony and Govindarajan 2003, pp. 364, 417). It was after the PAR
presentation and discussion – which focused on the technical and human resources
required – that the plans were developed at the budget level (see Hope and Fraser 2003a,
p. 11; Simons 1995b, p. 145). The Director-General explained the function of the MD in
the planning and budgeting process:
“The marketing area does its proposal and presents how the next year will be, the objectives and the reasons for their decisions; e.g., investing more in this or that area, being more incisive in the promotion plan, reducing the component of communication for positioning, investing more in CRM, invest more in web media, or social media, etc. Everything is analysed and proposed by marketing in meetings, including in the meetings related to the coordination of the plan of action and resources [PAR] for the whole area.”261
The budget amount for marketing was proposed by the MD (see Anthony and
Govindarajan 2003, pp. 420-421). It was based on the result of the historical information
collected, market research, and marketing strategy. The budget amount was then
presented to the board directors along with a set of measurable actions (see Anthony and
Govindarajan 2003, p. 416). The Marketing Director explained the budget amount was
determined considering a percentage of the volume of sales expected: “we have got a
benchmark for the marketing expenses as a ratio of net sales, i.e., usually 2% or 2.5%.”262
The process of activity planning and budgeting was led by the department of
management control with the collaboration of several departments, especially sales and
marketing – because the Controller said she needed information related to sales forecasts
and expectations for the coming year (see Anthony and Govindarajan 2003, pp. 420-423;
Nixon and Burns 2012, p. 226). The Controller, commenting on the work of planning,
said:
“Now we are closing the next year's budget for Modalfa, i.e., sales by store, by category, by month, going down to the lines of free cash flow and economic profit. Defining also the items of the balance sheet, e.g., inventories, suppliers credit, customer debts. We start on sales, going to the
261 Interview with the Director-General on 23/11/2011 (M01.40) 262 Interview with the Marketing Director on 13/12/2011 (M02.34)

CHAPTER 6
200
bottom line, up to what we need for evaluating the business itself; looking also at the expectations and business objectives for the next year.”263
The Marketing Director, in addition to controlling the costs budgeted for his
department, also made use of the overall business unit accounting information, every
month, during the analysis of the activity meeting (see Hope and Fraser 2003a, pp. 24-
26). He explained why he analysed the information every month:
“We all look [over the costs], over fixed costs and everything else; all of us individually for our department. But also, every month, we look at the overall accounts, the accounts of the business unit. We debug each one of the [cost] lines to see where the deviations, if any, are, why they are there and which corrective actions are eventually necessary.”264
The Commercial Director said that planning was annual and had several phases.
First, in April, they had strategic meetings on monitoring the business for 3 and 4 years.
In June and July, they made the analysis of activity of the semester, and then, in
September, they began to define the projections for the end of the year and the outlook for
the following year. He said that it was a process performed mainly by the management
control department, but with the collaboration of each of the businesses in each budget
item (see Anthony and Govindarajan 2003, pp. 421-422; Shank 2006, p. 356). The
Commercial Director concluded:
“The following year's budget is closed around December. It has several phases: first sales, then [gross] margins, operating costs, marketing [costs] and so forth. In each of them, I or people from my team, come in, according with what [information] we have [to supply].”265
The Commercial Director took into account different financial indicators while
setting the management objectives, the annual planning and the budget (see Anthony and
Govindarajan 2003, p. 416). He explained what his goals were as Commercial Director:
“[Our objective] is selling, with the best possible [profit] margin, and with the lowest possible inventories. This is the objective of any commercial company. We have got the objectives defined in the budget: [profit] margin objectives, sales objectives, increases in the number of stores, and internationalisation – not in Modalfa but in the case of Zippy. I am in
263 Interview with the Fashion Controller on 13/12/2011 (M03.07) 264 Interview with the Marketing Director on 13/12/2011 (M02.34) 265 Interview with the Commercial Director on 12/01/2012 (M04.46)

SECOND CASE STUDY: MODALFA
201
charge of both. Basically, these are the objectives, reflected in the budget.”266
The Commercial Director said that he interacted with accounting in particular
during the process of budgeting, e.g., looking at historic registries, setting objectives and
doing the profit and loss account projections for the end of year (see Anthony and
Govindarajan 2003, p. 416). During this process, the Commercial Director analysed the
costs and the profit margins from different perspectives, e.g., profit margin at the front
office, costs of goods sold, costs of stores, costs of marketing, logistics costs and
information system costs. In this respect the Commercial Director commented:
“We look at all of this even though I am not responsible for some of these costs; for example, I am not responsible for the information system costs. However, both myself and the Director-General of fashion, may approve, or not, some investments in IT, store expansions, and repairs.”267
The Modalfa Financial Director, referring to the PAR meetings and presentations
of budgets, commented that these were opportunities for interaction and learning among
managers of various functional areas (see Anthony and Govindarajan 2003, p. 417;
Simons 1995b, p. 29). He said that as the budget was prepared and presented by the heads
of the various functional areas, that meant a great proximity and use of accounting
information (see Horngren 2004, p. 210). The Financial Director commented in this
regard:
“[The live presentation of the PAR and the budget] is mainly a process of discussion and exposure. Usually a session of PAR exposure is done by first-line managers with people from the executive committee [board directors], so it is wider, so this is the time of the year where people take the day to listen to [others] and to see if there are interdependencies among [functional] departments’ scheduled actions. It is essentially a time for sharing information.”268
Besides the use of accounting information in planning marketing activities,
information was also used to argue and protect the levels of spending on marketing, in
particular when there were cost reduction objectives. This is developed in the next
section.
266 Interview with the Commercial Director on 12/01/2012 (M04.33) 267 Interview with the Commercial Director on 12/01/2012 (M04.14) 268 Interview with the Financial Director on 09/08/2012 (M06.32)

CHAPTER 6
202
6.3.3.1.9 Accounting Information to Protect Marketing Expenditures in Cost Containment Contexts
The Director-General stated that the objective of cost control was strengthened by two
factors: first, the reduction in consumption, due to the economic crisis; second, by the
rising prices of raw materials (cf. Section 6.3.3.1.3). In this context, of much control over
costs, the Marketing Director said that it was very important for him to prove to the board
directors that the marketing expenses had no negative effect on net earnings – after
considering all the relevant costs of marketing campaigns and the income differentials
resulting from these campaigns. The Marketing Director explained his perspective:
“In very difficult conjunctures, in difficult times, the companies face a huge dilemma; is it worth investing in marketing or saving the money, protecting the most the operating account? We wanted to show here that it is worth investing [in marketing], that creates value, that pays the costs. We wanted mostly to avoid – somehow, it might be conjectured – a decrease in marketing investment.”269
The Marketing Director mentioned that the operational indicators of marketing
performance – in situations of cost containment – were not sufficient to argue in defence
of marketing spending (see Lehmann 2004, p. 74). He considered it was necessary to use
financial indicators from the accounting system. He said he felt the need to demonstrate to
key decision-makers (the board directors) that his department was able to contribute to
adding value to the organisation, e.g., contributing significantly to increased sales. In this
regard the Marketing Director expressed:
“They [the board directors] always have the possibility, and in the end the necessity, to say to me ‘‘I will cut your budget’’; but I need to be in peace with my conscience; making it clear about the consequences of the decisions. It is a duty that I have with the organisation. The organisation will decide accordingly. It is my job to do this. I must make it clear in their minds that, if they cut the marketing budget, then they will also cut sales, as was proved by several analyses that I tried to do throughout the year.”270
Apart from the impact on sales, the Marketing Director also conducted analyses in
terms of EBITDA, to make the contribution of its marketing campaigns in the company’s
profitability quite clear. He said that the use of EBITDA, to analyse marketing
campaigns, was first used in 2011, and he associated that fact with the economic crisis
269 Interview with the Marketing Director on 13/12/2011 (M02.41) 270 Interview with the Marketing Director on 13/12/2011 (M02.68)

SECOND CASE STUDY: MODALFA
203
that occurred. Between 2006 and 2010, the marketing budget271 at Modalfa was, on
average, 2.9% of sales (see Table 6-7). Even though there was a decrease in sales, the
marketing budget, in 2010, was the highest. The Marketing Director explained that in
difficult years, as were 2010 and 2011, the pressure for reducing marketing expenses were
stronger; however his efforts to demonstrate the added value of marketing activities
protected the department from lower budgets (see Simons 1995b, p. 81). The Director-
General confirmed the efforts of the MD to negotiate the marketing budgets while
demonstrating the value of their activities.
Table 6-7 Modalfa Sales and Publicity Expenses 2006-2010
Thousands of euro 2006 2007 2008 2009 2010
Sales 74,015 88,463 100,606 107,035 103,430 Publicity expenses 2,244 2,356 2,516 2,539 3,839 % of sales 3.03 2.66 2.50 2.37 3.71 Source: adapted from the Informa DB database
Among the major Portuguese fashion brands, between 2006 and 2009, Modalfa
was the company with the highest average in publicity expenses as a percentage of sales
(see Appendix 1). The Marketing Director said that in the case of expenses related to the
construction or reinforcement of the brand image, the returns were in the long run; so it
was more difficult for him to argue with financial indicators based on immediate effects.
However, the accounting information helped him to protect the amount of expenditures
related to the brand as well; it is covered in the next section.
6.3.3.1.10 Accounting Information to Justify Brand Activation Activities
The marketing activities at Modalfa were planned to produce two major consequences:
brand activation and promotions. The Marketing Director explained that the brand
activation concept was related to intangible things, e.g., customer loyalty, brand
awareness and brand perceived image. The promotional activities were focused on
achieving immediate returns, e.g., increase in sales and higher margins, through more
visitors at stores or higher conversion rates, i.e., converting visitors into buyers (see
Kotler et al. 2006). In the case of Modalfa, accounting information supported the
Marketing Director to plan activities that, although they were focused on activating the
271 Marketing expenses for publicity
CHAPTER 6
204
brand in the mind of consumers (see brand activation concept in Appendix 2), with long-
run profitability objectives, also produced effects on the short-run profitability (see
Johnson 1992, pp. 171-172). The Marketing Director explained his strategy:
“Nowadays, in difficult times, there is a concern in generating visits [to the stores]. There is a pressure for it. Even in brand activation activities, we try to do it with a cause-effect [with relation to store visits]. The process of brand construction does not need to walk back-to-back with the promotion for the visits. While planning the activities for the year we try to think of those that bring customers to the stores.”272
Both the Director-General and the Marketing Director recognised that, in
macroeconomic difficult times, the expenses for brand activation might be reduced. The
resources tended to be allocated to activities that contributed clearly and positively to the
short-run profitability, i.e. promotions. Modalfa made an effort to develop promotional
activities that produced impact on the brand positioning, and brand activation activities
that produced impact on store visits. The Director-General confirmed their aim at
designing the short-run oriented marketing actions – to impact on sales and earnings –
without forgetting the importance of building brand value with long-run effects (see
Johnson 1992, pp. 171-172). Referring to the subject, the Director-General said:
“I think that in these times of huge cuts [in expenses], the part that we cut is the positioning and the specific work for the brand. We always try to do campaigns closer to the operational, communication, more related to consumption. As I used to say, working for the legs [for customers to come to the stores] but allowing some marks on the head, i.e., with a positive impact on [brand] positioning.”273
Besides protecting the total amount budgeted for marketing, the Marketing
Director also had the aim of protecting the resources of his department, through being
accountable, in terms of his contribution to the company’s profitability. This topic is
addressed in the next section.
6.3.3.1.11 Accounting Information for Marketing Accountability
The Marketing Director reported that he performed measurements of marketing
performance using financial data helped by the management control. For example, (1)
whether the communication's contents and used media generated additional customer
272 Interview with the Marketing Director on 13/12/2011 (M02.10) 273 Interview with the Director-General on 23/11/2011 (M01.19)
SECOND CASE STUDY: MODALFA
205
visits; or (2) how the marketing campaigns influenced the retailing conversion rate, i.e.,
transforming visitors into customers; or (3) whether the customer bought more than the
average. In this respect, the Marketing Director reported:
“We concluded, in some cases, that when we got simultaneously the three vectors, i.e., taking more people to the store, increasing the conversion rate from 20% to 22% or 23%, and when the average sale amount increased, we got a positive EBITDA. The increase in the value generated was higher than all extra costs, even with all the marketing investment in media and communication.”274
The Marketing Director said that his aim was to show that the financial
measurements of marketing could be standardised; to demonstrate to the board directors
that the marketing investments, though the directors could see them as a cost, generated
value for the firm. The Marketing Director explained that although the responsibility of
marketing was to generate awareness, adding value to the brand, marketing had a very
important role to play in the short run, i.e., the promotion of sales.275 The Director-
General, in recognising the efforts made by the Marketing Director to prove the value
added by the marketing campaigns, said:
“The Marketing Director has done a huge amount of work in proving to me and to all in the company that it is possible to do [marketing] campaigns with positive EBITDA. […] The Marketing Director has been trying – and well – to prove that the money that he is investing in his area has a return, not only in the long run – we do know that, but nowadays we are mainly worried with the short run. We must be sure that every single euro that we invest has an analysis of its return in the future.”276
The Marketing Director commented that he calculated the EBITDA of marketing
activities, helped by the management control department. The Marketing Director said
that they did these measurements in 2010 and 2011, and explained the reasons:
“[We] scrutinised every euro spent, it is normal to do so. In these [economic] situations the marketing expenses are hard pressed for generating return.”277
Explaining the methodology used, the Marketing Director said that in the new
stores they compared the volume of sales with the previous week, or the previous month,
274 Interview with the Marketing Director on 13/12/2011 (M02.39) 275 Interview with the Marketing Director 276 Interview with the Director-General on 23/11/2011 (M01.21/25) 277 Interview with the Marketing Director on 13/12/2011 (M02.37)
CHAPTER 6
206
when the data from the year before was not available. At those stores with historic
records, they compared the sales with the homologue week of the previous year. They
compared the homologue-week with the campaign-week and the homologue-week with
the week-after-campaign and analysed the results.278 The Marketing Director explained
why he was giving an account of marketing activities:
“Nowadays it is very important for marketing to reset itself and assume that one of its main functions – perhaps so for these years – its main function is a very tactical one, i.e., to lead customers to the store, to sell, and show it and aver it by numbers.” 279
Moreover, the Marketing Director considered it was very important, in difficult
times, to prove that the resources that he consumed, besides generating more value for the
company, could potentiate the initiatives that came from the commercial department. In
this respect he argued:
“We could continue to do just what is our duty; we could, for example, communicate promotions that the commercial department tells us, and only this. I think we may have an obligation to do more. We have to prove that every euro we spend, the way we communicate, has impacts, and we can leverage all the great deals that can possibly come from our commercial department. It is at these times that we have to be very careful and very zealous for the attributes that are the basis of support of our [department] position.”280
In Modalfa, accounting information was also used for contribution margin
analysis; the following section discusses this topic.
6.3.3.1.12 Accounting Information for Business Unit’s Contribution Margin Analysis
The Financial Accounting Director explained that each main business was organised with
smaller business units. For example, the textile business had the men’s product line, the
women’s product line, and the children’s product line; each of these product lines were
called business units within the textile business. Each of these business units had sales
information, purchasing information and contribution margin information available, he
said (see Shank, in Robinson 1990, p. 16). Costs that did not originate at the business unit
were not allocated to the business unit; they were considered at the store unit profit and
278 Interview with the Marketing Director 279 Interview with the Marketing Director on 13/12/2011 (M02.48) 280 Interview with the Marketing director on 13/12/2011 (M02.65)
SECOND CASE STUDY: MODALFA
207
loss account. The Financial Accounting Director indicated that much of the accounting
information was organised at the store unit because “the unit of reference for us is the
store.”281 He described how the commercial staff analysed the business units, using
accounting information:
“The business unit – in this concept of product line, e.g., children [clothing] – is managed up to the level of gross margin, contribution margin. The cost of logistics, direct costs at product level, and those very related to the product. The business manager, or the manager of the business unit, which we call the DUN,282 the director of the business unit, is responsible for managing the [contribution] margin. He is responsible for sales, he is responsible for purchasing, he is responsible for managing the margin of that business.”283
Apart from the use of contribution margins to analyse the profitability of the
business units, the commercial staff also used the accounting information to make
decisions about the product mix. The following section discusses the topic.
6.3.3.1.13 Accounting Information for Product Mix Decisions
Commenting on the product mix management, the Director-General said they needed to
have a combination of profitable products and price attractive products, for assuring
business profitability and attracting customers to the stores, respectively (see Section
6.3.3.1.7). He said they used to manage the product placement carefully, i.e.,
merchandising, in order that the customers bought both the highest number of articles and
the desired mix. The Director-General commented that they analysed the impact of both
pricing and placement – putting certain products on a table or on a wall – on the number
of transactions, on the products sold to each customer and on the overall store profitability
at the end of the day. He explained that the merchandising team, from operations, looked
for this balance, led by someone from the MD. The Director-General explained how the
placement of products was managed in order to maximise profitability:
“We never do [the profitability analysis] using the logic of the margin of a single product. We do the profitability analysis for the store as a whole. In some shops we have got devices that count the entries of customers. We cross check the number of customer entries with the purchasing transactions, this gives us a first success rate, we call it the conversion rate;
281 Interview with the Financial Accounting Director on 21/09/2012 (M07.20) 282 DUN are the initials of Portuguese words: Director da Unidade de Negócio; which means Business Unit Director. 283 Interview with the Financial Accounting Director on 21/09/2012 (M07.21)

CHAPTER 6
208
i.e., the rate of converting visitors into customers. Afterwards we calculate the number of pieces purchased and the average value of pieces. Then we are always testing [controlling] where we should put the products for improving these ratios. All of them are multiplicative.”284
Accounting information was also used, by marketing and commercial
departments, to perform business analysis and diagnosis of problems, as discussed next.
6.3.3.1.14 Accounting Information for Business Analysis and Diagnosis
The Fashion Controller said that the business activity analysis was done on a monthly
basis. She explained that the objective was to analyse the results of the month before, and
it was performed with the first-line directors, the Director-General and the Board Director
for Sonae SR (see Hope and Fraser 2003a, pp. 24-26). The Controller said that they
performed an analysis of the business, from the top line of sales to the bottom line of
results.285 The Fashion Controller said that the meeting was organised by her and
explained how it was done:
“The documents are prepared by us, the management control. On some occasions there are also [other] documents of support – if people attending the meeting deem it necessary to justify any question, or share some analysis that they themselves have done that month; e.g., if there is a specific campaign, they will make an analysis of the campaign and also share this information with us because, in the end, this was reflected in the profitability of the brands in that month.”286
The Controller said that the support document for the meeting was the activity
analysis report. It was produced by the management control department and it included
every detail regarding the performance of the division as a whole and of each brand in
particular (see Anthony and Govindarajan 2003, p. 495). It was done as a monthly
analysis and a year-to-date analysis including comparisons with the budget (see Ambler
2003b, pp. 29-30). The meeting was led by the Controller who set the agenda. All
participants contributed different points, and might receive comments or questions from
any of their fellow participants (see Hope and Fraser 2003a, p. 155). The Controller noted
that the support document began with an executive summary that gave the highlights for
every type of business, e.g., the highlight of sales, how they compared to the budget, how
284 Interview with the Operations Director on 18/01/2012 (M05.46) 285 Interview with the Fashion Controller on 13/12/2011 (M03.07) 286 Interview with the Fashion Controller on 21/09/2012 (M08.01)
SECOND CASE STUDY: MODALFA
209
the [profit] margins were, how the EBITDA was. The highlights were on the first slide.
The Controller said that, ultimately, if no one else wanted to read the rest of the
document, on the first page were the most important messages for each of the businesses,
i.e., what had happened in that month. The Controller explained:
“This is not to say that every month they read the document intensively and look for all the details. Maybe there are months when it is more productive to analyse a particular item, and they have there the details and they are going to analyse them; and in the following month, it is more productive to analyse another [item] and they also have the detail and will analyse it. I give the basis for people to do the analyses they consider more relevant. [...] At bottom it is the attitude of giving. I give information that I consider relevant, in case the person actually wants to look at all the lines. Obviously, after that, every month we look at those that are most critical or which have more positive performances to see also what is happening at all levels.”287
The aim, said the Controller, was to send out the activity analysis report two
working days before the meeting, so people would have time to see the information, to
prepare and to make additional analyses if necessary (see Simons 1995b, p. 121). The
Controller explained:
“Above all, it is not only to show what the results were, but sharing and the very discussion of what was done well or done poorly, and then also to define inputs for the work for the following months.”288
The Brand Manager, referring to the availability of accounting information and its
importance for the analysis and diagnosis of the business (see Eccles 1991, p. 5)
commented:
“Also in a regular manner, but not daily, printouts are available with commercial information: sales per collection, impacts of mark down,289 and stocks; and operational information: sales and transactions, complemented by stores’ ranking. The profit and loss account is analysed, allowing you to fully diagnose the business and make more strategic decisions.”290
The directors of marketing and sales also used accounting information to analyse
the performance of their staff; this is seen in the following section.
287 Interview with the Fashion Controller on 21/09/2012 (M08.08) 288 Interview with the Fashion Controller on 21/09/2012 (M08.02) 289 Here, “mark down” means a long-run price reduction. 290 Email from the Brand Manager on 19/03/2013 and phone call on 20/03/2013 (M10)
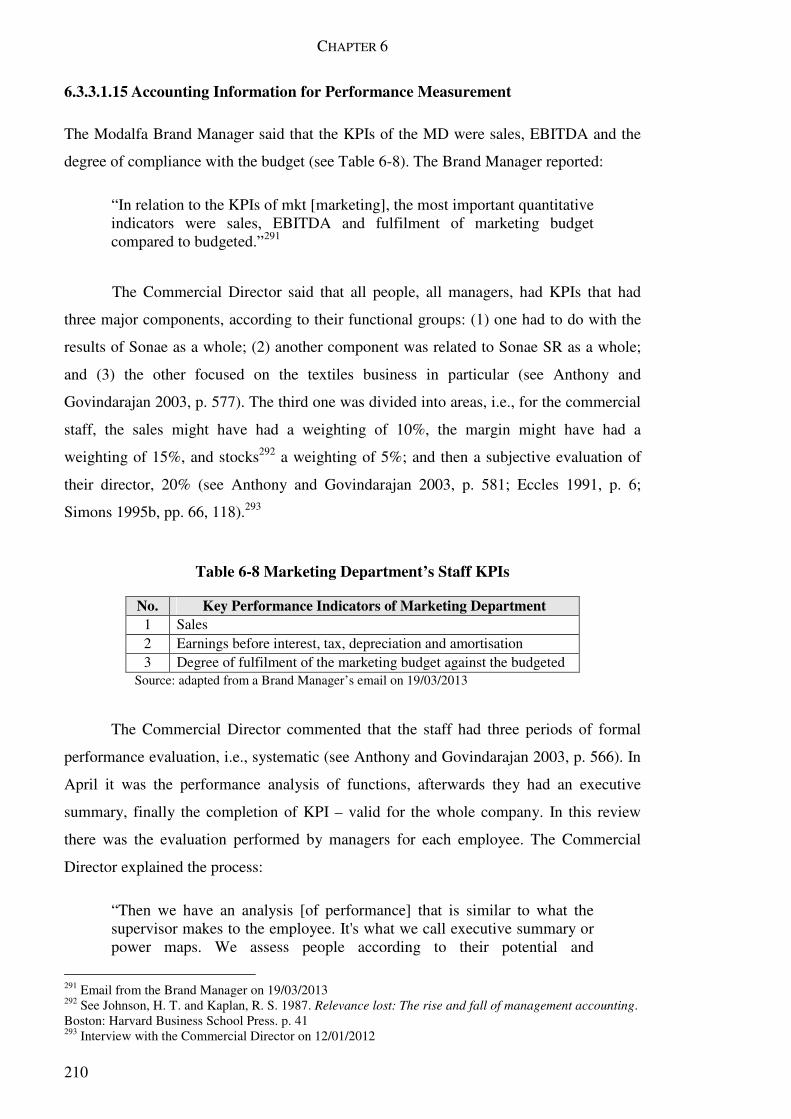
CHAPTER 6
210
6.3.3.1.15 Accounting Information for Performance Measurement
The Modalfa Brand Manager said that the KPIs of the MD were sales, EBITDA and the
degree of compliance with the budget (see Table 6-8). The Brand Manager reported:
“In relation to the KPIs of mkt [marketing], the most important quantitative indicators were sales, EBITDA and fulfilment of marketing budget compared to budgeted.”291
The Commercial Director said that all people, all managers, had KPIs that had
three major components, according to their functional groups: (1) one had to do with the
results of Sonae as a whole; (2) another component was related to Sonae SR as a whole;
and (3) the other focused on the textiles business in particular (see Anthony and
Govindarajan 2003, p. 577). The third one was divided into areas, i.e., for the commercial
staff, the sales might have had a weighting of 10%, the margin might have had a
weighting of 15%, and stocks292 a weighting of 5%; and then a subjective evaluation of
their director, 20% (see Anthony and Govindarajan 2003, p. 581; Eccles 1991, p. 6;
Simons 1995b, pp. 66, 118).293
Table 6-8 Marketing Department’s Staff KPIs
No. Key Performance Indicators of Marketing Department 1 Sales 2 Earnings before interest, tax, depreciation and amortisation 3 Degree of fulfilment of the marketing budget against the budgeted
Source: adapted from a Brand Manager’s email on 19/03/2013
The Commercial Director commented that the staff had three periods of formal
performance evaluation, i.e., systematic (see Anthony and Govindarajan 2003, p. 566). In
April it was the performance analysis of functions, afterwards they had an executive
summary, finally the completion of KPI – valid for the whole company. In this review
there was the evaluation performed by managers for each employee. The Commercial
Director explained the process:
“Then we have an analysis [of performance] that is similar to what the supervisor makes to the employee. It's what we call executive summary or power maps. We assess people according to their potential and
291 Email from the Brand Manager on 19/03/2013 292 See Johnson, H. T. and Kaplan, R. S. 1987. Relevance lost: The rise and fall of management accounting. Boston: Harvard Business School Press. p. 41 293 Interview with the Commercial Director on 12/01/2012
SECOND CASE STUDY: MODALFA
211
performance, i.e., one year the person has a lot of potential but that year the performance was not satisfactory, was not brilliant; or a person has not great potential but did a very good job in that role and, probably, will be a good person for that functional level or for that function. Afterwards we put it on an axis between the horizontal and vertical – with these two components – and we know the power map. We can see the people that are well or those people that we need to re-consider both in terms of functional displacement or exiting to other [business] areas.”294
The Financial Director commented in this regard that each department defined a
set of KPIs (see Simons 1995b, p. 63); however, there were KPIs that were common to
all: the corporate KPIs. That is, each person had the corporate KPIs, the departmental
KPIs and the personal KPIs, which were related to the level of compliance with both their
responsibilities and the business strategy (Simons 1995a, p. 81).
Accounting information was still used by Modalfa to manage in changing
contexts, as described below.
6.3.3.1.16 Accounting Information for Managing in Changing Contexts
In Modalfa, the budgets were considered as guides for managers (see Horngren 2004, p.
210). The Marketing Director said that budgets were not seen with an absolute
determinism but as guidelines in situations of instability and change (see Hope and Fraser
2003a, p. 127). There were also tools to identify gaps and stimulate actions to correct the
previously plotted course for the business (see Simons 1995b, pp. 4, 123). In this regard
the Marketing Director said:
“These [budgets] are theoretical exercises. Budgets, in times like these, we see that, in a very cold mind, as theoretical exercises, as guidelines. Because, I think, no one, in his right mind, can say, today, that whatever is there [in the budget] will be achieved. You cannot. The degree of uncertainty is such, nowadays, that I think more than anything else, it has to be a working tool, something that guides us. But really we have to be prepared to act very quickly if those assumptions do not come to fulfilment, we must all be prepared for that.”295
The Brand Manager said she received daily, by email, accounting information
produced by the business intelligence unit of the fashion division. This information was
produced in conjunction with the department of planning and management control (see
294 Interview with the Commercial Director on 12/01/2012 (M04.11) 295 Interview with the Marketing Director on 13/12/2011 (M02.74)
CHAPTER 6
212
Shank 2006, p. 356). These reports contributed to daily tactical decision making, and
helped to focus marketing management on priority issues. The Brand Manager reported:
“Regarding the accounting information support, we receive daily a tableau
de board from the Fashion Division's Business Intelligence team, with indicators of sales, [profit] margin and provisions [for inventory losses]. This information gives important daily alerts of major deviations from the established objectives, it guides tactical decision making, and focuses the business continuously.”296
Finally, accounting information was also used to better understand the
competitors’ situations.
6.3.3.1.17 Accounting Information for Understanding Competitors
The Commercial Director commented that they had information about competitors,
prepared by the management control department (see Hope and Fraser 2003a, p. 55;
Shank and Govindarajan 1993; Simmonds 1981, p. 26). He said that in textiles there was
little information about market shares, competitors, and prices levels, supplied by
specialised agencies. He said it was easier in food retailing, because there was Nielsen297
and other organisations that worked with the supermarket products, e.g., grocery or
beverages. Moreover, the Commercial Director said it was difficult to make a comparison
between fashion products, because in fashion the products were always changing. The
information about competitors was prepared by the head office management control
department or by the dedicated controller working in the commercial department of
Modalfa. The Commercial Director, commenting about the availability of competitors'
information, said:
“[We have competitors’ information] about sales, profitability, business strategy, exports, etc. We also perform regular visits to competitors, where we analyse the business, i.e., the products that they have, fashion, price decreases and price increases. We do it in loco. We have got teams allocated to do this.”298
296 Email from the Brand Manager on 19/03/2013 (italics in the original) and phone call on 20/03/2013 (M10) 297 “In 100 countries around the world, Nielsen provides clients the most complete understanding of what consumers watch and buy.” (http://www.nielsen.com/uk/en/about-us.html, accessed on 19/03/2013) 298 Interview with the Commercial Director on 12/01/2012 (M04.47)

SECOND CASE STUDY: MODALFA
213
The PCG also had access299 to the accounts of competitors. They knew, for
example, what the cost structure of Zara was (e.g., how much was spent on certain
accounts, such as water expenses) and how much the Bershka had sold. The PCG used to
report, to other Modalfa departments, about the performance of these competitors, using
them to benchmark their own activities (see Eccles 1991, pp. 4-5; Hope and Fraser 2003a,
pp. 55, 123). The Operations Director explained the role of PCG and what was the
accounting information she received in order to make a comparison with other direct
competitors (see Simons 1995b, p. 94). She said:
“They inform us about the profitability of the major [competitors], in order to challenge us, holding up the carrot to us, saying you must reach this goal. [PCG] is very much involved. Moreover, they participate in almost all our meetings. It is an element that belongs to our department.”300
Finally, the Operations Director said that they frequently used the information
about competitors and customers for managing the evolution of the image of stores:
“We are always looking at what others are doing better than us. The evolution for the 5th generation [stores] has a great deal of intelligence. We visit all others and we bring the best from every one. We construct a store with the best from the best of all.”301
The factors that influenced the ability of the accounting system to meet the
managers’ demand of accounting information are described in the sections that follow.
6.3.3.2 Factors Influencing the Use of Accounting Information
In this section it is identified the factors that influenced – facilitated or hindered – the
ability of the Modalfa accounting system to meet the managers’ demand of accounting
information. Firstly, it is reported the structural factors – those that refer to the
management style and the characteristics of Modalfa’s human and technical resources.
Then follows the functional (behavioural) ones, those that relate to the way of doing
things, i.e., the way accounting information was collected, organised, communicated and
used.
299 The information was accessed through competitors’ annual management reports or through companies specialised in collecting accounting information, e.g., eInforma from Informa D&B. “The Informa D&B database contains all businesses in Portugal and is updated daily [...] through public sources and the companies themselves.” (www.einforma.pt, accessed on 01/12/2012) 300 Interview with the Operations Director on 18/01/2012 (M05.75) 301 Interview with the Operations Director on 18/01/2012 (M05.72)
CHAPTER 6
214
6.3.3.2.1 Structural Factors
6.3.3.2.1.1 Managers’ Mindset
The comments made by both the Operations Director and the Marketing Director
suggested that, on the one hand, the culture of Sonae led managers to be very attentive to
the sales revenue and the savings in resources consumptions (see Kaplan, in Robinson
1990, p. 3); on the other hand, to value investments in marketing, in particular the
creation of strong brands with long-run returns. These perspectives strongly contributed
to Modalfa managers to seek information from the accounting system and its intensive
use. For example, the Operations Director said that her stance on the management of costs
was closely linked to the values transmitted by the company's founder and the company
culture. She recollected:
“We learned so much with Mr. Belmiro; he was very restrained [on spending]. He always told us ‘‘take it easy’’, and this culture stays. We spend on what adds value, avoiding what doesn't. It is in our roots, the costs analysis was always a concern for us, but it is not the variable which we look at every morning. The variable that we look at, in first place, is yesterday's sales, this is the first [indicator] we look at.”302
The Marketing Director shared the Operations Director’s perspective saying that it
was a cultural issue, the value attributed to the brand and the importance given to the
marketing investments (see Johnson 1992, p. 25). However, he also stressed that he still
had to prove that what he did in the MD was well done and worth the investment
(marketing outlays). When he referred to the culture of the organisation as a factor for
enhancing the brand, he justified it by reference to the financial perspective, i.e., the
necessary investments in the brand in order to reap the benefits afterwards. He
commented:
“I would be dismissed if I could not prove that what we do is well done. However, it is essentially a cultural question. This company always had a very concrete notion of brand value, of the necessary investments for attaining the results, and of the risks that should be taken.”303
Therefore, the demand for accounting information and its use was embedded in
the company culture. The information system was also a factor that fostered the use of
accounting information in Modalfa. This aspect is discussed in the following section.
302 Interview with the Operations Director on 18/01/2012 (M05.54) 303 Interview with the Marketing Director on 13/12/2011 (M02.83)
SECOND CASE STUDY: MODALFA
215
6.3.3.2.1.2 Information System
The accounting information system adequately met the managers’ demand of accounting
information for profitability analysis and revenue analysis (see Johnson and Kaplan 1987,
p. 14). The Controller attested that they had very good IT tools, which enabled them to do
many types of analysis (see Eccles 1991, p. 4):
“We have got excellent [IT] tools. We can do whatever analysis you can imagine. The information is totally available. I can do an analysis of yesterday's sales, unit by unit, store by store, by article and size, e.g., how many pieces of skirts were sold yesterday, by store, children's article, blue colour, size S; I can have this information automatically, from the system, in a single sheet. We can do [profitability analysis] at the product level.”304
Software adaptations that were required by new business contexts or managers’
requirements were met quickly. No director reported any weakness from the IT system.
The IT department had a person exclusively allocated to the fashion business department,
to detect improvement opportunities and understand the specific management accounting
information requirements from the business unit managers (see Hope and Fraser 2003a, p.
135). The Commercial Director observed that the information system gave him all the
information needed to make his analyses of the business. He described the support he
received from the information system:
“[I evaluate] the return, sales less the given discounts, the increment on sales, in terms of [profit] margins and value, the price discounts by area, I do the results. It is compared with the historical and the references that we have. [The information system] gives the basis and we do the calculations in Excel or in a more manual way, so to speak. The system gives us what are the articles that are in the [marketing] campaign, which is the date of the campaign, giving us the reports, the numbers, afterwards we have to work a little.”305
The Operations Director had detailed information for managing the stores, and
information for the profitability management, both for the insignia and for the business
unit (see Anthony and Govindarajan 2003, p. 495). She used the MAS information for
determining the focus on certain objectives, and for analysing and supporting opinions.
304 Interview with the Fashion Controller on 13/12/2011 (M03.15) 305 Interview with the Commercial Director on 12/01/2012 (M04.31)
CHAPTER 6
216
The Operations Director explained the importance of MAS information for
supporting the decision making (see Nixon and Burns 2012, p. 226):
“This is a maxim that we always have; also for the stores' teams. They know that they cannot form opinions without analysing data. Otherwise the result is the think-for-all, i.e., I think that... we tend to give opinions too much, and after analysing the data the things are completely different. Also for the measurement of the impact of actions. It is very important. We do need this strong discipline. Many people like to implement, but never like to see afterwards. What is the result? [Which is] the improvement in productivity?”306
The Operations Director said that if they did not have such a rigorous and tailored
information system, they would need twice the time to analyse something. They did not
need to go to several places because they had got the information properly compiled and
integrated from several areas (see Eccles 1991, p. 4). In that same document – which
arrived from the PCG for the monthly activity analysis – they had got the inventory
perspective, the commercial perspective and the stores' operations perspective. The
Operations Director added:
“I have got a document that tells me everything, about all areas, which clarifies my doubts. It is very well integrated and very important.”307
The Finance Director also used the computer system to plan payments to
suppliers. It gave him the information automatically and on time, without the need to
personally contact other functional directors. He explained:
“There are systems for this, i.e., the orders are registered, and we get the information about the orders from these systems.”308
The Financial Accounting Director said that a large part of the management and
control information, particularly with regard to the financial control – e.g., balance sheets
and profit and loss accounts – was based on accounting information that was structured
by cost centres and profit centres, and it was greatly aided, and facilitated, by the
information systems. He observed:
“We have all [accounting] information organised in this way and the systems help so much. The systems facilitate everything.”309
306 Interview with the Operations Director on 18/01/2012 (M05.100) 307 Interview with the Operations Director on 18/01/2012 (M05.102) 308 Interview with the Financial Director on 09/08/2012 (M06.10)
SECOND CASE STUDY: MODALFA
217
Finally, the Management Control Director said that the information system, as it
was set, allowed great flexibility and customisation in accessing to the accounting
information (see Hope and Fraser 2003a, pp. 65, 126). The Management Control Director
explained the advantages of the system they used:
“Basically [the self-service in accounting information] allows [the managers] to be faster in their decision-making processes. They are fully autonomous in their search of [accounting] information and building conclusions for a decision. I think that this gives them a clear advantage. On the other hand, even when it comes to monitoring their business, they have the information continuously available which allows them to follow up the business on a daily basis. In fact, there are people who prefer to have a set of information in one way, others in another way. The tools themselves, nowadays, are enabling enough customisation and people focus on the way that is most comfortable for them, that's an advantage.”310
Accounting information was organised in careful detail, allowing it to be analysed
by managers from different hierarchical levels, from the top managers to the managers at
operational levels (see Anthony and Govindarajan 2003, p. 495). This is discussed in the
following section.
6.3.3.2.1.3 Detailed Accounting Information
The Financial Accounting Director said that the management control department received
detailed accounting information up to the business units and to the store level; producing
afterwards the management accounting information. He said that the profit and loss
accounts were made at the store level, and the gross margins were made at the business
unit levels, i.e., by the product lines of menswear, womenswear or children’s clothing
(see Anthony and Govindarajan 2003, p. 495). In this regard he said:
“It is the management control [department] that prepares that information, that analyses that information, that produces the information reports. The information is then discussed in the various meetings of analysis of business activity. Definitely at the executive committees, which make a kind of general analysis, afterwards at the meetings at each brand, each business, each business unit. The information is very detailed and there are many managers looking at the [accounting] information.”311
309 Interview with the Financial Accounting Director on 21/09/2012 (M07.17) 310 Interview with the Management Control Director on 24/09/2012 (M09.53) 311 Interview with the Financial Accounting Director on 21/09/2012 (M07.42)
CHAPTER 6
218
The Fashion Controller acknowledged the availability of detailed accounting
information, as well as the support from the information system, commenting:
“The information is totally available. I can do an analysis of yesterday's sales, unit by unit, by article and size […] I can have this information automatically, from the system, in a single sheet. We can do [profitability analysis] at the product level.”312
Accounting information also had links to other Modalfa’s databases containing
non-financial information, which allowed linking non-financial data to financial data (see
Anthony and Govindarajan 2003, p. 495; Simons 1995b, p. 64) as discussed in the
following section.
6.3.3.2.1.4 Links Between Databases
The Financial Accounting Director said that they used the SAP313 software for financial
accounting which interfaced with the multiple operating systems, as store management
and sales management software. He noted that the enterprise resource planning software
was not SAP. The enterprise resource planning system used was the Retek314 from
Oracle.315 Information about both purchases and sales – sales information had another
system that had very detailed retail sales information, e.g., information from each sale
transaction – was then stored in a data warehouse and accessible by all software (see
Hope and Fraser 2003a, p. 65). The Financial Accounting Director said that the
integration of all systems and the existence of a common data warehouse allowed quick
and detailed access to all management accounting information (see Ambler 2003b, p. 84;
Hope and Fraser 2003a, pp. 65, 126; Shank 2006, p. 361). The Financial Accounting
Director explained:
“This very detailed information – now we can know the daily purchases by article – all of this information goes into a data warehouse system which holds the detailed information. Then, a synthesis of a more aggregated information is sent to the accounting [department]. This is done at store [level], or at business unit [level].”316
312 Interview with the Fashion Controller on 13/12/2011 (M03.15) 313 “Headquartered in Walldorf, Germany, with locations in more than 130 countries, SAP AG is the world leader in enterprise software and software-related services.” (http://www.sap.com, accessed on 31/12/2012). 314 “A comprehensive, complete solution that includes back-office functionality for finance and human resources and extends throughout planning, merchandising, the supply chain, and multiple retail channels.” (http://www.oracle.com/us/corporate/acquisitions/retek/index.html, accessed on 31/12/2012). 315 “Oracle offers an optimised and fully integrated stack of business hardware and software systems.” (http://www.oracle.com/us/corporate/welcome/index.html, accessed on 31/12/2012) 316 Interview with the Financial Accounting Director on 21/09/2012 (M07.18)
SECOND CASE STUDY: MODALFA
219
In addition to integration of computer systems, the speed and automation of
accounting entries also contributed to provide daily updated accounting information to all
managers, as discussed below.
6.3.3.2.1.5 Automated Accounting Registry
The Financial Accounting Director expressed that he was very committed to automating
the accounting entries. The automation resulted in cost savings related to human
resources: fewer people were required to enter and check accounts. It also accelerated the
reporting and analysis of accounting information, making it more useful in tasks of
managing the business, particularly in the commercial and operations areas, said the
Financial Accounting Director. Referring to the efficiency of the accounting department,
he said:
“One of our drivers of efficiency is the electronic invoice. That is, what we call the dematerialisation of information, and, we go further, touch less, i.e., [we] are able to perform the accounting entries, the recording of transactions, and even the control of accounting operations and transactions, without any human intervention.”317
The Financial Accounting Director commented that when the complexity of the
administrative work was upstream, i.e., in the processing of documents from suppliers,
there were more likely to be errors in the system. In this regard, he stated that in retailing,
the complexity of administrative and accounting system was upstream. If there were
inefficiencies, many of them were related to the process of verifying and registering
supplier invoices, said the Financial Accounting Director. The complexity in Modalfa was
not downstream, because they had no invoicing to customers, but cash sales, and
therefore this greatly simplified the process of accounting entries, commented the
Financial Accounting Director. In this regard, and on the efforts made to minimise errors
and hasten the accounting processes, the Financial Accounting Director said:
“I have to buy every day, I receive goods every day, every day I have to do receptions of goods, I have to check invoices every day. I receive three million supplier's invoices every year and I have to check them, I have to control them. [...] Today we have, in the goods, about 80% of electronic invoices, 80% of goods' invoices come electronically from our suppliers. Within these 80%, there are 90% that are checked automatically [by the electronic system].”318
317 Interview with the Financial Accounting Director on 21/09/2012 (M07.32) 318 Interview with the Financial Accounting Director on 21/09/2012 (M07.36)

CHAPTER 6
220
The Financial Accounting Director explained that when the invoice total was
correct or within the limits of acceptability, it entered immediately into the accounting
system. The verification of suppliers' invoices was done automatically by the system, and
went to the accounting and payment automatically. “No one is there making a touch
whatever. So this is what we call touch-less. There is no touch,”319 he said. The Financial
Accounting Director rationalised the decision to develop electronic verification of
suppliers’ bills (see Johnson 1992, pp. 60-61):
“Our main cost is people. So if I do not have the automatic processes, alternatively I'll have to have people doing the job. Either I have systems and automated processes or I have people. Not only [the gain of] cost reduction but also on the efficiency and process quality. I also get faster information flows, and more correct financial accounts. The quality of information is different, it is faster. I have a much faster process of inserting the information into the [IT] system.”320
As a result, the Financial Accounting Director said that in 2012 they were closing
the Sonae Group's consolidated accounts between the 6th and the 7th working days after
the accounting period had ended. However, the Financial Accounting Director aimed at
reducing the period. He explained:
“Our goal – and we made a continuous improvement project with this overall objective – is the 5th business day. In 2013 we'll be able to do it on the 5th business day. It is not easy, in fact, because there are many processes and it is only possible because there are many automatisms. [...] We have increasingly sought to make the processes daily, aiming at not having many processes at the end of the month.”321
The existence of a controller dedicated exclusively to the fashion business unit
also contributed to the Commercial Director using more accounting information in his
daily work, as described in continuation.
6.3.3.2.1.6 A Controller at the Business Unit Level
The Marketing Director explained that apart from the Management Control Director, the
commercial department had a dedicated controller for the fashion business (see Shank
2006, p. 363). He explained that it was the person who was in direct contact with them
and was more involved with the fashion business (see Hope and Fraser 2003a, p. 106). It 319 Interview with the Financial Accounting Director on 21/09/2012 (M07.32) 320 Interview with the Financial Accounting Director on 21/09/2012 (M07.38) 321 Interview with the Financial Accounting Director on 21/09/2012 (M07.72)
SECOND CASE STUDY: MODALFA
221
was the person to whom he turned to when they needed help, he said. Especially in
economically difficult years they still used more this support, the Marketing Director
added, because they needed to devote more attention to cost management.
The Commercial Director explained that the controller dedicated to his department
allowed him to make analyses that were more commercially oriented, and more
appropriate to his role of commercial director than using the information from the PCG
(see Hope and Fraser 2003a, p. 106; Ratnatunga et al. 1990, p. 40). It had a lower weight
of accounting and cost management than the head-office reports, he said. It allowed the
Commercial Director to obtain tailored accounting information to support managerial
work (see Ambler 2003b, p. 253), which would be more difficult to obtain from the
department of management control at the headquarters level, due to its limited
availability, he said. The Commercial Director explained the advantages:
“I have a management controller only for my area; for more specific issues, for more specific analysis of the business and not for cost accounting. This person does the connection with the head office management control. He depends on me, he is a controller of the commercial unit, e.g., analyses if Modalfa is selling coats and parkas well, [therefore he is] more related to trade and less to accounting.”322
The Fashion Controller, referring to the existence of the dedicated controller to the
business unit, confirmed and agreed with the Commercial Director. The Fashion
Controller commented:
“He [the commercial controller] is not a controller in the sense of the controller as we are. He is the person responsible for the management [accounting] information of the fashion division. He produces information with a certain level of detail, more commercial. While I – or the management control – look from sales to the free cash flow, I look at everything. There [at the commercial control] is much more focus on the commercial side. They make analysis more at the article [level], the things are much more detailed. Here, with the resources we have, this is not at all possible. In the end, the support he gives to business [managers] is more commercial, information for commercial management.”323
Finally, another feature of the Sonae group that contributed to the use of
accounting information, by different directors, was the culture of projects, as is discussed
in the following section.
322 Interview with the Commercial Director on 12/01/2012 (M04.12) 323 Interview with the Fashion Controller on 21/09/2012 (M08.19)
CHAPTER 6
222
6.3.3.2.1.7 Culture of Projects
The Financial Accounting Director stated that Sonae was characterised by a spirit of team
work – at all levels – and by the culture of projects (see Hope and Fraser 2003a, p. 34).
He explained that whenever there was a common or shared initiative, they set up projects
where all functions were involved, including financial accounting and management
control, even when the objectives or activities were not directly related to accounting. The
Financial Accounting Director explained:
“We have a huge activity of project. We organise a project and create a project team for any initiative. A team who, most often, is multi-functional. Because it is the best way of having everyone contributing to the solution and everyone being involved and being well informed about what can affect his function or his team. We do not live in silos. We live in project teams, whether in daily work – in the meetings and in sharing – or when there is change, when there are processes of change.”324
In addition to these organisational (structural) aspects, which facilitated
communication and use of accounting information, Modalfa also had functional
(behavioural) characteristics that were contributing to an intensive use of accounting
information. For example, the regular interactions between the managers of the various
functional areas – finance, marketing and sales – contributed to the use of accounting
information. It was a common language, between different functional managers, in the
analysis of the performed activity and in the projections of the forthcoming (see Ambler
2003b, p. 64; Nixon and Burns 2012, p. 226; Shank 2006, p. 355). The topic is discussed
in the following sections.
6.3.3.2.2 Functional Factors
6.3.3.2.2.1 Regular Reporting Interactions Between Managers
In regard of interactions between the different functional Modalfa directors, the
Operations Director said that they met frequently (see Anthony and Govindarajan 2003,
p. 566). She said specifically that the meetings, covering the market issues, occurred
every fortnight, the product meetings every quarter and the strategic meeting occurred
monthly (see Simons 1995b, p. 96). The meetings brought together the first-line directors,
i.e., marketing, commercial, inventory and operations.
324 Interview with the Financial Accounting Director on 21/09/2012 (M07.86)
SECOND CASE STUDY: MODALFA
223
The Operations Director explained:
“It is productive to meet regularly, because I have an analysis of data and a perception about what is happening at the stores. The commercial director has a different perception of data, because he analyses it more from a business perspective and less from the store [perspective]. The Marketing Director has more of a perspective of unity, incorporating the communication strategy and how it is working.”325
The Controller, referring specifically to the monthly meetings of activity analysis,
commented that at the meeting, in addition to the first-line managers, there were also
present the CEO of Sonae SR, the Director-General, the Management Control Director,
and herself, as she was the person who followed the fashion business, as well as prepared
and moderated the meeting. Referring to the support documents of the meeting, the
Controller said the documents were prepared by the management control department, and,
if necessary or convenient, there were also support documents prepared by other
participants (see Ambler 2003b, p. 253). The Operations Director commented that
although these face-to-face meetings occupied two days, every month, they were very
useful to her (see Simons 1995b, p. 101). She argued that much information which was
transmitted face-to-face was difficult to pass through written reports or emails (see
Simons 1995b, p. 97). She explained:
“Sometimes we think about it: another meeting, being all together two days per month; however the communication by email does not show the non-verbal impact; his expression and his concern cannot be noticed [by email]. It is very important to be [face-to-face] at the meeting, exchanging ideas and understanding which product ran well, which ran badly; the opinions of all; what about a campaign; what could be improved.”326
At the monthly meeting, in addition to the analysis of data gathered internally by
the management control, the department of management control also sought to gather
information on competitors and present it to the various functional managers (see Hope
and Fraser 2003a, p. 55). The Controller observed:
“We are restricted to public information, but we look for the performance of the major players comparing it to ours, we always try to do this. We also share this information [in the monthly meeting with business directors].”327
325 Interview with the Operations Director on 18/01/2012 (M05.40) 326 Interview with the Operations Director on 18/01/2012 (M05.06) 327 Interview with the Fashion Controller on 13/12/2011 (M03.24)

CHAPTER 6
224
The Director-General commented that the overall annual budget was based on an
initial meeting, non-financial in nature, in which all functional directors directed (see
Anthony and Govindarajan 2003, pp. 420-421). That meeting was primarily to present the
action plans, with lots of information on the resources required for it, in particular, the
human resources required (see Horngren 2004, p. 210). Commenting on the objectives of
the meeting, the Director-General said:
“In order to prepare the budgeting, we have previous steps which we call PARs, i.e., plans of action and resources, usually human resources, not the financial ones.”328
The Financial Director reinforced the importance of the qualitative component of
the PAR meetings (see Ambler 2003b, p. 26); however, he said, some financial indicators
were also included and discussed by the distinct functional directors present at the
meeting aiming at improving the business processes (see Johnson 1992, p. 9). The
Financial Director explained:
“[At the PAR meeting we present] essentially more qualitative issues. However we also forecast the overall budget of the department or the functional area. In the Modalfa case, [presented] are sales variables, expansion issues, but mostly the improvement processes – e.g., sourcing improvements or visual merchandising improvements.”329
The Financial Director commented that the interactions during the PAR meetings
were opportunities for different functional directors to inform their colleagues, from other
departments, on projects for the forthcoming year and to identify situations in which the
plans of a specific functional area had implications in other departments (see Anthony and
Govindarajan 2003, p. 364; Simons 1995b, p. 96). In this regard, the Financial Director
observed:
“[The PAR meeting] is not a team building but more of a sharing session. The people also discuss. If there is a department that forecasts some investment plans then it impacts on the cash flows. People have exposure to the plans of others and they try to see the areas where the [different] activities overlap. […] so it’s the time of year where people take the day to listen to [others] and to see if there are interdependencies in what the other areas of the company will do.”330
328 Interview with the Director-General on 23/11/2011 (M01.40) 329 Interview with the Financial Director on 09/08/2012 (M06.30) 330 Interview with the Financial Director on 09/08/2012 (M06.22)

SECOND CASE STUDY: MODALFA
225
The Financial Accounting Director referred to the PAR meetings as PARs sharing
meetings (see Eccles 1991, p. 5). He said that these meetings were very important for
him, because they enabled them to communicate the departmental projects to their
colleagues of other departments (see Simons 1995b, p. 145). For example, for
communicating the initiatives of the accounting department to the other functional
departments, e.g., marketing and sales. The Financial Accounting Director explained the
importance of the interaction between managers before the phase of the budget (see
Anthony and Govindarajan 2003, pp. 350-352, 420-421):
“Each activity makes its PAR; it has to do so in an articulated form. I will not launch a reorganisation of the administrative function – which involves interactions with business directors, interactions with the operations directors – without sharing it with both the commercial directors and the operations directors and coordinating these initiatives [with them]. There is a time for preparation of PAR and then there is a time for discussion and sharing, in which all functional managers are [present]. These meetings have a significant number of people, what we call first-line directors; beyond the board directors there are the second lines, i.e., the commercial, the operations, the administrative, the planning and the management control areas.”331
The Management Control Director indicated that the main advantage of the
monthly activity review meetings was the alignment of teams (see Ambler 2003b, p. 143).
It allowed the managers to have a common understanding about the performance, on the
problems and solutions (see Nixon and Burns 2012, p. 226); which was fundamental for
managers to take coordinated decisions (see Ambler 2003b, pp. 29-30). The Management
Control Director explained:
“An error that they had known how to identify, in a particular month, and that everyone has understood as an error, and what are its origins, and its impacts, prevents, avoids, similar situations in the future. At the same time, often depending on the performance that we are seeing, we, in these meetings, take some initiatives to re-balance, e.g., if we have difficulty in sales, it is analysed and the main problems identified. Normally teams create some alignment on what is needed to do next.”332
The Management Control Director specified that, from the monthly review
meetings, there resulted diverse types of initiatives – e.g., to launch new marketing
campaigns, or, at worst, not launch marketing campaigns and protect the profit margins –
which were the result of a common understanding, and created by the interaction between 331 Interview with the Financial Accounting Director on 21/09/2012 (M07.53) 332 Interview with the Management Control Director on 24/09/2012 (M09.33)

CHAPTER 6
226
teams with the major skills, e.g., the commercial area, the areas of stocks, marketing and
operations (see Simons 1995b, pp. 94-96, 2000, p. 217). The Management Control
Director commented:
“The main advantage has to do with this multidisciplinary discussion that usually allows you to form a well-structured opinion about what is going on. This is crucial in these meetings. Obviously they often seek – when there are problems it is essentially around these issues that time passes – to identify the causes of a weakness or a problem in a given month. This is normally reviewed in some detail in an activity review meeting: what went wrong, why it went wrong, how we can solve the problems.”333
The mindset and perspective of the accounting department staff was another factor
that contributed to organise the accounting information so as to be useful to managers.
The accounting department was directed to the internal customers, i.e., the internal users
of the accounting information. This feature is described in the following section.
6.3.3.2.2.2 Financial Accounting Department Focused on Internal Clients
The Financial Accounting Director said he was a member of the executive committees
and informed about the various business activities; therefore, he knew about the business
situation and their needs, “as someone that is from inside the business unit”334 (see Boer,
in Robinson 1990, p. 28; Shank 2006, p. 356). As the Financial Accounting Director
belonged to the executive committee of Sonae SR, he participated in two meetings
monthly; at these meetings he analysed the business activity, analysed projects –
everything that was related to new investments – and other general or specific issues to
each business. He said he was in contact with the other directors and aligned with the
decisions across the various business units and functional departments. The Financial
Accounting Director in this respect commented:
“[I am] in the executive committee of Sonae SR, where the administrators of the business of Worten [consumer electronics], [Modalfa] fashion division, the Sport Zone, are. I am there, there is the general manager of information systems, there is the general manager of planning and management control systems, there is the general manager of treasury and finance, there is the general manager of human resources. We are a management team. We are fully attuned and coordinated.”335
333 Interview with the Management Control Director on 24/09/2012 (M09.34) 334 Interview with the Financial Accounting Director on 21/09/2012 (M07.46) 335 Interview with the Financial Accounting Director on 21/09/2012 (M07.47)
SECOND CASE STUDY: MODALFA
227
The financial accounting department was not only focused on the strictly legal or
bureaucratic functions associated with the external report – although the department was a
central, shared service, which was intended for all the retail business of Sonae – but it was
a department that was focused on the business situation (see Shank 2006, p. 365), i.e.,
concerned with the development of business and the role of accounting in supporting
them, said the Financial Accounting Director (see Hope and Fraser 2003a, p. 82; Boer, in
Robinson 1990, p. 28). The Financial Accounting Director, describing his responsibility
and the administrative department role, said:
“This starts with me, I'm on the executive committees, so I'm listening, I'm monitoring, I am speaking, and I'm putting the issues from the administrative services that are relevant to the business [management]. I have the ability to intervene and share knowledge, etc., and, after all, my directors are there too. My directors meet the commercial staff, the operations directors from the various businesses. They meet the directors of the central functions. We work as a team and in a coordinated way, because it has to be.”336
The Financial Accounting Director justified the presence of the administrative
department staff being closer to the business management with the need to be informed of
the needs of internal customers, i.e., the users of accounting information within the
organisation, particularly the commercial managers, marketing and operations (see Boer,
in Robinson 1990, p. 28; Shank 2006, p. 356). In this regard, the Financial Accounting
Director said:
“We are shared services – maybe in other businesses the shared services need not be so close – but in this business we have to be inside. We cannot be out of the business [management]. Otherwise we are not playing our role, because we will not have the information to manage processes and to manage information; nor are we contributing to help the business [managers] to manage their own problems.”337
The Financial Accounting Director gave as an example the coordination with
suppliers. He noted that in addition to the problems related to the accounts of suppliers,
the issue of documents errors, the financial problems, and also the problems related with
trade negotiation, always arose in these meetings. He noted that if accounting staff were
not present and helping to solve these problems, it meant that they were not doing their
job (see Hope and Fraser 2003a, p. 37; Johnson 1992, p. 9).
336 Interview with the Financial Accounting Director on 21/09/2012 (M07.48) 337 Interview with the Financial Accounting Director on 21/09/2012 (M07.49)

CHAPTER 6
228
The Financial Accounting Director concluded by saying:
“We [the financial accounting] have teams organised by processes. We are always present at the meetings where we belong to and where we are needed, where we have to intervene. This demands, every day, a huge coordination between the teams [from financial accounting] that are more linked to both processes’ management and the business teams [e.g., commercial, marketing and operations].”338
In addition to the focus of the financial accounting department on internal clients,
there was also a mood of collaboration between departments that encouraged the use of
accounting information (see Nixon and Burns 2012, p. 226). This topic is seen in the next
section.
6.3.3.2.2.3 Collaboration Between Departments
The relationship between the PCG and the other departments for performing the business
control was very collaborative (see Hope and Fraser 2003a, p. 107; Nixon and Burns
2012, p. 226). The Director-General said that both the MD and the PCG, worked closely
with each other to plan and assess the returns of marketing campaigns:
“Our management control – differently from other experiences, from people to whom I talk, not mine – has much more a posture of planning and proactive control. It is not the posture of the red balls or green balls, a posture of detectives, that here, thank God, does not exist. They work the data and perform the management control, but not in the perspective of identifying problems but identifying opportunities. This is why the Marketing Director has the support from management control for assessing the [marketing] campaigns. It is very interesting indeed.”339
The Controller perception was that everyone from marketing, operations,
commercial, and sourcing, formed the fashion team as a whole. She expressed:
“I have been here for ten years, I don't know how was it before. Everyone from marketing, operations, commercial, and sourcing, form the fashion team as a whole, they work very closely. There is no reason for not having a direct and collaborative relationship. They have a direct relationship with us, the management control. The relationship is also very good with the administrative services and all other units; e.g., from IT, there are people in charge, at least one, who is directly and only at the fashion division. He [the person from the IT department] looks at the business needs and tries to
338 Interview with the Financial Accounting Director on 21/09/2012 (M07.49) 339 Interview with the Director-General on 23/11/2011 (M01.67)
SECOND CASE STUDY: MODALFA
229
develop [the existing tools] or creates new ones if necessary; he follows the business needs [of IT] very closely.”340
The Operations Director noted that she was very well supported by the PCG (see
Hope and Fraser 2003a, p. 37). This was reported as highly critical when deciding about
changes in operations. The Operations Director reported a particular situation, where the
timely management control information about relevant costs and revenues supported, with
objective information, her sense about the solution to a particular issue. The Operations
Director commented:
“They [PCG] create the analysis that we need. It was almost a tailor made dress, it is a luxury; e.g., last week we needed an analysis focusing on store timetable, for knowing what would we gain or lose from reducing the store opening times. I asked for this analysis for all shops and they answered me within a week. It confirmed my feelings, but we need data to support our feelings. […] They produce and send us precious information every month, e.g., about costs, operational accounts, and, sometimes, they give us provisional operational accounts for helping us with business navigation. They are not like policemen; they are very helpful. This is very positive for helping me in decision making, of great value; otherwise it would be much more difficult or more expensive as far as I would need to create, inside my structure, someone that would do these analyses for me, for supporting my decisions.”341
The Marketing Director also reported that his department had a very good
communication with the PCG, and that this was particularly important in the difficult
economic environment of the year 2011. The Controller, in addition to collaborating with
the MD in evaluating campaigns, assisted in controlling the costs. The Controller
described her collaboration with marketing, in the control of costs:
“We, management control, look at the expenditures and variances on the marketing budget as a whole and by types of expenditures. We talk to the Marketing Director, to understand the variances, and identify the planned activities not yet performed. Afterwards, I issue a report for the cost centre of Modalfa, with the marketing expenses and any possible revenue, directed to the Marketing Director, who discusses it with his staff; verifying if all invoices are properly registered.”342
340 Interview with the Fashion Controller on 13/12/2011 (M03.26) 341 Interview with the Operations Director on 18/01/2012 (M05.44) 342 Interview with the Fashion Controller on 13/12/2011 (M03.30)
CHAPTER 6
230
The Financial Director said that the PCG, although an autonomous department,
collaborated with other departments (see Eccles 1991, p. 5). He explained:
“[The PCG] is an autonomous entity – it means that it has its own structure, has a director, has an administrator, is responsible for planning everything; for all that is management indicators, business indicators. Obviously, with all the other departments there is an overlapping area and we all work together.”343
The Financial Accounting Director commented that the diverse functional
directors looked at the accounting department as part of the business – although the
administrative department was located at the headquarters. The Financial Accounting
Director said:
“People [from the business units] do not see the administrative services department as a thing apart. They see it as something that is part of the business. Because it was born that way.”344
As mentioned in the previous section, the PAR meetings contributed to the
administrative department were involved with the business managers and set the design of
administrative processes and the flow of accounting information from the time of the
launch of the business units (see Johnson and Kaplan 1987, p. 14; Lere 2001, p. 589). The
Financial Accounting Director commented that they had bodies, forums, advisory groups,
committees, which they called sharing and knowledge bodies (see Eccles 1991, p. 5).
These groups met regularly. They were from different functional areas and from different
businesses. He said that as there were common management processes, e.g., information
technology, this collaboration enabled synergies and negotiation power with suppliers,
which were often common. He also said that this exchange facilitated the mobility of
people between different departments or different business units.
The contribution of several managers from different functional areas to detect
errors and validate the information organised by the accounting department was another
factor that contributed to the accounting information being deemed credible by managers,
and therefore used on a regular basis. This is described in the following section.
343 Interview with the Financial Director on 09/08/2012 (M06.01) 344 Interview with the Financial Accounting Director on 21/09/2012 (M07.88)
SECOND CASE STUDY: MODALFA
231
6.3.3.2.2.4 Accounting Information Checked by Different Managers
The Financial Accounting Director said it was very important to him that the various
managers looked at the accounting information with a critical eye, identified errors and
reported them to the administrative department. The Financial Accounting Director
commented that errors could occur, because they performed more than 40 million
accounting entries a year and about 60% occurred automatically. He noted that the
participation of managers in the identification and correction of accounting errors had
made accounting information more reliable. Referring to this aspect, he said:
“There are many eyes looking at the [accounting] information. Thousands of people analysing the management information in this organisation. They themselves are the first ones concerned that the information is accurate, that all is right, and if they detect any [...] error, it will be observed, it will be identified and can be, and will be, corrected. There is here a kind of self-control in the management information, which is at the same time accounting information.”345
The face-to-face transmission and analysis of accounting information was another
factor that influenced positively the use of accounting information (see Anthony and
Govindarajan 2003, p. 505; Hall 2010). This is discussed in the following section.
6.3.3.2.2.5 Accounting Information Communicated and Analysed Face-to-Face
The Fashion Controller, while describing the meetings of the activity analysis – a monthly
meeting led by the management control department, involving mainly financial reporting,
as described in Section 6.3.3.2.2.1 – said that it was characterised by a “work session,
usually productive, in which the participants are active in all matters that arise”.346
However, she noted that the very presentation of numbers was not enough; the managers
needed an explanation and an interpretation of the figures. She said it was achieved
through the participation of all managers from different functional areas. She rationalised
the importance of presenting and discussing face-to-face the accounting information (see
Simons 1995b, p. 97) in the following terms:
“As management control we look at the numbers but we do not necessarily have an explanation [for them]. I can look and I can ask, but I cannot give the answer. Why did we have some kind of distinct performance? And the business [managers], depending on the area, can give almost an immediate
345 Interview with the Financial Accounting Director on 21/09/2012 (M07.44) 346 Interview with the Fashion Controller on 21/09/2012 (M08.12)
CHAPTER 6
232
answer to that. That is why it is a very sharing working session of all these issues; we clarify issues that depend on us, and the business [managers] also clarify issues directly with each of the [functional] areas, where people [who attend the meeting] are responsible.”347
Other managers have made similar assessments on the importance of the verbal
communication of accounting information (Hall 2010). The Commercial Director, for
example, highlighted the fact that he systematically interacted through email,
conversations and meetings. He explained:
“We meet to analyse the numbers and [fashion] collections, e.g., yesterday we met to discuss the product collection, where all departments spoke about the product. There must be a big dynamic between departments. […] More than this, we are physically organised with several departments mixed together. There is an interaction of different areas on the table work, long tables, with people from different departmental heads. As in every organisation, sometimes we have got communication noise, or communications that need to be known quickly; in these cases we must reinforce with meetings, notices and conversations.”348
In this regard, the Operations Director revealed that she considered email
communication very limited. “Communication by email does not show the non-verbal
impact, his expression and his concerns do not pass”349 by email, said the Operations
Director. In this respect, the Financial Director also commented that the executive
meetings, e.g., the live presentation of both the PAR and the budget, were mainly a
process of discussion and exposure (see Horngren 2004, p. 210). He considered that it
was a unique opportunity for managers to listen to others and ask questions;
opportunities for sharing information and interacting (see Simons 1995b, p. 4).
The fact the management control was involved in strategic planning also
contributed to accounting information being used by other managers and in particular
marketing and sales. The subject is addressed in the following section.
6.3.3.2.2.6 Management Control Involved in Strategic Planning
The Controller commented that although she engaged in the construction of budgets, for
about four months, she also had the responsibility to follow up the daily business and to
build the business plan for projects of expansion – in particular the internationalisation
347 Interview with the Fashion Controller on 21/09/2012 (M08.13) 348 Interview with the Commercial Director on 12/01/2012 (M04.43) 349 Interview with the Operations Director on 18/01/2012 (M05.06)
SECOND CASE STUDY: MODALFA
233
projects. This led her to interact and communicate frequently with other managers – e.g.,
commercial and operations – using accounting and financial information, she said. The
Director of the PCG had also indicated that he had access to strategic information because
it was his department who streamlined the strategic reflections on each of the businesses
in Sonae (see Shank 1989, p. 50). He said that it was the PCG who streamlined the entire
process of reflection about the business, identifying problems, identifying solutions, and
defining strategies. In this regard, he said:
“It was the area of management control that promoted this whole [strategic] discussion and sought to transfer it to [management control] elements which were then used by the rest of the organisation. We participate actively in discussions and try to guide the management teams to achieve a goal, a result.”350
The Management Control Director said that his participation in the process of
strategic reflection and strategic definition had the advantage of contributing to set the
components of management control which were “geared to assist teams to lead the
company in the desired direction”351 (see Anthony and Govindarajan 2003, p. 352). He
noted that when identifying a weakness in a business concept, e.g., in a KPI, the
knowledge of the strategy helped them to identify the problem (see Simons 1995b, p. 64),
to create a solution and then monitor the solution’s implementation (see Simons 1995b, p.
3). The Management Control Director explained the advantage and consequences of
involving the control department in the business strategy (see Shank 2006, p. 356):
“I think that [the control department leading the strategic discussions and planning] allows continuous bridging with the results. The key advantage we have is [...] that it helps us to understand what is happening in the business, in the activities and in the more qualitative components, and this is the main advantage: to understand why [the results are these].”352
The involvement of PCG in strategic thinking and on monitoring the business,
contributed to the PCG focus on supporting managers in their managerial work, i.e.,
conducting the business in the planned direction, and using accounting and financial
information (see Shank 2006, p. 363). The support management accounting was giving to
business managers is described in the next section.
350 Interview with the Management Control Director on 24/09/2012 (M09.25) 351 Interview with the Management Control Director on 24/09/2012 (M09.26) 352 Interview with the Management Control Director on 24/09/2012 (M09.48)
CHAPTER 6
234
6.3.3.2.2.7 The Control Department Focus on Supporting The Business Managers
The Financial Director said that the department of management control supplied all the
quantitative information regarding the activity and the performance of the various
businesses; including both the aggregated information and the very detailed information
(see Anthony and Govindarajan 2003, p. 495; Hope and Fraser 2003a, p. 65). He
explained:
“All quantitative data are provided by the PCG or are provided by the respective departments, who give this information. The PCG, in this respect, is the soul of the business. The soul of the business in the sense that the PCG is accompanying the progress of the business and the various variables. […] You can go, as a last resort, to the number of T-shirts sold. The person who has the responsibility of T-shirts is not necessarily the same as the one with the responsibility of socks; therefore they must be evaluated differently.”353
The Financial Director also commented that in Modalfa, the PCG had the
responsibility to observe the business in its most essential aspects, e.g., how the prices
were, how they compared to the competition, which products were selling well and which
products were not selling (see Shank 2006, p. 356). He also noted that in the case of
Sonae – he said the role of PCG was in the genesis of the group – the PCG had a dual
function: (1) one was looking after the budgets, the analysis of the variances, and the
business planning in the logic of reporting; the other function (2) was the follow up of the
real business in its context (see Shank 2006, p. 365). The Financial Director explained
how the PCG was involved in the follow-up of the real business:
“When you are analysing deviations, you cannot just say that there is a deviation of 100 or 20 in the budget. You need someone who understands [the business situation]. Someone that perceives the business, not just the numbers, therefore you can make the bridge. [For example] This is so, why? Is it because competitors are lowering prices? Is it because people are consuming less? Is it because there are products that sell better, others worse? Is it because we have excess of inventory? Is it because we are not able to sell out a particular type of product? Is it in the north region? Is it in the south? Is it in store X? Is it in store Y? Is it the product A? Is it the product B? It is the sum of all these [understandings] that explains why the performance is better than expected. Why is it that a competitor went bankrupt? I think that all of this is what explains the sum of deviations. Therefore, in our case, a large part of this is at the PCG, another part is at the business unit.”354
353 Interview with the Financial Director on 09/08/2012 (M06.38) 354 Interview with the Financial Director on 09/08/2012 (M06.44)

SECOND CASE STUDY: MODALFA
235
The proximity of management control in relation to marketing managers (see
Hope and Fraser 2003a, p. 107; Boer, in Robinson 1990, p. 28; Shank 2006, p. 365) was
revealed in two comments made by the Controller. She commented:
“It was always our objective, in the company and in the management control, to have this proximity [to the business management]. Usually, the management control function is policing. We do not want to be so; it is obvious that we want to control, for this is our role, but mostly we want to follow up the business. The better we understand the business, the better we do our job of controllers.”355
She also said that in the PCG they were developing software systems trying to get
more detail in terms of sales (see Anthony and Govindarajan 2003, p. 495), i.e., to know
at every moment what was sold of each collection, e.g., to know today how much was
sold from the current collection, from the spring-summer collection, from the permanent
items, or from the old collections, and with what margins? How much in full pricing?
How much with promotions? The Controller, regarding the project, said:
“Let us try. We are moving forward. Currently it is a project but we are moving in this direction of giving more detail. [...] Today, the [commercial] teams, with more or less difficulty, are already able to do this internally. We have information by article, but working all this information is very tricky. We are trying to mount it directly into the information systems, so anyone – and it also brings significant improvements on the side of the very own team of fashion division – can browse the system and see the aggregated information that way, very quickly.”356
In addition to the close monitoring of the business and the concern in providing
tools to monitor the activity and dynamics of the business, the management control also
supported the commercial and marketing departments to collect and analyse financial
information in accordance with the requests originated in these two departments (see
Boer, in Robinson 1990, p. 28). This topic is seen in the following section.
6.3.3.2.2.8 The Management Control Department Collaboration with Marketing
The Controller stated that her interaction with the MD staff and the Marketing Director
was frequent throughout the year. She noted that she spoke to marketing staff whenever
355 Interview with the Fashion Controller on 13/12/2011 (M03.14) 356 Interview with the Fashion Controller on 21/09/2012 (M08.17)
CHAPTER 6
236
she had any questions or anything to resolve. The most used media was the telephone or
email. The Controller explained:
“It is a work of mutual help. They talk to me when they have any doubt or question, and when I have any doubt or question I talk to them. We exchange sales information on a weekly basis.”357
The Marketing Director commented that the role of the management control
department was very important in the assessment of marketing activities. He said that
although the MD could easily measure the increase in visitors, the increase in
transactions, and the increase in the average sale amount – this was available to them,
using the usual marketing tools – it was very difficult for marketing to assess the financial
return of marketing campaigns. The management control intervened at marketing requests
to perform these calculations. It was a joint effort of the marketing and management
control departments to bring the analysis at the EBITDA line. The control department
gave to marketing the cost information that marketing did not have automatically, said the
Marketing Director.358 The Director-General, commenting on the efforts of the two
departments to calculate the extent to which marketing activities generated returns that
justified the marketing outlays, said:
“We do this [analysis of the return on investment] very carefully. The Marketing Director is doing this in connection with the management control department, asking for their help. In this way, the management control can do an independent assessment.”359
The Director-General also said that the management control department had much
more of a posture of planning and proactive control than a simple and limited budgetary
control. The Director-General commented that the control department processed the data
and performed the management control aiming at identifying improvement opportunities
(see Simons 1995b, p. 21). The proactive attitude of the management control department
explains why the Marketing Director had the support from the management control to
assess the marketing campaigns in financial terms (see Ambler 2003b, p. 253), said the
Director-General.360
357 Interview with the Fashion Controller on 13/12/2011 (M03.08) 358 Interview with the Marketing Director on 13/12/2011 (M02.37/41) 359 Interview with the Director-General on 23/11/2011 (M01.24) 360 Interview with the Director-General on 23/11/2011

SECOND CASE STUDY: MODALFA
237
The Marketing Director asserted that the communication between the MD and the
management control was perfect, and the Management Control Director said they worked
two vectors related to the MD (see Simons 1995b, p. 21):
“There is a vector of control – and that is a vector of little added value – where basically we are looking to get them closer to what was defined before, or at the best possible position in terms of economy or return of media. [...] Where we seek to add value to marketing has much more to do with the support we provide with some tools to measure the effectiveness of campaigns and the media used. [...] We usually challenge them to make more effective campaigns with fewer resources. Demonstrate to them, very often, that success is a success of campaigns. Often challenge them, showing the example of other actions taken by different means and with better results [...] But essentially, we, who are the controllers, try to help them to measure the actual performance of the actions they do.”361
The Management Control Director explained that the collaboration of PCG was
justified by its largest base of accounting information and the customisation that was
needed in the analysis of campaigns (see Eccles 1991, p. 5). He said that the
methodologies used required hours of work and some specifications in the calculations
for each particular campaign. The Management Control Director explained:
“In fact this has required some effort, since it is not completely systematised, there is an effort, a bit ad hoc, which, very often, has not been possible for the areas of marketing, which does not have this cost area developed – they are much more oriented to media [communication] and for the most creative part, while the most economic part, of control, rests here at the management control.”362
Explaining the type of calculations that the PCG did to assess the economic
benefit of marketing campaigns, the Management Control Director said:
“We have EBITDA calculated for each [marketing] campaign, i.e., incremental sales, incremental margins, and incremental costs [for each campaign].”363
The Management Control Director said that the management control staff tried to
be proactive in the delivery of knowledge or clues about greater effectiveness and
economy of means (see Simons 1995b, p. 21).364 The Commercial Director commented
361 Interview with the Management Control Director on 24/09/2012 (M09.08) 362 Interview with the Management Control Director on 24/09/2012 (M09.12) 363 Interview with the Management Control Director on 24/09/2012 (M09.13) 364 Interview with the Management Control Director on 24/09/2012
CHAPTER 6
238
that he also received printouts with management control information, on a monthly basis,
from the central management control department. However, when the head office control
information was insufficient, the Commercial Director asked for more from the internal
and dedicated commercial controller (see Section 6.3.3.2.1.6). The Commercial Director
commented:
“We have some regular meetings, monthly meetings, where we review the activity. Moreover, we do have the management control leading the presentation of the numbers. In terms of numbers, yes, [I am satisfied]. If they do not give [the information I need] I look for it at the specific management control of the business.”365
The Controller stated that her department made a continuous effort to keep up with
the demands of managers – e.g., marketing, sales and business operations – for the
accounting information necessary to support management (see Ambler 2003b, p. 253;
Shank 2006, p. 363). On this topic she gave two examples. One was to improve the
system of automatic reporting, giving the possibility to issue reports with more details and
closer to the user’s needs (see Boer, in Robinson 1990, p. 28). The aim was to save time
for managers in the search of accounting information, making it more accessible and
customisable (see Hope and Fraser 2003a, p. 126). The Fashion Controller explained:
“We're always [innovating], I cannot tell you a year in which we have not introduced new things, there isn't one. Always innovating. We have lots of information, we have much detail, things that are already made internally, but manually. We try to take that weight off [commercial] teams to give them time to do other work. [...] If they have information directly available in the information systems, it makes life easier for everyone. So that the question of efficiency, of improvements, is constant.”366
Another effort to adapt to the dynamics of the business (see Simons 1995b, p. 4)
and the needs of users of information was the monthly report, discussed at meetings of
activity analysis (see Ambler 2003b, p. 113). For this, the Controller also stated that
improvements were continuous and that the reports had changed considerably in four
years (see Eccles 1991, p. 8; Hope and Fraser 2003a, p. 70). She referred to this issue in
these terms:
“From 2008 to 2012 ... [2008] has nothing to do with what I do today. In five years, or four years, so much has changed ...”367
365 Interview with the Commercial Director on 12/01/2012 (M04.40) 366 Interview with the Fashion Controller on 21/09/2012 (M08.18) 367 Interview with the Fashion Controller on 21/09/2012 (M08.21)
SECOND CASE STUDY: MODALFA
239
The following section describes the configuration of Modalfa’s MD, the marketing
metrics used, the marketing performance measurement process and the Modalfa MD
situation.
6.3.4 Modalfa Marketing Department
This section describes how the Modalfa MD was organised, how it was controlled, and
how it influenced the business management. The first section describes the MD’s human
resources and how planning and budgeting was done. The second section focuses on the
evaluation tools and metrics demanded by the MD to control and assess the return of its
activities. The last section identifies practices and perceptions regarding the power of MD
and its influence on business management. This interpretative case study seeks to
complement the existing quantitative studies on the same topic in order to contribute to a
better understanding and explanation of this phenomenon.
6.3.4.1 Marketing Department Planning and Budgeting
The MD is located at the head office of Sonae SR, in Maia (Oporto). It is directed by the
Marketing Director who coordinated a team of seven people. Aiming at keeping a small
structure, the department was much supported by external agencies, i.e., communication
agencies, digital agencies, and enterprise resource planning agencies.368
The department had two polyvalent brand managers. Their tasks were not only
publicity or communication, but also public relations, brand activation, and digital media.
Each brand manager was responsible for everything that was related to her brand. One of
the brand managers was also dedicated to the communication inside the shops, e.g., store
fronts and mannequins. The other brand manager was responsible for the brand activation
process and the relations with external entities, e.g., specialised press, fashion magazines,
general press, public relations, and sponsorships.
The Commercial Director commented that the MD had autonomy for managing
the brand positioning and influencing public opinion through media. The commercial
department decided about product, price and promotions, the MD had the responsibility
of communicating to consumers.
368 Interview with the Marketing Director on 13/12/2011 (M02.08)
CHAPTER 6
240
The Commercial Director described and distinguished the responsibilities of
marketing and commercial departments as follows:
“Doing or not doing a billboard [campaign] is a decision of marketing. We [commercial department] do the rest, e.g., a campaign of 50% [discount voucher] on menswear is decided and measured by me, and communicated by marketing. Price promotions are my responsibility, communication and brand activation is marketing responsibility. Price and product highlights [decisions are managed] by my team.”369
The MD had power and autonomy for designing the marketing plan and setting
the marketing budget. The budget was prepared at the MD in connection with the PCG.
In order to set the level of marketing expenditures, the Marketing Director said that he
assumed that the board of directors might have a reference value, i.e., a percentage of
sales for marketing budget. However, he tried to justify the budgeted level of
expenditures, using a cost and benefit analysis (see Section 6.3.3.1.9 and Section
6.3.3.1.10). For some marketing projects, the Marketing Director made an effort to
calculate the EBITDA of the marketing campaign.
The budget and the level of execution of marketing activities were controlled
every month at the activity analysis meeting.
6.3.4.2 Marketing Accountability
The Marketing Director considered the marketing cost and benefit analysis crucial for the
management of the department, and to protect the planning, budgeting and execution of
marketing activities in difficult economic times. The Director-General explained why it
was important to calculate the financial returns of the marketing campaigns, and the
efforts that the Marketing Director did to demonstrate the return of MD activities. The
Director-General commented:
“The marketing is a [cost] line, that, when analysed only from the management control perspective, is an easy [cost] line [to cut]. There is not a direct link between company performance and the marketing investment, at least in the short run. […] I used to say to him [the Marketing Director] ‘‘You just need to prove that it [EBITDA from the marketing projects] is zero, zero is not bad!’’ At the end, if the result is null you end up creating a buzz for the brand. For some of those [marketing projects] he is able to prove indeed that the bottom line is positive.”370
369 Interview with the Commercial Director on 12/01/2012 (M04.31) 370 Interview with the Director-General on 23/11/2011 (M01.20)
SECOND CASE STUDY: MODALFA
241
The culture of Sonae was to appraise as precisely as possible all expenses and
investments. The Commercial Director said that he measured his commercial actions
looking at sales performance and compared them with historic values (see Section
6.3.3.1.4). The Marketing Director also had the preoccupation of demonstrating the
impact of his activities on sales and profitability. These calculations supported top
management in making decisions about resource allocation to marketing (see Section
6.3.3.1.11). The Marketing Director expressed:
“The strength [of the marketing department] is not an easily acquired fact. It has to be gained. […] I must clearly convey to them [board directors] that, if they cut the marketing budget, then they will also cut sales, as was proved by several analyses that I tried to do throughout the year [...]371
In times like this, I would say no [i.e., the operational indicators are not sufficient to justify investment in marketing …]372
In these [economic] situations the marketing expenses are under greater pressure to generate returns. Last year, in particular, the marketing department was keen to demonstrate that their activities created value […] We aimed at showing that this can be standardised and also demonstrated to the board directors that the marketing investments – though they can see it as a cost – generate value [...]373
The Marketing Director recognised that the role of the PCG was very important in
reviewing the performance of the MD. He explained that the MD could easily measure
the increase in visitors; however, it was not easy to identify the costs and calculate the
bottom line earnings. Moreover, the Marketing Director said that the measurement
methodology, used by the Modalfa MD, was easily understood by other directors (see
McManus and Guilding 2008, p. 787; Simons 1995b, p. 108). The Marketing Director
commented:
“Marketing is usually seen, is often seen, as an entity whose value created is seen as a little subjective. It does not mean that people do not like and do not value [marketing], but it is difficult to measure. Only if one accounts the tangible versus the intangible value, i.e., when one goes to an action and sees what its value is, and makes a tangible difference to the value of the company, here we have a measurable value; this is the brand value. Although there are few companies that do this. This [which we do] is very factual, it is very real, these values are understood by our commercial
371 Interview with the Marketing Director on 13/12/2011 (M02.68) 372 Interview with the Marketing Director on 13/12/2011 (M02.45) 373 Interview with the Marketing Director on 13/12/2011 (M02.37)

CHAPTER 6
242
director, understood by our general manager, and understood by our CEO.”374
The Operations Director explained that, whenever there was a campaign, she tried
to deliver to the Marketing Director, in a formal way, a document with the stores' opinion
of that campaign; especially of new campaigns. She also produced a formal report that
was filed and available for future reference. She explained that the Marketing Director
might want to keep it and see later what the result of a specific campaign was, e.g., the
Modelo-Continente customer card association and the qualitative appraisal of operations
about that.375 In this way, the MD received qualitative feedback from their campaigns (see
Ambler 2003b, pp. 26-30). The Operations Director explained that she informed the MD,
about the return of campaigns, because the MD could adapt the campaign and knew what
failed and why (Simons 1995a, p. 81). She justified why it was important to add
qualitative information to the management control numerical reports:
“Often [the explanation of failures] does not appear in the numbers. Sometimes it is only a question of very small things, e.g., recently, we had promoters delivering flyers about that weekend campaign, in the Modelo shopping centre galleries. In many stores this did not produce good results. If I had not told the Marketing Director that the promoters weren't proactive, that it was a fail on the part of the promoters and not of the campaign, we could have questioned the whole campaign, because, in many places, the promoters were not in the right place, they were not enough dynamic, they were not extrovert, they did not talk to the customers, they were not proactive in the campaign communication. This kind of information does not pass through the numbers.”376
Finally, in the next section, the position of the MD at Modalfa is described.
6.3.4.3 Marketing Department Stature and Influence
The MD at Modalfa was considered, by the other executive directors, as extremely
relevant to the business management. An indicator of the power of the MD was its
capacity to attract more financial resources in 2010, which was a year of reduction in both
sales and profitability (see Section 6.3.3.1.9). The MD influenced both strategic and
operational management decisions. The Director-General said that the dynamism of the
MD had been increasing, i.e., the department proposed and managed new and innovative
374 Interview with the Marketing Director on 13/12/2011 (M02.49) 375 Interview with the Operations Director on 18/01/2012 376 Interview with the Operations Director on 18/01/2012 (M05.09)
SECOND CASE STUDY: MODALFA
243
projects. He gave the example of marketing having the responsibility to manage the
expansion projects. There was a person from MD that linked marketing to procurement,
i.e., shop’s location, construction of stores, and shop architecture.
The Director-General commented that the MD had the important role of
guaranteeing that all of the business, together with expansion of stores and business
growth, was made in a coherent way.377 The Director-General explained the MD’s
relevance as a consequence of the Sonae culture; for it was a company that had always
valued the role of marketing (see Johnson 1992, p. 25). Commenting on the MD
influence, the Director-General observed:
“The history of Sonae shows it always gave an important role in marketing and communication, and to the challenging role that marketing must have. It is so [across all business units] due to our culture, although with different nuances in different units.”378
The Director-General also suggested that the ability of the MD to prove the added
value of its activities was another important cause to defend and contribute to the
importance of the MD at Modalfa.
The Marketing Director confirmed that he felt himself respected and influential in
decision making at the board level. He had the perception of being recognised and valued
by the board directors. He explained how the culture of the company very much
influenced the attitude of the board directors towards the MD (see Johnson 1992, p. 25):
“Sonae has a school of marketing. It is a school of marketing. Ever since I joined Sonae, I have reported directly to the Board Directors. This is very important not only at the theoretic level of the organisation chart. This means that the marketing is not submitted to other units, whose KPI are not related to the creation of brand value, e.g., if we were only at an exclusive commercial logic, most probably, we would only do promotions, we would only communicate promotions; for here is a lower sensibility for the importance of creating a valuable brand. We have a notion that we are here today, but we need an ever stronger brand to be here in 10, 15 or 20 years too. This [idea] has been always present. The people who are now at the board of directors, and the CEO have this very much present. They know what the function of the marketing unit is.”379
The Director-General explained that the MD had a challenging role: marketing
coordinated all market research, and interpreted the market trends. He explained that the
377 Interview with the Director-General on 23/11/2011 378 Interview with the Director-General on 23/11/2011 (M01.32) 379 Interview with the Marketing Director on 13/12/2011 (M02.63)
CHAPTER 6
244
MD at Modalfa tried to assure that the brand progress was properly aligned with the
market growth and the business. He said that the marketing was becoming more than a
service supplier, inside the area of fashion, but a challenger, bringing new ideas, and new
forms of working.380 The Director-General also considered the MD as a department that
linked and motivated the other departments (see Kohli and Jaworski 1990, p. 9). He
explained:
“The marketing department has this role of bridging between various units. It is an independent unit. There is always a huge tension between supply chain, sales and operations, e.g., sales, looking at P&L, aim at EBITDA, pushing for stores full of products, this creates tensions at the supply chain, and operations while managing supplies, stocks, etc.; there are several conflicts [between departments] and the marketing department has a conciliation role, being a bridge between the various areas.”381
The Commercial Director said that the collaboration between the MD and the
commercial department was very strong. For example, the commercial department fed the
MD with the promotional plans, throughout the year, and the MD communicated these
promotions through outdoors, billboards, or out-releases via the Internet. The MD also did
the communication and the complete promotional plan for the 50% discount in vouchers,
which was frequent.
The MD was autonomous in brand positioning, catalogues production and fashion
production – though marketing had autonomy, it was based on the products to be
promoted, and which were defined by the Commercial Director. Marketing also informed
the commercial department about the market feedback and the results of commercial
campaigns. The Commercial Director explained:
“The marketing, in the case of Modalfa, has the obligation of pulling the insignia's brand. Allocating in their budget, the better they can, the percentage of sales that they have, and supporting many of our strategies. There must be a fluid relationship with marketing. We give them [information about] our objectives, the promotional plan, strategy. They give us the communication proposals that they have for each strategy, they give us feedback on how the collections are being seen by some media, press, etc., where our products are appearing, and, information about the results of some campaigns.”382
The Commercial Director was satisfied with the MD’s performance. He
380 Interview with the Sonae Fashion Division Director-General on 23/11/2011 (M01.30) 381 Interview with the Director-General on 23/11/2011 (M01.45) 382 Interview with the Commercial Director on 12/01/2012 (M04.38)
SECOND CASE STUDY: MODALFA
245
considered that the MD was involved in strategic decisions and gave opinions about them.
According to the Commercial Director, the MD did not used to have as much influence as
the commercial area, which defined the global strategy, but the MD had importance in
strategy formulation, he said (see Simons 1995b, p. 3).383
The MD also used to give the information about the concept of the campaigns to
the operations department. Afterwards, the Operations Director decided how to manage
the implementation within stores. Using the information from the Marketing Director, she
managed, at operational level, the resources and the stores as well as the interaction with
the commercial department, which had the visual merchandising.384 In this regard, the
Operations Director explained how she followed the MD instructions:
“The Marketing Director gives me the concept, e.g., says: ‘‘within some time, we will mount a week-end campaign which will use these pieces of communication and the objective is that the customers do this and that.’’ Using the information from the Marketing Director, I manage, at operational level, the resources and the store dynamics.”385
To have an advertisement page each month in the Vogue, in the Máxima or in the
Happy magazine was a decision of the MD, the Operations Director said. It was a result
of a thought out strategy of brand projection designed by the MD. In this respect, the
Operations Director commented:
“When marketing does the Modalfa fashion dream, while choosing the models, and all glamour related to the action, he does not care to speak to the commercial or operations [staff], for what he wants is to project the brand […] [marketing] is more institutional, more independent.”386
The MD also participated in decision making related to sales and operations, the
Operations Director gave an example of the MD involvement in decision making:
“Yesterday, the Commercial Director was concerned about a week-end [customer] flow deviation and asked me and the Marketing Director about our ideas and what we would like to do. Everyone is involved in decision making; both for the running issues and the structural ones. At the strategic monthly meeting with the board director, all of us are asked about the current problems and solutions. All of us are involved and have the opportunity [to influence the decision making]. A department isn't set aside, and called only when needed, to create something.”387
383 Interview with the Commercial Director on 12/01/2012 384 Interview with the Operations Director on 18/01/2012 385 Interview with the Operations Director on 18/01/2012 (M05.11) 386 Interview with the Operations Director on 18/01/2012 (M05.13) 387 Interview with the Operations Director on 18/01/2012 (M05.16)

CHAPTER 6
246
Operations and marketing also shared information about complaints and
perceptions from customers. The complaints arrived first at the MD. Most of the
complaints were registered directly through the website. Afterwards, marketing sent it to
the operations department. It could be a complaint about a product or a complaint about
the customer service. Marketing had knowledge of all complaints, however each
department solved their own, e.g., if it was a quality problem, then the quality department
solved it, contacting the customer, aiming at giving more specialised, more technical
information.388
6.4 Conclusion
Modalfa, founded in 1995, is the second largest Portuguese company in the retail fashion
(after Inditex), it increased its sales by 40% between 2006 and 2010 and its shops
increased from 68 in 2006 to 105 in 2010. They still had a market share of 2.9% in 2010
and the second largest ROE (66.5%) of the top 10 fashion retailers (cf. Section 4.3). In
2010 the turnover was €103 million which generated €10.3 million in EBITDA.
Modalfa is a business unit of Sonae group. Established in 1959, the Sonae group
had a turnover of €5.9 billion in 2010. Its main activity is in the retail sector. In 2010 was
the market leader in food retail, consumer electronics and sports goods. In 2011, the
objectives of the Sonae group were to increase the business activity in the international
markets, to get good returns on equity and to reduce liabilities in absolute terms. Sonae
followed a strategy that focused on products and processes innovation, competitive
pricing and customer service.
The managers explained the success achieved in Modalfa with the strategy of
locating stores outside major urban areas – where competition was less intense. Another
factor that contributed to its success, according to the managers, was the offer
configuration: family clothing, fashion at very competitive prices. A strategic cost
management also provided competitive advantages in terms of costs (see Shank 1989),
i.e., a scale which enabled negotiation power in the upstream markets, optimisation of
back office processes, and internal and external benchmarking.
In the genesis of the company was a culture of frugal management, constant
attention to sales revenue and permanent protection of brand value which protected the
returns in the long run. This focus on revenue, costs, and constant monitoring of the
business situation to identify both risks and opportunities for improvement strengthened
388 Interview with the Operations Director
SECOND CASE STUDY: MODALFA
247
the role of management accounting department. The perspective of the planning and
management control department was that their primary role was to support management,
i.e., producing information that managers demand. Although they were responsible for
planning, budgeting and variance analysis, they were also very focused on designing the
accounting system to match the actual needs of the various managers. It was a flexible
department conscious of its relevance for the control and support of management. They
designed the reports tailored to the needs of users and involved the managers in both the
information validation and discussion.
On the demand side, the Modalfa managers sought accounting information
primarily with two distinct objectives and, consequently, in two distinct albeit
complementary ways. First, they sought out information to monitor the day-to-day
business, especially sales revenues, as well as costs and contribution margins per store
(not contribution margins by products). They did in detail and in real time up to the
product level, i.e., comparing the dynamics of sales across products, business units, shops
and regions. To achieve this goal, the access to accounting information was always
available, independent, self-serviced and supported by pre-designed reports – though
flexible and adjustable to the managers’ requirements. This was result of a direct link
between managers and the IT systems. This direct and personal access to accounting
information provided autonomy and speed in decision-making which was highly valued
by Modalfa managers. On the other hand, managers also wanted to be regularly informed
of the business progress, from a cross functional perspective, and of its competitors’ costs
and revenues. They desired this information to identify changes in the business context
(market, customers and competitors) that could have resulted in threats or opportunities
for the business as a whole or for their departments in particular. For this second objective
access to information was led by the management control department which intervened
actively and systematically. The managers met face-to-face every month and discussed in
a comprehensive and detailed manner – for a day or two – a monthly report prepared by
the management control department. In addition to information related to the budget and
deviations, the returns were also analysed as well as the situation of competitors. The
information obtained through this process far exceeded the content of the report because
(1) managers valued the report interpretations, analyses and discussions that were
generated; and (2) the managers offered qualitative explanations of historical results
based on the personal experience of each manager and their contact with the business
reality. Moreover, they valued the collective identification of problems, proposed
solutions, opportunities for improvement and plans for concerted action that resulted from
CHAPTER 6
248
these interactions. The report format was flexible and its content met what managers
wanted and considered as relevant as the business evolved. This interaction was also an
opportunity for the management control department to communicate and teach managers
to use information from the accounting system. It was likewise an opportunity for the
department of management control to understand the managers’ information demand and
correspond accordingly.
The MD called for specific support from the accounting and management control
department. Although the Marketing Director noted that Sonae valued the role of the MD
and Modalfa allocated a certain amount to the marketing budget as a percentage of sales,
he also stated that he wanted to show the board directors the contribution of marketing
projects to EBITDA. The Marketing Director noted that in difficult economic times
marketing expenses could be cut. It was in these contexts that he sought the support of
accounting and management control department to calculate the impact of marketing
projects on cash flow, i.e., to identify the outlays for each marketing project and the
impact of each project in sales revenues and contribution margins. They were very
practical experiments, with control variables, to demonstrate the gains from maintaining
the marketing budget levels, even in difficult times. The Marketing Director stated that
these exercises were only possible because the department of accounting and management
control participated with detailed cost information. The relevance of the MD in Modalfa
was not a consequence of demonstrating their positive contribution to EBITDA; it
resulted from the company culture which in itself appreciated the function of marketing.
However, these “financial exercises” aimed at demonstrating the contribution of the
marketing projects to EBITDA, contributed positively to avoid a possible reduction of
both the marketing budget and the technical and human resources allocated to the MD,
especially in economically difficult times (see Kotler et al. 2006, p. 71; Simons 1995a, p.
84; Srinivasan et al. 2005, p. 114; Webster Jr et al. 2005, p. 37).
In conclusion, the Modalfa accounting system proposed and provided relevant
accounting information for managers, as it is suggested in the accounting literature
(Anthony and Govindarajan 2003; Hope and Fraser 2003a; Shank and Govindarajan
1993); the managers also sought accounting information, including marketing and sales
managers (see McGovern et al. 2004; O'Sullivan and Abela 2007; Verhoef et al. 2011).
However, in this case, contrary to what is suggested in the literature (e.g., De Ruyter and
Wetzels 2000; Phillips and Halliday 2008; Schultz 2003; Srivastava et al. 1998), there
was an intense interaction and communication between accounting and business
managers. There were two factors that influenced the ability of Modalfa’s accounting
SECOND CASE STUDY: MODALFA
249
system to meet managers’ demand of accounting information (see De Ruyter and Wetzels
2000; Foster and Gupta 1994; McManus and Guilding 2008). The first was the real time
individual access to accounting information using customised and flexible reports. This
became possible due to: (1) the integration of financial and non-financial databases; (2)
the automation of accounting entries that provided updated information; (3) information
validated by different managers which increased the reliability of information; and (4)
reports pre-designed according to the managers’ demand. The second was the face-to-face
interactions between management control staff and managers. This face-to-face
interaction enabled managers to analyse accounting information in teamwork
complemented with qualitative information from the personal experience of each one and
their contact with the reality (see Hope and Fraser 2003a). It also served to ensure that
managers learn to use the accounting information and allowed the management control
department to understand the characteristics of managers’ demands and needs of
accounting information (see McManus and Guilding 2008, p. 785; Ratnatunga et al. 1990,
p. 41). In addition to providing a thorough explanation of the business and the numbers
offered in the management accounting reports, it also contributed to identifying problems
and finding solutions. The face-to-face meetings at Modalfa were therefore moments of
strategic thinking with practical implications. It allowed Modalfa to effectively use the
accounting system for strategic cost analysis and interactive control – as suggested in
management accounting theory (e.g., Shank and Govindarajan 1993; Simons 1995b).

CHAPTER 6
250
251
CHAPTER 7 ANALYSIS AND DISCUSSION
7.1 Introduction
This chapter begins by examining each case separately in order to answer the research
questions (sections 7.2 to 7.6). In the second part a comparative analysis is made
contrasting the two cases (sections 7.7 to 7.9). The chapter begins by analysing the factors
that enable or hinder the communication and use of accounting information. Then, the
managers’ demands and uses of accounting information are described and analysed, as
well as how marketing managers desire to measure the performance of marketing.
Afterwards, the support that the accounting department provides to managers is analysed,
as well as how the accounting information is communicated in each organisation. In
Section 7.7 the factors that influenced the ability of the accounting system to meet the
managers’ demand of accounting information in each organisation is compared. As to
how accounting information is demanded and used by different managers, the two
companies are compared in Section 7.8. In Section 7.9 the differences between the MDs
of both organisations in terms of levels of responsibility in marketing management are
analysed. Also examined is the extent to which the degree of responsibility of the MD, in
the management of the various components of the operational and strategic marketing, is
conditioned by the ability of the department to show its contribution to the financial
results of the business.
Summarising, the following topics are examined: (1) factors that influence the
ability of the accounting system to meet the managers’ demand of accounting
information; (2) information demanded by managers and how they use it; (3) how
accounting information is communicated; and finally (4) the impact accounting
information has on the management of marketing – both operational and strategic (see
Tomkins and Carr 1996, p. 165).
7.2 Factors Influencing the Use of Accounting Information
By analysing the factors influencing the use of accounting information in the management
of marketing, structural and functional causes can be distinguished (see Foster and Gupta
1994; Shank 1989). In this research the structural factors are considered the ones that
refer to the management style and the characteristics of human and technical resources.
The functional (behavioural) ones are those that relate to the way of doing things, i.e., the

CHAPTER 7
252
way accounting information is collected, organised, communicated and used.
Distinguishing between structural and functional factors contributes to systematise the
analysis and to produce a parsimonious conceptual model. It contributes to design action
plans for both short and long run with the aim of fostering the use of the accounting
system in practice. In the short run one can focus on the functional factors and in the long
run one can act on the structural ones. These factors are analysed in the following
sections.
7.2.1 The Dimoda Case
In Dimoda, there are structural causes that limit the use of accounting information in the
management of marketing. A key aspect, according to the people interviewed, is the
mindset of managers and top-management. They set a functional structure composed of
delimited departments, like silos, leading to a lack of communication and poor cross-
functional interaction (see Ambler 2003b, p. 202; Hope and Fraser 2003a, pp. 34, 110).
Another aspect that limited the use of accounting information was the separation of the
marketing and sales software databases from the financial accounting computer system.
The situation caused delays of two months in management control reporting, and required
much interdependence of departments to move data from one system to another. The time
managers spent managing the data was not used to analyse the information. The
inadequacy of computer systems was known by various managers – accounting,
management control, information technology and marketing. However, two factors
prevented the change: first, financial limitations and cost containment mindset hindered
the investment in new hardware and software; second, the top management understood
that the gains from changing the computer system for management control did not cover
the corresponding expenses.
From the functional point of view, there were three aspects in communication that
limited the use of accounting information by managers of marketing and sales in Dimoda.
The first was the lack of automatic, regular and face-to-face communication between
managers – marketing, sales and management control (see Simons 1995b, p. 97). The lack
of interaction limited the availability of qualitative explanations of numerical data and
reduced the quality of management reports (Ambler 2003b, p. 26; Simons 1995b, p. 71).
The second was the orientation of the management control reports to top managers only
(see Anthony and Govindarajan 2003, pp. 416-417). Although this allowed an overall
analysis of the performed activity and strategic thinking, it did not allow identifying

ANALYSIS AND DISCUSSION
253
operational problems in the area of marketing and sales, therefore limiting the
effectiveness of the management at the business unit level. Finally, the lack of managers’
direct access to accounting information – they did not have an integrated and updated
computer system – delayed access to information and limited the usefulness of accounting
information for daily decisions (see Hope and Fraser 2003a, p. 155).
Still, at the functional level, the orientation and focus of financial accounting in
reporting for entities outside Dimoda, also led the accounting department to be very
focused on technical accounting procedures, e.g., inventory control, imparities, deferrals
and accruals (see De Ruyter and Wetzels 2000, p. 210); therefore, belittling the
accounting department’s role as organiser and facilitator of adequate accounting
information, suited for the needs of marketing and sales managers (see Anthony et al.
2010, p. 456).
It is worth noting that, in Dimoda, the existence of one cultural feature that limited
the use of accounting information was reported: managers used to pay attention to sales
and to create very good product collections and there was no concern to closely monitor
the profitability of the business.
7.2.2 The Modalfa Case
In Modalfa there are structural and functional aspects that facilitate communication and
use of accounting information. From a structural standpoint, the mindset of managers
contributed strongly to the communication and use of accounting information. In
Modalfa, there was a constant concern for daily track of sales – comparing it to previous
periods – and careful cost management (see Kaplan, in Robinson 1990, p. 3). The
information system was also structured to facilitate communication and use of accounting
information. Firstly, all information was linked to a database that was common to
financial accounting, management control, marketing and sales. Secondly, information
was collected and stored with much detail. This allowed two different forms of
communication and analysis with two distinct purposes. The much detailed information
enabled user customised reports and self-service accessed (see Hope and Fraser 2003a, p.
65). Each single manager accessed the computer system directly in order to obtain the
much updated information to act in real time and immediately in the course of the
business (see Johnson and Kaplan 1987, p. 14). There was also aggregated information
generated by the management control department. The information was reported monthly,
both written and by viva voce, discussed, explained and analysed by multi-functional and

CHAPTER 7
254
multi-hierarchical teams (see Hope and Fraser 2003a, p. 33; Simons 1995b, p. 108, 2000,
pp. 217-218). The aim was to analyse the performance, to identify errors and
opportunities for improvement, and to devise strategies and tactics for immediate action,
in a coordinated and aligned manner (see Ahrens and Chapman 2007; Ambler 2003b;
Simons 1995b, p. 123).
Modalfa also had some characteristics that contributed to the communication and
intensive use of accounting information from the functional point of view. The first
feature was frequent and systematic oral communication between managers (Hall 2010).
It occurred prior to the yearly budget, across all functional managers, during a meeting to
discuss the activities to be undertaken and the required resources; it was followed by the
annual meeting, for the presentation of budgets (see Horngren 2004, p. 210). A meeting
of product analysis was held quarterly. Every month a session of activity analysis took
place, led by the management control department that lasted a day or two. All functional
directors participated actively providing quantitative and qualitative information that
complemented the information prepared by the management control department (see
Ambler 2003b, pp. 8, 26). Every two weeks a meeting was held for marketing and sales
analysis (see Kaplan, in Robinson 1990, p. 3).
The second feature was the focus of financial accounting department to collect,
organise and process accounting information in order to be useful in the business
management (see Boer, in Robinson 1990, p. 28). For this purpose, one or more
representatives of the administrative and financial department were present at business
meetings, both during the lifecycle of the business unit and at the initial phase of start-
ups. They acted so with the aim of designing an accounting system tailored to the unique
needs of each business unit, allowing the production of useful information for
management and decision making (see Johnson and Kaplan 1987, pp. 14-15, 17).
The third feature was the availability and interest of the management control
department to realise and understand the needs of managers in terms of accounting
information; therefore producing reports tailored to each functional manager, adapted to
the evolution of the business and incorporating information from competitors (see Ambler
2003b; Bromwich 1990; Hope and Fraser 2003a; Simon et al. 1954).
In short, management control, in addition to planning for the future and
controlling the past, also supported managers in the diagnosis and decision making
process, shaping up and trying to understand the unique characteristics and needs of each
functional manager (see Preston 1986).

ANALYSIS AND DISCUSSION
255
7.3 Managers’ Demand of Accounting Information
7.3.1 The Dimoda Case
Dimoda marketing and sales managers use accounting information primarily for
management control. From the budgetary point of view, they look in particular at the
control of sales – at the level of the business unit – and at the control of costs, both in
terms of the business unit and the MD. The MD itself does two separate analyses: from
the commercial point of view, it analyses sales (though in a simpler form), from the
functional point of view, it analyses the budget of costs and deviations.
Some problems, related to the use of accounting information, were observed and
need to be considered in the analysis, i.e., how the information was being used did not
match what was desired by the managers of marketing and sales at Dimoda.
First, from a focus on sales – looking to increase sales – they turned to a policy of
cost reduction. There is not a focus on the profitability management, i.e., maximising
revenues and minimising costs in coordination (see Section 5.3.3.1.3). The apparent lack
of interest of senior management in analysing profitability in detail (sales less cost of
sales) – as has been reported by a member of the board – contrasted with the interest of
the Business Unit Director in profitability analysis (see Goebel et al. 1998, p. 498).
Moreover, the management accounting system and the management control were not
designed to meet the Business Unit Director’s demands for profitability analysis (see
Johnson and Kaplan 1987, pp. 14-15).
Second, the management control of the MD was done through the budget
compliance (see Hope and Fraser 2003a, p. xviii). There was not an analysis of costs and
benefits in terms of financial returns from marketing campaigns. It was a difficulty felt
and expressed by the Dimoda marketing managers. They had no means to do so, although
both the Marketing Manager and the Business Unit Director wanted it (see sec. 5.3.3.1.4).
Third, the Marketing Manager was not focused on simultaneously analysing costs
and revenues, but in promoting the brand (limited by a certain budget). For her, the
mission of the MD was to protect the brand, not necessarily to manage the costs and
profitability.
7.3.2 The Modalfa Case
The performance of Modalfa between 2006 and 2009 in terms of sales growth, EBITDA
and profit was equal or superior both to the other companies in the fashion sector and to
CHAPTER 7
256
the other companies of the Sonae group. The Modalfa managers explained their success
by assigning it to five main factors. Two of which were related to the support from
accounting and control department and to the use of accounting information. The reasons
reported were:
• Locations outside the major urban centres;
• Dimension that gave them bargaining power in regions of Asia;
• Skills at back-office level in the renovation of stores and innovation of processes
(see Johnson 1992, p. 9);
• Very much detailed accounting information (see Hope and Fraser 2003a, p. 65). It
allowed the analysis of sales by store and the identification of business
opportunities (see Simons 1995a, p. 86); and,
• A department of management control that sought to inform managers on the
performance of Modalfa’s competitors, making comparisons and establishing
benchmarks and incentives for continuous improvement (see Section 6.3.1)
(Ambler 2003b, p. 30; Bromwich 1990; Eccles 1991, pp. 4-5; Hope and Fraser
2003a, pp. 55, 123; Simons 1995b, p. 94).
The ultimate objective of Modalfa managers was EBITDA (see Ambler 2003b, p.
100). However, managers defined other objectives that, in their view, led to the latter (see
Anthony and Govindarajan 2003, p. 416). One of the main objectives of the MD was to
attract customers to the stores. The main objective of both the operations and the
commercial department was turning visitors into buyers (see Kaplan, in Robinson 1990,
p. 3). The MD had still two additional objectives: to create a brand image in the mind of
consumers with long-term returns, and to design tactical operations (promotions,
campaigns and discounts) with immediate effect on sales and profits.
The department of management control organised monthly review meetings of
activity that contributed to a review of the performance of the various departments and a
measurement of the impact of operational and commercial decisions on both EBITDA
and the company's profit (see Ambler 2003b, p. 8). This interaction also contributed to an
alignment of the various functional managers relating to brand positioning, competition
and trade tactics.
Modalfa managers used accounting information intensively. In addition to using
accounting information to control the extent to which the business managers met the
established budgets, accounting information was used to diagnose problems in the
ANALYSIS AND DISCUSSION
257
marketing of products and establish internal standards for the management of products
and stores (see Hope and Fraser 2003a, p. 61).
A peculiar feature of Modalfa’s management accounting system was the use of
accounting information oriented to action (see Simons 1995b, p. 123). Its aim was to
identify – using accounting information prepared by the management control department
– problems and opportunities in marketing and sales management and act accordingly and
immediately (see Simons 1995b, p. 5). Internally, they compared the financial
information – sales and margins – of each of the stores, brands and product lines (see
Hope and Fraser 2003a, p. 61). The aim was to motivate competition between stores, to
identify the best practices and replicate them in the other units (see Ambler 2003b, p. 201;
Hope and Fraser 2003a, p. 134). Externally, Modalfa’s accounting information was
compared with their competitors’ accounting information in order to set benchmarks for
Modalfa managers – inspired by their competitors’ performances (Ambler 2003b, p. 30;
Bromwich 1990; Eccles 1991, pp. 4-5; Hope and Fraser 2003a, pp. 55, 123; Simons 2000,
p. 315).
The Modalfa managers’ purpose was to act in operational terms – managing the
stores in order to improve the overall profitability of each store – more than to manage
and maximise contribution margins by product or customer, e.g., they did not manage the
contribution margin by product mix or portfolio of customers (see Shank, in Robinson
1990, p. 16; Shank and Govindarajan 1988b). In Modalfa there was not the concern of
allocating indirect costs (see Johnson 1992, pp. 153-154). The marketing and sales
management was in terms of the contribution margin by product line for the overall cost
structure (fixed costs) of each store (see Shank, in Robinson 1990, p. 16).
7.4 Marketing Managers’ Demand for Marketing Metrics
7.4.1 The Dimoda Case
In Dimoda, the MD was managed as a cost centre. The Business Unit Director set an
amount for marketing expenditures that was, afterwards, submitted for administration
approval. It was with this value that the Marketing Manager planned the brand
communication activities. Both managers wanted more information on the return of
marketing activities. It would help them to better manage the mix of media and the
overall marketing budget. The most commonly used measure was the comparison of sales
between periods with and without specific marketing campaigns. These comparisons were
CHAPTER 7
258
made with difficulty and had no support from the management control department. The
indicator of marketing performance that the Business Unit Director referred to as the most
important one for her was the impact of the marketing campaigns on the business unit’s
profit margin, i.e., she wanted to know what the impact of each marketing investment was
in both sales and net profit margin (differential analysis). She also said that she would
have performed more marketing campaigns if she had had the information about
marketing returns, accurately produced by the MD with the support of management
control staff (see Ambler 2003b, p. 253).
The Dimoda case reveals two aspects related to the marketing performance
measurement. The first is that it is not enough to have a set – even if it is a comprehensive
one – of operational indicators of marketing to satisfy the CEOs and protect the resources
of the MD (see Lehmann 2004; Seggie et al. 2007). In the Dimoda case, the marketing
managers had software that provided much information about the impact of campaigns in
various marketing and sales operational indicators. Even so, they failed both to see the
Business Unit Director satisfied with marketing and the department’s technical and
human resources maintained. Second, the indicator that really counted for deciding about
the budget for marketing activities was the impact of marketing campaigns on operating
cash flow, i.e., the impact of marketing investments (expenditures) on sales and gross
margins (see Seggie et al. 2007; Srivastava et al. 1998).
In Dimoda, the absence of an assessment of marketing performance, with financial
metrics, led to a significant reduction in resources used in the MD (e.g., budgets not spent
in full) and a reduction of the influence of the Marketing Manager on marketing
management decisions – both strategic and operational (see Lehmann 2004; Seggie et al.
2007; Verhoef and Leeflang 2009). The situation resulted from the Business Unit
Director’s little recognition towards the value added by marketing, the Dimoda Marketing
Manager said (see Ambler 2003b, p. 62).
7.4.2 The Modalfa Case
In Modalfa, the Marketing Director made two types of MD performance measurements.
First, he analysed deviations from the budget. Second, he measured the impact of
marketing activities on EBITDA (see Ambler 2003b, p. 100). He used this second
measurement to justify the MD budget and, therefore, protect the resources of the MD.
Although the Modalfa Marketing Director stated that the marketing budget was based on
a certain percentage of sales, he said that without a clear justification, demonstrating the
ANALYSIS AND DISCUSSION
259
value added by marketing, the marketing budget could be reduced, particularly during
periods of cost contention (see Kotler et al. 2006, p. 71; Simons 1995a, p. 84; Srinivasan
et al. 2005, p. 114; Webster Jr et al. 2005, p. 37).
The analysis of these two cases, calls attention to two aspects that are not
explicitly addressed in the current literature on marketing performance measurement. The
extant literature often refers to customer lifetime value, customer profitability analysis or
brand equity as the most appropriate financial metrics to measure marketing performance
(see Barwise and Farley 2004; Gao 2010; Srivastava et al. 1998). These two cases show a
different situation. The unit of analysis is not the client, nor the brand, but the marketing
project (activity) instead. The concern of each marketing director, in both cases, was to
measure the return and the investment associated with each single marketing project
(campaign) (see Ambler 2003b, p. 11). Secondly, the financial metrics reported in the
literature are usually based on the concept of discounted cash flows. In these two cases,
the marketing managers prefer a metric equivalent to EBITDA of each marketing
campaign (project), i.e., income and spending differentials associated with each
marketing project (see Ambler 2003b, pp. 5-6 ). They made efforts and tried to calculate
the EBITDA value, supported by the management control department.
7.5 The Contribution of Management Accounting Departments
The contribution of the department of management accounting was crucial to enable the
Modalfa’s MD to perform calculations of the added value of their activities. The
Marketing Director explained that he had no expertise in integrating the cost information
in the analysis of marketing performance. As the Marketing Director wanted to know the
profitability of his projects, i.e., the EBITDA, he needed the cost information. The role of
the management accounting department as a collaborative department was fostered by
Sonae’s culture (see Nixon and Burns 2012, p. 226). The management accounting was
seen as an element of information and support to decision making; not as an agent of
“policing”, the Director-General suggested (see Hope and Fraser 2003a, p. 107). The
Modalfa Controller explained that she managed the management accounting department
so that it was involved with management decisions, and had a comprehensive
understanding of the business (see Boer, in Robinson 1990, p. 28; Shank 2006, p. 356)
(see Section 6.3.3.2.2.8). The Modalfa Marketing Director reported that he was satisfied
with the management accounting support. He said that the management accounting
collaborated regularly to obtain accounting information, which supported his managerial
CHAPTER 7
260
work (see Ambler 2003b, p. 253; Shank 2006, p. 363). The Marketing Director also said
that the MD was in permanent contact with the management accounting; their interaction
was even more intense in the moments of economic uncertainty and difficulty (see
Simons 1995b, pp. 94-96), he said (see Section 6.3.3.1.9). Both Modalfa Marketing
Director and Controller classified the communication between both departments as
“perfect”. The positive motivation of both departments, to collaborate in the calculations
of financial returns of marketing activities, permitted the MD, in Modalfa, to obtain proof
of the value added by the MD (Ambler 2003b, p. 8). According to the Modalfa Marketing
Director, the demonstration of marketing added value was very important in nurturing the
empowerment of the MD (see Verhoef and Leeflang 2009).
Conversely, Dimoda had weak relationships between the marketing and
management accounting departments (see Section 5.3.3.2.1.2) (De Ruyter and Wetzels
2000). The marketing-accounting interaction focused on the budgeting process and cost
control. In Dimoda, the MD was shaped as a cost centre; therefore, it was managed and
controlled focusing on costs. Even though the Controller from Dimoda was aware of the
importance of interacting with marketing, she did not interact. The Controller said that the
lack of interaction was a consequence of the organisation’s culture, i.e., departmental self-
sufficiency and isolation (see Hope and Fraser 2003a, p. 110). It was also because there
was no top management rules for automatic and systematic inter-departmental reporting
(see Section 5.3.3.1).
In Modalfa, the Marketing Director was involved with other departments, i.e.,
commercial, operations and accounting. He explained that he was concerned about the
interaction with other functional areas within the company, because, through interaction
with the other departments, the MD could be better understood, while promoting the spirit
of unity in management. In this respect, the Modalfa Director-General commented that
the MD fulfils the role of linking and conciliating the various functional departments (see
Kohli and Jaworski 1990, p. 9).
Sonae’s market oriented culture (cf. Section 6.3.4.3 and Appendix 2) and regular
and systematic inter-departmental communication, enabled the exchange of updated
market information (see Simons 1995b, p. 3). For example, the information about the
competitors’ cost structure was collected, analysed and presented by the Modalfa
Controller to the first-line directors − e.g., operations and marketing − establishing
benchmarks for management (see Ambler 2003b, p. 30; Bromwich 1990; Eccles 1991,
pp. 4-5; Hope and Fraser 2003a). The Dimoda managers did not obtain financial
ANALYSIS AND DISCUSSION
261
information about their competitors, for they did not interact with the control department
beyond cost management control.
Modalfa included the software investments in the business unit’s budget, while
Dimoda included all IT investments at the head office’s budget. The inclusion of a
heading of IT investments in the budget of the business unit, and the existence of an IT
expert at the business unit, allowed Modalfa to develop business-specific software
applications that made accounting information more tailored to the operational and
commercial decisions, the Commercial Director said (see Hope and Fraser 2003a, p. 135).
The adequacy of the IT to produce real-time monitoring about the market response to
marketing and sales tactics, was important for the Modalfa marketing management (see
Eccles 1991, p. 4). Dimoda persisted with the malfunctioning software and incompatible
databases. Therefore, Dimoda’s directors allocated more time to collecting and processing
management accounting information than to analysing it, as was reported by the Dimoda
IT Director (see Section 5.3.3.2.1.2) (see Hope and Fraser 2003a, p. 6).
7.6 Communication of Accounting Information
These two cases present two different ways of collecting and communicating accounting
information. In the following two sections, how each of the companies communicated
accounting information is analysed.
7.6.1 The Dimoda Case
In Dimoda, the responsibility to collect, record, process, interpret, analyse and transmit
accounting information is in the finance department. The responsibility lies with two
people: the Controller and the Financial Accountant. These two people had different
objectives. The Controller sought to gather and compare the actual values of income and
expenses with the budgeted figures. She produced a monthly report with the analysis of
deviations and sent it to the Director-General, who, afterwards, discussed it at the meeting
of the group’s board of directors at the head-office (see Hope and Fraser 2003a, p. xviii).
There is a management control organised by responsibility centres (revenues, costs and
results), therefore, the control is performed by comparing the actual figures with the
budget. The communication of accounting information is aggregated and in written form,
addressed to the group’s board directors located in the head-office. There was not a
regular and systematic communication between marketing managers and the accounting
CHAPTER 7
262
department staff. Therefore, the analysis of sales and prices was exclusively done through
the computer system – which had been out of order.
It was verified that, in Dimoda, how managers collected and communicated
accounting information was not adjusted to the needs of managers and to the company
strategy. First, the lack of regular accounting information and reporting to the business
unit directors contrasted with the firm’s objectives to delegate responsibilities and make
it like a sole business of the directors themselves (see sec. 5.2.2.). For example, the
Dimoda Business Unit Director felt there was a lack of frequent and systematic
accounting information – prepared and communicated by the accounting and management
control department – to obtain explanations for the figures and to identify deviations in
costs (see Simons 1995b, p. 71).
Second, the lack of accounting information shared regularly with the business unit
directors also contrasted with the main Director-General objective, which was EBITDA,
sales and cost control (see sec. 5.2.3). Dimoda’s focus, between 2006 and 2009, was on
profitability and cost control. However, it was found that the accounting department had
not supported this strategy: there was missing automatic, detailed, and interpreted
accounting information provided on a regular basis (see sec. 5.3.1) (see Hope and Fraser
2003a, p. xvii). The monitoring of sales was also considered a business vital aspect (see
sec. 5.3.2) and the management accounting system did not support it (see Ambler 2003b,
p. 253).
Third, the lack of accounting information did not fit the highly competitive
business context which focused on low prices and frequent promotions. The Dimoda
strategy was to open and to close stores according to the profitability of each store unit;
this strategy was also not supported by the way the accounting information was
communicated (see Hope and Fraser 2003a, p. xvii). Both the lack of frequent and
systematic communication between marketing and financial managers, and the lack of
linked computer systems and databases limited the profitability analysis, which resulted
in focusing only on sales.
Fourth, the Dimoda management control was backward oriented (strict budgetary
control) and reported to the top management only (see Anthony and Govindarajan 2003,
pp. 416-417; Hope and Fraser 2003a, p. xviii). However, the Business Unit Director
wanted to receive alerts from the accounting and control departments for managing
forward looking (see Simons 1995b, p. 123). She aimed to correct her actions, contribute
to the achievement of budgets and prevent deviations; therefore she expected support
from the management accounting department (see Ambler 2003b, p. 253).

ANALYSIS AND DISCUSSION
263
Fifth, the accounting information was organised and reported in an aggregated
form. Though it satisfied the general management, it was insufficient for the management
of marketing and sales. The Business Unit Director felt the lack of regular, frequent and
detailed information, presented and discussed verbally by the controller in order to
explain the numbers, identify problems and find solutions and opportunities for
improvement (see Simons 1995b, p. 97).
Sixth, the accounting information was accessed by self-service. However,
technical system failures hindered the analysis and interpretation of data. It was a factor
that caused demotivation on the part of the Marketing Manager (see Anthony and
Govindarajan 2003, p. 566; Horngren 2004, p. 207).
7.6.2 The Modalfa Case
In Modalfa, accounting information was communicated in two different ways, with two
different objectives. Firstly, it was communicated through the daily information system
and by self-service access (see Hope and Fraser 2003a, p. 65). The aim of the managers
was to track daily sales and margins, and compare with other prior periods in order to
monitor activity, diagnose problems and identify opportunities in the development of
sales and business management (see Kaplan, in Robinson 1990, p. 3). In the second form,
which complements the first one, it was the Fashion Controller that communicated
accounting information, producing both a weekly and a monthly report. The monthly
report was delivered both in written format and verbally. During the verbal
communication, all frontline managers participated in the presentation and analysis (see
Hope and Fraser 2003a, pp. 24-26). They actively explained the numbers and shared their
management experiences (see Simons 1995b, p. 97). In this second form of
communication the objective was to analyse the activity of the business as completely as
possible, adding qualitative information and interpretations of the various functional
managers to the financial figures (see Ambler 2003b, p. 26; Simons 1995b, p. 121). In
addition to actions that lead to stimulation of sales and profit, cost reduction opportunities
were also identified (see Johnson and Kaplan 1987, p. 40). Both forms of accounting
information communication were intended to identify improvement opportunities; they
were not only intended for management control or compliance with budgets (see Hope
and Fraser 2003a, p. 33; Simons 1995a, p. 86).
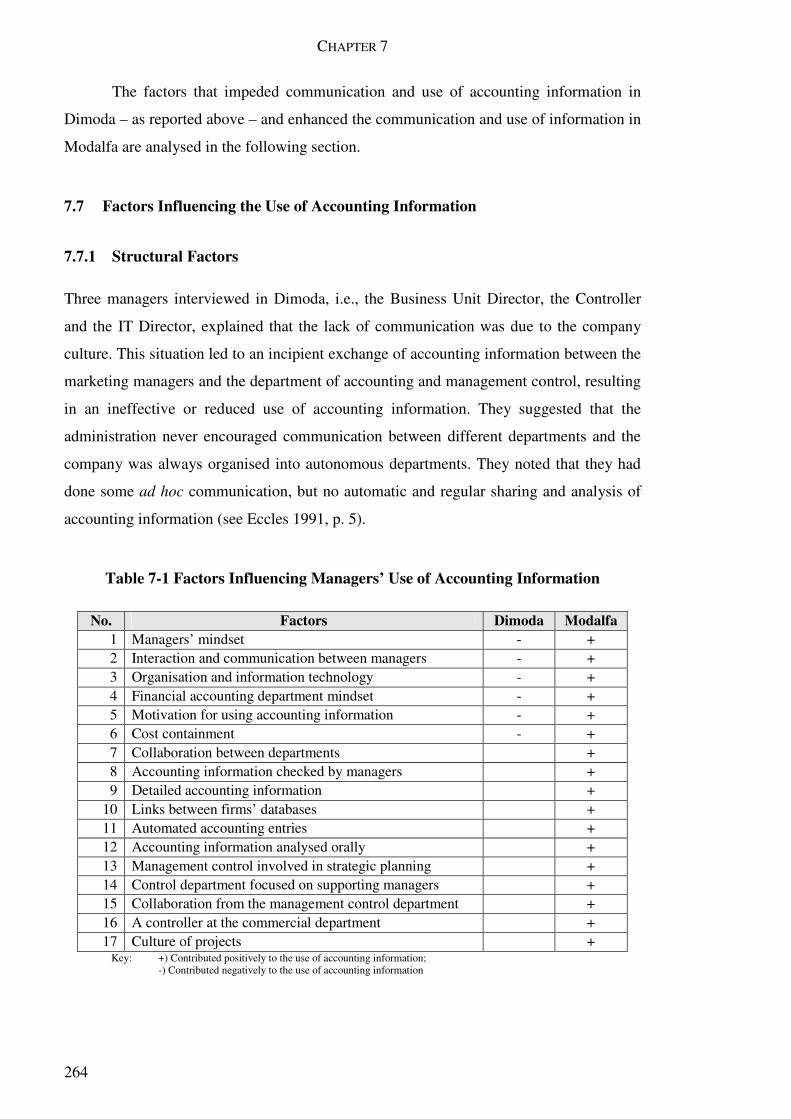
CHAPTER 7
264
The factors that impeded communication and use of accounting information in
Dimoda – as reported above – and enhanced the communication and use of information in
Modalfa are analysed in the following section.
7.7 Factors Influencing the Use of Accounting Information
7.7.1 Structural Factors
Three managers interviewed in Dimoda, i.e., the Business Unit Director, the Controller
and the IT Director, explained that the lack of communication was due to the company
culture. This situation led to an incipient exchange of accounting information between the
marketing managers and the department of accounting and management control, resulting
in an ineffective or reduced use of accounting information. They suggested that the
administration never encouraged communication between different departments and the
company was always organised into autonomous departments. They noted that they had
done some ad hoc communication, but no automatic and regular sharing and analysis of
accounting information (see Eccles 1991, p. 5).
Table 7-1 Factors Influencing Managers’ Use of Accounting Information
No. Factors Dimoda Modalfa 1 Managers’ mindset - + 2 Interaction and communication between managers - + 3 Organisation and information technology - + 4 Financial accounting department mindset - + 5 Motivation for using accounting information - + 6 Cost containment - + 7 Collaboration between departments + 8 Accounting information checked by managers + 9 Detailed accounting information +
10 Links between firms’ databases + 11 Automated accounting entries + 12 Accounting information analysed orally + 13 Management control involved in strategic planning + 14 Control department focused on supporting managers + 15 Collaboration from the management control department + 16 A controller at the commercial department + 17 Culture of projects +
Key: +) Contributed positively to the use of accounting information; -) Contributed negatively to the use of accounting information
ANALYSIS AND DISCUSSION
265
The Operations Director and the Marketing Director from Modalfa reported that
the company's culture, as well as encouraging communication and teamwork – as seen
below – fostered a mindset of careful management of revenues and costs. That is, it gave
conditions for interaction and exchange of accounting information, and it promoted the
economic analysis of business and economic rationale of management decisions
(Lehmann 2004; Srivastava et al. 1998). These two characteristics contributed to
extensive use of accounting information by managers.
Comparing the two cases of Dimoda and Modalfa, both companies were focused
on budget compliance and costs reductions. However, the organisational culture
encouraged Modalfa managers to analyse budgets, identify deviations, detect problems
and build solutions, through interaction and communication between cross-functional
teams (see Simons 1995b, p. 96). Modalfa did it in a coordinated manner, through regular
and systematic interaction between managers, from different functional departments (see
Horngren 2004, p. 210). In Dimoda, each department was focused on itself and tried, with
some effort, to control its own budget. The Dimoda department of management control
was primarily focused on reporting to the boardroom directors (see Hope and Fraser
2003a, p. xviii).
In Dimoda, two structural aspects related to the organisation of accounting
information limited the commercial and marketing directors in the use of accounting
information. One was the software and hardware, while the other, the dependency that
financial accounting had on the sales department as to the cost information related to the
cost of goods acquired and sold. Being the two computer systems, from the commercial
and administrative areas, separated in terms of hardware and software, both departments
were dependent on each other to complete the process of collecting, sorting and reporting
the accounting information. The financial accounting had information of overheads, but
lacked the information on the cost of goods purchased. The commercial department had
the information of sales and direct costs of goods sold, but lacked the information
concerning remaining costs. The management control had none of this information in real
time and waited two months to be informed by the financial accounting (see Johnson and
Kaplan 1987, p. 14). In this context, the Marketing Manager had only cost information,
though with a delay of two months. In order to analyse the sales and profitability
estimates, the Business Unit Director had to make her own accounts. The Controller
waited two months for information and only reported to the boardroom directors and the
Director-General.

CHAPTER 7
266
In Modalfa, the existence of a data warehouse for all accounting and business
related data – commercial, marketing and operations – and the integration of IT systems
allowed accounting entries that were mostly automatic, and also the verification and
approval of documents, and schedule of payments, to be made through the systems
without the need for human interaction. Therefore, the queries that the marketing
managers made to the accounting information were updated in real time and customised
(see Ambler 2003b, p. 84; Johnson and Kaplan 1987, p. 14; Shank 2006, p. 361).
Comparing the two cases, in Dimoda the commercial managers spent their time
communicating accounting information from the perspective of financial accounting – of
a bureaucratic nature – due to the separation of the IT systems, therefore reducing the
time available to discuss the management accounting information. In Modalfa, the
bureaucratic accounting information was approved and passed automatically through
information systems – which were integrated – therefore, the management accounting
information was personally present and discussed at the monthly meetings of activity
analysis, as described in Section 6.3.3.1.
Both organisations had other structural factors that conditioned or encouraged the
use of accounting information (see Table 7-1). In the case of Dimoda, firstly, there was a
problem of low motivation of managers to use accounting information. For example, the
Marketing Manager said that she did not know what the advantage was, of interacting
more with the departments of accounting and management control; nor did she
understand the extent to which information from the accounting department helped her in
her work (see Gleaves et al. 2008; McManus and Guilding 2008). Secondly, the Dimoda
financial difficulties reported by the Director-General, by the Business Unit Director and
by the IT Director, conditioned investments in information systems, which in turn did not
allow the integration of commercial software with accounting software, and prevented
production of commercial reports and its analysis (see Eccles 1991, p. 4).
7.7.2 Functional Factors
The Dimoda Controller, the Marketing Manager and the Business Unit Director said that
if they were to interact and communicate more, in a regular and systematic manner, more
accounting information would be considered in commercial management and in the
planning and management control. The Marketing Manager commented that some
information about the development of specific campaigns was not transmitted to
management control, preventing the Controller from explaining certain deviations in the

ANALYSIS AND DISCUSSION
267
budgetary analysis document that she, the Controller, sent to the Director-General.
Moreover, the Controller stated that if she were to communicate more with the
commercial directors, the business plan and budget could be better adapted to the real
circumstances of the business – which she did not dominate and did not know (see
Anthony and Govindarajan 2003, pp. 420-421; Hope and Fraser 2003a, p. 70).
One factor that led to accounting information being used by the marketing and
commercial managers in Modalfa was their frequent interaction. These interactions
occurred systematically and in two circumstances in particular: the phase that preceded
the construction of the annual budget (the PAR meeting) and in the analysis of the
monthly activity. Both circumstances involved the use of accounting information. The
first, although being more qualitative, also included financial rubrics, e.g., sales and
investments; the latter, supported essentially by financial information (prepared by the
management control department) was complemented with qualitative or quantitative
information prepared by each participant (Ambler 2003b, p. 8). The occurrence of these
meetings in Modalfa, to share financial and non-financial information (see Anthony and
Govindarajan 2003, p. 495; Simons 1995b, p. 64), contributed to Marketing Director
using and analysing the accounting information in intensive and varied forms, as already
described in Section 6.3.3.1 and discussed in Section 7.3.2. (see Hope and Fraser 2003a,
p. 155).
Comparing Dimoda with Modalfa in this respect, it can be asserted that in
Modalfa, systematic and regular communication between the various functional managers
with the aim of, first preparing and discussing the annual budget, and second, analysing
the monthly activity, determined that the accounting information was used; whereas in the
case of Dimoda, the lack of interaction and formal communication between the
management control department and the marketing managers hampered the use of
accounting information in marketing management. In Modalfa these regular face-to-face
interactions contributed to the non-financial managers learning how to both read and
interpret management accounting reports as well as to understanding the usefulness of
management accounting information (see McManus and Guilding 2008, p. 785;
Ratnatunga et al. 1990, p. 41). Also, the face-to-face interactions allowed the department
of management control to be able to comprehend the information needs of managers;
therefore the management control department was able to produce reports that were
useful in practice and adapted to the real circumstances of the business – from the
perspective of managers who were the users of accounting information (see Ratnatunga et
al. 1990, p. 41).
CHAPTER 7
268
In Dimoda, the financial accounting department was especially oriented towards
external reporting (cf. Section 5.3.3.2.2.2). The Dimoda Financial Accountant revealed
that she spent a lot of time answering the questions of the sales department when she
should have been more focused on responding in a timely fashion to the legal
requirements of financial reporting, for entities outside the company, she said (see
Langfield-Smith 2008, p. 209). Moreover, the Director-General considered the control of
inventories a priority – it was a function with an allocated team and exclusive resources
(see Shank 1989, p. 47).
In Modalfa, the Financial Accounting Director sought that he or its directors were
in close liaison with the managers of the business through participation in meetings, PAR
or executive committee meetings. They understood the concern of the administrative
needs of each business and matched these through the organisation of administrative
processes and accounting information in order to provide accounting information for the
commercial and operational management (see Boer, in Robinson 1990, p. 28).
While the department of administrative services and accounting at Dimoda was
more focused on external clients – concerned about the consolidation of accounts and
external financial reporting – the very same department in Modalfa was attentive to the
needs of internal clients, i.e., commercial and operational managers, seeking to organise
the accounting processes and accounting information in order to help managers solve
their internal problems themselves (see Section 6.3.3.2.2.2) (see Hope and Fraser 2003a,
p. 37).
In the following section, the differences between the managers of the two
companies regarding the use of the accounting system are analysed, in particular how
these different managers demanded and used accounting information.
7.8 Managers’ Demand of Accounting Information
7.8.1 Accounting Information for Diagnosis and Control
In Dimoda, the accounting information was used to analyse sales. The software allowed
for analysing sales by articles and by customers – only if the customer had a customer
card. However, the information was stored in the commercial computer system and the
business department numbers were often estimated. Accounting and management control
had no access to the sales information in real time (see Johnson and Kaplan 1987, p. 14).
The formal reports of sales and profits, directed to the administration, were processed

ANALYSIS AND DISCUSSION
269
through a different pathway and sometimes with a time lag, because the accounts were
closed, normally two months after the end of the accounting period. Some problems in the
commercial software had been preventing instant access to detailed sales information
which was considered important as an incentive to the lower management levels in the
organisations (see Anthony and Govindarajan 2003, p. 566).
In Modalfa, the commercial managers demanded the sales information daily
through direct consultations and customised information systems reports (see Hope and
Fraser 2003a, p. 65). The accounting system was oriented to support the intensive use of
accounting information and the management control department produced detailed reports
on the activity, on a monthly basis (see Shank 2006, p. 363). The accounting information
on sales was presented in specific meetings for business activity analysis, led by the
management control department and attended by all heads of business, e.g., marketing,
sales and operations (see Hope and Fraser 2003a, pp. 24-26). The information was
analysed and explained by the managers who were directly related to each activity
reported.
In both companies the marketing managers demanded accounting information to
analyse sales. In Modalfa, it was daily, through integrated information management
systems, while in Dimoda it was with some restrictions due to the software limitations.
The marketing directors from both companies did not report a use of accounting
information on sales as intensively as the commercial directors. However, in Modalfa,
during the monthly meetings led by the management control department, the sales
information was presented, discussed and interpreted in a systematic form. The Modalfa
Marketing Director had an interest in that information. In Dimoda, the Marketing
Manager had stopped doing these analyses because of flaws in the commercial software.
In Dimoda, the Business Unit Director showed much interest in having accounting
information for profitability analysis. However, she complained that the department of
management control did not give her the necessary information voluntarily and regularly.
The costs calculations were inaccurate and the real indirect costs were not allocated;
therefore, it was not possible to manage the profitability or to take corrective actions in a
timely manner (see Simons 1995b, p. 123). Although the results were discussed with the
Director-General on a monthly regimen, the discussion was made late. The Business Unit
Director said that information about the profitability was insufficient and, as it was, did
not help her manage to correct any errors quickly (see Anthony and Govindarajan 2003,
p. 566). The Dimoda Marketing Manager made no analysis of profitability.

CHAPTER 7
270
In Modalfa, both the Commercial Director and the Marketing Director were very
focused on EBITDA (see Ambler 2003b, p. 100). The Commercial Director looked daily
to the contribution margins (see Shank, in Robinson 1990, p. 16) and the Marketing
Director was concerned to see to what extent his activities had contributed to changes in
EBITDA – the Marketing Director reported that it was a way of protecting his MD
resources.
Both companies were interested in accounting information for profitability
analysis. However, in Dimoda the process of profitability analysis was limited by the lack
of appropriate information systems and the limited cooperation of the department of
financial accounting and management control. In Modalfa, analysis was done on a daily
basis, with the information available automatically in the computer systems. Unlike
Dimoda, in Modalfa the Marketing Director used the accounting information to analyse
the returns of the business and the impact of marketing activities on the company's profit.
Both the Marketing Manager and the Business Unit Director of Dimoda used
accounting information to control costs (see Johnson and Kaplan 1987, pp. 33, 40). The
Business Unit Director sought accounting information to identify opportunities for cost
reduction through process changes or renegotiating contracts; the Marketing Manager to
control the level of expenditures so as not to exceed the budget. In this case two problems
arose. First, the information was not produced with the necessary speed – it normally took
two months to close the accounts. Second, it was not produced with the necessary detail
(cf. Section 5.3.3.1.3). The management control, who produced the cost information,
made its reports to the board directors, being discussed at that level. Thus, the information
was aggregated so that it was useful for analysis and decision at the boardroom; but it was
insufficient for most operational decisions (cf. Section 5.3.3.1.3).
In Modalfa, accounting information was demanded by both the Marketing
Director and the Operations Director to control costs. The Marketing Director said that
his main focus – at the monthly activity analysis meeting – was looking at each line of
costs, identifying deviations from the budget and understanding the reasons for the
problems in order to take corrective actions during the subsequent month (see Ambler
2003b, pp. 29-30; Horngren 2004, p. 210; Simons 1995b, p. 123). The analysis of costs
was done systematically every month with the management team, i.e., all functional
directors, the support services departments and a member of the administration.
In both companies there was concern in using accounting information to manage
costs. However Modalfa was characterised by having detailed information available every
month. The interaction between senior managers at Modalfa, during the monthly review
ANALYSIS AND DISCUSSION
271
meeting, allowed them to understand and explain deviations, find solutions and define
corrective actions in a multi-functional context (see Simons 1995b, pp. 96, 123).
In Dimoda, the Marketing Manager and the Business Unit Director also demanded
accounting information to measure the impact of marketing promotional activities, e.g.,
promotions carried out through SMS. The directors said it was a difficult calculation to
do. Neither the financial accounting department nor the management control department
participated in this process.
In Modalfa, accounting information was also demanded by the Marketing Director
and the commercial department to analyse the impact of marketing campaigns on the
results. Apart from the impact on sales, the incremental costs and incremental revenues
were also analysed, thus trying to identify the net effect of each marketing campaign on
results (EBITDA) (see Ambler 2003b, p. 100). These analyses were produced by the
department of management control.
Although the two companies performed financial analyses of the return on
marketing campaigns, Modalfa did it differently; firstly, they sought to go beyond the
sales and identified the outcome differential; secondly, the management control
department participated actively doing the calculations. While in Dimoda the marketing
managers did the analysis with the means they had available within the MD, in Modalfa
the analysis was done in coordination with the department of management control.
Apart from these common practices of the two companies, Dimoda also demanded
accounting information to analyse sales by customer account – only for those with loyalty
card. In the case of Modalfa, the accounting information was demanded to analyse and
diagnose business problems, and to measure the performance of managers and employees
(see Section 7.3.2).
In the following sections, the demand of accounting information in the
management of marketing that aimed and supported management action are identified.
7.8.2 Accounting Information for Management Action
The Dimoda Business Director noted that the accounting information was also useful for
her to identify opportunities for improvement in the organisation. However, she
commented that for the use of accounting information to be effective for this purpose, it
was important that there was face-to-face communication and interaction between
business managers and those responsible for the management control department that
produced the information (see Simons 1995b, pp. 97-101). She justified, saying that these
CHAPTER 7
272
were discussions that contributed to identifying the problems (Ambler 2003b, p. 1).
Moreover, she told that this type of interactions did not occur with regularity in Dimoda,
which was against her desire (see Foster and Gupta 1994, pp. 66-67).
In Modalfa, accounting information in respect of stores, e.g., sales, contribution
margins and results, was used to identify the best performing stores and revenue drivers
(see Foster and Gupta 1994, p. 69) – particularly in converting visitors into buyers (see
Hope and Fraser 2003a, p. 61). The causes of above average performances were identified
through qualitative analysis (see Ambler 2003b) at the point of sale, and replicated in
other stores with lower performances. This methodology allowed the identification of
efficient processes and successful products (see Johnson 1992; Johnson and Kaplan 1987,
p. 9; Simons 1995b, p. 5).
Although the two companies had identified different ways to use accounting
information to identify opportunities for improvement, both suggested that the
information system and the interaction between senior managers are critical in this
process (see Simons 1995b, p. 96). In both companies, the senior managers reported that
the financial reports, as written, were insufficient to diagnose the cause of the problems,
identify opportunities for improvement and support management action (see Ambler
2003b, p. 1; Hall 2010, pp. 307-308).
Dimoda managers, i.e., commercial, marketing and control, said they had no
formal process of strategic reflection and strategic definition for the business. However,
when referring to the use of accounting information, they revealed that some long-term
decisions and strategies – including closing and opening stores, negotiating leases, and
decisions to compete with low cost structures – considered account information in the
analysis, which was processed by the accounting and management control department.
In the case of Modalfa, the accounting information was necessary for the MD to
propose and justify, financially, structural changes or investments in projects with
implications in the medium and long-term, e.g., to hire more people for the MD or to
launch a loyalty card program. The Modalfa department of management control had the
responsibility to promote the processes of strategic reflection across the organisation and
perform strategic planning (see Shank 1989, p. 50); it also made the business plans for
expansion or internationalisation projects. In the budgetary process, the control
department also made five year projections which included the respective business plans
(see Hope and Fraser 2003a, p. 78; Simons 1987b, p. 4).
In both companies, the commercial and marketing managers demanded
accounting information to justify strategic decisions (see Shank 2006, p. 356). In Dimoda,
ANALYSIS AND DISCUSSION
273
it was the Business Unit Director who collected and processed information for decision
support (see Horngren 2004, p. 207), while in Modalfa, the planning and control
department had the responsibility to integrate accounting information with the strategy
formulation (see Ambler 2003b, p. 253). For example, in Modalfa, during the strategic
thinking, the process was stimulated by the PCG; after the strategy formulation, it was the
PCG that established the indicators and monitored the business, to align the managers'
performance to the objectives set in the strategic plan (see Shank 2006, p. 356).
Another common aspect in both companies was the demand of accounting
information for pricing. The Dimoda Business Director estimated the product cost and
added to it a margin for indirect costs, i.e., a mark-up over cost.
The Modalfa Marketing Director said they considered two factors for the
establishment of prices and promotions: firstly, a profit margin that would allow paying
adequate returns to the shareholders; secondly, sufficiently attractive prices that resulted
in proper stock rotation (see Johnson and Kaplan 1987, p. 41).
Both companies considered accounting information in pricing, however the
perspectives were different. The prospect of Dimoda was centred on cost, i.e., the price
was established in order to cover the direct and indirect costs. Modalfa was focused on
satisfying shareholders, i.e., with prices determined by the profit margin; and the
customers, i.e., offering sufficiently attractive prices for customers, which would lead to a
rotation of inventories.
The two companies also had in common the fact that they demanded accounting
information for planning and controlling marketing activities. The Dimoda Marketing
Manager received the maximum value for her marketing budget and it was according to
this value that she did the planning of her marketing activities (see Hope and Fraser
2003a, p. 21). Throughout the year, she controlled the fulfilment of the plan and costs
according to the budget. Sometimes she did not spend all that had been budgeted for
marketing due to the absence of instructions from her director, she said. In Dimoda, the
MD was a cost centre, only the costs were controlled by the Marketing Manager; she had
no information for analysing returns.
In Modalfa, accounting information was used by the Marketing Director to plan
and control the activities of the MD. The plan had four phases, beginning in April and
ending in December. It was a process where all the directors participated in order to
reflect strategically, analyse the activity and project sales and profits. The process was led
and controlled by the management accounting department using input from the business
managers, i.e., commercial, marketing and operations.
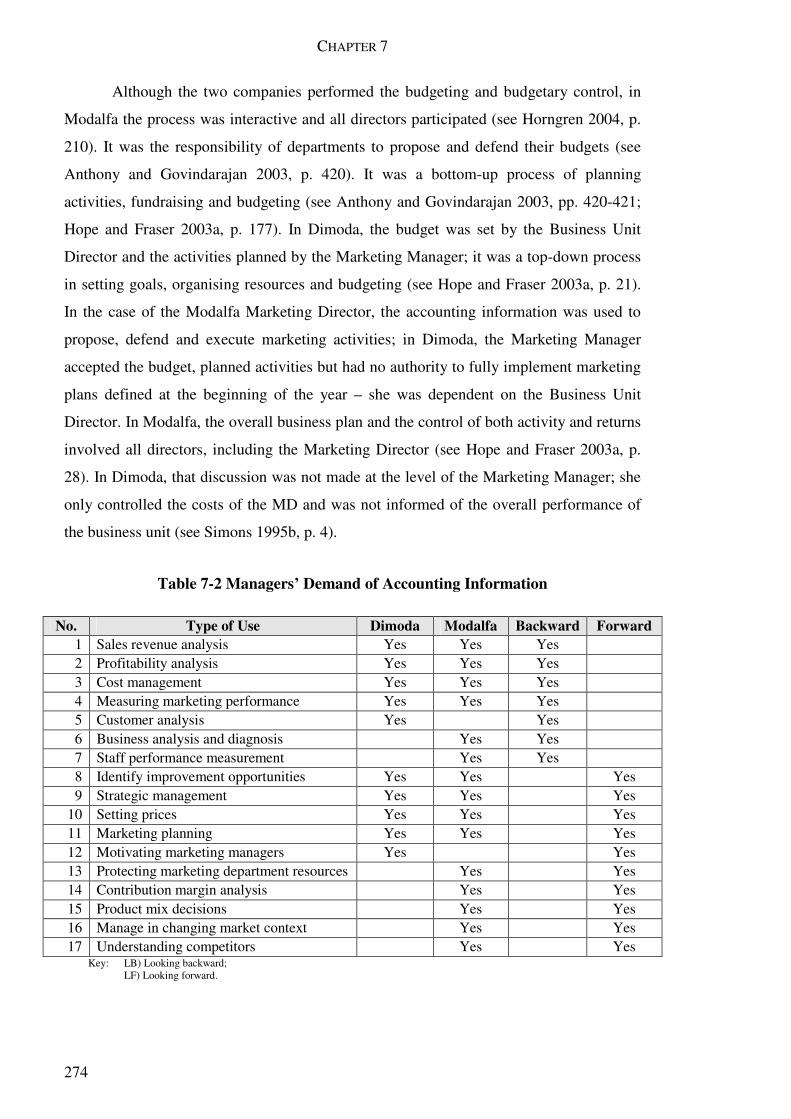
CHAPTER 7
274
Although the two companies performed the budgeting and budgetary control, in
Modalfa the process was interactive and all directors participated (see Horngren 2004, p.
210). It was the responsibility of departments to propose and defend their budgets (see
Anthony and Govindarajan 2003, p. 420). It was a bottom-up process of planning
activities, fundraising and budgeting (see Anthony and Govindarajan 2003, pp. 420-421;
Hope and Fraser 2003a, p. 177). In Dimoda, the budget was set by the Business Unit
Director and the activities planned by the Marketing Manager; it was a top-down process
in setting goals, organising resources and budgeting (see Hope and Fraser 2003a, p. 21).
In the case of the Modalfa Marketing Director, the accounting information was used to
propose, defend and execute marketing activities; in Dimoda, the Marketing Manager
accepted the budget, planned activities but had no authority to fully implement marketing
plans defined at the beginning of the year – she was dependent on the Business Unit
Director. In Modalfa, the overall business plan and the control of both activity and returns
involved all directors, including the Marketing Director (see Hope and Fraser 2003a, p.
28). In Dimoda, that discussion was not made at the level of the Marketing Manager; she
only controlled the costs of the MD and was not informed of the overall performance of
the business unit (see Simons 1995b, p. 4).
Table 7-2 Managers’ Demand of Accounting Information
No. Type of Use Dimoda Modalfa Backward Forward 1 Sales revenue analysis Yes Yes Yes 2 Profitability analysis Yes Yes Yes 3 Cost management Yes Yes Yes 4 Measuring marketing performance Yes Yes Yes 5 Customer analysis Yes Yes 6 Business analysis and diagnosis Yes Yes 7 Staff performance measurement Yes Yes 8 Identify improvement opportunities Yes Yes Yes 9 Strategic management Yes Yes Yes
10 Setting prices Yes Yes Yes 11 Marketing planning Yes Yes Yes 12 Motivating marketing managers Yes Yes 13 Protecting marketing department resources Yes Yes 14 Contribution margin analysis Yes Yes 15 Product mix decisions Yes Yes 16 Manage in changing market context Yes Yes 17 Understanding competitors Yes Yes
Key: LB) Looking backward; LF) Looking forward.
ANALYSIS AND DISCUSSION
275
In addition to the eight coincident managers’ demands of accounting information
(see Table 7-2), other managers’ demands were identified in each of the organisations
(see Table 7-2, Section 5.3.3.1 and Section 6.3.3.1). In Dimoda, the Business Unit
Director and the Marketing Manager also considered accounting information as a
motivation factor for marketing management (see Anthony and Govindarajan 2003, p.
566; Horngren 2004, p. 207). In Modalfa, accounting information was demanded with
several other purposes related to management action, For example, they demanded it to
protect the levels of marketing expenditures in situations of widespread cost reductions,
giving account of what they did and their contributions to the business profitability; to
justify spending on construction and activation of the brand; to do analysis of contribution
margins by product line (business unit) (see Shank, in Robinson 1990, p. 16); to help to
manage in contexts of market change (see Simons 1995b, p. 92); and, finally, to realise
the situation of competitors (Ambler 2003b, p. 30; Bromwich 1990).
The following section analyses and discusses how the MDs of Dimoda and
Modalfa were organised, how they measured their performances, and what their situation
and influence was on marketing management.
7.9 Marketing Department Situation: Comparative Analysis
In Dimoda, the MD was reduced in terms of people. One explanation given was the
reduction in the number of brands sold, another was the fact that the MD was limited to
the activity of communications and public affairs (see Ambler 2003b, p. xiii). The amount
of the marketing budget is set by the Business Unit Director and by the Director-General
of retailing (see Hope and Fraser 2003a, p. 21). The distribution of the marketing budget
by the various marketing activities is the responsibility of the Marketing Manager. The
board directors typically approve the marketing budget proposed by the Business Unit
Director (see Hope and Fraser 2003a, p. 4).
In Modalfa, the marketing budget is proposed by the MD with the support of the
department of planning and management control. The Marketing Director seeks to justify
spending money on marketing with the impact marketing activities have on the profits of
the business (Ambler 2003b, p. 11) – despite the fact that the budget can be defined in
terms of a percentage of sales. For operational marketing activities, e.g., communication
and digital media, Modalfa is supported by external agencies. The staff of the Modalfa
MD is focused on in-store communication, on public affairs and brand management. It is
the MD that decides how to communicate about new products, prices and promotions,
CHAPTER 7
276
controlling the extent to which these decisions are aligned with the strategic decisions for
the business as well as for each of the brands, e.g., positioning and targeting (see Section
6.3.4.1 and Appendix 2).
The comparison of the two cases reveals that in Dimoda the marketing budget is
set outside the department and has reduced values as regards in terms of percentage of
sales – usually accepted in the boardroom due to its small value. In Modalfa, the
marketing budget amount is defined within the department in collaboration with the
department of planning and management control (see Hope and Fraser 2003a, p. 37). It is
justified by analyses of the impact of marketing projects on profits and negotiated with
the Director-General. In this context, in Dimoda the MD has low level responsibilities,
e.g., communication activities and public affairs, as well as few resources (0.69% of sales
in 2010) compared to Modalfa; the Modalfa MD participates in strategic and operational
marketing management, and its budget was equivalent to 3.71% of sales in 2010 (see Low
and Mohr 2000; Stewart 2009).
The lack of analysis of the costs and benefits associated with the marketing
activities in Dimoda, limited their decisions on the media used and the budget allocated to
marketing (Ambler 2003b, p. 11). The software failure – related to the commercial
analysis and the analysis of commercial transactions with the customer loyalty card – was
used as an argument to explain the inability to analyse the impact of marketing
campaigns. However, it was found that the fact that this software already worked in the
past was not enough to justify the assignment of human resources and budget for
marketing activities. It is also worth mentioning that the absence of analysis of the impact
of marketing activities on sales and profits led to another analysis to justify the marketing
activities undertaken. Such analysis did not compare the costs and benefits differentials in
the operating account of Dimoda that derived from developed marketing activities. It just
compared the alternative costs: the costs incurred (i.e., the cost of clothing supplied to TV
presenters) were justified with the costs saved (i.e., if they had to pay for the space
occupied by television advertising cards, after the sponsored program). The impact that
caused the advertising on sales and profits was not assessed, and there was no
optimisation of the mix of media used. Although the Business Unit Director desired the
calculation of marketing activity’s impact on profits, there were no technical or human
resources to make this analysis.
In Modalfa, in addition to analysing the impact of marketing campaigns in terms
of sales – with detail, customisation and promptness – the Marketing Director also sought
to calculate the EBITDA of marketing campaigns (see Ambler 2003b, p. 100). The
ANALYSIS AND DISCUSSION
277
calculation was done supported by the department of planning and management control
(see Lehmann 2004; Srivastava et al. 1998). The Marketing Director used this financial
information to propose activities to the board level and to communicate with his
colleagues from other functional departments. This methodology for calculating the
marketing performance was used especially in periods of economic contraction and cost
containment, to protect the human and financial resources assigned to the MD (see Kotler
et al. 2006, p. 71; Simons 1995a, p. 84; Srinivasan et al. 2005, p. 114; Webster Jr et al.
2005, p. 37). In addition to the quantitative information, the MD also received qualitative
information about campaigns (see Ambler 2003b), such as failures in the implementation
of in-store campaigns. The qualitative information allowed identifying situations in which
the failure of campaigns was not due to its configuration inputs but to its implementation
(see Figure 2-1). Quantitative analysis, including financial information, was not able to
explain the failures of marketing campaigns (see Ambler 2003b, pp. 26-30). The
explanation was achieved through the information provided by the Operations Director,
who contacted directly with staff in the stores and identified the reasons for the deviations
in the operational and financial indicators.
When comparing the two cases, one can see that it is not sufficient to have the
tools available (e.g., software for analysing the impact on sales of certain marketing
campaigns) or other means (e.g., comparison of alternative scenarios for using marketing
media and minimisation of costs) to justify the marketing expenditures. In Modalfa, what
actually helped to strengthen the financial resources allocated to the MD was its ability to
calculate the EBITDA for specific marketing campaigns. Moreover, the contribution of
the department of planning and management control was necessary to calculate these
values. The MD by itself had no expertise or tools to develop these financial calculations
that required information in terms of costs.
In Dimoda, the MD has a very limited influence on strategic and operational
decisions related to marketing management (Ambler 2003b, p. xiii). The Marketing
Manager said that this situation led to decisions that harmed the Dimoda brand, e.g., (1)
an excessive focus on promotions through price reductions, (2) the marketing ads using
poor quality materials, and (3) the SMS messages not adequate to the Dimoda customer
segment. The limited influence of the Dimoda MD was explained by the Marketing
Manager as a result of both low motivation of the Business Director and financial
constraints that conditioned the resources devoted to the MD (see Ambler 2003b, p. 253).
The Marketing Manager added that the MD was recognised and its participation was
active in the other brands managed by the GR.

CHAPTER 7
278
In Modalfa, the MD was recognised by the other directors as a department that (1)
coordinated marketing management in its various facets (e.g., product, price, promotions,
merchandising, customer segmentation and brand positioning); (2) that participated in
strategic decisions; and (3) that controlled the operational decisions related to marketing –
those managed by other departments, e.g., commercial, operations and purchasing. The
importance of the MD within the company was seen by both the Marketing Director and
the Director-General as a consequence of the company culture. However, the MD's ability
to demonstrate the value of its activities strengthened its position and the resources
allocated to it – particularly in years of economic downturn and cost containment (see
Kotler et al. 2006, p. 71; Simons 1995a, p. 84; Srinivasan et al. 2005, p. 114; Webster Jr
et al. 2005, p. 37).
Comparing the two cases, one can see that the existence of a MD with influence
and recognition within the organisation (e.g., in Modalfa), contributed to considering
strategic orientations as the brand was managed (see Webster Jr et al. 2005). The
marketing decisions took into account the long-term impacts, e.g., the impact of both the
locations of stores and their decoration, in brand positioning (see Appendix 2). Also, in
the Modalfa case, the promotions were controlled by the MD, so as not to adversely affect
the brand positioning – even if they were decided by the commercial department. In the
case where the MD had no influence or was not recognised by the business director (e.g.,
Dimoda), its responsibilities were limited to operational aspects related to communicating
promotions and to public relations – which were decided by the Business Unit Director.
The status and influence of the MD was positively influenced by its ability to demonstrate
the contribution of its activities to the company's profitability (see Ambler 2003b, p. 62).
However, when analysing these cases, one may conclude that the MPM ability, by itself,
was not enough. In Modalfa the board directors and the Director-General understand and
appreciate the role of marketing in business management and it was a crucial aspect for
the MD situation (see Homburg et al. 1999; Nath and Mahajan 2008).
Finally, the literature suggests that it is important to use financial metrics, e.g.,
customer profitability analysis, CLV, customer equity and brand equity, to demonstrate
the value that marketing activities add to the company (see Gupta and Zeithaml 2006;
McGovern et al. 2004; Verhoef and Leeflang 2009). When observing these cases, it
became evident that these companies do not use these metrics, do not feel its need, and do
not have the desire to do so. Notwithstanding, it was noted that it is very important for
both these companies to calculate the return of certain marketing projects, i.e., specific
marketing campaigns – but this is not suggested in the literature. This was done by

ANALYSIS AND DISCUSSION
279
calculating the EBITDA of certain marketing campaigns as Modalfa did, i.e., the increase
in net income deducted from the increase in costs associated with the specific marketing
campaign. It is a calculation that the Modalfa's management accounting department was
able to do, and it is information that the various functional managers understood (see
Simons 1995b, p. 108) – as stated by the Modalfa Marketing Director (see Section
6.3.4.2). This understanding of the marketing managers’ perspective regarding
performance measurement produces two findings. First, the unit of analysis is the
marketing project – not the customer or the brand as suggested in the literature (see
Barwise and Farley 2004; Gao 2010; Srivastava et al. 1998). Second, the metric is the
difference between the relevant revenues and the relevant expenditures associated with
each marketing project – not the discounted cash flows as suggested in the literature (e.g.,
Gupta et al. 2004; Kumar et al. 2008).
The next section analyses the relationship between marketing and accounting
departments and to what extent this interaction influenced the situation of the MD within
these organisations.
7.10 Conclusion
The individual analysis of each case supports the conclusion that the ability of the
accounting system to meet managers’ demand of accounting information is influenced by
several factors in each of these companies. This conclusion is reinforced when comparing
the two cases. One may classify these factors according to two dimensions – structural or
organisational and functional or behavioural – to facilitate the understanding and
systematise the explanation.
From the structural point of view, (1) the integration of databases and automation
of accounting entries contribute to the availability and reliability of management
accounting information to managers. Another factor is that (2) the management
accounting system design regards the aggregation and the detail of accounting
information equally important and complementary. It is related to how information is
collected, stored and made available to managers. Aggregation of accounting information
is important for report and analysis at the boardroom level – oriented to strategic
decisions. The detailed information is required for staff direct access and analysis (at all
hierarchical levels) – oriented for store operations, marketing and sales. Finally, (3) the
mindset of both managers and management accounting department staff is another
structural factor influencing the ability of the accounting system to meet managers’
CHAPTER 7
280
demand for information. In Modalfa the management accounting department staff go
beyond their role of planners and controllers; it makes them proactive and dynamic
because they feel responsible for supporting managers in an always changing business
contexts. They assume the role of facilitators of information.
From the functional (behavioural) point of view, it is the way accounting
information is communicated. In the Modalfa case there are two complementary forms to
communicate information which contributed to the intensive use of the accounting
system: (1) it was the personal, direct and real-time access to information through the
information system – for daily analysis and managerial decision making; and (2) it was
the regular and systematic team-based access to accounting information, both
communicated and interpreted in face-to-face meetings which were led by the
management control department (see Horngren 2004, p. 208) – for a holistic and strategic
business analysis aiming at short and medium term management alignment. From this
form of communication and interaction there also resulted opportunities of mutual
learning (see Abernethy and Brownell 1999, p. 199; De Haas and Kleingeld 1999; Mundy
2010, p. 501; Shields and Shields 1998). Managers learn how to use the accounting
information as well as realise the potential of the accounting system; and the management
accounting staff understand the managers’ need of accounting information in each
particular situation (see McManus and Guilding 2008, p. 785; Ratnatunga et al. 1990, p.
41).
Regarding managers’ demand of accounting information, in both cases the
managers do value and seek accounting information. In both companies the managers
demand information on sales revenues, costs and profits. They also demand information
on contribution margins by product line and stores. Also in the two companies, managers
seek accounting information for budgeting and variance analysis. However, only Modalfa
managers make use of strategic cost analysis, specifically through internal and external
benchmarking, analysis of competitors’ accounting information, and cost management
considering structural and executional drivers (see Ambler 2003b, p. 30; Bromwich 1990;
Eccles 1991, pp. 4-5; Hope and Fraser 2003a; Shank 1989, pp. 56-57). Also, only
Modalfa managers do an interactive control through systematic face-to-face multi-
functional and multi-hierarchical meetings aiming at team-based business activity
analysis – in order to identify risks and strategic opportunities (see Simons 2000).
In addition to the applications of accounting information common to both
companies (e.g., sales analysis, profitability analysis, cost analysis, MPM, strategic
planning and pricing), the Dimoda Marketing Manager in particular considered that the
ANALYSIS AND DISCUSSION
281
accounting information on the return of marketing campaigns also contributed to her
motivation (see Anthony and Govindarajan 2003, p. 566; Horngren 2004, p. 207).
Analysing the Modalfa Marketing Director’s demand of accounting information – and
unlike what happened in Dimoda – the accounting information was used to protect the
technical and human resources of the MD, and to protect spending on creation or
activation of the brand. Therefore, the accounting information contributed to Modalfa
marketing managers to strengthen the competitive position of Modalfa (see Simons
1995b, p. 123).
It is worth noting that in Dimoda, the existence of operational metrics to assess the
results of marketing activity was not enough to protect the MD from downsizing, which
contrasts with the theories in the literature (see O'Sullivan et al. 2009; Verhoef et al.
2011). The Dimoda business, which had specific software to analyse marketing, had the
MD reduced in terms of both staff and decision-making power. Though the Modalfa
Marketing Director considered the capacity to use the financial measurements in
marketing a crucial factor in preserving the power and influence of his department, the
manager commented that Modalfa was a market oriented company which recognised the
marketing function as crucial (see Simons 1995b, p. 3).
At Dimoda, where the marketing activities (cf. Appendix 2) were not financially
assessed, the marketing budget was allocated to the promotional activities, not to the
strategic brand management (see Low and Mohr 2000; Nijs et al. 2001; Stewart 2009). In
Dimoda, the MD had responsibilities at the operational level, e.g., communication of
promotions and events, rather than at strategic marketing management, e.g., deciding on
brand positioning, and customer segmentation (see Sheth and Sisodia 2005; Verhoef and
Leeflang 2009). In Dimoda, the promotional activities focused on price reductions, being
misaligned with both the concept of brand and the business strategy, said the Marketing
Manager. The business management focused more on cost saving tactics, than on sales
boosting strategies (see Hope and Fraser 2003a, p. 49). Finally, in the Modalfa case,
where the MD preserved both decision-making power and influence over the other
departments, the promotional campaigns were aligned with the brand positioning, and the
brand activation activities were oriented for short-term returns.
The perspectives of both the financial accounting and management accounting
departments are also fundamentally different in the two organisations (see Figure 8-1 and
Table 8-1). In Dimoda, the financial accounting was very much focused on reporting to
both external entities and boardroom directors (see Anthony and Govindarajan 2003, pp.
416-417; Langfield-Smith 2008, p. 209). In Modalfa, the financial accounting was very
CHAPTER 7
282
much focused on understanding managers’ needs of information, in order to gather and
organise information so the business managers can use it conveniently (see Boer, in
Robinson 1990, p. 28) – there is a dedicated department focused on external reporting. In
Dimoda, the management accounting was mainly focused on both budgetary control and
reporting to the boardroom directors. In Modalfa, the management accounting in addition
to its responsibility in budgeting and variance analysis, also had the responsibility of
strategic planning; still it focused on supporting managers, seeking to realise their needs
for accounting information, producing timely reports tailored to each specific case (see
McManus and Guilding 2008, p. 785; Ratnatunga et al. 1990, p. 41; Boer, in Robinson
1990, p. 28).
The comparative analysis reveals that these two companies, although apparently
similar in the demand of accounting information for the budgetary management of the
MD, are very different in the way they did so, and in the motivations they had for the use
of accounting information (see Horngren 2004, p. 210). While Dimoda was focused on
cost control and in written reports for senior management, Modalfa was oriented in the
use of accounting information to support management, with face-to-face presentations in
multi-functional and multi-hierarchical meetings (see Simons 1995b, p. 108, 2000, pp.
217-218). In Dimoda, accounting information was demanded geared to the analysis of
past activity – in this regard, with some time delay in the production of reports – and less
focused on management action, e.g., the identification of corrective measures or
improvement opportunities (see Simons 1995b, p. 123). In Dimoda, the analyses and
diagnoses were made primarily at the level of the boardroom, contributing to strategic
decision making, e.g., closure of unprofitable businesses or opening new stores, however
it was not useful for identifying operational problems and corrective measures at
marketing management level (see Johnson 1992, p. 15).
In conclusion, the analysis of these cases suggests that managers seek accounting
information and the accounting system is able to provide such information. Regular and
systematic face-to-face interactions between managers are a key factor; it creates
favourable conditions and facilitates the exchange of accounting information. These
meetings are opportunities for sharing and learning. They create learning opportunities for
managers without financial training, and offer accountants the possibility to understand
the managers’ demand of accounting information (see McManus and Guilding 2008, p.
785; Ratnatunga et al. 1990, p. 41).

283
CHAPTER 8 CONCLUSION
This study explores the factors that influence the ability of the accounting systems to meet
the managers’ demand of accounting information, in two fashion retail companies. The
managers’ demand of accounting information is also researched, in particular the
marketing managers’ demand. The management accounting departments’ perspectives on
their role in supporting managers, as well as how accounting information is
communicated is also explored. The chapter starts by offering a summary of the research
findings. The contribution of the study including how it builds on prior research is
discussed in Section 8.2 and the research limitations are identified in Section 8.3. The
chapter concludes with suggestions for further research in Section 8.4.
8.1 Summary of Findings
The result of this research – based on the study of the two cases – can be summed up to
five main findings. First, several factors were identified, specific to each organisation,
that influenced the ability of the accounting system to meet the managers’ demand of
accounting information. These factors may foster the use of accounting information –
supporting the desire of managers – or may hinder the transmission and use of accounting
information.
There are two aspects, in the organisation and communication of accounting
information, that influence the managers’ use of accounting information. One is related to
how information is structured (stored), another one is related to how information flows (is
communicated). At the level of the information structure, it is important for Modalfa that
the information is organised and stored at a very detailed level. This facilitates detailed
analysis in terms of product or product line sales and profitability. It supports individual
managers’ daily decisions, which are more operational in nature (see Hope and Fraser
2003a, p. 65). The aggregation of information is also necessary and done by Modalfa
management control staff with the aim of performing analysis at the business unit level. It
supports both a team based business analysis and team decision making; it is reflexive
and strategic (see Hope and Fraser 2003a, p. 82).
At the level of information flow, it is important for these observed companies to
have a personal, immediate and real time access to accounting information (see Hope and
Fraser 2003a, p. 65; Johnson and Kaplan 1987, p. 14). The direct access to accounting
information, through self-service mechanisms, was aimed at supporting managers in daily
CHAPTER 8
284
individual decision-making. It was also useful for identifying problems and good internal
practices that contributed to find opportunities for improvement. It was also important for
Modalfa to have information prepared, interpreted and explained by the management
accounting department (see Shank 2006, p. 363). This second form of communicating
accounting information – which was customised and verbally transmitted – was enriched
by the managers’ interaction from both different hierarchical and functional areas (see
Simons 1995b, p. 97). The different managers’ perspectives added qualitative information
and explained the management accounting numbers produced by management accounting
staff (see Ambler 2003b; Simons 1995b, p. 118). It also allowed comparisons with
competitors and the establishment of internal and external benchmarks (Ambler 2003b, p.
30; Bromwich 1990; Eccles 1991, pp. 4-5; Hope and Fraser 2003a, p. 55). Through
teamwork analysis Modalfa managers identified problems and opportunities, which, in
turn, led to action plans decided and agreed collectively by all chief executives every
month (see Hope and Fraser 2003a, p. 28; Simons 1995b, p. 123).
The importance of the financial accounting department being focused on the
internal clients (see Figure 8-1) is also highlighted. The Modalfa Financial Accounting
Director was focused on internal users of accounting information; he collected and
organised the information considering its future treatment by the department of
management control and its utilisation by business managers (see Boer, in Robinson
1990, p. 28; Shank 2006, p. 356). Conversely, the Dimoda Financial Accountant was
focused on producing legal accounting information directed to external clients, e.g.,
nationwide statistics institute, income tax administration, and value added tax
administration (see Langfield-Smith 2008, p. 209). The latter situation produced delays in
processing the accounting information for the purpose of internal use.
The combination of the two factors mentioned above created a favourable context
that supported the managers’ use of the accounting system, i.e., the combination of both
the accountants recognising their role in supporting managers and the interactive face-to-
face interpretation of accounting information. The combination of these two factors
created contexts of learning: managers learned the potential of the accounting system and
management accountants learned the real needs of managers in terms of accounting
information (see McManus and Guilding 2008, p. 785; Ratnatunga et al. 1990, p. 41).
This mutual learning contributed to both the design of the accounting system and the
content of management account reports be aligned with Modalfa managers’ demand (see
Figure 8-1) (see Lere 2001, p. 589).

CONCLUSION
285
Figure 8-1 Accounting System Design Circles
Little Inter-Functional Interaction
Functional Departments Focused on Themselves
“Silos”
Accounting Reports
Designed for Boardroom
Analysis
Highly Aggregated Accounting Information
Dimoda
Accounting System Focused on Boardroom
Inter-
Functional Interaction and Face-to-Face
Communication
Mutual
Learning: Managers and Accountants
Accounting System Design
Oriented to Managers
Accounting System Meets
Managers’ Demands of Information
Modalfa
Accounting System Focused on Managers

CHAPTER 8
286
Table 8-1 Summary of Findings: Dimoda vs. Modalfa
Concept Dimoda Modalfa
Organisational Form Functional
Departments, Silos
Projects
Teams, Interactions
Use of Accounting
Information Light Intensive
Communication Written
to Board Directors
Oral
in Functional Meetings
Analysis of
Accounting Reports
Boardroom Directors
Director-General (ad-hoc)
Multi-Hierarchical
Multi-Departmental
Frequency of Management
Accounting Reports Analysis
Monthly
2 months lag in financial acc.
Monthly
6 days lag in financial acc.
Marketing Department Perspective Cost Control
Budget as a Limit
Value Added by Activities
Budget as a Guide
Financial Accounting Focused External Clients
Balance Sheet Accuracy
Internal Clients
Timeliness and Efficiency
Management Accounting Focused Report to Boardroom
Budget Control
Support Business Managers
Analysis of Activity
Marketing Influence or Stature Low
Operational: Communication
High
Strategic: Big Picture
Publicity Expenditures
(% sales, 2008-2010) 0.69% 2.86%
Sales Growth
(2007→ 2010) 1.84% 16.84%
Profitability
(% sales, 2008-2010) -7.26% 6.19%
The second result of this study is to realise that the managers of these firms seek
accounting information and consider it very important – apart from the Dimoda
Marketing Manager.389 Managers seek information for various purposes: some more
389 She showed, however, interest in receiving accounting information if the utility of it was explained to her. The Marketing Manager’s commentary confirms the importance of the aspect of team-based learning in multi-functional face-to-face interactions (see Figure 8.1).

CONCLUSION
287
operational, others more strategic. When information is sought for operational
management, managers value the personal, direct, updated and detailed access to it. In
this regard, managers seek information on sales, costs and profitability; both companies
are identical in this kind of demand for accounting information.
In the strategic perspective, managers demanded accounting information to identify
improvement opportunities in both stores and back-office processes as well as in
marketing campaigns (see Ambler 2003b; Johnson 1992; Simons 1995b). For example, in
the Modalfa case, the managers identified the retail stores with the best results and best
practices using accounting information (see Ambler 2003b, p. 201); afterwards, they
replicated the more efficient business processes or successful marketing decisions, e.g.,
product mix or merchandising (see Appendix 2) in the remaining stores (see Johnson
1992, p. 9; Simons 1995b, p. 5). However, the way in which the information was shared
and analysed, conditioned its efficacy in this process. The information was more often
used as it was automatically available and customisable by the users (e.g., Modalfa).
Moreover, the written presentation, in the form of reports or printouts, was not enough, by
itself, to identify problems and find solutions (e.g., Dimoda). It was more effective (see
Table 8-1) when it was discussed and analysed verbally in multi-functional and multi-
hierarchical face-to-face meetings (see Simons 1995b, pp. 101, 108, 2000, pp. 217-218).
The accounting information was also demanded to plan and budget marketing
activities (see Anthony and Govindarajan 2003, pp. 420-421). Two distinct approaches
were again observed depending on each company case. Dimoda adopted a top-down
model, i.e., the value of the budget was set by the directors of business and the Marketing
Manager just decided on the mix of media (see Hope and Fraser 2003a, p. 4). In Modalfa,
the model was bottom-up, i.e., a plan of actions and resources (mainly human resources)
was submitted, presented and discussed in advance in multi-functional meetings (see
Simons 1995b, p. 4). The plan of actions, after it had been approved, led to the
development of the budget (at the departmental level) and its approval by both the
business directors and the board directors (see Anthony and Govindarajan 2003, pp. 420-
421). The Modalfa’s approach stimulated departmental managers’ entrepreneurship and
initiative to launch innovative projects (see Simons 1995b, p. 16). It also encouraged cost-
benefit analyses in the MD which, in turn, facilitated the approval of departmental
initiatives and fundraising for both promotional and brand activation activities (Roslender
and Hart 2003, 2006; Stewart 2009).
Concluding, accounting information was demanded by Modalfa managers, with two
major purposes. One was strategic through the team based interactive analysis of both

CHAPTER 8
288
business activity and competitors’ accounting information (see Bromwich 1990) – in
order to formulate, communicate and implement strategic decisions (see Shank 1989, p.
50). Another one was an individual daily analysis of online accessed business activity
data, with the aim of guiding the daily management decisions. In Dimoda, managers
sought accounting information for two main purposes. One was the budgetary control of
revenues and costs; the other was to manage the business in a daily basis, demanding
information mainly on sales, but also on costs and profitability.
The third finding is that in both companies, the marketing directors wanted to use
performance metrics to help them justify the expenditures they would like to make in
marketing. They desired metrics that might be easy to explain and easy to understand by
other functional managers. Three characteristics from the marketing metrics in practice
were identified: first, the unit of analysis was the marketing activity. Second, the metric
unit was earnings before interest, tax, depreciation and amortisation. Third, it was
complemented with qualitative information related to the implementation of the
marketing campaigns; the qualitative information contributed to identify the causes of
poor marketing performance, and to distinguish implementation errors from design errors
(see Ambler 2003b). In Modalfa the support given by the department of management
control allowed to calculate EBITDA for certain marketing campaigns. The absence of
such support in Dimoda limited the Business Unit Director in calculating the financial
returns from the MD’s activities (see Ambler 2003b, p. 253).
Moreover, in the situation where the MD developed financial metrics for
marketing performance measurement, it maintained an influential position, e.g., in
Modalfa. The Marketing Director was focused on customers, as he had long-run concerns
about the brand positioning. In the Dimoda case, where the MD’s influence was low, the
daily operational and commercial decisions were not aligned with the brand strategy (see
Low and Mohr 2000; Stewart 2009). The Business Unit Director was focused on
maximising sales and minimising costs and the Marketing Manager was absorbed in
carrying out the Business Unit Director's instructions. Therefore, the Marketing Manager
was carrying out operational tasks (see Sheth and Sisodia 2005; Verhoef and Leeflang
2009); she was not involved with strategy formulation neither with its implementation
(see Hope and Fraser 2003a, p. xvii). For example, in Dimoda, (1) the MD did not
participate in the strategic or operational decisions; (2) the Marketing Manager was in
disagreement with the stores' promotional flyers, (3) promotional SMS messages and (4)
low-priced products. The marketing planning was being driven by immediate returns,
using sales as the performance indicator. The most managed marketing instruments were
CONCLUSION
289
price and promotions (see Section 5.3.4.3). The strategy resulted in efforts for price
reduction, cost reduction and reduced profit margins. Conversely, in Modalfa, the brand
management, the stores' construction, the products and the pricing policy were controlled
by the MD – though it was managed by the commercial department (Homburg et al.
1999).
The fourth finding is related to the perspective of the accounting staff regarding
their role in supporting managers; it was substantially different in the two organisations.
In Dimoda financial accounting was mainly focused on fulfilling the legal obligations
with external entities and on the rigor of financial accounting and reporting (Bromwich
and Bhimani 1994; Langfield-Smith 2008; McManus and Guilding 2008; Shank 2006). In
Modalfa the financial accounting department was present at meetings with managers
since the start-up of each business unit. Its aim was to understand the needs of managers
in each specific context, and design the accounting system to match the specific needs of
these managers (see Preston 1986; Boer, in Robinson 1990, p. 28; Shank 2006, p. 356).
Management accounting in Dimoda was mainly focused on the construction of the annual
budget and on monitoring of deviations throughout the year; they reported to the
boardroom and interacted little with the other functional managers (see Ambler 2003b, p.
202; Hope and Fraser 2003a, pp. 34, 110). In Modalfa, the department of management
control was seen by other managers as the “soul” of business.390 The management
accounting staff considered that their primary role was serving the business managers and
supporting them with accounting information (Cooper and Kaplan 1988b; Shank and
Govindarajan 1993; Shillinglaw 1982; Simons 1995b). They did this in several ways: (1)
they were responsible for driving the process of strategic thinking (Shank and
Govindarajan 1993); (2) they did the five years business planning (Simons 1987b); (2)
they constructed the annual budget and controlled the deviations along the year (Anthony
et al. 2010, pp. 742-750); (3) they did a weekly activity report (Simons 2000); and (4)
they directed a monthly review meeting of business activity (Simons 1995b). In addition
to these systematic tasks, they also developed and designed templates for automatic
tailored reports for each functional manager who demanded it (see Ambler 2003b, p.
253). They were likewise available to support the MD in measuring the results of
marketing campaigns with financial metrics (see Lehmann 2004; Srivastava et al. 1998).
Finally, in Modalfa, the organisation in which the inter-departmental
communication was strong, i.e., through systematic annual and monthly meetings, all
executive directors performed a joint analysis of both the business action plan and the 390 Interview with the Financial Director on 09/08/2012 (M06.38)
CHAPTER 8
290
business activity. They discussed the challenges and commented on the results, using
accounting information produced by the management accounting department. The
meetings were led by the Fashion Controller, who reported the business performance to
all directors, using a single monthly report. The objectives and the strategy were clear for
all executives (see Anthony and Govindarajan 2003, pp. 352, 416); it was an opportunity
to discuss the promotional activities, therefore aligning the short-run promotional
campaigns with the strategic marketing orientations (see Webster Jr et al. 2005). The
Marketing Director was present at these meetings, therefore he commented on the
operational decisions made by other departments, and controlled their alignment with
both the marketing strategies and the brand positioning (see Simons 1995b, p. 3). In
Dimoda case, where the level of inter-departmental communication was low, the MD was
not informed about the strategy and the management control focused only on budgetary
control (see Anthony and Govindarajan 2003, p. 350; Hope and Fraser 2003a, p. xvii).
The management accounting reports were based on financial accounting data and directed
to the board directors (see Johnson 1992). The strategy and the objectives were not shared
by the different functional managers (see Anthony and Govindarajan 2003, p. 350) and
the managerial decisions, both commercial and operational, were not supported by
updated management accounting information (see Simons 1995b, p. 117).
This case study has revealed that marketing managers appreciated the availability
and access to accounting information, used it for various purposes and regarded as
necessary a proactive stance of the management accounting department, so that
information was in due time collected, processed and reported, both orally explained and
analysed in teamwork (see Table 8-1) (see Anthony and Govindarajan 2003, p. 505).
8.2 Contributions of the Research
As to the factors which influence the ability of the accounting system to meet the
managers’ demand of accounting information, this study contributes to the identification
of a set of factors that facilitate the use of accounting information and others that render it
difficult. These can be distinguished between functional (behavioural) and structural
(accounting system design) factors. This is a contribution to the understanding of the
difficulties of both management accounting in practice (Langfield-Smith 2008) and
interaction between marketing and accounting mentioned in the extant literature (see
Gleaves et al. 2008). The current literature explains this lack of interaction because of a
lack of willingness, of relational attitude and of knowledge of accountants and marketers

CONCLUSION
291
(De Ruyter and Wetzels 2000; Foster and Gupta 1994; McGovern et al. 2004). This study
suggests that these difficulties may be mitigated through the design of an accounting
system that takes into account how the information is communicated and the importance
of face-to-face cross-functional interactions – in both the access to the information and in
the discussion of the management accounting reports. Firstly, in terms of information
flow, it is important for Modalfa to have two complementary forms of access to
accounting information (see Shank 2006, p. 360). On the one hand, an automatic access,
self-serviced, customisable, and updated in real time for supporting managers’ daily
decisions is required (see Hope and Fraser 2003a, p. 65). On the other hand, information
collected, prepared and interpreted by the management control department and
transmitted orally in the multi-functional and multi-hierarchical teams is needed (see
Anthony and Govindarajan 2003; Simons 1995b, p. 108, 2000, pp. 217-218). This second
path for communicating and analysing accounting information contributes to collective
tactical and strategic decision making at the level of the business units (see Shank 2006,
p. 356). It also contributes to mutual learning: managers understand the potential of
accounting system and management accounts understand the managers’ demand from the
accounting system (see McManus and Guilding 2008, p. 785; Ratnatunga et al. 1990, p.
41). In terms of information structure, it is important for these companies to have much
detailed information – stored in shared databases – so that managers can give support to
daily product and product-line marketing decisions (see Hope and Fraser 2003a, p. 65). It
is also important to have accounting information aggregated at the level of the business
units with the purpose of being examined by first-line managers to support strategic
analyses and decisions (see Shank 1989, p. 50). Two structurally different organisational
forms were observed. The Dimoda departments were organised into silos and the Modalfa
ones with a high degree of cross functional interactions (see Hope and Fraser 2003a, p.
34). The analysis of these cases suggest that the use of accounting information by
marketing managers was mainly determined by the organisational forms and not by the
propensity of marketing and commercial managers to use accounting information as
suggested in the literature (see Gleaves et al. 2008).
This research contributes with new perspectives on the demand and use of
accounting information, particularly in marketing management. Contrary to what is
suggested in the marketing literature (see Baker and Holt 2004; Barker 2008; De Ruyter
and Wetzels 2000), in these cases the marketing managers do value and do desire to use
accounting information (see Nixon and Burns 2012, p. 226). However, these very same
marketing managers feel they need to have the support of the management control
CHAPTER 8
292
department, so that the communication and use of accounting information is effective (see
Ambler 2003b, p. 253). Therefore, the collaboration of the accounting and management
control departments is critical for marketing managers make use of accounting
information and measure the performance of marketing with financial metrics (see
Ambler 2003b, p. 263; Hope and Fraser 2003a, p. 37). In these cases, the marketing
managers on their own do not know how to do the financial calculations in marketing
(McGovern et al. 2004; O'Sullivan and Abela 2007; Srivastava et al. 1998).
The focus of the financial accounting department on internal users of accounting
information is critical (Boer, in Robinson 1990). This aspect contributes to the design of
the accounting information system and its databases oriented to the demands of the final
users, i.e. the managers (see Johnson and Kaplan 1987, p. 14).
It is suggested in the literature that the development of information systems and
standardised management accounting information would reduce the need for staff in
accounting and management control department (Shank 2006, p. 362). In Modalfa it
turned out that there was no accounting staff redundancy but there existed
complementarity between the IT system and the management accounting staff. It is
necessary accounting staff to identify ever-changing managers’ information needs in
order to design the automatic accounting information reports. Accounting and control
staff are also needed to lead the process of management accounting reporting and
information interpretation, adding managers’ qualitative information to systems’
quantitative information (see Ambler 2003b; Johnson 1992; Simons 1995b).
This case study also shows that the discussion of budgets is not a case of rivalry
between marketing and accounting managers as suggested in the literature (De Ruyter and
Wetzels 2000). In Modalfa, the preparation, the face-to-face discussion and the multi-
functional interactive presentation of budgets, linked positively the various functional
areas, including marketing and accounting (see Horngren 2004; Libby and Lindsay 2010).
In the context of marketing and with regard to the metrics used in the performance
evaluation systems, this study reveals that the metric and the unit of analysis desired by
the marketing managers of the two companies differs from those suggested in the
marketing literature (e.g., Gupta et al. 2004; Kumar et al. 2008). The literature suggests
three measures to evaluate the financial performance of marketing: CPA, brand equity
and CLV (e.g., Bick 2009; Gleaves et al. 2008; Kumar et al. 2008; Van Raaij et al. 2003).
The study of these cases revealed that CPA and CLV are not used or sought in these cases
of fashion retail (see Ambler 2003b, p. 32). The measure brand equity was also
considered impractical and complex (see Ambler 2003b, pp. 54-55). In addition, the
CONCLUSION
293
Modalfa Marketing Director indicated that it was important to have a measurement that is
easy to calculate, to explain and be understood by the other directors (see Simons 1995b,
p. 108). First, for these managers the relevant unit of analysis is the marketing project
(campaign) and not the brand or the portfolio of customers, as suggested in the literature
(see Bates and Whittington 2009; De Ruyter and Wetzels 2000; McManus and Guilding
2008). Second, the desired metric for these managers is the earnings (EBITDA) of each
marketing project, i.e., the differential income less differential spending (excluding
interest, depreciation, amortisation and tax) associated with each marketing project and
not the discounted cash flows as suggested in the extant marketing literature (e.g., Gupta
et al. 2004; Kumar et al. 2008). Third, it is important for these managers to include
qualitative information about the implementation of marketing projects. Using the
qualitative information, managers may identify and explain low marketing performances,
distinguishing marketing implementation related causes from marketing design related
causes for low performances (Ambler and Roberts 2008). Considering all these aspects,
this research has helped to identify the concept of EBITDA applied to the evaluation of
marketing projects as a financial metric to assess the performance of marketing (see
Ambler 2003b, p. 100). Beyond what has been said, the EBITDA was also a measure that
allowed Modalfa to balance the long-term actions (brand) with the short-term ones
(promotional), which is suggested in the literature as difficult to balance (e.g., Low and
Mohr 2000; Stewart 2009; Webster Jr et al. 2005).
In this research one can also conclude that accounting information is not mainly
used for the purpose of profit maximisation (see Lucas and Rafferty 2008), contrary to
what is suggested in the literature (see Nueno and Simon 1999, pp. 153-205; Sloman
2003, pp. 170-173). Although it had been used in the management of contribution
margins for calculating the stores’ profitability, this was not its primary use (see Shank, in
Robinson 1990, p. 16). Additionally, the managers of these firms were not concerned with
the methods of allocating indirect costs. Although Modalfa utilised the concept of
transactions to assign the indirect costs of shared central services (administration and
accounting) to diverse SBUs served, both the controller and managers were not concerned
in the allocation of indirect costs at the product, the business unit, or the store level (see
Goebel et al. 1998, p. 505). They made the profitability analysis using the contribution
margin per unit of analysis, e.g., product, product line or store level.
Finally, this study describes and analyses the management accounting system of
Modalfa which is the leader in the retail business in Portugal (see Section 6.2). The
CHAPTER 8
294
description and analysis of the use of accounting information by managers of marketing
in the fashion retail sector is also a contribution of this research.
8.3 Limitations of the Research
Some limitations are identified in this research. The interviews were conducted at
medium-high hierarchical levels, i.e. with managers and directors. If there had been more
interviews, including with lower hierarchy managers (product managers or store
managers) the investigation would have been more complete and would have produced
findings more related to the practice of accounting.
The research did not have access to the Modalfa’s activity analysis meetings, nor
to the internal documents produced by the department of management control, namely the
activity analysis reports and the methodologies used for MPM. Although applications
have been made to get access to it, the information was confidential and not available for
research. The lack of these elements limited the conclusions drawn from this research,
particularly in terms of specific tools for marketing activity monitoring systems.
The study of only two cases may also be a limitation. Though it has allowed both
an in-depth interpretative analysis – aiming at “emic” understandings and “etic” “thick”
explanations (see Kakkuri-Knuuttila et al. 2008, p. 268; Lukka and Modell 2010, pp. 463-
464) – and the obtainment of answers to the research questions, the findings cannot be
generalised. More case study research (for theoretical generalisation) or the development
of an appropriate quantitative analysis (for statistical generalisation) is required if one
aims at generalising the findings.
The research focuses only on cases of the fashion retail sector. The data collected,
the discussion and the conclusions are largely contextualised in the fashion retail. This
sector represents a context where there are no large customer accounts and the format of
sales teams are different from those in business-to-business situations, e.g., there are no
key account managers. Therefore, the conclusions drawn in this research about the tools
and priorities on MPM may not be applicable in business-to-business contexts.
Finally, the companies were observed in a macroeconomic context extraordinarily
difficult, as Portugal was in a situation of external bailout. The conclusions drawn in this
context may not apply in different macroeconomic situations.
CONCLUSION
295
8.4 Suggestions for Further Research
Considering the impact of both PAR meetings and business activity analysis meetings in
Modalfa, more research focusing on the processes of planning and control in the retailing
industry is suggested (see Ambler 2003b, pp. 29-30). It will possibly contribute to better
understand whether retailing requires specific forms of business planning and control.
Research on the use of accounting information by marketing managers in contexts
of business-to-business is also suggested, to ascertain to what extent in these businesses
the metrics recommended in the literature (e.g., CLV and CPA) have a higher relevance
than they have in retail and what are the factors that influence their use.
Another suggestion is related to control systems and the role of the marketing
departments in it (see Hope and Fraser 2003a, p. 52). The importance of controlling the
marketing management is evident. In the Modalfa case, even though the MD had
influential power, some marketing decisions were made by another department, e.g.,
prices, commercial promotions and product placement were managed by the commercial
department. The directors at Modalfa, i.e., the Director-General, the Operations Director
and the Commercial Director, gave evidence about the important role of the MD to
control the alignment of marketing management. Considering the positive experience of
Modalfa in using the MD as a non-financial controller of marketing decisions, it seems
interesting to investigate new forms of management control which may include the
marketing expertise in the process (see Johnson 1992, p. viii; Simons 1995b, p. 138). This
approach to management control is even more relevant when the marketing management
is dispersed by several functional departments across the organisation (see Webster Jr
1992).
More research on the relationship between difficult financial situations, the
functioning of the accounting system and the managers’ use of accounting information is
also suggested (see Figure 8-1). In Dimoda, the difficult financial situation limited
investments in technical and human management control resources, e.g., the management
accounting system software was not updated. This factor limited the ability of the
accounting system to meet the information needs of managers, which negatively affected
their work. If this situation negatively influences the company's performance, then it runs
the risk of entering a negative spiral. Subsequent studies may help to understand these
relationships.
Finally, it is noted that some marketing activities are sub-contracted to outside
agencies (outsourcing). This produces three consequences: (1) the companies that sub-
CHAPTER 8
296
contract the marketing services reduce the staff of their own MD; (2) their marketing
directors get closer to the CEO and the CFO, participating in strategic decisions; and (3)
their budgets for promotional activities are reduced, and budgets increase for brand
focused activities. This conclusion emerges from the interviews made in Modalfa and has
implications on how one interprets the results from quantitative research (e.g., Verhoef et
al. 2011) and may reveal that some conclusions may be skewed. There are two factors for
this bias: (1) companies may be using more financial metrics to assess marketing, but the
motivation may come from marketing agencies and not from the marketing departments
or their director; and (2) the reduction of staff in marketing departments, and eventually
the marketing budget, caused by efficiency savings in the use of external means, may be
related to subcontracting the marketing services to outside agencies and may not mean a
decrease in the importance of the MD within the company. This situation could be
exploited in future quantitative studies, e.g., changing or adding other variables to
distinguish these situations; or in qualitative research, e.g., to explore how marketing
outsourcing has implications in the use of accounting information to manage marketing.

297
APPENDICES

APPENDICES
298
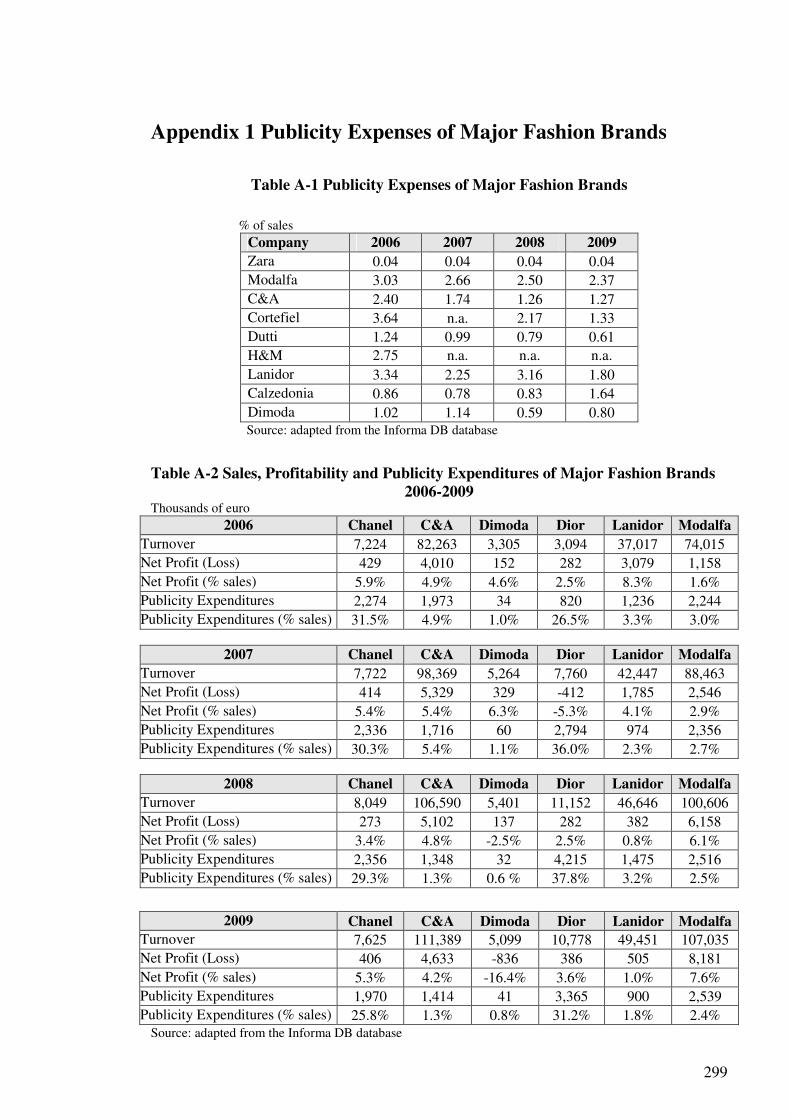
299
Appendix 1 Publicity Expenses of Major Fashion Brands
Table A-1 Publicity Expenses of Major Fashion Brands
% of sales Company 2006 2007 2008 2009 Zara 0.04 0.04 0.04 0.04 Modalfa 3.03 2.66 2.50 2.37 C&A 2.40 1.74 1.26 1.27 Cortefiel 3.64 n.a. 2.17 1.33 Dutti 1.24 0.99 0.79 0.61 H&M 2.75 n.a. n.a. n.a. Lanidor 3.34 2.25 3.16 1.80 Calzedonia 0.86 0.78 0.83 1.64 Dimoda 1.02 1.14 0.59 0.80
Source: adapted from the Informa DB database
Table A-2 Sales, Profitability and Publicity Expenditures of Major Fashion Brands
2006-2009 Thousands of euro
2006 Chanel C&A Dimoda Dior Lanidor Modalfa Turnover 7,224 82,263 3,305 3,094 37,017 74,015 Net Profit (Loss) 429 4,010 152 282 3,079 1,158 Net Profit (% sales) 5.9% 4.9% 4.6% 2.5% 8.3% 1.6% Publicity Expenditures 2,274 1,973 34 820 1,236 2,244 Publicity Expenditures (% sales) 31.5% 4.9% 1.0% 26.5% 3.3% 3.0%
2007 Chanel C&A Dimoda Dior Lanidor Modalfa
Turnover 7,722 98,369 5,264 7,760 42,447 88,463 Net Profit (Loss) 414 5,329 329 -412 1,785 2,546 Net Profit (% sales) 5.4% 5.4% 6.3% -5.3% 4.1% 2.9% Publicity Expenditures 2,336 1,716 60 2,794 974 2,356 Publicity Expenditures (% sales) 30.3% 5.4% 1.1% 36.0% 2.3% 2.7%
2008 Chanel C&A Dimoda Dior Lanidor Modalfa
Turnover 8,049 106,590 5,401 11,152 46,646 100,606 Net Profit (Loss) 273 5,102 137 282 382 6,158 Net Profit (% sales) 3.4% 4.8% -2.5% 2.5% 0.8% 6.1% Publicity Expenditures 2,356 1,348 32 4,215 1,475 2,516 Publicity Expenditures (% sales) 29.3% 1.3% 0.6 % 37.8% 3.2% 2.5%
2009 Chanel C&A Dimoda Dior Lanidor Modalfa Turnover 7,625 111,389 5,099 10,778 49,451 107,035 Net Profit (Loss) 406 4,633 -836 386 505 8,181 Net Profit (% sales) 5.3% 4.2% -16.4% 3.6% 1.0% 7.6% Publicity Expenditures 1,970 1,414 41 3,365 900 2,539 Publicity Expenditures (% sales) 25.8% 1.3% 0.8% 31.2% 1.8% 2.4%
Source: adapted from the Informa DB database

APPENDICES
300
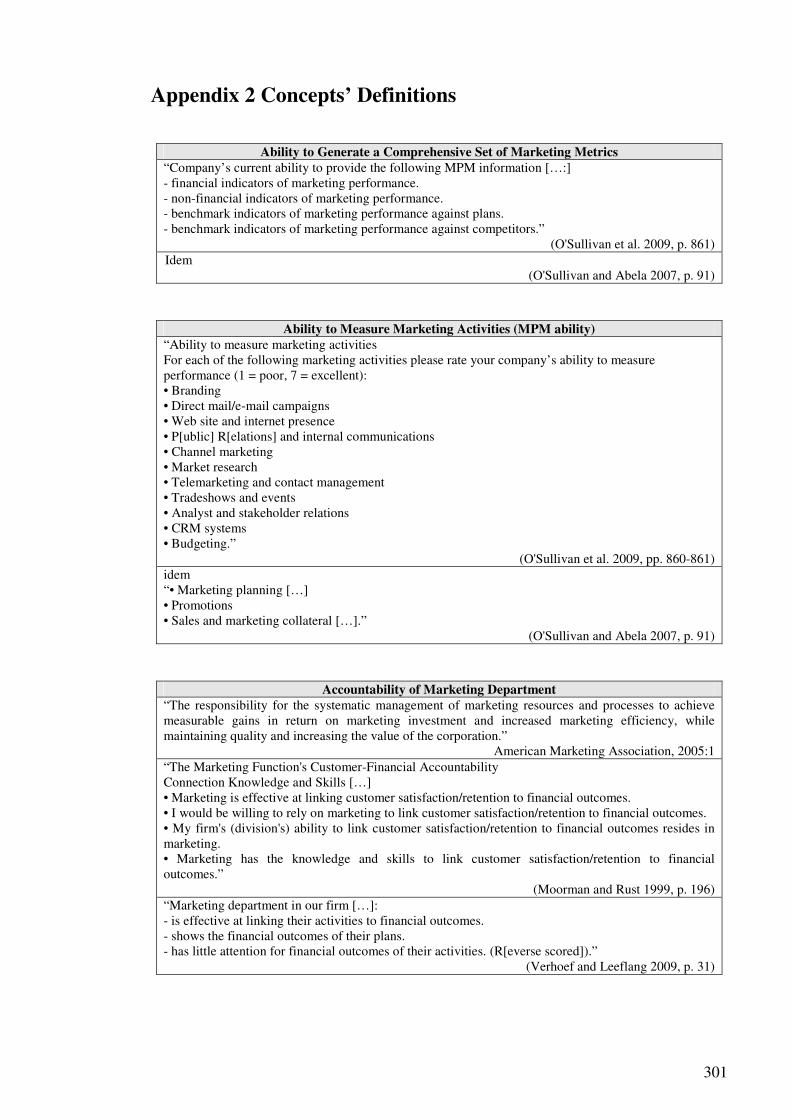
301
Appendix 2 Concepts’ Definitions
Ability to Generate a Comprehensive Set of Marketing Metrics “Company’s current ability to provide the following MPM information […:] - financial indicators of marketing performance. - non-financial indicators of marketing performance. - benchmark indicators of marketing performance against plans. - benchmark indicators of marketing performance against competitors.”
(O'Sullivan et al. 2009, p. 861) Idem
(O'Sullivan and Abela 2007, p. 91)
Ability to Measure Marketing Activities (MPM ability) “Ability to measure marketing activities For each of the following marketing activities please rate your company’s ability to measure performance (1 = poor, 7 = excellent): • Branding • Direct mail/e-mail campaigns • Web site and internet presence • P[ublic] R[elations] and internal communications • Channel marketing • Market research • Telemarketing and contact management • Tradeshows and events • Analyst and stakeholder relations • CRM systems • Budgeting.”
(O'Sullivan et al. 2009, pp. 860-861) idem “• Marketing planning […] • Promotions • Sales and marketing collateral […].”
(O'Sullivan and Abela 2007, p. 91)
Accountability of Marketing Department “The responsibility for the systematic management of marketing resources and processes to achieve measurable gains in return on marketing investment and increased marketing efficiency, while maintaining quality and increasing the value of the corporation.”
American Marketing Association, 2005:1 “The Marketing Function's Customer-Financial Accountability Connection Knowledge and Skills […] • Marketing is effective at linking customer satisfaction/retention to financial outcomes. • I would be willing to rely on marketing to link customer satisfaction/retention to financial outcomes. • My firm's (division's) ability to link customer satisfaction/retention to financial outcomes resides in marketing. • Marketing has the knowledge and skills to link customer satisfaction/retention to financial outcomes.”
(Moorman and Rust 1999, p. 196) “Marketing department in our firm […]: - is effective at linking their activities to financial outcomes. - shows the financial outcomes of their plans. - has little attention for financial outcomes of their activities. (R[everse scored]).”
(Verhoef and Leeflang 2009, p. 31)

APPENDICES
302
Accounting Information “Accounting information is quantitative, relates to an entity, is based on observation, and is prepared according to rules.”
(McKinnon and Bruns 1992, p. 4)
Brand “Can be either: a name, term, symbol or design (or a combination of them) which identifies one or more products (mostly used in the USA); the identification plus the product itself and its packing, i.e. the gestalt (mostly used in the UK). For example, ‘‘A product is something that is made, in a factory; a brand is something that is bought, by a customer. A product can be copied by a competitor; a brand is unique. A product can be quickly outdated; a successful brand is timeless’’ (Stephen King).” (Emphasis and quote in original)
(Ambler 2003b, pp. 280-281) “A product or service’s brand is actually a collection of beliefs – a core belief that the customer has about the product or service and then a compilation of data/memories (experiences, information, stories from others, observations, etc.) that support/reinforce this core belief. This opinion – what the product or service means to the customer – is the essence of that product or service’s brand.” (emphasis in original)
(Nordhielm 2006, p. 9) “The set of physical attributes of a product or service, together with the beliefs and expectations surrounding it – a unique combination which the name or logo of the product or service should evoke in the mind of the audience.”
The Chartered Institute of Marketing (CIM), 2012, www.cim.co.uk
Brand Activation “Brand Activation is the smooth integration of all available means of communication in a creative platform to activate consumers. Activate means the stimulation of: 1 interest 2 trial 3 loyalty”
www.brandbase.nl/visie
Brand Equity “An important intangible asset for the company, it can be seen as the reservoir of results gained by good marketing but not yet delivered to the profit and loss account.”
(Ambler 2003b, p. 281) “A set of associations and behaviours on the part of a brand’s customers, channel members and parent corporation that permits the brand to earn greater volume or greater margins than it could without the brand name and that gives a strong, sustainable and differential advantage.”
(Srivastava and Shocker 1991, p. 5)
Customer focused (Customer oriented) “Where all the operations of a company are carried out with the customer in mind; not just marketing activities but also logistics, R&D and finance.”
(Ambler 2003b, p. 287)
Four Ps “Shorthand term for the classic elements of marketing: product, price, place and promotion. ‘‘Place’’ refers to sales and distribution and ‘‘promotion’’ here includes all forms of marketing communications.”
(Ambler 2003b, p. 290)
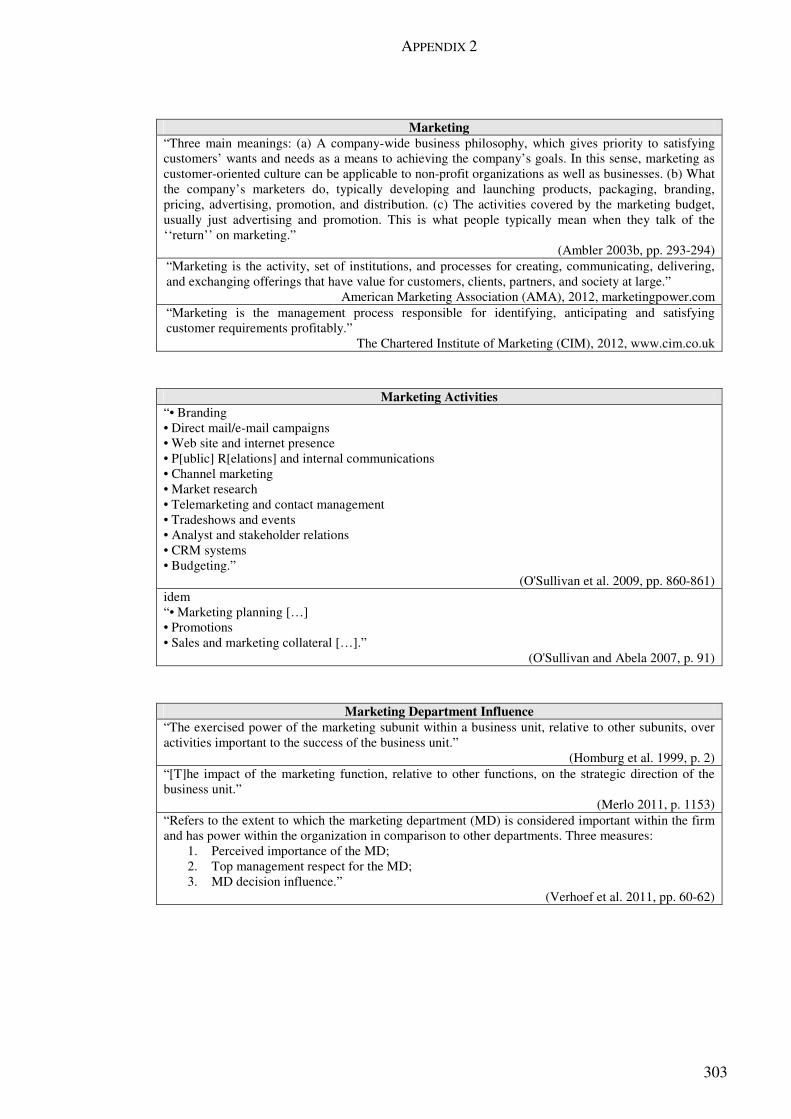
APPENDIX 2
303
Marketing “Three main meanings: (a) A company-wide business philosophy, which gives priority to satisfying customers’ wants and needs as a means to achieving the company’s goals. In this sense, marketing as customer-oriented culture can be applicable to non-profit organizations as well as businesses. (b) What the company’s marketers do, typically developing and launching products, packaging, branding, pricing, advertising, promotion, and distribution. (c) The activities covered by the marketing budget, usually just advertising and promotion. This is what people typically mean when they talk of the ‘‘return’’ on marketing.”
(Ambler 2003b, pp. 293-294) “Marketing is the activity, set of institutions, and processes for creating, communicating, delivering, and exchanging offerings that have value for customers, clients, partners, and society at large.”
American Marketing Association (AMA), 2012, marketingpower.com “Marketing is the management process responsible for identifying, anticipating and satisfying customer requirements profitably.”
The Chartered Institute of Marketing (CIM), 2012, www.cim.co.uk
Marketing Activities “• Branding • Direct mail/e-mail campaigns • Web site and internet presence • P[ublic] R[elations] and internal communications • Channel marketing • Market research • Telemarketing and contact management • Tradeshows and events • Analyst and stakeholder relations • CRM systems • Budgeting.”
(O'Sullivan et al. 2009, pp. 860-861) idem “• Marketing planning […] • Promotions • Sales and marketing collateral […].”
(O'Sullivan and Abela 2007, p. 91)
Marketing Department Influence “The exercised power of the marketing subunit within a business unit, relative to other subunits, over activities important to the success of the business unit.”
(Homburg et al. 1999, p. 2) “[T]he impact of the marketing function, relative to other functions, on the strategic direction of the business unit.”
(Merlo 2011, p. 1153) “Refers to the extent to which the marketing department (MD) is considered important within the firm and has power within the organization in comparison to other departments. Three measures:
1. Perceived importance of the MD; 2. Top management respect for the MD; 3. MD decision influence.”
(Verhoef et al. 2011, pp. 60-62)
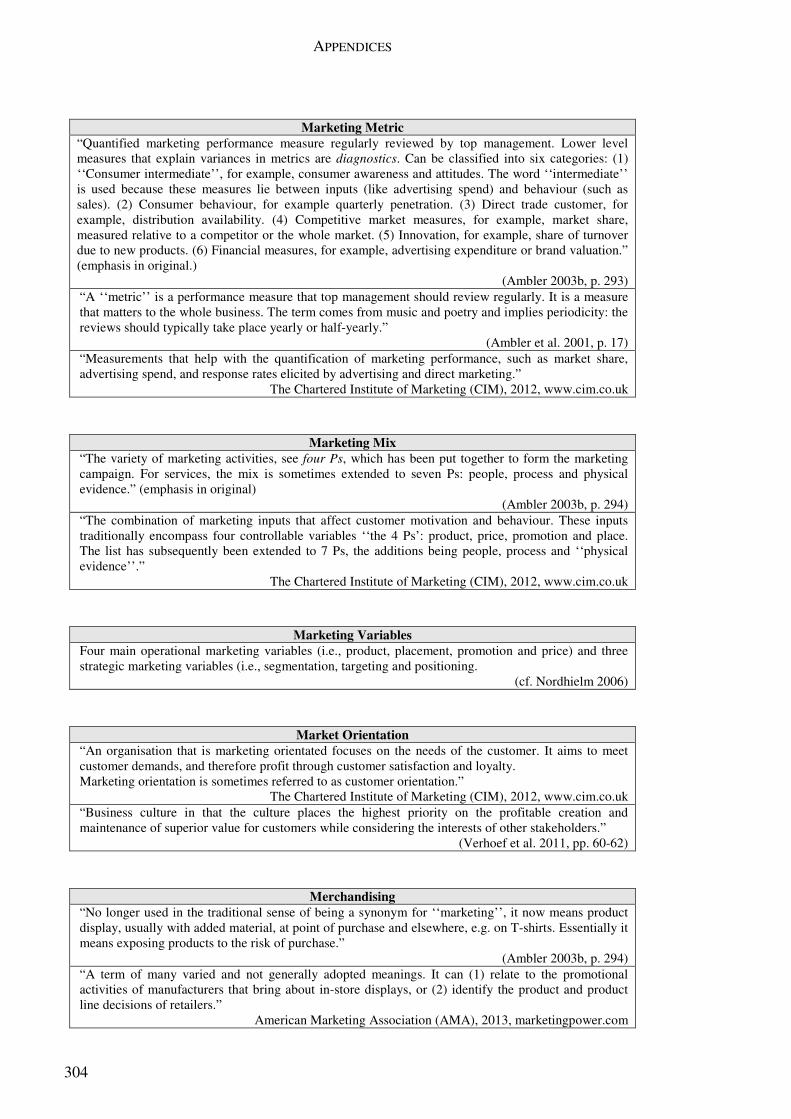
APPENDICES
304
Marketing Metric “Quantified marketing performance measure regularly reviewed by top management. Lower level measures that explain variances in metrics are diagnostics. Can be classified into six categories: (1) ‘‘Consumer intermediate’’, for example, consumer awareness and attitudes. The word ‘‘intermediate’’ is used because these measures lie between inputs (like advertising spend) and behaviour (such as sales). (2) Consumer behaviour, for example quarterly penetration. (3) Direct trade customer, for example, distribution availability. (4) Competitive market measures, for example, market share, measured relative to a competitor or the whole market. (5) Innovation, for example, share of turnover due to new products. (6) Financial measures, for example, advertising expenditure or brand valuation.” (emphasis in original.)
(Ambler 2003b, p. 293) “A ‘‘metric’’ is a performance measure that top management should review regularly. It is a measure that matters to the whole business. The term comes from music and poetry and implies periodicity: the reviews should typically take place yearly or half-yearly.”
(Ambler et al. 2001, p. 17) “Measurements that help with the quantification of marketing performance, such as market share, advertising spend, and response rates elicited by advertising and direct marketing.”
The Chartered Institute of Marketing (CIM), 2012, www.cim.co.uk
Marketing Mix “The variety of marketing activities, see four Ps, which has been put together to form the marketing campaign. For services, the mix is sometimes extended to seven Ps: people, process and physical evidence.” (emphasis in original)
(Ambler 2003b, p. 294) “The combination of marketing inputs that affect customer motivation and behaviour. These inputs traditionally encompass four controllable variables ‘‘the 4 Ps’: product, price, promotion and place. The list has subsequently been extended to 7 Ps, the additions being people, process and ‘‘physical evidence’’.”
The Chartered Institute of Marketing (CIM), 2012, www.cim.co.uk
Marketing Variables Four main operational marketing variables (i.e., product, placement, promotion and price) and three strategic marketing variables (i.e., segmentation, targeting and positioning.
(cf. Nordhielm 2006)
Market Orientation “An organisation that is marketing orientated focuses on the needs of the customer. It aims to meet customer demands, and therefore profit through customer satisfaction and loyalty. Marketing orientation is sometimes referred to as customer orientation.”
The Chartered Institute of Marketing (CIM), 2012, www.cim.co.uk “Business culture in that the culture places the highest priority on the profitable creation and maintenance of superior value for customers while considering the interests of other stakeholders.”
(Verhoef et al. 2011, pp. 60-62)
Merchandising “No longer used in the traditional sense of being a synonym for ‘‘marketing’’, it now means product display, usually with added material, at point of purchase and elsewhere, e.g. on T-shirts. Essentially it means exposing products to the risk of purchase.”
(Ambler 2003b, p. 294) “A term of many varied and not generally adopted meanings. It can (1) relate to the promotional activities of manufacturers that bring about in-store displays, or (2) identify the product and product line decisions of retailers.”
American Marketing Association (AMA), 2013, marketingpower.com
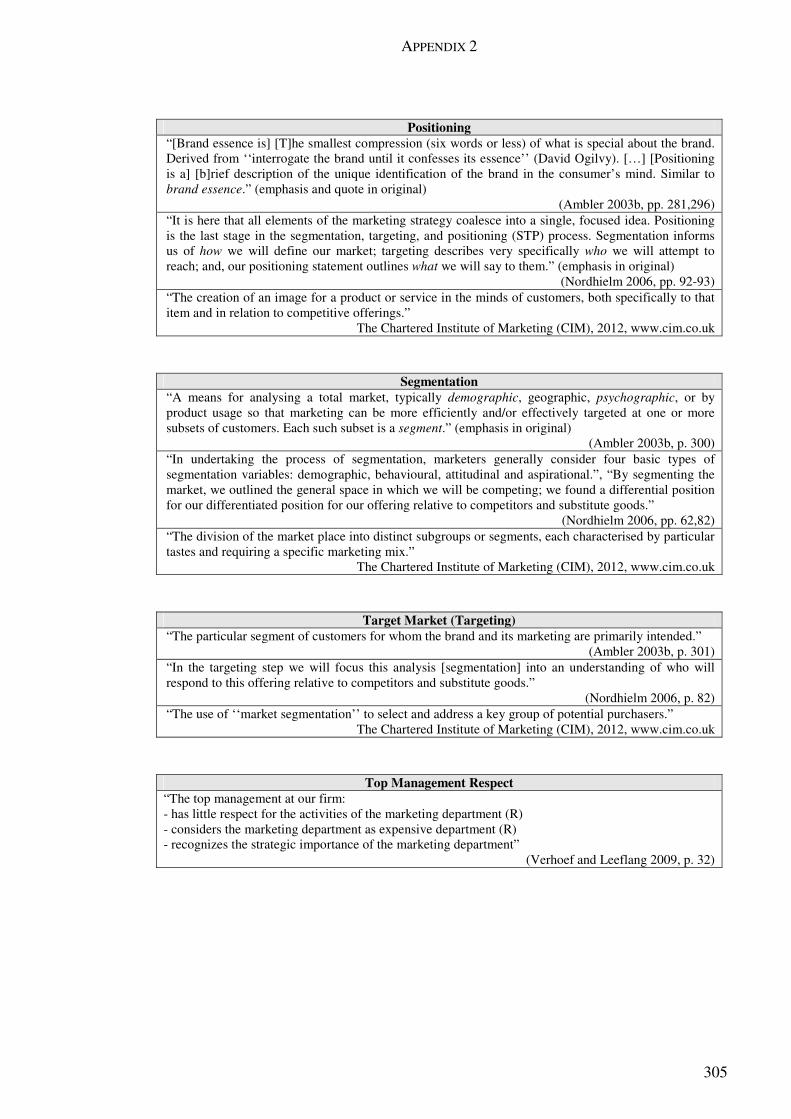
APPENDIX 2
305
Positioning “[Brand essence is] [T]he smallest compression (six words or less) of what is special about the brand. Derived from ‘‘interrogate the brand until it confesses its essence’’ (David Ogilvy). […] [Positioning is a] [b]rief description of the unique identification of the brand in the consumer’s mind. Similar to brand essence.” (emphasis and quote in original)
(Ambler 2003b, pp. 281,296) “It is here that all elements of the marketing strategy coalesce into a single, focused idea. Positioning is the last stage in the segmentation, targeting, and positioning (STP) process. Segmentation informs us of how we will define our market; targeting describes very specifically who we will attempt to reach; and, our positioning statement outlines what we will say to them.” (emphasis in original)
(Nordhielm 2006, pp. 92-93) “The creation of an image for a product or service in the minds of customers, both specifically to that item and in relation to competitive offerings.”
The Chartered Institute of Marketing (CIM), 2012, www.cim.co.uk
Segmentation “A means for analysing a total market, typically demographic, geographic, psychographic, or by product usage so that marketing can be more efficiently and/or effectively targeted at one or more subsets of customers. Each such subset is a segment.” (emphasis in original)
(Ambler 2003b, p. 300) “In undertaking the process of segmentation, marketers generally consider four basic types of segmentation variables: demographic, behavioural, attitudinal and aspirational.”, “By segmenting the market, we outlined the general space in which we will be competing; we found a differential position for our differentiated position for our offering relative to competitors and substitute goods.”
(Nordhielm 2006, pp. 62,82) “The division of the market place into distinct subgroups or segments, each characterised by particular tastes and requiring a specific marketing mix.”
The Chartered Institute of Marketing (CIM), 2012, www.cim.co.uk
Target Market (Targeting) “The particular segment of customers for whom the brand and its marketing are primarily intended.”
(Ambler 2003b, p. 301) “In the targeting step we will focus this analysis [segmentation] into an understanding of who will respond to this offering relative to competitors and substitute goods.”
(Nordhielm 2006, p. 82) “The use of ‘‘market segmentation’’ to select and address a key group of potential purchasers.”
The Chartered Institute of Marketing (CIM), 2012, www.cim.co.uk
Top Management Respect “The top management at our firm: - has little respect for the activities of the marketing department (R) - considers the marketing department as expensive department (R) - recognizes the strategic importance of the marketing department”
(Verhoef and Leeflang 2009, p. 32)

APPENDICES
306
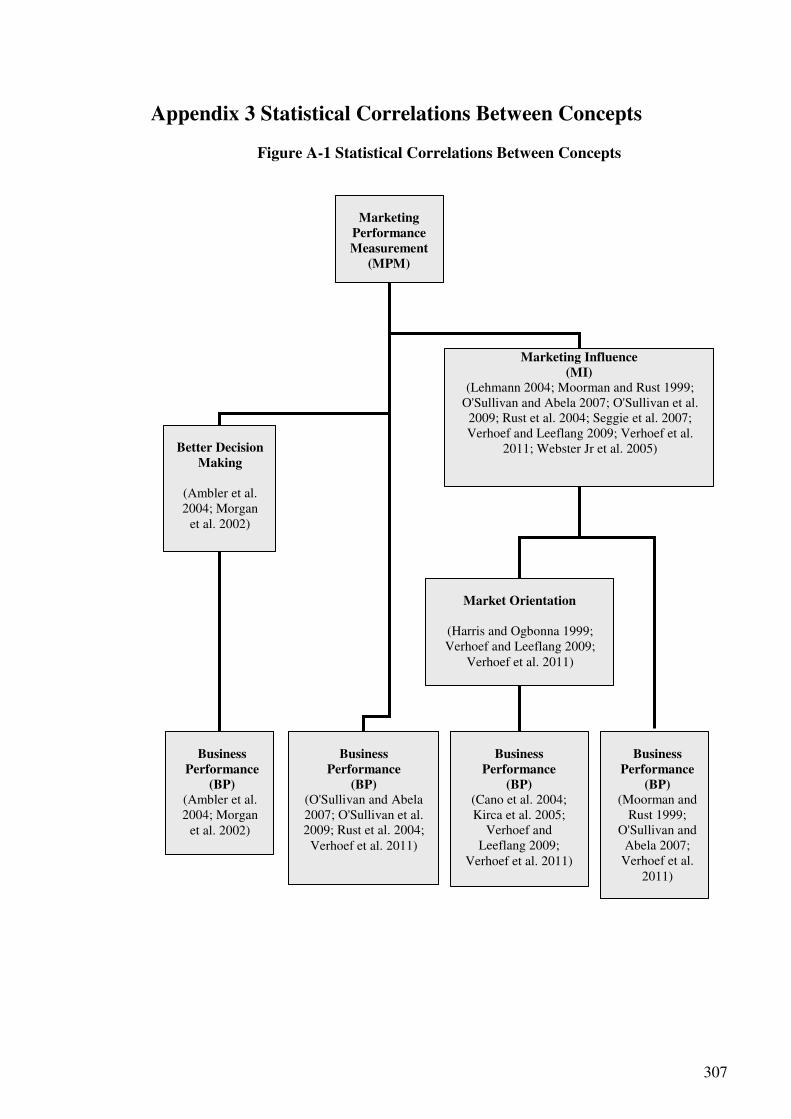
307
Appendix 3 Statistical Correlations Between Concepts
Figure A-1 Statistical Correlations Between Concepts
Marketing
Performance Measurement
(MPM)
Better Decision
Making
(Ambler et al. 2004; Morgan
et al. 2002)
Business
Performance (BP)
(O'Sullivan and Abela 2007; O'Sullivan et al. 2009; Rust et al. 2004;
Verhoef et al. 2011)
Marketing Influence (MI)
(Lehmann 2004; Moorman and Rust 1999; O'Sullivan and Abela 2007; O'Sullivan et al. 2009; Rust et al. 2004; Seggie et al. 2007; Verhoef and Leeflang 2009; Verhoef et al.
2011; Webster Jr et al. 2005)
Market Orientation
(Harris and Ogbonna 1999; Verhoef and Leeflang 2009;
Verhoef et al. 2011)
Business
Performance (BP)
(Cano et al. 2004; Kirca et al. 2005;
Verhoef and Leeflang 2009;
Verhoef et al. 2011)
Business
Performance (BP)
(Ambler et al. 2004; Morgan
et al. 2002)
Business
Performance (BP)
(Moorman and Rust 1999;
O'Sullivan and Abela 2007;
Verhoef et al. 2011)

APPENDICES
308
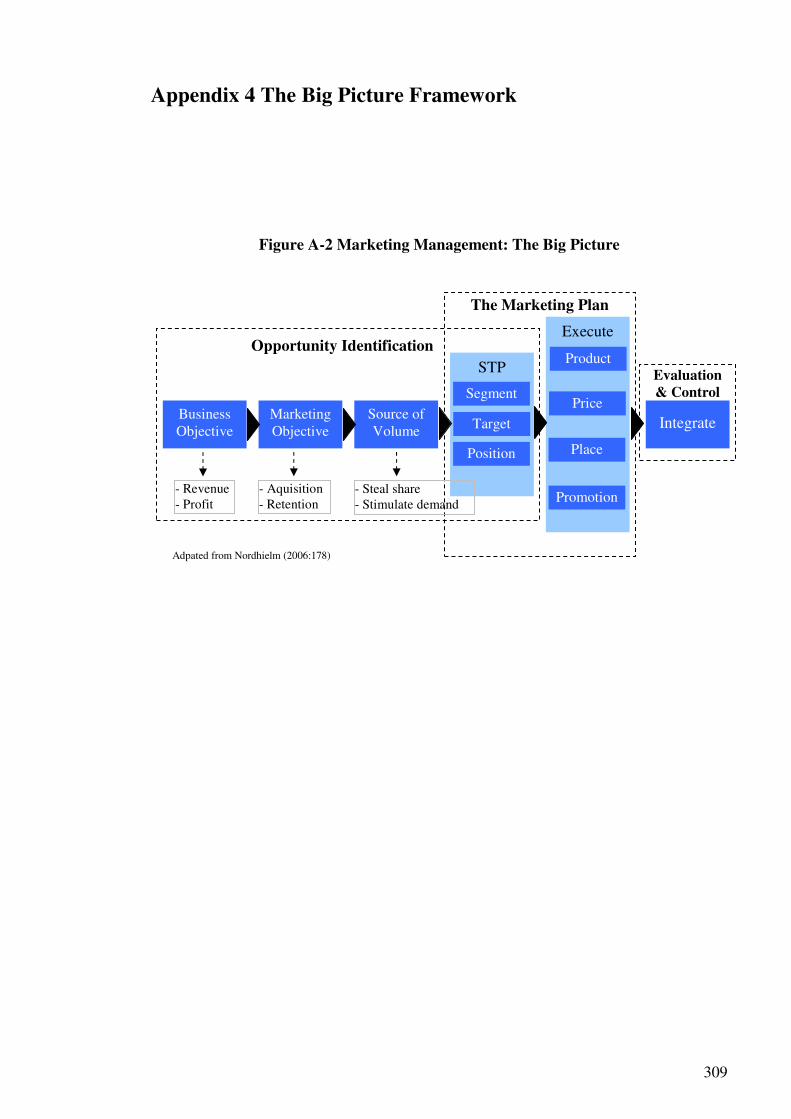
309
Appendix 4 The Big Picture Framework
Figure A-2 Marketing Management: The Big Picture
Business Objective
Marketing Objective
Source of Volume
STP
Execute
Integrate
The Marketing Plan
Opportunity Identification
Evaluation & Control Segment
Position
Adpated from Nordhielm (2006:178)
Product
Price
Place
Promotion
Target
- Revenue - Profit
- Aquisition - Retention
- Steal share - Stimulate demand

APPENDICES
310
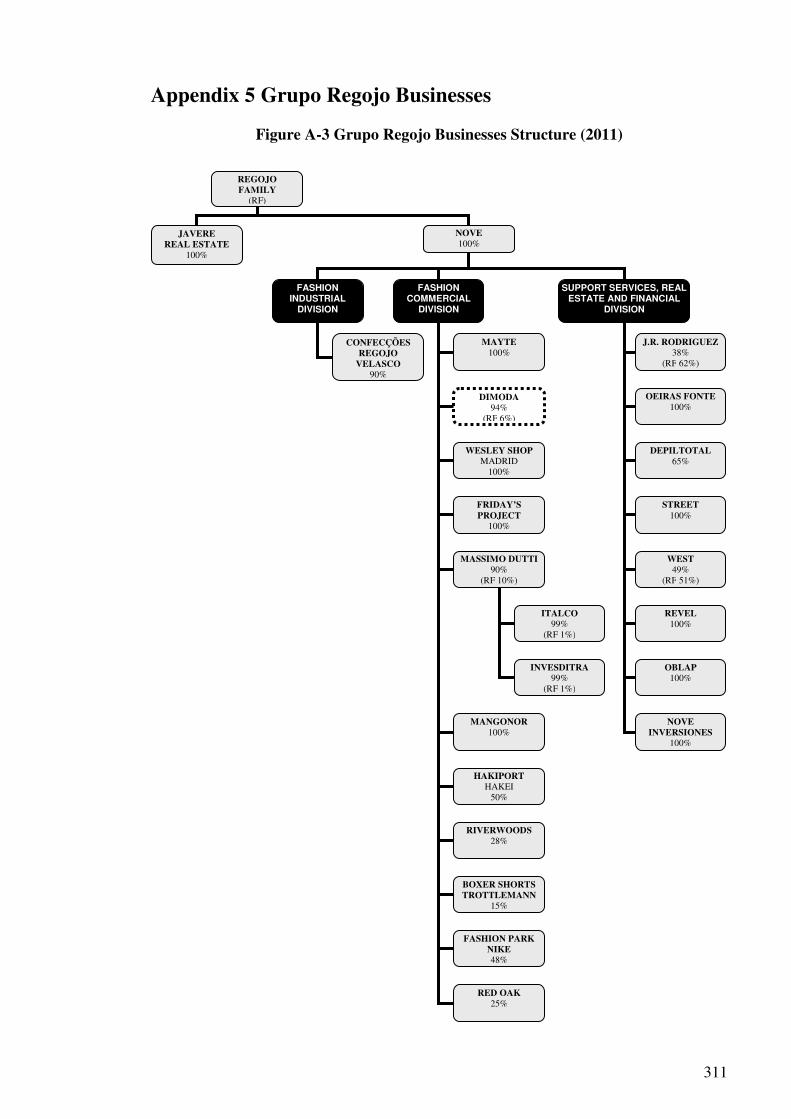
311
Appendix 5 Grupo Regojo Businesses
Figure A-3 Grupo Regojo Businesses Structure (2011)
REGOJO FAMILY
(RF)
JAVERE REAL ESTATE
100%
NOVE 100%
FASHION
INDUSTRIAL
DIVISION
FASHION
COMMERCIAL
DIVISION
MAYTE 100%
DIMODA 94%
(RF 6%)
WESLEY SHOP MADRID
100%
FRIDAY’S PROJECT
100%
MASSIMO DUTTI 90%
(RF 10%)
MANGONOR 100%
HAKIPORT HAKEI
50%
CONFECÇÕES REGOJO
VELASCO 90%
SUPPORT SERVICES, REAL
ESTATE AND FINANCIAL
DIVISION
J.R. RODRIGUEZ 38%
(RF 62%)
OEIRAS FONTE 100%
DEPILTOTAL 65%
STREET 100%
WEST 49%
(RF 51%)
REVEL 100%
OBLAP 100%
ITALCO 99%
(RF 1%)
INVESDITRA 99%
(RF 1%)
RIVERWOODS 28%
BOXER SHORTS TROTTLEMANN
15%
FASHION PARK NIKE 48%
RED OAK 25%
NOVE INVERSIONES
100%
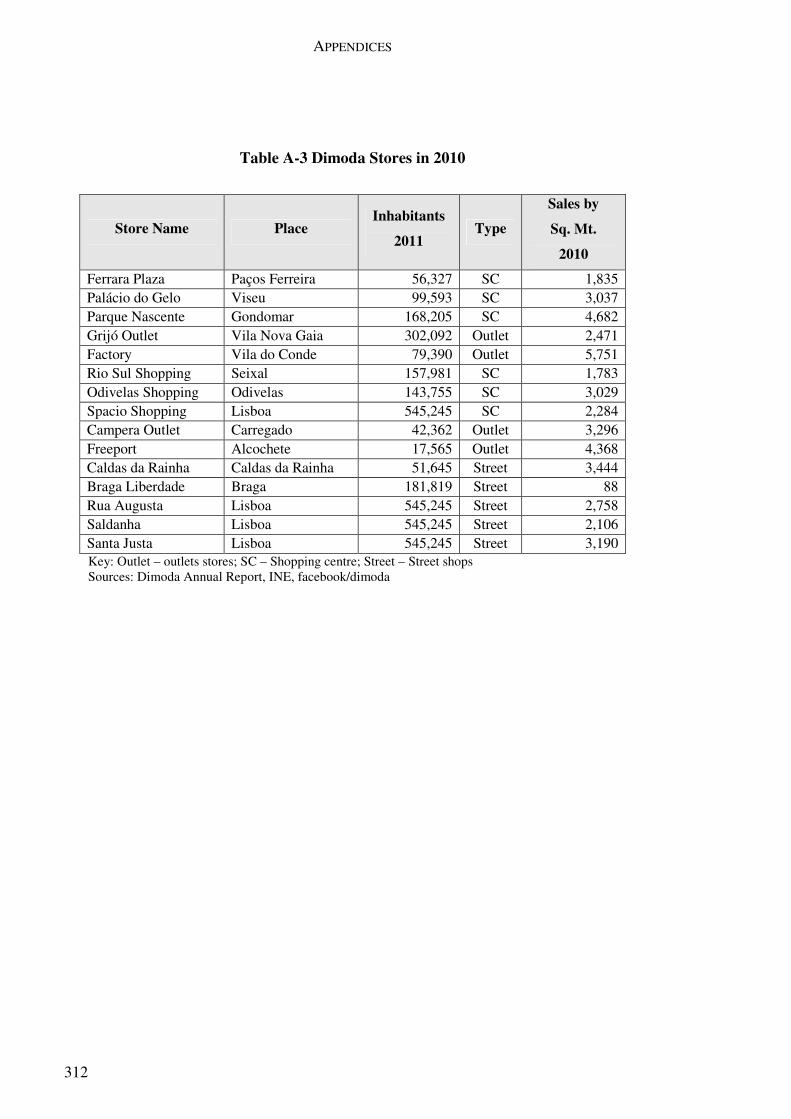
APPENDICES
312
Table A-3 Dimoda Stores in 2010
Store Name Place Inhabitants
2011 Type
Sales by
Sq. Mt.
2010
Ferrara Plaza Paços Ferreira 56,327 SC 1,835 Palácio do Gelo Viseu 99,593 SC 3,037 Parque Nascente Gondomar 168,205 SC 4,682 Grijó Outlet Vila Nova Gaia 302,092 Outlet 2,471 Factory Vila do Conde 79,390 Outlet 5,751 Rio Sul Shopping Seixal 157,981 SC 1,783 Odivelas Shopping Odivelas 143,755 SC 3,029 Spacio Shopping Lisboa 545,245 SC 2,284 Campera Outlet Carregado 42,362 Outlet 3,296 Freeport Alcochete 17,565 Outlet 4,368 Caldas da Rainha Caldas da Rainha 51,645 Street 3,444 Braga Liberdade Braga 181,819 Street 88 Rua Augusta Lisboa 545,245 Street 2,758 Saldanha Lisboa 545,245 Street 2,106 Santa Justa Lisboa 545,245 Street 3,190
Key: Outlet – outlets stores; SC – Shopping centre; Street – Street shops Sources: Dimoda Annual Report, INE, facebook/dimoda
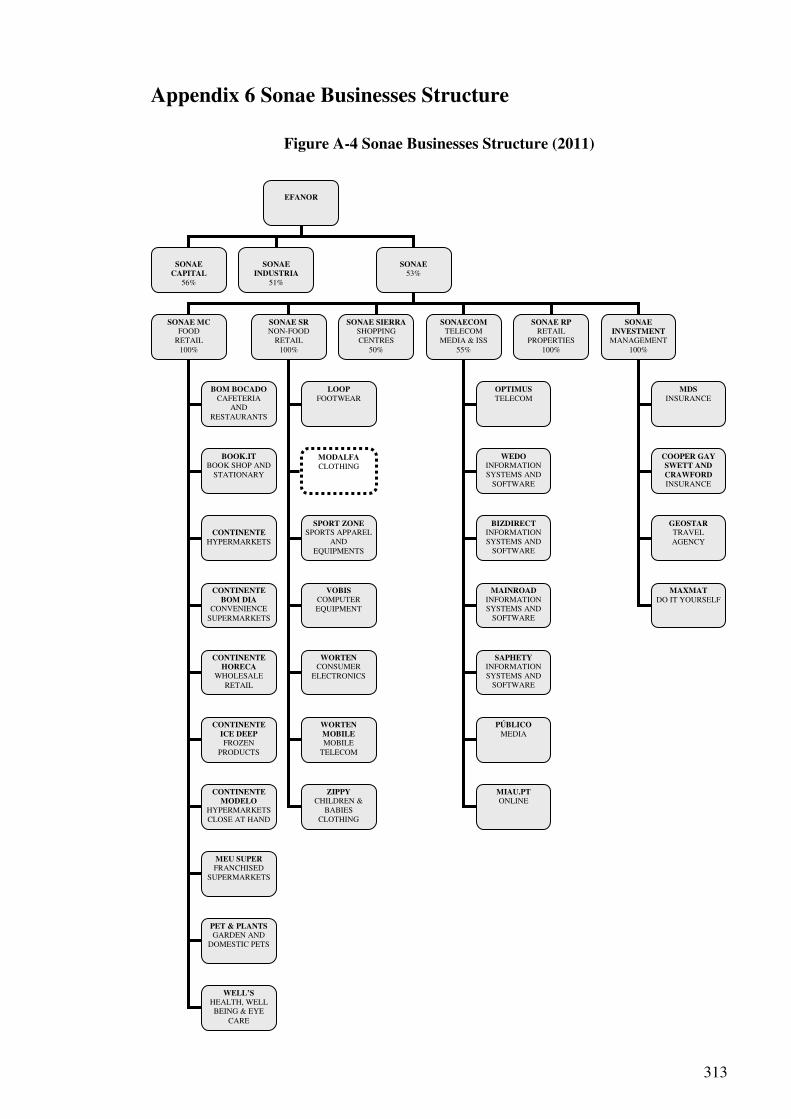
313
Appendix 6 Sonae Businesses Structure
Figure A-4 Sonae Businesses Structure (2011)
EFANOR
SONAE
CAPITAL 56%
SONAE
INDUSTRIA 51%
SONAE
53%
SONAE MC FOOD
RETAIL 100%
SONAE SR NON-FOOD
RETAIL 100%
SONAE SIERRA SHOPPING CENTRES
50%
SONAECOM TELECOM
MEDIA & ISS 55%
SONAE RP RETAIL
PROPERTIES 100%
SONAE INVESTMENT
MANAGEMENT 100%
BOM BOCADO CAFETERIA
AND RESTAURANTS
BOOK.IT BOOK SHOP AND
STATIONARY
CONTINENTE
HYPERMARKETS
CONTINENTE BOM DIA
CONVENIENCE SUPERMARKETS
CONTINENTE HORECA
WHOLESALE RETAIL
CONTINENTE ICE DEEP FROZEN
PRODUCTS
CONTINENTE MODELO
HYPERMARKETS CLOSE AT HAND
MEU SUPER FRANCHISED
SUPERMARKETS
PET & PLANTS GARDEN AND
DOMESTIC PETS
WELL’S HEALTH, WELL BEING & EYE
CARE
LOOP FOOTWEAR
MODALFA CLOTHING
SPORT ZONE SPORTS APPAREL
AND EQUIPMENTS
VOBIS COMPUTER EQUIPMENT
WORTEN CONSUMER
ELECTRONICS
WORTEN MOBILE MOBILE
TELECOM
ZIPPY CHILDREN &
BABIES CLOTHING
OPTIMUS TELECOM
WEDO INFORMATION SYSTEMS AND
SOFTWARE
BIZDIRECT INFORMATION SYSTEMS AND
SOFTWARE
MAINROAD INFORMATION SYSTEMS AND
SOFTWARE
SAPHETY INFORMATION SYSTEMS AND
SOFTWARE
PÚBLICO MEDIA
MIAU.PT ONLINE
MDS INSURANCE
COOPER GAY SWETT AND CRAWFORD INSURANCE
GEOSTAR TRAVEL AGENCY
MAXMAT DO IT YOURSELF

APPENDICES
314
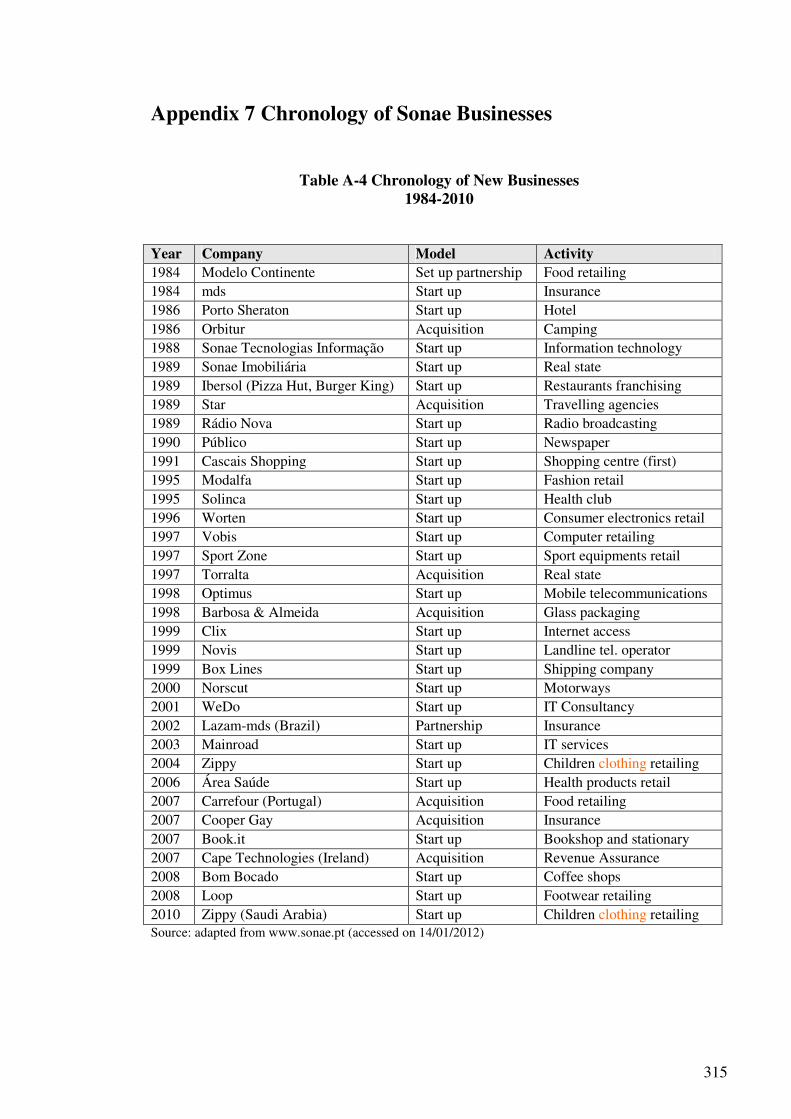
315
Appendix 7 Chronology of Sonae Businesses
Table A-4 Chronology of New Businesses 1984-2010
Year Company Model Activity 1984 Modelo Continente Set up partnership Food retailing 1984 mds Start up Insurance 1986 Porto Sheraton Start up Hotel 1986 Orbitur Acquisition Camping 1988 Sonae Tecnologias Informação Start up Information technology 1989 Sonae Imobiliária Start up Real state 1989 Ibersol (Pizza Hut, Burger King) Start up Restaurants franchising 1989 Star Acquisition Travelling agencies 1989 Rádio Nova Start up Radio broadcasting 1990 Público Start up Newspaper 1991 Cascais Shopping Start up Shopping centre (first) 1995 Modalfa Start up Fashion retail 1995 Solinca Start up Health club 1996 Worten Start up Consumer electronics retail 1997 Vobis Start up Computer retailing 1997 Sport Zone Start up Sport equipments retail 1997 Torralta Acquisition Real state 1998 Optimus Start up Mobile telecommunications 1998 Barbosa & Almeida Acquisition Glass packaging 1999 Clix Start up Internet access 1999 Novis Start up Landline tel. operator 1999 Box Lines Start up Shipping company 2000 Norscut Start up Motorways 2001 WeDo Start up IT Consultancy 2002 Lazam-mds (Brazil) Partnership Insurance 2003 Mainroad Start up IT services 2004 Zippy Start up Children clothing retailing 2006 Área Saúde Start up Health products retail 2007 Carrefour (Portugal) Acquisition Food retailing 2007 Cooper Gay Acquisition Insurance 2007 Book.it Start up Bookshop and stationary 2007 Cape Technologies (Ireland) Acquisition Revenue Assurance 2008 Bom Bocado Start up Coffee shops 2008 Loop Start up Footwear retailing 2010 Zippy (Saudi Arabia) Start up Children clothing retailing Source: adapted from www.sonae.pt (accessed on 14/01/2012)

APPENDICES
316

317
REFERENCES Abernethy, M. A. and Brownell, P. 1999. The role of budgets in organizations facing strategic change: an exploratory study. Accounting, Organizations and Society 24(3), pp. 189-204.
Abernethy, M. A. and Lillis, A. M. 1995. The impact of manufacturing flexibility on management control system design. Accounting, Organizations and Society 20(4), pp. 241-258.
Adler, L. 1967. Systems approach to marketing. Harvard Business Review 45(3), pp. 105-118.
Agbejule, A. and Jokipii, A. 2009. Strategy, control activities, monitoring and effectiveness. Managerial Auditing Journal 24(6), pp. 500-522.
Ahrens, T. and Chapman, C. S. 2007. Management accounting as practice. Accounting,
Organizations and Society 32(1/2), pp. 1-27.
Ailawadi, K. L. et al. 2009. Communication and promotion decisions in retailing: a review and directions for future research. Journal of Retailing 85(1), pp. 42-55.
Alves, M. G. 2010. Information needs and the decision process - Perceptions of managers and accountants. In: 2nd IEEE International Conference on Information and Financial
Engineering. IEEE, pp. 547-550.
Ambler, T. 2003a. Are you a wimp or a warrior? Marketing 23(October), pp. 22-23.
Ambler, T. 2003b. Marketing at the bottom line. 2nd ed. London: Prentice Hall.
Ambler, T. et al. 2001. Market metrics: what should we tell the shareholders? Centre for Business Performance - Institute of Chartered Accountants in England and Wales.
Ambler, T. et al. 2004. Assessing marketing performance: reasons for metrics selection. Journal of Marketing Management 20(3/4), pp. 475-498.
Ambler, T. and Roberts, J. H. 2008. Assessing marketing performance: don't settle for a silver metric. Journal of Marketing Management 24(7), pp. 733-750.

REFERENCES
318
Anderson, M. H. 2008. Social networks and the cognitive motivation to realize network opportunities: A study of managers' information gathering behaviors. Journal of
Organizational Behavior 29(1), pp. 51-78.
Anderson, P. F. 1982. Marketing, strategic planning and the theory of the firm. Journal of
Marketing 46(2), pp. 15-26.
Andon, P. et al. 2001. Calculating the economic value of customers to an organisation. Australian Accounting Review 11(23), pp. 62-72.
Anthony, R. N. 1960. Management accounting: text and cases. Homewood: Richard D. Irwin.
Anthony, R. N. and Govindarajan, V. 2003. Management control systems. 11th ed. New York: McGraw-Hill/Irwin.
Anthony, R. N. et al. 2010. Accounting: text and cases. 12th ed. New Delhi: Tata McGraw-Hill.
Auty, S. 1998. Fashion involvement, self-monitoring and the meaning of brands. The
Journal of Product & Brand Management 7(2), pp. 109-123.
Baker, S. and Holt, S. 2004. Making marketers accountable: a failure of marketing education? Marketing Intelligence & Planning 22(5), pp. 557-567.
Baldvinsdottir, G. et al. 2010. Issues in the relationship between theory and practice in management accounting. Management Accounting Research 21(2), pp. 79-82.
Banker, R. D. and Hughes, J. S. 1994. Product costing and pricing. The Accounting
Review 69(3), pp. 479-494.
Barker, T. 2008. Exploring the differences between accountants and marketers in terms of information sharing. Marketing Intelligence & Planning 26(3), pp. 316-329.
Barwise, P. and Farley, J. U. 2004. Marketing metrics: status of six metrics in five countries. European Management Journal 22(3), pp. 257-262.
Bates, K. and Whittington, M. 2009. The customer is king. Enthroned or in exile? An analysis of the level of customer focus in leading management accounting textbooks. Accounting Education 18(3), pp. 291-317.

REFERENCES
319
Baxendale, S. et al. 2006. The selection of actionable cost objects for an activity-based costing system. Management Accounting Quarterly 7(3), pp. 9-13.
Beik, L. L. and Buzby, S. L. 1973. Profitability analysis by market segments. Journal of
Marketing 37(3), pp. 48-53.
Beyer, R. and Trawicki, D. J. 1972. Profitability accounting for planning and control. New York: Ronald Press.
Bick, G. N. 2009. Increasing shareholder value through building customer and brand equity. Journal of Marketing Management 25(1/2), pp. 117-141.
Birnberg, J. G. et al. 2006. Psychology theory in management accounting research. In: C. S. Chapman, A.G.H., and M. D. Shields ed. Handbook of Management Accounting
Research. Vol. 1. Oxford: Elsevier, pp. 113-135.
Bisbe, J. and Otley, D. 2004. The effects of the interactive use of management control systems on product innovation. Accounting, Organizations and Society 29(8), pp. 709-737.
Blattberg, R. C. 1993. Customer equity: an alternative to brand equity.Working paper. Northwestern University
Bromwich, M. 1990. The case for strategic management accounting: the role of accounting information for strategy in competitive markets. Accounting, Organizations
and Society 15(1/2), pp. 27-46.
Bromwich, M. 2000. Thoughts on management accounting and strategy. Pacific
Accounting Review 11(1/2), pp. 41-48.
Bromwich, M. and Bhimani, A. 1989. Management accounting: evolution not revolution. London: CIMA.
Bromwich, M. and Bhimani, A. 1994. Management accounting: pathways to progress. London: CIMA.
Brown, S. W. et al. 2005. Marketing renaissance: opportunities and imperatives for improving marketing thought, practice, and infrastructure. Journal of Marketing 69(4), pp. 1-25.
REFERENCES
320
Bryman, A. and Bell, E. 2007. Business research methods. New York: Oxford University Press.
Burns, J. and Vaivio, J. 2001. Management accounting change. Management Accounting
Research 12(4), pp. 389-402.
Cabral, L. 2000. Introduction to industrial organization. Cambridge: MIT Press.
Cano, C. R. et al. 2004. A meta-analysis of the relationship between market orientation and business performance: evidence from five continents. International Journal of
Research in Marketing 21(2), pp. 179-200.
Cardinaels, E. et al. 2004. Customer profitability analysis reports for resource allocation: the role of complex marketing environments. Abacus 40(2), pp. 238-258.
Chenhall, R. H. 2008. Accounting for the horizontal organization: A review essay. Accounting, Organizations and Society 33(4), pp. 517-550.
Clark, B. H. 1999. Marketing performance measures: history and interrelationships. Journal of Marketing Management 15(8), pp. 711-732.
Clark, B. H. and Ambler, T. 2001. Marketing performance measurement: evolution of research and practice. International Journal of Business Performance Management 3(2), pp. 231-244.
Clark, J. M. 1923. Studies in the economics of overhead costs. Chicago: University of Chicago Press.
Cooper, D. J. and Morgan, W. 2008. Case study research in accounting. Accounting
Horizons 22(2), pp. 159-178.
Cooper, R. 1996a. Costing techniques to support corporate strategy: evidence from Japan. Management Accounting Research 7(2), pp. 219-246.
Cooper, R. 1996b. Look out, management accountants, part 1. Management Accounting 77(11), pp. 20-26.
Cooper, R. 1996c. Look out, management accountants, part 2. Management Accounting 77(12), pp. 35-41.
REFERENCES
321
Cooper, R. and Kaplan, R. S. 1988a. How cost accounting distorts product costs. Management Accounting 69(10), pp. 20-27.
Cooper, R. and Kaplan, R. S. 1988b. Measure costs right: make the right decisions. Harvard Business Review 66(5), pp. 96-103.
Cooper, R. and Kaplan, R. S. 1991. Profit priorities from activity-based costing. Harvard
Business Review 69(3), pp. 130-135.
Cooper, R. and Slagmulder, R. 2004. Achieving full-cycle cost management. MIT Sloan
Management Review 46(1), pp. 45-52.
Curren, M. T. et al. 1992. Explanations for successful and unsuccessful marketing decisions: The decision maker's perspective. Journal of Marketing 56(2), pp. 18-31.
Day, G. S. 1992. Marketing’s contribution to the strategy dialogue. Journal of the
Academy of Marketing Science 20(4), pp. 323-329.
De Haas, M. and Kleingeld, A. 1999. Multilevel design of performance measurement systems: enhancing strategic dialogue throughout the organization. Management
Accounting Research 10(3), pp. 233-261.
De Ruyter, K. and Wetzels, M. 2000. The marketing-finance interface: A relational exchange perspective. Journal of Business Research 50(2), pp. 209-215.
Dean, J. 1936. Statistical determination of costs, with special reference to marginal costs. Studies in Business Administration 7(1), pp. 1-145.
Deming, W. E. and Edwards, D. W. 1982. Quality, productivity, and competitive position. Cambridge: MIT - Center for Advanced Engineering Study.
Denzin, N. K. and Lincoln, Y. S. eds. 2011. The Sage handbook of qualitative research. 4th ed. Thousand Oaks: Sage.
Doyle, P. 2000. Value-based marketing. Chichester: Wiley.
Drucker, P. F. 1954. The practice of management. New York: Harper & Row.
Drury, C. 2009. Management accounting for business. 4th ed. Hampshire: Cengage Learning EMEA.

REFERENCES
322
Drury, C. and Tayles, M. 2005. Explicating the design of overhead absorption procedures in UK organizations. The British Accounting Review 37(1), pp. 47-84.
Dubé, J.-P. et al. 2005. An empirical model of advertising dynamics. Quantitative
Marketing and Economics 3(2), pp. 107-144.
Dunne, P. M. and Wolk, H. I. 1977. Marketing cost analysis: a modularized contribution approach. Journal of Marketing 41(July), pp. 83-94.
Eccles, R. G. 1991. The performance measurement manifesto. Harvard Business Review 69(1), pp. 2-8.
Emsley, D. 2001. Redesigning variance analysis for problem solving. Management
Accounting Research 12(1), pp. 21-40.
Farris, P. W. et al. 2010. Marketing metrics: The definitive guide to measuring marketing
performance. 2nd ed. Upper Saddle River: Pearson Prentice Hall.
Fisher, J. 1995. Contingency-based research on management control systems: categorization by level of complexity. Journal of Accounting Literature 14, pp. 24-53.
Flyvbjerg, B. 2001. Making social science matter. Cambridge: Cambridge University Press.
Forbis, J. L. and Mehta, N. T. 1981. Value-based strategies for industrial products. Business Horizons 24(3), pp. 32-42.
Foster, G. and Gupta, M. 1994. Marketing, cost management and management accounting. Journal of Management Accounting Research 6, pp. 43-77.
Gao, Y. 2010. Measuring marketing performance: a review and a framework. Marketing
Review 10(1), pp. 25-40.
Garrison, R. H. et al. 2003. Managerial accounting. New York: McGraw-Hill/Irwin.
Gleaves, R. et al. 2008. Accounting is from Mars, marketing is from Venus: establishing common ground for the concept of customer profitability. Journal of Marketing
Management 24(7), pp. 825-845.
Goebel, D. J. et al. 1998. Activity-based costing: accounting for a market orientation. Industrial Marketing Management 27(6), pp. 497-510.
REFERENCES
323
Goldratt, E. M. and Cox, J. 1986. The goal. Croton-on-Hudson: North River Press.
Gosselin, M. 1997. The effect of strategy and organizational structure on the adoption and implementation of activity-based costing. Accounting, Organizations and Society 22(2), pp. 105-122.
Gosselin, M. 2006. A review of activity-based costing: technique, implementation, and consequences. Handbooks of Management Accounting Research 2, pp. 641-671.
Govindarajan, V. 1986. Decentralization, strategy, and effectiveness of strategic business units in multibusiness organizations. Academy of Management Review 11(4), pp. 844-856.
Govindarajan, V. and Shank, J. K. 1992. Strategic cost management: tailoring controls to strategies. Journal of Cost Management 6(3), pp. 14-25.
Guilding, C. and McManus, L. 2002. The incidence, perceived merit and antecedents of customer accounting: an exploratory note. Accounting, Organizations and Society 27(1/2), pp. 45-59.
Guilding, C. and Moorhouse, M. 1992. The case for brand value budgeting. In: Drury, C. ed. Management Accounting Handbook. London: Butterworth-Heinemann.
Gupta, S. et al. 2004. Valuing customers. Journal of Marketing Research 41(1), pp. 7-18.
Gupta, S. and Zeithaml, V. 2006. Customer metrics and their impact on financial performance. Marketing Science 25(6), pp. 718-739.
Hales, C. P. 1986. What do managers do? A critical review of the evidence. Journal of
Management Studies 23(1), pp. 88-115.
Hall, M. 2008. The effect of comprehensive performance measurement systems on role clarity, psychological empowerment and managerial performance. Accounting,
Organizations and Society 33(2/3), pp. 141-163.
Hall, M. 2010. Accounting information and managerial work. Accounting, Organizations
and Society 35(3), pp. 301-315.
Harris, L. C. and Ogbonna, E. 1999. Developing a market oriented culture: a critical evaluation. Journal of Management Studies 36(2), pp. 177-196.
REFERENCES
324
Henri, J. F. 2006. Management control systems and strategy: a resource-based perspective. Accounting Organizations and Society 31(6), pp. 529-558.
Hergert, M. and Morris, D. 1989. Accounting data for value chain analysis. Strategic
Management Journal 10(2), pp. 175-188.
Hirshleifer, J. 1984. Price theory and applications. 3rd ed. Englewood Cliffs: Prentice-Hall, Inc.
Homburg, C. et al. 1999. Marketing's influence within the firm. Journal of Marketing 63(2), pp. 1-17.
Hope, J. and Fraser, R. 2003a. Beyond budgeting: how managers can break free from the
annual performance trap. Boston: Harvard Business School Press.
Hope, J. and Fraser, R. 2003b. New ways of setting rewards. California Management
Review 45(4), pp. 104-119.
Hoque, Z. and Chia, M. 2012. Competitive forces and the levers of control framework in a manufacturing setting. Qualitative Research in Accounting and Management 9(2), pp. 123-145.
Horngren, C. T. 1962. Cost accounting: A managerial emphasis. Englewoods Cliffs: Prentice-Hall.
Horngren, C. T. 2004. Management accounting: some comments. Journal of Management
Accounting Research 16(1), pp. 207-211.
Howell, R. A. 2004. Turn your budgeting process upside down. Harvard Business Review 82(7/8), pp. 21-22.
Howell, R. A. and Soucy, S. R. 1990. Customer profitability - As critical as product profitability. Management Review 79(10), pp. 43-47.
Innes, J. and Mitchell, F. 1997. The application of activity-based costing in the United Kingdom's largest financial institutions. Service Industries Journal 17(1), pp. 190-203.
Isenberg, D. J. 1984. How senior managers think. Harvard Business Review 62(6), pp. 81-90.
REFERENCES
325
Ittner, C. D. and Larcker, D. F. 1998. Are nonfinancial measures leading indicators of financial performance? An analysis of customer satisfaction. Journal of Accounting
Research 36(3), pp. 1-35.
Jensen, M. C. 2001. Corporate budgeting is broken, let's fix it. Harvard Business Review 79(10), pp. 94-101.
Jermias, J. 2001. Cognitive dissonance and resistance to change: the influence of commitment confirmation and feedback on judgment usefulness of accounting systems. Accounting, Organizations and Society 26(2), pp. 141-160.
Johnson, H. T. 1992. Relevance regained: From top-down control to bottom-up
empowerment. New York: The Free Press.
Johnson, H. T. and Kaplan, R. S. 1987. Relevance lost: The rise and fall of management
accounting. Boston: Harvard Business School Press.
Joshi, A. and Hanssens, D. M. 2004. Advertising spending and market capitalization.Working Paper. Marketing Science Institute.
Jönsson, S. 1998. Relate management accounting research to managerial work! Accounting, Organizations and Society 23(4), pp. 411-434.
Kakkuri-Knuuttila, M.-L. et al. 2008. Straddling between paradigms: a naturalistic philosophical case study on interpretive research in management accounting. Accounting,
Organizations and Society 33(2), pp. 267-291.
Kaplan, R. S. 1983. Measuring manufacturing performance: a new challenge to management accounting research. Accounting Review 59(3), pp. 390-418.
Kaplan, R. S. and Anderson, S. R. 2004. Time-driven activity-based costing. Harvard
Business Review 82(11), pp. 131-138.
Kaplan, R. S. and Cooper, R. 1988. Cost and effect: using integrated cost systems to drive
profitability and performance. Boston: Harvard Business School Press.
Kaplan, R. S. and Norton, D. P. 1996a. The balanced scorecard: translating strategy into
action. Boston: Harvard Business School Press.
Kaplan, R. S. and Norton, D. P. 1996b. Using the balanced scorecard as a strategic management system. Harvard Business Review 74(1), pp. 75-85.
REFERENCES
326
Kasanen, E. et al. 1993. The constructive approach in management accounting research. Journal of Management Accounting Research 5, pp. 243-264.
Kato, Y. et al. 1995. Target costing: an integrative management process. Journal of Cost
Management 9(1), pp. 39-51.
Keller, I. W. 1967. Controlling contribution. Management Accounting (June).
Keller, K. L. 2002. Branding and brand equity. Cambridge: Marketing Science Institute.
Kirca, A. H. et al. 2005. Market orientation: a meta-analytic review and assessment of its antecedents and impact on performance. Journal of Marketing 69(2), pp. 24-41.
Kirpalani, V. H. and Shapiro, S. S. 1973. Financial dimensions of marketing management. Journal of Marketing 37(3), pp. 40-47.
Kohli, A. K. and Jaworski, B. J. 1990. Market orientation: the construct, research propositions, and managerial implications. Journal of Marketing 54(2), pp. 1-18.
Kotler, P. 1977. From sales obsession to marketing effectiveness. Harvard Business
Review 55(6), pp. 67-75.
Kotler, P. 2006. Re-engineering marketing. The Marketer (September), pp. 15-17.
Kotler, P. and Keller, K. L. 2006. Marketing management. Upper Saddle River: Prentice-Hall.
Kotler, P. et al. 2006. Ending the war between sales & marketing. Harvard Business
Review 84(7/8), pp. 68-78.
Kotter, J. P. 1982. The general managers. New York: Free Press.
Krasnikov, A. and Jayachandran, S. 2008. The relative impact of marketing, research-and-development, and operations capabilities on firm performance. Journal of Marketing 72(4), pp. 1-11.
Kumar, V. et al. 2008. The power of CLV: Managing customer lifetime value at IBM. Marketing Science 27(4), pp. 585-599.
REFERENCES
327
Lambert, D. M. and Sterling, J. U. 1987. What types of profitability reports do marketing managers receive? Industrial Marketing Management 16(4), pp. 295-303.
Langfield-Smith, K. 2008. Strategic management accounting: how far have we come in 25 years? Accounting, Auditing & Accountability Journal 21(2), pp. 204-228.
Lehmann, D. R. 2004. Metrics for making marketing matter. Journal of Marketing 68(4), pp. 73-75.
Lere, J. C. 2001. Your product-costing system seems to be broken: now what? Industrial
Marketing Management 30(7), pp. 587-598.
Libby, T. and Lindsay, R. M. 2010. Beyond budgeting or budgeting reconsidered? A survey of North-American budgeting practice. Management Accounting Research 21(1), pp. 56-75.
Lind, J. and Strömsten, T. 2006. When do firms use different types of customer accounting? Journal of Business Research 59(12), pp. 1257-1266.
Little, J. D. 1975. Brandaid: A marketing-mix model, Part 1: Structure. Operations
Research 23(4), pp. 628-655.
Locke, E. A. and Latham, G. P. 1990. Work motivation and satisfaction: Light at the end of the tunnel. Psychological Science 1(4), pp. 240-246.
Longman, D. R. and Schiff, M. 1955. Practical distribution cost analysis. Homewood: Richard D. Irwin.
Lord, B. R. 1996. Strategic management accounting: the emperor's new clothes? Management Accounting Research 7(3), pp. 347-366.
Low, G. S. and Mohr, J. J. 2000. Advertising vs sales promotion: a brand management perspective. Journal of Product & Brand Management 9(6), pp. 389-414.
Lucas, M. and Rafferty, J. 2008. Cost analysis for pricing: Exploring the gap between theory and practice. The British Accounting Review 40(2), pp. 148-160.
Lukka, K. and Granlund, M. 2002. The fragmented communication structure within the accounting academia: the case of activity-based costing research genres. Accounting,
Organizations and Society 27(1/2), pp. 165-190.
REFERENCES
328
Lukka, K. and Modell, S. 2010. Validation in interpretive management accounting research. Accounting, Organizations and Society 35(4), pp. 462-477.
March, J. G. 1987. Ambiguity and accounting: The elusive link between information and decision making. Accounting, Organizations and Society 12(2), pp. 153-168.
Marginson, D. E. W. 2002. Management control systems and their effects on strategy formation at middle-management levels: evidence from a UK organization. Strategic
Management Journal 23(11), pp. 1019-1031.
Marple, R. P. 1967. Management accounting is coming of age. Management Accounting 45(7), pp. 3-16.
Martin, P. Y. and Turner, B. A. 1986. Grounded theory and organizational research. The
Journal of Applied Behavioral Science 22(2), pp. 141-157.
Mason, J. 2002. Qualitative researching. 2nd ed. London: Sage.
May, T. 1997. Social research. Buckingham: Open University Press.
McAlister, L. et al. 2007. Advertising, research and development, and systematic risk of the firm. Journal of Marketing 71(1), pp. 35-48.
McCracken, G. D. and Roth, V. J. 1989. Does clothing have a code? Empirical findings and theoretical implications in the study of clothing as a means of communication. International Journal of Research in Marketing 6(1), pp. 13-33.
McFarland, W. B. 1966. Concepts for management accounting. New York: National Association of Accountants.
McGovern, G. J. et al. 2004. Bringing customers into the boardroom. Harvard Business
Review 82(11), pp. 70-80.
McKinnon, J. 1988. Reliability and validity in field research: some strategies and tactics. Accounting, Auditing & Accountability Journal 1(1), pp. 34-54.
McKinnon, S. M. and Bruns, W. J. 1992. The information mosaic. Boston: Harvard Business School Press.
REFERENCES
329
McManus, L. and Guilding, C. 2008. Exploring the potential of customer accounting: a synthesis of the accounting and marketing literatures. Journal of Marketing Management 24(7), pp. 771-795.
Merchant, K. A. and Van der Stede, W. A. 2006. Field-based research in accounting: accomplishments and prospects. Behavioral Research in Accounting 18(1), pp. 117-134.
Merlo, O. 2011. The influence of marketing from a power perspective. European Journal
of Marketing 45(7/8), pp. 1152-1171.
Mintzberg, H. 1980. The nature of managerial work. Englewood Cliffs: Prentice-Hall.
Moorman, C. and Rust, R. T. 1999. The role of marketing. Journal of Marketing 63(Special Issue), pp. 180-197.
Morgan, N. A. et al. 2002. Marketing productivity, marketing audits, and systems for marketing performance assessment integrating multiple perspectives. Journal of Business
Research 55(5), pp. 363-375.
Mundy, J. 2010. Creating dynamic tensions through a balanced use of management control systems. Accounting, Organizations and Society 35(5), pp. 499-523.
Nath, P. and Mahajan, V. 2008. Chief marketing officers: A study of their presence in firms' top management teams. Journal of Marketing 72(1), pp. 65-81.
Nijs, V. R. et al. 2001. The category-demand effects of price promotions. Marketing
Science 20(1), pp. 1-22.
Nixon, B. and Burns, J. 2012. Strategic management accounting. Management
Accounting Research 23(4), pp. 225-228.
Nordhielm, C. L. 2006. Marketing management: The big picture. Hoboken: John Wiley & Sons, Inc.
Norman, R. 2001. Letting and making managers manage: the effect of control systems on management action in New Zealand’s central government. International Public
Management Journal 4(1), pp. 65-89.
Nueno, J. L. and Simon, G. 1999. Gestión de precios. Barcelona: Estudios y Ediciones IESE, S.L.
REFERENCES
330
O'Sullivan, D. and Abela, A. V. 2007. Marketing performance measurement ability and firm performance. Journal of Marketing 71(2), pp. 79-93.
O'Sullivan, D. et al. 2009. Marketing performance measurement and firm performance: Evidence from the European high-technology sector. European Journal of Marketing 43(5/6), pp. 843-862.
Ouchi, W. G. 1979. A conceptual framework for the design of organizational control mechanisms. Management Science 25(9), pp. 833-848.
Pauwels, K. et al. 2004. New products, sales promotions, and firm value: The case of the automobile industry. Journal of Marketing 68(4), pp. 142-156.
Peles, Y. 1970. Amortization of advertising expenditures in the financial statements. Journal of Accounting Research 8(Spring), pp. 128-137.
Pereira, F. et al. 2010. Contabilidad para dirección. 23rd ed. Pamplona: EUNSA - Ediciones Universidad de Navarra.
Perloff, J. M. and Salop, S. C. 1985. Equilibrium with product differentiation. The Review
of Economic Studies 52(1), pp. 107-120.
Persson, A. and Ryals, L. 2010. Customer assets and customer equity: management and measurement issues. Marketing Theory 10(4), pp. 417-436.
Petersen, J. A. et al. 2009. Choosing the right metrics to maximize profitability and shareholder value. Journal of Retailing 85(1), pp. 95-111.
Petty, J. and Goodman, K. 1996. Customers from hell are they worth the effort? Australian Accountant 66(8), pp. 55-57.
Phillips, P. and Halliday, S. V. 2008. Marketing/accounting synergy: a discussion of its potential and evidence in e-business planning. Journal of Marketing Management 24(7), pp. 751-770.
Porter, M. 1980. Competitive strategy: Techniques for analyzing industries and
competitors. New York: The Free Press.
Porter, M. 1985. Competitive advantage: Creating and sustaining superior performance. New York: Free Press.
REFERENCES
331
Preston, A. 1986. Interactions and arrangements in the process of informing. Accounting,
Organizations and Society 11(6), pp. 521-540.
Ratnatunga, J. et al. 1990. The marketing-finance interface. European Journal of
Marketing 24(1), pp. 29-43.
Ratnatunga, J. et al. 1988. The application of management accounting techniques to marketing. Accounting and Business Research 18(72), pp. 363-370.
Ratzinger, J. 2004. Introduction to christianity. San Francisco: Ignatius Press.
Rayburn, L. G. 1986. Accounting principles and marketing models related to deferred marketing costs. European Journal of Marketing 20(1), pp. 75-82.
Reeve, J. M. 1991. Activity-based cost systems for functional integration and customer value. In: Stahl, M.J. and Bounds, G.M. eds. Competing globally through customer value:
The management of strategic suprasystems. New York: Quorum Books.
Riley, D. 1987. Competitive cost based investment strategies for industrial companies.Manufacturing Issues. New York: Booz Allen Hamilton, pp. 30-34.
Roberts, J. 1990. Strategy and accounting in a U.K. conglomerate. Accounting,
Organizations and Society 15(1/2), pp. 107-126.
Robinson, J. 1932. Imperfect competition and falling supply price. Economic Journal 42(168), pp. 544-554.
Robinson, M. A. ed. 1990. Contribution margin analysis: no longer relevant/strategic
cost management: the new paradigm. Annual Meeting of the American Accounting Association. Journal of Management Accounting Research.
Rosanas, J. M. 2005. Los presupuestos: ¿Herramienta crucial de dirección o requisito
burocrático inútil? Barcelona: Universidad de Navarra.
Roslender, R. and Hart, S. J. 2002. Integrating management accounting and marketing in the pursuit of competitive advantage: the case for strategic management accounting. Critical Perspectives on Accounting 13(2), pp. 255-277.
Roslender, R. and Hart, S. J. 2003. In search of strategic management accounting: theoretical and field study perspectives. Management Accounting Research 14(3), pp. 255-279.

REFERENCES
332
Roslender, R. and Hart, S. J. 2006. Interfunctional cooperation in progressing accounting for brands: the case for brand management accounting. Journal of Accounting &
Organisational Change 2(3), pp. 229-247.
Roslender, R. and Hart, S. J. 2010. Taking the customer into account: transcending the construction of the customer through the promotion of self-accounting. Critical
Perspectives on Accounting 21(8), pp. 739-753.
Rust, R. T. et al. 2004. Measuring marketing productivity: current knowledge and future directions. Journal of Marketing 68(4), pp. 76-89.
Sakurai, M. and Keating, P. J. 1994. Target costing and activity-based costing: contrasting approaches to performance measurement in Japanese and U.S. companies.Working paper. Senshu University.
Scapens, R. W. 1990. Researching management accounting practice: the role of case study methods. The British Accounting Review 22(3), pp. 259-281.
Scherer, F. M. 1980. Industrial market structure and economic performance. 2nd ed. Chicago: Rand McNally.
Schiff, M. and Benninger, L. J. 1963. Cost accounting. 2nd ed. New York: Ronald Press.
Schiff, M. and Mellman, M. 1962. Financial management of the marketing function.New York: Financial Executives Research Foundation.
Schultz, D. E. 2003. Marketing gets no respect in the boardroom. Marketing News 37(24), p. 9.
Schultz, D. E. 2005. MR deserves blame for marketing's decline. Marketing News 39(3), p. 7.
Schultz, D. E. and Gronstedt, A. 1997. Making Marcom an investment. Marketing
Management 6(3), pp. 41-49.
Seggie, S. H. et al. 2007. Measurement of return on marketing investment: a conceptual framework and the future of marketing metrics. Industrial Marketing Management 36(6), pp. 834-841.
REFERENCES
333
Selden, L. and MacMillan, I. C. 2006. Manage customer-centric innovation - Systematically. Harvard Business Review 84(4), pp. 108-116.
Shank, J. K. 1989. Strategic cost management: new wine, or just new bottles? Journal of
Management Accounting Research 1(1), pp. 47-65.
Shank, J. K. 2006. Strategic cost management: upsizing, downsizing, and right (?) sizing. In: Bhimani, A. ed. Contemporary issues in management accounting. Oxford: Oxford University Press, pp. 355-379.
Shank, J. K. and Fisher, J. 1999. Target costing as a strategic tool. Sloan Management
Review 41(1), pp. 73-83.
Shank, J. K. and Govindarajan, V. 1988a. Making strategy explicit in cost analysis: a case study. Sloan Management Review 29(3), pp. 19-29.
Shank, J. K. and Govindarajan, V. 1988b. The perils of cost allocation based on production volumes. Accounting Horizons 2(4), pp. 71-79.
Shank, J. K. and Govindarajan, V. 1992. Strategic cost management: the value chain perspective. Journal of Management Accounting Research 4, pp. 179-197.
Shank, J. K. and Govindarajan, V. 1993. Strategic cost management: The new tool for
competitive advantage. New York: The Free Press.
Shapiro, B. P. et al. 1987. Manage customers for profits (not just sales). Harvard Business
Review 65(5), pp. 101-108.
Sheth, J. N. and Sisodia, R. S. 2002. Marketing productivity: issues and analysis. Journal
of Business Research 55(5), pp. 349-362.
Sheth, J. N. and Sisodia, R. S. 2005. A dangerous divergence: marketing and society. Journal of Public Policy & Marketing 24(1), pp. 160-162.
Sheth, J. N. and Sisodia, R. S. 2006. Does marketing need reform? Fresh perspective on
the future. Armonk: M. E. Sharpe.
Shields, J. F. and Shields, M. D. 1998. Antecedents of participative budgeting. Accounting, Organizations and Society 23(1), pp. 49-76.

REFERENCES
334
Shillinglaw, G. 1959. Accounting: A management approach. Homewood: Richard D. Irwin.
Shillinglaw, G. 1961. Cost accounting: analysis and control. Homewood: Richard D. Irwin.
Shillinglaw, G. 1982. Managerial cost accounting. 5th ed. Homewood: Richard D. Irwin.
Sidhu, B. K. and Roberts, J. H. 2008. The marketing accounting interface - Lessons and limitations. Journal of Marketing Management 24(7/8), pp. 669-686.
Simmonds, K. 1981. Strategic management accounting. Management Accounting 59(4), pp. 26-29.
Simon, H. A. 1960. The new science of management decision. New York: Harper and Row.
Simon, H. A. et al. 1954. Centralization vs. decentralization in organizing the controller's
department. New York: The Controllership Foundation.
Simons, R. 1987a. Accounting control systems and business strategy: an empirical analysis. Accounting, Organizations and Society 12(4), pp. 357-374.
Simons, R. 1987b. Codman & Shurtleff, Inc.: Planning and control system.Boston: Harvard Business School Publishing.
Simons, R. 1990. The role of management control systems in creating competitive advantage: new perspectives. Accounting, Organizations and Society 15(1/2), pp. 127-143.
Simons, R. 1995a. Control in an age of empowerment. Harvard Business Review, pp. 80-88.
Simons, R. 1995b. Levers of control. Cambridge: Harvard Business School Press.
Simons, R. 1999. How risky is your company? Harvard Business Review 77(3), pp. 85-94.
Simons, R. 2000. Performance measurement & control systems for implementing
strategy. Upper Saddle River: Prentice Hall, Inc.

REFERENCES
335
Simpson, J. B. and Muthler, D. L. 1987. Quality costs: facilitating the quality initiative. Journal of Cost Management 1(1), pp. 25-34.
Sloman, J. 2003. Economics. 5th ed. Essex: Prentice Hall.
Smith, M. and Dikolli, S. 1995. Customer profitability analysis: An activity-based costing approach. Managerial Auditing Journal 10(7), pp. 3-7.
Snyder, M. 1989. Selling images versus selling products: motivational foundations of consumer attitudes and behavior. Advances in Consumer Research 16(1), pp. 306-311.
Speklé, R. F. 2001. Explaining management control structure variety: a transaction cost economics perspective. Accounting, Organizations and Society 26(4/5), pp. 419-441.
Sprinkle, G. B. 2003. Perspectives on experimental research in managerial accounting. Accounting, Organizations and Society 28(2/3), pp. 287-318.
Srinivasan, R. et al. 2005. Turning adversity into advantage: does proactive marketing during a recession pay off? International Journal of Research in Marketing 22(2), pp. 109-125.
Srinivasan, S. and Hanssens, D. M. 2009. Marketing and firm value: metrics, methods, findings, and future directions. Journal of Marketing Research 46(3), pp. 293-312.
Srivastava, R. K. et al. 1998. Market-based assets and shareholder value: a framework for analysis. Journal of Marketing 62(1), pp. 2-18.
Srivastava, R. K. and Shocker, A. D. 1991. Brand equity: a perspective on its meaning
and measurement. Cambridge: Marketing Science Institute.
Staubus, G. J. 1971. Activity costing and input-output accounting. Homewood: Richard D. Irwin.
Stewart, D. W. 2009. Marketing accountability: linking marketing actions to financial results. Journal of Business Research 62(6), pp. 636-643.
Stewart, R. 1988. Managers and their jobs. London: MacMillan Press.
Stewart, T. A. 1990. Why budgets are bad for business. Fortune 4, pp. 179-190.
REFERENCES
336
Storbacka, K. 1997. Segmentation based on customer profitability - Retrospective analysis of retail bank customer bases. Journal of Marketing Management 13(5), pp. 479-492.
Sun, B. 2005. Promotion effect on endogenous consumption. Marketing Science 24(3), pp. 430-443.
Swartz, T. A. 1983. Brand symbols and message differentiation. Journal of Advertising
Research 23(5), p. 59.
Tanaka, T. 1993. Target costing at Toyota. Journal of Cost Management 7(1), pp. 4-11.
Tellis, G. J. and Johnson, J. 2007. The value of quality. Marketing Science 26(6), pp. 758-773.
Thomas, A. 2003. Research skills for management studies. London: Routledge.
Thomas, J. S. et al. 2004. Getting the most out of all your customers. Harvard Business
Review 82(7/8), pp. 116-123.
Tillmann, K. and Goddard, A. 2008. Strategic management accounting and sense-making in a multinational company. Management Accounting Research 19(1), pp. 80-102.
Tomkins, C. and Carr, C. 1996. Reflections on the papers in this issue and a commentary on the state of strategic management accounting. Management Accounting Research 7(2), pp. 271-280.
Tuomela, T.-S. 2005. The interplay of different levers of control: a case study of introducing a new performance measurement system. Management Accounting Research 16(3), pp. 293-320.
Vaivio, J. 2004. Mobilizing local knowledge with ‘provocative’ non-financial measures. European Accounting Review 13(1), pp. 39-71.
Van Raaij, E. M. et al. 2003. The implementation of customer profitability analysis: a case study. Industrial Marketing Management 32(7), pp. 573-583.
Verhoef, P. C. and Leeflang, P. S. H. 2009. Understanding the marketing department's influence within the firm. Journal of Marketing 73(2), pp. 14-37.
REFERENCES
337
Verhoef, P. C. et al. 2011. A cross-national investigation into the marketing department's influence within the firm: toward initial empirical generalizations. Journal of
International Marketing 19(3), pp. 59-86.
Viscolani, B. 1994. Optimal advertising for selling a product with a nondifferentiable demand function. Decisions in Economics and Finance 17(1), pp. 53-67.
Wall, F. and Greiling, D. 2011. Accounting information for managerial decision-making in shareholder management versus stakeholder management. Review of Managerial
Science 5(2), pp. 91-135.
Webster Jr, F. E. 1992. The changing role of marketing in the corporation. Journal of
Marketing 56(4), pp. 1-17.
Webster Jr, F. E. et al. 2005. The decline and dispersion of marketing competence. MIT
Sloan Management Review 46(4), pp. 35-43.
Webster, S. and Weng, Z. K. 2008. Ordering and pricing policies in a manufacturing and distribution supply chain for fashion products. International Journal of Production
Economics 114(2), pp. 476-486.
Welch, G. 2004. CMO tenure: slowing down the revolving door [Online]. Available at: http://content.spencerstuart.com/sswebsite/pdf/lib/CMO_brochureU1.pdf [Accessed: 11/01/2013].
Whitely, W. 1985. Managerial work behavior: An integration of results from two major approaches. The Academy of Management Journal 28(2), pp. 344-362.
Widener, S. K. 2007. An empirical analysis of the levers of control framework. Accounting, Organizations and Society 32(7/8), pp. 757-788.
Wilson, R. M. 1986. Accounting for marketing assets. European Journal of Marketing 20(1), pp. 51-74.
Wilson, R. M. 1995. Strategic management accounting. In: Ashton, D. et al. eds. Issues in
Management Accounting. London: Prentice Hall.
Wind, Y. and Robertson, T. S. 1983. Marketing strategy: new directions for theory and research. Journal of Marketing 47(2), pp. 12-25.
REFERENCES
338
Winer, R. S. 2000. What marketing metrics are used by MSI members? Cambridge: Marketing Science Institute.
Winter, F. W. 1979. A cost-benefit approach to market segmentation. Journal of
Marketing, pp. 103-111.
Yin, R. K. 2009. Case study research: Design and methods. 4th ed. Thousand Oaks: Sage Publications Inc.
Zhang, J. L. et al. 2008. Joint optimization on pricing, promotion and inventory control with stochastic demand. International Journal of Production Economics 116(2), pp. 190-198.
Zikmund, W. G. 2010. Business research methods. 7th ed. New Delhi: Cengage Learning.
Zimmerman, J. L. 2001. Conjectures regarding empirical managerial accounting research. Journal of Accounting and Economics 32(1–3), pp. 411-427.