Embed Size (px)
Citation preview

22nd IAHR Symposium on Hydraulic Machinery and Systems June 29 – July 2, 2004 Stockholm – Sweden
1 (14)
Identification and modeling of pressure fluctuations of a Francis turbine scale model at part load operation
Author Firm / Institution City, Country Lecturer (x)
Christophe Nicolet Jorge Arpe François Avellan
Laboratory for Hydraulic Machines EPFL Swiss Federal Institute of Technology Lausanne
Lausanne, Switzerland x
Abstract Scale model of high specific speed Francis turbines may present at upper part load operation under low cavitation number pressure fluctuation in the range 2 to 4 times fn, the rotating frequency. In the framework of the FLINDT project, pressure measurements on the draft tube wall of a Francis turbine scale model at 104 locations revealed such phenomenon at a frequency of almost 2.5 fn. The phase shift analysis of the measured pressure fluctuations in the draft tube at this frequency points out a pressure source located in the inner part of the draft tube elbow. The spectral analysis of the pressure signal at this location shows that there is energy uniformly distributed in the range 0 to 7 fn. This results from impacts of the vortex rope during its precession on the draft tube wall. The wave speed along the draft tube is calculated using the experimental results of the phase shifts and allows modeling the entire test rig with SIMSEN. The simulation of the hydro acoustic behavior of the entire test rig, including the scale model and the piping system, and considering white noise excitation at the pressure source location provides eigen frequencies of the full hydraulic system. An eigen frequency at 2.46 fn is identified and the corresponding mode shape agrees well with the experimental results. A forced excitation composed of the synchronous pressure fluctuation measured in the draft tube cone added to pressure impulsion peaks at the vortex rope precession frequency is also simulated. This excitation represents the synchronous part of the vortex rope excitation and the energy provided by the impacts on the draft tube wall. The analysis of the resulting pressure fluctuation in the entire test rig shows significant pressure amplitude mainly at 2.46fn, which evidences the excitation mechanism. Résumé Les mesures de fluctuations de pression réalisées sur les modèles réduits de turbines Francis à grande vitesse spécifique peuvent révéler des fluctuations dans la plage 2 à 4 fois la fréquence de rotation fn. Dans le cadre du projet de recherche FLINDT le diffuseur du model réduit d’une turbine Francis a été instrumenté avec 104 capteurs de pression. Les mesures ont mis évidence des fluctuations de pression à une fréquence d’environ 2.5 fn. Une analyse de la phase des signaux de pression a permis d’identifier la position de la source de pression à l’origine de ces fluctuations. Cette source est localisée dans la partie intérieure du coude du diffuseur. L’analyse du contenu spectral du signal de pression à cette position révèle une
paper_IAHR_2004_nicolet_final

22nd IAHR Symposium on Hydraulic Machinery and Systems June 29 – July 2, 2004 Stockholm – Sweden
2 (14)
énergie distribuée de manière uniforme dans la plage de fréquence 0 à 7 fn. Ceci est attribué aux impacts de la torche de cavitation contre la paroi du diffuseur à cet endroit. La vitesse de propagation d’ondes dans le diffuseur est déterminée à partir des relevés expérimentaux de phase. Cette donnée offre la possibilité de modéliser l’ensemble du stand d’essais au moyen de SIMSEN. Ainsi le comportement hydroacoustique de la plate-forme d’essai est simulé en considérant un bruit blanc comme source d’excitation et permet de déterminer les fréquences propres du système hydraulique. Une fréquence propre à 2.46fn est identifiée. Le mode propre correspondant présente une bonne concordance avec les mesures. Une excitation forcée composée des parties synchrones des fluctuations de pression mesurées dans le cône du diffuseur auxquelles est ajouté une impulsion courte de pression à la fréquence de précession de la torche est également simulée. Cette excitation représente la partie synchrone de la source de pression associée à la torche et aux pics de pression générant l’énergie sur une bande large de fréquence du aux impacts de la torche contre la paroi du diffuseur. L’analyse des fluctuations de pressions obtenues par la simulation numérique montre que le mode propre à 2.46 fn constitue la principale réponse du système, ce qui met en évidence le mécanisme d’excitation. Nomenclature ψ Specific energy coefficient
2 21
2( / 2)e
g HD
ψω
⋅ ⋅=
⋅
[-] φ Discharge coefficient
31( / 2)e
QD
ϕπ ω
=⋅ ⋅
[-]
H Piezometric head [m] φ* φ* = φ/ φBEP [-] Q Discharge [m3/s] ψ* ψ* = ψ/ ψBEP [-] ω Angular speed [rd/s] ν Specific speed 1/ 2 3/ 4ν ϕ ψ= [-] N Rotational speed [rpm] E Specific energy E = gH [J/Kg] Introduction Nowadays hydroelectric power plants are increasingly subject to off-design operation in order to follow the demand. In this context, Francis turbine power plants operating at part load may present instabilities in terms of pressure, discharge, rotational speed and torque. These phenomena are strongly linked to the flow structure at the runner outlet inducing a vortex core precession in the draft tube. This leads to hydrodynamic instabilities (Jacob, Ref. 1). The decrease of the tailrace pressure level makes the vortex core visible as a gaseous vortex rope. The volume of the gaseous vortex rope is dependent of the cavitation number σ and affects the parameters characterizing the hydro-acoustic behavior of the entire power plant. As a result, eigen frequencies of the hydraulic system decreases with the cavitation number. Interaction between excitation source like vortex rope precession and eigen frequencies may result in resonance effect and induce a so called draft tube surge and electrical power swing, Rheingans, Ref. 2. In order to assess resonance risks on the prototype, pressure fluctuation measurements field are carried out during scale model tests to identify experimentally pressure excitations source and vortex rope compliance (Dörfler, Ref. 3). Then, the pressure fluctuation due to non uniform pressure field at the runner outlet (Nishi, Ref. 4) can be decomposed in two parts as proposed by Angelico (Ref. 5); a rotating part, due to vortex rotation, and a synchronous pulsating part resulting from the spatial perturbation of the rotating part. If the vortex rope precession frequency commonly corresponds to 0.2 to 0.4 of the turbine rotational frequency
paper_IAHR_2004_nicolet_final

22nd IAHR Symposium on Hydraulic Machinery and Systems June 29 – July 2, 2004 Stockholm – Sweden
3 (14)
fn, pressure fluctuations may occur in a higher frequency range, 2fn to 4fn, for high specific speed turbine at upper partial load range as described by Dörfler (Ref. 6) and Jacob (Ref. 1: A0-2, A03). Moreover, a “shock phenomenon” may occur in the same operating range and induces structural vibrations due to vortex rope impacts on the draft tube wall. In the framework of the FLINDT project (Avellan, Ref. 7), pressure fluctuation measurements were carried out in the draft tube of a scale model of a medium head Francis turbine (specific speed ν = 0.56) in a wide operating range by Arpe (Ref. 8). For the upper partial load and low cavitation number conditions, σ = 0.38, pressure fluctuations were found at a frequency value close to 2.5fn, while structural vibrations of the whole test rig were observed too. This paper presents the analysis of the pressure fluctuation measured in the draft tube at part load operation under low cavitation number. First a phase shift analysis is carried out, pointing out a pressure excitation source in the elbow of the draft tube. The wave speed along the draft tube is deduced form this analysis allowing building up a hydro-acoustic model of the entire test rig using SIMSEN. Then, a free oscillation analysis as well as a forced oscillation analysis is investigated in order to explain the pressure fluctuation mechanism. Experimental set-up The experimental investigations are performed on a scale model of a high specific speed Francis turbine, ν=0.56 described by Avellan (Ref. 7), see Figure 1. The draft tube is equipped with 292 pressure taps, distributed in 13 sections, see Figure 2. A cone made in Plexiglas, an elbow in glass fiber-epoxy resin and a diffuser with a pier made of welded stainless steel plates compose the draft tube. A set of 104 miniatures Keller Piezoresistive pressure transducers series 2MI are mounted on the draft tube wall. The transducer range goes from 0 to 3 bars to measure low pressures that extend in the whole draft tube. The scale model equipped with the FLINDT draft tube is installed in the test rig PF3 of the EPFL Laboratory for Hydraulic Machines and the tests are carried out according to IEC 60913 standards (Ref. 9).
±
To capture phenomena of interest at low flow rate turbine conditions, all pressure signals are acquired simultaneously with a HP-VXI acquisition system using a sampling frequency of 200 Hz and 214 samples. This setup allows recording 430 vortex passages providing a number of segments acceptable for averaging process. Phenomenon of interest The turbine operating point selected for the investigation at low discharge is given Table 1, see Figure 3. Table 1 Studied operating point.
ϕ∗ ψ∗ N [rpm] Guide vane opening 0.703 1.06 750 16°
Spectral analysis of pressure fluctuations measured in the cone performed for different σ values evidence the influence of the vortex volume variation on the fluctuating pressure field, see Figure 4. Pressure fluctuations between 2fn and 4fn can be noticed for low σ values. These fluctuations are apparently modulated by the vortex precession and come with strong
paper_IAHR_2004_nicolet_final

22nd IAHR Symposium on Hydraulic Machinery and Systems June 29 – July 2, 2004 Stockholm – Sweden
4 (14)
noise and vibration of the draft tube and test rig. The amplitudes decrease and the frequencies increase as σ is increasing see Figure 4. Concerning the fluctuations at the vortex frequency, their amplitudes increase with σ, while the vortex frequency drop slightly, see Jacob (Ref. 1).
Figure 1 Francis turbine scale model. Figure 2 Draft tube pressure taps location.
Figure 3 Low discharge operating point Figure 4 Influence of σ on the pressure fluctuations.
Case Study The selected case for the investigation of these particular high frequency pressure fluctuations corresponds to a cavitation number σ = 0.38. First, the pressure spectrum in the cone, Figure 4, shows clearly that there is amplitude modulation between the vortex precession, the modulating wave at fv, and a phenomenon that occurs at fc ~ 2.5fn, the carrier wave. The resulting modulation frequencies are fc-fv, fc+fv, fc+2fv and 2fc. A simulation performed by Arpe (Ref. 8) based on the product of 2 waves representing the 2 phenomena observed has evidenced all the characteristics frequencies observed experimentally. Moreover, the amplitude spectra following 4 paths through the draft tube, see Figure 5, show pressure fluctuations at ~2.5fn present in the whole draft tube. There is a maximum of amplitude in the elbow and a minimum at the draft tube outlet. This pressure fluctuation is also measured in the turbine intake pipe with high amplitudes. Experimental results Pressure amplitudes spectrum calculation allows determining the phase angle between two signals at the frequency ~2.5fn. This phase is calculated for every pressure signals according
paper_IAHR_2004_nicolet_final

22nd IAHR Symposium on Hydraulic Machinery and Systems June 29 – July 2, 2004 Stockholm – Sweden
5 (14)
to a reference signal in the cone, see Arpe (Ref. 10). Those phase shifts are presented in an unfolded draft tube representation, see Figure 6 left. It can be observed that in the cone, there is no phase shift between pressure signals in the same section which is related to a synchronous fluctuation. On the other hand, there is a maximum of phase located at the inner part of the elbow. It corresponds to the location where impacts between vortex rope and wall occur. The phase evolution indicates that pressure waves start from this point towards both upstream and downstream. On the basis of these results, a source of pressure waves is identified and represented Figure 6 right. Those pressure waves are also propagating trough the 2 channels of the diffuser.
Figure 5 Spectra of pressure fluctuations along 4 paths.
Phase analysis The estimated phase shifts can be expressed in time at the studied frequency. The wave velocities estimated through the sections are represented Figure 7 following the 4 paths defined Figure 5. The resulting distribution shows differences of pressure wave velocities through the draft tube. The wave velocity depends mainly of the section diameter, the pipe thickness and material and strongly of the vapor content in the section. One can notice that the pressure wave velocity is low in the cone, about 20 m/s. In the elbow sections the wave velocity increases to a mean value of 450 m/s because of the section stiffness, thick walls and short pipe, and the decreasing vapor content. The wave velocity is higher in the outer elbow because the wave travel distance is longer than in the inner elbow. The wave velocity decreases in the draft tube channels mainly because of the lateral deformations of the rectangular sections of the channels. During experiments, impacts between the vortex rope and the inner part of the elbow wall are noticed. Those impacts are producing strong acoustic noise similar to hammer strike. This shock phenomenon, described by Dörfler (Ref. 6) and Jacob (Ref. 1), can be assumed to be a white noise source supplying the system with a wide frequency range of energy. This assumption is confirmed by the comparison between pressure fluctuation energy at the pressure source location and at the upper cone part Figure 8. One can notice that energy is uniformly distributed for the pressure source with indications of vortex rope precession harmonics. Whereas, at the upper part of the cone, there is energy only at ~2.5fn, the
paper_IAHR_2004_nicolet_final

22nd IAHR Symposium on Hydraulic Machinery and Systems June 29 – July 2, 2004 Stockholm – Sweden
6 (14)
modulation frequencies, ~5fn and vortex rope precession. These results evidence that the vortex rope impacts at this location has an energy distribution over a wide frequency range similar to a "white noise". From this location, pressure waves propagate towards both upstream and downstream the piping system.
Figure 6 Field of the phase shift at the wall of the cone and the elbow at ~2.5 fn. Left: unfolded mapping. Right: 3D distribution.
Figure 7 Distribution of the wave velocity along the draft tube along 4 different paths.
Figure 8 Energy spectra of the pressure fluctuation for the upper cone and for the pressure source location.
paper_IAHR_2004_nicolet_final

22nd IAHR Symposium on Hydraulic Machinery and Systems June 29 – July 2, 2004 Stockholm – Sweden
7 (14)
Hydro-acoustic modeling of the test rig To identify the origin of the pressure fluctuations at the frequency ~2.5fn, the hydro-acoustic behavior of the entire test rig is investigated. The entire test rig, including the Francis turbine scale model, the free surface downstream tank, the connecting pipes and the 2 circulating pumps operating in parrallel mode, see Figure 9, is simulated with SIMSEN. The models of hydraulic components used in SIMSEN, Ref. 11, are based on the electrical analogy, Bergeron, Ref. 12; Paynter, Ref. 13. The hydro-acoustic characteristics of the SIMSEN model are given Table 2.
Turbine
Figure 9 Hydro-Acoustic SIMSEN model of the PF3 test rig.
Tank
Feeding pumps
1 16 50 54
4549 47 43
Table 2 Dimensions of the equivalent pipe modeling the PF3 test rig. Pipe Length L
[m] Diameter Dequ
[m] Cross-section area Aequ [m2]
Wave speed a [m/s]
L1 11.53 0.610 0.292 1057 L2 2.55 0.610 0.292 1057 L3 7.09 0.610 0.292 1057 L4 2.30 0.484 0.184 1057 L5 4.03 0.508 0.203 1057 L6 34.27 0.529 0.220 1057 Pumps 1 and 2 2.55 0.270 0.06 850 Spiral +distributor + runner 3.49 0.418 0.137 852 The wave speed of the pipes L6 are determined experimentally and considered for the pipes L1 to L5 too. The cross section and equivalent length of the circulating pumps determination are described below. The same approach is used for the spiral casing, distributor, and the
paper_IAHR_2004_nicolet_final
22nd IAHR Symposium on Hydraulic Machinery and Systems June 29 – July 2, 2004 Stockholm – Sweden
8 (14)
runner of the turbine model, while the wave speed is determined using the phase shift at the frequency ~2.5fn between the turbine intake and the runner outlet pressure transducers. Hydraulic machines modeling The hydro-acoustic behavior of a turbine, a pump or a pump-turbine is modeled as an equivalent pipe for which the head losses are function of the slope of its static characteristic for the operating point of interest, according to Bolleter et al. (Ref. 14). However, the hydro-acoustic model is improved by considering a pressure source driven by the hydraulic characteristic of the machine instead of a pure resistance, see Figure 10.
Figure 10 Modeling of a hydraulic machine, turbine, pump or pump-turbine.
H=H(Qt, y,ω) Leq/4 Leq/4 Leq/2
By taking into account the constant area change of the machine cross section, the inductance term is evaluated according to:
( )
outtot
eqin
ldxLgA x g A
= =∫ ( 1 )
where: Ā: average area of the pump-turbine cross section [m2] ltot: total length of the pump-turbine in terms of curvilinear abscissa [m] The capacitance value is a function of the equivalent wave speed in the hydraulic machine. The evaluation of this term requires the knowledge of the bulk modulus of the water, Ew, and the variation of the cross section area under the pressure ∆A/(A*∆P). Bolleter (Ref. 14) performed investigations for a centrifugal pump and determined the RLC terms of the corresponding hydro-acoustic model. He demonstrated a good agreement between measurements and the predicted model for the inductance and the resistance terms. However, the model overpredicted the capacitance by twice the measured value. It allows estimating the wave speed for such a pump:
2
12002*
==aa = 850 m/s ( 2 )
Draft tube modeling A special attention is taken for the modeling of the draft tube which is considered as 2 parts. The first one extends from the outlet of the runner to the mid part of the elbow, where the wave speed is increasing downstream. The second part extends from the mid part of the elbow to the draft tube outlet, where the wave speed is constantly decreasing. In those two parts, the waves speed is assumed to vary linearly. The measured wave speed distribution along the 4 paths in the draft tube, see Figure 7, are averaged and the corresponding mean values reported Figure 12 as solid line.
HI HĪC1 C2 QĪQI Qt
paper_IAHR_2004_nicolet_final
22nd IAHR Symposium on Hydraulic Machinery and Systems June 29 – July 2, 2004 Stockholm – Sweden
9 (14)
The equivalent wave speed of the draft tube is deduced by integrating the wave speed along the curvilinear abscissa according to:
0
0
0
ln( )( )
x L xx L
x L x
x
a aL Ladt a adx
a x
= ==
= =
=
−= = =
∫ ( 3 )
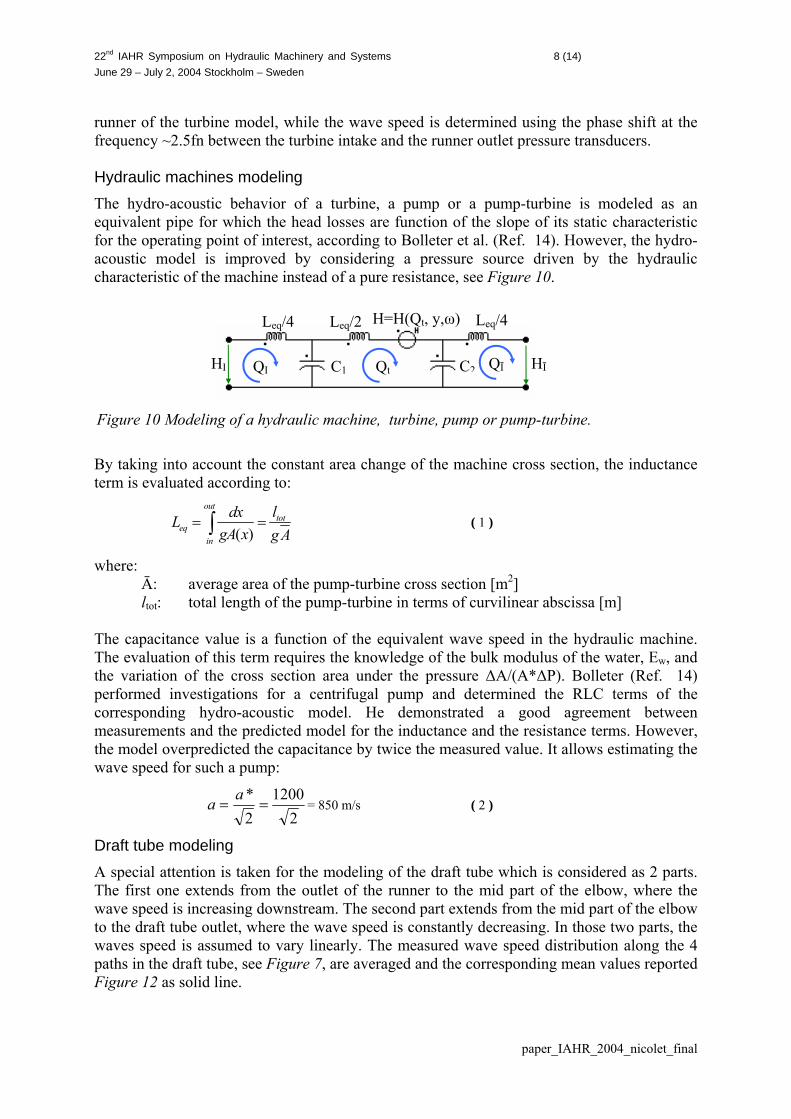
The mean wave speed, obtained for the 2 parts of the draft tube as well as the wave speed for the outlet part of the runner, see Figure 11, where the vortex rope is attached, are also reported Figure 12 as dashed line. The equivalent wave speed values of the two parts of the draft tube are given Table 3. The resulting 47 m/s wave speed value of the first part of the draft tube, takes into account the part of the rope in the runner.
Figure 11 Vortex rope development in the draft tube..
Figure
Table 3 Draft tube equivalent wave speed. Wave speed Outlet runner to elbow
x = 2.76 => 1.83m aequ 47 [m/s]
The draft tube model in SIMSEN is made 14 nodes. This hydro-acoustic model doeslocation, but distributes the compliance adata. This model allows analyzing the hydfrequency range, up to 60 Hz, see Coustontwo parts of the draft tube correspondingincluded in the model of Figure 9. Free oscillation analysis of the ful To make apparent the eigen frequencies completed by simulating the hydro-acoustnoise excitation. Thus a pseudo random bsource location resulting in a wide frequefluctuation obtained at every spatial node ifrequencies of the entire test rig are eviden
0.2 m
0.3 m
runner outlet +cone12 Mean wav(solid line)
Elbow to drafx = 1.83
308 [
of 2 pipes wit not concentrlong the drafro-acoustic be and Philiber to pressure
l test rig
of the entire ic behavior ofinary sequencncy range exs presented asced and summ
elbow
e speed in the and correspo
t tube outlet => 0m m/s]
h constant wavate the vortex t tube accordhavior of the t, Ref. 15). Tsource locatio
test rig, a fre the entire teste (PRBS) is gcitation. Spect a waterfall plarized Table 4
pape
channels outlet
draft tube measured nding mean values.
es speed with a total of rope compliance at one ing to the experimental entire test rig in a wider he junction between the n, a pressure source is
e oscillation analysis is rig considering a white enerated at the pressure ral analysis of pressure ot, see Figure 13. Eigen .
r_IAHR_2004_nicolet_final

22nd IAHR Symposium on Hydraulic Machinery and Systems June 29 – July 2, 2004 Stockholm – Sweden
10 (14)
Figure 13 Eigen mode of the pressure fluctuation spectrum of the full test rig.
Table 4 Eigen frequencies of the test rig. fo/fn f1/fn f2/fn f3/fn f4/fn f5/fn f6/fn f7/fn f8/fn f9/fn f10/fn f11/fnModeled 0.52 0.57 0.66 0.72 1.05 1.14 1.74 2.1 2.25 2.29 2.46 2.65Measured 2.5 In the frequency range 0 to 3fn, the system exhibits 12 eigen frequencies with one at 2.46fn, which corresponds to the pressure fluctuation peaks measured at ~2.5fn. The corresponding mode shape exhibits 5 pressure maxima along the test rig. One is located in the draft tube elbow. A simulation of the test rig dynamic behavior considering a sinus excitation function at the frequency of 2.46fn in the draft tube elbow provides the corresponding eigen mode shape, see Figure 14 and Figure 15. The amplitude of the excitation is optimized to fit the experimental pressure amplitudes in the draft tube elbow, leading to a pressure excitation source amplitude for the frequency 2.46fn, which is equal to 0.5% of the reference energy Eref. The pressure fluctuation profile obtained by simulation in the draft tube at the frequency 2.46fn presents good agreements with measurements, Figure 5. Moreover, pressure fluctuations at the turbine intake, element node 17, are found to correspond to a pressure maximum, which is in good agreement with the measurements too. Finally, one can notice the high amplitudes of discharge fluctuations in the draft tube cone, see Figure 14, due to the vortex rope compliance.
Figure 14 Eigen mode shape of the hydraulic system for f1/fn=2.46 at t=to.
Figure 15 Eigen mode shape of the hydraulic system for f1/fn=2.46 at t=to+T/4.
paper_IAHR_2004_nicolet_final

22nd IAHR Symposium on Hydraulic Machinery and Systems June 29 – July 2, 2004 Stockholm – Sweden
11 (14)
Forced oscillation analysis of the full test rig The pressure excitation source identified experimentally, located in the draft tube elbow, is related to both the shock phenomenon and the vortex rope precession. Therefore, a forced excitation analysis simulation is performed, considering both synchronous pressure fluctuations and Dirac impulsions at the frequency of the vortex rope. The synchronous excitation is considered for frope and the corresponding harmonics which are obtained experimentally by a decomposition procedure of the pressure fluctuations under cavitation free operating conditions as prescribed by Dörfler (Ref. 3). The pressure excitation source used for the simulation is presented Figure 16 right, and is expressed as follow:
1 11
2 2 3
1( ) ( ) sin(2 )
sin(2 (2 ) ) sin(2 (3 ) )
s syn ropek rope
syn rope syn rope
H t H t k H f tf
H f t H f
δ δ π ϕ
3tπ ϕ π
∞
=
= ⋅ − ⋅ + ⋅ ⋅ ⋅ ⋅ +
+ ⋅ ⋅ ⋅ ⋅ ⋅ + + ⋅ ⋅ ⋅ ⋅ ⋅ +
∑ϕ
( 4 )
The amplitude of the Dirac term of the pressure source excitation is adapted in order to obtain 0.5% of Eref in the spectral decomposition of the excitation signal at the frequency of 2.46fn. The amplitude of the Dirac impulsion is found to be 5% of Eref. The resulting pressure fluctuation spectra obtained for every element node are presented as a waterfall diagram, Figure 16. One can notice, that even if the test rig presents several eigen frequencies in the frequency range 0 to 10fn, the only significant pressure amplitudes correspond to 0.72fn, 2.46fn, 5fn and 7.5fn, and are in good agreements with the measurements. A comparison between simulation and measurements of pressure fluctuations resulting from forced excitation in the upper part of the cone is presented Figure 17. The numerical simulations at the upper part of the cone show good agreement with the experimental values for the frequencies of interest, i. e. vortex rope precession and all the harmonics, eigen frequencies of the hydraulic system. However, for the others frequencies the pressure amplitudes are lower because the forced excitation used in the simulation does not take into account the broad band excitation.
Figure 16 Pressure fluctuation spectrum resulting from the synthesized forced excitation, right.
paper_IAHR_2004_nicolet_final

22nd IAHR Symposium on Hydraulic Machinery and Systems June 29 – July 2, 2004 Stockholm – Sweden
12 (14)
Figure 17 Comparison of pressure fluctuations in the upper cone section.
Attempt to prototype transposition The direct transposition of the pressure fluctuations to the prototype for the same operating point is not feasible unless performing a new simulation of the hydro-acoustic behavior of the whole power plant under forced excitation. This new simulation requires modeling of the whole power plant, from the upstream reservoir to the downstream reservoir, considering all the hydraulic components with the appropriate hydro-acoustic parameters. For the draft tube component, the parameters can be transposed from scale model to prototype. This transposition of the hydro-acoustic parameters of the SIMSEN model, see Figure 18 left, requires the re-evaluation of all the parameters of the model according to the topology of the prototype and considering the scale effect. While the inductance terms depend on the geometry only, the capacitance terms are relative to the local compliance of the cross section. According to the electrical analogy, the local compliance is equivalent to a capacitance Ceq corresponding to 2 capacitances in parallel, see Figure 18; one for the wall deformation and the water compressibility, Co, and one for the vortex rope compliance, Crope if any. For the part of the draft tube where the vortex rope is present, Crope is transposed provided that Froude and Thoma cavitation number similitude criteria are fulfilled. Those criteria ensure the similitude of the pressure field along the draft tube extension, thus ensuring a homologous vortex rope.
( , , , FrMropePrope
CF
Cϕ ψ σ= ) ( 5 )
Moreover, according to Jacob (Ref. 17), pressure source excitations induced by vortex rope precession, can also be transposed by following the same similitude criteria.
Hs(t)
Figure 18 Hydro-acoustic model of the draft tube and the equivalent capacitance of a single
element.
L1 Lk+1L1 Lk Lk Lk+1 Ln Ln
Ceq Co CropeHnH1 Q1 Qn = QkCk Ck+1 CnC1
Vortex rope + Pressure excitation Channels
paper_IAHR_2004_nicolet_final

22nd IAHR Symposium on Hydraulic Machinery and Systems June 29 – July 2, 2004 Stockholm – Sweden
13 (14)
Conclusion This paper presents the analysis of the origin of pressure fluctuations measured in the elbow draft tube of a Francis turbine scale model for low discharge operation. A component of pressure fluctuation at ~2.5fn frequency is identified all along the draft tube walls, the source of those pressure fluctuations being located at the inner part of the draft tube elbow. The source energy extends over a wide frequency range and it seen as the result of the impacts of the vortex rope on the draft tube wall at this location. The analysis of the pressure fluctuations phases for the ~2.5fn frequency provides a way to determine the experimental wave speeds along the draft tube, which are the key parameters for a numerical simulation of the hydro-acoustic behavior of the test rig. The simulation carried out for the full test rig, taking into account piping, circulating pumps and the scale turbine model with the elbow draft tube shows that the ~2.5fn frequency value corresponds to an eigen frequency of the system. Therefore, a model of the excitation source is synthesized as a forcing function made of the superposition of the dominant components of the rope precession signal and a series of Dirac pressure impulses at the vortex rope frequency. The forced system response reveals predominant amplitudes at the ~2.5fn eigen frequency, in agreement with the excitation mechanism model. Moreover, an attempt of transposition procedure of draft tube hydro-acoustic parameters from scale model to prototype is suggested, requiring to fulfill the Froude and Thoma similitude as it could be expected! The envisioned transposition procedure enables to use an advanced simulation tool like SIMSEN, Ref. 18., to build up a realistic dynamic behavior model of a full hydroelectric power plant considering excitation source, hydraulic layout, hydraulic machine, electrical machine, transformer, grid and control system. Acknowledgments The authors would like to thank particularly all the partners of the FLINDT II Eureka Project No 1625, i. e. ALSTOM Hydro, EDF-CIH, GE Hydro, VA TECH Hydro, VOITH-SIEMENS Hydro Power Generation for their financial support and assistance. The FLINDT II project is funded by PSEL, Funds for Projects and Studies of the Swiss Electric Utilities, Contract award No 126, and CTI, Swiss Federal Commission for Technology and Innovation, Contract award No 5190.2 EUS. The authors would like also to thank gratefully Dr. G. Ciocan, for its contribution to the results analysis of this work. For this paper, the authors took advantages of the development of the SIMSEN hydraulic extension, developed in collaboration with P. Allenbach, Dr. A. Sapin, and Prof. J.-J. Simond from the EPFL Laboratory for Electrical Machines under the following contract awards: CTI No 5750.1 EBS, PSEL No 215 Scapin, EDF-CIH, HMD 420.210.3459. References Ref. 1 Jacob, T., "Evaluation sur modèle réduit et prédiction de la stabilité de
fonctionnement des turbines Francis." Thesis. Lausanne: EPFL, 1993.
Ref. 2 Rheingans, W. J., "Power swing in hydroelectric power plants." Transaction, American Society of Mechanical Engineers, Vol. 62, pp 171-184, 1940.
Ref. 3 Dörfler, P. K., "System dynamics of the Francis turbine half load surge." IAHR Symposium, Amsterdam, paper 39, 1982.
paper_IAHR_2004_nicolet_final

22nd IAHR Symposium on Hydraulic Machinery and Systems June 29 – July 2, 2004 Stockholm – Sweden
14 (14)
Ref. 4 Nishi, M., "Surging characteristics of conical and elbow type draft tubes."
Proceeding of the 12th IAHR Symposium, Stirling, p272-283, 1984.
Ref. 5 Angelico, F. M. G., Muciaccia, F. F., Rossi, G., "Part load behavior of a turbine: a study on a complete model of a hydraulic power plant," Proceedings of the IAHR Symposium, paper 17, Montreal, 1986.
Ref. 6 Dörfler, P. K., "Observation of the pressure pulsation on Francis model turbine with high specific speed." Hydropower & Dams, p21-26, January 1994.
Ref. 7 Avellan, F., "Flow investigation in a Francis Draft Tube: The FLINDT project," Proceedings of 20th IAHR Symposium, Charlotte, USA, 2000.
Ref. 8 Arpe, J., "Analyse du champ de pression pariétale d'un diffuseur coudé de turbine Francis." Thesis EPFL n°2779, Lausanne, 2003.
Ref. 9 "IEC 60913 Standard Hydraulic Turbines, Storage Pumps and Pump-Turbines-Model Acceptance Tests" International Electrotechnic Commission, Genève 1999.
Ref. 10 Arpe, J., Avellan, F.; "Pressure wall measurements in the whole draft tube : steady and unsteady analysis ". Proceedings of the 21st IAHR Symposium, Lausanne, pp. 593-602, 2002.
Ref. 11 Nicolet, C., Avellan, F., Allenbach, P., Sapin, A., Simond, J.-J., "New Tools for the Simulation of Transient Phenomena in Francis Turbine Power Plants". Proceedings of the 21st IAHR Symposium, Lausanne, pp. 519-528, 2002.
Ref. 12 Bergeron, L.; “Du coup de Bélier en hydraulique au coup de foudre en électricité”. Dunod, 1950.
Ref. 13 Paynter, H. M.; “Surge and water hammer problems”. Transaction of ASCE, vol. 146, p 962-1009, 1953.
Ref. 14 Bolleter, U. et al.: "Hydraulic and mechanical interactions of feedpump systems". EPRI Report TR-100990, Sept. 1992.
Ref. 15 Philibert, R., Couston, M., 1998, Francis turbine at part load : "Matrix simulating the gaseous rope". In Proc. Of the 19th IAHR Symposium (Singapore, 9-11 September 1998), vol. 1, pp. 441-453.
Ref. 16 Dörfler, P. K., "System oscillations ecxited by the Francis turbine’s part load vortex core: mathematical modeling and experimental verification." (in German) Dissertation Techn. University Vienna. 1982.
Ref. 17 Jacob, T., “Similitude in stability of operation tests for Francis turbine”. Hydropower & Dams, volume one, January 1994.
Ref. 18 Nicolet, C., Avellan, F., Allenbach, P., Sapin, A., Simond, J.-J., Herou, J.-J.; "Transient Phenomena in Francis Turbine Power Plants : Interaction with the Power Network ". IAHR Work Group on the Behavior of Hydraulic Machinery under Steady Oscillatory Conditions, Stuttgart, Germany, 8-10 October 2003.
paper_IAHR_2004_nicolet_final


![Francis Turbine [Compatibility Mode]](https://img.pdfslide.us/doc/110x75/55cf92f8550346f57b9ab6be/francis-turbine-compatibility-mode.jpg)