Embed Size (px)
Citation preview

No portion of this report may be reproduced, reused, or otherwise distributed in any form without prior written consent.
Franchise Business Economic Outlook for 2017
August Forecast Update
Prepared for:
International Franchise Association Franchise Education and Research Foundation
By:
IHS Markit Economics
August 2017

No portion of this report may be reproduced, reused, or otherwise distributed in any form without prior written consent.
About IHS Markit Economics IHS Economics is one of the leading economic analysis and forecasting firms in the world. With over 600 economists and industry specialists in 25 offices worldwide, IHS Economics offers market intelligence for over 200 countries and coverage of over 170 industries that helps more than 3,800 clients to monitor, analyze, and interpret conditions affecting their business. IHS Economics has an established track record for providing rigorous, objective forecast analysis and data to businesses, governments, and industry associations around the world.
About IHS Markit (www.ihs.com) IHS Markit (NASDAQ: INFO) is the leading source of insight, analytics and expertise in critical areas that shape today’s business landscape. Businesses and governments in more than 150 countries around the globe rely on the comprehensive content, expert independent analysis and flexible delivery methods of IHS Markit to make high-impact decisions and develop strategies with speed and confidence. IHS Markit is a dynamic team that includes more than 5,000 analysts, data scientists, financial experts and industry specialists. IHS Markit delivers its clients a powerful combination of world-class expertise, knowledge and solutions so they can make more informed decisions to enable their long-term, sustainable growth.
For more information, contact:
John Reynolds President, IFA Franchise Education and Research Foundation
Brendan O’Neil Managing Director, IHS Economics
For press information, contact:
Katherine Smith Media Relations Manager, IHS
(C) Copyright 2017. IFA Franchise Education and Research Foundation. ALL RIGHTS RESERVED.
All information contained herein is obtained by IHS Economics from sources believed by it to be accurate and reliable. All forecasts and predictions contained herein are believed by IHS Economics to be as accurate as the data and methodologies will allow. Because of the possibilities of human and mechanical error, however, as well as other factors such as unforeseen and unforeseeable changes in political and economic circumstances beyond IHS Economics control, the information herein is provided “as is” without warranty of any kind, and IHS Economics, AND ALL THIRD-PARTY PROVIDERS, MAKE NO REPRESENTATIONS OR WARRANTIES EXPRESS OR IMPLIED TO ANY SUBSCRIBER OR ANY OTHER PERSON OR ENTITY AS TO THE ACCURACY, TIMELINESS, COMPLETENESS, MERCHANTABILITY, OR FITNESS FOR ANY PARTICULAR PURPOSE OF ANY OF THE INFORMATION OR FORECASTS CONTAINED HEREIN.

No portion of this report may be reproduced, reused, or otherwise distributed in any form without prior written consent.
Table of Contents
EXECUTIVE SUMMARY .................................................................................................................................. 1
Franchise Business Index .......................................................................................................................... 4
INTRODUCTION ............................................................................................................................................. 6
THE ECONOMIC OUTLOOK ............................................................................................................................ 7
Policy Effects ............................................................................................................................................. 9
OUTLOOK FOR FRANCHISE BUSINESS ......................................................................................................... 10
Outlook Summary ................................................................................................................................... 10
Establishments by Business Line ............................................................................................................. 17
Employment by Business Line ................................................................................................................. 18
Output by Business Line .......................................................................................................................... 20
Franchise Businesses' Contribution to GDP ............................................................................................ 21
Distribution by Sector ............................................................................................................................. 21
Output per Employee .............................................................................................................................. 23
State Franchise Outlook .............................................................................................................................. 25
State Overview ........................................................................................................................................ 25
Appendix A: Composition of Franchise Business Lines ........................................................................... 28
Appendix B: Methodology ...................................................................................................................... 29

No portion of this report may be reproduced, reused, or otherwise distributed in any form without prior written consent.

IHS Economics Page 1 No portion of this report may be reproduced, reused, or otherwise distributed in any form without prior written consent.
EXECUTIVE SUMMARY
This report presents an update of the outlook for the franchise sector of the US economy in 2017
prepared by IHS Markit Economics for the International Franchise Association’s Franchise Education and
Research Foundation (FERF).
The economy has positive momentum moving into the second half of 2017. After growth in the first half
that fell short of expectations, real GDP is projected to increase at annual rates of 3.1% in the third
quarter and 2.4% in the fourth quarter. Our forecast of real GDP growth for all of 2017, at 2.1%, is down
slightly from the 2.3% forecast at the time of our January 2017 report on the franchise business outlook.
Growth will be broadly based, with solid gains in consumer spending, residential investment, business
fixed investment, and exports. Real consumer spending got back on track in the second quarter and is
projected to increase at 2.6–2.7% annual rates during the final two quarters of 2017. Household
finances continue to improve, supported by gains in employment, real incomes, stock prices, and home
values. Government spending is also expected to increase after falling in the first quarter, due to the
release of federal funds for surface transportation projects and additional funding of defense and
security.
The IFA/IHS Franchise Business Index continues to signal steady growth in the franchise sector. The
index was 2.4% above its year-ago level in June, matching the pace at the end of 2016. However,
franchise employment growth as reported by ADP has slowed somewhat in the first half of the year
after posting the highest growth rate in 2016 since the series began in 2011. Growth of the franchise
restaurant business lines, which account for nearly three-fifths of franchise employment, has been
slower than expected, and this will contribute to slightly slower growth of overall franchise sector
indicators in 2017. Nonetheless, we continue to project that the franchise sector will grow faster than
the overall economy in 2017 as it has in recent years:
We expect the number of franchise establishments to increase 1.6% in 2017 to 745 thousand.
Franchise employment is forecast to grow 3.1% in 2017, and franchise employment will
continue to outpace growth in businesses economy-wide. Total private nonfarm employment is
forecast to increase 1.7% this year.
The output of franchise businesses in nominal dollars is projected to increase 5.3% in 2017 to
$711 billion.
The gross domestic product (GDP) of the franchise sector will increase by 5.1% to $426 billion in
2017. This will exceed the growth of US GDP in nominal dollars, which is projected at 3.9%. The
franchise sector will contribute approximately 3% of US GDP in nominal dollars.
There is considerably greater uncertainty regarding the growth outlook for 2018. The IHS Markit view is
that modest fiscal stimulus (personal and corporate tax cuts, along with a boost in infrastructure
spending) is still possible and will help real GDP growth to accelerate to 2.7% next year. However, if such
stimulus is not forthcoming, we estimate that real GDP growth will be approximately 0.4 percentage
point lower in 2018, when the full impact of such stimulus would likely be felt. The good news is that the

IHS Economics Page 2 No portion of this report may be reproduced, reused, or otherwise distributed in any form without prior written consent.
fundamentals of the US economy remain solid enough that, even without any stimulus, it can amble
along at a decent pace for the next year or two.
While it is too early to assess the effects of Hurricane Harvey, it will likely increase the volatility of growth in the second half of 2017, with reduced growth in the third quarter offset by a boost to growth in the fourth.
This report also presents updated estimates of franchise growth in 2017 at the state level. Some
highlights include:
Franchise Business Economic Outlook: August 2017 Forecast
Forecast
2013 2014 2015 2016 2017
Establishments 697,944 708,974 720,458 733,297 745,078
Percent change 1.6% 1.6% 1.8% 1.6%
Employment ('000) 6,962 7,164 7,379 7,645 7,879
Percent change 2.9% 3.0% 3.6% 3.1%
Output ($Billions) 570.7 602.7 637.5 675.7 711.4
Percent change 5.6% 5.8% 6.0% 5.3%
GDP ($Billions) 344.4 363.2 382.9 405.0 425.6
Percent change 5.5% 5.4% 5.8% 5.1%

IHS Economics Page 3 No portion of this report may be reproduced, reused, or otherwise distributed in any form without prior written consent.
States in the South and West will lead the nation in franchise employment and output growth in
2017. Economic growth in both regions has benefited greatly in recent years from renewed
flows of domestic migration.
Strength in services has proved to be a prominent economic driver in these regions. Particularly
in the West South Central region, the service sector has helped offset the oil related disruption.
Low oil prices have provided stimulus to consumers and, in turn, help sectors closely tied to
discretionary spending such as leisure/hospitality and retail trade.
Our analysis is based on a grouping of franchise businesses into 10 broad business lines. The growth
outlook differs among the groups, with output growth in 2017 ranging from a low of 3.0% in the
Commercial & Residential Services business line to 6.1% in Personal Services. Other highlights of the
revised industry forecast for 2017 are:
Franchise Personal Services have experienced strong growth over the past year, and in our
updated forecast the Personal Services business line is now projected to rank first in growth of
the number of establishments, employment and output in 2017.
After a very strong year of employment and output growth in 2016, the franchise restaurant
business lines are seeing slower growth this year. Still, the franchise Quick Service Restaurant
and Table/Full Service Restaurants business lines will rank 2nd and 3rd, respectively, in
employment and output growth in 2017.
The nation’s housing outlook, while still showing month-to-month volatility, has improved since
the beginning of the year. We have revised our forecast of the franchise Real Estate business
line up slightly, and it now ranks 4th in output growth in 2017, at 5.8%.
Franchise Business Economic Outlook 2017: August 2017 Forecast
Establishments
Amount
Percent
Change Over
Previous Year
Amount
Percent
Change Over
Previous Year
Amount
Percent
Change Over
Previous Year
Automotive 37,585 1.3% 195 2.5% 41.6 4.5%
Business Services 106,498 1.3% 640 2.1% 97.8 4.9%
Commercial & Residential Services 65,817 1.1% 247 1.0% 43.5 3.0%
Lodging 27,990 1.0% 619 1.1% 71.0 4.8%
Personal Services 109,666 2.5% 487 4.1% 34.9 6.1%
Quick Service Restaurants 190,649 1.8% 3,615 3.7% 236.8 6.0%
Real Estate 62,701 1.7% 250 2.3% 50.5 5.8%
Retail Food 52,608 0.8% 465 2.0% 37.6 3.7%
Retail Products & Services 60,187 1.5% 343 2.8% 30.7 5.8%
Table/Full Service Restaurants 31,377 1.6% 1,019 3.5% 67.0 5.8%
TOTAL 745,078 1.6% 7,879 3.1% 711.4 5.3%
Output
($Billions)
Employment
(thousands)

IHS Economics Page 4 No portion of this report may be reproduced, reused, or otherwise distributed in any form without prior written consent.
Franchise Business Index
The estimates of output, employment and the number of establishments in the franchise industry
reported here provide valuable measures of the size and growth of the industry. But, because most of
the key data inputs required to make these estimates are published only on an annual basis, the
estimates are made only at an annual frequency. A more timely reading of the business environment for
franchise operations in the US is provided by the Franchise Business Index (FBI) – a monthly index of
franchise activity that was developed for IFA by IHS Markit. The FBI combines indicators of the growth or
decline of industries where franchise activity has historically been concentrated with measures of the
demand for franchise business services and the general business environment. The components of the
index are:
Employment in Franchise Businesses (ADP)
Number of Self Employed (BLS)
Unemployment Rate (BLS)
Retail Sales of Franchise-Intensive Industries (Census Bureau)
Small Business Optimism Index (NFIB)
Small Business Credit Conditions Index (NFIB)
The Franchise Business Index continues to signal steady growth in the franchise sector. A slight
downturn in June reflects the volatility seen in the monthly economic data this year due to the
uncertainty around policy and global events. The FBI increased by an average 0.1% per month over the
last three months for which data are available (April through June 2017), and the index was up 2.4% in
June compared to June 2016. This matches the year-over-year pace at the end of 2016.
Over the most recent 3-month period all components of the index made positive contributions to the
FBI except for credit conditions, which slowed by an average -0.2%. Among individual components,
strong gains in retail sales of franchise-intensive retailers contributed most. The self-employment
component neither increased nor decreased on average over the 3-month period.
Mar Apr May June 12-month
2017 2017 2017 2017 June-June
Franchise Business Index 122.0 122.2 122.4 122.3
Percent Change 0.2% 0.2% 0.1% -0.1% 2.4%

IHS Economics Page 5 No portion of this report may be reproduced, reused, or otherwise distributed in any form without prior written consent.

IHS Economics Page 6 No portion of this report may be reproduced, reused, or otherwise distributed in any form without prior written consent.
INTRODUCTION
This report presents an update of the outlook for the franchise sector of the US economy in 2017
prepared by IHS Markit Economics for the International Franchise Association Franchise Education and
Research Foundation.
The following section presents a summary of the current IHS forecast of the US economy in 2017, with
attention to economic indicators that relate to sectors of the economy where there is a significant
concentration of franchising.
We then present an overview of our estimates and forecasts of franchising for 10 business lines: 1
1. Automotive
2. Business Services
3. Commercial & Residential Services
4. Lodging
5. Personal Services
6. Quick Service Restaurants
7. Table/Full Service Restaurants
8. Real Estate
9. Retail Food
10. Retail Products and Services
For each of the 10 business format lines, the projections include estimates from 2013 through 2016 and
an initial forecast for 2017 of:
Franchise establishments2
Franchise employment3
Franchise nominal output4
This report also includes a forecast of 2017 franchise growth in each of the 50 states and Washington,
DC for employment, establishments, payroll and output.
1 This report does not include estimates for product-distribution franchises, such as automotive and truck dealers,
gasoline service stations without convenience stores, and beverage bottlers.
2 An establishment is a single physical location at which business is conducted or services or industrial operations
are performed. A business may consist of more than one establishment. An establishment may be owned by the franchisor or the franchisee. 3 Positions filled by part-time and full-time employees or by self-employed individuals.
4 Nominal output is the gross value of goods and services produced -- a concept that is comparable with "sales" for
most industries. In government input-output accounts, the output of goods-producing industries is measured by the value of shipments. For most other industries, output is measured by receipts or revenues from goods and services sold. A special case is the output of the wholesale and retail industries, which is measured generally as the difference between receipts or revenues and the cost of goods sold—this difference is referred to as "margin."
IHS Economics Page 7 No portion of this report may be reproduced, reused, or otherwise distributed in any form without prior written consent.
THE ECONOMIC OUTLOOK
Recent data on the US economy have been mixed. While the underlying fundamentals driving consumer
spending remain positive—a strong job market, more-than-adequate income and wealth gains, and
elevated levels of consumer confidence—recent readings on automotive sales, retail sales, and overall
consumer spending suggest that American households are taking a breather. However, this spending
hiatus is likely temporary and not the beginning of an extended period of softness. IHS Markit expects
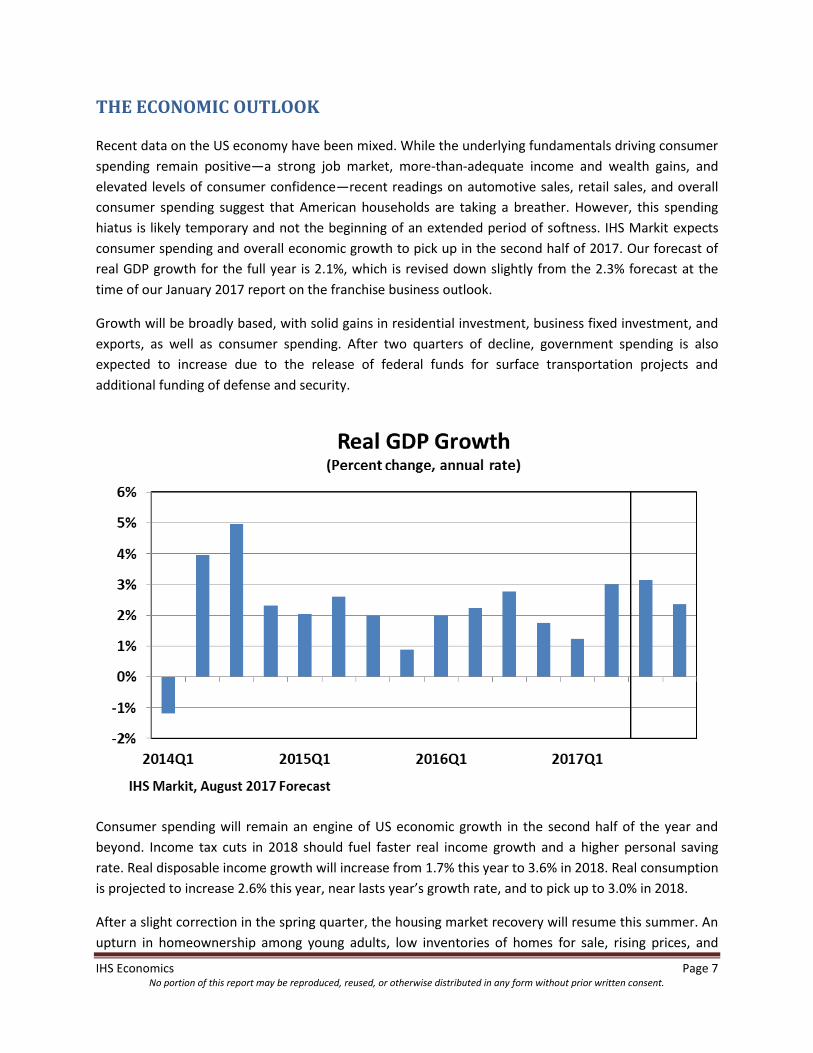
consumer spending and overall economic growth to pick up in the second half of 2017. Our forecast of
real GDP growth for the full year is 2.1%, which is revised down slightly from the 2.3% forecast at the
time of our January 2017 report on the franchise business outlook.
Growth will be broadly based, with solid gains in residential investment, business fixed investment, and
exports, as well as consumer spending. After two quarters of decline, government spending is also
expected to increase due to the release of federal funds for surface transportation projects and
additional funding of defense and security.
Consumer spending will remain an engine of US economic growth in the second half of the year and
beyond. Income tax cuts in 2018 should fuel faster real income growth and a higher personal saving
rate. Real disposable income growth will increase from 1.7% this year to 3.6% in 2018. Real consumption
is projected to increase 2.6% this year, near lasts year’s growth rate, and to pick up to 3.0% in 2018.
After a slight correction in the spring quarter, the housing market recovery will resume this summer. An
upturn in homeownership among young adults, low inventories of homes for sale, rising prices, and

IHS Economics Page 8 No portion of this report may be reproduced, reused, or otherwise distributed in any form without prior written consent.
homebuilder optimism should lead to more construction. Thus, real residential fixed investment is
projected to increase at a 3.9% average annual rate over the third and fourth quarters.
After stalling in 2016, capital spending revived in the first half of 2017. Business fixed investment saw its
strongest jump in five years during the first quarter, boosted by over-the-top real spending growth on
mines and wells. Expanding global markets, relatively low financing costs, and an improving regulatory
climate are also driving the upturn in investment. Real nonresidential fixed investment is expected to
advance at a 4.9% annual rate during the second half, led by transportation equipment and commercial
construction.
Both imports and exports have picked up from last year. Strengthening world demand and the fading
effects of the strong dollar have boosted exports. Currency markets initially factored in an acceleration
in US growth in 2017 due to lower corporate tax rates and a rollback of regulations. As the likelihood of
these receded, the dollar lost ground and is now back to where it stood before the election. Meanwhile,
stronger domestic demand – particularly for capital goods – has strengthened import growth. Both
exports and imports are expected to increase steadily over the next two years.
The Economic Outlook for 2017
(Annual percent change) 2013 2014 2015 2016 2017
Real Gross Domestic Product 1.7% 2.6% 2.9% 1.5% 2.1%
Total Nonfarm Employment 1.6% 1.9% 2.1% 1.8% 1.5%
Accommodations and Food Services 3.6% 3.0% 3.2% 3.0% 2.3%
Personal Services 1.0% 1.5% 1.0% 1.1% 1.2%
Real Disposable Income -1.4% 3.6% 4.2% 1.4% 1.7%
Real Personal Consumption 1.5% 2.9% 3.6% 2.7% 2.6%
Food Services 1.3% 3.3% 4.5% 2.7% 1.0%
Accommodations 4.1% 3.4% 3.1% 0.9% 3.7%
Personal Services -1.0% 2.6% 2.2% 4.1% 3.1%
Retail Sales (nominal dollars) 3.8% 4.2% 2.6% 3.0% 3.8%
Existing Home Sales 9.1% -3.1% 6.3% 3.9% 2.5%
Com'l & Indus. Loans Outstanding, Com'l.Banks 6.8% 12.6% 10.3% 7.3% 2.4%
IHS Markit Economics, August 2017 Forecast

IHS Economics Page 9 No portion of this report may be reproduced, reused, or otherwise distributed in any form without prior written consent.
Policy Effects
There is considerably greater uncertainty regarding the growth outlook for 2018. The IHS Markit view is
that modest fiscal stimulus (personal and corporate tax cuts, along with a boost in infrastructure
spending) is still possible and will help real GDP growth to accelerate to 2.7% next year. Our outlook
incorporates our take on policies proposed by the new administration: lower personal and corporate
federal taxes, somewhat consistent with the House Republican plan (but excluding the border-
adjustment tax); removal of some tax loopholes; $800 billion in overseas profits repatriated to face a
10% tax; and $250 billion in additional infrastructure spending over 10 years.
However, if such stimulus is not forthcoming, we estimate that real GDP growth will be approximately
0.4 percentage point lower in 2018, when the full impact of such stimulus would likely be felt. The good
news is that the fundamentals of the US economy remain solid enough that, even without any stimulus,
it can amble along at a decent pace for the next year or two.
Hurricane Harvey will increase the volatility of growth in the third and fourth quarters.
While it is still too early to do a full damage assessment as this report is being prepared, Harvey is
shaping up to be the second or third worst hurricane in recent US history. The cost of the storm is
currently estimated to come in somewhere between $60 billion and $80 billion. Hurricane Katrina, which
devastated New Orleans, cost around $110 billion. Hurricane Sandy, which slammed the Caribbean, US
East Coast and, especially, New York City, cost about $75 billion. Mercifully, the death toll, so far, from
Harvey (less than 50) is much lower than either Katrina (around 1,800) or Sandy (around 250, of which
about 70 were in the United States).
As is common with such happened with past storms, Harvey will hurt near-term growth. Loss of life,
damaged infrastructure (especially in the energy and chemicals sectors), and disrupted businesses will
take a huge toll on the devastated areas. Given the importance of the energy and chemicals sectors
along both the Texas and Louisiana Gulf coasts, the impact on the overall economy will also be
noticeable. However, as in the case of past storms, the reconstruction efforts—which will likely kick into
high gear in the fourth quarter—will boost growth.
The extent of the reduction in growth in the third quarter and the rebound in the fourth will depend on a
number of factors, including the duration of the storm, the extent of the damage to key segments of the
affected economies, and how quickly the reconstruction efforts can get underway.
Early estimates put the range of third-quarter growth reductions at 0.3–1.5 percentage points. Given
what we know now, IHS Markit expects that growth in the third quarter—which was previously estimated
at around 3.5%—to be cut by 0.5–0.6 percentage point. Fourth-quarter growth—previously estimated at
around 2.4%—will likely be bumped up by a few tenths of a percentage point.
The bottom line is that despite the hurricane-induced volatility, average growth in the second half of 2017
is still likely to come in between 2.5% and 3.0%.
IHS Economics Page 10 No portion of this report may be reproduced, reused, or otherwise distributed in any form without prior written consent.
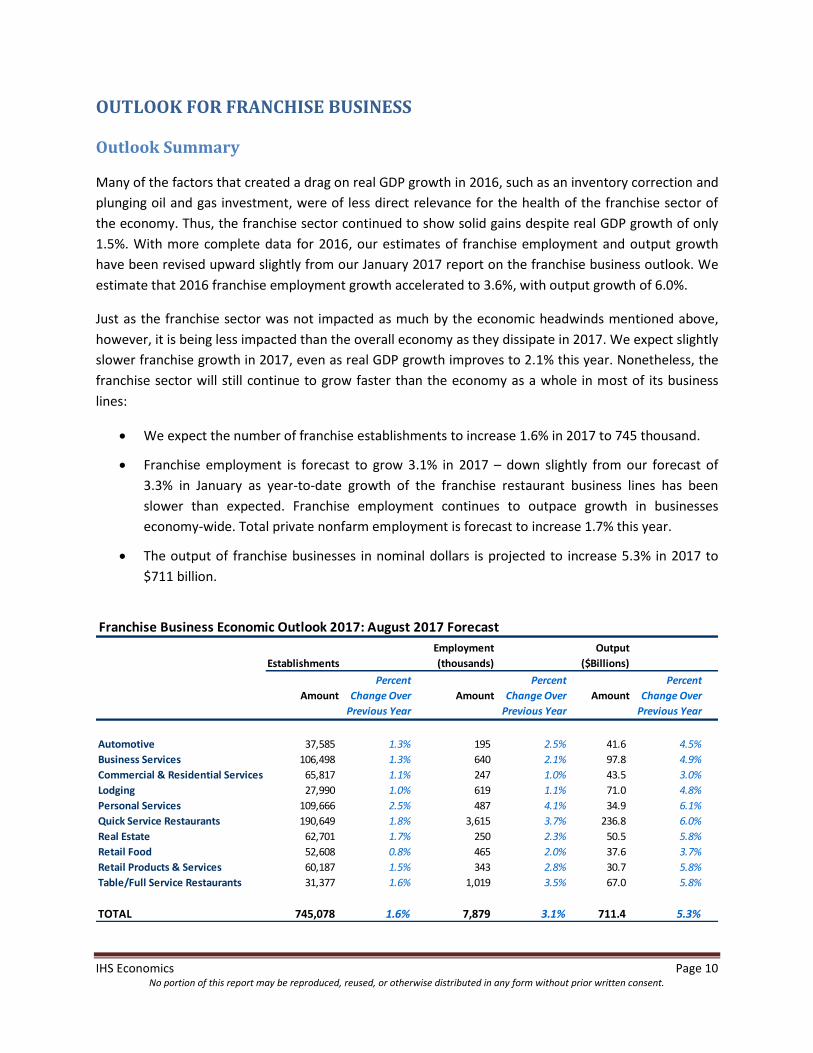
OUTLOOK FOR FRANCHISE BUSINESS
Outlook Summary
Many of the factors that created a drag on real GDP growth in 2016, such as an inventory correction and
plunging oil and gas investment, were of less direct relevance for the health of the franchise sector of
the economy. Thus, the franchise sector continued to show solid gains despite real GDP growth of only
1.5%. With more complete data for 2016, our estimates of franchise employment and output growth
have been revised upward slightly from our January 2017 report on the franchise business outlook. We
estimate that 2016 franchise employment growth accelerated to 3.6%, with output growth of 6.0%.
Just as the franchise sector was not impacted as much by the economic headwinds mentioned above,
however, it is being less impacted than the overall economy as they dissipate in 2017. We expect slightly
slower franchise growth in 2017, even as real GDP growth improves to 2.1% this year. Nonetheless, the
franchise sector will still continue to grow faster than the economy as a whole in most of its business
lines:
We expect the number of franchise establishments to increase 1.6% in 2017 to 745 thousand.
Franchise employment is forecast to grow 3.1% in 2017 – down slightly from our forecast of
3.3% in January as year-to-date growth of the franchise restaurant business lines has been
slower than expected. Franchise employment continues to outpace growth in businesses
economy-wide. Total private nonfarm employment is forecast to increase 1.7% this year.
The output of franchise businesses in nominal dollars is projected to increase 5.3% in 2017 to
$711 billion.
Franchise Business Economic Outlook 2017: August 2017 Forecast
Establishments
Amount
Percent
Change Over
Previous Year
Amount
Percent
Change Over
Previous Year
Amount
Percent
Change Over
Previous Year
Automotive 37,585 1.3% 195 2.5% 41.6 4.5%
Business Services 106,498 1.3% 640 2.1% 97.8 4.9%
Commercial & Residential Services 65,817 1.1% 247 1.0% 43.5 3.0%
Lodging 27,990 1.0% 619 1.1% 71.0 4.8%
Personal Services 109,666 2.5% 487 4.1% 34.9 6.1%
Quick Service Restaurants 190,649 1.8% 3,615 3.7% 236.8 6.0%
Real Estate 62,701 1.7% 250 2.3% 50.5 5.8%
Retail Food 52,608 0.8% 465 2.0% 37.6 3.7%
Retail Products & Services 60,187 1.5% 343 2.8% 30.7 5.8%
Table/Full Service Restaurants 31,377 1.6% 1,019 3.5% 67.0 5.8%
TOTAL 745,078 1.6% 7,879 3.1% 711.4 5.3%
Output
($Billions)
Employment
(thousands)

IHS Economics Page 11 No portion of this report may be reproduced, reused, or otherwise distributed in any form without prior written consent.
The gross domestic product (GDP) of the franchise sector will increase by 5.1% to $426 billion in 2017.
This will exceed the growth of US GDP in nominal dollars, which is projected at 3.9%. The franchise
sector will contribute approximately 3% of US GDP in nominal dollars.
The following chart shows how the franchise economy has fared over the last three years, along with
our 2017 forecast, by various measures. Growth rates of output and GDP are in nominal dollars.
To provide background for our view of how different segments of the franchise sector will fare in 2017,
we review IHS forecasts of employment and output in the industries where there is a large
concentration of franchise businesses. Key drivers of the franchise economy drawn from the IHS US
Industry and US Macroeconomic forecasts are summarized below.
Automotive: Light-vehicle unit-sales peaked in December, and all but one month since then has
suffered a decline. June’s light vehicle sales slowed to a 16.6-million-unit pace, the weakest showing
since October 2014. Total sales in the first half of 2017 were 2% below 2016. One factor in the demand
for new vehicles is the availability of credit, and credit standards for auto loans have increased markedly
this year. According to the New York Fed and Equifax, the median credit rating for customers granted
new auto loans jumped 6 points, to 706, in the first quarter – the largest increase in six quarters and the
highest level since first quarter 2011. New auto loan balances correspondingly took a step back. A
steady increase in auto loan delinquencies has provoked this caution by lenders. The share of auto loan
balances more than 30 days delinquent in the fourth quarter of 2016 was 7.46%, more than a
percentage point higher than at their low point in 2012. However, delinquent auto loans remain low by
recent standards. Lenders appear intent on keeping it that way. We expect total light vehicle sales in
2017 to be down 2.1%.

IHS Economics Page 12 No portion of this report may be reproduced, reused, or otherwise distributed in any form without prior written consent.
The growth of consumer spending on motor vehicle parts and accessories has also slowed. Spending in
nominal dollars in the first half of 2017 was only 1.6% above the corresponding period of 2016. We have
revised our January forecast of full-year consumer spending in this category downward to show growth
of only 1.3% in 2017 from 3.1% in 2016.
Franchise employment growth in the automotive business line is estimated to be 3.0% in 2016 and will
slow slightly to 2.5% in 2017. While this will outpace employment growth in the industry economy-wide
(measured as overall auto parts and tires retailers and the automotive service industry), it will keep the
automotive business line among the slower growing of the 10 franchise business lines, ranking fifth in
employment growth and eighth in output growth. Growth of the number of establishments in the
automotive business line will slow from 1.5% in 2016 to 1.3% in 2017.
Commercial & Residential Services: Economy-wide employment in facilities support services grew less
than 1% in 2016 and is negative on a year-over-year basis this year. ADP franchise employment data
show a similar pattern in a broader category of business services.
We project the commercial & residential services business line to grow at the slowest pace of the 10
franchise business lines in 2017. Our estimates of establishment, employment and output for this
business line show 2017 growth of 1.1%, 1.0% and 3.0%, respectively – near the estimated pace of
growth in 2016 in all instances.
Table/Full Service Restaurants: Various indicators related to the restaurant industry economy-wide
show a slow-down in 2017 compared to growth rates registered in 2016. Employment growth in all
restaurants slowed from 3.3% in 2016 to 2.4% in the first seven months of this year. Sales of restaurants
economy-wide show a similar slowdown from growth near 6% in 2016 to 3% in the first half of 2017 on a
non-seasonally adjusted basis. (The decline is smaller in the seasonally adjusted data, which do not

IHS Economics Page 13 No portion of this report may be reproduced, reused, or otherwise distributed in any form without prior written consent.
report QSR and full-service restaurants separately.) The broader personal consumption expenditures
category of spending on food services grew 5.4% in nominal dollars in 2016 and the IHS macroeconomic
forecast shows growth slowing to 3.4% in 2017. The retail sales data show slightly faster growth
economy-wide in the QSR business line compared with full-service restaurants in 2016 and year-to-date
in 2017.
We project employment growth in the franchise table/full service restaurants business line to slow from
4.0% in 2016 to 3.5% in 2017. Output growth will slow from 7.4% to 5.8%. Both 2017 growth rates have
been revised downward since our January 2017 report on the franchise business outlook. Despite this
expected slowdown, the table/full service restaurants business line will remain one of the growth
leaders among the 10 business lines, ranking third in both employment and output growth in 2017.
Quick Service Restaurants: A similar slowdown in employment and output in 2017 is projected for the
QSR business line. We project employment growth in the franchise QSR business line to slow from 4.6%
in 2016 to 3.7% in 2017. Output growth will slow from 7.5% to 6.0%. Again, both 2017 growth rates
have been revised downward slightly since our January 2017 report.
Growth of the franchise QSR business line will continue to slightly outpace the table/full service business
line, and the QSR business line will rank second only to personal services among the 10 business lines in
employment and output growth in 2017.
Retail Food: Although restaurants are expected to continue to do well in 2017, it is becoming
increasingly pricy to eat out compared with preparing food at home. For example, the IHS Markit

IHS Economics Page 14 No portion of this report may be reproduced, reused, or otherwise distributed in any form without prior written consent.
forecast of the price deflator for food for off-premises consumption shows an average price increase of
0.5% in 2016-2017 compared to a 2.6% average price increase for spending at restaurants. This should
help the retail food franchise business line.
Retail sales of food and beverage stores of all types (including their sales of non-food items) grew by
2.3% in 2016, and increased 2.5% on a year-over-year basis in the first half of 2017. Economy-wide
employment in the industry grew 0.9% in 2016 and slowed to a 0.4% pace in the first half of 2017. We
expect franchise employment and output within the retail food business line to outpace these industry-
wide growth trends. Our forecast for this business line shows a 2.0% increase in employment and 3.7%
growth of sales (output) in 2017. Among all 10 business lines, the Retail Food business line will rank 8th
in employment growth and 9th in output growth in 2017.
Lodging: Employment and output in the lodging industry has slowed over the last two years. Economy-
wide employment growth in the industry grew only 1.2% in 2016, and year-to-date growth in 2017 is
under 1%. Personal consumption expenditures on accommodations in nominal dollars, which measures
only household and not business spending, slowed to 3.5% growth in 2016 and but is expected to
improve in 2017. Similarly, recent ADP data on the franchise lodging industry show employment growth
near 1%.
We estimate that franchise employment in the lodging business line will grow 1.1% in 2017 – down from
1.4% in 2016. Output growth in the lodging business line is expected to grow 4.8% in 2017, ranking it 7th
among the 10 business lines.
0%
1%
2%
3%
4%
5%
6%
2013 2014 2015 2016 YTD 2017
Sales of Food and Beverage Stores: Growth in Nominal Dollars
Source: Census Bureau, Retail Sales

IHS Economics Page 15 No portion of this report may be reproduced, reused, or otherwise distributed in any form without prior written consent.
Real Estate: In housing markets, the supply of homes available for sale, new or existing, is not keeping
pace with demand. As a result, prices for new and existing homes have reached all-time highs. For the
first time ever, the average price of a new home topped $400,000 in May – nearly 10 times pricier than
the average home in 1975 –for an average annual increase of 5.6%. Rising prices and relatively
optimistic homebuilders should be spurring more building, but sporadic weakness in housing starts and
permits (especially in multifamily units) this year suggests that homebuilders may be facing challenges,
especially in getting the necessary financing to start new construction. Existing home sales fell 1.8% in
June. However, first-half existing home sales were up 3.0% over 2016, and we anticipate a pick-up in
housing market activity in the second half of the year. Our forecast of existing home sales has been
boosted compared to expectations at the beginning of the year and now shows a 2.5% gain in 2017.
Housing starts are projected to be up by 3.3%, led by a 7.5% increase in single-family starts.
We estimate that the output of the franchise real estate business line will increase 5.8% in 2017 – up
slightly from 5.5% growth in 2016 – ranking it 4th among the 10 business lines. Employment growth in
the real estate business line is expected to accelerate to 2.3% in 2017 – 6th among all business lines.
Retail Products & Services: Nonstore (mostly online) retailers continue to post double-digit growth
rates in sales, while the sales of many categories of brick-and-mortar stores have been flat to declining.
Department store and electronic store sales have been running negative, while clothing stores and
sporting goods stores have posted at best 1-2% growth. However, the franchise retail products &
services business line continues to outperform these other categories of retailers. We project
employment in franchise retail products & services will increase 2.8% in 2017 – fourth among all
business lines – and output will increase 5.8% -- fifth among business lines.
Business Services: The IHS Markit US Industry Service forecasts a slight slowdown in economy-wide
business services growth. Employment in professional and technical services, including accounting and
bookkeeping services and architectural and engineering services, has increased at a pace just above 3%
over the last two years, but growth is projected to slow to 2.4% in 2017. Output growth will be just
under 5%. The franchise business services industry has been one of the leaders among franchise
business lines in past years, but we estimate that employment growth in franchise business services
slowed to 2.3% in 2016 with output up only 5.0%. We project that growth based on both indicators will
slow further in 2017 to 2.1% and 4.9%, respectively, below average for the franchise sector as a whole.
Personal Services: The personal services business line includes a diverse array of services such as
educational services, health care, entertainment and recreation, personal and laundry services, and
selected financial activities. The growth of spending on personal services economy-wide has been
supported by gains in real income and household net worth. Household finances are also in excellent
shape, helped by the post-election stock market rally, rising home prices, and nearly a decade of
restraint in borrowing. Economy-wide personal consumption spending is expected to grow 4.3% in 2017
(in nominal dollars) after growing 4.0% in 2016.
ADP franchise employment data show a surge in the growth of franchise personal services over the last
two years, well ahead on economy-wide average growth, with somewhat slower growth for personal
IHS Economics Page 16 No portion of this report may be reproduced, reused, or otherwise distributed in any form without prior written consent.
service retailers. We estimate that employment in franchise personal services increased 4.0% in 2016
and will accelerate to 4.1% in 2017. Output is projected to be up 6.1% in 2017 following a 6.0% increase
in 2016. Franchise personal services will lead all other business lines in employment and output growth
in 2017.

IHS Economics Page 17 No portion of this report may be reproduced, reused, or otherwise distributed in any form without prior written consent.
Establishments by Business Line
We estimate that the total number of franchise establishments across all 10 business lines increased by
1.8% in 2016, and growth will slow slightly to 1.6% in 2017. The personal services line will take the lead
with 2.5% growth, followed closely by quick service restaurants at 1.8% and the real estate business line
at 1.7%.
Franchise Establishments by Business Line: August 2017 Forecast
Forecast
2013 2014 2015 2016 2017
Automotive 35,503 35,913 36,535 37,100 37,585
Percent change 1.2% 1.7% 1.5% 1.3%
Business Services 99,791 101,590 103,596 105,080 106,498
Percent change 1.8% 2.0% 1.4% 1.3%
Commercial & Residential Services 62,678 63,552 64,371 65,083 65,817
Percent change 1.4% 1.3% 1.1% 1.1%
Lodging 26,428 26,939 27,396 27,712 27,990
Percent change 1.9% 1.7% 1.2% 1.0%
Personal Services 100,398 102,635 104,333 106,940 109,666
Percent change 2.2% 1.7% 2.5% 2.5%
Quick Service Restaurants 178,133 180,717 183,332 187,368 190,649
Percent change 1.5% 1.4% 2.2% 1.8%
Real Estate 58,877 59,722 60,712 61,653 62,701
Percent change 1.4% 1.7% 1.5% 1.7%
Retail Food 50,320 50,933 51,649 52,165 52,608
Percent change 1.2% 1.4% 1.0% 0.8%
Retail Products & Services 56,292 57,144 58,238 59,326 60,187
Percent change 1.5% 1.9% 1.9% 1.5%
Table/Full Service Restaurants 29,524 29,829 30,296 30,870 31,377
Percent change 1.0% 1.6% 1.9% 1.6%
Total 697,944 708,974 720,458 733,297 745,078

IHS Economics Page 18 No portion of this report may be reproduced, reused, or otherwise distributed in any form without prior written consent.
Employment by Business Line
We estimate that total franchise employment grew 3.6% in 2016, but growth will slow to 3.1% in 2017
due primarily to slower growth in the restaurant business lines, which account for nearly three-fifths of
franchise employment. Despite their slower growth, the QSR and table/full service restaurant business
lines will continue to be the growth leaders, ranking second and third, respectively in 2017 employment
growth. Personal services will move up to the top spot with growth of 4.1%.

IHS Economics Page 19 No portion of this report may be reproduced, reused, or otherwise distributed in any form without prior written consent.
Franchise Employment by Business Line: August 2017 Forecast
Forecast
2013 2014 2015 2016 2017
Automotive 175,209 179,092 185,127 190,674 195,477
Percent change 2.2% 3.4% 3.0% 2.5%
Business Services 575,345 592,643 612,496 626,370 639,524
Percent change 3.0% 3.3% 2.3% 2.1%
Commercial & Residential Services 231,139 238,663 241,819 244,136 246,577
Percent change 3.3% 1.3% 1.0% 1.0%
Lodging 571,916 588,878 603,507 611,956 618,688
Percent change 3.0% 2.5% 1.4% 1.1%
Personal Services 425,360 440,062 450,230 468,239 487,437
Percent change 3.5% 2.3% 4.0% 4.1%
Quick Service Restaurants 3,135,711 3,232,917 3,332,861 3,486,173 3,615,161
Percent change 3.1% 3.1% 4.6% 3.7%
Real Estate 230,013 234,079 239,263 244,048 249,661
Percent change 1.8% 2.2% 2.0% 2.3%
Retail Food 420,313 431,819 445,270 455,511 464,621
Percent change 2.7% 3.1% 2.3% 2.0%
Retail Products & Services 301,604 310,433 321,999 333,695 343,038
Percent change 2.9% 3.7% 3.6% 2.8%
Table/Full Service Restaurants 895,391 915,703 946,317 984,170 1,018,616
Percent change 2.3% 3.3% 4.0% 3.5%
Total 6,962,001 7,164,289 7,378,889 7,644,972 7,878,800
0.0%
0.5%
1.0%
1.5%
2.0%
2.5%
3.0%
3.5%
4.0%
2014 2015 2016 2017
Franchise Business Employment Growth: August 2017 Forecast

IHS Economics Page 20 No portion of this report may be reproduced, reused, or otherwise distributed in any form without prior written consent.
Output by Business Line
We estimate that total output across all franchise business lines grew 6.0% in 2016 – up from 5.8%
growth recorded in 2015. We expect the pace of growth in 2017 to slow to 5.3% due to slower growth of
the restaurant industry. Both the QSR and table/full service restaurant business lines will see slower
growth in 2017, but they will remain among the growth leaders, ranking second and third, respectively,
behind the personal services business line.
Franchise Output by Business Line: August 2017 Forecast
Forecast
($billions) 2013 2014 2015 2016 2017
Automotive 34.57 36.15 37.94 39.82 41.61
Percent change 4.6% 5.0% 5.0% 4.5%
Business Services 79.09 83.78 88.77 93.24 97.78
Percent change 5.9% 6.0% 5.0% 4.9%
Commercial & Residential Services 37.70 39.37 40.99 42.20 43.46
Percent change 4.4% 4.1% 3.0% 3.0%
Lodging 56.89 60.63 64.43 67.71 70.96
Percent change 6.6% 6.3% 5.1% 4.8%
Personal Services 28.27 29.66 31.08 32.94 34.94
Percent change 4.9% 4.8% 6.0% 6.1%
Quick Service Restaurants 185.13 195.84 207.87 223.39 236.79
Percent change 5.8% 6.1% 7.5% 6.0%
Real Estate 40.73 42.87 45.29 47.76 50.51
Percent change 5.3% 5.6% 5.5% 5.8%
Retail Food 31.94 33.39 34.93 36.31 37.64
Percent change 4.5% 4.6% 4.0% 3.7%
Retail Products & Services 24.12 25.61 27.24 29.03 30.70
Percent change 6.2% 6.4% 6.6% 5.8%
Table/Full Service Restaurants 52.25 55.43 58.93 63.29 66.96
Percent change 6.1% 6.3% 7.4% 5.8%
Total 570.7 602.7 637.5 675.7 711.4

IHS Economics Page 21 No portion of this report may be reproduced, reused, or otherwise distributed in any form without prior written consent.
Franchise Businesses' Contribution to GDP
By analyzing the components of value added in each of the industries where franchise businesses are
concentrated and calculating the relationship between gross output (sales) and value added in these
industries, IHS Markit Economics developed estimates of the contribution to US GDP by the franchise
sector as a whole. We estimate that franchise businesses accounted for approximately 3% of US private
GDP or a total of $405 billion in 2016. Based on our employment and output forecasts for franchising in
2017, we project that nominal GDP of the franchise sector will increase by 5.1% to $426 billion in 2017.
This will exceed the growth of total US GDP in nominal dollars, which – with moderately low inflation – is
projected at only 3.9% in 2017.
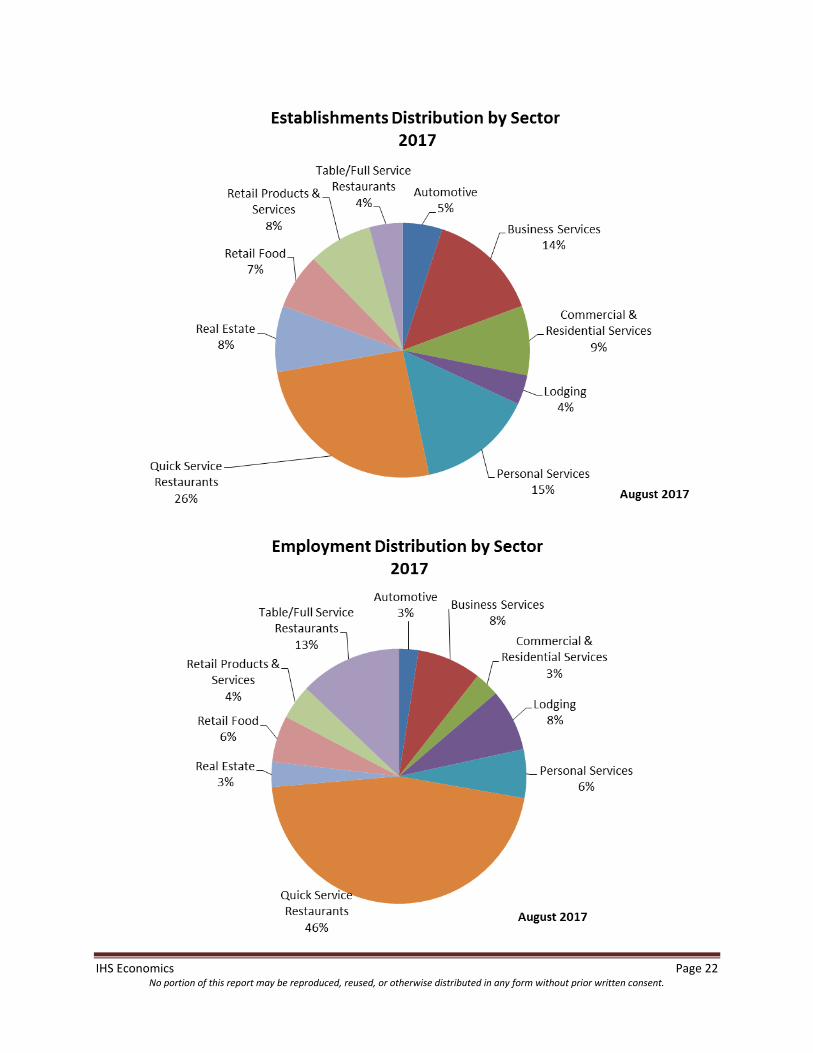
Distribution by Sector
This section focuses on the distribution of the 10 franchise business lines in terms of the number of
establishments, employment, and output, based on our forecast for 2017. The quick service restaurants
business line is the largest category, with 26% of all franchise establishments, and accounts for 46% of
franchise employment. This business line is expected to contribute 33% of total output in 2017. Second
in size in terms of the number of establishments is the personal services line, with 15% of the total.
However, these are generally smaller businesses. The personal services group will account for only 6% of
franchise employment and 5% of output.
The table/full service restaurants group occupies the second-largest share of employment, accounting
for 13% of the total. The business services segment, which has higher ratios of output per establishment
and per employee, is the second-largest contributor to the value of output in the franchise sector, with
14% of the total.
IHS Economics Page 22 No portion of this report may be reproduced, reused, or otherwise distributed in any form without prior written consent.

IHS Economics Page 23 No portion of this report may be reproduced, reused, or otherwise distributed in any form without prior written consent.
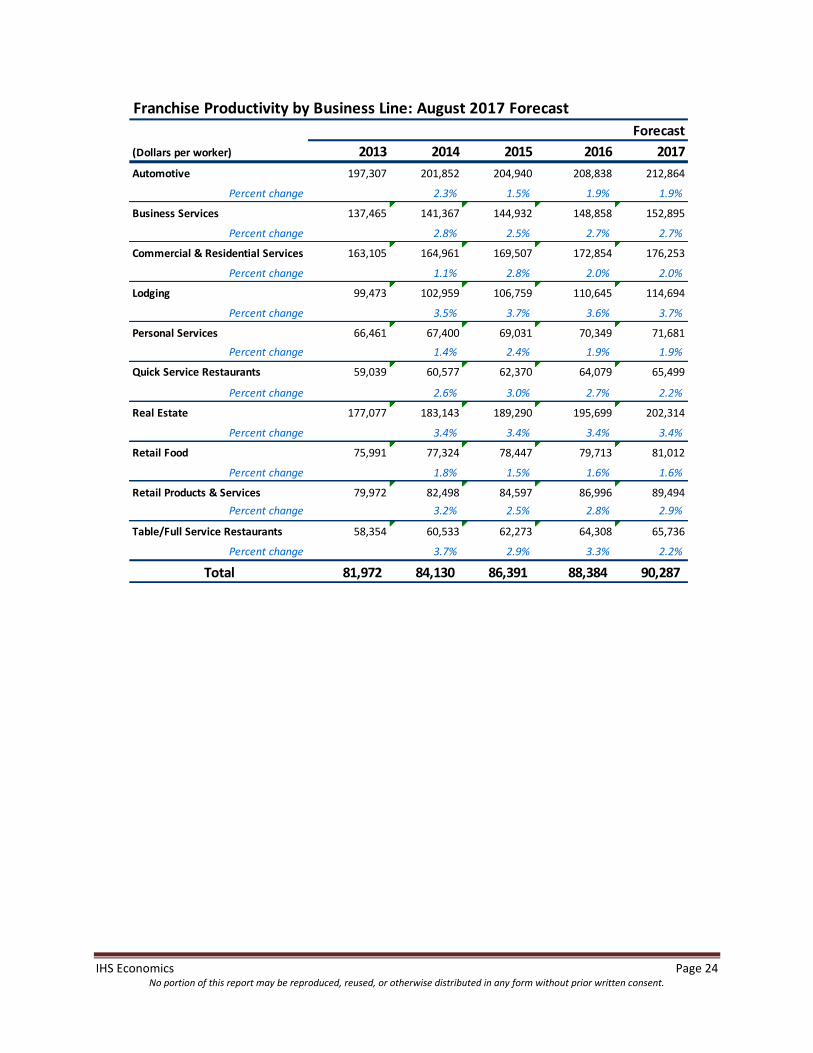
Output per Employee
The average output per worker in the franchise sector has grown since 2013, increasing at a compound
annual growth rate of 2.5%, and will continue to rise in 2017. Average output per employee in franchise
businesses is projected to increase to 90,287 in 2017 – up 2.2%. In 2017, this output-per-worker ratio
will vary among the 10 franchise business lines from a low of $65,499 (quick service restaurants) to a
high of $212,864 (automotive).
The lodging business line has been one of the fastest growing in terms of output per worker over the
2014-2016 timeframe, with average annual growth of 3.6%. The lodging business line will be the
productivity growth leader in 2017 with an increase of 3.7%, followed by real estate with a 3.4%
increase.
IHS Economics Page 24 No portion of this report may be reproduced, reused, or otherwise distributed in any form without prior written consent.
Franchise Productivity by Business Line: August 2017 Forecast
Forecast
(Dollars per worker) 2013 2014 2015 2016 2017
Automotive 197,307 201,852 204,940 208,838 212,864
Percent change 2.3% 1.5% 1.9% 1.9%
Business Services 137,465 141,367 144,932 148,858 152,895
Percent change 2.8% 2.5% 2.7% 2.7%
Commercial & Residential Services 163,105 164,961 169,507 172,854 176,253
Percent change 1.1% 2.8% 2.0% 2.0%
Lodging 99,473 102,959 106,759 110,645 114,694
Percent change 3.5% 3.7% 3.6% 3.7%
Personal Services 66,461 67,400 69,031 70,349 71,681
Percent change 1.4% 2.4% 1.9% 1.9%
Quick Service Restaurants 59,039 60,577 62,370 64,079 65,499
Percent change 2.6% 3.0% 2.7% 2.2%
Real Estate 177,077 183,143 189,290 195,699 202,314
Percent change 3.4% 3.4% 3.4% 3.4%
Retail Food 75,991 77,324 78,447 79,713 81,012
Percent change 1.8% 1.5% 1.6% 1.6%
Retail Products & Services 79,972 82,498 84,597 86,996 89,494
Percent change 3.2% 2.5% 2.8% 2.9%
Table/Full Service Restaurants 58,354 60,533 62,273 64,308 65,736
Percent change 3.7% 2.9% 3.3% 2.2%
Total 81,972 84,130 86,391 88,384 90,287
IHS Economics Page 25 No portion of this report may be reproduced, reused, or otherwise distributed in any form without prior written consent.
State Franchise Outlook
State Overview
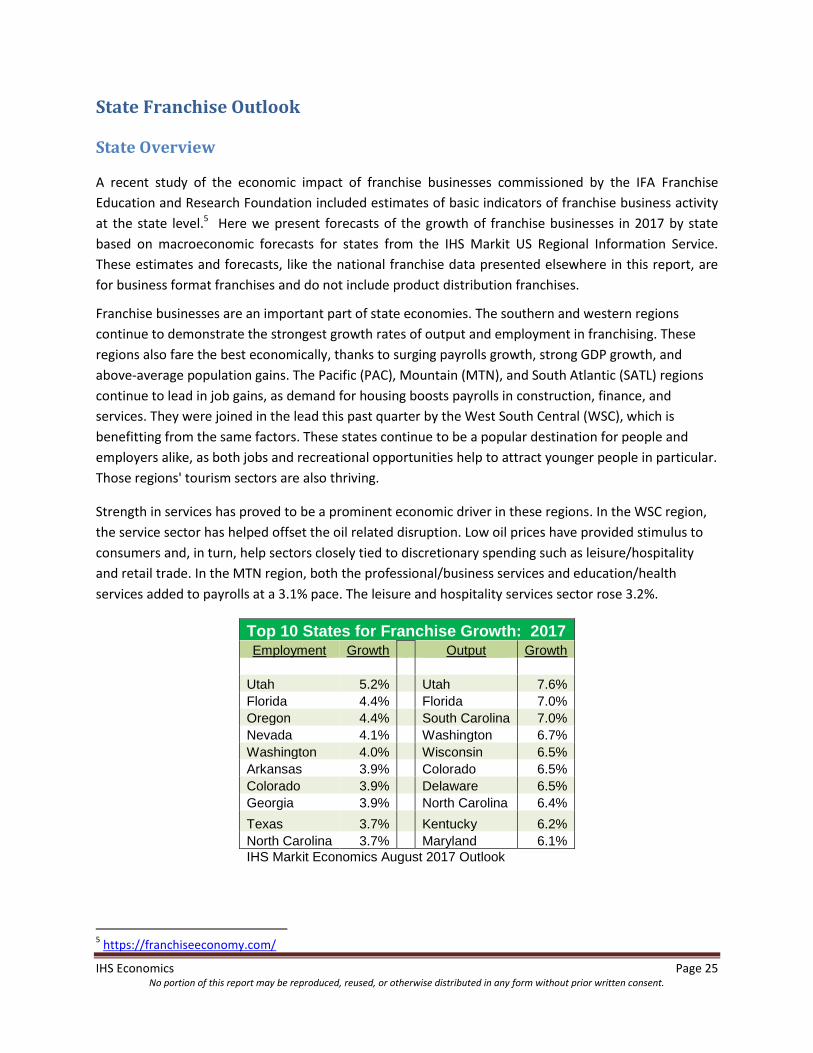
A recent study of the economic impact of franchise businesses commissioned by the IFA Franchise
Education and Research Foundation included estimates of basic indicators of franchise business activity
at the state level.5 Here we present forecasts of the growth of franchise businesses in 2017 by state
based on macroeconomic forecasts for states from the IHS Markit US Regional Information Service.
These estimates and forecasts, like the national franchise data presented elsewhere in this report, are
for business format franchises and do not include product distribution franchises.
Franchise businesses are an important part of state economies. The southern and western regions
continue to demonstrate the strongest growth rates of output and employment in franchising. These
regions also fare the best economically, thanks to surging payrolls growth, strong GDP growth, and
above-average population gains. The Pacific (PAC), Mountain (MTN), and South Atlantic (SATL) regions
continue to lead in job gains, as demand for housing boosts payrolls in construction, finance, and
services. They were joined in the lead this past quarter by the West South Central (WSC), which is
benefitting from the same factors. These states continue to be a popular destination for people and
employers alike, as both jobs and recreational opportunities help to attract younger people in particular.
Those regions' tourism sectors are also thriving.
Strength in services has proved to be a prominent economic driver in these regions. In the WSC region,
the service sector has helped offset the oil related disruption. Low oil prices have provided stimulus to
consumers and, in turn, help sectors closely tied to discretionary spending such as leisure/hospitality
and retail trade. In the MTN region, both the professional/business services and education/health
services added to payrolls at a 3.1% pace. The leisure and hospitality services sector rose 3.2%.
Top 10 States for Franchise Growth: 2017 Employment Growth Output Growth
Utah 5.2% Utah 7.6%
Florida 4.4% Florida 7.0%
Oregon 4.4% South Carolina 7.0%
Nevada 4.1% Washington 6.7%
Washington 4.0% Wisconsin 6.5%
Arkansas 3.9% Colorado 6.5%
Colorado 3.9% Delaware 6.5%
Georgia 3.9% North Carolina 6.4%
Texas 3.7% Kentucky 6.2%
North Carolina 3.7% Maryland 6.1%
IHS Markit Economics August 2017 Outlook
5 https://franchiseeconomy.com/

IHS Economics Page 26 No portion of this report may be reproduced, reused, or otherwise distributed in any form without prior written consent.
2016 2017 Growth 2016 2017 Growth
Alabama 12,228 12,437 1.7% 125,043 128,998 3.2%
Alaska 1,825 1,814 -0.6% 14,617 14,733 0.8%
Arizona 14,539 14,821 1.9% 153,476 158,686 3.4%
Arkansas 8,194 8,398 2.5% 82,895 86,165 3.9%
California 75,887 76,896 1.3% 729,737 749,975 2.8%
Colorado 15,616 16,000 2.5% 150,573 156,475 3.9%
Connecticut 7,244 7,326 1.1% 85,098 87,288 2.6%
Delaware 2,036 2,047 0.5% 22,025 22,456 2.0%
District of Columbia 890 907 1.9% 14,016 14,487 3.4%
Florida 47,117 48,477 2.9% 514,590 536,985 4.4%
Georgia 26,560 27,202 2.4% 276,117 286,825 3.9%
Hawaii 1,861 1,885 1.3% 30,835 31,684 2.8%
Idaho 4,724 4,801 1.6% 45,652 47,061 3.1%
Illinois 28,547 28,664 0.4% 321,769 327,692 1.8%
Indiana 16,516 16,624 0.7% 189,217 193,170 2.1%
Iowa 9,914 10,015 1.0% 95,510 97,854 2.5%
Kansas 9,176 9,162 -0.2% 89,703 90,844 1.3%
Kentucky 12,678 12,872 1.5% 145,867 150,214 3.0%
Louisiana 11,419 11,521 0.9% 116,033 118,740 2.3%
Maine 2,846 2,866 0.7% 27,131 27,715 2.2%
Maryland 12,838 13,069 1.8% 142,964 147,614 3.3%
Massachusetts 12,470 12,685 1.7% 116,734 120,439 3.2%
Michigan 23,365 23,767 1.7% 247,484 255,333 3.2%
Minnesota 15,182 15,414 1.5% 152,675 157,222 3.0%
Mississippi 8,061 8,025 -0.4% 78,991 79,758 1.0%
Missouri 16,883 17,217 2.0% 178,505 184,632 3.4%
Montana 3,758 3,811 1.4% 30,735 31,613 2.9%
Nebraska 6,530 6,638 1.7% 63,673 65,650 3.1%
Nevada 6,152 6,317 2.7% 73,985 77,051 4.1%
New Hampshire 3,081 3,148 2.2% 26,931 27,909 3.6%
New Jersey 17,015 17,240 1.3% 170,696 175,423 2.8%
New Mexico 4,874 4,940 1.4% 54,863 56,400 2.8%
New York 29,090 29,646 1.9% 305,250 315,522 3.4%
North Carolina 24,878 25,430 2.2% 294,738 305,570 3.7%
North Dakota 2,799 2,797 -0.1% 31,336 31,760 1.4%
Ohio 27,175 27,349 0.6% 318,866 325,487 2.1%
Oklahoma 10,169 10,117 -0.5% 97,212 98,097 0.9%
Oregon 9,112 9,375 2.9% 82,795 86,398 4.4%
Pennsylvania 26,657 26,946 1.1% 270,711 277,545 2.5%
Rhode Island 2,080 2,114 1.6% 18,021 18,581 3.1%
South Carolina 12,325 12,485 1.3% 130,149 133,721 2.7%
South Dakota 3,311 3,353 1.3% 28,232 28,996 2.7%
Tennessee 17,449 17,809 2.1% 200,630 207,686 3.5%
Texas 62,165 63,569 2.3% 636,230 659,871 3.7%
Utah 6,511 6,753 3.7% 63,373 66,668 5.2%
Vermont 1,508 1,523 1.0% 11,313 11,592 2.5%
Virginia 22,324 22,655 1.5% 238,474 245,464 2.9%
Washington 14,486 14,853 2.5% 136,657 142,116 4.0%
West Virginia 4,778 4,735 -0.9% 44,851 45,084 0.5%
Wisconsin 14,346 14,483 1.0% 149,672 153,250 2.4%
Wyoming 2,108 2,080 -1.3% 18,322 18,301 -0.1%
Establishments Employment
State Franchise Activity: August 2017 Outlook

IHS Economics Page 27 No portion of this report may be reproduced, reused, or otherwise distributed in any form without prior written consent.
2016 2017 Growth 2016 2017 Growth
Alabama 3,730 3,982 6.8% 9,765 10,318 5.7%
Alaska 636 644 1.3% 1,489 1,512 1.5%
Arizona 5,499 5,792 5.3% 13,655 14,415 5.6%
Arkansas 2,315 2,482 7.2% 6,260 6,629 5.9%
California 28,838 30,576 6.0% 69,531 73,301 5.4%
Colorado 5,409 5,768 6.6% 13,477 14,350 6.5%
Connecticut 4,291 4,447 3.6% 9,327 9,668 3.7%
Delaware 914 973 6.5% 2,277 2,424 6.5%
District of Columbia 1,003 1,023 2.0% 2,070 2,120 2.4%
Florida 17,903 19,142 6.9% 44,917 48,062 7.0%
Georgia 9,107 9,621 5.6% 22,768 23,962 5.2%
Hawaii 1,454 1,516 4.3% 3,479 3,631 4.4%
Idaho 1,217 1,278 5.0% 3,310 3,444 4.0%
Illinois 12,931 13,518 4.5% 31,903 33,311 4.4%
Indiana 5,426 5,740 5.8% 14,485 15,352 6.0%
Iowa 2,729 2,855 4.6% 7,617 7,997 5.0%
Kansas 2,807 2,879 2.6% 7,237 7,469 3.2%
Kentucky 4,154 4,428 6.6% 10,716 11,378 6.2%
Louisiana 3,780 3,932 4.0% 9,828 10,179 3.6%
Maine 884 931 5.3% 2,347 2,443 4.1%
Maryland 5,665 6,024 6.3% 13,665 14,497 6.1%
Massachusetts 4,915 5,102 3.8% 12,022 12,518 4.1%
Michigan 7,177 7,569 5.5% 19,510 20,672 6.0%
Minnesota 5,202 5,512 6.0% 13,456 14,118 4.9%
Mississippi 2,332 2,428 4.1% 6,172 6,432 4.2%
Missouri 5,816 5,966 2.6% 14,827 15,476 4.4%
Montana 893 942 5.5% 2,432 2,552 4.9%
Nebraska 2,011 2,131 6.0% 5,439 5,709 5.0%
Nevada 3,147 3,222 2.4% 7,456 7,811 4.8%
New Hampshire 1,044 1,056 1.1% 2,575 2,636 2.4%
New Jersey 7,221 7,484 3.6% 18,220 18,841 3.4%
New Mexico 1,625 1,702 4.7% 4,318 4,511 4.5%
New York 14,637 15,258 4.2% 34,197 35,583 4.1%
North Carolina 10,021 10,643 6.2% 24,414 25,973 6.4%
North Dakota 1,237 1,261 1.9% 3,391 3,476 2.5%
Ohio 10,063 10,631 5.6% 25,166 26,479 5.2%
Oklahoma 3,004 3,059 1.8% 7,630 7,812 2.4%
Oregon 2,887 3,102 7.4% 7,227 7,655 5.9%
Pennsylvania 9,884 10,307 4.3% 24,713 25,818 4.5%
Rhode Island 716 725 1.3% 1,832 1,875 2.3%
South Carolina 3,899 4,169 6.9% 10,251 10,966 7.0%
South Dakota 768 816 6.3% 2,247 2,362 5.1%
Tennessee 6,804 7,218 6.1% 16,960 17,992 6.1%
Texas 21,577 22,790 5.6% 53,174 56,186 5.7%
Utah 1,995 2,153 7.9% 5,046 5,432 7.6%
Vermont 386 394 2.1% 1,054 1,088 3.2%
Virginia 8,591 9,102 5.9% 21,112 22,322 5.7%
Washington 5,394 5,764 6.9% 13,912 14,846 6.7%
West Virginia 1,278 1,322 3.4% 3,384 3,518 4.0%
Wisconsin 4,420 4,755 7.6% 11,885 12,656 6.5%
Wyoming 586 593 1.2% 1,545 1,573 1.8%
Payroll Output
State Franchise Activity: August 2017 Outlook (in millions $)
IHS Economics Page 28 No portion of this report may be reproduced, reused, or otherwise distributed in any form without prior written consent.
APPENDIX
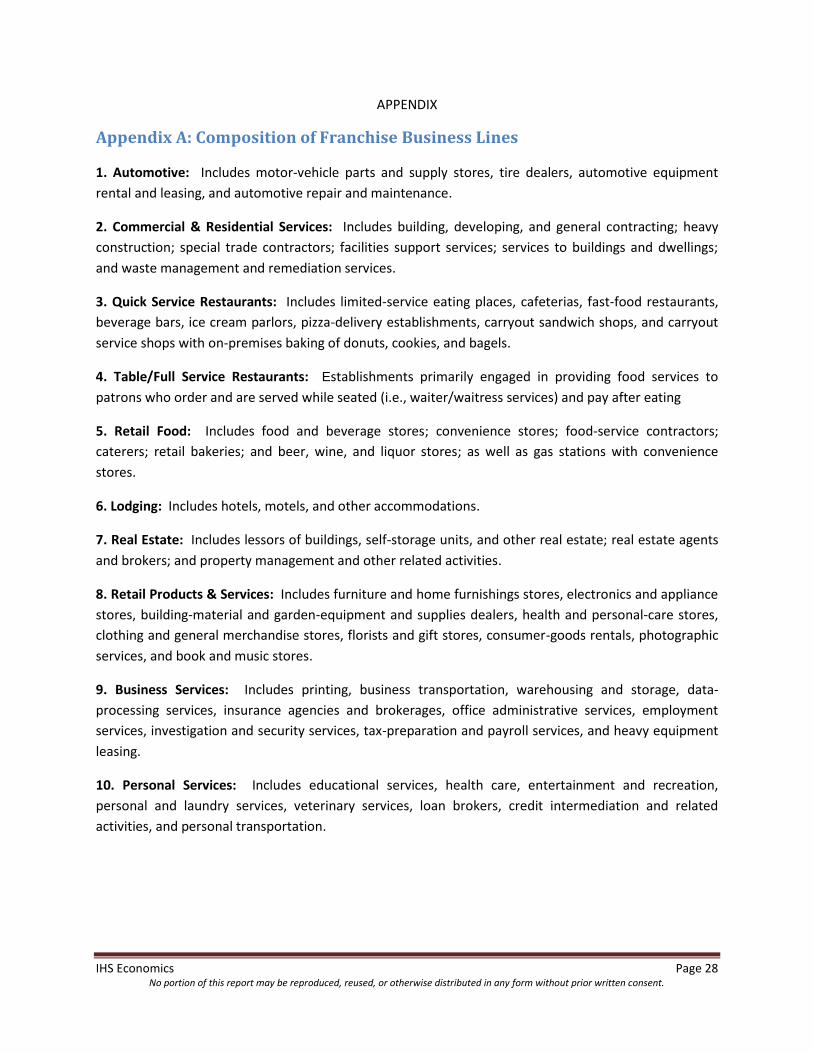
Appendix A: Composition of Franchise Business Lines
1. Automotive: Includes motor-vehicle parts and supply stores, tire dealers, automotive equipment
rental and leasing, and automotive repair and maintenance.
2. Commercial & Residential Services: Includes building, developing, and general contracting; heavy
construction; special trade contractors; facilities support services; services to buildings and dwellings;
and waste management and remediation services.
3. Quick Service Restaurants: Includes limited-service eating places, cafeterias, fast-food restaurants,
beverage bars, ice cream parlors, pizza-delivery establishments, carryout sandwich shops, and carryout
service shops with on-premises baking of donuts, cookies, and bagels.
4. Table/Full Service Restaurants: Establishments primarily engaged in providing food services to
patrons who order and are served while seated (i.e., waiter/waitress services) and pay after eating
5. Retail Food: Includes food and beverage stores; convenience stores; food-service contractors;
caterers; retail bakeries; and beer, wine, and liquor stores; as well as gas stations with convenience
stores.
6. Lodging: Includes hotels, motels, and other accommodations.
7. Real Estate: Includes lessors of buildings, self-storage units, and other real estate; real estate agents
and brokers; and property management and other related activities.
8. Retail Products & Services: Includes furniture and home furnishings stores, electronics and appliance
stores, building-material and garden-equipment and supplies dealers, health and personal-care stores,
clothing and general merchandise stores, florists and gift stores, consumer-goods rentals, photographic
services, and book and music stores.
9. Business Services: Includes printing, business transportation, warehousing and storage, data-
processing services, insurance agencies and brokerages, office administrative services, employment
services, investigation and security services, tax-preparation and payroll services, and heavy equipment
leasing.
10. Personal Services: Includes educational services, health care, entertainment and recreation,
personal and laundry services, veterinary services, loan brokers, credit intermediation and related
activities, and personal transportation.

IHS Economics Page 29 No portion of this report may be reproduced, reused, or otherwise distributed in any form without prior written consent.
Appendix B: Methodology
The statistics in this report were derived from various published sources as well as IHS Economics
propriety databases. In January 2017, IHS Markit developed estimates of franchise establishments,
employment and output by business line in 2013-2015 tied to benchmark estimates of these indicators
for 2016 developed in a study of the economic impact of franchise businesses prepared for the
International Franchise Association Franchise Education and Research Foundation by
PricewaterhouseCoopers6. That report, completed in mid-2016, provided estimates (projections) of
establishments, employment, and annual payroll and output, separately for business format franchises,
in 10 Business Format Lines in 2016.
To develop corresponding estimates for 2013-2015, IHS Economics estimated econometric models to
create forecasts for establishments, employment, and output of each of the 10 business lines. The
models include both macroeconomic (credit availability) and industry-specific variables, using a nested
modeling approach (i.e., franchise establishment formation affects employment requirements, which
further influences output forecasts). Many economic drivers for our forecasts of franchise business
activity are drawn from the IHS Economics Business Market Insights (BMI). This is a database that is
based on the Census Bureau’s County Business Patterns. It contains information on establishments,
employees, and sales at the country level at six-digit North American Industry Classification System
(NAICS).
When complete data for 2016 were available in mid-2017, IHS Markit made revised estimates for all
franchise business indicators in 2016.
State Level Forecast
The PricewaterhouseCoopers study also provided 2016 estimates of state level franchise activity. Using
these 2016 state levels as a starting point, IHS Markit Economics used our proprietary Business Market
Insights database and Regional Information Service forecasts to estimate the growth in franchise activity
in 2017. The estimates were further constrained to equal sum to our national level forecasts for 2017.
When complete data for 2016 were available in mid-2017, IHS Markit made revised estimates for all
state franchise business indicators in 2016 consistent with the revised national data for 2016.
Additionally, since our BMI database does not forecast payroll, we use our Regional Information Service
estimates and forecasts of wages in the 10 franchise business lines in 2016 and 2017 to estimate and
project the growth in payrolls for each state.
6 https://franchiseeconomy.com/


![Index []...1 Taxsutra’s Special Coverage of IFA Copenhagen 2013 Index Sr No Particulars Page Nos 1 Daywise and session wise summary of proceedings at IFA Copenhagen Congress 2-20](https://img.pdfslide.us/doc/110x75/5f13aa02a0c5cf7dd865995b/index-1-taxsutraas-special-coverage-of-ifa-copenhagen-2013-index-sr-no.jpg)
![Untitled-1 []Indian Franchise Association (IFA) in association with Franchise India presented the India's national Franchise & Retail opportunity show (FRO) on February 25th-26th 2012](https://img.pdfslide.us/doc/110x75/5fce7033644c4a499c17d0f9/untitled-1-indian-franchise-association-ifa-in-association-with-franchise.jpg)