Embed Size (px)
Citation preview
11 investor day Conquests 2015
European Seminar – Exane BNP Paribas
June 8th, 2011
France TelecomOrange
Gervais PellissierDeputy CEO & CFO
22 investor day Conquests 2015
� This presentation contains forward-looking statements about France Telecom’s business and
its "Conquests 2015" industrial plan. Although France Telecom believes these statements are
based on reasonable assumptions, the actual occurrence of the forecasted developments is
subject to numerous risks and uncertainties, including matters not yet known to us or not
currently considered material by us, and there can be no assurance that anticipated events will
occur or that the objectives set out will actually be achieved. Important factors that could cause
actual results to differ materially from the results anticipated in the forward-looking statements
include, among other factors, overall trends in the economy in general and in France Telecom’s
markets, the efficiency of the strategy incorporated in the “Conquests 2015” industrial plan and
of other strategic, operational and financial plans, France Telecom’s ability to adapt to the
ongoing transformation of the telecommunications industry, regulatory developments and
related constraints, as well as the outcome of legal proceedings and the risks and uncertainties
related to international operations and exchange rate fluctuations.
� More detailed information on the potential risks that could affect France Telecom's financial
results can be found in the Registration Document filed with the French Autorité des marchés
financiers and in the annual report on Form 20-F filed with the U.S. Securities and Exchange
Commission. Except to the extent required by law, in particular Articles 223-1 et seq. of the
General regulation of the Autorité des marches financiers, France Telecom does not undertake
any obligation to update forward-looking statements.
cautionary statement
33 investor day Conquests 2015
agenda
your concerns
our environment is improving
Conquests 2015 ambition
Conquests 2015 guidance

your concerns

55 investor day Conquests 2015
current market valuation of FT-Orange share is driven by misperceptions regarding the group
“increased competition in France will undermine FT-Orange’s capacity to
stabilise EBITDA in 2013 “
�Orange France EBITDA will reach its lowest point in 2012
“additional regulatory pressure will cripple FT-Orange’s performance “
�the current asymmetric regulation cycle on FT-Orange is coming to a
close
“marginal value creation from recent and future M&A “
�positive operating free cash flow from assets acquired since 2005
“FT-Orange is not looking hard enough at its asset portfolio for
possible divestitures “
�FT-Orange is rigorously managing its asset portfolio for better value & faster improvement in ROCE
“as a partly state-owned operator, FT-Orange is not fully pursuing its
best business interests “
�key business decisions combine all stakeholders’ long-term interests
“ FT-Orange is not able to adjust its cost base to market standards “
�FT-Orange targets at least €3bn in gross savings by 2015 vs. 2010 cost
base

66 investor day Conquests 2015
14e 15e12e 13e11e10
� capacity to react: regain momentum in broadband and stabilise mobile market share
� proactive investment in 2011 and 2012 to maintain leadership and differentiation
� positive EBITDA levers
� upside from mobile data monetisation and clear market share leadership ambition
while competition is increasing in
France, FT-Orange is best positioned to preserve value, thereby stabilising EBITDA in 2013
11e10 15e14e13e12e
revenue
s
EBITDA
performance program
sourcing
wholesale
reduced impact from regulation
Orange France EBITDA will reach its lowest point in 2012
France EBITDA will reach its lowest point in 2012
structural performance drivers will positively impact EBITDA

77 investor day Conquests 2015
building up on its 2009-2010 savings program, FT-Orange targets €3bn in gross
savings by 2015 vs. 2010 cost base
� FT-Orange has experience in designing and implementing group-wide cost savings initiatives
� 2009-2010 gross savings objectives were fully achieved
� FT-Orange has redesigned and extended its performance program extending over 2011-2015
� significant OPEX and CAPEX savings from procurement JV with DT ramping up to 2015
OPEX and CAPEX expected savings from procurement JV
FT-Orange targets at least €3bn in gross savings by 2015 vs. 2010 cost base
2012e
0,2
0,9
0,5
0,8
2015e2014e2013e
OPEX
CAPEX
in €bn
88 investor day Conquests 2015
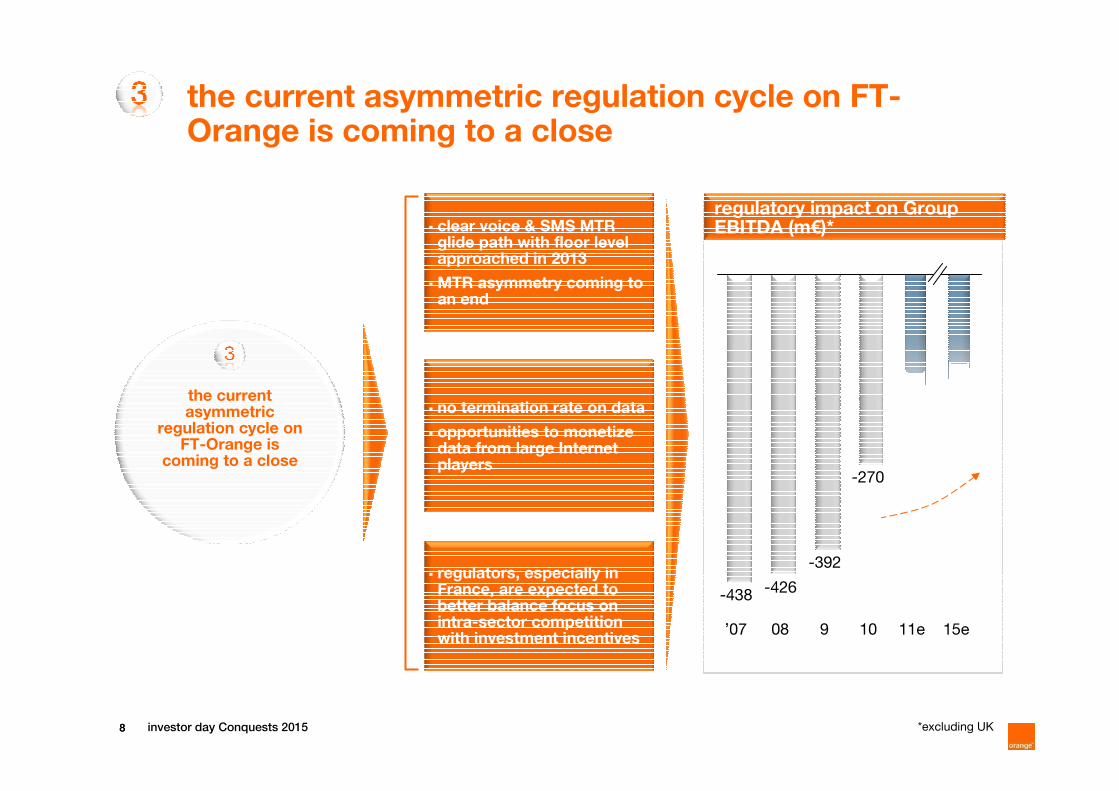
the current asymmetric
regulation cycle on FT-Orange is
coming to a close
� clear voice & SMS MTR glide path with floor level approached in 2013
� MTR asymmetry coming to an end
� no termination rate on data
� opportunities to monetize data from large Internet players
� regulators, especially in France, are expected to better balance focus on intra-sector competition with investment incentives
regulatory impact on Group EBITDA (m€)*
the current asymmetric regulation cycle on FT-Orange is coming to a close
*excluding UK
10908’07 11e 15e
-270
-392
-426-438

99 investor day Conquests 2015
the operating cash flow from assets
acquired since 2005 has turned positive
in 2010
� post acquisition of Amena, in 2005, cumulated net acquisition balance was almost nil
� including the Korektransaction, strategic objective to double revenues in emerging countries by 2015 almost achieved
� all participations are either consolidated or on the path to consolidation
� only a few minority positions held with no operational involvement by FT-Orange
� new funds invested are a minimal fraction of yearly dividend streams to FT S.A.
� in-market consolidation operation delivering synergies
positive operating cash flow from assets acquired since 2005
post acquisition of Amena, net acquisition was quite limited
operating cash flow from assets* acquired since 2005
2004-2010 acquisitions minus
divestitures in €bn
* total statutory operating free cash flow from Spain, Guinea-Bissau, Guinea, Niger, Kenya, Central African Rep.,
Uganda, Luxembourg, Armenia
10090807060504
∑ 2006-2010 ≈ 0
1,11,50,7
-0,7
-2,6
6,0
2,2
10 14e13e 15e09080706 12e11e

1010 investor day Conquests 2015
FT–Orange is rigorously
managing its asset portfolio for better value & faster improvement in
ROCE
� FT-Orange is currently assessing its foreign asset portfolio for strategic fit and financial contribution
� value creation factors:
– intrinsic value creation from each asset (ROCE, growth)
– synergies across the whole portfolio
� Emitel divested in 2011
� other assets in Europe and AMEA under review
ongoing assessment of value creation potential
FT–Orange is rigorously managing its asset portfolio
10-15 revenues CAGR (%)
2010-2015 change in ROCE
(in percentage points)
group
average
group
average
- 10
0
10
20
30
40
50
- 40 0 40

1111 investor day Conquests 2015
corporate governance ensures that key business decisions combine all stakeholders’
long-term interests
� FT-Orange governance not different from its European peers’
� unlike other European incumbents, FT-Orange has inherited from its past in France
� our incumbent status will allow us to keep our nationwide market leadership
key business decisions meet all stakeholders’ long-term interests
� French State has 20% of directors corresponding to 27% of FT-Orange capital
� 2011-2012 commitment on dividend floor of €1.4 / share
� best-in-class coverage everywhere we operate
� leader in future very high broadband networks
� best customer service
around 30% of French employees will retire by 2020

1212 investor day Conquests 2015
conversely, FT-Orange has key strengths widely acknowledged by investors
�balanced mature vs. emerging country portfolio with high quality
assets
�superior network coverage with adequate capacity to absorb
traffic
�ability to “develop once, rollout many” : animals segmentation, Orange Money, IPTV, VoIP
�good strategic mobility as evidenced by fast repositioning in
content
�capacity to execute swift turnarounds such as in Spain

our environment is
improving
1414 investor day Conquests 2015
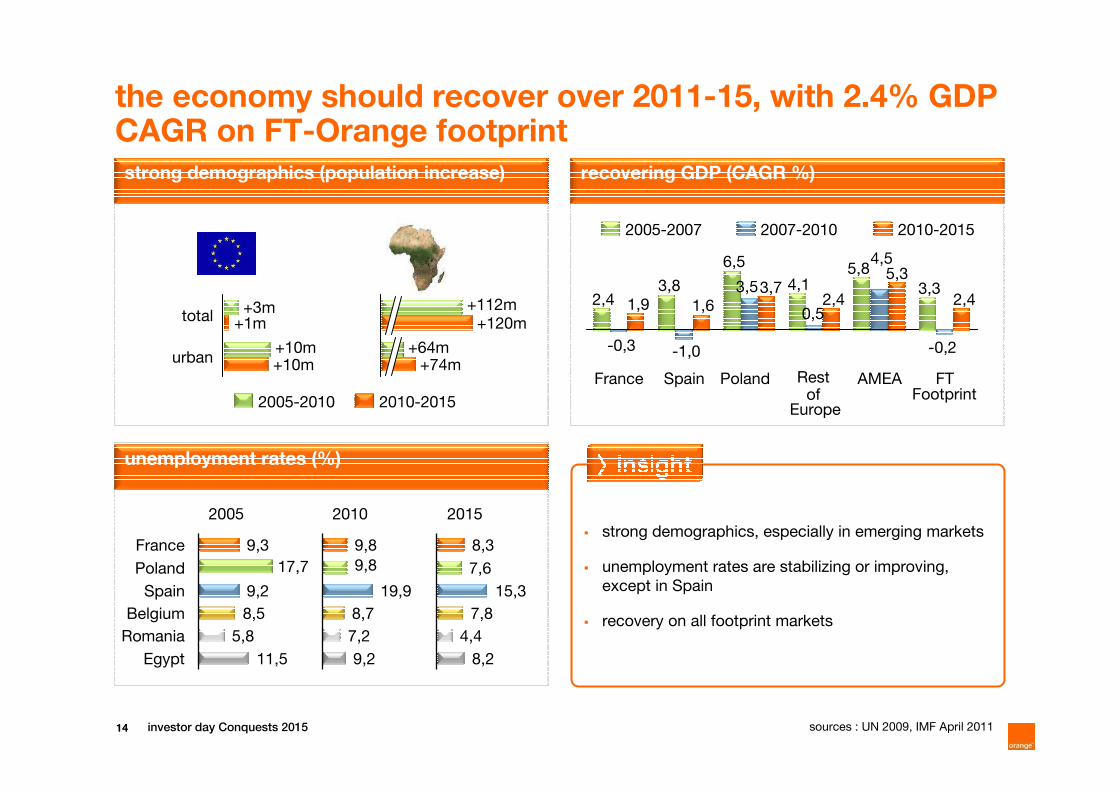
recovering GDP (CAGR %)strong demographics (population increase)
unemployment rates (%)
the economy should recover over 2011-15, with 2.4% GDP CAGR on FT-Orange footprint
� strong demographics, especially in emerging markets
� unemployment rates are stabilizing or improving,
except in Spain
� recovery on all footprint markets
9,3France
Poland
Spain
2005
5,8
11,5
8,5
9,2
Belgium
Romania
Egypt
2010
9,2
7,2
8,7
19,9
9,8
2015
8,2
4,4
7,8
15,3
7,6
8,3
sources : UN 2009, IMF April 2011
FTAMEAPoland Rest of
SpainFrance
2010-20152007-20102005-2007
urban +10m+10m
total +1m+3m
2010-20152005-2010
+64m+74m
+120m+112m
5,84,1
6,5
3,82,4
4,5
-1,0-0,3
5,3
2,43,7
1,61,9
17,7
EuropeFootprint
9,8
3,5
0,5
3,32,4
-0,2
1515 investor day Conquests 2015
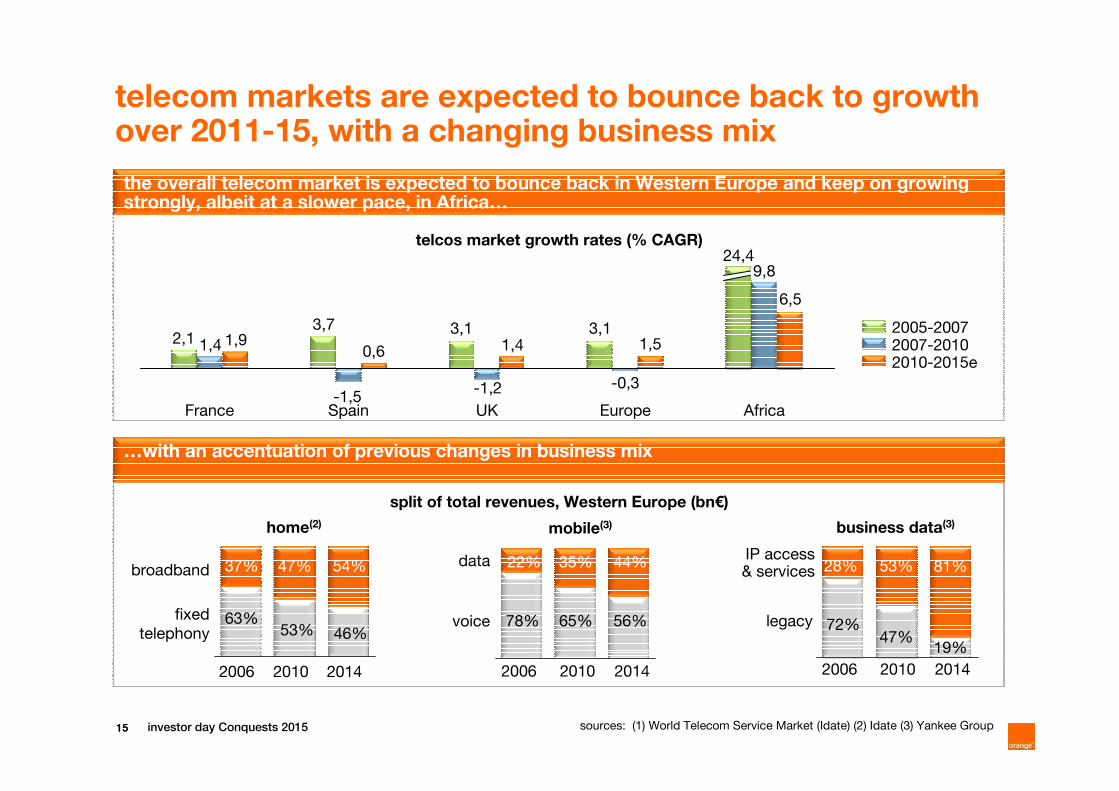
telecom markets are expected to bounce back to growth over 2011-15, with a changing business mix
the overall telecom market is expected to bounce back in Western Europe and keep on growing strongly, albeit at a slower pace, in Africa…
telcos market growth rates (% CAGR)
…with an accentuation of previous changes in business mix
home(2) mobile(3) business data(3)
split of total revenues, Western Europe (bn€)
sources: (1) World Telecom Service Market (Idate) (2) Idate (3) Yankee Group
37%broadband
20102006
63%fixed
telephony
2014
47%
53%
54%
46%
2014
voice
data
20102006
44%35%22%
78% 65% 56%
28% 53% 81%
72%47%
19%
201420102006
legacy
IP access& services
AfricaEuropeUKSpainFrance-1,5
9,824,4
2007-20102010-2015e
2005-20073,13,13,72,1
-0,3-1,2
1,4
6,5
1,51,40,61,9
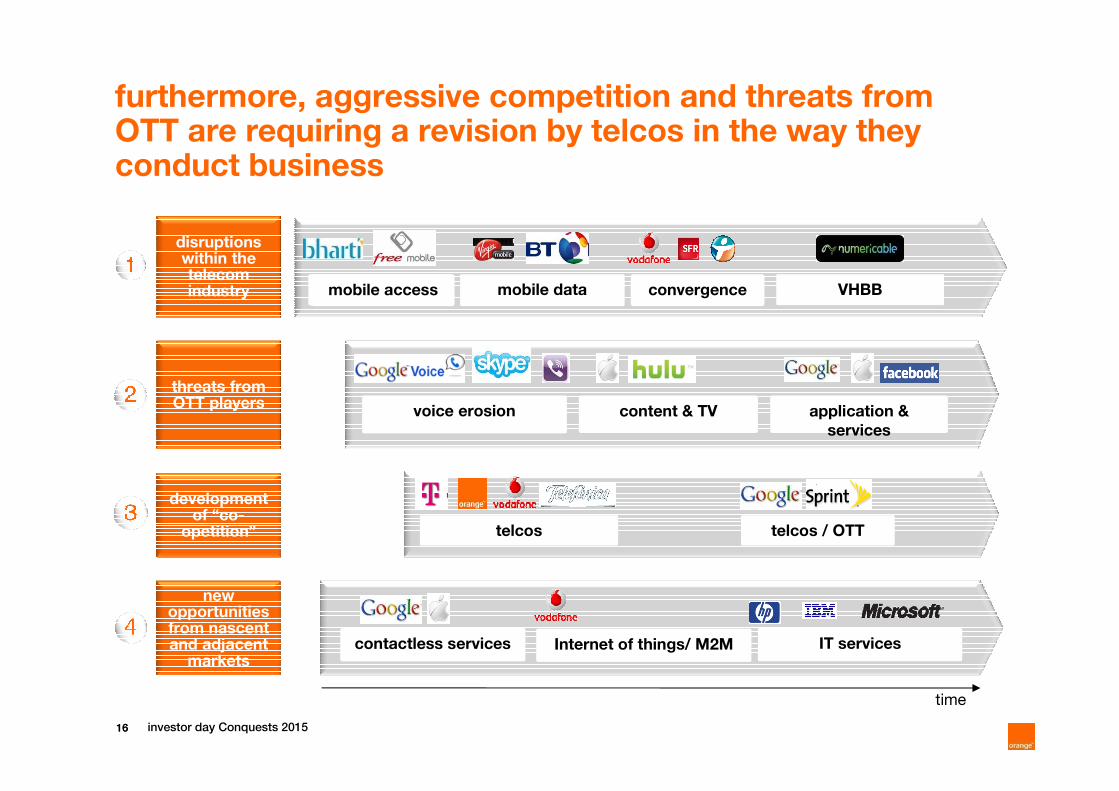
1616 investor day Conquests 2015
disruptions within the telecom industry
threats from OTT players
new opportunities from nascent and adjacent markets
development of “co-
opetition”
Internet of things/ M2M
mobile access
telcos / OTTtelcos
mobile access mobile data convergence VHBB
voice erosion content & TV application &
services
contactless services IT services
time
furthermore, aggressive competition and threats from OTT are requiring a revision by telcos in the way they conduct business

Conquests 2015
ambition
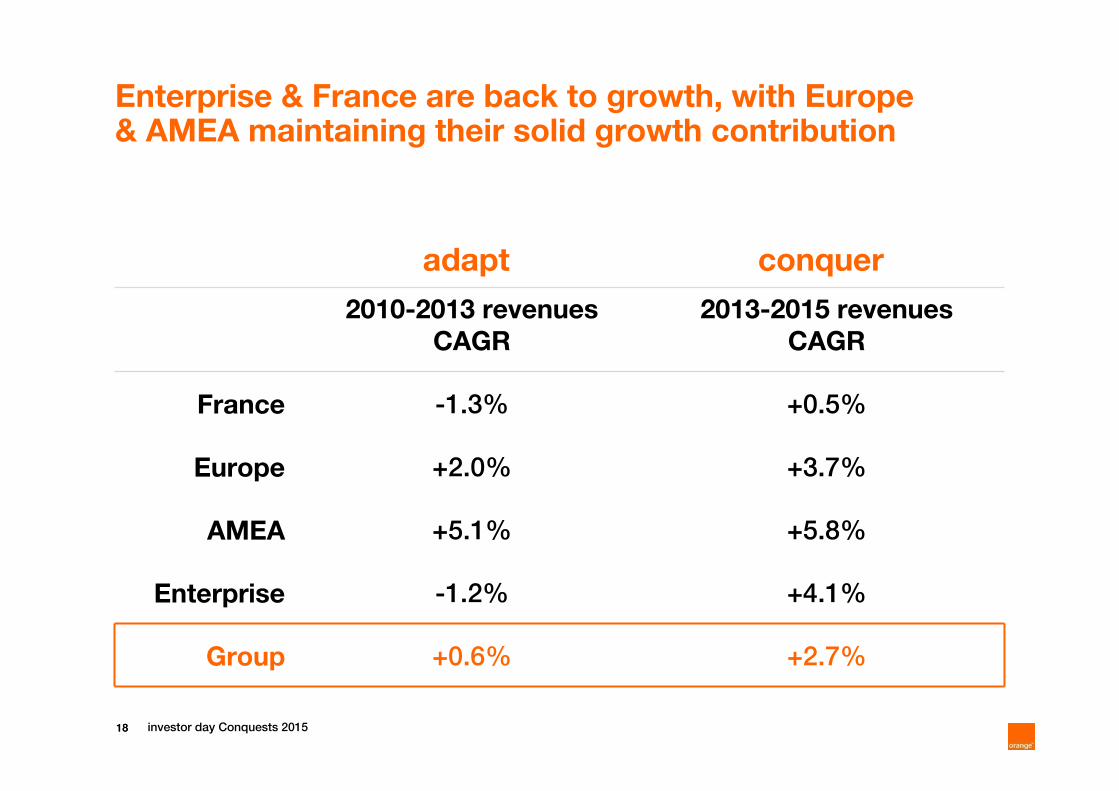
1818 investor day Conquests 2015
Enterprise & France are back to growth, with Europe & AMEA maintaining their solid growth contribution
adapt conquer
2010-2013 revenues
CAGR
2013-2015 revenues
CAGR
France -1.3% +0.5%
Europe +2.0% +3.7%
AMEA +5.1% +5.8%
Enterprise -1.2% +4.1%
Group +0.6% +2.7%
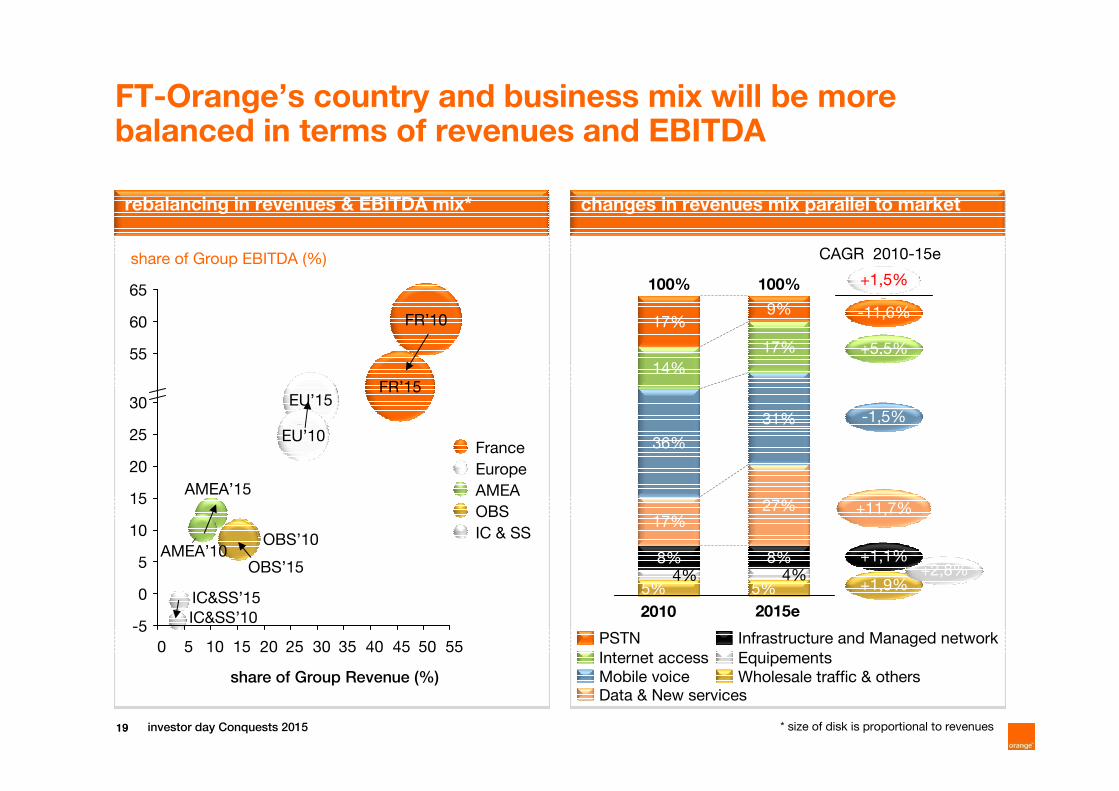
1919 investor day Conquests 2015
changes in revenues mix parallel to market rebalancing in revenues & EBITDA mix*
FT-Orange’s country and business mix will be more balanced in terms of revenues and EBITDA
CAGR 2010-15e
FR’10
FR’15
IC & SS
OBS
AMEA
Europe
France
65
60
55
30
25
20
15
10
5
0
-5
share of Group Revenue (%)
IC&SS’15
OBS’15
AMEA’15
EU’15FR’15
IC&SS’10
OBS’10AMEA’10
EU’10
FR’10
0 5 10 15 20 25 30 35 40 45 50 55
share of Group EBITDA (%)
+1,9%
-1,5%
+11,7%
-11,6%
+5,5%
+1,5%
+2,8%+1,1%
Equipements
Wholesale traffic & others
Infrastructure and Managed network
Data & New servicesMobile voice
Internet access
PSTN
100%
5%4%
8%
27%
31%
17%
9%
100%
5%4%
8%
17%
36%
14%
17%
2015e2010
* size of disk is proportional to revenues
2020 investor day Conquests 2015
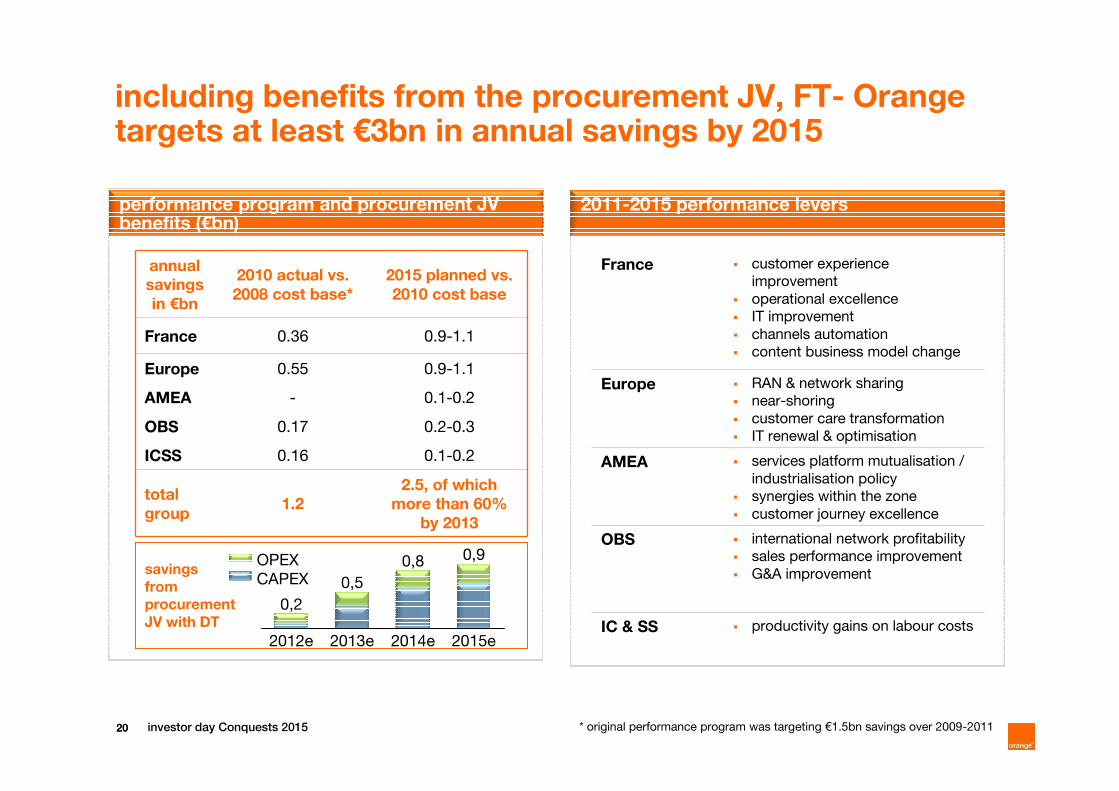
including benefits from the procurement JV, FT- Orange targets at least €3bn in annual savings by 2015
2011-2015 performance leversperformance program and procurement JV benefits (€bn)
* original performance program was targeting €1.5bn savings over 2009-2011
annual
savings
in €bn
2010 actual vs.
2008 cost base*
2015 planned vs.
2010 cost base
France 0.36 0.9-1.1
Europe 0.55 0.9-1.1
AMEA - 0.1-0.2
OBS 0.17 0.2-0.3
ICSS 0.16 0.1-0.2
total
group1.2
2.5, of which
more than 60%
by 2013
France � customer experience
improvement
� operational excellence
� IT improvement
� channels automation
� content business model change
Europe � RAN & network sharing
� near-shoring
� customer care transformation
� IT renewal & optimisation
AMEA � services platform mutualisation /
industrialisation policy
� synergies within the zone
� customer journey excellence
OBS � international network profitability
� sales performance improvement
� G&A improvement
IC & SS � productivity gains on labour costs2012e
0,2
0,9
0,5
0,8
2015e2014e2013e
OPEX
CAPEXsavings
from
procurement
JV with DT
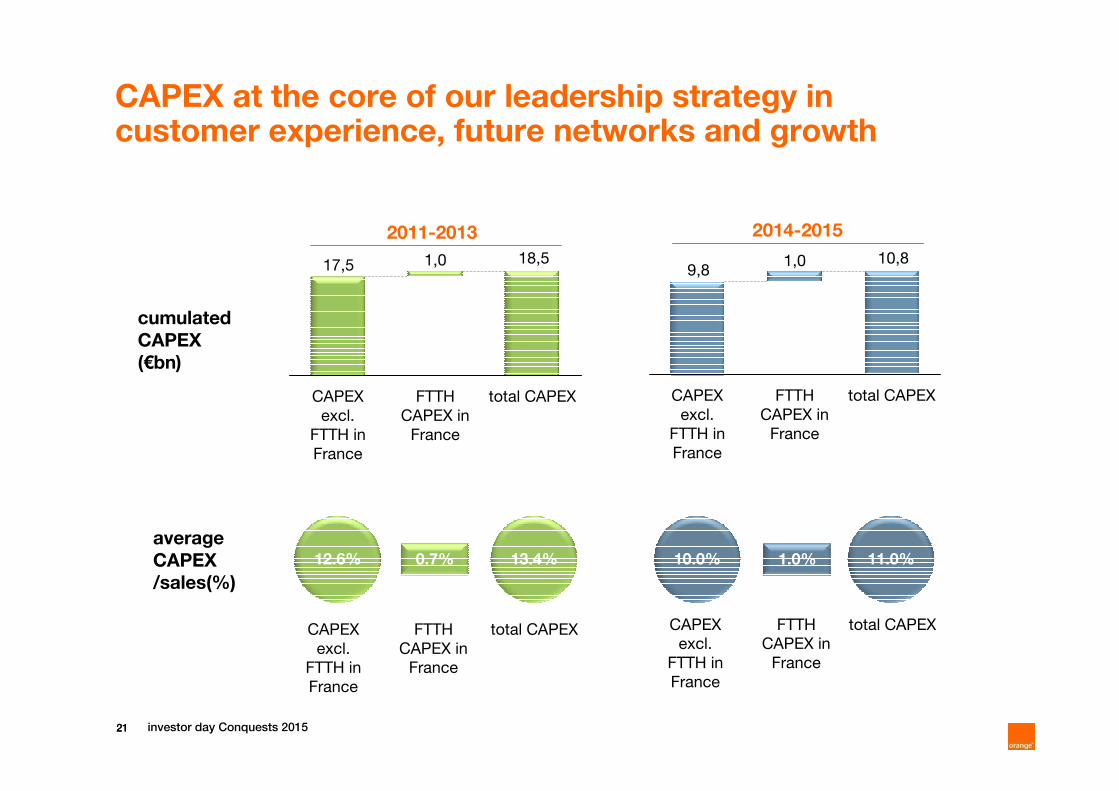
2121 investor day Conquests 2015
total CAPEXFTTH
CAPEX in
France
1,0
CAPEX
excl.
FTTH in
France
CAPEX
excl.
FTTH in
France
total CAPEXFTTH
CAPEX in
France
2011-2013 2014-2015
FTTH
CAPEX in
France
total CAPEXCAPEX
excl.
FTTH in
France
cumulated
CAPEX
(€bn)
CAPEX
excl.
FTTH in
France
total CAPEXFTTH
CAPEX in
France
average
CAPEX
/sales(%)
CAPEX at the core of our leadership strategy in customer experience, future networks and growth
18,517,5 10,89,8
1,0
12.6% 13.4%0.7% 10.0% 11.0%1.0%

2222 investor day Conquests 2015
consistent strategic & financial discipline applied to portfolio management
dynamic strategic analysis dynamic value creation dynamic value analysis
standalone asset potentialstrategic fit / synergies � assess market value, as seen by
investors, and asset value for
other potential owners of the
asset
� make own estimate for asset
value, including synergies with
rest of FT-Orange, and assess
scenarios for change
proactive actions to country and other business assets
� operations: implement restructuring, repositioning, breakthrough synergies,
etc.
� corporate : consolidation, disposal, swap, partnerships, etc
ROCE 2013 –country WACC
back to value
creation
top performer
attention
required
ROCE 2010 – country WACC
turnaround
promises

2323 investor day Conquests 2015
EBITDA
revenues
CAPEX
in summary, our Conquests 2015 ambition*
OpCF (EBITDA – CAPEX)
adapt conquer
2010-2013 2013-2015
0.6% CAGR 2.7% CAGR
adapt conquer
∑ 2011-2013 2013-2015
~€45 bn 3.4% CAGR
adapt conquer
∑ 2011-2013 ∑ 2014-2015
~€18.5bn
(12.6% excl.
FTTH in France)
~€10.8 bn
(10.0% excl.
FTTH in France)
adapt conquer
∑ 2011-2013 2013-2015
~€27bn
guidance (excl.
exceptional
items)
9% CAGR
* only those slides entitled “guidance” comprise our formal guidance; all other figures are extracted from the Conquests 2015 operating plan which was
completed recently; operating plans evolve continuously and are presented as an indication, not as a further guidance
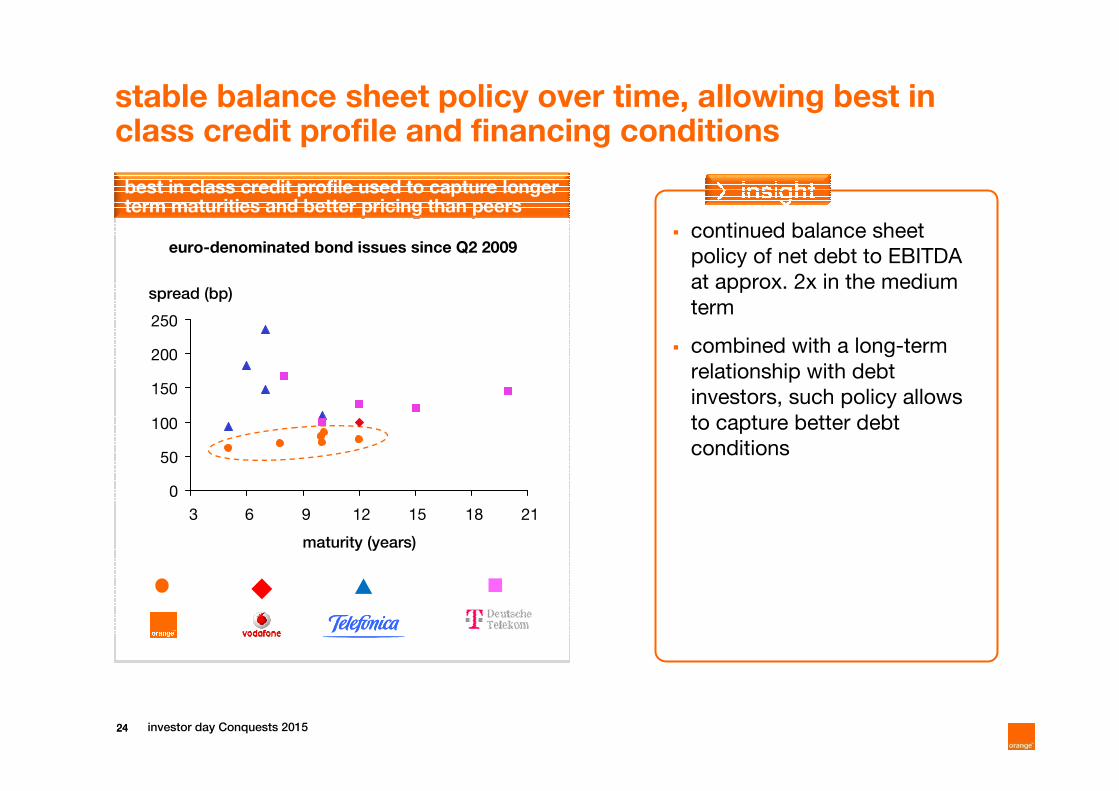
2424 investor day Conquests 2015
best in class credit profile used to capture longer term maturities and better pricing than peers
� continued balance sheet
policy of net debt to EBITDA
at approx. 2x in the medium
term
� combined with a long-term
relationship with debt
investors, such policy allows
to capture better debt
conditions
euro-denominated bond issues since Q2 2009
stable balance sheet policy over time, allowing best in class credit profile and financing conditions
spread (bp)
maturity (years)
0
50
100
150
200
250
3 6 9 12 15 18 21
Conquests 2015
guidance

2626 investor day Conquests 2015
FT-Orange is migrating to a more operations-oriented medium-term guidance
OpCF* guidance
15e14e13e12e11e10
2011-2013 cumulated
OpCF* ≈ € 27 bn
2011 OpCF* ≈ €9bn
in €bn 2009a 2010a 2011 20 11-2013
cum.
previous
guidance
organic cash
flow 8.2 8.1 8 -
new
guidance
OpCF*
(EBITDA –
CAPEX)10.8 10.1 - ≈ 27
1. fully aligned with management scorecard and
incentives
2. better adapted to transition from “adapt” to
“conquer” growth business profile
3. capacity to strike the right balance between short-
term competitive response and long-term company
value
* OpCF (EBITDA – CAPEX) excluding exceptional items
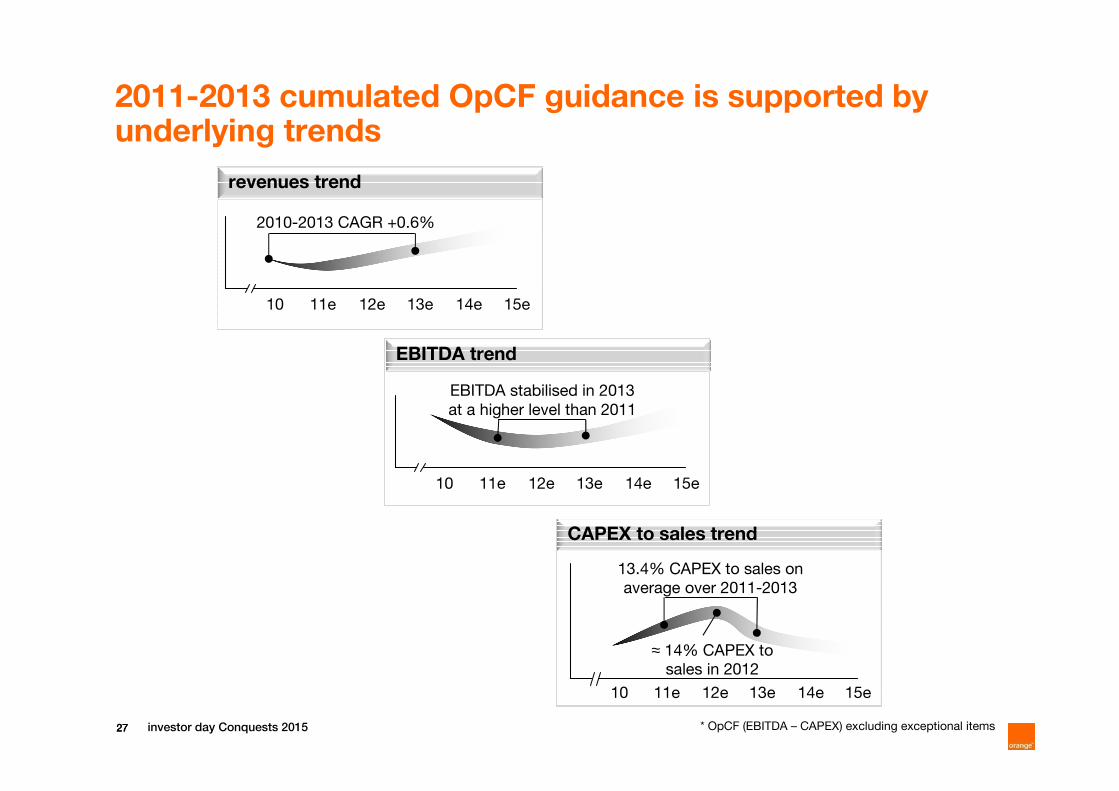
2727 investor day Conquests 2015
revenues trend
2011-2013 cumulated OpCF guidance is supported by underlying trends
* OpCF (EBITDA – CAPEX) excluding exceptional items
EBITDA trend
CAPEX to sales trend
10 15e14e13e12e11e
14e13e12e11e10 15e
13.4% CAPEX to sales on
average over 2011-2013
≈ 14% CAPEX to sales in 2012
15e14e13e12e11e10
2010-2013 CAGR +0.6%
EBITDA stabilised in 2013
at a higher level than 2011
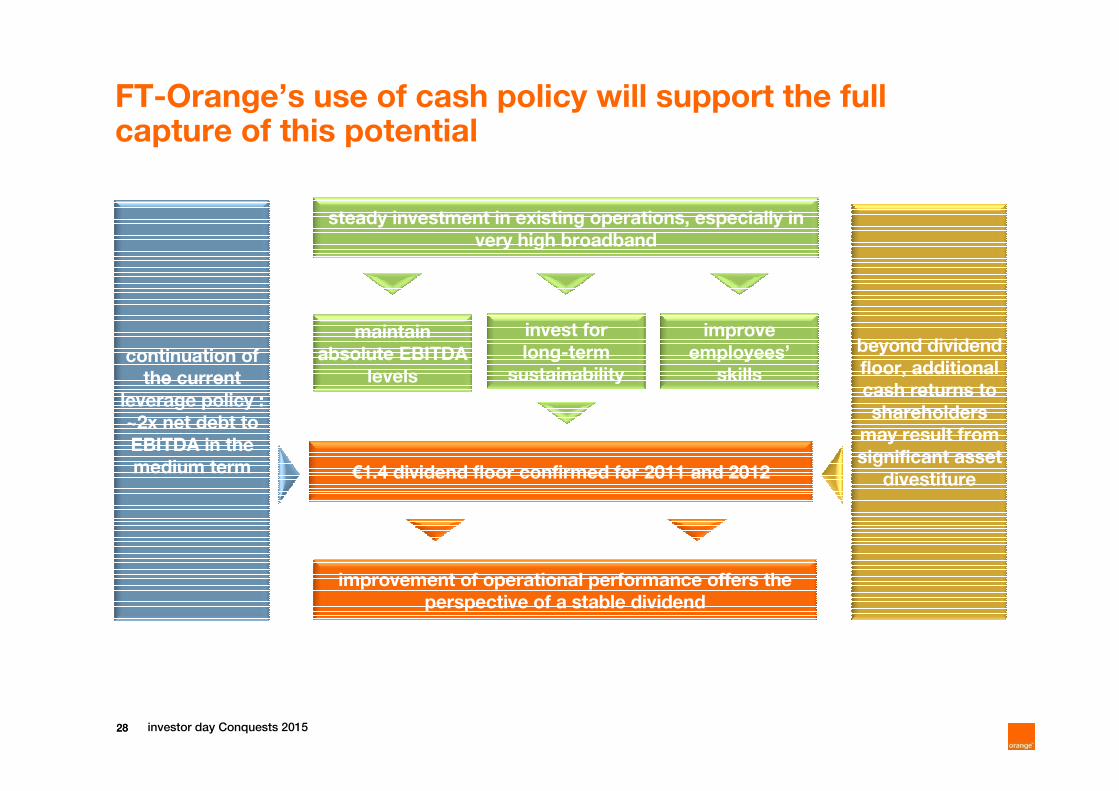
2828 investor day Conquests 2015
beyond dividend
floor, additional
cash returns to
shareholders
may result from
significant asset
divestiture
maintain
absolute EBITDA
levels
€1.4 dividend floor confirmed for 2011 and 2012
steady investment in existing operations, especially in
very high broadband
invest for
long-term
sustainability
improve
employees’
skillscontinuation of
the current
leverage policy :
~2x net debt to
EBITDA in the
medium term
FT-Orange’s use of cash policy will support the full capture of this potential
improvement of operational performance offers the
perspective of a stable dividend

2929 investor day Conquests 2015
European Seminar – Exane BNP Paribas
June 8th, 2011
France TelecomOrange
Q&A
Gervais PellissierDeputy CEO & CFO