Embed Size (px)
Citation preview
1
France is the largest member of the European Union (EU) by area. France or République Française refers to Metropolitan France
(the mainland in Western Europe), French Guiana in South America, Guadeloupe (the archipelago in the Caribbean Sea),
Martinique Island (north of Trinidad and Tobago), and Reunion (in the Indian Ocean).
Metropolitan France is bound by the Bay of Biscay and the Atlantic Ocean to the west, the English Channel and Strait of Dover
to the north-west, Belgium and Luxembourg to the north-east, Germany and Switzerland to the west, Italy and the Mediterranean
Sea to the south-east and Spain to the south-west. France is known for its stunning scenic beauty, the varied culture of the French
regions, the fiercely cultural loyalty, haute couture, radical thought and the scrumptious cuisine of the land.
French citizens enjoy a high standard of living and a high public education level. France has been listed as the world's "best overall
health care" provider by the World Health Organization. It is the most-visited country in the world, receiving 79.5 million foreign
tourists annually.
France is an active economic and political player among the European countries. France is a member of the United Nations, a
permanent member of the UN Security Council, and a member of the G8, G20, NATO, OECD, World Trade Organization, and
as well as the European Union.
GENERAL INFORMATION
Population 65,951,611 (July 2013 est.)
Capital Paris
Head of state Jean-Marc Ayrault
Chief of state Francois Hollande
Official language(s) French
Ethnic groups Celtic and Latin with Teutonic, Slavic, North African,
Indochinese, Basque minorities
Religions Roman Catholic 83%-88%, Protestant 2%, Jewish 1%,
Muslim 5%-10%, unaffiliated 4%
Life expectancy 81.56 years
Literacy rate 99%
HDI (2012) 0.893 (20th in the world)
Source: CIA World Factbook, 2013
1. Economic Overview
The French economy is diversified across all sectors. The government has partially or fully privatized many large companies,
including Air France, France Telecom, Renault, and Thales. However, the government maintains a strong presence in some sectors,
particularly power, public transport, and defense industries. With at least 79 million foreign tourists per year, France is the most
visited country in the world and maintains the third largest income in the world from tourism.
France is a developed country, possessing the worlds 5th-largest and Europe's 2nd-largest economy by nominal GDP. It is also the
world's 9th-largest by GDP at purchasing power parity. France is the wealthiest nation in Europe and the 4th-wealthiest in the
world in aggregate household wealth.
France had 39 of the 500 biggest companies of the world in 2010, France ranks 4th in the Fortune Global 500, behind the United
States, Japan and China. Paris is the second most important location in the world for the headquarters of the world's 500 largest
companies: there are more Fortune Global 500 company headquarters in Paris than in Beijing, New York, London or Munich,
but fewer than in Tokyo.
France Country Fact Sheet
2
France's real GDP contracted 2.6% in 2009, but recovered somewhat in 2010 and 2011, before stagnating in 2012. The
unemployment rate increased from 7.4% in 2008 to 10.3% in 2012. Youth unemployment shot up to 24.2% during the third
quarter of 2012 in metropolitan France. Lower-than-expected growth and high unemployment costs have strained France's public
finances. The budget deficit rose sharply from 3.4% of GDP in 2008 to 7.5% of GDP in 2009 before improving to 4.5% of GDP
in 2012, while France's public debt rose from 68% of GDP to 89% over the same period.
ECONOMIC INFORMATION
GDP (PPP) (2012 est.) USD2.291trn
GDP growth (2012 est.) 0%
GDP per capita (2012 est.) USD36,100
Inflation (2012 est.) 2.2%
Interest rate (31 December 2012) 1.5%
Unemployment rate (2012 est.) 10.3%
Exports (2012 est.) USD567.1bn
Imports (2012 est.) USD641.3bn
Trade balance USD3.2bn
Doing Business in… ranking (2013) 34
Source: Ease of Doing Business, 2013; CIA World Factbook, 2013
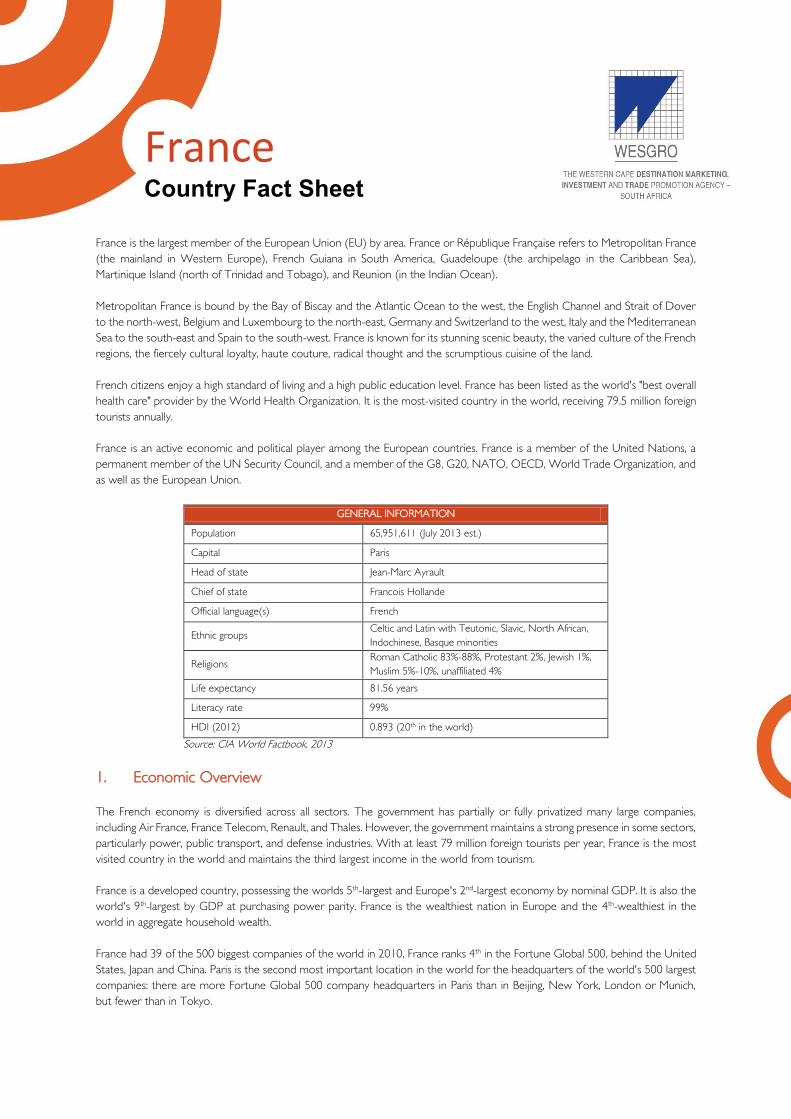
The graph below is a snapshot of the French GDP and growth from 2008 to 2017(forecast), it is evident that France was adversely
affected by the subprime crisis of 2008/9 as the country’s growth had receded into negative figures. Despite the recovery period
after 2008/9, however, the French economy and its fellow EU members are facing the European debt crisis, hence the depressed
growth figures from 2012 to 2014(forecast) are depressed. France is currently trying to improve its public finances through fiscal
consolidation. Growth is forecast to recover in 2015 and continue into the future.
Source: Business Monitor International, 2013
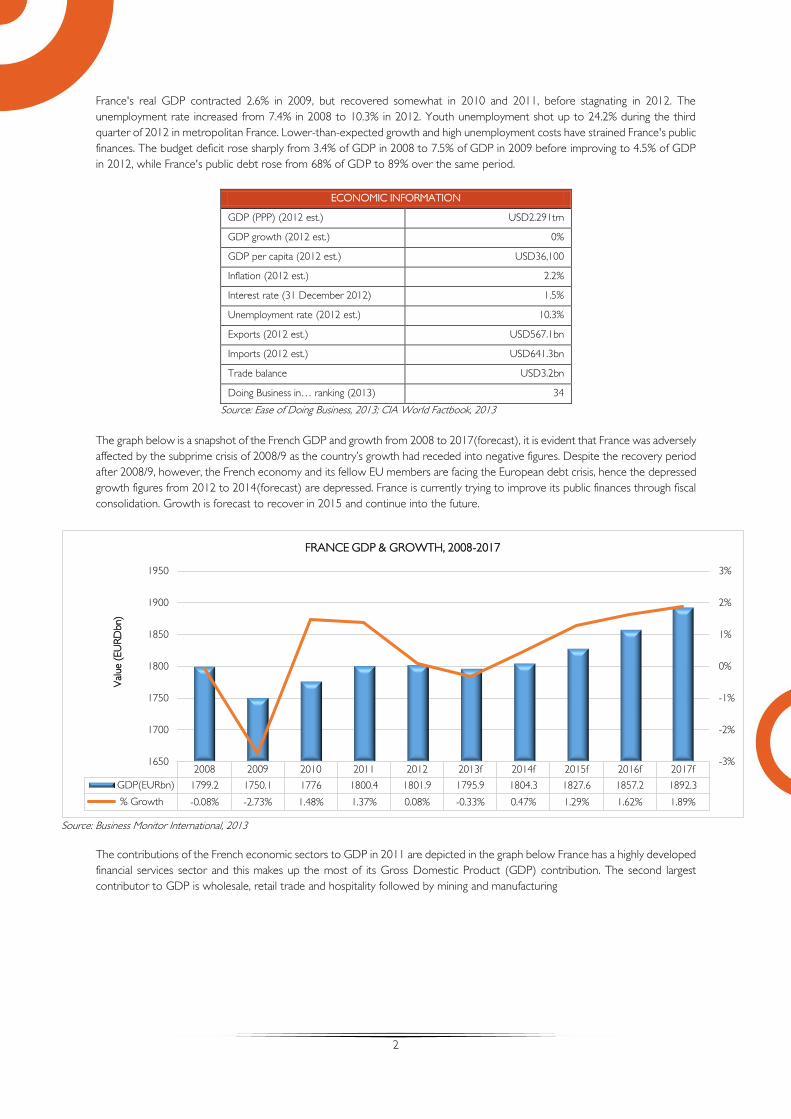
The contributions of the French economic sectors to GDP in 2011 are depicted in the graph below France has a highly developed
financial services sector and this makes up the most of its Gross Domestic Product (GDP) contribution. The second largest
contributor to GDP is wholesale, retail trade and hospitality followed by mining and manufacturing
2008 2009 2010 2011 2012 2013f 2014f 2015f 2016f 2017f
GDP(EURbn) 1799.2 1750.1 1776 1800.4 1801.9 1795.9 1804.3 1827.6 1857.2 1892.3
% Growth -0.08% -2.73% 1.48% 1.37% 0.08% -0.33% 0.47% 1.29% 1.62% 1.89%
-3%
-2%
-1%
0%
1%
2%
3%
1650
1700
1750
1800
1850
1900
1950
Val
ue (
EU
RD
bn)
FRANCE GDP & GROWTH, 2008-2017
3
Source: UNCTADstat, 2011
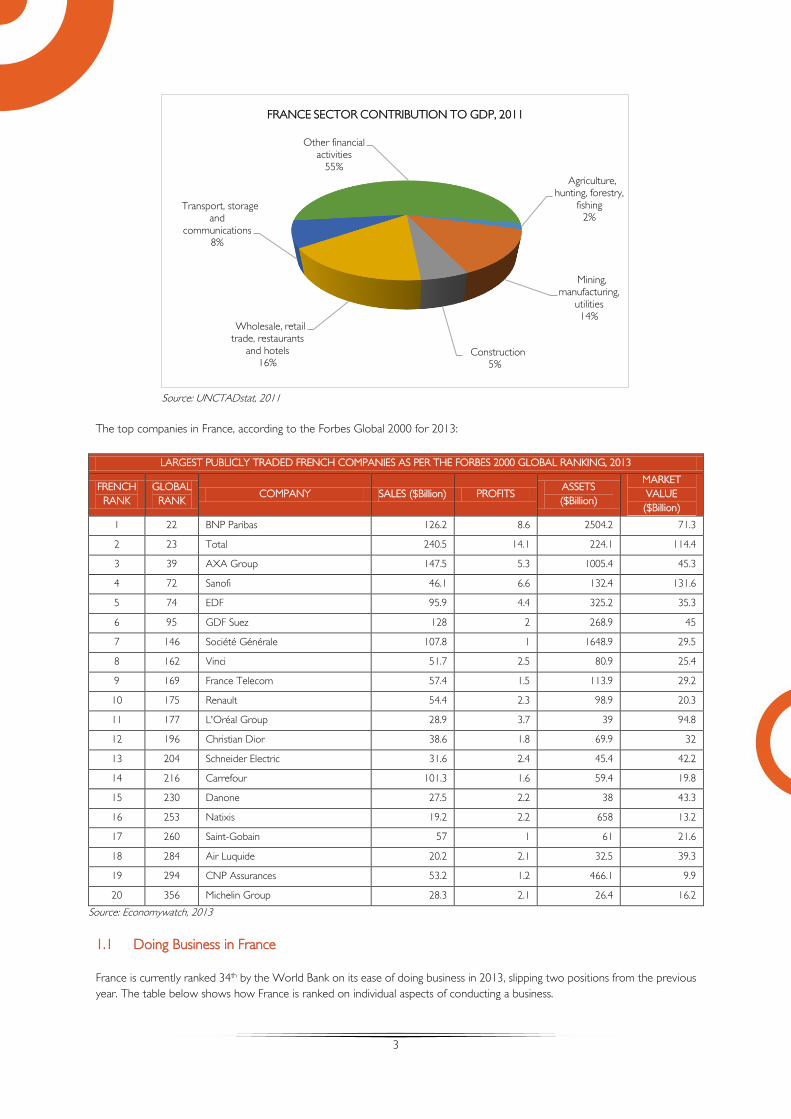
The top companies in France, according to the Forbes Global 2000 for 2013:
LARGEST PUBLICLY TRADED FRENCH COMPANIES AS PER THE FORBES 2000 GLOBAL RANKING, 2013
FRENCH
RANK
GLOBAL
RANK COMPANY SALES ($Billion) PROFITS
ASSETS
($Billion)
MARKET
VALUE
($Billion)
1 22 BNP Paribas 126.2 8.6 2504.2 71.3
2 23 Total 240.5 14.1 224.1 114.4
3 39 AXA Group 147.5 5.3 1005.4 45.3
4 72 Sanofi 46.1 6.6 132.4 131.6
5 74 EDF 95.9 4.4 325.2 35.3
6 95 GDF Suez 128 2 268.9 45
7 146 Société Générale 107.8 1 1648.9 29.5
8 162 Vinci 51.7 2.5 80.9 25.4
9 169 France Telecom 57.4 1.5 113.9 29.2
10 175 Renault 54.4 2.3 98.9 20.3
11 177 L'Oréal Group 28.9 3.7 39 94.8
12 196 Christian Dior 38.6 1.8 69.9 32
13 204 Schneider Electric 31.6 2.4 45.4 42.2
14 216 Carrefour 101.3 1.6 59.4 19.8
15 230 Danone 27.5 2.2 38 43.3
16 253 Natixis 19.2 2.2 658 13.2
17 260 Saint-Gobain 57 1 61 21.6
18 284 Air Luquide 20.2 2.1 32.5 39.3
19 294 CNP Assurances 53.2 1.2 466.1 9.9
20 356 Michelin Group 28.3 2.1 26.4 16.2
Source: Economywatch, 2013
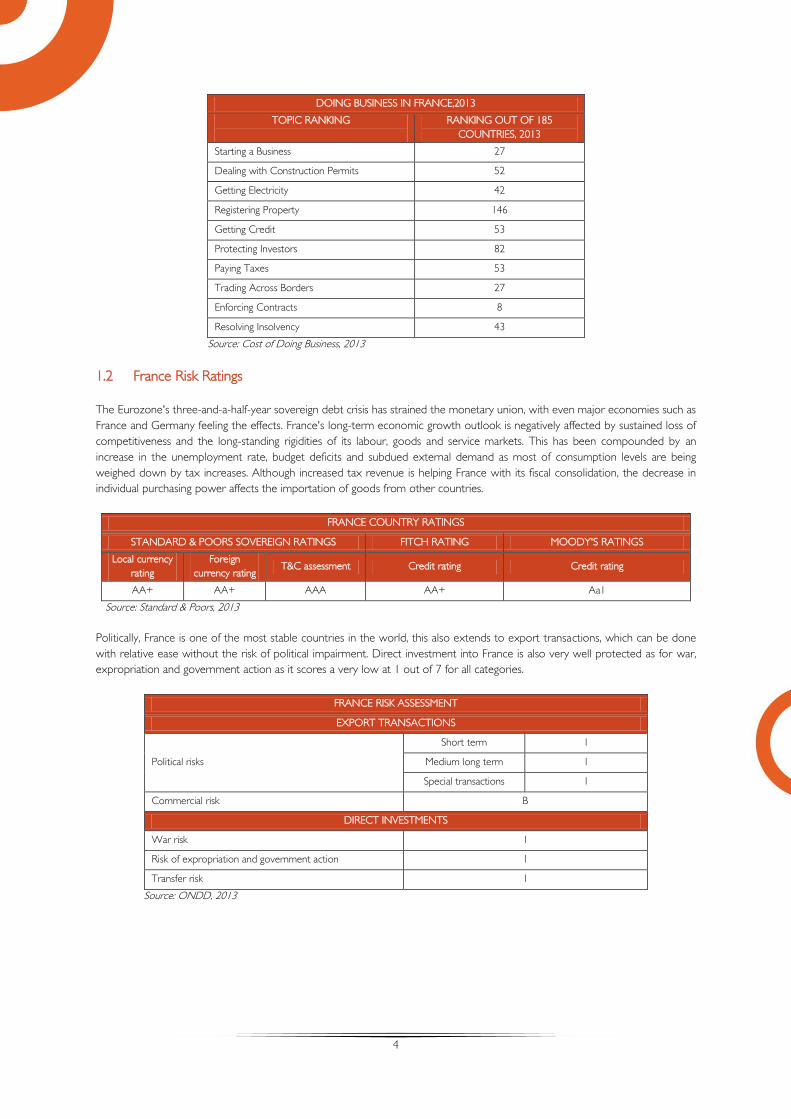
1.1 Doing Business in France
France is currently ranked 34th by the World Bank on its ease of doing business in 2013, slipping two positions from the previous
year. The table below shows how France is ranked on individual aspects of conducting a business.
Agriculture, hunting, forestry,
fishing2%
Mining, manufacturing,
utilities14%
Construction5%
Wholesale, retail trade, restaurants
and hotels16%
Transport, storage and
communications8%
Other financial activities
55%
FRANCE SECTOR CONTRIBUTION TO GDP, 2011
4
DOING BUSINESS IN FRANCE,2013
TOPIC RANKING
RANKING OUT OF 185
COUNTRIES, 2013
Starting a Business 27
Dealing with Construction Permits 52
Getting Electricity 42
Registering Property 146
Getting Credit 53
Protecting Investors 82
Paying Taxes 53
Trading Across Borders 27
Enforcing Contracts 8
Resolving Insolvency 43
Source: Cost of Doing Business, 2013
1.2 France Risk Ratings
The Eurozone's three-and-a-half-year sovereign debt crisis has strained the monetary union, with even major economies such as
France and Germany feeling the effects. France's long-term economic growth outlook is negatively affected by sustained loss of
competitiveness and the long-standing rigidities of its labour, goods and service markets. This has been compounded by an
increase in the unemployment rate, budget deficits and subdued external demand as most of consumption levels are being
weighed down by tax increases. Although increased tax revenue is helping France with its fiscal consolidation, the decrease in
individual purchasing power affects the importation of goods from other countries.
FRANCE COUNTRY RATINGS
STANDARD & POORS SOVEREIGN RATINGS FITCH RATING MOODY'S RATINGS
Local currency
rating
Foreign
currency rating T&C assessment Credit rating Credit rating
AA+ AA+ AAA AA+ Aa1
Source: Standard & Poors, 2013
Politically, France is one of the most stable countries in the world, this also extends to export transactions, which can be done
with relative ease without the risk of political impairment. Direct investment into France is also very well protected as for war,
expropriation and government action as it scores a very low at 1 out of 7 for all categories.
FRANCE RISK ASSESSMENT
EXPORT TRANSACTIONS
Political risks
Short term 1
Medium long term 1
Special transactions 1
Commercial risk B
DIRECT INVESTMENTS
War risk 1
Risk of expropriation and government action 1
Transfer risk 1
Source: ONDD, 2013

5
2. Trade
2.1 France Global Trade
France's global trade has continually increased over the last ten years, however imported goods have been increasing faster than
exports. Trade reached its highest point in 2008 however this level of imports and exports could not be achieved again until
2012 due to the decreased global demand as a result of the subprime crisis.
Source: TradeMap, 2013
As with most European nations, France conducts most of its trade with its EU partners, with 6 of its top ten export destinations
being EU member countries. Germany is the main importer of French goods and is also the fastest growing export market for
France. Africa is not a prominent trading partner with France, with less than 1% share of France’s global trade. South Africa
accounts for 0.4% of exports from France to the world and 0.2% of France’s imports from the world.
TOP 10 DESTINATION MARKETS FOR EXPORTS FROM FRANCE, 2012
RANK COUNTRY
VALUE
2012
(ZARbn)
%
GROWTH
2011-2012
%
SHARE
2012
1 Germany 748.7 8.29% 16.45%
2 Italy 335.9 -1.61% 7.38%
3 Belgium 333.3 10.75% 7.32%
4 Spain 307.2 1.05% 6.75%
5 United Kingdom 307.0 10.96% 6.74%
6 United States 279.0 19.51% 6.13%
7 Netherlands 192.8 7.73% 4.24%
8 China 158.6 17.82% 3.48%
9 Switzerland 144.4 10.13% 3.17%
10 Russian Federation 95.9 28.83% 2.11%
TOTAL EXPORTS 4552.1 8.86% 100.00%
Source:TradeMap, 2013
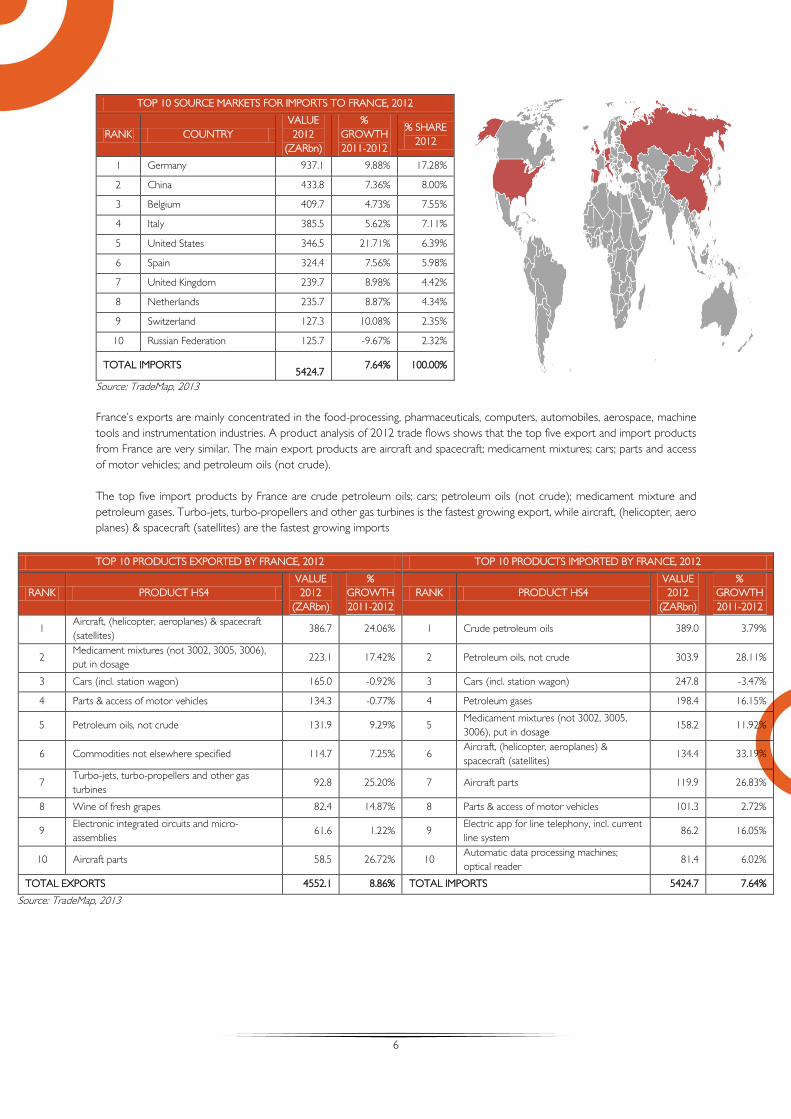
Following the export trend, France imports most of its goods from its EU counter parts, with Germany being the top source
market, followed by China (8%). The United States features on both top ten imports and export market lists and is the fastest
growing import market for the French at 21.71%.
2003 2004 2005 2006 2007 2008 2009 2010 2011 2012
Exports(ZARbn) 2,679.6 2,648.3 2,749.1 3,211.4 3,791.3 4,822.6 3,849.3 3,728.9 4,181.6 4,552.1
Imports(ZARbn 2,712.5 2,779.8 3,011.7 3,552.6 4,294.4 5,637.9 4,482.9 4,366.8 5,039.5 5,424.7
Trade Balance(ZARbn) -32.8 -131.4 -262.7 -341.2 -503.2 -815.2 -633.6 -637.8 -857.9 -872.6
-2,000
-1,000
0
1,000
2,000
3,000
4,000
5,000
6,000
Val
ue (
ZA
Rbn)
FRANCE GLOBAL TRADE, 2003 - 2012
6
TOP 10 SOURCE MARKETS FOR IMPORTS TO FRANCE, 2012
RANK COUNTRY
VALUE
2012
(ZARbn)
%
GROWTH
2011-2012
% SHARE
2012
1 Germany 937.1 9.88% 17.28%
2 China 433.8 7.36% 8.00%
3 Belgium 409.7 4.73% 7.55%
4 Italy 385.5 5.62% 7.11%
5 United States 346.5 21.71% 6.39%
6 Spain 324.4 7.56% 5.98%
7 United Kingdom 239.7 8.98% 4.42%
8 Netherlands 235.7 8.87% 4.34%
9 Switzerland 127.3 10.08% 2.35%
10 Russian Federation 125.7 -9.67% 2.32%
TOTAL IMPORTS
5424.7 7.64% 100.00%
Source: TradeMap, 2013
France’s exports are mainly concentrated in the food-processing, pharmaceuticals, computers, automobiles, aerospace, machine
tools and instrumentation industries. A product analysis of 2012 trade flows shows that the top five export and import products
from France are very similar. The main export products are aircraft and spacecraft; medicament mixtures; cars; parts and access
of motor vehicles; and petroleum oils (not crude).
The top five import products by France are crude petroleum oils; cars; petroleum oils (not crude); medicament mixture and
petroleum gases. Turbo-jets, turbo-propellers and other gas turbines is the fastest growing export, while aircraft, (helicopter, aero
planes) & spacecraft (satellites) are the fastest growing imports
TOP 10 PRODUCTS EXPORTED BY FRANCE, 2012 TOP 10 PRODUCTS IMPORTED BY FRANCE, 2012
RANK PRODUCT HS4
VALUE
2012
(ZARbn)
%
GROWTH
2011-2012
RANK PRODUCT HS4
VALUE
2012
(ZARbn)
%
GROWTH
2011-2012
1 Aircraft, (helicopter, aeroplanes) & spacecraft
(satellites) 386.7 24.06% 1 Crude petroleum oils 389.0 3.79%
2 Medicament mixtures (not 3002, 3005, 3006),
put in dosage 223.1 17.42% 2 Petroleum oils, not crude 303.9 28.11%
3 Cars (incl. station wagon) 165.0 -0.92% 3 Cars (incl. station wagon) 247.8 -3.47%
4 Parts & access of motor vehicles 134.3 -0.77% 4 Petroleum gases 198.4 16.15%
5 Petroleum oils, not crude 131.9 9.29% 5 Medicament mixtures (not 3002, 3005,
3006), put in dosage 158.2 11.92%
6 Commodities not elsewhere specified 114.7 7.25% 6 Aircraft, (helicopter, aeroplanes) &
spacecraft (satellites) 134.4 33.19%
7 Turbo-jets, turbo-propellers and other gas
turbines 92.8 25.20% 7 Aircraft parts 119.9 26.83%
8 Wine of fresh grapes 82.4 14.87% 8 Parts & access of motor vehicles 101.3 2.72%
9 Electronic integrated circuits and micro-
assemblies 61.6 1.22% 9
Electric app for line telephony, incl. current
line system 86.2 16.05%
10 Aircraft parts 58.5 26.72% 10 Automatic data processing machines;
optical reader 81.4 6.02%
TOTAL EXPORTS 4552.1 8.86% TOTAL IMPORTS 5424.7 7.64%
Source: TradeMap, 2013

7
France’s exports represent 3.1% of global exports and is the world’s 5th largest
exporter. France's imports represent 3.65% of global imports and the world’s 7th
largest importer.
2.2 Trade with South Africa
South Africa’s trade with France has been increasing in the period shown below, with South Africa as net importer of French
made goods. Trade between the two countries accelerated from 2004 till 2008 with a boom period. However the aftermath of
the subprime crisis decreased trade levels. There has been a recovery in 2012, although South Africa’s trade deficit with France
has continued to increase.
Source: Quantec, 2013
The export baskets between South Africa and France consists mainly of metals, minerals and industrial and equipment. The
leading export form South Africa to France being motor vehicles for the transport of goods, coal and liquid, gas centrifuges, and
filtering, purifying machines. Although South Africa exports motor vehicles for transport of persons (except buses), France has
the comparative advantage in the export of this product, France is the largest exporter of pharmaceutical goods in the world and
this is exhibited by the this good being the second largest import from France to South Africa.
Top global exporter of
aircraft, spacecraft, and parts thereof
Top global exporter of beverages, spirits and
vinegar
Top global exporter for essential oils,
perfumes, cosmetics, toileteries
2nd largest global importer of explosives,
pyrotechnics, matches,
pyrophorics
Top global importer of
aircraft, spacecraft, and parts thereof
Top global importer of cork and articles of
cork
2003 2004 2005 2006 2007 2008 2009 2010 2011 2012
Exports (ZARbn) 5,175.4 5,511.9 6,302.9 7,307.1 9,001.7 10,206.5 6,241.5 6,428.7 6,265.0 6,583.2
Imports(ZARbn) 15,456.7 18,596.6 15,407.7 16,938.6 18,841.6 20,872.7 16,921.9 17,111.1 19,349.5 20,303.7
Trade Balance(ZARbn) -10281.35 -13084.73 -9104.79 -9631.50 -9839.85 -10666.14 -10680.41 -10682.34 -13084.55 -13720.42
-20,000
-15,000
-10,000
-5,000
0
5,000
10,000
15,000
20,000
25,000
Val
ue (
ZA
Rm
)
SOUTH AFRICA'S TRADE WITH FRANCE, 2003-2012
8
TOP 10 PRODUCTS EXPORTED BY SOUTH AFRICA, 2012 TOP 10 PRODUCTS IMPORTED BY SOUTH AFRICA, 2012
RANK PRODUCT HS4
VALUE
2012
(ZARm)
%
GROWTH
2011-2012
RANK PRODUCT HS4
VALUE
2012
(ZARm)
%
GROWTH
2011-2012
1 Motor vehicles for the transport of goods 1,155.2 37.97% 1 Motor vehicles for transport of
persons (except buses) 1264.5 35.91%
2 Coal, briquettes, ovoids etc, made from
coal 766.5 -17.30% 2
Medicaments, therapeutic,
prophylactic use, in dosage 1260.2 4.70%
3 Liquid, gas centrifuges, filtering, purifying
machines 334.8 -61.66% 3
Steam turbines and other vapour
turbines 1217.1 947.14%
4 Ferro-alloys 324.7 -11.41% 4 Blood, antisera, vaccines, toxins and
cultures 673.9 33.66%
5 Nuclear reactors, fuel elements, isotope
separators 289.2 - 5
Self-propelled earth moving, road
making, etc machines 479.6 -6.77%
6 Motor vehicles for transport of persons
(except buses) 254.0 28.35% 6 Gasoline and oil additives 407.8 -0.45%
7 Unwrought aluminium 237.3 - 7 Parts of aircraft, spacecraft, etc 385.8 47.24%
8 Acyclic hydrocarbons 184.0 249.58% 8 Parts and accessories for motor
vehicles 329.8 2.44%
9 Rolled stainless steel sheet, width >
600mm 168.0 311.26% 9 Original equipment components 322.8 8.14%
10 Radioactive elements, isotopes,
compounds and mixtures 158.9 -6.27% 10 Perfumes and toilet waters 317.3 16.41%
TOTAL EXPORTS 6,583.2 5.08% TOTAL IMPORTS 20303.7 4.93%
Source: Quantec, 2013
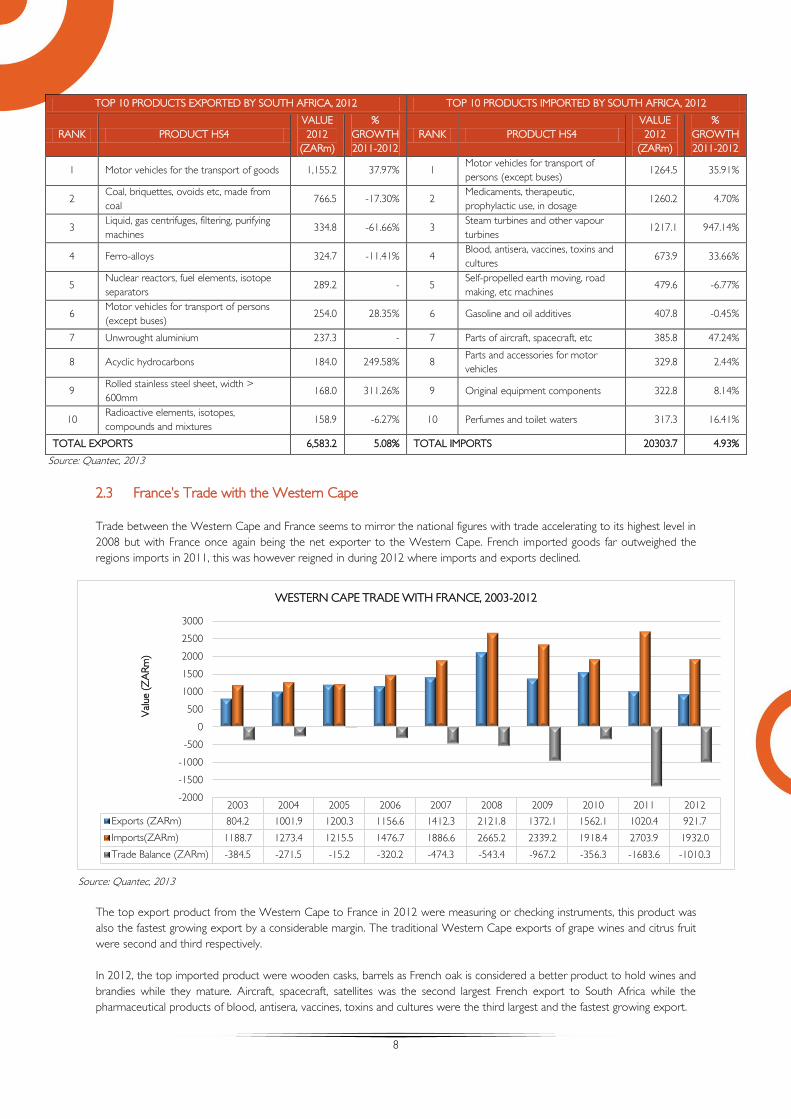
2.3 France’s Trade with the Western Cape
Trade between the Western Cape and France seems to mirror the national figures with trade accelerating to its highest level in
2008 but with France once again being the net exporter to the Western Cape. French imported goods far outweighed the
regions imports in 2011, this was however reigned in during 2012 where imports and exports declined.
Source: Quantec, 2013
The top export product from the Western Cape to France in 2012 were measuring or checking instruments, this product was
also the fastest growing export by a considerable margin. The traditional Western Cape exports of grape wines and citrus fruit
were second and third respectively.
In 2012, the top imported product were wooden casks, barrels as French oak is considered a better product to hold wines and
brandies while they mature. Aircraft, spacecraft, satellites was the second largest French export to South Africa while the
pharmaceutical products of blood, antisera, vaccines, toxins and cultures were the third largest and the fastest growing export.
2003 2004 2005 2006 2007 2008 2009 2010 2011 2012
Exports (ZARm) 804.2 1001.9 1200.3 1156.6 1412.3 2121.8 1372.1 1562.1 1020.4 921.7
Imports(ZARm) 1188.7 1273.4 1215.5 1476.7 1886.6 2665.2 2339.2 1918.4 2703.9 1932.0
Trade Balance (ZARm) -384.5 -271.5 -15.2 -320.2 -474.3 -543.4 -967.2 -356.3 -1683.6 -1010.3
-2000
-1500
-1000
-500
0
500
1000
1500
2000
2500
3000
Val
ue (
ZA
Rm
)
WESTERN CAPE TRADE WITH FRANCE, 2003-2012
9
TOP 10 PRODUCTS EXPORTED BY THE WESTERN CAPE, 2012 TOP 10 PRODUCTS IMPORTED BY THE WESTERN CAPE 2012
RANK PRODUCT HS4
VALUE
2012
(ZARm)
% GROWTH
2011-2012 RANK PRODUCT HS4
VALUE
2012
(ZARm)
% GROWTH
2011-2012
1 Measuring or checking instruments 108.5 9642.54% 1 Wooden casks, barrels, vats, tubs, 134.8 7.69%
2 Grape wines(including fortified),
alcoholic grape must 95.3 21.26% 2 Aircraft, spacecraft, satellites 123.4 -
3 Citrus fruit, fresh or dried 72.9 67.33% 3 Blood, antisera, vaccines, toxins
and cultures 101.2 20214.91%
4 Fish fillets, fish meat, mince except liver,
roe 67.3 -24.38% 4
Oils petroleum, bituminous,
distillates, except crude 81.5 -92.85%
5 Apples, pears and quinces, fresh 65.7 25.64% 5 Perfumes and toilet waters 71.6 22.08%
6 Liqueur, spirits and undenatured ethyl
alcohol <80% 64.1 297.61% 6
Stoppers, caps, lids, crown corks,
etc off base metal 63.0 -1.91%
7 Diodes, transistors, semi-conductors,
etc 60.8 -85.57% 7
Tobacco, tobacco substitute
products nes 58.7 75.74%
8 Parts for radio, tv transmission, receive
equipment 40.5 114.07% 8 Gasoline and oil additives 45.0 -42.35%
9 Yachts, pleasure, sports vessels, rowing
boats, canoes 39.6 2598.87% 9
Refrigerators, freezers and heat
pumps nes 44.8 21.83%
10 Grapes, fresh or dried 37.3 13.95% 10 Acrylic polymers in primary
forms 43.7 -3.53%
TOTAL EXPORTS 921.7 -9.66% TOTAL IMPORTS 1,932.0 -28.55%
Source: Quantec, 2013
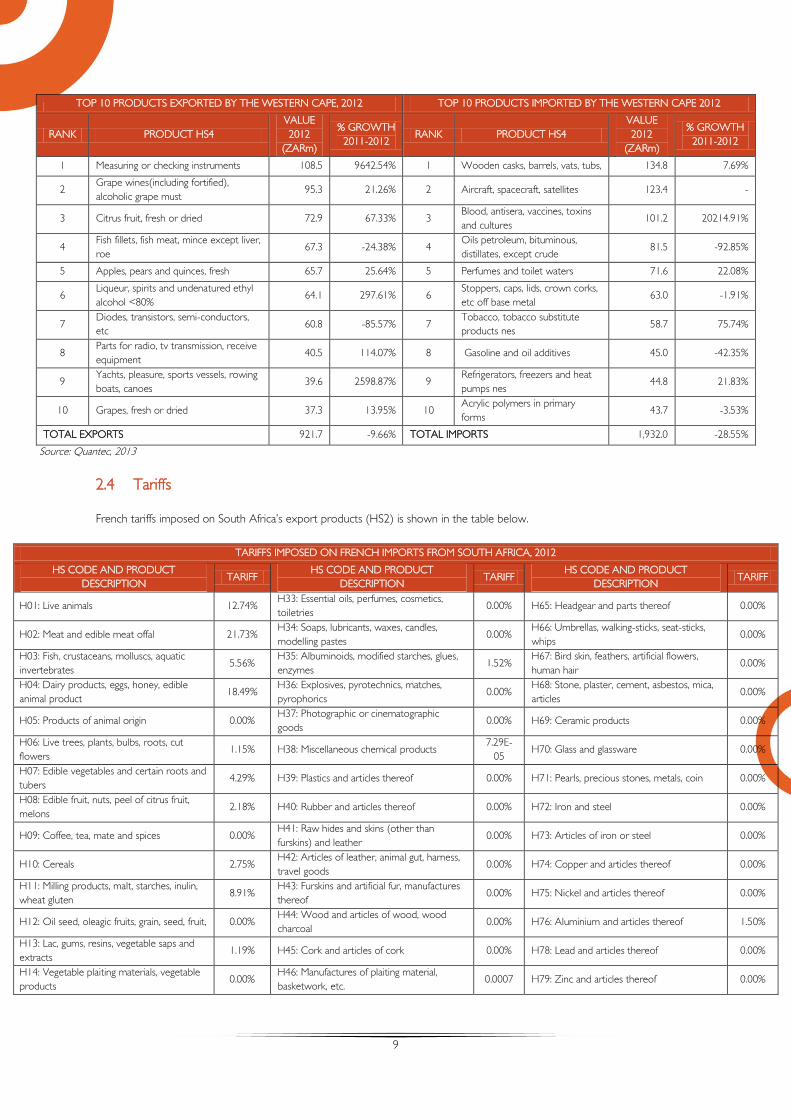
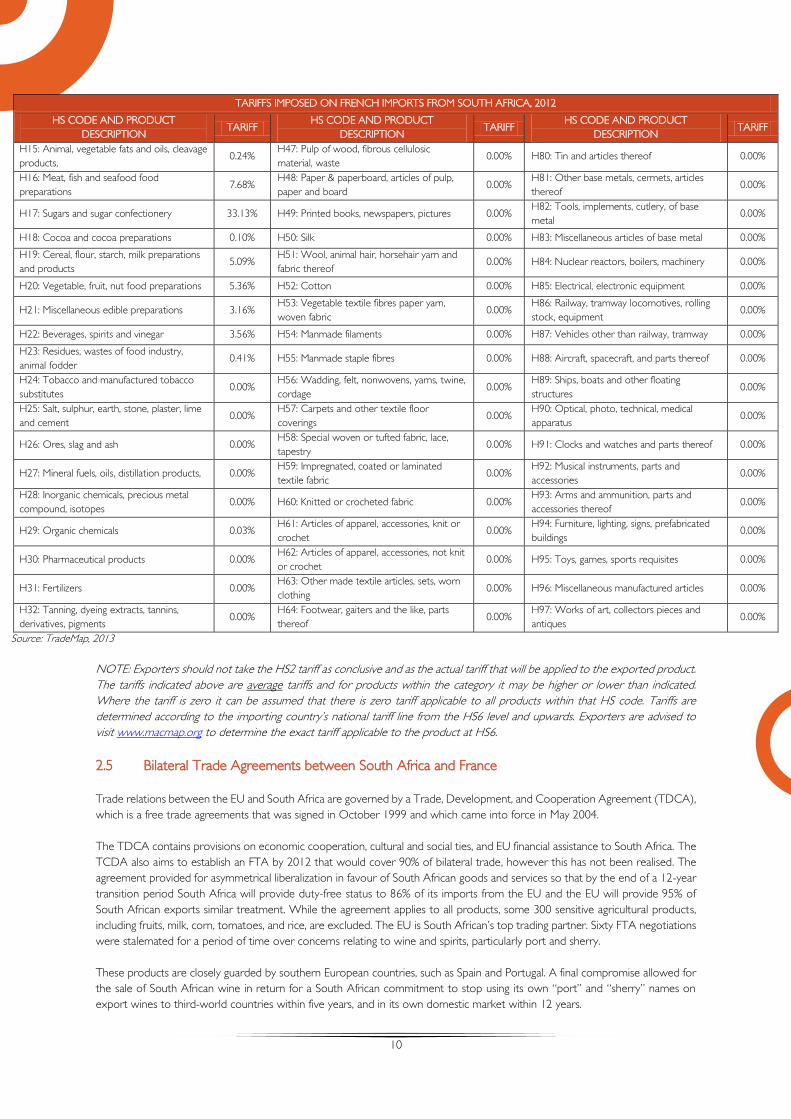
2.4 Tariffs
French tariffs imposed on South Africa’s export products (HS2) is shown in the table below.
TARIFFS IMPOSED ON FRENCH IMPORTS FROM SOUTH AFRICA, 2012
HS CODE AND PRODUCT
DESCRIPTION TARIFF
HS CODE AND PRODUCT
DESCRIPTION TARIFF
HS CODE AND PRODUCT
DESCRIPTION TARIFF
H01: Live animals 12.74% H33: Essential oils, perfumes, cosmetics,
toiletries 0.00% H65: Headgear and parts thereof 0.00%
H02: Meat and edible meat offal 21.73% H34: Soaps, lubricants, waxes, candles,
modelling pastes 0.00%
H66: Umbrellas, walking-sticks, seat-sticks,
whips 0.00%
H03: Fish, crustaceans, molluscs, aquatic
invertebrates 5.56%
H35: Albuminoids, modified starches, glues,
enzymes 1.52%
H67: Bird skin, feathers, artificial flowers,
human hair 0.00%
H04: Dairy products, eggs, honey, edible
animal product 18.49%
H36: Explosives, pyrotechnics, matches,
pyrophorics 0.00%
H68: Stone, plaster, cement, asbestos, mica,
articles 0.00%
H05: Products of animal origin 0.00% H37: Photographic or cinematographic
goods 0.00% H69: Ceramic products 0.00%
H06: Live trees, plants, bulbs, roots, cut
flowers 1.15% H38: Miscellaneous chemical products
7.29E-
05 H70: Glass and glassware 0.00%
H07: Edible vegetables and certain roots and
tubers 4.29% H39: Plastics and articles thereof 0.00% H71: Pearls, precious stones, metals, coin 0.00%
H08: Edible fruit, nuts, peel of citrus fruit,
melons 2.18% H40: Rubber and articles thereof 0.00% H72: Iron and steel 0.00%
H09: Coffee, tea, mate and spices 0.00% H41: Raw hides and skins (other than
furskins) and leather 0.00% H73: Articles of iron or steel 0.00%
H10: Cereals 2.75% H42: Articles of leather, animal gut, harness,
travel goods 0.00% H74: Copper and articles thereof 0.00%
H11: Milling products, malt, starches, inulin,
wheat gluten 8.91%
H43: Furskins and artificial fur, manufactures
thereof 0.00% H75: Nickel and articles thereof 0.00%
H12: Oil seed, oleagic fruits, grain, seed, fruit, 0.00% H44: Wood and articles of wood, wood
charcoal 0.00% H76: Aluminium and articles thereof 1.50%
H13: Lac, gums, resins, vegetable saps and
extracts 1.19% H45: Cork and articles of cork 0.00% H78: Lead and articles thereof 0.00%
H14: Vegetable plaiting materials, vegetable
products 0.00%
H46: Manufactures of plaiting material,
basketwork, etc. 0.0007 H79: Zinc and articles thereof 0.00%
10
TARIFFS IMPOSED ON FRENCH IMPORTS FROM SOUTH AFRICA, 2012
HS CODE AND PRODUCT
DESCRIPTION TARIFF
HS CODE AND PRODUCT
DESCRIPTION TARIFF
HS CODE AND PRODUCT
DESCRIPTION TARIFF
H15: Animal, vegetable fats and oils, cleavage
products, 0.24%
H47: Pulp of wood, fibrous cellulosic
material, waste 0.00% H80: Tin and articles thereof 0.00%
H16: Meat, fish and seafood food
preparations 7.68%
H48: Paper & paperboard, articles of pulp,
paper and board 0.00%
H81: Other base metals, cermets, articles
thereof 0.00%
H17: Sugars and sugar confectionery 33.13% H49: Printed books, newspapers, pictures 0.00% H82: Tools, implements, cutlery, of base
metal 0.00%
H18: Cocoa and cocoa preparations 0.10% H50: Silk 0.00% H83: Miscellaneous articles of base metal 0.00%
H19: Cereal, flour, starch, milk preparations
and products 5.09%
H51: Wool, animal hair, horsehair yarn and
fabric thereof 0.00% H84: Nuclear reactors, boilers, machinery 0.00%
H20: Vegetable, fruit, nut food preparations 5.36% H52: Cotton 0.00% H85: Electrical, electronic equipment 0.00%
H21: Miscellaneous edible preparations 3.16% H53: Vegetable textile fibres paper yarn,
woven fabric 0.00%
H86: Railway, tramway locomotives, rolling
stock, equipment 0.00%
H22: Beverages, spirits and vinegar 3.56% H54: Manmade filaments 0.00% H87: Vehicles other than railway, tramway 0.00%
H23: Residues, wastes of food industry,
animal fodder 0.41% H55: Manmade staple fibres 0.00% H88: Aircraft, spacecraft, and parts thereof 0.00%
H24: Tobacco and manufactured tobacco
substitutes 0.00%
H56: Wadding, felt, nonwovens, yarns, twine,
cordage 0.00%
H89: Ships, boats and other floating
structures 0.00%
H25: Salt, sulphur, earth, stone, plaster, lime
and cement 0.00%
H57: Carpets and other textile floor
coverings 0.00%
H90: Optical, photo, technical, medical
apparatus 0.00%
H26: Ores, slag and ash 0.00% H58: Special woven or tufted fabric, lace,
tapestry 0.00% H91: Clocks and watches and parts thereof 0.00%
H27: Mineral fuels, oils, distillation products, 0.00% H59: Impregnated, coated or laminated
textile fabric 0.00%
H92: Musical instruments, parts and
accessories 0.00%
H28: Inorganic chemicals, precious metal
compound, isotopes 0.00% H60: Knitted or crocheted fabric 0.00%
H93: Arms and ammunition, parts and
accessories thereof 0.00%
H29: Organic chemicals 0.03% H61: Articles of apparel, accessories, knit or
crochet 0.00%
H94: Furniture, lighting, signs, prefabricated
buildings 0.00%
H30: Pharmaceutical products 0.00% H62: Articles of apparel, accessories, not knit
or crochet 0.00% H95: Toys, games, sports requisites 0.00%
H31: Fertilizers 0.00% H63: Other made textile articles, sets, worn
clothing 0.00% H96: Miscellaneous manufactured articles 0.00%
H32: Tanning, dyeing extracts, tannins,
derivatives, pigments 0.00%
H64: Footwear, gaiters and the like, parts
thereof 0.00%
H97: Works of art, collectors pieces and
antiques 0.00%
Source: TradeMap, 2013
NOTE: Exporters should not take the HS2 tariff as conclusive and as the actual tariff that will be applied to the exported product.
The tariffs indicated above are average tariffs and for products within the category it may be higher or lower than indicated.
Where the tariff is zero it can be assumed that there is zero tariff applicable to all products within that HS code. Tariffs are
determined according to the importing country’s national tariff line from the HS6 level and upwards. Exporters are advised to
visit www.macmap.org to determine the exact tariff applicable to the product at HS6.
2.5 Bilateral Trade Agreements between South Africa and France
Trade relations between the EU and South Africa are governed by a Trade, Development, and Cooperation Agreement (TDCA),
which is a free trade agreements that was signed in October 1999 and which came into force in May 2004.
The TDCA contains provisions on economic cooperation, cultural and social ties, and EU financial assistance to South Africa. The
TCDA also aims to establish an FTA by 2012 that would cover 90% of bilateral trade, however this has not been realised. The
agreement provided for asymmetrical liberalization in favour of South African goods and services so that by the end of a 12-year
transition period South Africa will provide duty-free status to 86% of its imports from the EU and the EU will provide 95% of
South African exports similar treatment. While the agreement applies to all products, some 300 sensitive agricultural products,
including fruits, milk, corn, tomatoes, and rice, are excluded. The EU is South African’s top trading partner. Sixty FTA negotiations
were stalemated for a period of time over concerns relating to wine and spirits, particularly port and sherry.
These products are closely guarded by southern European countries, such as Spain and Portugal. A final compromise allowed for
the sale of South African wine in return for a South African commitment to stop using its own “port” and “sherry” names on
export wines to third-world countries within five years, and in its own domestic market within 12 years.
11
2.6 Port to Port
France is blessed with numerous ports on it northern and Mediterranean coasts through a long history of maritime trade. The
main ports are shown in the table below.
CAPE TOWN PORT TERMINAL TO FRENCH MAIN SEA PORTS
FRENCH PORTS DISTANCE TRANSIT TIME
Port of Bordeaux 10801km(5832.3M) 35 days 9 hrs.
Port of Brest 10656.7km(5754.2M) 35 days 3 hrs
Port of Fos Sur Mer 10767.7km(5814.1M) 35 days 7hrs
Marsaille 10781km(5821.2M) 35 days 8hrs
Sete Terminal 10722.3km(5878.6M) 35 days 5 hrs
Port of La Pallice 10716.4km(5786.4M) 35 days 5 hrs
Port of Rouen 11188.3(6041M) 35 days 23hrs
Port of Le Harve 11075.3(5890.2M) 35 days 19hrs
Source: Sea-Rates, 2013
3. Investment
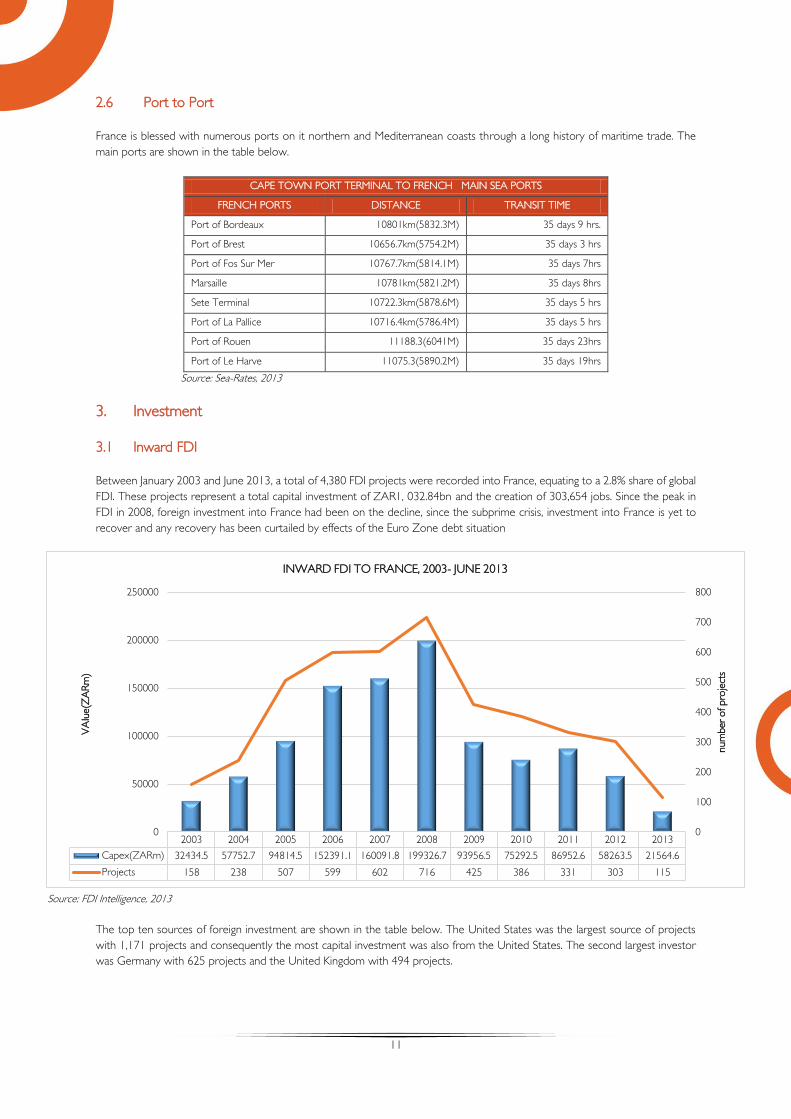
3.1 Inward FDI
Between January 2003 and June 2013, a total of 4,380 FDI projects were recorded into France, equating to a 2.8% share of global
FDI. These projects represent a total capital investment of ZAR1, 032.84bn and the creation of 303,654 jobs. Since the peak in
FDI in 2008, foreign investment into France had been on the decline, since the subprime crisis, investment into France is yet to
recover and any recovery has been curtailed by effects of the Euro Zone debt situation
Source: FDI Intelligence, 2013
The top ten sources of foreign investment are shown in the table below. The United States was the largest source of projects
with 1,171 projects and consequently the most capital investment was also from the United States. The second largest investor
was Germany with 625 projects and the United Kingdom with 494 projects.
2003 2004 2005 2006 2007 2008 2009 2010 2011 2012 2013
Capex(ZARm) 32434.5 57752.7 94814.5 152391.1 160091.8 199326.7 93956.5 75292.5 86952.6 58263.5 21564.6
Projects 158 238 507 599 602 716 425 386 331 303 115
0
100
200
300
400
500
600
700
800
0
50000
100000
150000
200000
250000
num
ber
of pro
ject
s
VA
lue(Z
AR
m)
INWARD FDI TO FRANCE, 2003- JUNE 2013
12
TOP 10 SOURCE MARKETS FOR FDI INTO FRANCE, 2003- MAY 2013
RANK COUNTRY PROJECTS % PROJECTS CAPEX (ZARm) % CAPEX COMPANIES % COMPANIES
1 United States 1,171 26.74% 221 633.58 21.46% 908 27.46%
2 Germany 625 14.27% 134 087.47 12.98% 454 10.42%
3 United Kingdom 494 11.28% 118 899.37 11.51% 381 8.06%
4 Spain 271 6.19% 104 483.31 10.12% 193 7.81%
5 Italy 224 5.11% 46 115.66 4.46% 174 4.00%
6 Japan 214 4.89% 31 755.82 3.07% 157 2.67%
7 Switzerland 214 4.89% 81 490.37 7.89% 151 2.54%
8 Netherlands 166 3.79% 60 053.93 5.81% 121 2.67%
9 Sweden 134 3.06% 44 865.83 4.34% 67 1.53%
10 Belgium 134 3.06% 18 139.10 1.76% 109 1.95%
Other Countries 733 16.74% 171 318.68 16.59% 592 23.46%
TOTAL 4,380.00 100.00% 1 032 843.12 100.00% 3,307 100.00%
Source: FDI Intelligence, 2013
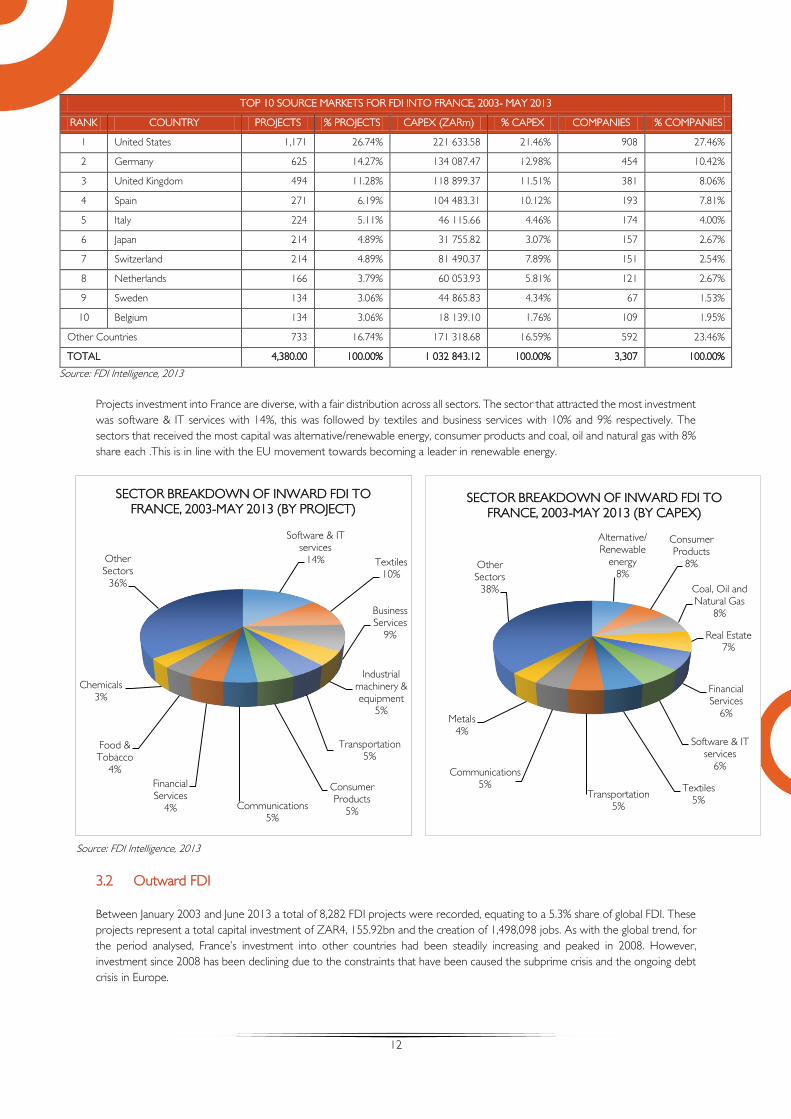
Projects investment into France are diverse, with a fair distribution across all sectors. The sector that attracted the most investment
was software & IT services with 14%, this was followed by textiles and business services with 10% and 9% respectively. The
sectors that received the most capital was alternative/renewable energy, consumer products and coal, oil and natural gas with 8%
share each .This is in line with the EU movement towards becoming a leader in renewable energy.
Source: FDI Intelligence, 2013
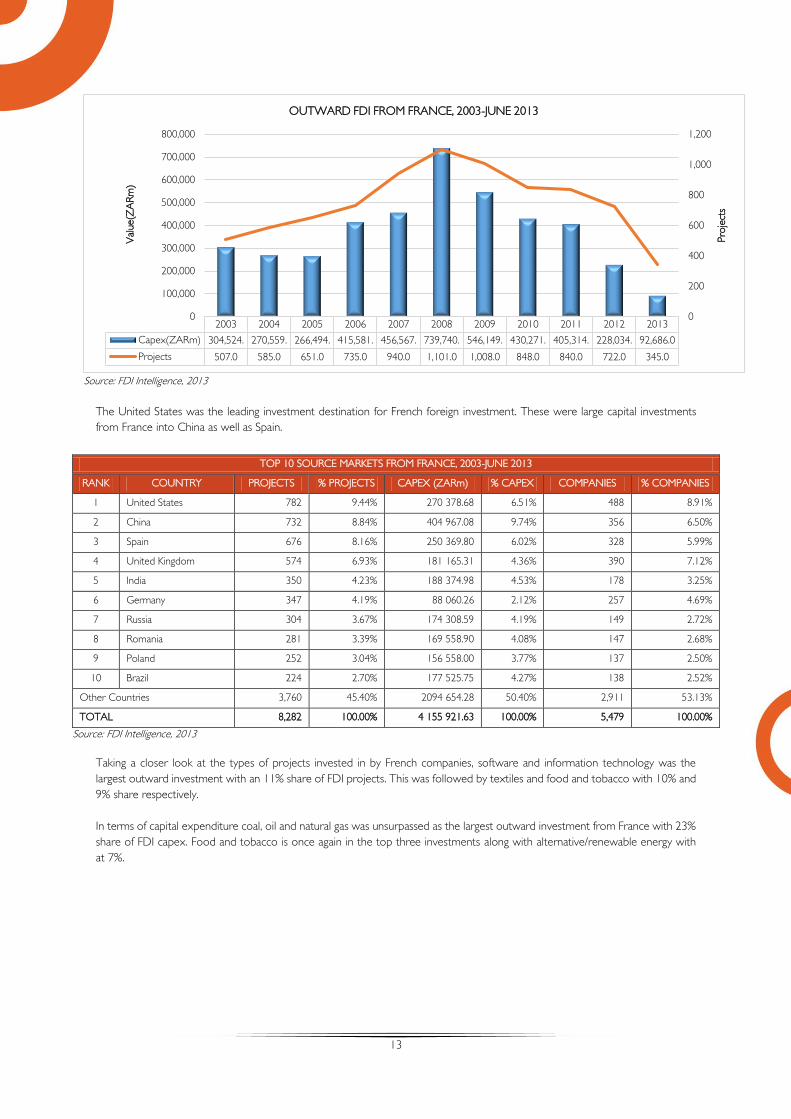
3.2 Outward FDI
Between January 2003 and June 2013 a total of 8,282 FDI projects were recorded, equating to a 5.3% share of global FDI. These
projects represent a total capital investment of ZAR4, 155.92bn and the creation of 1,498,098 jobs. As with the global trend, for
the period analysed, France’s investment into other countries had been steadily increasing and peaked in 2008. However,
investment since 2008 has been declining due to the constraints that have been caused the subprime crisis and the ongoing debt
crisis in Europe.
Software & IT services
14% Textiles10%
Business Services
9%
Industrial machinery &
equipment5%
Transportation5%
Consumer Products
5%Communications
5%
Financial Services
4%
Food & Tobacco
4%
Chemicals3%
Other Sectors
36%
SECTOR BREAKDOWN OF INWARD FDI TO
FRANCE, 2003-MAY 2013 (BY PROJECT)
Alternative/ Renewable
energy8%
Consumer Products
8%
Coal, Oil and Natural Gas
8%
Real Estate7%
Financial Services
6%
Software & IT services
6%
Textiles5%
Transportation5%
Communications5%
Metals4%
Other Sectors
38%
SECTOR BREAKDOWN OF INWARD FDI TO
FRANCE, 2003-MAY 2013 (BY CAPEX)
13
Source: FDI Intelligence, 2013
The United States was the leading investment destination for French foreign investment. These were large capital investments
from France into China as well as Spain.
Source: FDI Intelligence, 2013
Taking a closer look at the types of projects invested in by French companies, software and information technology was the
largest outward investment with an 11% share of FDI projects. This was followed by textiles and food and tobacco with 10% and
9% share respectively.
In terms of capital expenditure coal, oil and natural gas was unsurpassed as the largest outward investment from France with 23%
share of FDI capex. Food and tobacco is once again in the top three investments along with alternative/renewable energy with
at 7%.
TOP 10 SOURCE MARKETS FROM FRANCE, 2003-JUNE 2013
RANK COUNTRY PROJECTS % PROJECTS CAPEX (ZARm) % CAPEX COMPANIES % COMPANIES
1 United States 782 9.44% 270 378.68 6.51% 488 8.91%
2 China 732 8.84% 404 967.08 9.74% 356 6.50%
3 Spain 676 8.16% 250 369.80 6.02% 328 5.99%
4 United Kingdom 574 6.93% 181 165.31 4.36% 390 7.12%
5 India 350 4.23% 188 374.98 4.53% 178 3.25%
6 Germany 347 4.19% 88 060.26 2.12% 257 4.69%
7 Russia 304 3.67% 174 308.59 4.19% 149 2.72%
8 Romania 281 3.39% 169 558.90 4.08% 147 2.68%
9 Poland 252 3.04% 156 558.00 3.77% 137 2.50%
10 Brazil 224 2.70% 177 525.75 4.27% 138 2.52%
Other Countries 3,760 45.40% 2094 654.28 50.40% 2,911 53.13%
TOTAL 8,282 100.00% 4 155 921.63 100.00% 5,479 100.00%
2003 2004 2005 2006 2007 2008 2009 2010 2011 2012 2013
Capex(ZARm) 304,524. 270,559. 266,494. 415,581. 456,567. 739,740. 546,149. 430,271. 405,314. 228,034. 92,686.0
Projects 507.0 585.0 651.0 735.0 940.0 1,101.0 1,008.0 848.0 840.0 722.0 345.0
0
200
400
600
800
1,000
1,200
0
100,000
200,000
300,000
400,000
500,000
600,000
700,000
800,000
Pro
ject
s
Val
ue(Z
AR
m)
OUTWARD FDI FROM FRANCE, 2003-JUNE 2013

14
Source: FDI Intelligence, 2013
3.3 FDI Flows between South Africa & France
Between January 2003 and June 2013 a total of 36 FDI projects were recorded amounting to ZAR15.58bn and creating 2,894
jobs. When looking closer at French investment into South Africa it is varied with no definitive trend. In 2010, there was a large
inflow of capital intensive FDI and in 2011 a large number of FDI projects were recorded.
Source: FDI Intelligence, 2013
In terms of the types of projects French companies invested in, it is mostly service based investments with a small percentage in
manufacturing. Business services attracted the largest share with 17%, followed by financial services (14%) and software and IT
services (11%). In analyzing the investment expenditure, although alternative and renewable energy attracted 3 projects, these
projects amounted to 35% of the investment value. Communications accounted for 19% and chemical projects accounted for
15%.
Software & IT services
11%
Textiles10%
Food & Tobacco
9%
Business Services
8%
Consumer Products
7%Financial Services
6%
Communications4%
Transportation4%
Chemicals4%
Hotels & Tourism
4%
Other Sectors
33%
SECTOR BREAKDOWN OF OUTWARD FDI
FROM FRANCE, 2003-JUNE 2013 (PROJECTS)
Coal, Oil and Natural Gas
23%
Food & Tobacco
7%
Alternative/ Renewable
energy7%
Automotive OEM
6%Chemicals6%
Hotels & Tourism
6%Communications5%
Consumer Products
4%
Building & Construction
4%
Transportation3%
Other Sectors
29%
SECTOR BREAKDOWN OF OUTWARD FDI
FROM FRANCE, 2003-JUNE2013
2004 2005 2006 2007 2008 2009 2010 2011 2012 2013
Capex(ZARm 2,153.3 750.6 1,172.1 69.4 225.7 515.8 8,673.6 1,428.4 460.4 135.6
Projects 2 3 3 1 4 7 5 7 3 1
0
1
2
3
4
5
6
7
8
0
1,000
2,000
3,000
4,000
5,000
6,000
7,000
8,000
9,000
10,000
Pro
ject
s
Val
ue(Z
AR
m)
FDI FROM FRANCE TO SOUTH AFRICA, 2004-JUNE 2013

15
Source: FDI Intelligence, 2013
Listed below are the top 10 French companies investing in South Africa
TOP 10 COMPANIES INVESTING INTO SOUTH AFRICA, 2003-JUNE 2013
RANK INVESTING COMPANY PROJECTS CAPEX(ZARm)
1 BNP Paribas 3 233.1
2 Concentrix Solar 2 5,333.28
3 Diana Group 2 339.74
4 Teleperformance 2 76.05
5 Lafarge 2 524.9
6 Air Liquide 1 2,036.76
7 SCOR 1 100.85
8 Accor 1 996.06
9 CMA CGM 1 187.64
10 Elonex 1 15.71
Other companies 20 5740.29
Total 36 15584.38
Source: FDI Intelligence, 2013
3.4 FDI from South Africa to France
Between January 2003 and June 2013, a total of 6 FDI projects were recorded amounting to ZAR499.27m and creating 223 jobs.
In this period there was one investment from the Western Cape by Bridge People and Technology worth, ZAR66m
Business Services
17%
Financial Services
14%
Software & IT services
11%
Electronic Components
11%
Transportation8%
Chemicals8%
Alternative/ Renewable
energy8%
Biotechnology3%
Building & Construction
3%
Business Machines &
Equipments3%
Other Sectors
14%
SECTOR BREAKDOWN OF FDI FROM
FRANCE TO SOUTH AFRICA, 2003-JUNE
2013 (PROJECTS)
Alternative/ Renewable
energy35%
Communications19%
Chemicals15%
Hotels & Tourism
6%
Software & IT services
6%
Transportation5%
Business Services
4%
Building & Construction
3%
Financial Services
3%
Electronic Components
2%
Other Sectors
2%
SECTOR BREAKDOWN OF FDI FROM
FRANCE TO SOUTH AFRICA, 2003-JUNE
2013 (CAPEX)

16
FDI FROM SOUTH AFRICA TO FRANCE, 2003 - JUNE 2013
PROJECT
DATE INVESTING COMPANY
PARENT
COMPANY
SOURCE
STATE
INDUSTRY
SECTOR SUB-SECTOR
INDUSTRY
ACTIVITY
CAPEX
(ZARm) JOBS
Oct-12 HL Hall International HL Hall &
Sons Mpumalanga Food & Tobacco
Fruits & vegetables &
specialist foods
Logistics, Distribution
& Transportation 218.2 94
May-12 Barloworld Supply Chain
Software Barloworld Gauteng
Software & IT
services
Software publishers, except
video games
Sales, Marketing &
Support 67.0 23
Jan-10 HL Hall International HL Hall &
Sons Mpumalanga Food & Tobacco
Fruits & vegetables &
specialist foods
Sales, Marketing &
Support 28.9 27
Apr-07 Crane
Telecommunications Datatec Gauteng Communications
Wired telecommunication
carriers
Sales, Marketing &
Support 36.4 19
May-06 Dimension Data Europe
Dimension
Data Holdings
(DiData)
Gauteng Software & IT
services
Computer facilities
management services
Sales, Marketing &
Support 81.8 35
Dec-03 Bridge People and
Technology
Bridge People
and
Technology
Western Cape Software & IT
services
Custom computer
programming services
Sales, Marketing &
Support 67.0 25
TOTAL 499.3 223.0
Source: FDI Intelligence, 2013
3.5 FDI from France to Western Cape
Between January 2003 and June 2013 a total of 9 FDI projects were recorded from France into the Western Cape. These projects
represent a total capital investment of ZAR5.76bn and a total of 1,044 jobs were created. Sales, marketing and support received
attracted the largest amount of projects, while electivity projects received the largest capital expenditure.
FDI FROM FRANCE TO THE WESTERN CAPE, 2003 – JUNE 2013
PROJECT
DATE
INVESTING
COMPANY
DESTINATION
CITY INDUSTRY SECTOR SUB-SECTOR INDUSTRY ACTIVITY
CAPEX
(ZARm) JOBS
Sep-10 Concentrix Solar Not Specified Alternative/Renewable energy Solar electric power Electricity 2666.6 95
Sep-10 Concentrix Solar Not Specified Alternative/Renewable energy Solar electric power Electricity 2666.6 95
Mar-10 Tenesol Cape Town Electronic Components All other electrical
equipment & components Manufacturing 98.4 135
Nov-09 Teleperformance Cape Town Business Services Business support services Customer Contact Centre 38.0 297
Nov-09 Teleperformance Cape Town Business Services Business support services Customer Contact Centre 38.0 297
Sep-09 AD Software Cape Town Software & IT services Software publishers,
except video games Sales, Marketing & Support 63.6 14
Jun-09 Trusted Logic Cape Town Software & IT services Software publishers,
except video games Sales, Marketing & Support 63.6 14
Mar-09 Solaire Direct Cape Town Electronic Components All other electrical
equipment & components Manufacturing 58.7 70
Jan-09 Diana Group (Groupe
Diana) Cape Town Chemicals
Paints, coatings, additives &
adhesives Sales, Marketing & Support 66.1 27
Total 5759.8 1044.0
Source: FDI Intelligence, 2013
4. Tourism
4.1 Overview of the Tourism Offerings in France
According to the annual report on tourism from France's international competitiveness agency, the DGCIS. France was the
world’s top tourist destination again last year, maintaining this status that it has held since the 1990s, with 83 million foreigners
visiting in 2012. The new figure beat the previous record of 81.4 million foreign visitors in 2011.
17
4.2 French Trends and Travel Patterns
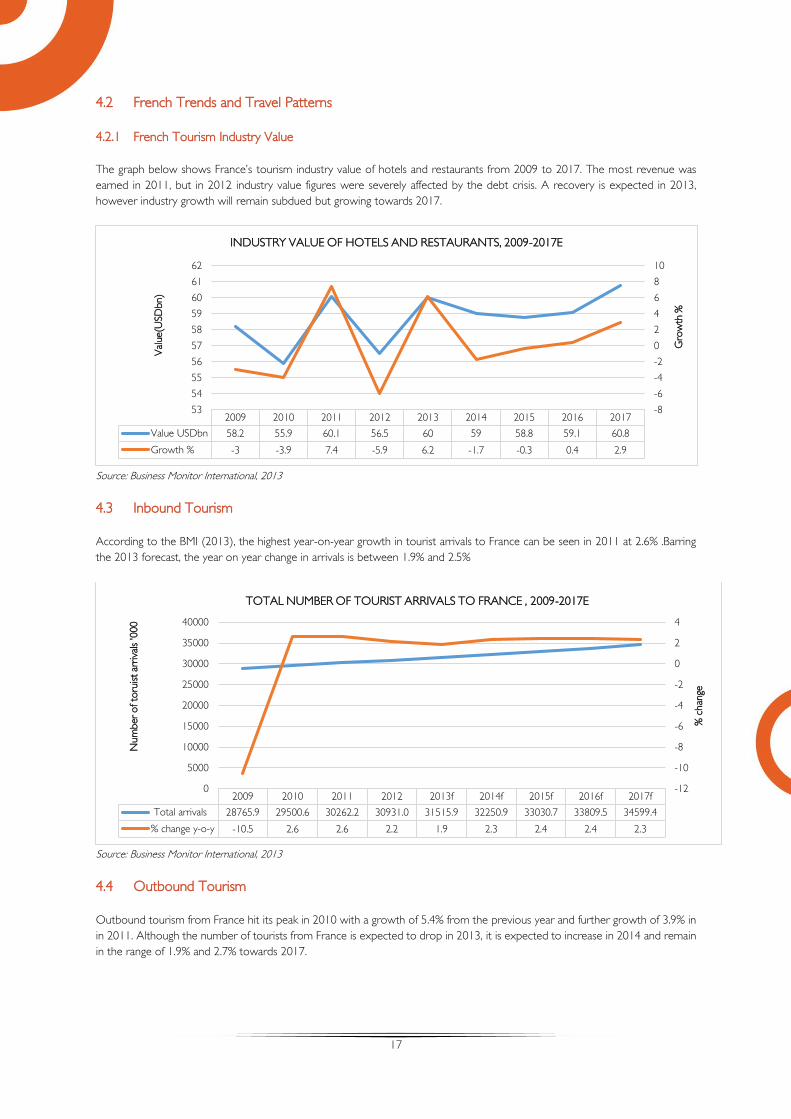
4.2.1 French Tourism Industry Value
The graph below shows France’s tourism industry value of hotels and restaurants from 2009 to 2017. The most revenue was
earned in 2011, but in 2012 industry value figures were severely affected by the debt crisis. A recovery is expected in 2013,
however industry growth will remain subdued but growing towards 2017.
Source: Business Monitor International, 2013
4.3 Inbound Tourism
According to the BMI (2013), the highest year-on-year growth in tourist arrivals to France can be seen in 2011 at 2.6% .Barring
the 2013 forecast, the year on year change in arrivals is between 1.9% and 2.5%
Source: Business Monitor International, 2013
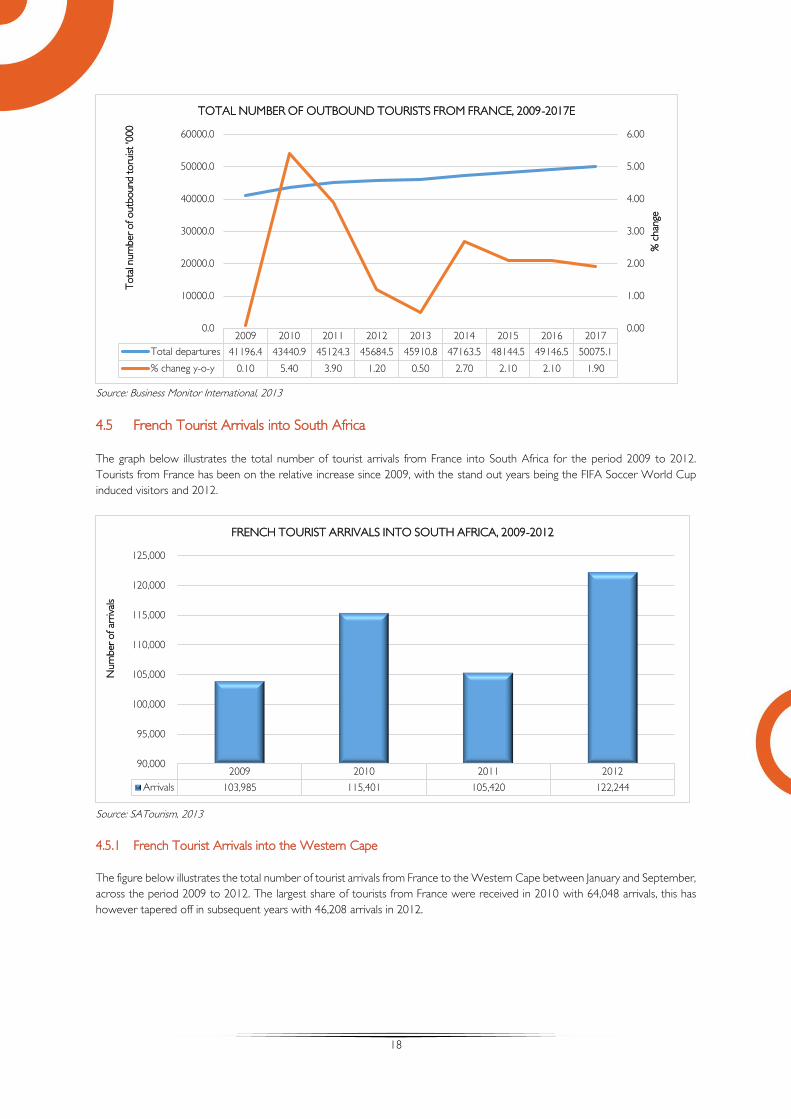
4.4 Outbound Tourism
Outbound tourism from France hit its peak in 2010 with a growth of 5.4% from the previous year and further growth of 3.9% in
in 2011. Although the number of tourists from France is expected to drop in 2013, it is expected to increase in 2014 and remain
in the range of 1.9% and 2.7% towards 2017.
2009 2010 2011 2012 2013f 2014f 2015f 2016f 2017f
Total arrivals 28765.9 29500.6 30262.2 30931.0 31515.9 32250.9 33030.7 33809.5 34599.4
% change y-o-y -10.5 2.6 2.6 2.2 1.9 2.3 2.4 2.4 2.3
-12
-10
-8
-6
-4
-2
0
2
4
0
5000
10000
15000
20000
25000
30000
35000
40000
% c
han
ge
Num
ber
of to
ruist ar
riva
ls '000
TOTAL NUMBER OF TOURIST ARRIVALS TO FRANCE , 2009-2017E
2009 2010 2011 2012 2013 2014 2015 2016 2017
Value USDbn 58.2 55.9 60.1 56.5 60 59 58.8 59.1 60.8
Growth % -3 -3.9 7.4 -5.9 6.2 -1.7 -0.3 0.4 2.9
-8
-6
-4
-2
0
2
4
6
8
10
53
54
55
56
57
58
59
60
61
62
Gro
wth
%
Val
ue(U
SD
bn)
INDUSTRY VALUE OF HOTELS AND RESTAURANTS, 2009-2017E
18
Source: Business Monitor International, 2013
4.5 French Tourist Arrivals into South Africa
The graph below illustrates the total number of tourist arrivals from France into South Africa for the period 2009 to 2012.
Tourists from France has been on the relative increase since 2009, with the stand out years being the FIFA Soccer World Cup
induced visitors and 2012.
Source: SATourism, 2013
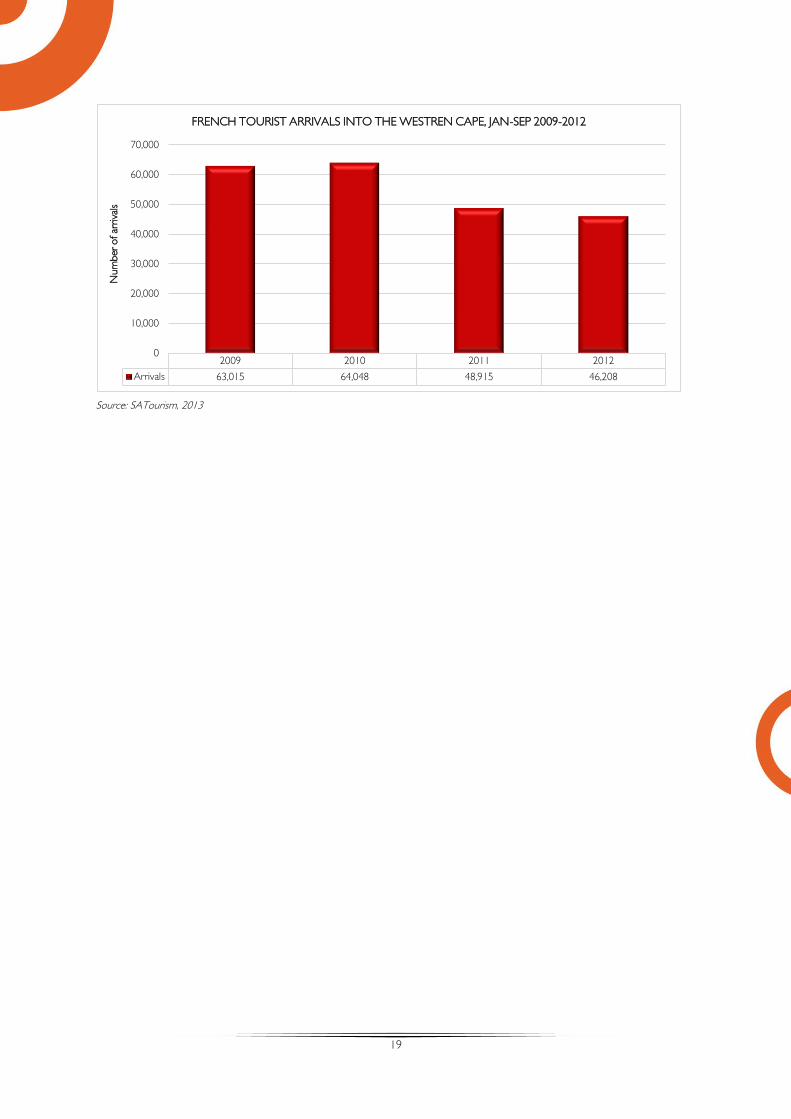
4.5.1 French Tourist Arrivals into the Western Cape
The figure below illustrates the total number of tourist arrivals from France to the Western Cape between January and September,
across the period 2009 to 2012. The largest share of tourists from France were received in 2010 with 64,048 arrivals, this has
however tapered off in subsequent years with 46,208 arrivals in 2012.
2009 2010 2011 2012 2013 2014 2015 2016 2017
Total departures 41196.4 43440.9 45124.3 45684.5 45910.8 47163.5 48144.5 49146.5 50075.1
% chaneg y-o-y 0.10 5.40 3.90 1.20 0.50 2.70 2.10 2.10 1.90
0.00
1.00
2.00
3.00
4.00
5.00
6.00
0.0
10000.0
20000.0
30000.0
40000.0
50000.0
60000.0
% c
han
ge
Tota
l num
ber
of outb
ound toru
ist '0
00
TOTAL NUMBER OF OUTBOUND TOURISTS FROM FRANCE, 2009-2017E
2009 2010 2011 2012
Arrivals 103,985 115,401 105,420 122,244
90,000
95,000
100,000
105,000
110,000
115,000
120,000
125,000
Num
ber
of ar
riva
ls
FRENCH TOURIST ARRIVALS INTO SOUTH AFRICA, 2009-2012
19
Source: SATourism, 2013
2009 2010 2011 2012
Arrivals 63,015 64,048 48,915 46,208
0
10,000
20,000
30,000
40,000
50,000
60,000
70,000
Num
ber
of ar
riva
lsFRENCH TOURIST ARRIVALS INTO THE WESTREN CAPE, JAN-SEP 2009-2012