Embed Size (px)
Citation preview
Treasu
re Ka
roo Ac
tion G
roup
©
ZA
TECHNICAL REPORT
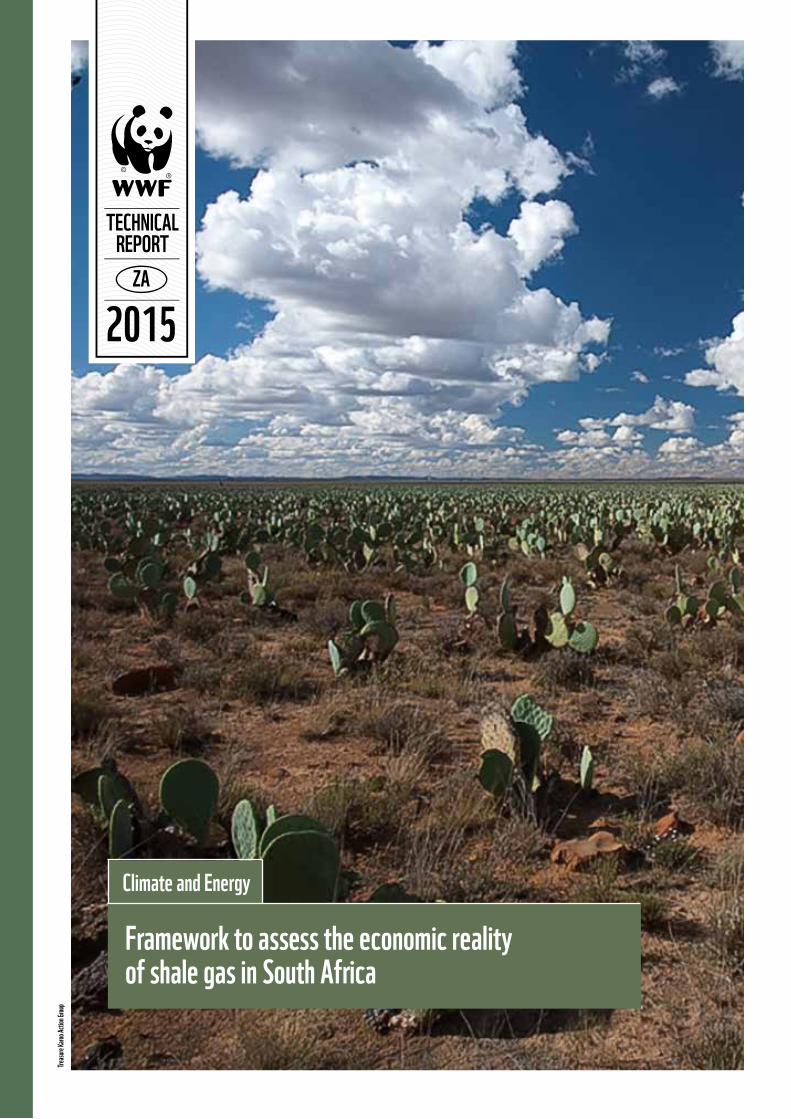
Framework to assess the economic reality of shale gas in South Africa
Climate and Energy
2015
2
ABOUT WWFWWF is one of the world’s largest and most experienced independent conservation organisations, with over 5 million supporters and a global network active in more than 100 countries.
WWF’s mission is to stop the degradation of the planet’s natural environment and to build a future in which humans live in harmony with nature, by conserving the world’s biological diversity, ensuring that the use of renewable natural resources is sustainable, and promoting the reduction of pollution and wasteful consumption.
CREDITSAuthor: Saliem FakirDesigner: Michelle Heyns, Apula
ACKNOWLEDGEMENTSThe author is grateful for having had the privilege of informative conversations with David Hughes, Michael Schwatz, Mitchell Austin, Avner Vengosh and Thomas Darrah who have written and studied the US shale plays extensively. The author also received support from WWF colleagues Manisha Gulati and Ellen Davies in the compilation of this report. The report began as a set of powerpoint slides following two months of intensive research. The presentations were shared with and commented on by various interest groups totaling more than 200 people from whom feedback was drawn in creating the final report.
Thanks go to David Bush, Edwin Ritchken, Louise Naude, Tjaša Bole-Rentel, Louise Scholtz, Duncan Pieterse, Megan Segar and Carolyn Cramer for their valuable comments. Any errors contained in the document remain the responsibility of the author. Designed by ApulaPublished in January 2015 by WWF-SA – World Wide Fund for Nature (formerly World Wildlife Fund), South Africa.© Text 2015 WWF-SAAll rights reserved
3
TABLE OF CONTENTSPreface 4 Glossary of Terms 5
1. Introduction 6 1.1 Gas in the global energy mix 6 1.2 The five key drivers of shale gas economics 6 1.3 Development of South African shale gas 7 1.4 Is a shale gas industry viable in South Africa? 7
2. A brief history of shale gas in the US 9
3. Shale-gas geology and the role of water 113.1 The origin of shale gas 113.2 Conventional versus unconventional reserves 113.3 Thermogenesis 123.4 Frack fluids and the role of water 14
4. The economics of shale gas 174.1 Recovery and learning 174.2 Decline rates 174.3 Methods for decline rates analysis 184.4 Application of the Arps formula 194.5 Aspects of shale-gas wells affecting well economics in comparison to conventional wells 22
5. Context of a wellhead base cost model 25 5.1 Base model considerations 25 5.2 The importance of technology learning rates 27 5.3 Financing of shale gas and prospects for South Africa 27 5.4 The MPRDA and South Africa’s oil and gas sector 29 5.5 Royalty rates 30 5.6 Free carry and tax waivers in South Africa 30 5.7 Timing for optimal revenue streams 31 5.8 Shale-gas pricing 31 5.9 Shale-gas pricing in the South African context 32 5.10 Shale-gas beneficiation 32
6. Costs and benefits of shale gas in South Africa 34
7. Towards a base economic model for shale gas 37
8. The economic potential and environmental challenges for South Africa 388.1 Environmental costs 388.2 The unknown impacts of seismicity 398.3 Environmental damage claims 398.4 Reclamation provisions 398.5 Carbon tax 408.6 Water costs 408.7 Shale-gas beneficiation pathways 418.8 The impact of shale gas on South Africa’s GDP 428.9 Job creation potential of shale gas 42
9. Conclusion 43
References and footnotes 45
4
PREFACEThis paper was borne in response to various claims made by both private firms and state agencies regarding the promise of shale gas as a cheap source of energy in South Africa. We undertook our own research and analysis on some of these claims. We have gone into far more detail than many reports have attempted by linking geology, environment, technology and financing. This report is the first edition as we will try to regularly update our analysis as our own knowledge grows. The issues we cover here are as comprehensive as we could be; hopefully we can set the basis for more work in this area in future.
Many of the claims made locally are based on the US experience. The majority of such claims reflect a lack of understanding both of the US experience and of the fact that for something to be replicable, the context has to be similar. As is already known, conclusions reached regarding the extraction of shale gas in the US have to be understood within the correct context and any extrapolations made must be adjusted for local conditions. Much of what is said in the local media merely touches on the politics of the debate rather than exploring the technical and economic aspects in more detail. Our own need to understand the issues led to a multitude of literature reviews, conversations and analyses of the technical material in order to undertake a proper unpacking of the economics of shale gas in more detail.
The publicity around the potential of shale gas in South Africa has focused primarily on the environmental and social implications. There has been comparatively little attention given to the critical assessment of whether or not hydraulic fracturing (fracking) would be commercially viable. The implied assumption (claimed by proponents of the oil and gas industry) is that vast amounts of money could be made by the oil and gas industry, landowners, local communities and government. The purported benefits of shale gas are largely based on what can be drawn from the US and Canadian experience. We draw, though, the bulk of our analysis from the US experience. Opinions on these benefits are divided between different experts in the light of the large write-offs of assets and value experienced by the oil majors such as Shell and others.
Given that the field of shale-gas economics is fairly new and that there is much room for growth in our understanding in South Africa, this paper attempts to summarise the core issues as they relate to the geology, the hydraulic fracturing technologies and the environmental factors that drive the extraction of shale resources and shale gas in particular. The author is not an expert geologist nor shale-gas operator and has relied on various sources in his attempt to connect the dots between the various fields to make an early appraisal of the issues that are likely to influence shale gas extraction in South Africa. This paper at best represents a modest attempt at the synthesis of the prevailing knowledge.
This report is designed to frame the economic issues pertinent to shale gas in South Africa. While the model proposed for assessing the economics of shale gas has not been tested for South African conditions, it does provide some possible approaches that warrant consideration. The report provides some preliminary conclusions. Readers who are unfamiliar with the technical aspects of the subject can refer to the references for further explanations of some of the technical issues. We hope the reader will find this informative and be better equipped to participate in the ongoing debate and policy-making process for shale gas as a result.
5
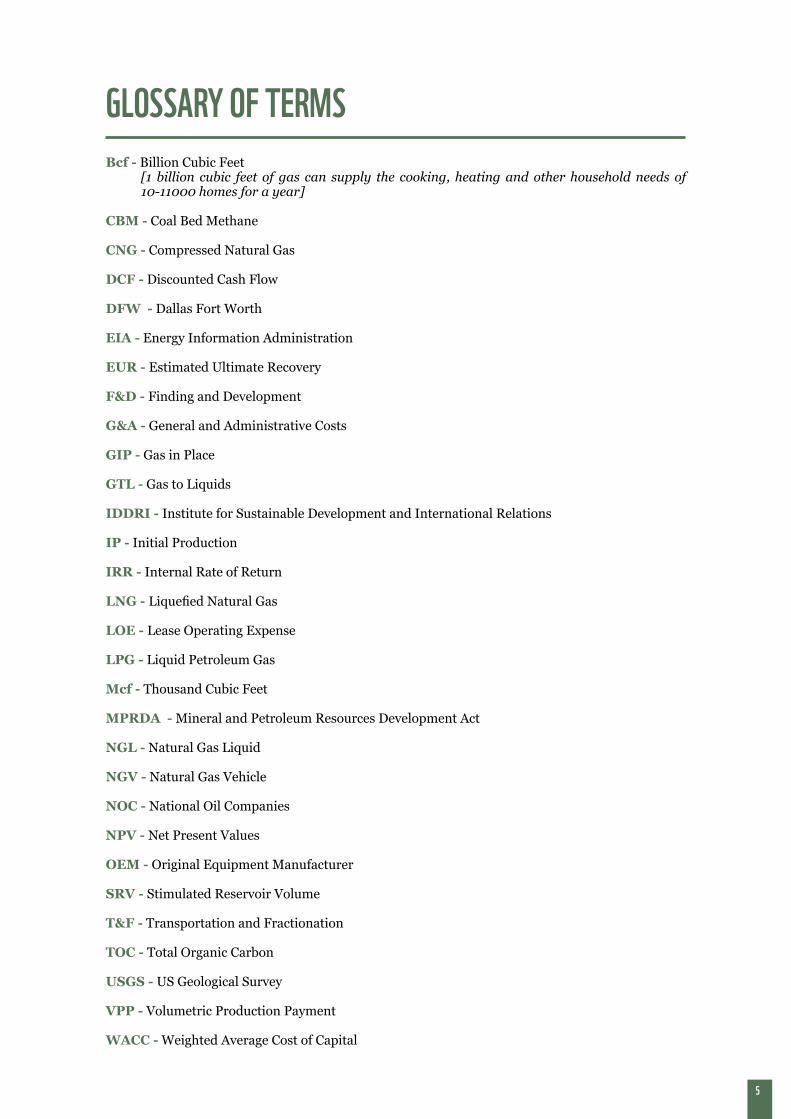
GLOSSARY OF TERMSBcf - Billion Cubic Feet [1 billion cubic feet of gas can supply the cooking, heating and other household needs of 10-11000 homes for a year]
CBM - Coal Bed Methane
CNG - Compressed Natural Gas
DCF - Discounted Cash Flow
DFW - Dallas Fort Worth
EIA - Energy Information Administration
EUR - Estimated Ultimate Recovery
F&D - Finding and Development
G&A - General and Administrative Costs
GIP - Gas in Place
GTL - Gas to Liquids
IDDRI - Institute for Sustainable Development and International Relations
IP - Initial Production
IRR - Internal Rate of Return
LNG - Liquefied Natural Gas
LOE - Lease Operating Expense
LPG - Liquid Petroleum Gas
Mcf - Thousand Cubic Feet
MPRDA - Mineral and Petroleum Resources Development Act
NGL - Natural Gas Liquid
NGV - Natural Gas Vehicle
NOC - National Oil Companies
NPV - Net Present Values
OEM - Original Equipment Manufacturer
SRV - Stimulated Reservoir Volume
T&F - Transportation and Fractionation
TOC - Total Organic Carbon
USGS - US Geological Survey
VPP - Volumetric Production Payment
WACC - Weighted Average Cost of Capital
6
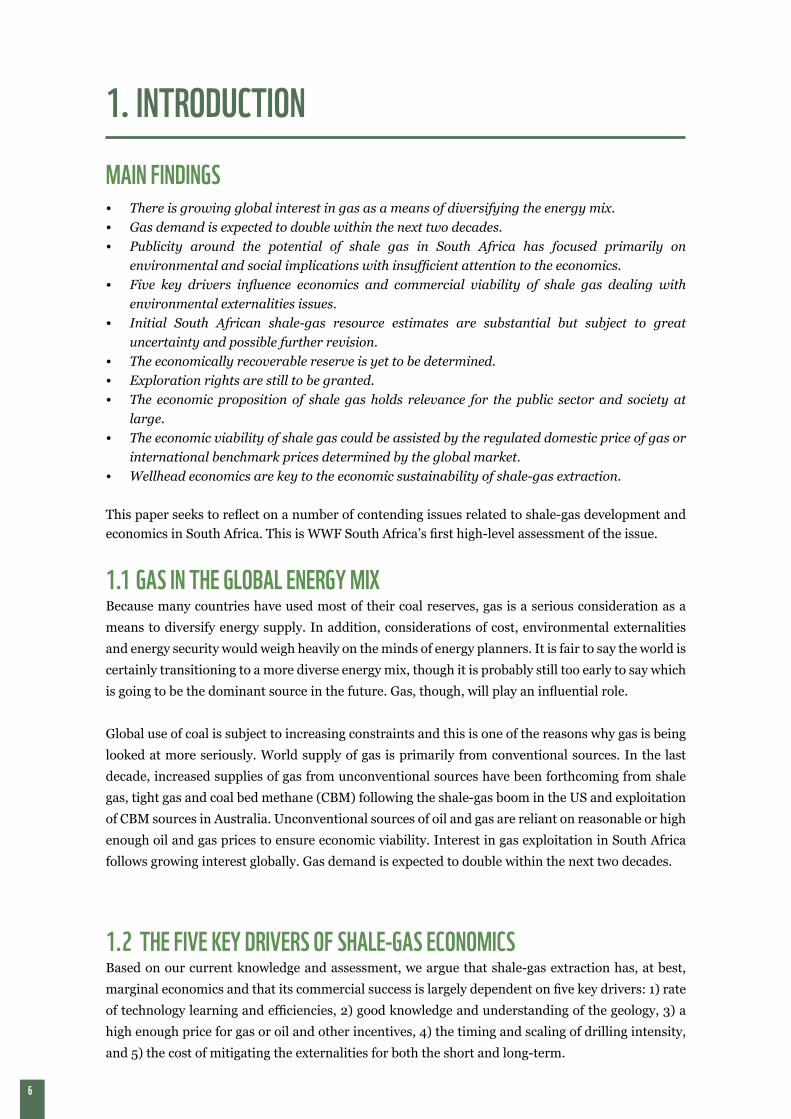
1. INTRODUCTIONMAIN FINDINGS• There is growing global interest in gas as a means of diversifying the energy mix.• Gas demand is expected to double within the next two decades.• Publicity around the potential of shale gas in South Africa has focused primarily on
environmental and social implications with insufficient attention to the economics.• Five key drivers influence economics and commercial viability of shale gas dealing with
environmental externalities issues. • Initial South African shale-gas resource estimates are substantial but subject to great
uncertainty and possible further revision.• The economically recoverable reserve is yet to be determined.• Exploration rights are still to be granted. • The economic proposition of shale gas holds relevance for the public sector and society at
large. • The economic viability of shale gas could be assisted by the regulated domestic price of gas or
international benchmark prices determined by the global market.• Wellhead economics are key to the economic sustainability of shale-gas extraction.
This paper seeks to reflect on a number of contending issues related to shale-gas development and economics in South Africa. This is WWF South Africa’s first high-level assessment of the issue.
1.1 GAS IN THE GLOBAL ENERGY MIXBecause many countries have used most of their coal reserves, gas is a serious consideration as a
means to diversify energy supply. In addition, considerations of cost, environmental externalities
and energy security would weigh heavily on the minds of energy planners. It is fair to say the world is
certainly transitioning to a more diverse energy mix, though it is probably still too early to say which
is going to be the dominant source in the future. Gas, though, will play an influential role.
Global use of coal is subject to increasing constraints and this is one of the reasons why gas is being
looked at more seriously. World supply of gas is primarily from conventional sources. In the last
decade, increased supplies of gas from unconventional sources have been forthcoming from shale
gas, tight gas and coal bed methane (CBM) following the shale-gas boom in the US and exploitation
of CBM sources in Australia. Unconventional sources of oil and gas are reliant on reasonable or high
enough oil and gas prices to ensure economic viability. Interest in gas exploitation in South Africa
follows growing interest globally. Gas demand is expected to double within the next two decades.
1.2 THE FIVE KEY DRIVERS OF SHALE-GAS ECONOMICSBased on our current knowledge and assessment, we argue that shale-gas extraction has, at best,
marginal economics and that its commercial success is largely dependent on five key drivers: 1) rate
of technology learning and efficiencies, 2) good knowledge and understanding of the geology, 3) a
high enough price for gas or oil and other incentives, 4) the timing and scaling of drilling intensity,
and 5) the cost of mitigating the externalities for both the short and long-term.
7
All five of these drivers are at the core of the economic and financial viability of shale-gas production
and, despite the hype, are sensitive to various conditions. Whether or not one is in favour of fracking
for shale gas, the drivers remain the cornerstone of the economics and any one of these factors can
throw out the economic viability.
It will be useful, in future, to compare the US experience with that of other countries and assess
how these five factors exert an influence on the commercial viability of shale gas in these countries.
As we will show later, some preliminary work in other countries – which we have yet to study
extensively – shows that it can be difficult to make the economics work when you consider all
the factors that have to be taken into account and the degree of inconsistency and variability in
performance they can throw up.
As far as externality costs are concerned, our primary focus will be on in-field or production
externalities and reclamation costs. In other words, they will be confined to the development
and production aspects of shale gas. Some externalities may be unknown in terms of their
nature, frequency, risk characteristic and future mitigation costs. As our knowledge grows, such
externalities will have to be factored into the production cost of shale gas. This report will not go
into the draft regulations for hydraulic fracturing currently being developed by the Department of
Mineral Resources. The Department of Mineral Resources has released draft technical regulations
on oil and gas exploration and production, including shale gas and hydraulic fracturing. The draft
regulations were gazetted on 15 October 2013. In addition, in August 2013, the Department of Water
Affairs (DWA) declared fracking a controlled activity in terms of the National Water Act, requiring
the approval of a water use license for this activity. Detailed regulations are still be developed and
released for comment.
1.3 DEVELOPMENT OF SOUTH AFRICAN SHALE GASSouth African shale gas resource estimates are placed at around 485 trillion cubic feet (Tcf) while the
economically recoverable reserve is yet to be determined. Exploration rights are still to be granted
even though a government moratorium has been lifted. Exploration for shale gas in South Africa is
only likely after drilling, water and minerals regulations have been finalised.
Much of our analysis has been dependent on knowledge and experience from the US. As a result, we
do not know the true economic potential, the well head costs, nor whether the Karoo geology will
yield any long term sustainable product. While the information gaps are significant, the domestic
knowledge base is growing in leaps and bounds.
1.4 IS A SHALE GAS INDUSTRY VIABLE IN SOUTH AFRICA?We seek to address the question of whether wellhead prices will be competitive by constructing a
base economic framework for how to assess the economics of wellhead costs, the implications on
the pricing of shale gas for the domestic market, and the domestication and beneficiation from gas
usage. We thereby develop a collage of potential environmental externalities and explore whether
these can be mitigated by building these costs in the drilling and production phase of shale gas. We
further consider long-term externalities where costs are difficult to predict but can be dealt with
through various interventions.
8
While it is true that private developers should be left to decide the economic proposition of shale gas,
extractives are not only about private investment and the associated risks to investors.
They also hold relevance for the public sector and society at large. From the perspective of the public
sector, an understanding of the economics of shale gas not only influences appropriate fiscal policies
and regimes, but also helps to clarify whether the exploitation of the resource justifies other public
spend and incentives to make shale-gas extraction a viable proposition. A more sober assessment of
the resource potential is essential, not only to allow for a more robust debate, but also to inform the
extent to which public funds should be allocated towards the development of the resource.
Secondly, the economic viability of the production cycle of shale gas could be determined by the
regulated domestic price for gas. To arrive at such a price, the wellhead economics need to be
understood and made transparent. These costs should be inclusive of environmental mitigation
costs. At present there is an information asymmetry. Multinational corporations vying for
shale-gas plays in South Africa enjoy an information and knowledge advantage that is already
influencing not only the nature of the debate, but could in future influence the framing of fiscal
policy and how environmental externalities are dealt with going forward. Asymmetries can only be
resolved through better information and transparency.
Better understanding of the make up of welhead costs begins to level the knowledge playing field.
Greater understanding of the issues enables different decision pathways to be thought through more
carefully when considering whether to exploit a resource, the timing of the exploitation and the pace
at which it should be exploited.
A vast resource can be both a bane and a boon for the domestic economy. Beneficiation pathways
are not only determined by gas prices, but also by the longevity of the production process and the
size of the resource. The scale and thresholds of the externality impacts give a measure of the benefit
and costs so that trade-offs can facilitate prudent choices while decisions are facilitated by sound
grounding of the science and economics. In the end, those with a personal incentive to extract make
their case on the promise of jobs and benefits to the economy. All claims in this regard must be
properly evaluated1 as claims of jobs and benefits are meaningless in the absence of proper context
to establish their veracity and the capacity to deliver these outcomes in reality.
We believe the wellhead economics are key to the economic sustainability of shale-gas extraction and
the use of gas in the broader economy. We believe a grasp of this provides for a better assessment of
downstream benefits and puts more realism to claims being made about economic spin-offs. The US
example is used widely. These are the only shale-gas plays we can draw on for real life experience.
The explosive growth in academic and grey literature only testifies to the hunger for understanding
given that the commercial production of shale gas dates back to 20042. An understanding of the
performance of the shale-gas industry is only growing as more experts analyse the experience in
field. We draw on some of these experiences to pull lessons for South Africa. Our study is based on
several interviews along with a review of academic and non-academic literature.
9
2. A BRIEF HISTORY OF SHALE GAS IN THE US
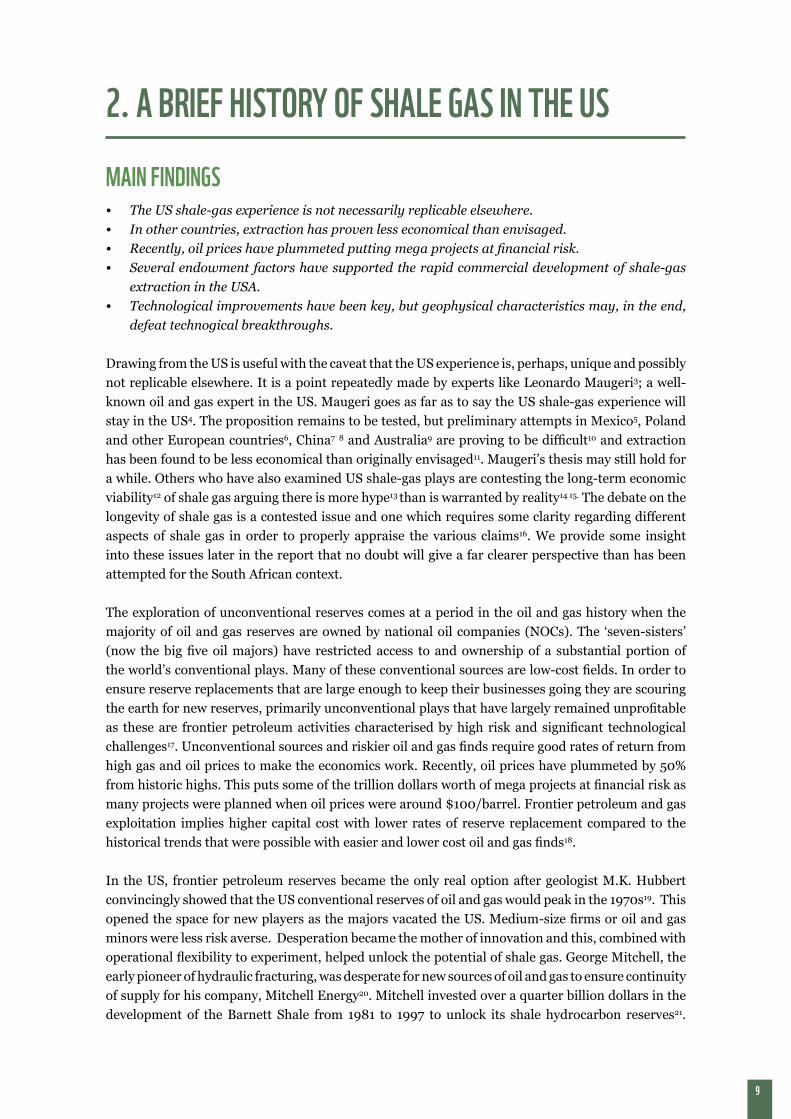
MAIN FINDINGS• The US shale-gas experience is not necessarily replicable elsewhere.• In other countries, extraction has proven less economical than envisaged. • Recently, oil prices have plummeted putting mega projects at financial risk. • Several endowment factors have supported the rapid commercial development of shale-gas
extraction in the USA.• Technological improvements have been key, but geophysical characteristics may, in the end,
defeat technogical breakthroughs.
Drawing from the US is useful with the caveat that the US experience is, perhaps, unique and possibly not replicable elsewhere. It is a point repeatedly made by experts like Leonardo Maugeri3; a well-known oil and gas expert in the US. Maugeri goes as far as to say the US shale-gas experience will stay in the US4. The proposition remains to be tested, but preliminary attempts in Mexico5, Poland and other European countries6, China7 8 and Australia9 are proving to be difficult10 and extraction has been found to be less economical than originally envisaged11. Maugeri’s thesis may still hold for a while. Others who have also examined US shale-gas plays are contesting the long-term economic viability12 of shale gas arguing there is more hype13 than is warranted by reality14 15. The debate on the longevity of shale gas is a contested issue and one which requires some clarity regarding different aspects of shale gas in order to properly appraise the various claims16. We provide some insight into these issues later in the report that no doubt will give a far clearer perspective than has been attempted for the South African context.
The exploration of unconventional reserves comes at a period in the oil and gas history when the majority of oil and gas reserves are owned by national oil companies (NOCs). The ‘seven-sisters’ (now the big five oil majors) have restricted access to and ownership of a substantial portion of the world’s conventional plays. Many of these conventional sources are low-cost fields. In order to ensure reserve replacements that are large enough to keep their businesses going they are scouring the earth for new reserves, primarily unconventional plays that have largely remained unprofitable as these are frontier petroleum activities characterised by high risk and significant technological challenges17. Unconventional sources and riskier oil and gas finds require good rates of return from high gas and oil prices to make the economics work. Recently, oil prices have plummeted by 50% from historic highs. This puts some of the trillion dollars worth of mega projects at financial risk as many projects were planned when oil prices were around $100/barrel. Frontier petroleum and gas exploitation implies higher capital cost with lower rates of reserve replacement compared to the historical trends that were possible with easier and lower cost oil and gas finds18.
In the US, frontier petroleum reserves became the only real option after geologist M.K. Hubbert convincingly showed that the US conventional reserves of oil and gas would peak in the 1970s19. This opened the space for new players as the majors vacated the US. Medium-size firms or oil and gas minors were less risk averse. Desperation became the mother of innovation and this, combined with operational flexibility to experiment, helped unlock the potential of shale gas. George Mitchell, the early pioneer of hydraulic fracturing, was desperate for new sources of oil and gas to ensure continuity of supply for his company, Mitchell Energy20. Mitchell invested over a quarter billion dollars in the development of the Barnett Shale from 1981 to 1997 to unlock its shale hydrocarbon reserves21.
10
Mitchell was able to take advantage of existing geological knowledge from conventional plays to exploit hydrocarbons from sources beneath these conventional fields. The early exploratory work by Mitchell was able to capitalise on favourable geology and sound knowledge.22
There are several in-country endowment factors that have supported the rapid commercial development of shale-gas extraction in the USA in the context of an already well-developed and mature oil and gas industry23:
1. Technological innovation and learning spill-overs are a product of US entrepreneurs and were largely developed by minors who were willing to take some big bets and conduct rapid in-field innovations. Once these were accomplished, the spread of knowledge and innovation was rapid due to the geographic proximity of players in the industry;
2. The US has a well-developed oil and gas industry with certain long settled capabilities, specialised drilling, well-engineering and, to a great degree, a good knowledge of the geology and resource base;
3. The dominant service and original equipment manufacturing (OEMs) companies, just to mention a few, are Halliburton, KBR, Schlumberger and Baker-Hughes. The ability to secure cheap commoditised services and equipment is crucial to the commercial development of shale-gas;
4. The mineral rights are in the ownership of private land holders, unlike other countries where land is owned by the State. Land owners themselves may be desperate for extra income sources, particularly in farming areas, and readily sign up to leases or other types of land-deals. Private ownership has allowed large acreage across various US plays to be brought rapidly into production;
5. The US has an extensive pipeline and gas storage infrastructure in many of the plays, this includes midstream and downstream parts of the gas value chain;
6. The US has a well-developed gas use market in which wellhead gas prices are deregulated at the producers’ end through the Henry Hub24 (which has its advantages25 and disadvantages26) allowing for easy clearance of gas and trade in gas;
7. The majority of horizontal drilling rigs in the US are concentrated in shale plays;8. The US has a well-developed financial sector which is used to dealing with the oil and gas
industry. A number of financial products and innovations cater for various financial needs of the oil and gas industry in different parts of the value chain.
Maugeri and others argue that the absence of these endowments in other countries interested in shale exploitation will lead to higher cost structures in the full exploitation of shale gas or oil resources as established endowments lower the cost of frontier oil and gas reserves exploitation if they are simply an extension of the existing system27. Countries that take a strategic view on long term energy security may not judge the investment in shale gas on pure commercial terms and returns, but also in terms of sovereign risk and energy independence. China is the most likely candidate for such a policy position and could, in the long term, exploit its shale-gas reserves even though it struggles to do so at present.
11
3. SHALE-GAS GEOLOGY AND THE ROLE OF WATER
MAIN FINDINGS• Early formation of gas and oil occurs within layers of impermeable and laminated shale rock.• Shale gas is termed an unconventional resource in reference to the methods required to extract
it.• Thermogenesis yields various by-products from the conversion of organic material.• Shale-play sites that contain high total organic content are likely to produce high yields of oil
and gas. • Wellhead design and fracturing is both a science and an art. • Water has proven to be the best medium for frack fluid chemistry.• The use of fresh water in hydraulic fracturing may compete with other uses.• Recycling and reuse of water depends on the chemical composition of water as the removal of
these determine cost of treatment. • The danger of ground water contamination exists and can be mitigated through the creation
of buffer zones or by restricting drilling in sensitive areas.
3.1 THE ORIGIN OF SHALE GASPerhaps the best way to describe the geology of shale is by way of reference to its place of origin through geological time as the source rock for oil and gas. The early formation of gas and oil takes place within these compacted layers of impermeable and laminated shale rock. As one expert puts it more technically, shale is “made of up of clay size weathering debris, shale formations are fine-grained, laminated clastic sedimentary rocks that are soft and fissile. Typically, they have a thickness of 50-600 ft, porosities between 2-8%, permeabilities 10-100 nano darcy28, organic content of 1-14%. They are encountered at depths ranging from 1000-13000 feet”29. In other words, the rock is so compact with pore sizes so small that trapped gas would only be able to escape by fracturing the rock.
Millions of years ago, large masses of organic material (whether plant, woody mass, marine life, animals or algae) were buried deep within the earth’s surface. This organic material was compacted and subjected to various stresses – mainly heat and pressure. Figure 1 depicts the distinction between conventional and unconventional sources.
3.2 CONVENTIONAL VERSUS UNCONVENTIONAL RESERVESOil and gas seep from the source rock and move towards the surface until they pool and get trapped by other types of impermeable rock barriers, such as salt domes which then act as a natural seal and result in a reservoir which is usually closer to the surface and easily accessed. This is the source for conventional reserves of oil and gas.
Unlike conventional pools of oil and natural gas, unconventional oil and natural gas are far more difficult to extract. The term “unconventional” simply refers to the methods that are used to access these resources, as well as the types of rock from which the oil and natural gas are produced.
12
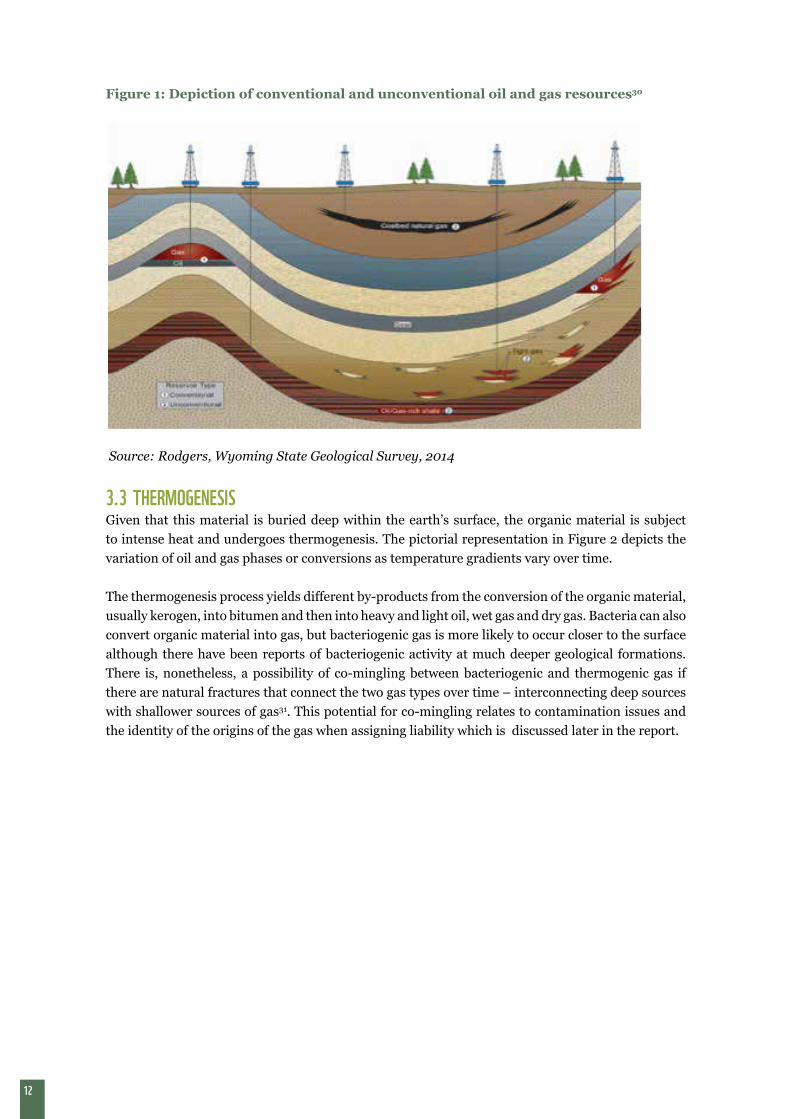
Figure 1: Depiction of conventional and unconventional oil and gas resources30
Source: Rodgers, Wyoming State Geological Survey, 2014
3.3 THERMOGENESISGiven that this material is buried deep within the earth’s surface, the organic material is subject to intense heat and undergoes thermogenesis. The pictorial representation in Figure 2 depicts the variation of oil and gas phases or conversions as temperature gradients vary over time.
The thermogenesis process yields different by-products from the conversion of the organic material, usually kerogen, into bitumen and then into heavy and light oil, wet gas and dry gas. Bacteria can also convert organic material into gas, but bacteriogenic gas is more likely to occur closer to the surface although there have been reports of bacteriogenic activity at much deeper geological formations. There is, nonetheless, a possibility of co-mingling between bacteriogenic and thermogenic gas if there are natural fractures that connect the two gas types over time – interconnecting deep sources with shallower sources of gas31. This potential for co-mingling relates to contamination issues and the identity of the origins of the gas when assigning liability which is discussed later in the report.
13
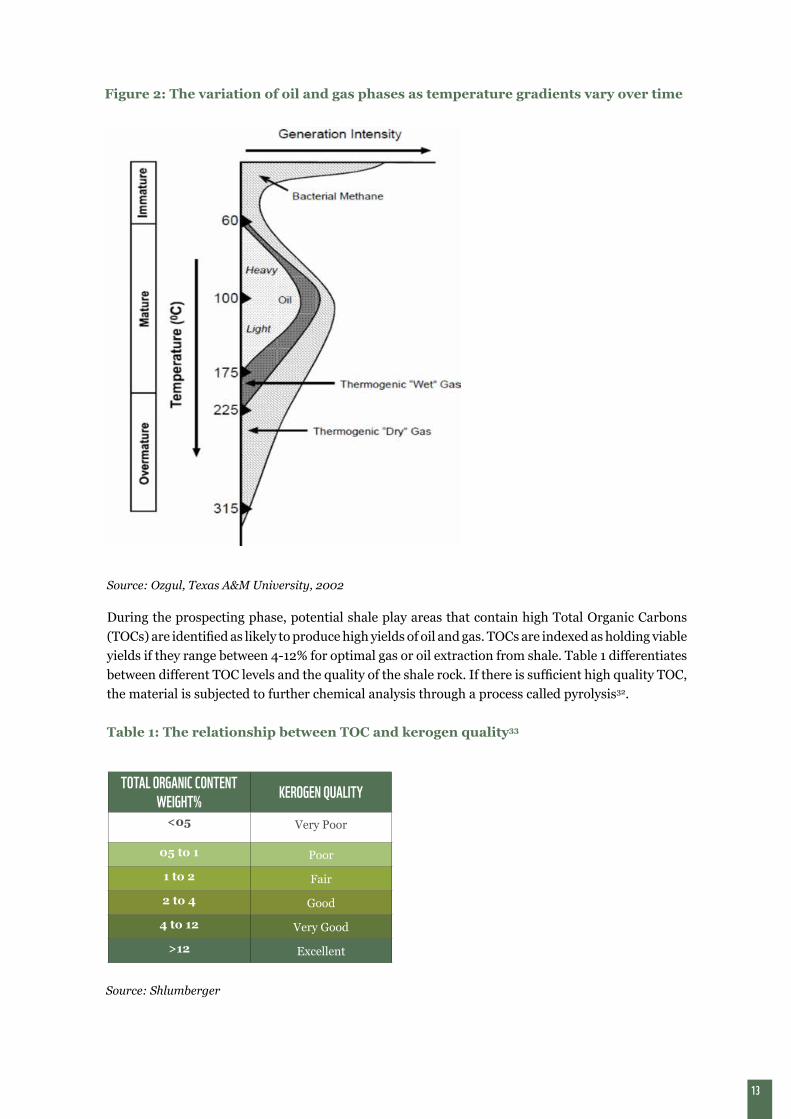
Figure 2: The variation of oil and gas phases as temperature gradients vary over time
Source: Ozgul, Texas A&M University, 2002
During the prospecting phase, potential shale play areas that contain high Total Organic Carbons (TOCs) are identified as likely to produce high yields of oil and gas. TOCs are indexed as holding viable yields if they range between 4-12% for optimal gas or oil extraction from shale. Table 1 differentiates between different TOC levels and the quality of the shale rock. If there is sufficient high quality TOC, the material is subjected to further chemical analysis through a process called pyrolysis32.
Table 1: The relationship between TOC and kerogen quality33
TOTAL ORGANIC CONTENT WEIGHT% KEROGEN QUALITY
<05 Very Poor
05 to 1 Poor
1 to 2 Fair
2 to 4 Good
4 to 12 Very Good
>12 Excellent
Source: Shlumberger
14
It is important to note that the presence of high TOC shale from early drilling results is not an indication of economically recoverable gas. It is merely a pointer of the potential for high gas-in-place (GIP). TOCs can be tested for their oil-to-gas ratio windows based on the measured readings of vitrinite reflectance34 indicating their level of maturity. The Karoo is expected to have fully matured thermogenesis in the most promising areas. Although insufficient drilling has taken place to be definitive, the presence of doleritic intrusions and other features seems to support the assumption that the Karoo will primarily consist of dry-gas plays or the gas has been over-cooked and the gas expelled from the shale over time. In the US, various shale plays have pure oil, dry gas and/or wet gas35 windows (wet gas is a mixture of methane gas and heavier hydrocarbons like butane and propane). For instance, the Marcellus play, which is a vast resource, has both dry- and wet gas windows where the west is primarily wet gas and eastern sections of the Marcellus segments contain methane rich dry gas.
In addition to the consideration of TOC and vitrinite readings, further determinations for successful gas extraction would include the minerology of the shale formation. In other words, what is the ability of the rock to fracture under high pressure and, in so doing, yield high gas or oil production rates. This depends on the levels of permeability that can be artificially created through fracking36. The key is to ensure a high degree of connectivity between natural and artificial fractures so that the permeability for gas transmission through the channels into gas outlets, such as the wellbore, can be improved37. Porosity is influenced by rock structure and the degree to which the shale rock is itself saturated with formation water38. High water saturation can impede permeability and gas flow39. Even after fracking, the pores and fractures should stay intact to allow for gas and oil to flow when production commences.
It seems that wellhead design and fracturing is both a science and an art. The mineral mix of the shale formation, the proportion of clay, silicate or carbonate and quartzite, will influence the type of frack technique and chemical mixture required.
3.4 FRACK FLUIDS AND THE ROLE OF WATERFracking has to take place under high pressure with high volumes (to date) of frack fluids to succeed. Water has proven to be the best medium for frack fluid40 chemistry and its high volume low viscosity properties allow for various manipulations tailored in relation to its interaction with the rock to be fractured. While alternatives to water (such as Liquid Petroleum Gas (LPG) or concentrate and the use of enhanced carbon dioxide techniques) have had some application on a trial basis, mainly in Texas, such trials have not been at a commercial scale that would warrant commercial application at this point in time41. At present, a Canadian company is the only company that is developing LPG as an alternative. If LPG gains wider use in this sense, special legislation would be necessary to deal with potential gas emissions and flammability issues as well as liability cover in the case of accidental explosions42.
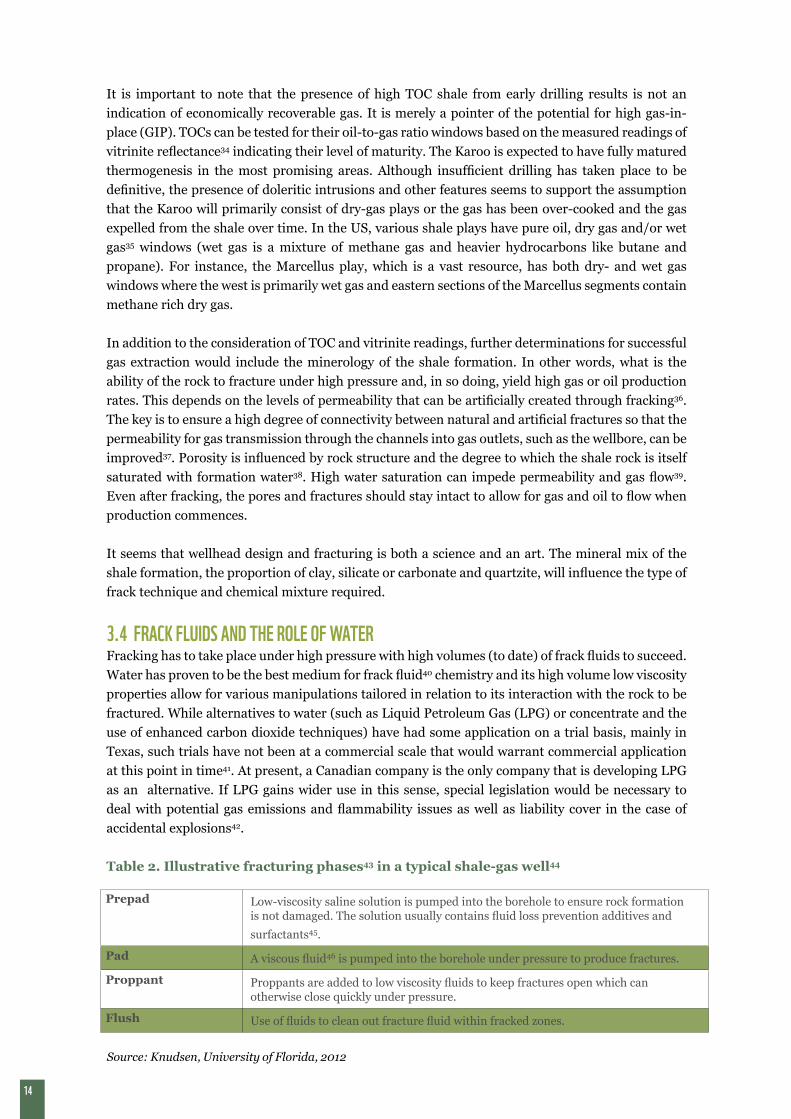
Table 2. Illustrative fracturing phases43 in a typical shale-gas well44
Prepad Low-viscosity saline solution is pumped into the borehole to ensure rock formation is not damaged. The solution usually contains fluid loss prevention additives and
surfactants45.
Pad A viscous fluid46 is pumped into the borehole under pressure to produce fractures.
Proppant Proppants are added to low viscosity fluids to keep fractures open which can otherwise close quickly under pressure.
Flush Use of fluids to clean out fracture fluid within fracked zones.
Source: Knudsen, University of Florida, 2012
15
Water remains a cost-effective fluid and so most wells make use of water as the major medium for the creation of artificial fractures and well stimulation. Table 2 illustrates the shale gas fracking preparation phases. The viscosity of water47 can be modified using gels sourced from guar48, as a case in point, so that the higher viscosity facilitates the transport of high concentrations of proppant into the fractures where the artificial fractures have been created. This is usually applied under conditions where the shale rock brittleness factor is low and the clay content of the rock is high. The proppants, which can be sand or, in some cases, walnut shell resins (other types of materials such as ceramics are also being tested), enable the artificial fractures to be kept open after the cracks have been created.
The issue of water is an important concern if water continues to be the preferred frack fluid49. The volume of water required depends on the nature of the frack that has to be performed. This could have material consequences in localised conditions where fresh water is used that could compete with other uses, although nationally the effects of water consumption for fracking are not significant50. That said, South Africa is a water-stressed country, and so caution must be taken in terms of how we deal with water allocation for industries or activities that will, over time, require more water as more wells are drilled. The problem with the use of potable water is that invariably a quantity of it is permanently lost and what is returned as flowback and produced water (essentially fracking wastewater) is a mixture of the originally pumped fresh water (which is now contaminated) and formation water (water rich in brine from the targeted shale gas-rich rock). The amount of water that returns to the surface varies greatly across and even within shale plays, with most figures indicating that between 15-80%51 of the water is returned. Water that is not recycled or reused will incur an opportunity cost, especially in the local context where water may be in high demand. This is something which warrants a more detailed examination in future studies. It is necessary, in any case, to consider a total cost model for the acquisition of water in terms of transport, disposal, reuse/recycle and the opportunity cost.
Technical measures can be required to deal with shale-gas wastewater and should be standard practice with operators. The recycling of flowback and produced water or various types of brine52 is one option, which is increasingly being used in the US53. Depending on the characteristics of the brine, processing technologies to treat it for reuse can be expensive54. Early essential work in considering the development of recycling is to investigate the various types of brines generated from shale-gas extraction, their chemical composition and the water treatment technologies required to treat water to acceptable levels for reuse or to be returned to the system.
In the US it has been cheaper to dispose of flowback water and produced water in injection wells, but the recycling and reuse of water is increasingly becoming an option due to economic reality (as it is costly to truck and dispose of water), political pressures and environmental concerns55. Reusing frack fluids will require new technology innovations56. If fracking happens in the Karoo, recycling and reuse of water would be the only option. The reuse of flowback or produced water depends on treatment options available for the given level and type of chemical contamination as, in order for its reuse to be feasible, the after-treatment quality has to be ideal for the various chemical mixtures that go into the fracking fluid. Experience has shown that fracking fluid chemistry is a combination of chemicals that involves a recipe for each different type of geophysical characteristic of shale rock and to create the capacity to carry the proppant down the borehole whilst reducing the friction felt in the borehole as the frack proceeds.
The danger of ground water contamination depends on whether high standards are being adhered to for drilling of the borehole, installing the well-casings and cementing them in place. Minimising risk requires that best practice is followed when implementing standards to protect ground water and surface water resources.

16
The possibility of contamination increases if shale wells are close to either natural fractures or ground water sources. This could possibly be mitigated through the creation of buffer zones or by restricting drilling to shale plays well below 1500m or a distance from ground water sources. In the Karoo, the creation of a buffer and well-spacing regime will most likely narrow the area of the resource base that can be exploited57. All of these factors will play a role in economics of shale gas drilling and development.
The key to unlocking the gas from shale is to make the impermeable geology yield to engineering and technology and this is where unconventional wells differ from conventional wells. Unconventional wells require far more effort to unlock as much of the GIP58 as possible as detailed in Table 3.
Table 3: Summary of Some the Key Factors for Successful Fracking59 60
• Minimum GIP should be around three cubic metres/ton with water saturation lower than 40%;
• The GIP is also influenced by other factors: high temperature and low TOCs (2.9%) will have minor contribution from adsorbed gas while low temperatures with high TOCs (5-6%) will have higher fracktion of adsorbed gas. In some cases of extremely high temperatures there have been wells with no adsorbed gas61;
• Plays with higher adsorbed gas will have a flatter decline curve than plays with little adsorbed gas;
• The higher the pressure, the better the frack outcome;
• Brittle shale is more conducive to large volume, high rate water treatments in what is called slick water use62;
• It is key to develop a complex network of fractures with high potential for gas flow63;
• Large treatment leads to large fractures64;
• Smaller proppant65 particles are preferable as they tend to go deeper into the fractures;
• Brittle shale is mostly fractured with water as water is the least viscous and less brittle shale is fracked with high-viscosity fluids which have higher concentrations of polymer and gelling agents which enable them to carry the proppant66 to the fracture zones;
• A Brittle Index67 of more than 40% is desirable. By way of example, it was found that the Barnett Shale was more brittle when it was rich in silica and low in clay68;
• Permeability for shale rock, because it is so fine grained and compact, is measured in milli- and nano-Darcy ranges69;
• Pressure gradients of 0.5 Psi and above are ideal for high success rates in the creation of fractures;
• Temperature and pressures change as fluids or gases are brought to the surface;
• The quality of the oil and gas is also important as they may contain many impurities such as nitrogen, carbon dioxide and hydrogen sulphide which will have to be removed and so add to the cost of extraction.
17
4. THE ECONOMICS OF SHALE GAS
MAIN FINDINGS• The economics depend on how much gas can actually be recovered versus gas-in-place
estimates against sunk capital cost. • Total recovery depends on technology, well design, fracture creation and geology. • Shale decline curves depict high decline rates in the first two to three years of production
followed by leveling off. • Initial production (IP) and decline rates determine economic limit and profitability.• Deriving realistic production figures and economic limits is encumbered by limited drilling
history and production data. • The industry tendency is to give optimistic expectations.• Only after an extended drilling and completion programme can the true potential of the
shale-gas play be determined. • Shale-gas wells are high cost, low producing wells that require drilling in large numbers to
commoditise the gas.
4.1 RECOVERY AND LEARNING The economics of shale-gas extraction is also dependent on how much gas can actually be recovered compared to the GIP estimates70. The total recovery rate is a function of the technology used, well design, fracture creation and geology. The importance of making mention of this is to illustrate that TOC levels are one part of the story, but the use of a combination of techniques and geological knowledge to create a successful well is a function of experience. Reserve estimates are based on methodologies that are able to assess the total Stimulated Reservoir Volume (SRV)71. Learning rate dynamics will influence not only technology application, but also the levels at which in-field discovery and production costs are reduced over time.
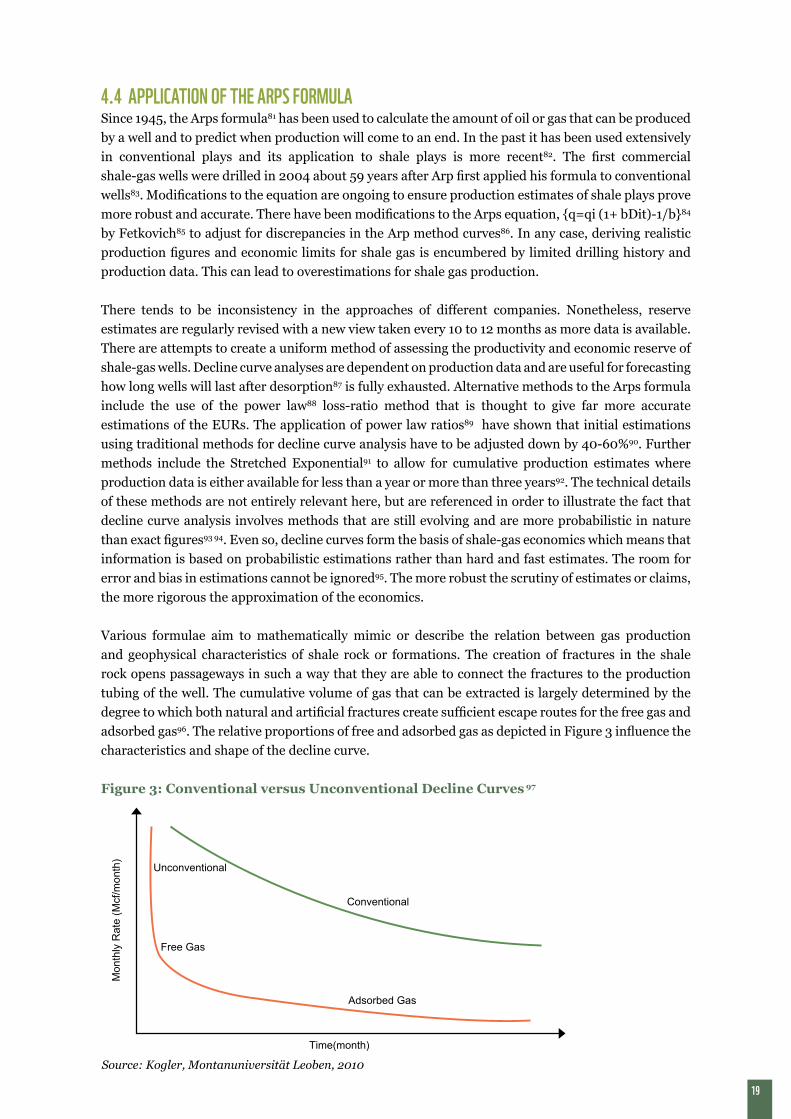
4.2 DECLINE RATESIn recent years, various experts have examined the data from producing wells in different US plays72 73. The general pattern of well production performance for shale-gas wells is now fairly well known74 75. In Figure 3, the decline curves depict high decline rates76 in the first two to three years of production77 and then each year levels off as more gas is extracted from completed wells78. However, these decline rates are much more aggressive than in conventional wells. Shale-gas wells differ from conventional wells in that the initial production decline is steep and then gradual as shown79 in Figure 3. This makes sense considering the geology of shale as described above.
The curve (Figure 3) corresponds generally to the geophysical and pretrophysical characteristics of the wells when the gas production profile moves from free gas to adsorbed gas states. This is when production dominated by fractures moves to production dominated by the rock matrix. The volume of shale gas that can be produced over time for a specific well is defined as the Estimated Ultimate Recovery (EUR) which is usually measured in billion cubic feet (Bcf). Daily production estimates are given in million cubic feet (Mcf).
18
4.3 METHODS FOR DECLINE RATES ANALYSISShale-gas well IP and decline rates determine their economic limit and profitability. EUR estimations are important to both investors and regulators as they need to be given a view of future well behaviour which is as accurate as possible. Investors need to know they are not investing in unproductive wells or wells that will show lower revenue due to wrong or over-optimistic estimates.
Shale-gas production estimates are usually calculated in an aggregate or field basis. Within the field, individual wells will have different production characteristics, with some wells producing more than others. In shale-gas economics, it is not a single well that matters, but rather the average volume of gas that can be produced by a group of wells. On average, field decline rates are lower than decline rates for individual wells. Field decline rates are dependent on:
• Decline rates of individual wells;• Total number of wells in the field;• Period of time over which older wells were added;• Rate at which new wells are added reduces as field production rates begin to decline80 as the
already drilled wells age
The amount one can drill depends not only on the size of land that is available, but also on the ease with which the geology can be made to work, and the number of rigs that can be deployed. Field decline rates can accelerate if drilling rates are not kept up in what is sometimes referred to as the drilling treadmill. The more you drill, the more you have to lay out capital and each well, in turn, remains uncertain with respect to its EURs and initial production.
Every well drilled is a lottery – it may produce a lucky draw, a poor draw or a dud draw meaning that shale-gas drilling and economics remain a continual challenge to the industry given the uncertainty of the production rates and life times of individual wells. More crucially, the more wells you have to drill at a faster pace, the greater the danger of accidental events, contamination from polluted water and methane leaks. Hence, vigilance has to be maintained when it comes to health, safety and environment standards.
Within a given play or field, wells are tiered based on their gas production EURs. The industry classification system for wells is arranged according to P10, P50, and P90 ranges. These are determined by estimating the gas production rates based on the estimated production decline curve for a well. P10 wells are the most productive and long lasting and P90 wells are the least productive with shorter life-spans. The tiering system also determines which wells will be exploited first depending on the price of gas. The combination of P10 and P50 wells will lead to a strategy which optimises the production rates or average yield for the whole shale-gas play when gas prices are reasonable or high. The exploitation of ‘sweet-spots’ earlier in the field production schedule will tend to give higher earlier average production rates (measured in MCf/day), but as operators move to less productive areas these wells will have lower IPs and overall lower production rates. Optimising early drilling of ‘sweet-spots’ also increases cash-flow and working capital that allows for more wells to be drilled in a field in that poorer wells can be drilled later in the development of the field when gas prices are predicted to be higher. Production rates can be improved by opening newer wells with better learning, the optimisation of techniques and expanding the intensity of extraction by reaching a greater surface area.
The calculation of decline rates using mathematical formulae and geological assumptions can give real or exaggerated gas production. The determination of these values is far from a perfect science and the science of decline curve estimates for shale continues to improve led by industry’s need for better estimates and enabled by more wells with longer production histories that allow better analysis.
19
4.4 APPLICATION OF THE ARPS FORMULASince 1945, the Arps formula81 has been used to calculate the amount of oil or gas that can be produced by a well and to predict when production will come to an end. In the past it has been used extensively in conventional plays and its application to shale plays is more recent82. The first commercial shale-gas wells were drilled in 2004 about 59 years after Arp first applied his formula to conventional wells83. Modifications to the equation are ongoing to ensure production estimates of shale plays prove more robust and accurate. There have been modifications to the Arps equation, {q=qi (1+ bDit)-1/b}84
by Fetkovich85 to adjust for discrepancies in the Arp method curves86. In any case, deriving realistic production figures and economic limits for shale gas is encumbered by limited drilling history and production data. This can lead to overestimations for shale gas production.
There tends to be inconsistency in the approaches of different companies. Nonetheless, reserve estimates are regularly revised with a new view taken every 10 to 12 months as more data is available. There are attempts to create a uniform method of assessing the productivity and economic reserve of shale-gas wells. Decline curve analyses are dependent on production data and are useful for forecasting how long wells will last after desorption87 is fully exhausted. Alternative methods to the Arps formula include the use of the power law88 loss-ratio method that is thought to give far more accurate estimations of the EURs. The application of power law ratios89 have shown that initial estimations using traditional methods for decline curve analysis have to be adjusted down by 40-60%90. Further methods include the Stretched Exponential91 to allow for cumulative production estimates where production data is either available for less than a year or more than three years92. The technical details of these methods are not entirely relevant here, but are referenced in order to illustrate the fact that decline curve analysis involves methods that are still evolving and are more probabilistic in nature than exact figures93 94. Even so, decline curves form the basis of shale-gas economics which means that information is based on probabilistic estimations rather than hard and fast estimates. The room for error and bias in estimations cannot be ignored95. The more robust the scrutiny of estimates or claims, the more rigorous the approximation of the economics.
Various formulae aim to mathematically mimic or describe the relation between gas production and geophysical characteristics of shale rock or formations. The creation of fractures in the shale rock opens passageways in such a way that they are able to connect the fractures to the production tubing of the well. The cumulative volume of gas that can be extracted is largely determined by the degree to which both natural and artificial fractures create sufficient escape routes for the free gas and adsorbed gas96. The relative proportions of free and adsorbed gas as depicted in Figure 3 influence the characteristics and shape of the decline curve.
Figure 3: Conventional versus Unconventional Decline Curves 97
Mon
thly
Rat
e (M
cf/m
onth
)
Time(month)
Free Gas
Adsorbed Gas
Conventional
Unconventional
Source: Kogler, Montanuniversität Leoben, 2010
20
Adsorbed gas is what exists in the rock matrix and flows at the tail end of the curve or well-life. Because it is attached to organic matter or clay, it is harder to extract as it requires depressurisation to occur as part of a desorption process. As McGlade et al note: “Higher rates of production decline lead to a shorter production experience, it is difficult to know whether production will continue to decline at the same rate or whether the rate of decline will slow in the future”98.
Initial Production (IP) normally varies for every well. The IP rate is a function of maximum (early) production rate per well after well completion, while the decline curve provides an estimate of how fast a well is depleted and how long it will last. Decline curves can be further adjusted based on estimates the engineer attaches to how much of the adsorbed gas can be released as a result of depressurisation.
Significant amounts of gas can exist in an adsorbed state on the organic kerogen and clay depending on temperature and pressure (or the adsorption isotherm)99. The importance of maintaining a pressure gradient must not be underestimated as Kaiser notes: “A reservoir is pressurised because of its depth, trap characteristics, geologic properties, and other factors. When a well is drilled into a reservoir, the reservoir pressure is an important determinant of the potential flow rate. As oil (or gas) is produced, the reservoir pressure decreases, leading to a drop in driving force and oil production” 100.
IP is crucial as it generates high initial revenue and determines whether the payback period is shorter or longer for each well that is drilled101. The key challenge in shale formations is the high variance of IP in unconventional plays. Break-even costs are heavily influenced by estimations of IP, the decline rate and the life-span to the economic limit of a well.
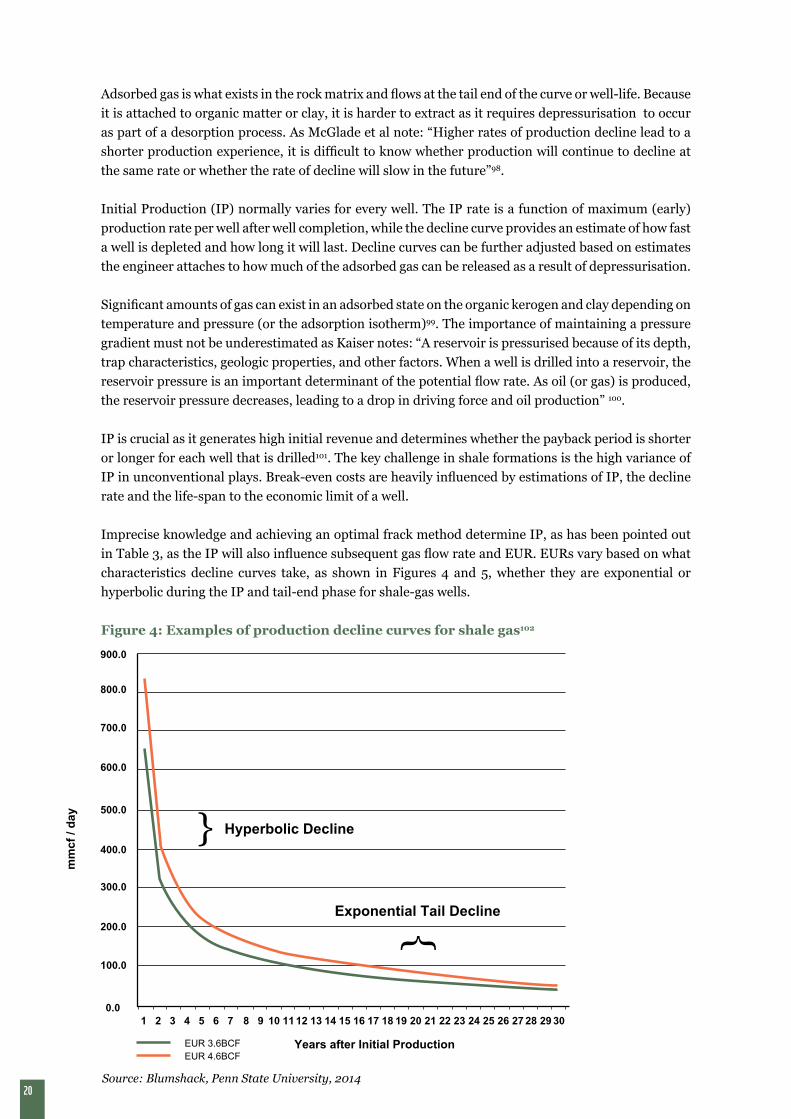
Imprecise knowledge and achieving an optimal frack method determine IP, as has been pointed out in Table 3, as the IP will also influence subsequent gas flow rate and EUR. EURs vary based on what characteristics decline curves take, as shown in Figures 4 and 5, whether they are exponential or hyperbolic during the IP and tail-end phase for shale-gas wells.
Figure 4: Examples of production decline curves for shale gas102
900.0
800.0
600.0
700.0
500.0
400.0
300.0
200.0
100.0
mm
cf /
day
Years after Initial ProductionEUR 3.6BCFEUR 4.6BCF
0.01 2 3 4 5 6 7 8 9 10 11 12 13 14 15 16 17 18 19 20 21 22 23 24 25 26 27 28 29 30
}
}
Hyperbolic Decline
Exponential Tail Decline
Source: Blumshack, Penn State University, 2014
21
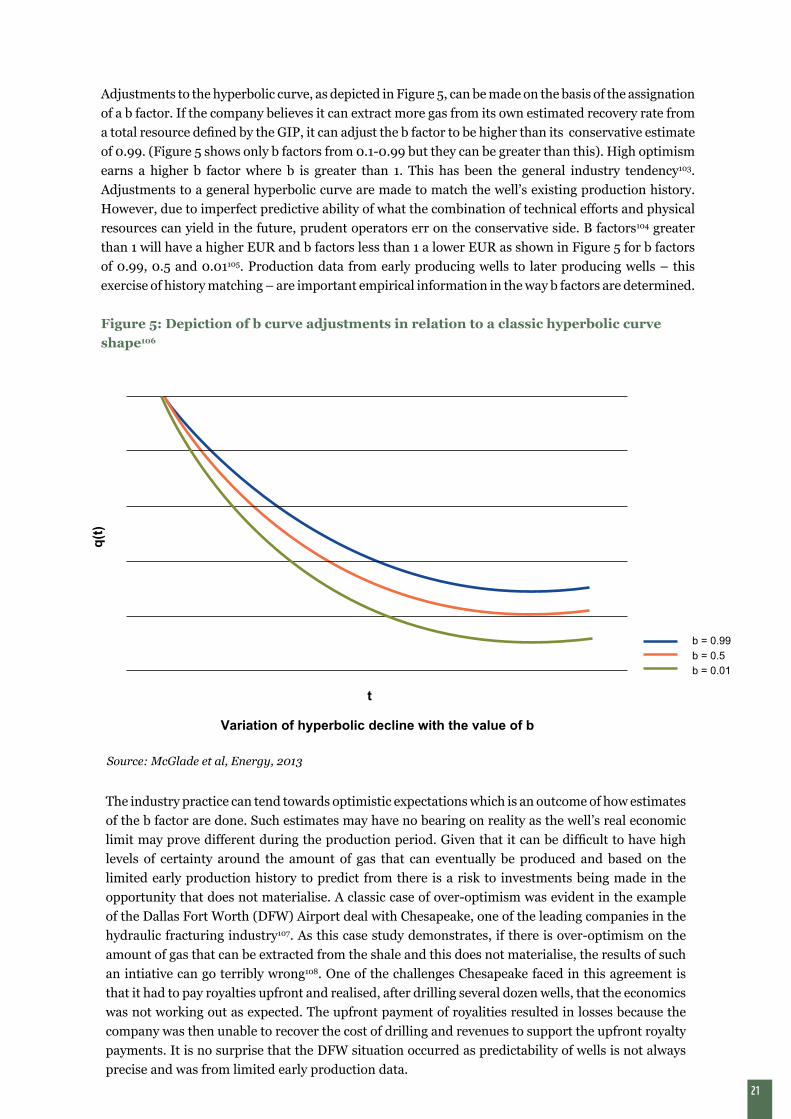
Adjustments to the hyperbolic curve, as depicted in Figure 5, can be made on the basis of the assignation of a b factor. If the company believes it can extract more gas from its own estimated recovery rate from a total resource defined by the GIP, it can adjust the b factor to be higher than its conservative estimate of 0.99. (Figure 5 shows only b factors from 0.1-0.99 but they can be greater than this). High optimism earns a higher b factor where b is greater than 1. This has been the general industry tendency103. Adjustments to a general hyperbolic curve are made to match the well’s existing production history. However, due to imperfect predictive ability of what the combination of technical efforts and physical resources can yield in the future, prudent operators err on the conservative side. B factors104 greater than 1 will have a higher EUR and b factors less than 1 a lower EUR as shown in Figure 5 for b factors of 0.99, 0.5 and 0.01105. Production data from early producing wells to later producing wells – this exercise of history matching – are important empirical information in the way b factors are determined.
Figure 5: Depiction of b curve adjustments in relation to a classic hyperbolic curve shape106
The industry practice can tend towards optimistic expectations which is an outcome of how estimates of the b factor are done. Such estimates may have no bearing on reality as the well’s real economic limit may prove different during the production period. Given that it can be difficult to have high levels of certainty around the amount of gas that can eventually be produced and based on the limited early production history to predict from there is a risk to investments being made in the opportunity that does not materialise. A classic case of over-optimism was evident in the example of the Dallas Fort Worth (DFW) Airport deal with Chesapeake, one of the leading companies in the hydraulic fracturing industry107. As this case study demonstrates, if there is over-optimism on the amount of gas that can be extracted from the shale and this does not materialise, the results of such an intiative can go terribly wrong108. One of the challenges Chesapeake faced in this agreement is that it had to pay royalties upfront and realised, after drilling several dozen wells, that the economics was not working out as expected. The upfront payment of royalities resulted in losses because the company was then unable to recover the cost of drilling and revenues to support the upfront royalty payments. It is no surprise that the DFW situation occurred as predictability of wells is not always precise and was from limited early production data.
q(t
)
t
Variation of hyperbolic decline with the value of b
b = 0.99
b = 0.5b = 0.01
Source: McGlade et al, Energy, 2013
22
From 2009 to 2011 the Energy Information Administration (EIA) estimated that the total volume of recoverable gas for the US would more than triple. These figures had to be revised downward by 46% in 2012109.
The potential exists for wells to be refracked in order to expand the economic limit and hence the EUR and life of the well. But this decision is dependent, amongst other things, on three things: 1) Whether the technical feasibility of refracking will justify the extra spending 2) the gas production rate of a well (refracking is likely to be more successful in wells that are ‘sweet-spots’ around P10), and 3) the price of gas (this should be high enough to sustain additional capital outlays). Expert opinions so far suggest that refracking at low gas prices is unlikely. It is better to drill fresh wells. However, future innovations may make refracking feasible for all types of wells110.
4.5 ASPECTS OF SHALE-GAS WELLS AFFECTING WELL ECONOMICS IN COMPARISON TO CONVENTIONAL WELLS
There are several features of shale-gas wells that make the economics of these wells different from conventional wells; we provide a summary of the key features:
1. The heterogeneity of the wells and uncertainty around production rates from shale rock formations always poses a challenge for the economics.
2. Shale surface areas are wider and longer in nature while those of conventional wells are contained and usually secured by overlying impermeable rock, such as shales or salt barriers. To optimise recovery you need to frack as much of the laterals.
3. Unlike conventional wells, the viability of a shale-gas well can only be determined after it has been fracked. The importance of this is that well completion can only take place after the reserve has been proved. Well costs are made up of two parts. Drilling costs make up 40 - 50%111 and the balance of costs are associated with stimulation, casing, cementing and final well completion112.
4. Given the characteristic of free and adsorbed gas behaviour in wells, not all the GIP is recoverable. Recovery rates vary per well from 10-30% based on estimates from literature surveys and expert views. Probabilistic methods have to be used to determine resource potential and in determining recovery factors113.
5. IPs also vary per well requiring that wells be classified into different tiers (according to their P ranges) in a field to derive average production rates per set of wells. It is for this reason that more wells have to be drilled for shale plays than conventional wells in the appraisal phase so that the full potential of the resources can be recognised. This helps to determine the pace of drilling and extraction in the development phase.
6. To maintain high average production rates per field, drilling intensity has to be ramped up and maintained over time. Ramping up models can be garnered from US experience and these can be set for different field conditions, IP, EURs and land size. Different scenarios are typically modelled for specific fields or shale-gas areas114.
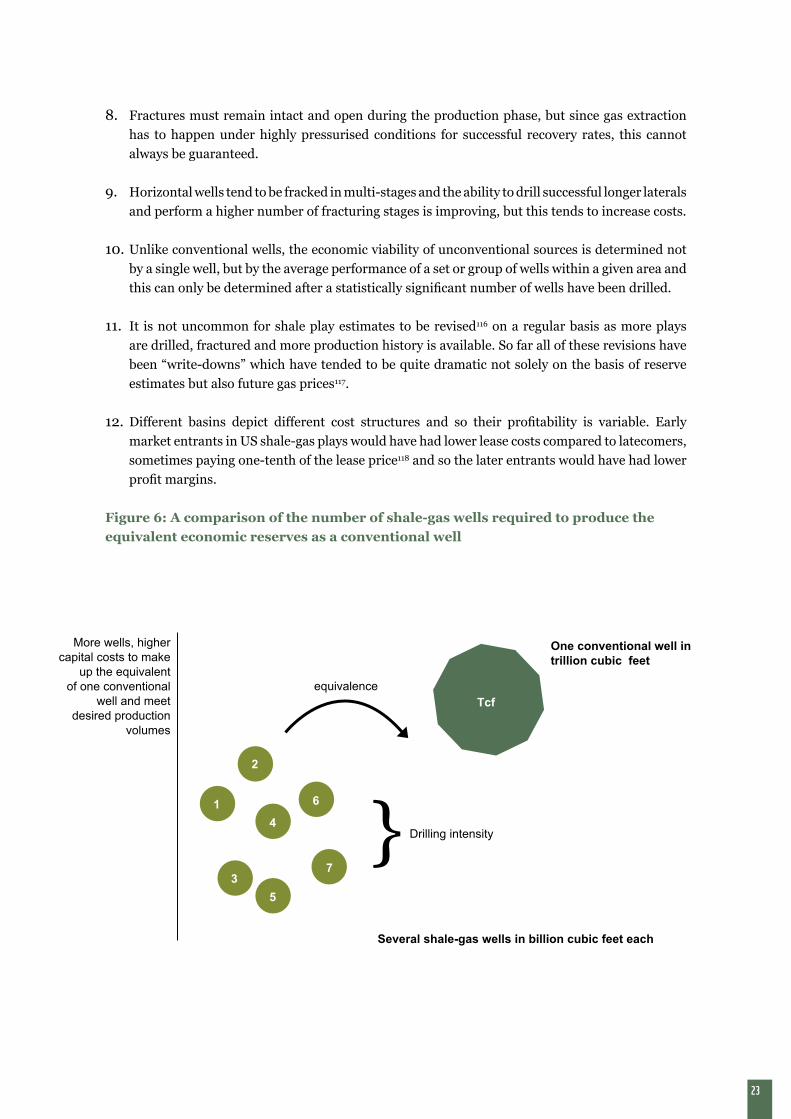
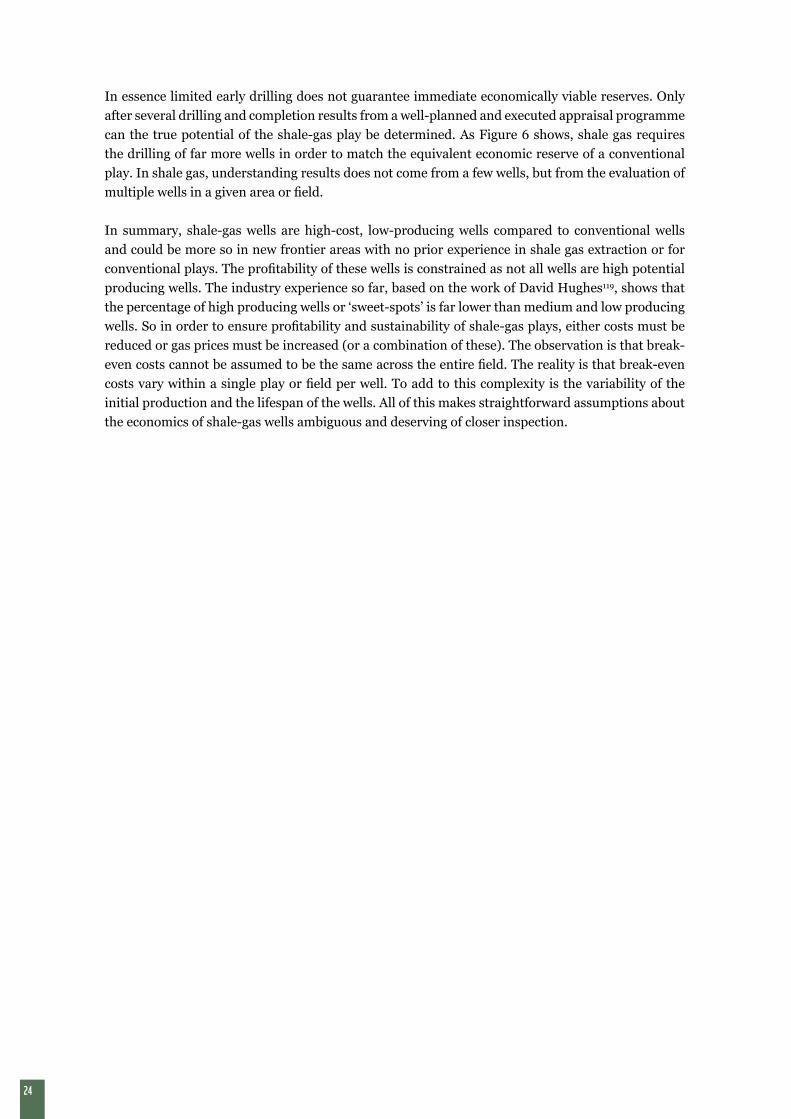
7. For the large amount of shale-gas wells, the proportion of ‘sweet-spots’ are smaller in relation to other wells. In other words, for all the capital outlay, a smaller portion of wells will be in the P10 range and the rest will be P50 or P90 wells. As a result, a smaller share of shale-gas wells are as productive as would typically be the case for conventional gas wells as depicted in Figure 6115.
23
8. Fractures must remain intact and open during the production phase, but since gas extraction has to happen under highly pressurised conditions for successful recovery rates, this cannot always be guaranteed.
9. Horizontal wells tend to be fracked in multi-stages and the ability to drill successful longer laterals and perform a higher number of fracturing stages is improving, but this tends to increase costs.
10. Unlike conventional wells, the economic viability of unconventional sources is determined not by a single well, but by the average performance of a set or group of wells within a given area and this can only be determined after a statistically significant number of wells have been drilled.
11. It is not uncommon for shale play estimates to be revised116 on a regular basis as more plays are drilled, fractured and more production history is available. So far all of these revisions have been “write-downs” which have tended to be quite dramatic not solely on the basis of reserve estimates but also future gas prices117.
12. Different basins depict different cost structures and so their profitability is variable. Early market entrants in US shale-gas plays would have had lower lease costs compared to latecomers, sometimes paying one-tenth of the lease price118 and so the later entrants would have had lower profit margins.
Figure 6: A comparison of the number of shale-gas wells required to produce the equivalent economic reserves as a conventional well
}
equivalence
More wells, higher capital costs to make
up the equivalent of one conventional
well and meet desired production
volumes
Drilling intensity
Tcf
Several shale-gas wells in billion cubic feet each
One conventional well in trillion cubic feet
2
6
4
7
5
3
1
24
In essence limited early drilling does not guarantee immediate economically viable reserves. Only after several drilling and completion results from a well-planned and executed appraisal programme can the true potential of the shale-gas play be determined. As Figure 6 shows, shale gas requires the drilling of far more wells in order to match the equivalent economic reserve of a conventional play. In shale gas, understanding results does not come from a few wells, but from the evaluation of multiple wells in a given area or field.
In summary, shale-gas wells are high-cost, low-producing wells compared to conventional wells and could be more so in new frontier areas with no prior experience in shale gas extraction or for conventional plays. The profitability of these wells is constrained as not all wells are high potential producing wells. The industry experience so far, based on the work of David Hughes119, shows that the percentage of high producing wells or ‘sweet-spots’ is far lower than medium and low producing wells. So in order to ensure profitability and sustainability of shale-gas plays, either costs must be reduced or gas prices must be increased (or a combination of these). The observation is that break-even costs cannot be assumed to be the same across the entire field. The reality is that break-even costs vary within a single play or field per well. To add to this complexity is the variability of the initial production and the lifespan of the wells. All of this makes straightforward assumptions about the economics of shale-gas wells ambiguous and deserving of closer inspection.
25
5. CONTEXT OF A WELLHEAD BASE COST MODEL
MAIN FINDINGS• Base models can be used to analyse shale-gas prospects under various conditions. • The introduction of a shadow estimate could reduce financial risks. • Further research, development and technology innovation are necessary to reduce drilling,
completion and production costs. • Learning rates are key in reducing costs. • Wellhead costs for the gas industry are influenced by development and construction costs as
well as the fiscal and tax regime. • The five-year window is the most likely time-frame for optimal revenue streams and cost
recoveries. • Wellhead costs guide the pricing of shale gas until it enters the domestic or international
market.
The base economic model idea is drawn from work by various academics in the US. It is designed to understand break-even costs in relation to gas prices. We propose a similar model for South Africa. Base models can be used to analyse shale-gas prospects under various conditions. The base model will have to take into account the various costs for different phases of well development and completion as identified in Table 5. The incorporation of environmental mitigation costs is an important feature in such a base model. The value of the base model will be in helping to develop greater clarity on a number of issues. Such a model would help provide:
• Tighter contextualisation of costs under South African conditions building on US experience;• Greater understanding of the key variables which influence break-even costs;• A useful gauge of likely trends in wellhead gas prices;• A greater understanding of which royalty or carry free rates are most optimal in terms of the net-
effect from a fiscal regime that covers a variety of taxes, levies and incentives;• A basis for understanding cashflow scenarios under different conditions for both wells and shale
gas fields
5.1 BASE MODEL CONSIDERATIONSBreak-even costs120 can be determined using standard discounted cash-flow (DCF) analysis methods where internal rates of return (IRR)121 per well and net-present values (NPVs122)123 per well can be used to assess the economic viability of a well or a set of wells. IRRs that are higher than the weighted average cost of capital (WACC)124 and where the NPVs > 0 favour a project going ahead. In shale gas, the appraisal of a single well is insufficient. The entire field or play IRR and NPV would provide more material as we are concerned with a production regime that can be ramped up over time based on the level of confidence that the shale-gas play economics will be favourable.
The important difference, in our view, is that IRRs and NPVs for shale-gas wells will have an initial shadow estimate and then a real estimate, unlike conventional wells. We believe the financial sector and investor world should introduce this innovation for shale-gas plays125. The shadow estimates are based on a sample of initial drills for a reasonably represented area that becomes the basis for initial capital raising provided to investors. We recommend that there also be a real estimate to ‘stress test’ the initial assumptions as IRRs and NPVs are likely to vary when well drilling is ramped up and there is wider well coverage in a given field. This would be better suited when more production data
26
and real-life production costs are available. In addition, in the US, real proven reserves are legally registered while the possible resources tend to be estimates thrown about at investor meetings and conferences which often paint a more promising picture than could be the reality126. The correctives proposed here will go a long way to ensuring tighter oversight is given over reserve estimates already in place, costs and profitability of shale gas wells and plays.
The proportion of debt/equity127 and favourable interest rates that a firm or borrower can secure based on their credit ratings and expected return on equity are two factors that would influence the WACC. Some preliminary academic work paints a picture of some gas companies showing financial strain and underperformance along a number of indicators including128: 1) retained earnings 2) the amount of working capital129 3) total shareholder return and 4) margin analysis. This reinforces the view, perhaps, that shale gas is a marginal play and would require a high gas price or other incentives to improve the attractiveness of extraction130. The effect of low prices131 is that drilling intensity has to increase, and so capex spend to meet not only land royalty obligations but also futures contracts132 through Volumetric Production Payments133 (VPPs)134 135 increases pressure for producers136. This is at least the case in the US, but will mostly likely take on different structural and financial characteristics in other countries.
Several studies now show that cash-flows are in negative territory, especially for dry-gas plays 137
138. The main findings are that companies have to drill far more to meet cash-flow targets and so capex costs139 are exceeding initial modest expectations and drilling intensity, in turn, drives more production, further depressing prices as US gas demand has not kept up with supply140 141. It is what one would call a vicious rather than virtuous cycle. In the last two years, there have been significant impairments in the balance sheets for US companies and the majors, for instance Shell has had to write down its shale-gas assets in the US142. These trends can be understood through some of the main challenges of shale-gas extraction detailed in section 8.
Table 4: Well drilling and completion phase
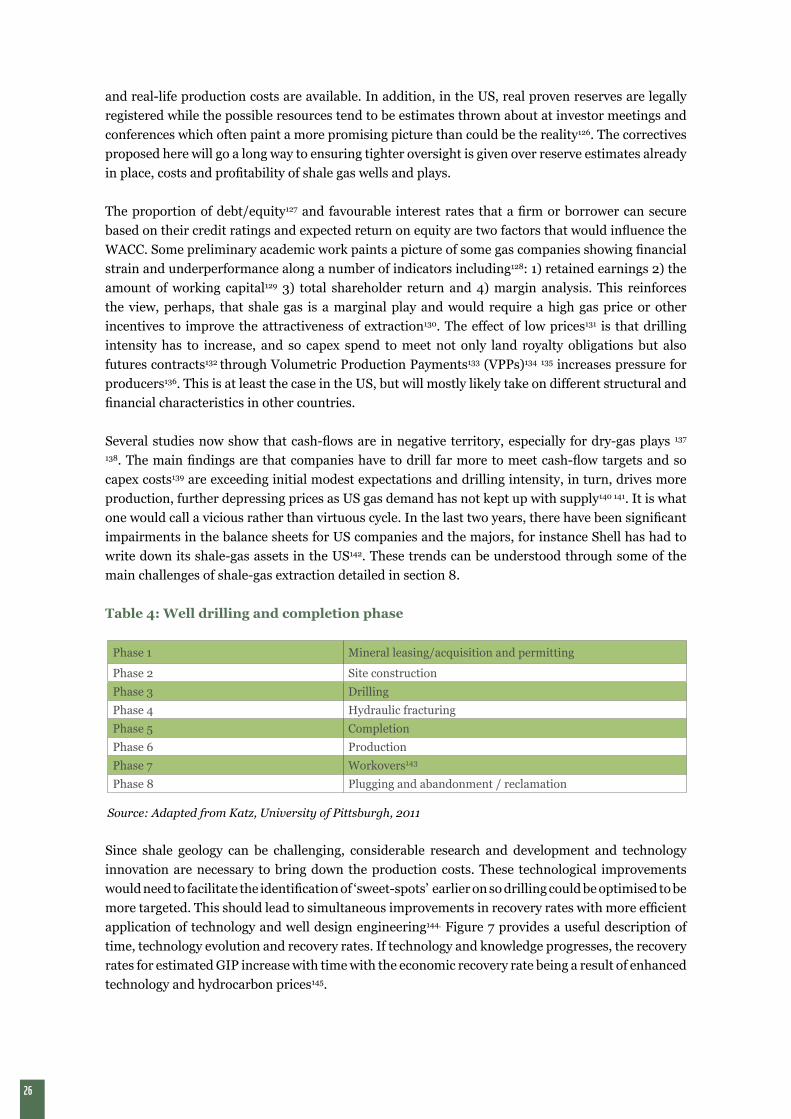
Since shale geology can be challenging, considerable research and development and technology innovation are necessary to bring down the production costs. These technological improvements would need to facilitate the identification of ‘sweet-spots’ earlier on so drilling could be optimised to be more targeted. This should lead to simultaneous improvements in recovery rates with more efficient application of technology and well design engineering144. Figure 7 provides a useful description of time, technology evolution and recovery rates. If technology and knowledge progresses, the recovery rates for estimated GIP increase with time with the economic recovery rate being a result of enhanced technology and hydrocarbon prices145.
Phase 1 Mineral leasing/acquisition and permitting
Phase 2 Site constructionPhase 3 DrillingPhase 4 Hydraulic fracturingPhase 5 CompletionPhase 6 ProductionPhase 7 Workovers143
Phase 8 Plugging and abandonment / reclamation
Source: Adapted from Katz, University of Pittsburgh, 2011
27
5.2 THE IMPORTANCE OF TECHNOLOGY LEARNING RATESTechnology learning rates and innovation sharing uptake rates by other operators have been shown to bring costs down and are expected do so further in the future146. These learning rates and innovations involve the optimal spacing of drilling (this can only be achieved with good knowledge of geology and mapping techniques); the replacement of single-pad drill rigs with multi-well drilling147 148 which has led to improvements in drilling time and the number of wells that can be drilled; improvements in well design engineering with growing experience; and in-field innovation allowing more free and adsorbed gas to be stimulated and recovered.
Learning rates will be especially important in the early phases of South Africa’s shale-gas development, because of the limited experience with drilling in the country. As a result, the early production costs are expected to be higher. The extent to which we can learn, apply the technology and understand the influence of the geology more efficiently to ensure a positive learning rate is uncertain. Those learning rate effects are crucial in optimising the economics of shale gas. If these learning rates do not appear early enough the sentiment toward shale gas will likely be more negative as seen in China, Poland and other countries where fracking has been attempted. Most of South Africa’s learning rates are likely to come from application of technology such as the operation of the rigs, the extraction of gas and in the use of fracking methods.
Learning rate effects can be displaced by other variables or structural issues within the oil and gas economies such as the market advantage that OEMs can exercise over equipment or service pricing. There have been some concerns raised in the US media regarding market advantage problems149.
Market advantage on specific critical equipment is likely to lead to overpricing. This is more likely if few companies own and produce critical technologies like rigs, certain gas separation equipment, water treatment technologies, and intellectual property over certain processes or applications just as illustrative examples. If shale gas expands to other countries, US OEMs and other related service industries will be major beneficiaries, not only because of proprietary information, but also the advantage of know-how that comes with years of practice and tacit knowledge.
5.3 FINANCING OF SHALE GAS AND PROSPECTS FOR SOUTH AFRICAOther factors that could influence shale viability is how upstream, midstream and downstream operations and gas infrastructure are funded. It is not entirely clear what portion of investment would be driven by the state and what portion will be driven by the private sector. Upstream exploration and development is expected to be taken on risk by private oil and gas corporations. Exchange rate volatility and sovereign credit ratings150 (which influences the cost of capital) would be important factors weighing on the financing and economic dynamics of shale-gas production151. However, the credit ratings of private firms is a separate matter and their cost of capital would be influenced by their own balance sheet and value of assets. It is anticipated that most critical skills and equipment for drilling will have to be imported. South Africa has no drill rigs152. The country has no specialised engineers with experience in shale-gas well design and, as pointed out, successful fracks require experience, good knowledge of the shale-gas play and a degree of design skill.
28
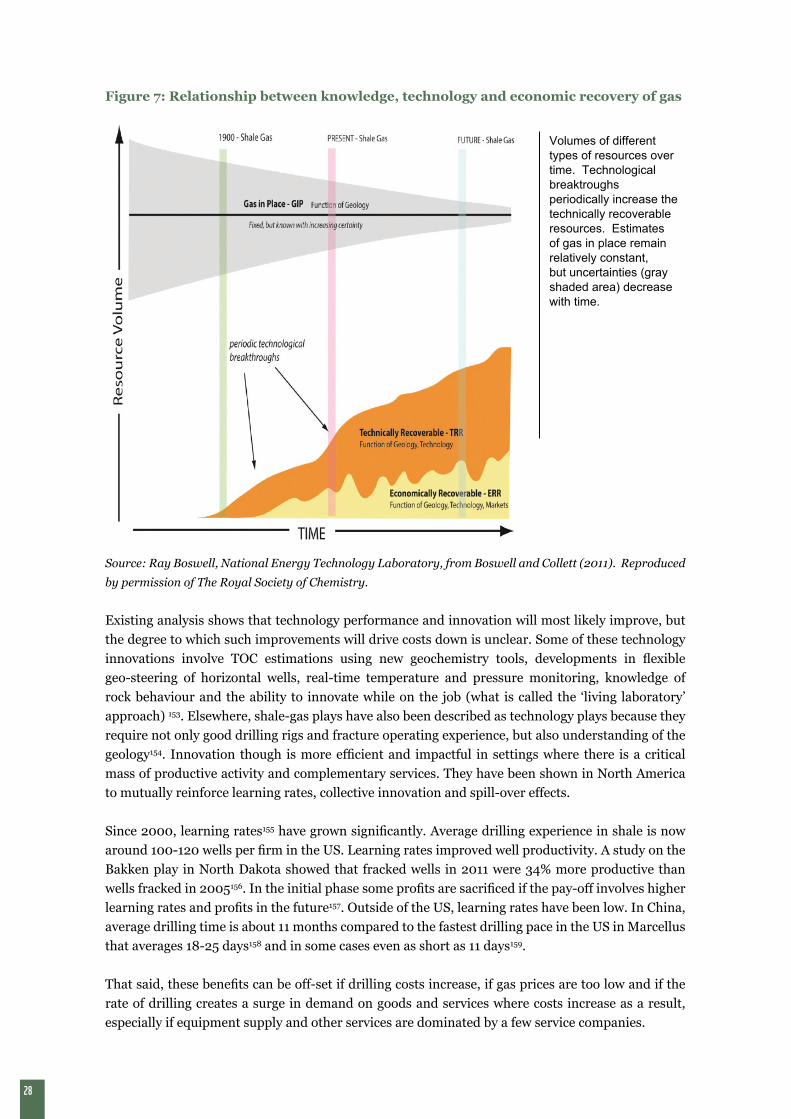
Figure 7: Relationship between knowledge, technology and economic recovery of gas
Volumes of different types of resources over time. Technological breaktroughs periodically increase the technically recoverable resources. Estimates of gas in place remain relatively constant, but uncertainties (gray shaded area) decrease with time.
Source: Ray Boswell, National Energy Technology Laboratory, from Boswell and Collett (2011). Reproduced
by permission of The Royal Society of Chemistry.
Existing analysis shows that technology performance and innovation will most likely improve, but the degree to which such improvements will drive costs down is unclear. Some of these technology innovations involve TOC estimations using new geochemistry tools, developments in flexible geo-steering of horizontal wells, real-time temperature and pressure monitoring, knowledge of rock behaviour and the ability to innovate while on the job (what is called the ‘living laboratory’ approach) 153. Elsewhere, shale-gas plays have also been described as technology plays because they require not only good drilling rigs and fracture operating experience, but also understanding of the geology154. Innovation though is more efficient and impactful in settings where there is a critical mass of productive activity and complementary services. They have been shown in North America to mutually reinforce learning rates, collective innovation and spill-over effects.
Since 2000, learning rates155 have grown significantly. Average drilling experience in shale is now around 100-120 wells per firm in the US. Learning rates improved well productivity. A study on the Bakken play in North Dakota showed that fracked wells in 2011 were 34% more productive than wells fracked in 2005156. In the initial phase some profits are sacrificed if the pay-off involves higher learning rates and profits in the future157. Outside of the US, learning rates have been low. In China, average drilling time is about 11 months compared to the fastest drilling pace in the US in Marcellus that averages 18-25 days158 and in some cases even as short as 11 days159.
That said, these benefits can be off-set if drilling costs increase, if gas prices are too low and if the rate of drilling creates a surge in demand on goods and services where costs increase as a result, especially if equipment supply and other services are dominated by a few service companies.
29
It is unknown what learning rates will look like in South Africa as fracking has not been tested under South African geological conditions and other non-geological factors. It is likely that during the exploration phase some of these learning rates will be tested or grounded. When new technologies are applied to new geographic conditions, learning rates will be slower.
The timing of the development and production phase of gas is important. If global demand for scarce skills, equipment and services is at peak, additional demand is likely to be inflated and would influence production costs. As a case in point, these factors are coming to bear with the global surge in gas production and the development of Liquefied Natural Gas (LNG) export terminals. LNG platform development costs have surged considerably160 with Australia seeing cost overruns161 and labour strikes. Skilled labour enjoys a captive market162. This has particular relevance for South Africa if we are to import conventional gas from Mozambique in the future and consider developing the shale-gas industry in South Africa especially if it is destined for export.
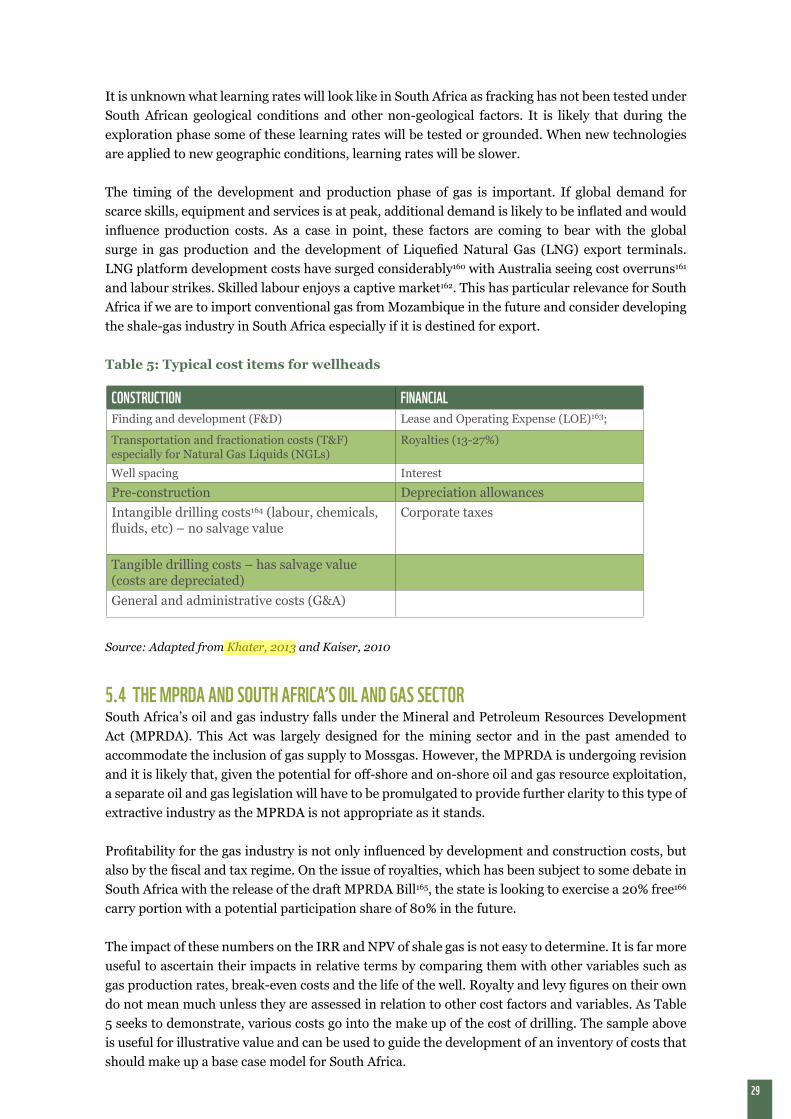
Table 5: Typical cost items for wellheads
Source: Adapted from Khater, 2013 and Kaiser, 2010
5.4 THE MPRDA AND SOUTH AFRICA’S OIL AND GAS SECTORSouth Africa’s oil and gas industry falls under the Mineral and Petroleum Resources Development Act (MPRDA). This Act was largely designed for the mining sector and in the past amended to accommodate the inclusion of gas supply to Mossgas. However, the MPRDA is undergoing revision and it is likely that, given the potential for off-shore and on-shore oil and gas resource exploitation, a separate oil and gas legislation will have to be promulgated to provide further clarity to this type of extractive industry as the MPRDA is not appropriate as it stands.
Profitability for the gas industry is not only influenced by development and construction costs, but also by the fiscal and tax regime. On the issue of royalties, which has been subject to some debate in South Africa with the release of the draft MPRDA Bill165, the state is looking to exercise a 20% free166 carry portion with a potential participation share of 80% in the future.
The impact of these numbers on the IRR and NPV of shale gas is not easy to determine. It is far more useful to ascertain their impacts in relative terms by comparing them with other variables such as gas production rates, break-even costs and the life of the well. Royalty and levy figures on their own do not mean much unless they are assessed in relation to other cost factors and variables. As Table 5 seeks to demonstrate, various costs go into the make up of the cost of drilling. The sample above is useful for illustrative value and can be used to guide the development of an inventory of costs that should make up a base case model for South Africa.
CONSTRUCTION FINANCIALFinding and development (F&D) Lease and Operating Expense (LOE)163;
Transportation and fractionation costs (T&F) especially for Natural Gas Liquids (NGLs)
Royalties (13-27%)
Well spacing Interest
Pre-construction Depreciation allowancesIntangible drilling costs164 (labour, chemicals, fluids, etc) – no salvage value
Corporate taxes
Tangible drilling costs – has salvage value (costs are depreciated)General and administrative costs (G&A)
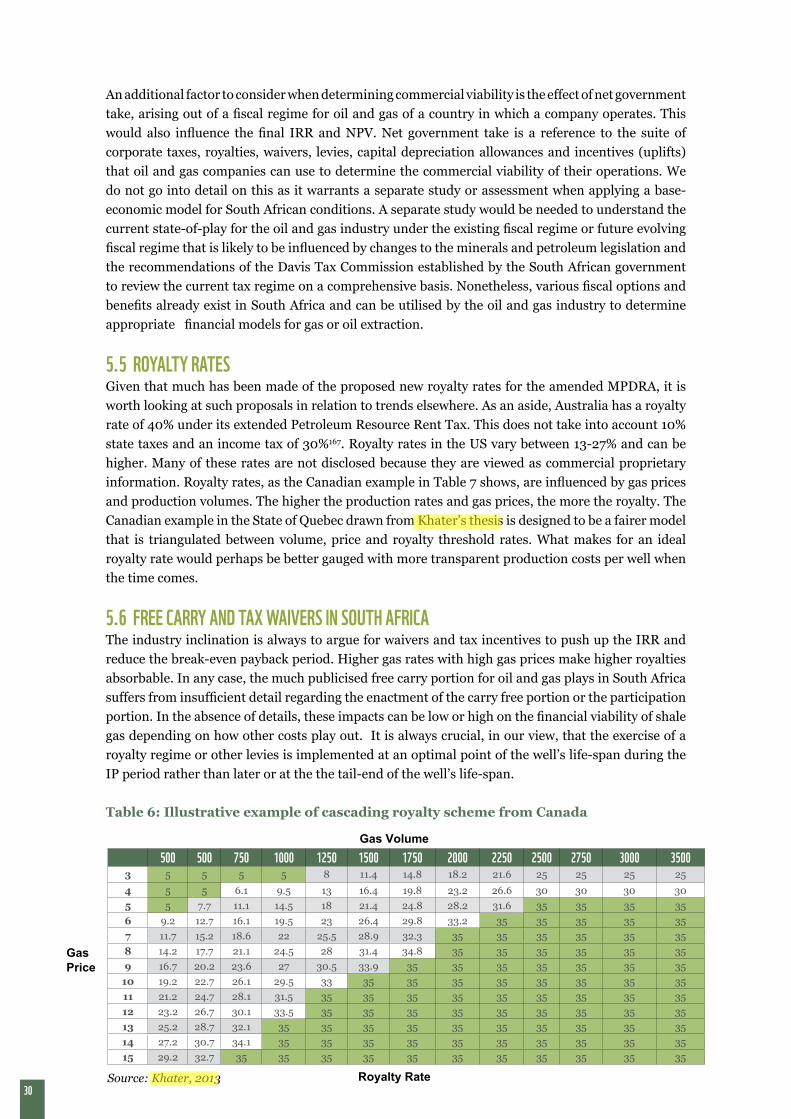
30
An additional factor to consider when determining commercial viability is the effect of net government take, arising out of a fiscal regime for oil and gas of a country in which a company operates. This would also influence the final IRR and NPV. Net government take is a reference to the suite of corporate taxes, royalties, waivers, levies, capital depreciation allowances and incentives (uplifts) that oil and gas companies can use to determine the commercial viability of their operations. We do not go into detail on this as it warrants a separate study or assessment when applying a base-economic model for South African conditions. A separate study would be needed to understand the current state-of-play for the oil and gas industry under the existing fiscal regime or future evolving fiscal regime that is likely to be influenced by changes to the minerals and petroleum legislation and the recommendations of the Davis Tax Commission established by the South African government to review the current tax regime on a comprehensive basis. Nonetheless, various fiscal options and benefits already exist in South Africa and can be utilised by the oil and gas industry to determine appropriate financial models for gas or oil extraction.
5.5 ROYALTY RATES Given that much has been made of the proposed new royalty rates for the amended MPDRA, it is worth looking at such proposals in relation to trends elsewhere. As an aside, Australia has a royalty rate of 40% under its extended Petroleum Resource Rent Tax. This does not take into account 10% state taxes and an income tax of 30%167. Royalty rates in the US vary between 13-27% and can be higher. Many of these rates are not disclosed because they are viewed as commercial proprietary information. Royalty rates, as the Canadian example in Table 7 shows, are influenced by gas prices and production volumes. The higher the production rates and gas prices, the more the royalty. The Canadian example in the State of Quebec drawn from Khater’s thesis is designed to be a fairer model that is triangulated between volume, price and royalty threshold rates. What makes for an ideal royalty rate would perhaps be better gauged with more transparent production costs per well when the time comes.
5.6 FREE CARRY AND TAX WAIVERS IN SOUTH AFRICAThe industry inclination is always to argue for waivers and tax incentives to push up the IRR and reduce the break-even payback period. Higher gas rates with high gas prices make higher royalties absorbable. In any case, the much publicised free carry portion for oil and gas plays in South Africa suffers from insufficient detail regarding the enactment of the carry free portion or the participation portion. In the absence of details, these impacts can be low or high on the financial viability of shale gas depending on how other costs play out. It is always crucial, in our view, that the exercise of a royalty regime or other levies is implemented at an optimal point of the well’s life-span during the IP period rather than later or at the the tail-end of the well’s life-span.
Table 6: Illustrative example of cascading royalty scheme from Canada
500 500 750 1000 1250 1500 1750 2000 2250 2500 2750 3000 35003 5 5 5 5 8 11.4 14.8 18.2 21.6 25 25 25 25
4 5 5 6.1 9.5 13 16.4 19.8 23.2 26.6 30 30 30 305 5 7.7 11.1 14.5 18 21.4 24.8 28.2 31.6 35 35 35 356 9.2 12.7 16.1 19.5 23 26.4 29.8 33.2 35 35 35 35 357 11.7 15.2 18.6 22 25.5 28.9 32.3 35 35 35 35 35 358 14.2 17.7 21.1 24.5 28 31.4 34.8 35 35 35 35 35 359 16.7 20.2 23.6 27 30.5 33.9 35 35 35 35 35 35 35
10 19.2 22.7 26.1 29.5 33 35 35 35 35 35 35 35 3511 21.2 24.7 28.1 31.5 35 35 35 35 35 35 35 35 3512 23.2 26.7 30.1 33.5 35 35 35 35 35 35 35 35 3513 25.2 28.7 32.1 35 35 35 35 35 35 35 35 35 3514 27.2 30.7 34.1 35 35 35 35 35 35 35 35 35 3515 29.2 32.7 35 35 35 35 35 35 35 35 35 35 35
Royalty Rate
Gas Volume
Gas Price
Source: Khater, 2013
31
Given that shale-gas wells typically depict high initial decline rates, the largest volume of production and revenue stream would be seen in the early part of the IP window – during the first 15-24 months of production.
More detailed understanding should inform the royalty and reclamation cost recovery threshold and strategy. Information asymmetries between state understanding of shale-gas economics and the knowledge that companies have of shale-gas well performance can undermine an optimum royalty scheme and the ability to recover other costs if risks or liabilities become the inheritance of public coffers.
5.7 TIMING FOR OPTIMAL REVENUE STREAMSOur view is that the five-year window168 is the most likely window for optimal revenue streams and cost recoveries in shale-gas plays based on current knowledge and understanding of the performance of shale-gas wells. Shale-gas wells may last longer, but current evidence suggests that the first five-year estimates are critical for financial viability based on our examination of the literature and conversations with experts.
5.8 SHALE-GAS PRICINGOne of the challenges for both beneficiation and royalties is being able to get a reasonable handle on the financially viable gas price that sustains the longevity of shale gas plays and production rates. The wellhead costs guide the pricing of shale gas before it enters into the domestic or international market. Pricing should not only cover the cost, but must also enable private firms to earn a profit and support further investments. Pricing would ultimately determine the viability of long term shale-gas extraction. The highest international benchmark prices generate the highest arbitrage between domestic break-even cost at the wellhead and the higher price margins that can be reached if you sell to the highest bidder on the price curve as shown in Figure 8. So, for instance, in Japan, if LNG prices are around $17/mcf169 and the wellhead price for South African gas is between $8-$10, the arbitrage, after adding shipping and other costs, could be in the range of $7-8/mcf.
It is these very arbitrage ranges that are bolstering the push for LNG export approvals in the US. This is in light of the current low gas prices that the US is able to offer when compared to international LNG benchmark prices as a consequence of the gas-to-gas market at the Henry Hub terminal. These low prices are one of the reasons for the conversion of the Cheniere170 LNG import terminal into an export terminal following the shale-gas boom in the US171. LNG plants costs, in general, are escalating172 and the US could be a competitive exporter of LNG in the future as it has a lower cost structure than many new LNG plants173 that are being built and planned by other countries.
The US shale gas plays also have other advantages as the nature of its shale-gas resource allows producers to take advantage of different shale-rock products and prices to produce different revenue streams. The variation in product range can be indexed according to their different markets and monetisation profiles in different petroleum sectors. Shale oil, for instance, would be priced at relevant crude prices, gas could be linked to different global LNG prices or regulated prices within the domestic economy and these, in turn, will determine the economic viability of different wells that are fracked. For instance, in the US, where gas prices are currently low, drilling and production has shifted to the wet gas and oil windows of shale plays because these products fetch higher market prices. However, dry gas is cheaper to produce than wet gas as extra surface equipment is required to separate gas from wet condensate174. The expansion of drilling in oil and wet gas windows has seen a growth in LPG production resulting in significant growth in LPG exports from the US175.
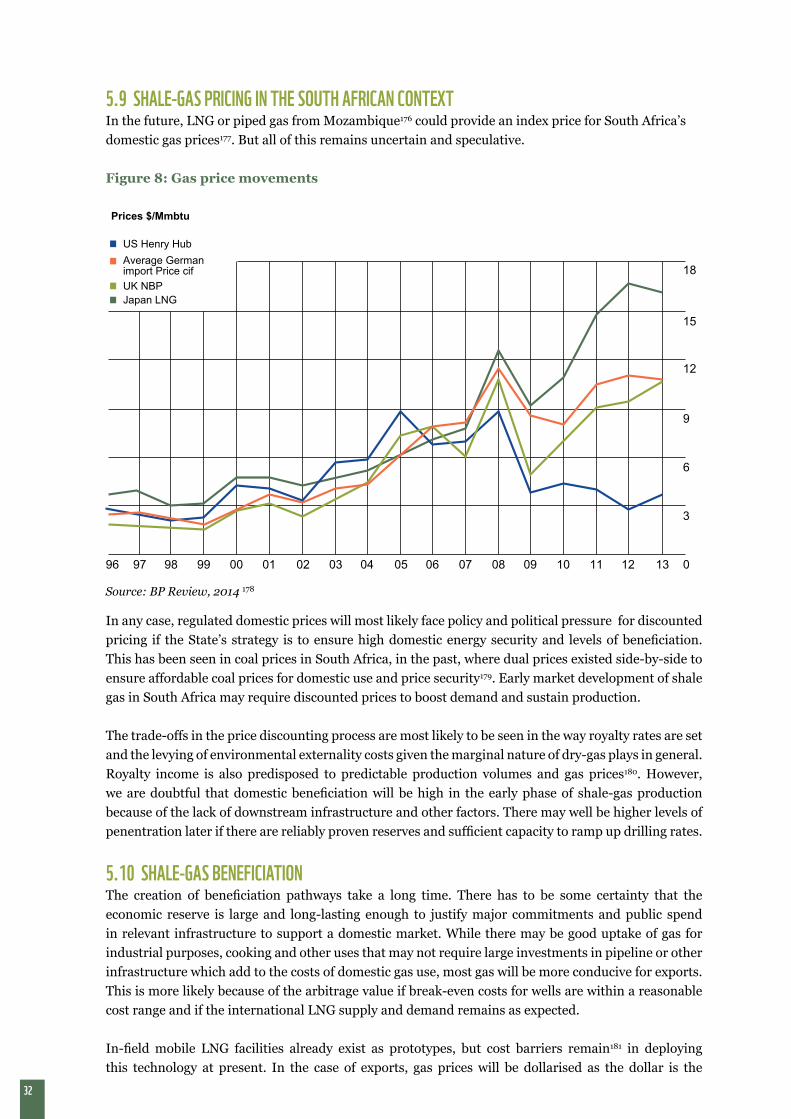
32
5.9 SHALE-GAS PRICING IN THE SOUTH AFRICAN CONTEXTIn the future, LNG or piped gas from Mozambique176 could provide an index price for South Africa’s domestic gas prices177. But all of this remains uncertain and speculative.
Figure 8: Gas price movements
CAPEX
In any case, regulated domestic prices will most likely face policy and political pressure for discounted pricing if the State’s strategy is to ensure high domestic energy security and levels of beneficiation. This has been seen in coal prices in South Africa, in the past, where dual prices existed side-by-side to ensure affordable coal prices for domestic use and price security179. Early market development of shale gas in South Africa may require discounted prices to boost demand and sustain production.
The trade-offs in the price discounting process are most likely to be seen in the way royalty rates are set and the levying of environmental externality costs given the marginal nature of dry-gas plays in general. Royalty income is also predisposed to predictable production volumes and gas prices180. However, we are doubtful that domestic beneficiation will be high in the early phase of shale-gas production because of the lack of downstream infrastructure and other factors. There may well be higher levels of penentration later if there are reliably proven reserves and sufficient capacity to ramp up drilling rates.
5.10 SHALE-GAS BENEFICIATION The creation of beneficiation pathways take a long time. There has to be some certainty that the economic reserve is large and long-lasting enough to justify major commitments and public spend in relevant infrastructure to support a domestic market. While there may be good uptake of gas for industrial purposes, cooking and other uses that may not require large investments in pipeline or other infrastructure which add to the costs of domestic gas use, most gas will be more conducive for exports. This is more likely because of the arbitrage value if break-even costs for wells are within a reasonable cost range and if the international LNG supply and demand remains as expected.
In-field mobile LNG facilities already exist as prototypes, but cost barriers remain181 in deploying this technology at present. In the case of exports, gas prices will be dollarised as the dollar is the
96 97 98 99 00 01 02 03 04 05 06 07 08 09 10 11 12 13 0
3
6
9
12
15
18
US Henry Hub
Average Germanimport Price cif
UK NBPJapan LNG
Prices $/Mmbtu
Source: BP Review, 2014 178
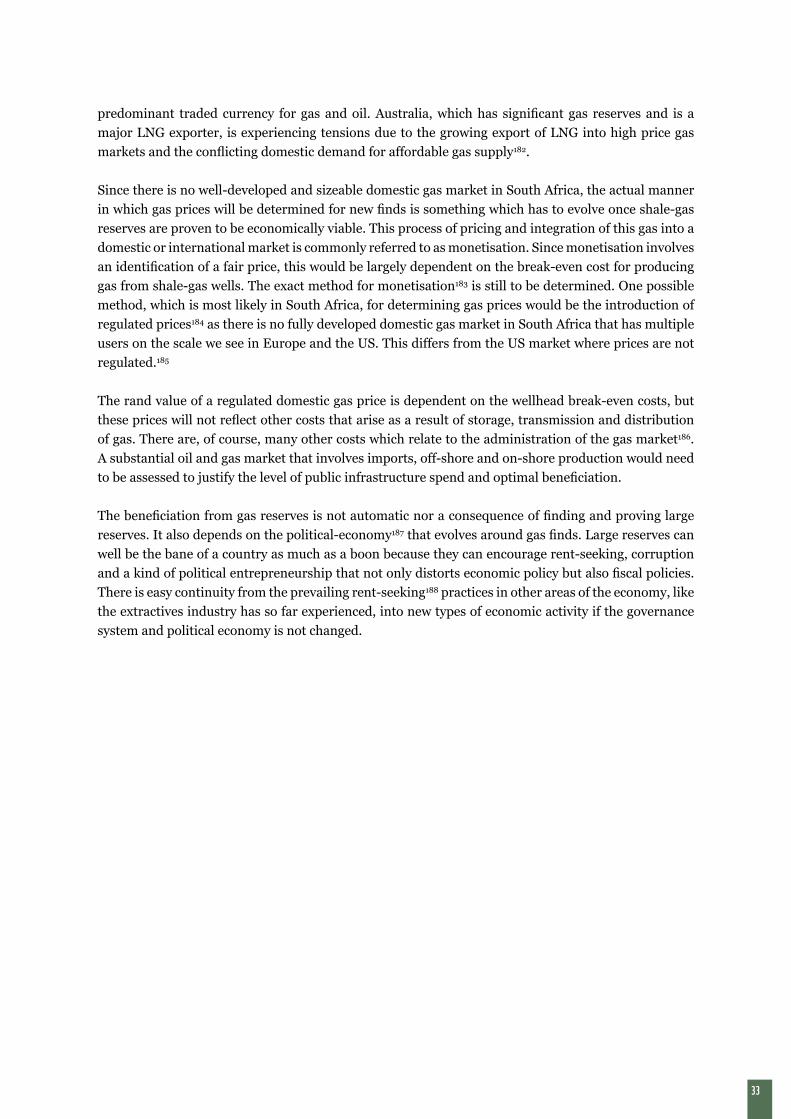
33
predominant traded currency for gas and oil. Australia, which has significant gas reserves and is a major LNG exporter, is experiencing tensions due to the growing export of LNG into high price gas markets and the conflicting domestic demand for affordable gas supply182.
Since there is no well-developed and sizeable domestic gas market in South Africa, the actual manner in which gas prices will be determined for new finds is something which has to evolve once shale-gas reserves are proven to be economically viable. This process of pricing and integration of this gas into a domestic or international market is commonly referred to as monetisation. Since monetisation involves an identification of a fair price, this would be largely dependent on the break-even cost for producing gas from shale-gas wells. The exact method for monetisation183 is still to be determined. One possible method, which is most likely in South Africa, for determining gas prices would be the introduction of regulated prices184 as there is no fully developed domestic gas market in South Africa that has multiple users on the scale we see in Europe and the US. This differs from the US market where prices are not regulated.185
The rand value of a regulated domestic gas price is dependent on the wellhead break-even costs, but these prices will not reflect other costs that arise as a result of storage, transmission and distribution of gas. There are, of course, many other costs which relate to the administration of the gas market186. A substantial oil and gas market that involves imports, off-shore and on-shore production would need to be assessed to justify the level of public infrastructure spend and optimal beneficiation.
The beneficiation from gas reserves is not automatic nor a consequence of finding and proving large reserves. It also depends on the political-economy187 that evolves around gas finds. Large reserves can well be the bane of a country as much as a boon because they can encourage rent-seeking, corruption and a kind of political entrepreneurship that not only distorts economic policy but also fiscal policies. There is easy continuity from the prevailing rent-seeking188 practices in other areas of the economy, like the extractives industry has so far experienced, into new types of economic activity if the governance system and political economy is not changed.
34
6. COSTS AND BENEFITS OF SHALE GAS IN SOUTH AFRICAMAIN FINDINGS• Well-designed economic and fiscal policies result in stronger opportunities for economic
development and poverty alleviation. • Oil and gas rights should be put out for bid rather than on a first-come-first-served basis. • Oil and gas resource endowments do not easily translate into resource entitlements for citizens.
Visions of a blissful outcome from the exploitation of new resources are not confirmed by common experience as wealth acquisition and distribution in South Africa not only reinforce past patterns in the minerals sector, but also continue to exclude many within the present. The promise that the exploitation of natural resources leads to automatic poverty alleviation and economic development remains unconvincing as many proponents know full well189 that these are influenced by the characteristics of the prevailing political-economy.
In the post-1994 period, South Africa’s per capita income grew significantly to push us from lower-middle-income to upper-middle-income status. In 1994, the annual earnings per person averaged R12 281. In 2013, that share grew by 401% to R62 676 per year – a compounded annual rise of 8.9% per year. Such statistics belie a different reality – South Africa is among the world’s most unequal societies with persistently high unemployment for the last twenty years.190 This mismatch points to other structural and systemic issues within South Africa’s political-economy that defines the nature of how wealth is distributed and used. Oil and gas wealth can relieve this as much as it can sustain this divide in wealth and income share.
If economic and fiscal policies are designed well, they can lead to stronger possibility of economic development and poverty alleviation. The prevailing setting of governance and the political-economy over a country’s natural resources is often a better indicator of where things can go than the mountain of rhetoric and platitudes announced along with the intention to open up new resources for exploitation so as to calm popular sentiment and build public support to serve vested interests.
The fair distribution of oil and gas benefits requires sound economic policy and governance in order to properly allocate and invest any revenues generated from oil and gas receipts. Good governance supports strong national sovereignty over resource management and economic planning.
An important issue that South African policy makers must grapple with is what type of fiscal model would work locally for shale gas specifically, but also for wider oil and gas exploitation if these prove to be realisable in future. We do not need to reinvent the wheel, but can draw from experiences and insights based on application of fiscal tools and policies 191 implemented elsewhere in the world.
The Norwegian model relies on what is called the ‘bird-in-hand’192 approach where national budgets are drawn193 or run into deficit ranges based on the overall returns from accumulated surplus from oil and gas sales that are managed as a pool fund194.
The Norwegian and Chilean models are often cited, but there are more. Nonetheless, these are well-tested economic models that should be studied carefully. We will not delve into this deeply but economists such as Hotelling195 and Hartwick196 as well as Friedman’s Permanent Income Hypothesis197 provide useful
35
economic theories to consider the fiscal policy design for optimal royalties, fees, levies or taxes that allow the state to build new endowments and capabilities from a depleting resource. All of these economic models are designed to create new wealth and preserve wealth as part of intergenerational equity strategies. These benefits, in turn, are dependent on the nature of the consumption of revenues based on whether investments are made in durable goods (capital spending) or non-durable goods (current spending)198. Predictability of revenues from oil and gas proceeds would also determine the size of the deficit the government can carry on its books in order to ensure that spending towards social welfare and development is brought forward if revenues have high levels of certainty.
Other countries have considered the creation of a Stability Fund199 to smooth the effects of commodity price cycles due to boom or bust periods. Stability Funds also act as useful buffers for managing currency risk and for managing boom and bust cycles that are often associated with the extractive industries.
These economic theories collectively suggest that the conversion of depleting resources into new types of assets should happen at the desired rates of substitute annuity income. In countries that have development backlogs, it is expected that some portion of the revenue stream will be used for consumption such as the spend on new infrastructure or the provision of other public goods, while the remainder will be invested. The rate of spend has to be aligned with reserve estimates, the pace at which the reserve will be extracted, and the present and future price for the resource. This may well be relevant for South Africa in the future as the combination of on-shore and off-shore reserves can boost fiscal coffers. Fiscal regimes allow for judicious management of revenue streams from the extractive industries by the government on behalf of its citizens. In the absence of such regimes, social benefits may be undermined, environmental externalities may not be dealt with and the development of the extractive industry can have adverse impacts, crowding out the potential and the development of other sectors of the economy, especially manufacturing, particularly if there is an influx of foreign currency. This is known as the ‘Dutch Disease’ syndrome200.
Since we do not know enough about South African conditions, it is hard to predict the ultimate economic reserve or the life-span of such a reserve for shale gas. All of these matter when considering what the royalty and environmental levy rates should be. They tell us, in effect, whether economic interests will trump social and environmental interests. Our considerations, as far as economic policy goes, do not only dwell on labour and capital as inputs of production but also on the use of the environment.
The exploitation of resources should take into account damage, loss or other factors that compromise future use and benefit from environmental resources. These tend to be ignored, underestimated or simply used as a subsidy to bolster economic growth and production. Sound governance and fiscal regimes that tame the excesses of rent-seeking are more likely to accommodate proper environmental mitigation measures as well as social development objectives in areas where communities will be most affected by the extractive industries. Income uncertainty from shale plays can be a key characteristic of shale gas because of the different nature of shale-gas wells compared to conventional wells. This makes royalty estimates, other levies and investment of revenues a challenge in areas of the economy dependent on oil or gas revenues.
Ideally, oil and gas rights should be put out for bid201 202. This is not a practice in South Africa as allocation of exploration rights has been done on a first-come-first-serve basis. Companies that value the resource most and have had proven track records in sound environmental practice should be preferred bidders. In general, oil and gas industries tend to generate surpluses depending on production costs and the global prices of oil and gas. These surpluses or super-profits are not a
36
result of effort, but rather of market conditions and national governments have a right to a part of these revenue streams. Experience with the development and exploitation of North Sea oil and gas provide useful examples of how Britain and Norway developed these reserves or frontier petroleum fields where the risks were high during the early prospecting and development phases. In the early phases, both the Norwegian and British governments avoided equity and operational participation. They had private companies take on the risk of establishing the new oil and gas fields. Fields that had high levels of certainty were put out for bids for exploration and production licences. Private companies, in turn, managed the risk by creating diverse consortia. As risks of proving the reserves declined, more state participation could be seen and in Norway it became mandatory.
Norway’s state participation took the form of ‘carried interest’ during the exploration phase. It allowed the state to exercise the option of holding a participation share in the development and production phase as well. In essence, the state carried none of the risk during exploration. As risks fell even further, both the UK and Norwegian governments increased their participation with Norway forming Statoil in 1972 and nationalising its resource base. At first Statoil operated as an investment arm of the state. Later it was entitled to a 50% carried interest in all new exploration blocks. Britain followed suit but did so more gradually. Norway’s Statoil became an active oil and gas operator holding the high potential blocks. However, Britain privatised its national oil company and Norway did not203. These different approaches and economic policy regimes have led to very different development pathways and beneficiation outcomes as we can see today.
Oil and gas resource endowments do not easily translate into resource entitlements for citizens. There is always the danger of capture of these rents by more politically connected and moneyed interests. The exploitation of natural resources also has costs and risks that can be apportioned unfavourably within a political-economy that has entitlement regimes which are exclusive by nature. The efficient capture of resource rents by the State can finance government expenditure when the development backlog in a country is acute. Some of these endowments and entitlements are not only in the form of social transfers, but also in ensuring that environmental and health risks are mitigated or proper provisions are made to deal with them in the long term. This is both a question of the design of the redistribution model, and also, critically, the governance and accountability over such expenditures.
The South African oil and gas plays, especially shale gas, currently suffer from a trust deficit. The credibility of accountability measures are not believable by the public given the widespread prevalence of corruption and political scandals that have been the focus of media attention in South Africa.
Paul Segal, in his examination of fiscal policy regimes in Mexico204, provides a useful framework for thinking through oil and gas rents and entitlements. Segal proposes205 that the measure of success of oil and gas policies, as far as the accruing of rents go from these resources, is not only the market income, but the degree to which citizen entitlements are enhanced and advanced through various forms of social expenditure during the life of the resource base.206 Entitlements themselves are conditional on oil revenues and therefore the decision to consume or save these revenues are important long term planning issues that the state must undertake.
One of the glaring problems with Shell’s Econometrix study207 is that it shows market income and optimistic figures for jobs, but fails to really grapple with issues of inequality and redistribution under the current political-economy in South Africa208. It assumes entitlements are automatic and seamless between the exploitation of resources and the way revenues are appropriated and accrued within a given economy.
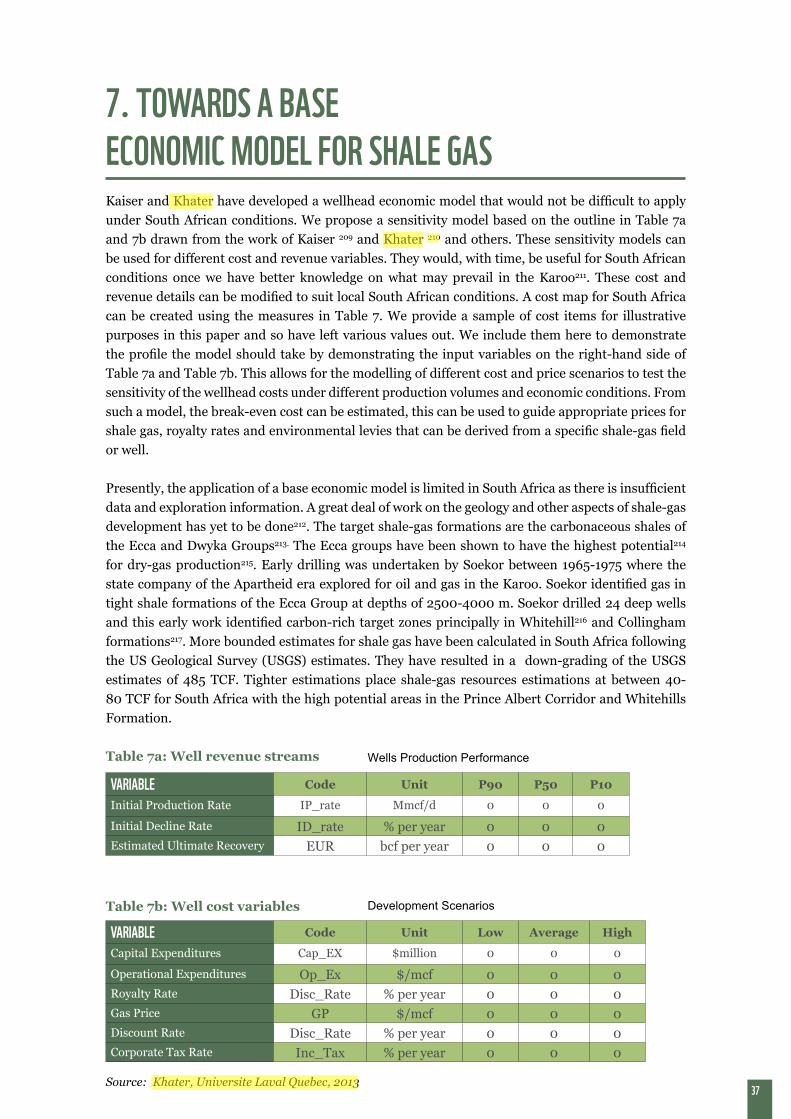
37
7. TOWARDS A BASE ECONOMIC MODEL FOR SHALE GASKaiser and Khater have developed a wellhead economic model that would not be difficult to apply under South African conditions. We propose a sensitivity model based on the outline in Table 7a and 7b drawn from the work of Kaiser 209 and Khater 210 and others. These sensitivity models can be used for different cost and revenue variables. They would, with time, be useful for South African conditions once we have better knowledge on what may prevail in the Karoo211. These cost and revenue details can be modified to suit local South African conditions. A cost map for South Africa can be created using the measures in Table 7. We provide a sample of cost items for illustrative purposes in this paper and so have left various values out. We include them here to demonstrate the profile the model should take by demonstrating the input variables on the right-hand side of Table 7a and Table 7b. This allows for the modelling of different cost and price scenarios to test the sensitivity of the wellhead costs under different production volumes and economic conditions. From such a model, the break-even cost can be estimated, this can be used to guide appropriate prices for shale gas, royalty rates and environmental levies that can be derived from a specific shale-gas field or well.
Presently, the application of a base economic model is limited in South Africa as there is insufficient data and exploration information. A great deal of work on the geology and other aspects of shale-gas development has yet to be done212. The target shale-gas formations are the carbonaceous shales of the Ecca and Dwyka Groups213. The Ecca groups have been shown to have the highest potential214 for dry-gas production215. Early drilling was undertaken by Soekor between 1965-1975 where the state company of the Apartheid era explored for oil and gas in the Karoo. Soekor identified gas in tight shale formations of the Ecca Group at depths of 2500-4000 m. Soekor drilled 24 deep wells and this early work identified carbon-rich target zones principally in Whitehill216 and Collingham formations217. More bounded estimates for shale gas have been calculated in South Africa following the US Geological Survey (USGS) estimates. They have resulted in a down-grading of the USGS estimates of 485 TCF. Tighter estimations place shale-gas resources estimations at between 40-80 TCF for South Africa with the high potential areas in the Prince Albert Corridor and Whitehills Formation.
Table 7a: Well revenue streams
VARIABLE Code Unit P90 P50 P10
Initial Production Rate IP_rate Mmcf/d 0 0 0
Initial Decline Rate ID_rate % per year 0 0 0Estimated Ultimate Recovery EUR bcf per year 0 0 0
VARIABLE Code Unit Low Average High
Capital Expenditures Cap_EX $million 0 0 0
Operational Expenditures Op_Ex $/mcf 0 0 0Royalty Rate Disc_Rate % per year 0 0 0Gas Price GP $/mcf 0 0 0Discount Rate Disc_Rate % per year 0 0 0Corporate Tax Rate Inc_Tax % per year 0 0 0
Wells Production Performance
Development ScenariosTable 7b: Well cost variables
Source: Khater, Universite Laval Quebec, 2013
38
8. THE ECONOMIC POTENTIAL AND ENVIRONMENTAL CHALLENGES FOR SOUTH AFRICA
MAIN FINDINGS• Tighter environmental regulation costs are unavoidable to deal with short-term and long
term risks. • Transparency of chemicals used for fracking is important. • The potential of seismic trigger effects are not well understood in South Africa. • Poorly designed reclamation provisions can prove to be insufficient to deal with externality
costs. • The impact of a carbon tax must be considered.• Economic value is dependent on economic beneficiation. • Job numbers are likely to peak from the development of shale-gas reserves to well completion
and rapidly decline during the production phase. • Expectations of high direct jobs do not match reality and do not seem realisable in the future
either but midstream and downstream secondary, tertiary and induced jobs have the potential to be high if the resource is significant.
Exploration applications cover an extensive 40 – 70% of South Africa’s surface area218. The economic reserve is still to be determined219. Some assessments paint a less optimistic picture for South African shale and CBM based on full cycle economics220. Model break-even prices221 have been estimated at US$11.93/mcf for shale and US$13.33/mcf for CBM222. Our own analysis of the literature and drawing from the perspectives of others suggest that even at $7/mcf, shale is uneconomical and prices will have to be higher for the gas drilling to be financially viable. We cannot discount observation from some geologists that much of the gas has already been burnt off223 or leaked due to doleritic intrusions224 225 in parts of the Karoo.
We have largely focused our analysis on upstream costs – in this case the wellhead costs and their economic dynamics as they pertain to shale gas. Further work needs to be done on various environmental costs226 like water treatment, ensuring proper methane capping227 reclamation costs for fractured sites after gas production, and road haulage damage228. There have also been studies on the life-cycle carbon footprint of shale gas. The Department of Environmental Affairs commissioned a study that shows that the carbon footprint is higher if the gas is exported when compared to using it for electricity and other purposes. The main reason being that domestic consumption displaces the use of coal229.
8.1 ENVIRONMENTAL COSTSEnvironmental costs will be an important and significant cost variable as they have shown to increase in the US over time and as drilling expands to more densely populated areas. One estimate put tighter environmental regulation costs in the US at $500 000 per well230. We see these as unavoidable as mitigating environmental damage in the Karoo has to be a key condition for fracking. Appropriate mitigation will require good baseline studies for methane, brine and other chemicals to ensure traceabiity of source231 and identification of liability232. Transparency of the chemicals used for fracking would need to be part of the regulatory regime233. In the US, some states have a specific haulage levy or bonds so that costs associated with road damage can be recovered from shale-gas companies.
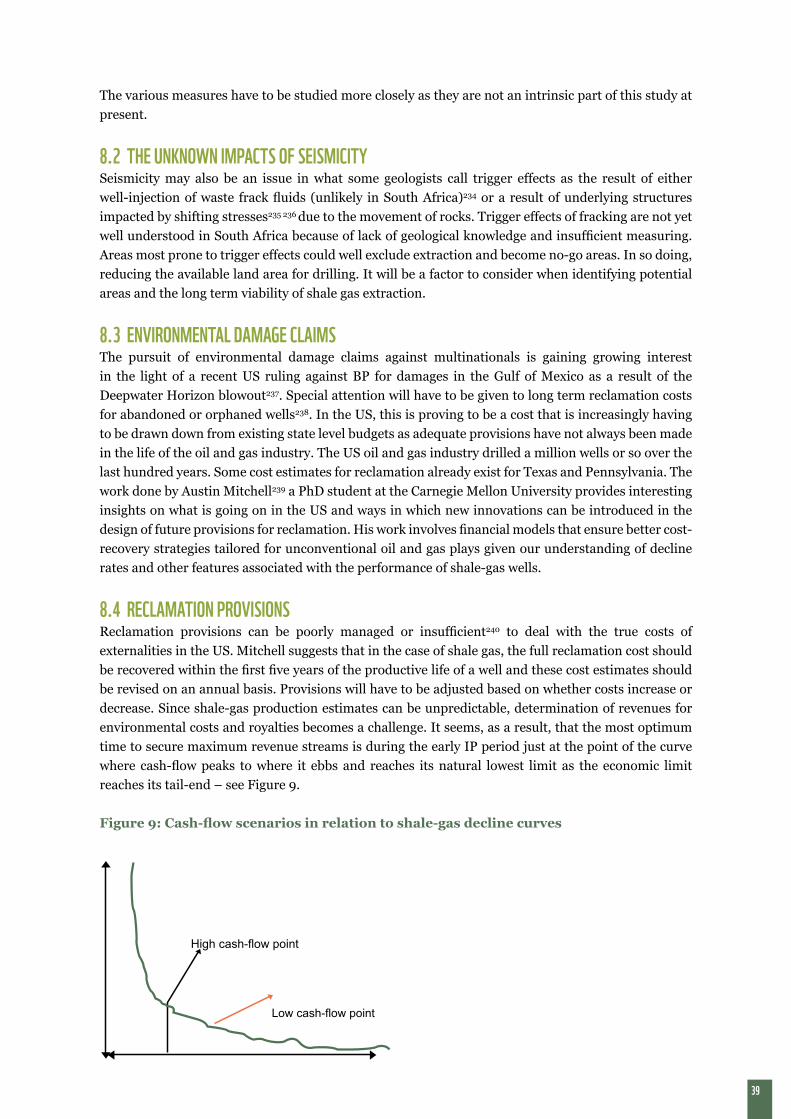
39
The various measures have to be studied more closely as they are not an intrinsic part of this study at present.
8.2 THE UNKNOWN IMPACTS OF SEISMICITYSeismicity may also be an issue in what some geologists call trigger effects as the result of either well-injection of waste frack fluids (unlikely in South Africa)234 or a result of underlying structures impacted by shifting stresses235 236 due to the movement of rocks. Trigger effects of fracking are not yet well understood in South Africa because of lack of geological knowledge and insufficient measuring. Areas most prone to trigger effects could well exclude extraction and become no-go areas. In so doing, reducing the available land area for drilling. It will be a factor to consider when identifying potential areas and the long term viability of shale gas extraction.
8.3 ENVIRONMENTAL DAMAGE CLAIMSThe pursuit of environmental damage claims against multinationals is gaining growing interest in the light of a recent US ruling against BP for damages in the Gulf of Mexico as a result of the Deepwater Horizon blowout237. Special attention will have to be given to long term reclamation costs for abandoned or orphaned wells238. In the US, this is proving to be a cost that is increasingly having to be drawn down from existing state level budgets as adequate provisions have not always been made in the life of the oil and gas industry. The US oil and gas industry drilled a million wells or so over the last hundred years. Some cost estimates for reclamation already exist for Texas and Pennsylvania. The work done by Austin Mitchell239 a PhD student at the Carnegie Mellon University provides interesting insights on what is going on in the US and ways in which new innovations can be introduced in the design of future provisions for reclamation. His work involves financial models that ensure better cost-recovery strategies tailored for unconventional oil and gas plays given our understanding of decline rates and other features associated with the performance of shale-gas wells.
8.4 RECLAMATION PROVISIONSReclamation provisions can be poorly managed or insufficient240 to deal with the true costs of externalities in the US. Mitchell suggests that in the case of shale gas, the full reclamation cost should be recovered within the first five years of the productive life of a well and these cost estimates should be revised on an annual basis. Provisions will have to be adjusted based on whether costs increase or decrease. Since shale-gas production estimates can be unpredictable, determination of revenues for environmental costs and royalties becomes a challenge. It seems, as a result, that the most optimum time to secure maximum revenue streams is during the early IP period just at the point of the curve where cash-flow peaks to where it ebbs and reaches its natural lowest limit as the economic limit reaches its tail-end – see Figure 9.
Figure 9: Cash-flow scenarios in relation to shale-gas decline curves
High cash-flow point
Low cash-flow point
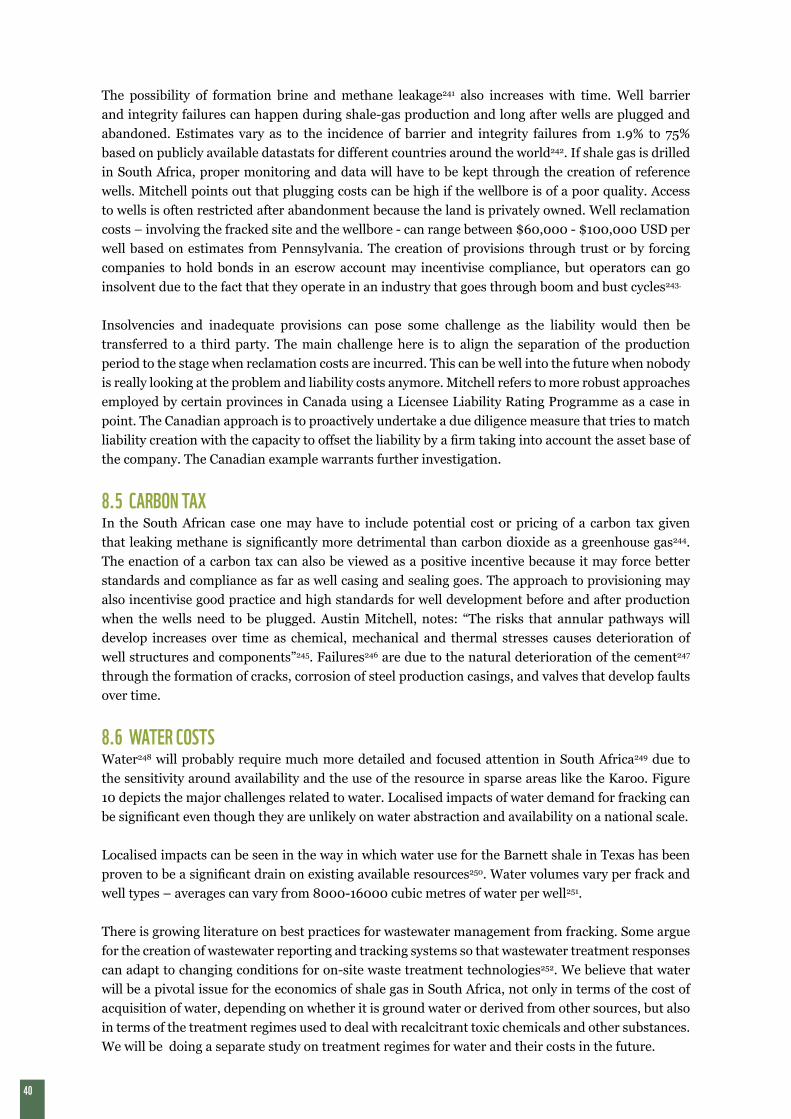
40
The possibility of formation brine and methane leakage241 also increases with time. Well barrier and integrity failures can happen during shale-gas production and long after wells are plugged and abandoned. Estimates vary as to the incidence of barrier and integrity failures from 1.9% to 75% based on publicly available datastats for different countries around the world242. If shale gas is drilled in South Africa, proper monitoring and data will have to be kept through the creation of reference wells. Mitchell points out that plugging costs can be high if the wellbore is of a poor quality. Access to wells is often restricted after abandonment because the land is privately owned. Well reclamation costs – involving the fracked site and the wellbore - can range between $60,000 - $100,000 USD per well based on estimates from Pennsylvania. The creation of provisions through trust or by forcing companies to hold bonds in an escrow account may incentivise compliance, but operators can go insolvent due to the fact that they operate in an industry that goes through boom and bust cycles243.
Insolvencies and inadequate provisions can pose some challenge as the liability would then be transferred to a third party. The main challenge here is to align the separation of the production period to the stage when reclamation costs are incurred. This can be well into the future when nobody is really looking at the problem and liability costs anymore. Mitchell refers to more robust approaches employed by certain provinces in Canada using a Licensee Liability Rating Programme as a case in point. The Canadian approach is to proactively undertake a due diligence measure that tries to match liability creation with the capacity to offset the liability by a firm taking into account the asset base of the company. The Canadian example warrants further investigation.
8.5 CARBON TAXIn the South African case one may have to include potential cost or pricing of a carbon tax given that leaking methane is significantly more detrimental than carbon dioxide as a greenhouse gas244. The enaction of a carbon tax can also be viewed as a positive incentive because it may force better standards and compliance as far as well casing and sealing goes. The approach to provisioning may also incentivise good practice and high standards for well development before and after production when the wells need to be plugged. Austin Mitchell, notes: “The risks that annular pathways will develop increases over time as chemical, mechanical and thermal stresses causes deterioration of well structures and components”245. Failures246 are due to the natural deterioration of the cement247
through the formation of cracks, corrosion of steel production casings, and valves that develop faults over time.
8.6 WATER COSTSWater248 will probably require much more detailed and focused attention in South Africa249 due to the sensitivity around availability and the use of the resource in sparse areas like the Karoo. Figure 10 depicts the major challenges related to water. Localised impacts of water demand for fracking can be significant even though they are unlikely on water abstraction and availability on a national scale.
Localised impacts can be seen in the way in which water use for the Barnett shale in Texas has been proven to be a significant drain on existing available resources250. Water volumes vary per frack and well types – averages can vary from 8000-16000 cubic metres of water per well251.
There is growing literature on best practices for wastewater management from fracking. Some argue for the creation of wastewater reporting and tracking systems so that wastewater treatment responses can adapt to changing conditions for on-site waste treatment technologies252. We believe that water will be a pivotal issue for the economics of shale gas in South Africa, not only in terms of the cost of acquisition of water, depending on whether it is ground water or derived from other sources, but also in terms of the treatment regimes used to deal with recalcitrant toxic chemicals and other substances. We will be doing a separate study on treatment regimes for water and their costs in the future.
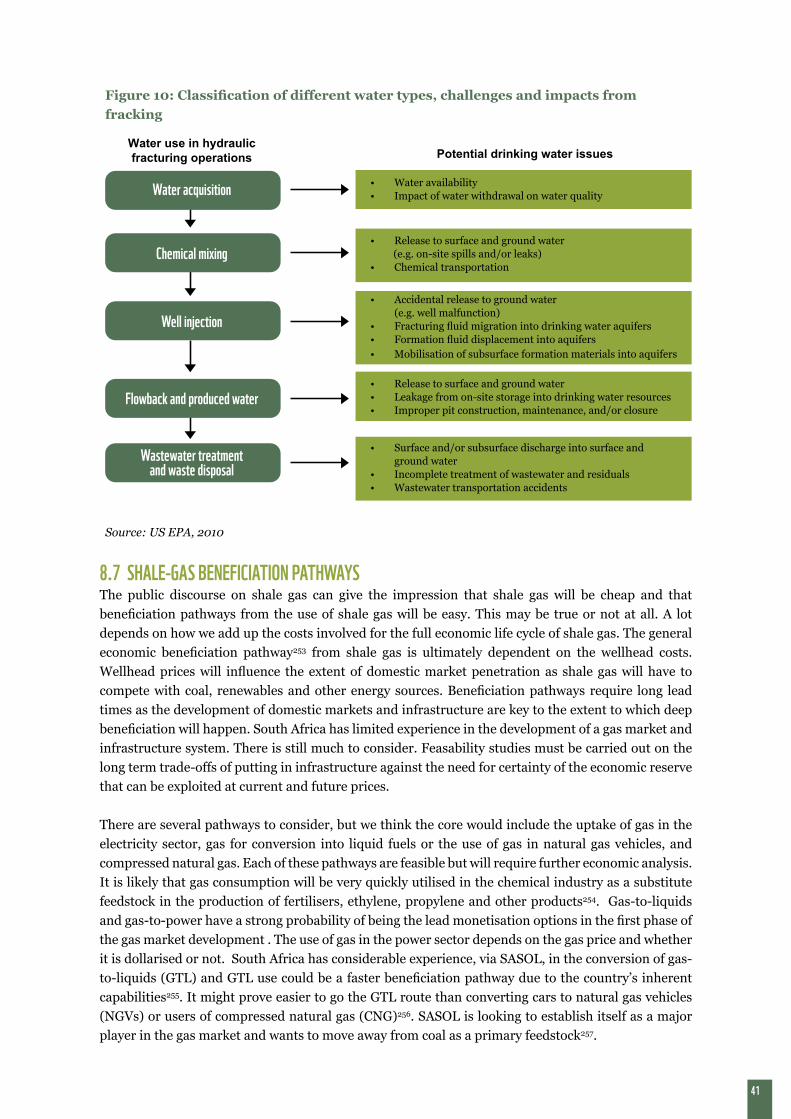
41
Figure 10: Classification of different water types, challenges and impacts from fracking
Source: US EPA, 2010
Water use in hydraulic fracturing operations
Water acquisition
Chemical mixing
Well injection
Flowback and produced water
Wastewater treatment and waste disposal
Potential drinking water issues
• Water availability• Impact of water withdrawal on water quality
• Release to surface and ground water (e.g. on-site spills and/or leaks)• Chemical transportation
• Release to surface and ground water• Leakage from on-site storage into drinking water resources• Improper pit construction, maintenance, and/or closure
• Surface and/or subsurface discharge into surface and ground water
• Incomplete treatment of wastewater and residuals • Wastewater transportation accidents
• Accidental release to ground water (e.g. well malfunction)
• Fracturing fluid migration into drinking water aquifers• Formation fluid displacement into aquifers• Mobilisation of subsurface formation materials into aquifers
8.7 SHALE-GAS BENEFICIATION PATHWAYSThe public discourse on shale gas can give the impression that shale gas will be cheap and that beneficiation pathways from the use of shale gas will be easy. This may be true or not at all. A lot depends on how we add up the costs involved for the full economic life cycle of shale gas. The general economic beneficiation pathway253 from shale gas is ultimately dependent on the wellhead costs. Wellhead prices will influence the extent of domestic market penetration as shale gas will have to compete with coal, renewables and other energy sources. Beneficiation pathways require long lead times as the development of domestic markets and infrastructure are key to the extent to which deep beneficiation will happen. South Africa has limited experience in the development of a gas market and infrastructure system. There is still much to consider. Feasability studies must be carried out on the long term trade-offs of putting in infrastructure against the need for certainty of the economic reserve that can be exploited at current and future prices.
There are several pathways to consider, but we think the core would include the uptake of gas in the electricity sector, gas for conversion into liquid fuels or the use of gas in natural gas vehicles, and compressed natural gas. Each of these pathways are feasible but will require further economic analysis. It is likely that gas consumption will be very quickly utilised in the chemical industry as a substitute feedstock in the production of fertilisers, ethylene, propylene and other products254. Gas-to-liquids and gas-to-power have a strong probability of being the lead monetisation options in the first phase of the gas market development . The use of gas in the power sector depends on the gas price and whether it is dollarised or not. South Africa has considerable experience, via SASOL, in the conversion of gas-to-liquids (GTL) and GTL use could be a faster beneficiation pathway due to the country’s inherent capabilities255. It might prove easier to go the GTL route than converting cars to natural gas vehicles (NGVs) or users of compressed natural gas (CNG)256. SASOL is looking to establish itself as a major player in the gas market and wants to move away from coal as a primary feedstock257.
42
8.8 THE IMPACT OF SHALE GAS ON SOUTH AFRICA’S GDPAs far as the effects of exploiting shale gas in South Africa on GDP go, this will depend on the size of the resource, the value of the resource and the pace of resource extraction. Domestic supply would offset foreign imports of oil and gas. These would have balance-of-payment benefits. But the depth of economic value is dependent on the depth of beneficiation, as we can already see for other extractives in South Africa. The higher the levels of beneficiation, the more secondary, tertiary and induced jobs will be created. The general impacts of shale gas on the US economy have been analysed elsewhere. Long term impacts from shale gas have been estimated to be around 0.84% of US GDP between 2012 and 2035 258. The impacts are small in relation to the rest of the US’s sizeable economy. In the US there will also not be dramatic effects on manufacturing either, as is often implied, as the influence of cheap gas on industry and manufacturing is selective, mostly limited to industries switching fuel from coal or substituting for oil-indexed products like naptha259 for cheap gas in the fertiliser and plastics industry. The US is primarily a service-based economy. The service sector accounts for 83% of total employment – an increase in share from 60% since 1947260. For manufacturing to return to the US, other factors than gas price will play a role, such as corporate tax rates, labour costs and other variables.
Electricity markets are complicated as fuel costs are only a portion of the electricity price structure261. Other costs relate to transmission, distribution and taxes or levies. A study by the Institute for Sustainable Development and International Relations (IDDRI) shows that no major GDP, manufacturing or electricity price effects are evident, while other studies suggest the opposite.262. It is unlikely that utilities will have a tendency to transfer these benefits to consumers if gas prices are low compared to other fuels. This is especially true in a country like South Africa where full cost recovery – through the tariff system – remains a challenge. The question of whether US gas prices will stay low in the next decade or more is debatable.
8.9 JOB CREATION POTENTIAL OF SHALE GASThis report has not gone into the details of job numbers, but preliminary work shows that job numbers peak from the development of shale-gas reserves to the well completion period and rapidly decline during the production phase. Fracking is highly industrialised and a high skill industry. Expectations of high direct jobs do not match the reality of technology developments in the shale-gas industry at present and in the future. The levels of mechanisation and automation are high and are expected to increase as fracking technologies evolve. Available studies on job numbers can often be hard to disentangle as assumptions about direct, indirect and induced job numbers vary between studies263. These assumptions will influence how one reads the relevance of economic multiplier models used to determine job numbers in various studies. Some of these assumptions depend on total revenues generated264 and expectations of spend in a local economy265 266.
More realistic numbers for jobs can be determined for direct jobs per well and ancillary services associated during the well production period like transportation, maintenance, wastewater management, hospitality etc. Other economic impacts include wage differentials between high-skilled and low-skilled workers, impacts on property prices267 and labour migration patterns of outsiders versus insiders (and the social consequences thereof) due to the transitory employment effects of extraction268. Nonetheless, most of the claims regarding the long term economic boost of the US economy from cheap shale gas need to be treated with some caution as a short-term boom may not be a sign of long term trends. There other structural issues in the US economy that will not be resolved by a transient shale-gas boom. The US, like Europe and Japan, is going through what is referred to as ‘secular stagnation’ following the 2008 financial crisis. Since oil and gas account for only a small portion of the US economy, broader economic prospects are dependent on demographics, debt levels, saving rate, education and innovation269. These structural issues are also relevant for South Africa. While energy costs play a role, it is worth stressing here that they are not the sole input costs that determine the level of economic activity and growth.
43
9. CONCLUDING HIGH-LEVEL ASSESSMENTOur findings are preliminary. Due to the lack of quality data for South Africa our assessment takes a more conservative view of shale-gas prospects. The assessment is not definitive as our reflections are based on what we understand from the US experience. In summary:
1. Shale gas, by definition, is a marginal resource as its exploitation is reliant on high gas or oil prices, generous or reasonable tax incentives and other factors, coming together in a seamless manner;
2. The idea that gas will be cheap mimicking US Henry Hub prices reflects a misunderstanding of gas monetisation in the US as this is not applicable to South Africa. Preliminary findings from drilling attempts in other countries have shown that extraction costs have been higher than anticipated;
3. Due to its inherently marginal economics, the incentive to export the gas will most likely be a greater probability under South African conditions as the arbitrage value to the highest paying market is the only economically viable option for shale-gas extraction if domestic gas prices cannot compete with export prices and other energy sources;
4. Export prospects of shale gas grow in South Africa if integration into the domestic economy and high levels of beneficiation are not forthcoming or have lead times which are too long;
5. There is a possibility that if the economics of shale gas works out, shale gas could be a complementary component of an off-shore and regional integrated gas market. On its own, shale gas is likely be a tough prospect because of other needs like pipelines, storage and other infrastructure;
6. The economic viability of shale-gas extraction is based on success rates of drilling and fracking techniques. Break-even margins are dependent on cost reductions in well development and completion, effectiveness and efficiency. The levels of cost-savings that can be achieved are uncertain;
7. Long term technology trends and learning rate improvements could shift the economics and make it more positive. However, there is a great deal of uncertainty regarding how these trends will affect the underlying economics if other standard cost variables are also changing;
8. The regulatory environment for South Africa – because of environmental externality issues and water security concerns – should be founded on the highest standards of best practice. In the Karoo, high environmental standards are necessary and government public justification to exploit a resource like shale has to be measured in terms of the various trade-offs discussed above. These include benefit to the fiscus, job creation, localisation potential, environmental impacts and the long term sustainability and resilience of the South African economy;
9. The balance of private versus public interest will influence the economic viability. The tension between these two contending and sometimes converging interests are not always easy to resolve or reach a consensus on;
10. Water acquisition costs and the treatment of frack wastewater will add additional burdens to cost management. Water treatment is essential as frack fluids which contain formation water
44
will include harmful chemicals such as bromide, radium and arsenic that will have to be properly disposed of. These disposal costs are not well established at present and will be determined by the chemical composition of flowback water and the model and technology of the treatment regime that would have to be applied to safely dispose of wastewater;270
11. The reclamation provisions model and method of provisioning will be necessary not only to deal with rehabilitation of frack sites, but also long-term well failure and degradation. These tend to be liabilities that are transferred to the public long after production has been completed. Reclamation provisions, either through trusts or bond guarantees, will have to be closely studied and designed to accommodate the aftermath of fracking even though wells are closed and plug experience shows that well integrity and failures will happen.
Based on these preliminary assessments the commercial financial viability of shale gas will be challenging and the success of gas extraction will depend on good knowledge of the geology, efficient application of the technology, the pricing of gas and ensuring sufficiently high standard of measures are taken to deal with both short-term and long term environmental impacts. The economics depends on how the five drivers we have identified above converge. They can well facilitate the economics of shale gas or prove to limit and hinder the success and commercial viability of fracking. In the interim the conclusion we draw is that the full commercial exploitation of shale gas in South Africa seems like a distant, if not unlikely, prospect.
45
REFERENCES AND FOOTNOTES1. See Goodell, J. March 2012. The Big Fracking Bubble: The Scam Behind the Gas Boom. Rolling Stone. [Online] Available
at: http://www.rollingstone.com/politics/news/the-big-fracking-bubble-the-scam-behind-the-gas-boom.
2. It is often said that fracking is an old technology. This is partially true. J.B. Clarke, an employee of Stanolind Oil and Gas Company in Tulsa, first introduced the technique in 1947. Clarke discovered the technique while working on the Hugoton Gas Field, a gas well in Kansas, and captured the experience in a paper titled “Hydrafrack”. However, it was only much later that Clarke’s technique evolved into both vertical and horizontal fracking and it is the combination of these two fracking methods that has been key to optimising gas recovery rates in shale gas formations. Therefore, what distinguishes Clarke’s early discovery from modern day fracking is the combination of vertical and horizontal fracks at significantly deeper depths, a process that has now become completely industrialised. A patent for this process was later granted to Halliburton Oil Well Cementing Company.
3. Maugeri, L. June 2013. The Shale Oil Boom: A US Phenomena. The Geopolitics of Energy Project, Belfer Centre, Harvard Kennedy School, U.S.
4. Former Secretary of State Hilary Clinton was very keen to ensure that US companies export their new hydraulic fracturing techniques as recently leaked documents have shown. This led to the creation of the Global Shale gas Initiative. For more information, see Blake, M. 10 September 2014. How Hillary Clinton’s State Department Sold Fracking to the World. Guardian Environment Network, The Guardian. [Online] Available at: http://www.theguardian.com/environment/2014/sep/10/how-hillary-clintons-state-department-sold-fracking-to-the-world.
5. Unconventional shale oil fields discovered in 2007 in Chicontepec in northeast Mexico have proven recalcitrant. Despite having invested almost $4.5 billion, PEMEX, the Mexican state owned oil company, has struggled to unlock these reserves which are estimated to hold around 60.2 billion barrels of shale oil. What makes Chicontepec interesting is that it shares proximity to the EagleFord and Woodford shale plays in Texas. For more information see Sen, A and Upadhyay, S. June 2014. Awaiting the Mexican Wave: Challenges to Energy Reforms and Raising Oil Output. The Oxford Institute for Energy Studies (OIES), Oxford, U.K.
6. The cost of drilling an average well in Poland is around $11million. This compared to an average of $3.9 million per well in the US. For more information see Strzelecki, M. November 29, 2011. ‘ Drilling Cost in Poland Triple US, Schlumberger Says. Bloomberg. [Online] Available at: http://www.bloomberg.com/news/2011-11-29/shale gas-drilling-cost-in-poland-triple-u-s-schlumberger-says.html. For a specific Continental Europe appraisal, the following paper provides some useful insights on the conditions that influence commercial viability and the challenge to unlock shale gas economics if these enabling conditions are not available. See Weijemers, R (2013) Economic Appraisal of shale gas plays in Continental Europe, Applied Energy, 106: 100-115.
7. China had drilled 178 shale gas wells by the end of October 2013. However, unlocking its shale gas reserves has proven difficult. Some of the main challenges China has faced include a lack of geological knowledge; a lack of experience with the technology; the need for legislative reforms; the slow pace of infrastructure development; and environmental and social concerns associated with the development of major shale plays in densely populated areas. For more information see Xiaoli, L. February 2014. US Shale gas Development and Challenges in China. OIES Energy Forum 95. Oxford Institute for Energy Studies (OIES), Oxford, U.K. See also Bullis, K. December 11, 2012. China Has Plenty of Shale gas, But It Will Be Hard to Mine. MIT Technology Review. Massachusetts Institute of Technology (MIT), Cambridge, U.S. [Online] Available at: http://www.technologyreview.com/news/508146/china-has-plenty-of-shale gas-but-it-will-be-hard-to-mine/
8. Xiong, H and Holditch, S.A. 2006. Will Blossom of Unconventional Natural Gas Development in North America Repeat in China? SPE 103775. The Society of Petroleum Engineers (SPE International).
9. Burgess, J. December 20, 2012. Second Interim Report on Shale gas Financial Modelling. Australian Council of Learned Academies (ACOLA), Australia. [Online] Available at: http://www.acola.org.au/PDF/SAF06Consultants/Burgess%20Report20th%20December%202012%20Financial%20Modelling.pdf. The report’s financial modelling suggests that shale gas production in Australia will be 3 to 4 times higher than in the US.
10. China has onerous licensing and permitting requirements. Exploration rights are limited to renewable 3-year leases with stipulated target capital expenditure per km2. China has the largest shale gas-in-place, around 5100 TCF and technically recoverable resource of about 1275 TCF. Most foreign players must sign joint ventures with Chinese firms. China’s shale sources are deeper than US shale plays and in areas of high seismicity. The main geographic locations are the Sichuan, Tarim, Junggar and Songliao basins. Most of the terrain is mountainous and difficult to access. Depths range from 3-5000 meters and even up to 8000 meters in some areas. Water is the biggest constraining factor for Chinese shale formations. Currently, gas prices in China range from $8-12/mcf depending on whether you are inland or at the coast. However, LNG prices that are imported from Qatar are close to $19/mcf at May 2013 prices. See Chou, L. July 11, 2013. Shale gas in China: Development and Challenges (draft). [Online] Available at: http://blogs.law.harvard.edu/ellachou/files/2013/07/Shale gas-in-China-Draft.pdf.
11. See Deutsche Bank. 20 October, 2011. European Gas: A First Look at EU Shale gas Prospects. Global Markets Research, Deutsche Bank.
12. Nelder, C. December 29, 2011. What the Frack: Is There Really 100 Years’ Worth of Natural Gas Beneath the
46
United States? Slate.com, U.S. [Online] Available at: http://www.slate.com/articles/health_and_science/future_tense/2011/12/is_there_really_100_years_worth_of_natural_gas_beneath_the_united_states_.html.
13. See Foreign Affairs. May/June, 2014. Big Fracking Deal: Shale and the Future of Energy. Council on Foreign Relations. A large part of the issue covers topics dealing with the US shale gas revolution.
14. Powers, B. 2013. Cold, Hungry and in the Dark: Exploding the Natural Gas Supply Myth. New Society Publishers, USA. See also Crooks, E. August 29, 2014. Shale gas: What Lies Beneath.Financial Times. [Online] Available at: http://www.ft.com/intl/cms/s/0/e178031e-2cf4-11e4-8105-00144feabdc0.html#axzz3FrF64MuT.
15. See Powers, B. March 9, 2014. The Popping of the Shale gas Bubble. Forbes. [Online] Available at: http://www.forbes.com/sites/billpowers
16. The growth in crude oil production in the US has been phenomenal. Shale and tight oil plays will contribute a million barrels per day by 2014 from a position of negative growth in 2008. From 2008-2013 the US added around 800 000 barrels/day of NGLs and production exceeded 2.5 million barrels per day in 2013. The EIA predicts shale and tight oil production will reach 4.8 million barrels per day by 2021 comprising 50% of total US production. They have reversed historical declines in crude oil production from 7.3 million barrels per day in 2007 to about 12.6 million barrels per day in 2013. Interestingly, US gasoline consumption has declined from its peak in 2007 at 9.3 million barrels per day to 8.7 million barrels per day. Dependence on imports has declined from 10 million barrels per day in 2007 to 7.6 million barrels per day in 2013. The share of imports from the Middle East has dropped to 25% from 30% as a result, but the share of imports from Canada has increased from 10% in 1990 to 33% in 2013. There are price differentials between imports and exports. Domestic oil is cheaper even though it is indexed against the West Texas Intermediate and Brent Crude oil indices. This is partly due to the fact that there is also a surplus of supply and producers want to get rid of stock fast. See Fatouh, B. October 2014. The US Tight Oil Revolution and Its Impact on the Gulf Cooperation Council Countries: Beyond the Supply Shock. OIES Paper WPM 54. Oxford Institute for Energy Studies (OIES), Oxford, U.K. The paper gives a more optimistic outlook on US shale-oil production. Irrespective, US shale gas production is still a high cost production universe compared to Gulf States.
17. Nolan, P.A. and Thurber, M.C. December 2010. On the State’s Choice of Oil Company: Risk Management and the Frontier of the Petroleum Industry. Working Paper 99. Programme on Energy and Sustainable Development (PESD), Stanford University, USA. [Online] Available at: http://iis-db.stanford.edu/pubs/23057/WP_99,_Nolan_Thurber,_Risk_and_the_Oil_Industry,_10_December_2010.pdf
18. The Economist. October 11, 2014. Unsustainable Energy. [Online] Available at: http://www.economist.com/news/business/21623694-price-oil-has-been-tumbling-cost-finding-it-has-not-unsustainable-energy
19. Deffeyes, K.S. 2001. Hubbert’s Peak: The Impending World Oil Shortage. Princeton University Press, USA.
20. Trembath, A., Jenkins, J., Nordhaus, T. and M. Shellenberger. May 2012. Where the Shale gas Revolution Came From: Government’s Role in the Development of Hydraulic Fracturing in Shale. The Breakthrough Institute, USA. [Online] Available at: http://thebreakthrough.org/blog/Where_the_Shale_Gas_Revolution_Came_From.pdf.
21. Zuckerman, G. 2013. The Frackers: The Outrageous Inside Story of the New Energy Revolution. Portfolio Penguin, Great Britain. This book provides an excellent biographical sketch of the shale gas revolution in the US.
22. Krupnick, A. and Wang, Z. March 2013. US Shale gas Development: What Led to the Boom? Issue Brief 13-04. Resources for the Future (RFF), USA. [Online] Available at: http://www.rff.org/RFF/Documents/RFF-IB-13-04.pdf. They identify key factors such as 3D seismic imaging, micro seismic and fracturing mapping where sensors are used to identify height, length and orientation of induced fractures.
23. See Brown, S.P.A. and Yucel, M.N. October 2013. The Shale gas and Tight Oil Boom: US States, Economic Gains and Vulnerabilities. Council on Foreign Relations (CFR), USA.
24. The Henry Hub is a gas pooling facility based in Louisiana owned by the Sabine Pipeline LLC. It sets the price of gas for the North American gas market.
25. One of the biggest problems with deregulated markets is gas price volatility. Financial instruments such as hedging therefore become key to managing price volatility. However, high volatility may also set limits on contract duration and the level of risk that can be hedged as they become more and more costly.
26. A low gas price is a great advantage to consumers. However, too low a price due to over-production is not beneficial to producers as they cannot recover their break-even costs.
27. See McMahon, J. July 4, 2013. Six Reasons Fracking Has Flopped Overseas. Forbes. [Online] Available at: http://www.forbes.com/sites/jeffmcmahon/2013/04/07/six-reasons-fracking-has-flopped-overseas/
28. The US government in the 1970s defined 0.1 milli-Darcy as the limit for receiving tax credits. Darcy’s Law is not only applicable for permeability, but also fluid pressure, surface area to flow and fluid viscosity.
29. Carratu, J. C. 2013. Sensitivity Of Fractured Horizontal Well Productivity To Reservoir Properties In Shale gas Plays. Master’s Thesis, Department of Petroleum Engineering, Colorado School of Mines at 19. [Online] Available at: http://digitool.library.colostate.edu/view/action/singleViewer.do?dvs=1413209194413~672&locale=en_US&VIEWER_URL=/view/action/singleViewer.do?&DELIVERY_RULE_ID=10&adjacency=N&application=DIGITOOL-3&frameId=1&usePid1=true&usePid2=true.
47
30. Rodgers, J. 2014. In Wyoming State Geological Survey. Conventional vs Unconventional Reservoirs. [Online] Available at: http://www.wsgs.uwyo.edu/research/energy/oil-gas/Reservoirs.aspx.
31. See Ozgul, E. August 2002. Geochemical Assessment of Gaseous Hydrocarbons: Mixing of Bacterial and Thermogenic Methane in the Deep Subsurface Petroleum System, Gulf of Mexico Continental Slope. Master’s thesis, Texas A&M University. [Online] Available at: http://repository.tamu.edu/bitstream/handle/1969.1/223/etd-07182002-124338-1.pdf?sequence=1. It contains some useful insights on the difference between thermogenic and bacteriogenic methane sources and how they can be differentiated by means of carbon and hydrogen isotopes. Isotope signatures are chemical forms of identification or fingerprinting. Chemical fingerprinting will be important in establishing liability in cases of well failures. Traceability will allow liability to be assigned to the correct parties during and after fracking. Bacteriogenic sources are usually found in shallower depths with lower temperatures while thermogenic sources are found at much deeper depths where temperatures and pressures are higher. Thermogenic source rocks are characterised by rich total organic content (TOC). They are usually black, calcareous shale which come from argillaceous limestones. Kerogen is an insoluble higher molecular weight molecule while bitumen is the lighter weight solvent. Conversion reactions are determined by temperature, geothermal gradient and time of burial. The thermal maturity of bitumen then determines the oil-to-gas transition. There are four different types of Kerogen (from I-IV). Type I, II and III kerogen is derived from organic material such as algae, plankton and terrestrial plant material. Oil is mostly from sapropelic organic matter (type I and II) and gas from humic sources (type III and IV). Gas wetness is defined by the formula (C2+C3+i-C4+n-C4)/(C1+C2+C3+i-C4+n-C4)*100. See temperature gradients in Figure 2. The molecular composition of gaseous hydrocarbons are seven saturated compounds; methane (C1), ethane (C2), propane (C3), isobutene (i-C4), normal butane (n-C4), iso-pentane (i-C5) and normal pentane (n-C5).
32. A chemical method for breaking hydrocarbons into smaller molecules that can be analysed for their vitrinite reflectance and other properties.
33. See Schlumberger. Oilfield Glossary [Online] Available at: http://www.glossary.oilfield.slb.com/en/Terms.aspx?LookIn=term%20name&filter=total%20organic%20carbon.
34. Vitrinite is a chemical substance found in coal and kerogen. It has a shiny appearance and is derived from the cell walls of wood tissue and plants. It is made up of cellulose, lignin and polymers. Vitrinite reflectance is a technique used to establish the temperature conditions organic material was subjected over geological time. It is useful in establishing thermal maturity and is designated by the metric symbol %Ro.
35. Wet gas is also described as natural gas liquid. This is produced by separating the dry gas from the heavier hydrocarbons, which in this case would be ethane, propane and other NGL condensates. Condensates are more oil based products that can be mixed with gasoline in refineries. The US generally does not allow for the export of condensates. Ethane production has been substituted for more expensive naptha. Propane is also derived from NGLs and is used to produce Liquid Petroleum Gases (LPG). Ethane is a gaseous mix and is used by the domestic petrochemical industry as a feedstock for the production of ethylene. Ethane steam crackers are used to break down hydrocarbon bonds to produce what is called olefins which are the chemical building blocks for plastics, synthetic rubber and other petrochemical products. Ethane feedstock economics is also an improvement on naptha as a higher volume ethylene can be generated from a smaller stock of ethane compared to naptha (for ethane it is around 80% compared to 25-30% for naptha). In the processing of NGLs, producers can choose to recover ethane or not depending on domestic ethylene prices. The US petrochemicals industry is the only source of ethane demand at present. On the other hand, the US is fast developing as a major exporter of LPG. See a very useful paper by Fattouh, B. and Brown, C. September 2014. US NGLs Production and Steam Cracker Substitution: What will the Spillover Effects Be in Global Petrochemical Markets? The Oxford Institute for Energy Studies (OIES), Oxford, UK.
36. Passey, Q.R., Bohacs, K.M., Esch, W.L., Klimentidis, R. and S. Sinha. 2010. From Oil-Prone Source Rock to Gas-Producing Shale Reservoir – Geologic and Petrophysical Characterization of Unconventional Shale gas Reservoirs. Paper presented at the CPS/SPE International Oil and Gas Conference and Exhibition, Beijing, China 8-10 June 2010.
37. Well spacing is also important in ensuring that economic reserve estimates are more accurate and in reducing the
possibility of connectivity and sharing between wells.
38. Understood as water that is naturally found in the pores of rock or rock matrices due to natural seepage from surface or subsurface sources. Formation water may not be the original water present when the rock water itself was created. This is called connate or fossil water. Formation water is also different from produced water. Produced water is a term generally used to describe water that is produced as a by-product during oil and gas extraction.
39. Deshpande, V.P. December 2008. General Scientific Criteria for Shale gas Reservoirs and Production Data of Barnett Shale. Thesis submitted for Master of Science to the Office of Graduate Studies at the Texas A & M University.
40. High pressure fluids result in fracture zones from the location of the fracture to areas with the least resistance. There are three types of fractures: Mode I, crack fracture propagates in the normal direction away from each other, Mode II, fracture propagates through shearing by means of a sliding mechanism away from each other and Mode III, fracture propagates through shearing but by tearing away from one another. Mode I is the most common type of fracture in hydraulic fracturing. See, Knudsen, M.J. 2012. Extraction of Natural Gas by Hydraulic Fracturing. Thesis submitted for the degree of Bachelor of Science, University of Florida.
41. See http://www.gasfrack.com/ for more information on LPG fracking methods. GasFrack Energy Services is a Canadian company which tested LPG as a substitute for water. There are only about 2000 wells or so being tested using LPG. About
48
95% of wells continue to use water as a frack fluid. LPG allows fracks to be done with propane, butane or pentane. Even if there were improvements in the use of LPG, it is unlikely to be a total solution. LPG is more expensive than water although there are savings later on as you do not have flowback or wastewater to deal with afterwards. It is claimed that LPG fracks produces higher gas yields. These claims have not been independently verified. The LPG used for fracking can also be reused and sold. The disposal of water costs can be around $10/barrel adding to $1-2 million more to wellhead costs.
42. See Wilson, T.B. 2013. GasFrack: A Cost-Benefit Analysis of Hydraulic Fracturing with Liquefied Petroleum Gas Gel. Journal of Technology Law and Policy XIV. [Online] Available at: http://tip.law.pitt.edu.
43. A horizontal well is fracked in stages and these stages can vary. Well longitudes – the length of the horizontal wells - are getting longer and so are the number of frack stages. In other words, starting at the end towards the entrance of the vertical well, the horizontal well is fracked in different phases. The greater the length and the more stages fracked, the more water and other chemicals used.
44. Knudsen, op. cit. note 40 at 26.
45. Hydrochloric Acid (HCl) is usually used to clean the perforations and cement. To prevent corrosion and protect steel casings, inhibitors are used. Breakers are used after proppant transfer to break the gel and allow proppants to be released into fractures.
46. Water is pumped initially to clean the wellbore. The well is then sealed and pressurised to allow water and acid to create fractures. Lubricants are then added to facilitate proppant transfer. Proppants come in different sizes. Once the well has been fractured, more freshwater is pumped into the well to clean out the proppants before gas production can begin. Horizontal wells can use anywhere between 4-to-8 times more water than vertical wells.
47. Some of the early breakthroughs came from the use of slick water fracking. It is a method of fracking using large volumes of water with low proppant, as proppant costs are high. This technique was first invented by the Union Pacific Railroad Corporation and was pioneered in tight gas formations. Slick water fracking helped to reduce costs by 50%. However, it is not always applicable to all geological formations. Some geological formations have weak containment barriers which require high proppant volumes.
48. India and Pakistan are the only countries which grow the guar bean from which guar gum is derived. Guar is currently one of India’s biggest exports.
49. It describes a mixture of chemicals in water drawn from a menu of over 600 or more different chemicals. The chemical formulation used depends on the nature of the frack required. Many of these chemical formulations are trade secrets.
50. Ground Water Protection Council and All Consulting. April 2009. Modern Shale gas Development in the United States. A Primer. Prepared for US Department of Energy, Office of Fossil Energy and National Energy Technology Laboratory, USA.
51. US EPA. June 2010. Hydraulic Fracturing Research Study. U.S. Environmental Protection Agency (US EPA), USA. [Online] Available at: http://www.epa.gov/safewater/uic/pdfs/hfresearchstudyfs.pdf.
52. It generally refers to water that has high salt content or salinity. However, deep water brine can also contain radium, boron, bromide and other chemical salts. Brine that is returned with flowback water also contains formation water. For more information see: Chameides, B. 2013. Fracking Water: It’s Just So Hard to Clean. National Geographic Society, USA. [Online] Available at: http:/energyblog .nat ionalgeographic .com/2013/10/04/frack ing-water- i t s - jus t -so-hard- to-c lean/
53. In our conceptualisation, flowback water is water that is returned to the surface and has dissolved minerals and salts. Total salt content is measured in total dissolved salts (TDS). Brine and produced water is often used interchangeably with formation water in the literature. However, we regard formation water as water that is derived from deep below the surface that existed before fracking and then is also generated after fracking with the extraction of gas.
54. See Brantley, S.L., Yoxheimer, D., Arjmand, S., Grieve, P., Vidic, R., Pollak, J., Llewellyn, G.T., Abad, J. and C. Simon. 2014. Water Resource Impacts During Unconventional Shale gas Development: The Pennsylvania Experience. International Journal of Coal Geology 126: pp. 152.
55. Groom, N. July 15, 2013. Analysis: Fracking Water’s Dirty Little Secret – Recycling. Reuters. [Online] Available at: http://www.reuters.com/article/2013/07/15/us-fracking-water-analysis-idUSBRE96E0ML20130715.
56. See Sider, A., Gold, R. and B. Lefebvre. November 20, 2012. Drillers Begin Reusing ‘Frack Water’: Energy Firms Explore Recycling Options for an Industry That Consumes Water on Pace With Chicago. The Wall Street Journal, USA. [Online] Available at: http://online.wsj.com/news/articles/SB10001424052970203937004578077183112409260.
57. See Brantley et al op. cit. note 54 at 140-156.
58. A technical term used by petroleum geologists to describe a potential hydrocarbon location within a specific
49
geologic formation. So when they say the Karoo has 485 TCFs of shale gas resource they mean GIP. However, the GIP is not the same thing as the economic reserve. Based on current geologic knowledge and technology, a lower technically recoverable resource (TRR) becomes the next best estimate and it is only when drilling is complete that the economically viable reserve or the Estimated Ultimate Recoverable Reserve (EUR) is determined.
59. Useful technical detail can be found in the following thesis: Janzen, M.R. December 2012. Hydraulic Fracturing in the Dutch Posidonia Shale. Delft University of Technology, Netherlands.
60. See also Carratu op. cit. note 29.
61. See Euzen, T. October 2011. Shale gas an Overview. IFP Technologies Inc, Canada.
62. Ghassemi, A. June 2012. A Geomechanical Analysis of Shale gas Fracturing and Its Containment: A Technology Status Report. Texas A & M University, Texas. [Online] Available at: http://www.rpsea.org/media/files/project/dc4535ec/10122-42-TS-geomechanical_Analysis_Gas_Shale_Fracturing_Containment-07-02-12.pdf.
63. Wang, W. May 2014. Study of Natural and Hydraulic Fracture Interaction Using Semi-Circular Bending Experiments. Master of Science of Engineering submitted to the University of Austin Texas, USA.
64. Technically speaking, well design engineers have to determine a reservoir’s transmissivity and storativity. Transmissivity relates to the ability of gas to flow between the rock matrix, natural and artificial fractures. Storativity describes the ability of secondary pores, as a result of artificial fractures, to serve as gas stores. As Carratu explains: “matrix has large storativity but negligible conductivity while the fracture network has negligible storativity but high conductivity” and “Shale rocks, however, do not display a uniform pore size; instead, they have a variety of pore sizes, ranging from micropores to nanopore size pores”. Carratu, op. cit. note 29 at 22-23.
65. There is always a danger of proppant flowback which can cause well productivity to drop.
66. The proppant used is usually sand but ceramics can also be used if a stronger proppant is required. Gels are usually used to increase viscosity so as to carry the proppant. Gel tends not to be used when the rock mineralogy has high brittleness.
67. Brittleness can be determined using Young’s Modulus and Poisson Ratio. Young’s Modulus is a measure of tensile strength and the ability of a material to withstand stresses due to another force or body acting against it. The Poisson Ratio is a reflection of the strain a material experiences when stretched or compressed. Underlying shales usually have rock formation barriers on either side of the shale formation. Fluid pressure, as a result of fracking in the shale formation, should be resisted by the countervailing rocks which serve as barriers so that the fracture formation does not extend beyond the shale formation. If pathways are created outside of the borehole this could lead to methane or formation water leakage.
68. Lee, D.S., Herman, J.D., Eslworth, D., Kim, H.T. and H.S. Lee. 2011. A Critical Evaluation of Unconventional Gas Recovery From the Marcellus Shale, Northeastern United States. KSCE Journal of Civil Engineering 15(4): pp. 679-687.
69. See also Burns, C., Topham, A. and R. Lakani. 2012. The Challenges of Shale gas Exploration and Appraisal in Europe and North Africa. Paper presented at the SPE/EAGE European Unconventional Resources Conference and Exhibition held in Vienna, Austria, 20-22 March, 2012. SPE 151868.
70. As a result, GIP estimates are continuously revised based on better geological information and production data.
71. It is the basis for volumetric per well reserve-estimates. It would also be used to project a well’s production potential. SRVs describe the surface area or a proportion of the surface area of a shale gas reservoir that is opened to the wellbore after stimulation.
72. Powers, B. August 11, 2012. US Shale gas Won’t Last Ten Years, Interview Bill Powers. The Energy Report. [Online] Available at: http://www.TheEnergyReport.com.
73. The most critical have been Arthur Berman and Bill Powers. See Stafford, J. March 5, 2014. Shale, the Last Oil and Gas Train: An Interview with Arthur Berman. Oilprice.com. [Online] Available at: http://oilprice.com/interviews/shale-the-last-oil-and-gas-train.
74. Patzek, T.W. 2010. Unconventional Gas in the US. Archives of Mining Sciences of the Polish Academy of Sciences 55(1).
75. Berman, A.E. and Pittinger, L.F. August 8, 2011. US Shale gas: Less Abundance, Higher Cost. The Oil Drum. [Online] Available at: http://www.theoildrum.com/node/8212. Berman tends to have higher decline rate figures.
76. There is a great deal of variation. However, decline rates tend to be higher than conventional plays. Decline rates can average 30-70% per well per annum.
77. Hughes, D. February 19, 2013. Drill Baby Drill: Can Unconventional Fuels Usher in a New Era of Energy Abundance? Post Carbon Institute, USA. Hughes notes in this report that “80 percent of shale gas production comes from five plays, several of which are in decline. The very high decline rates of shale gas wells require continuous inputs of capital—estimated at $42 billion per year to drill more than 7,000 wells—in order to maintain production.
50
In comparison, the value of shale gas produced in 2012 was just $32.5 billion.”
78. Foss, M.M. December 2011. The Outlook for US Gas Prices in 2020: Henry Hub at $3 or $10. The Oxford Institute for Energy Institute (OIES), Oxford, UK. This paper also contains a useful discussion on future gas price predictions for the US and considers shale gas plays and the economics in the US.
79. Some of the best work on real life decline rates for wells already drilled is that of David Hughes. See Hughes, D. December, 2013. Drilling California: A Reality Check on the Monterrey Shale. Post Carbon Institute, USA. More work by Hughes can be found on the Post Carbon Institute website at http://www.postcarbon.org.
80. See Coyne, D. 2014. [Online] Available at http://peakoilbarrel.com/. Coyne writes a blog on peak oil issues.
81. For more detail see Euzen op. cit. note 61 at 50.
82. Loder, A. April 3, 2014. An Old Formula May Overstate U.S. Oil Supplies. Bloomberg Businessweek. [Online] Available at http://www.businessweek.com/printer/articles/192869-an-old-formula-may-overstate-u-dot-s-dot-oil-supplies.
83. Kogler, K. August 2010. Considerations in Shale and Tight Gas Mechanisms for Reserve Estimations and Production Physics and Mechanics. Bachelor Thesis, Department of Petroleum Production and Processing, Montauniversitat Leoben.
84. q=quantity; qi=the initial rate in Mcf; t=time; D=decline rate; b=the decline exponent adjusted to match production data.
85. Fetkovich developed new types of curves to accommodate transient flows. It is seen as a modification of the Arps equation which ensures better flow boundaries for gas estimates by adjusting decline curves for more realistic estimations. Generally, Fetkovich provides a better theoretical model for the behaviour of wells. The b factor differs for different reservoir types. The Arps equation tends to work well in stable, non-transient flow type wells. In ultra-low permeability wells, transient flow models are more relevant as they better align mathematical estimates with the real-life physical performance of wells. Reasons for transient flow are not exactly known but could be a result of liquid loading in pores or fractures.
86. IIk, D., Rushing J.A., Perego, A.D. and Blasingame, T.A. 2008. Exponential vs. Hyperbolic Decline in Tight Gas Sands – Understanding the Origin and Implications of Reserve Estimates Using Arps Decline Curves. Paper presented at the 2008 SPE Annual Technical Conference and Exhibition in Denver Colorado, USA, 21-24 September 2008. SPE 116731.
87. The process in which adsorbed gas is released or detached from rock grains or kerogen.
88. Power law methods are used widely in economics and other sectors and are described by the equation Y = kXα. Y and X are variables of interest; α is the power law exponent; k is the constant. Power laws describe scaling effects such as distribution of wealth, income, the growth of cities and firms. Power Law applicability exists because of the presence of regularities or what some call ‘universalities’.
89. The power law formula used in shale gas estimates is q=q0exp [- (ᵗ/τ)ⁿ]. q is production rate; t is time since construction; n is the model parameter; and τ is time constant.
90. Mcneil, R., Jeje, O. and A. Renuad. 2009. Application of the Power Law Loss-Ratio Method of Decline Analysis. Petroleum Society. Paper submitted as part of the proceedings of the Canadian International Petroleum Conference, Calgary, Alberta, 16-18 June 2009.
91. Also referred to as Valko’s Decline method or stretched exponential model developed to produce more realistic EURs. A complementary decline curve model which is often used is referred to in the literature as the Duong method.
92. See Husain, M.T. August 2011. Assessment of Reserve Estimation Tools for Low Permeability Reservoirs Flowing Under Early Transient Flow Regime. Master of Science, Department of Energy and Mineral Engineering, Pennsylvania State University. [Online] Available at: http://www.google.co.za/search?hl=en-ZA&source=hp&q=Assessment+of+Reserve+Estimation+Tools+for+Low+Permeability+Reservoirs+Flowing+Under+Early+Transient+Flow+Regime&btnG=Google+Search&gbv=1.
93. This is because shale rock geophysics need to be better understood and production data more rigorously analysed as more wells are drilled.
94. See also Mattar, L., Gault, B., Morad, K., Clarkson, C.R., Freeman, C.M., IIk, D. and Blasimgame, T.A. 2008. Production Analysis and Forecasting of Shale gas Reservoirs: Case History Based Approach. Paper presented at the SPE Shale gas Production Conference in Fort Worth, Texas, USA, 16-18 November 2008.
95. See recent media coverage of overestimation problems by industry. Loder, A and Amsdorf, I. October 9, 2014. We’re sitting on 10 billion barrels of oil! OK, Two. Bloomberg. [Online] Available at: http://www.bloomberg.com.
96. Walton, I. and McLennan, J. 2013. The Role of Natural Fractures in Shale gas Production. In R. Jeffrey (Ed) Effective and Sustainable Hydraulic Fracturing. InTech, USA. [Online] Available at: http://www.dx.doi.org/10.5772/56404. Their main thesis is that natural fractures may not always be a good thing as they can be filled with calcite and other minerals and thereby interfere with porosity. In most artificial simulation, well-design engineers focus on
51
the flow path or connectivity from the impermeable matrix into fractures and then the wellbore. The paper describes different methods for flow-rate determination using the discrete fracture network (DFN) model or dual porosity/dual permeability models.
97. There are useful references on the Society of Petroleum Engineers (SPE) website that cover a lot of ground on decline curves and other analysis. [Online] Available at: http://www.spe.org/
98. McGlade, C., Speirs, J. and S. Sorrell. 2013. Methods of Estimating Shale gas Resources - Comparison, Evaluation and Implications. Energy 59: pp. 116-125 at 120.
99. Fritzgerald, T. 2013. Frackonomics: Some Economics of Hydraulic Fracturing. Case Western Reserve Law Review 63(4).
100. Kaiser, M.J. 2010. Economic Limit of Field Production in Louisiana. Energy 35: pp. 3399-3416.
101. See Jackson, R.B., Vengosh, A., Carey, J.W., Davies, R.J., Darrah, T.H., O’Sullivan, F. and G. Petron. 2014. The Environmental Costs and Benefits of Fracking. Annual Review of Environment and Resources 39.
102. [Online] Available at: https://www.e-education.psu.edu/eme801/node/521.
103. IIk et al, op. cit. note 86.
104. Exponential decline (b=0), hyperbolic decline (0<b<1) and harmonic decline (b=1).
105. More detail can be found in Ilk et al, op. cit. note 86.
106. For more detail see McGlade et al, op. cit. note 98 at 121.
107. Weijermars, R. August 5, 2013. Barnett at DFW Provides Lessons on Shale gas Projects at US Airports. Oil and Gas Journal. [Online] Available at: http://www.ogj.com/articles/print/volume-111/issue-8/exploration-development/barnett-at-dfq-provides-lessons-on-shale.html
108. Malewitz, J. December 21, 2013. Fort Worth Sues Driller, Citing Millions Lost in Royalties. New York Times. [Online] Available at: http://www.nytimes.com/2013/12/22/us/fort-worth-sues-driller-citing-millions-in-lost-royalties.html?pagewanted=all&_r=0
109. Thomas, J.M. April 30, 2012. Cheap Natural Gas and US Reindustrialization: Economic Outlook. The Carlyle Group, USA.
110. lmadani, H.A.S. August 2010. A Methodology to Determine Both the Technically Recoverable Resource and the Economically Recoverable Resource in an Unconventional Gas Play. Master of Science, Texas A&M University.
111. Another report suggests that it is up to 60%. Lake, L.W., Martin, J., Ramsey, J.D. and S. Titman. July 17, 2012. A Primer on the Economics of Shale gas Production: Just How Cheap is Shale gas. Texas A & M University, Texas.
112. Duman, R.J. 2012. Economic Viability of Shale gas Production in the Marcellus Shale, Indicated by Production Rates, Costs and Current Natural Gas Prices. Thesis submitted for Master of Science, Michigan Technological University. This thesis also covers useful ground regarding other costs and incentives as part of the economic base model used to determine the viability of shale gas plays under various variable assumptions.
113. McGlade et al, op. cit. note 98. This paper is useful for understanding factors that influence well performance and variation in productivity and recovery rates.
114. If, for instance, one assumed that the Marcellus field had an average decline rate of 70-75% and an IP rate of 3.5MMcf/day and if we assume that in 2012 100 wells were drilled, the number of wells that need to be drilled to produce 50 BCM/year in 8 years is around 7000 wells. To sustain this production rate after 2020 about 1000 wells/year would have to be drilled. See Gao, F. April 2012. Will There Be a Shale gas Revolution in China By 2020? OIES Paper NG 61. The Oxford Institute for Energy Studies (OIES), Oxford, UK.
115. Gulen, G., Browning, J., Ikonniva, S. and S.W. Tinker. 2013. Well Economics Across Ten Tiers in Low and High Btu (British Thermal unit) Areas in Barnett Shale, Texas. Energy 60: pp. 302-315. This paper goes into some detail on the many factors influencing wellhead costs.
116. Meaning the estimate is revised and adjusted to reflect a truer situation and so the number has to be brought down if the estimate has proven to have been too high initially.
117. Ahmed, N. May 22, 2014. Write-Down of Two-Thirds of US Shale Oil Explodes Fracking Myth. The Guardian. [Online] Available at: http://www.theguardian.com/environment/earth-insight/2014/may/22/two-thirds-write-down-us-shale-oil-gas-explodes-fracking-myth
118. Baihly, J., Altman, R., Malpani, R. and F. Luo. May 2011. Study Assesses Shale Decline Rates. The American Oil and Gas Reporter. [Online] Available at: http://www.slb.com/resources/publications/industry_articles/dcs/201105_aogr_shale_decline_rates.aspx
119. Hughs, D.J. October 2014. Drilling Deeper: A Reality Check on U.S. Government Forecasts for a Lasting Tight Oil &
52
Shale gas Boom. Post Carbon Institute. 120. See also Roach, P. November 30, 2010. Estimating the Break-even Costs of Shale gas. [Online] Available at: http://
seekingalpha.com/article/239231.
121. IRRs are reference to the return that an investor needs to cover his interest and capital cost (usually shareholder return on their equity plus the cost of debt) to ensure the production of gas is profitable. The IRR in more technical sense is the rate of return needed to make the NPV equal to zero. A NPV that is higher than the original investment together with an acceptable IRR makes the project viable as it will cover all the expenses, recover the original investment and enable the project to pay its debt with a reasonable profit in the end. If the NPV is negative, the project is economically viable. The discount rate is the interest rate for the project that is derived by what the bank charges the project developer as interest on a loan.
122. Some useful detail on NPVs can be found in Kaiser, M.J. 2012. Profitability Assessment of Haynesville Shale gas Wells. Energy 38: pp. 315-330. Kaiser shows that if one considers the full cycle, the majority of Haynesville wells underperform. Chesapeake reported the average cost for drilling in Haynesville was $9.5 million. Competing firm, Encana, spend an average $11 million/well. The majority of assumed discount rates are around 10%.
123. See also Kaiser, M.J. 2012. Haynesville Shale Play Economic Analysis. Journal of Petroleum Science and Engineering 82-83: pp. 75-89.
124. Kaiser op. cit. note 100. Kaiser also provides a base case model template that was used Khater for his thesis.
125. As the Bloomberg article notes, industry investor presentations can over-state resource potential and reserves, which are often very different from what is legally registered with the US Security Exchange Commission. The SEC requirements state that drillers should have ‘reasonable certainty’ that estimated oil and gas reserves will be extracted from wells within five years. The industry is lobbying to relax the rules to increase the term for estimates beyond five years and to include speculative reserves under definitions of ‘probably’ and ‘possible’. The Bloomberg report notes that the average estimates presented to investors was 6.6 times higher than what was filed with the SEC.
126. Lake, L.W., Martin, J., Ramsey, J.D. and S. Titman. July 17, 2012. A Primer on the Economics of Shale gas Production: Just How Cheap is Shale gas? Baylor University, Texas, USA.
127. Levels of debt leverage in the industry have been high. See Rajszel, P. April 29, 2010. Accounting Alerts! Chesapeake Leverage: It’s More Than You Think. Veritas Investment Research. The main concern raised in this report is the manipulation of VPP’s to hide real liabilities using an accounting loophole which Chesapeake uses to its advantage. The VPPs sold do not have to be registered on its balance sheet despite the fact that the company must still honour VPP contracts. Other commentators suggest this is an unusual practice. In any case, this would not have relevance for South Africa and the author has not gone into great detail on how VPPS work on a daily basis in the US.
128. Urbina, I. June 25, 2011. Insiders Sound an Alarm Amid Natural Gas Rush. New York Times. [Online] Available at: http://www.nytimes.com/2011/06/26/us/26gas.html.
129. Hagget, S. and Ghosh, S. November 5, 2013. Encana Corp to Cut 20% of Workforce, Close Office and Slash Dividend. [Online] Available at: http://business.financialpost.com/2013//11/05.
130. Alboran Energy Strategy Consultants. May 2011. Can Technology R & D Close the Unconventional Gas Performance Gap? First Break 29: pp. 89. [Online] Available at: http://fb.eage.org/publication/content?id=4994
131. See Godec, M., Van Leeuwen, T. and V. Kuuskraa. July 24, 2007. Economics of Unconventional Gas. OGJ Unconventional Gas Article 5. Advanced Resources International, Arlington, VA.
132. For an interesting review of Chesapeake’s financial model see Mollenkamp, C. May 9, 2012. Chesapeake’s Deepest Well: Wall Street. Reuters Special Report. See also Sullivan, T. June 2008. Deutsche Bank Deal of the Year. Energy Risk Awards.
133. VPP buyers classify VPPs as loans. The buyer hedges away the commodity prices risk by taking a forward contract. VPP buyers are mainly large companies or financial institutions. VPPs are treated as a loan to the seller and can influence their credit ratings as a result. In the seller’s book, VPPs are treated as a deferred revenue liability which declines as oil or gas is delivered in terms of the contract amount. Generally, oil and gas companies would register VPPs as a liability on their balance sheet irrespective of accounting practices. VPPs can also be securitised and housed in a special purpose vehicle (SPV) where further equity shares can be issued by the SPVs and the value of these shares are underwritten by the underlying value that is reflected in the total value of the VPPs.
134. Munoz, J.S. 2009. Financing of Oil and Gas Transactions. Texas Journal of Oil, Gas and Energy Law 4.
135. Betancourt, E.C. May 2014. Modelling, Pricing and Hedging Derivatives on Natural Gas: An Analysis of the Influence of the Underlying Physical Market. Universidad Pontificia De Comillas, Spain.
136. See also Helman, C. March 17, 2014. Screwing Royalty Owners Means Chesapeake Is Stealing Cash. [Online] Available at: http://www.forbes.com/sites/christopherhelman/.
137. See Sandrea, I. March 2014. US Shale gas and Tight Oil Industry Performance: Challenges and Opportunities. Oxford Energy Comment. The Oxford Institute for Energy Studies (OIES), Oxford, UK.
138. Morse, E. June 2014. International Shale Development: Can “Made in America” Spread Globally? Citi Research.
53
139. Crooks, E. January 5, 2014. Shale Boom Leaves Investors Underwhelmed. Financial Times.
140. Loder, A. May 27, 2014. Shakeout Threatens Shale Patch as Frackers Go for Broke. Bloomberg.
141. Bresciani, G., Inia, D. and P. Lambert. 2014. Capturing Value in Global Gas: Prepare Now for an Uncertain Future. Oil and Gas Practice, McKinsey and Company.
142. Chazan, G. October 6, 2013. Peter Voser Says He Regrets Shell’s Huge Bet on US Shale. Financial Times. See also Hughes, D.J. February 21, 2013. A Reality Check on Shale Revolution. Nature 494: pp. 307 and Rogers, D. February 2013. Shale and Wall Street: Was the Decline in Natural Gas Prices Orchestrated? Energy Policy Forum.
143. Maintenance, servicing and possibly refracking.
144. See Reeves, S.R., Koperna, G.J. and V.A. KuusKraa. July 24, 2007. Nature and Importance of Technology Progress for Unconventional Gas. OGJ Unconventional Gas Article 4: pp. 91. Advanced Resources International.
145. The National Academy of Sciences. 2014. Development of Unconventional Hydrocarbon Resources in the Appalachian Basin: Workshop Summary. The National Academy Press. [Online] Available at: http://www.nap.edu/catalog.php?record_id=18624
146. See Covert, T.R. 2014. Experential and Social Learning in Firms: The Case of Hydraulic Fracking in the Bakken Shale. Harvard Business School and Harvard University Department of Economics. The paper discusses methods and approaches to learning by doing for shale gas firms.
147. EIA. September 11, 2012. Pad Drilling and Rig Mobility Lead to More Efficient Drilling. US Energy Information Administration (EIA), USA. [Online] Available at: http://www.eia.gov/todayinenergy/.
148. See also Ladlee, J. and Jacquet, J. September 2011. The Implications of Multi-Well Pads in the Marcellus Shale. Research and Policy Brief Series 43. Community and Regional Development Institute, Cornell University.
149. See Platts McGraw Hill Financial. August 5, 2013. Fracking Price Fixing Charges Likely Unfounded: Analysts. [Online] Available at: http://www.platts.com/latest-news/natural-gas/houston/fracking-price-fixing-charges-likely-unfounded-21379636 See also Wittmeyer, H. November 19, 2013. Fracking Industry Anti-Competition Lawsuit. Frackwire. [Online] Avialable at: http://frackwire.com/fracking-industry-anti-competition-lawsuit/ and Anderson, J. August 9, 2013. Halliburton, Baker Hughes, Schlumberger Accused of Market Manipulation. [Online] Available at: http://breakingenergy.com/2013.
150. It is not unusual for a multinational to have much better credit rating than a sovereign state and in so doing bring down their cost of borrowing.
151. WWF’s work on the financing of the Renewables Independent Power Producers Programme (REIPPP) provides a good analysis of the challenges that exist when you have to deal with foreign exchange issues, importing of technology and specialised skills. See reports at http://www.wwf.org.za/media_room/publications/.
152. However, Anglo-American has developed a pilot drill-rig for coal-bed methane fracking in the Limpopo area.
153. Nash, S.S. May 2014. Technology Strategy for Shale Plays: Independents vs Majors – An Analysis and Outlook. Presented at AAPG/STGS Eagle Ford Plus Adjacent Plays and Extensions Workshop, February 24-26, 2014, San Antonio, Texas.
154. Alekseenko, A. 2012. Reserve Estimation: Unconventionals: Summary of Presentations and Discussions, Hasan Wade. Workshop held in Houston Texas, August 20-21, 2012. [Online] Available at http://www.reserve-estimation.com.
155. Learning rates can involve many things. They are used by the industry to identify cost reductions with scaling and learning-by-doing. For instance, it does take some time for a country to learn how to use and apply new technologies. It requires skills transfer, experimentation and optimisation until the learning is at such a level that a new technology can be used more efficiently. The less time taken and the more efficient the capability, the lower the cost of applying the technology with time. This leads to project or construction savings.
156. According to the same report, the costs of fracking in Bakken were in the range of $2-5 million out of total well costs of $9m. Most of the costs were associated with the cost of sand and water. The Bakken is nonetheless a major oil producing shale in the US. Prices for the shale product are linked to oil prices and not Henry Hub prices.
157. Covert op. cit. note 146 at 2.
158. Cohen, A.K. May 2013. The Shale gas Paradox: Assessing the Impacts of the Shale gas Revolution on Electricity Markets and Climate Change. M-RCBG Associate Working Paper Series 14. Harvard Kennedy School, USA. [Online] Available at: http://www.hks.harvard.edu/var/ezp_site/storage/fckeditor/file/cohen_awp_14x.pdf.
159. Krupnick and Wang, op. cit. note 22 at 8.
160. Engineering News. June 3, 2014. IEA sees LNG Playing Big Role in Gas Globalisation, But Warns on Costs. Engineering News, South Africa.
54
161. Ernst and Young. 2013. Global LNG: Will New Demand and New Supply Mean New Pricing. This report provides useful benchmark capital costs for LNG plants historically and for different types of projects.
162. In the case of LNG, the sequencing and timing of plant development will be crucial for how costs are managed. EPC contractors are no longer willing to take on plant development risks as was the case in some instances around the world. Plant sponsors and financiers increasingly have to take on these risks.
163. Bibikos, G.A. 2013. A Review of the Implied Covenant of Development in the Shale gas Era. West Virginia Law Review 4(24). This paper contains a useful analysis of lease agreement deals and how they are constructed in the US.
164. In one study, the rental cost and manning of a drill rig was around $209 000. See Hefley, W.E. and Seydor, S.M. August 2011. The Economic Impact of the Value Chain of a Marcellus Shale Well. Pitt Business Working Papers. University of Pittsburgh, USA.
165. Greve, N. August 27, 2014. MPRDA Amendment Bill Could Present Legal Ambiguity for Oil and Gas Sector. Engineering News, South Africa. [Online] Available at: http://www.engineeringnews.co.za/article/mprda-amendment-bill-could-present-legal-ambiguity-for-oil-gas-sector-2014-08-27
166. Creamer, M. October 10, 2013. State Will Have 20% Free Stake in Shale gas Exploitation – Minister. Mining Weekly, South Africa. [Online] Available at: http://www.miningweekly.com/article/state-will-have-20-free-stake-in-shale gas-exploitation-minister-2013-10-10
167. Burgess op. cit. note 9 at 11.
168. This is also reinforced by the following paper Holditch, S.A. August 2012. Getting the Gas Out of The Ground. The Centre for Economic Performance (CEP), London School for Economic and Political Science, UK. [Online] Available at: http://www.aiche.org/cep/. The report’s main contention is that if wells pay-out in less than 5 years with an IRR of 20%, it is economical to drill. Less than that is a stronger indicator of viability. If cash-flows are three or more times the cost of drilling, it would also be viable.
169. Rogers, H.V. and Stern, J. February 2014. Challenges to JCC Pricing in Asian LNG Markets. OIES Paper NG81. The Oxford Institute for Energy Studies (OIES), Oxford, UK.
170. Ratner, M., Parfomak, P.W. and L. Luther. November 4, 2011. US Natural Gas Exports: New Opportunities, Uncertain Outcomes. CRS Report for Congress R42074. Congressional Research Service, USA. [Online] Available at: http://www.crs.gov.
171. Apte, S., Critchlow, J. and A. Steinhubl. 2011. Are We on the Edge of a Truly Global Gas Market? Bain and Company.
172. Songhurst, B. February 2014. LNG Plants Cost Escalation. OIES Paper NG 83. The Oxford Institute for Energy Studies (OIES), Oxford, UK.
173. Henderson, J. October 2012. The Potential Impact of North American LNG Exports. OIES NG 68. The Oxford Institute for Energy Studies (OIES), Oxford, UK.
174. Kamal, S. 2013. Transformation of Energy, Technologies in Purification and End Use of Shale gas. Journal of the Combustion Society of Japan 55(171): pp. 13-20.
175. Fattouh, B. July 2014. The US Shale Revolution and the Changes in LPG Trade Dynamics: A Threat to the GCC? The Oxford Institute for Energy Studies (OIES), Oxford, UK.
176. See also Fruhauf, A. April 2014. Mozambique’s LNG Revolution: A Political Risk Outlook for the Rovuma LNG Ventures. OIES Paper 86. The Oxford Institute for Energy Studies (OIES), Oxford, UK.
177. Gqada, I. August 2012. Mozambique’s Gas: An Opportunity for South Africa. Policy Briefing 53. South African Institute for International Affairs (SAIIA), South Africa.
178. BP. 2014. BP Statistical Review of World Energy. [Online] Available at: http://www.bp.com/content/dam/bp/pdf/Energy-economics/statistical-review-2014/BP-statistical-review-of-world-energy-2014-full-report.pdf.
179. Eberhard, A. January 2011. The Future Of South African Coal: Market, Investment, and Policy Challenges. Working Paper 100. Programme for Energy and Sustainable Development, Stanford University, USA. [Online] Available at: http://iis-db.stanford.edu/pubs/23082/WP_100_Eberhard_Future_of_South_African_Coal.pdf.
180. Lee, M. April 2014. Path to Prosperity? A Closer Look at British Columbia’s Natural Gas Royalties and Proposed LNG Income Tax. LNG Reality Checks Series. Canadian Centre for Policy Alternatives, Canada. This study is useful because it also includes an assessment of carbon tax.
181. The existence of a mobile LNG unit was mentioned by John Shoobridge pers communication we had over lunch at a Fossil Fuel Foundation workshop on gas titled: “Gas – the Game Changer for Southern Africa?!” Wednesday 21, May 2014, Glen Hove Conferencing, Melrose, Johannesburg.
182. Ledesma, D., Henderson, J. and N. Palmer. October 2014. The Future of Australian LNG Exports: Will Domestic Challenges Limit the Development of Future LNG Export Capacity? OIES Paper NG 90. Oxford Institute for Energy
55
Studies (OIES), Oxford, UK.183. For an insight into gas pricing strategies in Europe see Stern, J. and Rogers, H. March 2011. The Transition to
Hub-Based Gas Pricing in Continental Europe. OIES Paper NG 49. The Oxford Institute for Energy Studies (OIES), Oxford, UK.
184. See an interesting paper by Giamouridis, A. July 2012. The Offshore Discovery in the Republic of Cyprus: Monetisation Prospects and Challenges. OIES Paper NG 65. The Oxford Institute for Energy Studies (OIES), Oxford, UK.
185. This is one of the problems with the Shell study by Econometrix. It assumed an arbitrary wellhead price that had no bearing because it could not be verified under South African conditions.
186. Darbouche, H. June, 2012. Issues in the Pricing of Domestic and Internationally-Traded Gas in MENA and Sub-Saharan Africa. OIES Paper NG 64. The Oxford Institute for Energy Studies (OIES), Oxford, UK.
187. This is a general reference to the relation of economic institutions and agents to the political and social system. The role that a state plays within an economy is an important aspect of this. Our preference is to use it to describe the various types of forces and powers of agency that exist within the economy and exert influence over the political system and state in order to favour their specific interests.
188. Rent here is used here to describe profits and surpluses that are appropriated by moneyed or politically influential players from the profits generated by a particular sector or the general economy.
189. For more scholarly work on the problem of extractives and rent seeking, see Paul Collier’s Group, The Centre for the Study of African Economies. [Online] Available at: http://www.csae.ox.ac.uk/ and Paul Collier himself [Online] Available at: http://ideas.repec.org/f/pco353.html.
190. Lings, K. 2014. The Missing Piece: Solving South Africa’s Economic Puzzle. Pan Macmillan, South Africa at 15-16.
191. Mahadeva, J. June, 2012. Optimal Fiscal Policy in the Face of Oil Windfalls and Other Known Unknowns. OIES Paper SP 26. Oxford Institute for Energy Studies (OIES), Oxford, UK.
192. Barnett, S and Ossowski, R. October 2002. Operational Aspects of Fiscal Policy in Oil-Producing Countries. IMF Working Paper WP/02/177. International Monetary Fund (IMF), USA. The paper goes into technical details that can be independently studied by the reader. They cover appropriate fiscal rules for spending oil and gas revenues, dealing with price volatility, currency exchange issues and wider sector impacts if a currency strengthens due to the inflow of foreign currency within the domestic economy. While this paper does not delve into the details, there are models that can be used to guide governance and fiscal policy regimes tailored to deal with the oil and gas industry.
193. Harding, T. and van der Ploeg, R.F. 2009. Fiscal Reactions to Anticipated Hydrocarbons Windfalls and Pension Burden: Is Norway’s Stabilization Fund Prudent Enough? [Online] Available at: http://www.webmeets.com/files/papers/WCERE/2010/610/Fiscal%20Policy%20Windfall%20Norway%20WCERE.pdf.
194. Norway puts oil and gas revenues in a stabilization fund and draws about 4% from the fund to support tax cuts or expanded public spending. The 4% represents the real-rate of return on the fund. BIH is usually contrasted with the permanent income hypothesis (PIH) which argues that revenue losses from depleting oil and gas reserves must be weighed up against increasing pension costs. Revenues can be divided into two periods – windfall and non-windfall. During windfall periods more must be saved or debts reduced. These savings can be ‘housed’ in a sovereign fund which chases after assets with higher returns to meet future obligations. The Harding and van Ploeg paper critiques the BIH rule saying it is insufficient as it does not account adequately for the value of depleting resources and in so doing underestimates the true rate of return that is necessary to target in order to ensure reasonable rates of profit. Windfalls can also elicit the opposite: increased consumption spend and less taxes. These are all policy matters for governments to decide based on their economic objectives. The danger of PIH rules is what economists call ‘habit persistence’ – once a country is hooked on consumption patterns of spend it is hard to break from it after a decline in revenues or windfalls.
195. Harold Hotelling was born in 1895 and died in 1973. He was a statistician by training and greatly influenced economic theory. Hotelling’s rule stipulates that marginal hydrocarbon revenues minus marginal extraction costs should rise at the market rate of interest. See [Online] Available at: http:// en.wikipedia.org/wiki/Harold_Hotelling.
196. See Smith, J.L. December 2012. Issues in Extractive Resource Taxation: A Review of Methods and Models. IMF Working Paper WP/12/287. International Monetary Fund (IMF), USA.
197. Also referred to PIH.
198. Medas, P. and Zakharova, D. March 2009. Primer on Fiscal Analysis in Oil Producing Countries. IMF Working Paper WP/09/56. International Monetary Fund (IMF), USA.
199. Stabilisation funds have several roles like managing significant foreign currency inflows, the ability of the government to step in when a commodity boom cycle is in a downward trend (either to support a currency or government spending) and then to manage inflation.
200. This happens when a country exports a vast amount of commodities such as oil and gas. The inflow of foreign currency, in this case the dollar, leads to the strengthening of the local currency. While imports are made cheaper, the effect on other parts of the economy can be long term in nature especially if a country wants to export manufactured goods and other services. The strong currency makes these exports less competitive.
56
201. See Bertrand, M. and Mullainathan, S. February 2005. Profitable Investments or Dissipated Cash? Evidence on the Investment-Cash Flow Relationship from Oil and Gas Lease Bidding. Working Paper 11126. National Bureau of Economic Research. [Online] Available at: http://wwwnber.org/papers/w11126. See also Perez, A.H. July 2010. Oil and Gas Bidding with a Dominant Incumbent: Evidence from the Brazilian Oil Block Auction. Working Paper. [Online] Available at: http://www.fea.usp.br/feaecon/media/fck/File/Oil%20and%20Gas%20Bidding%20with%20a%2 Dominant%20Incumbent%209.pdf and Sen, A. and Chakravarty. December 2013. Auctions for Oil and Gas Exploration Leases in India: An Empirical Analysis. OIES Paper 30. The Oxford Institute for Energy Studies (OIES), Oxford, UK. and Nordt, D.P. August 2009. A Study of Strategies for Oil and Gas Auctions. Doctor of Philosophy, Texas A&M University.
202. See also Segal, P. May 2012. Fiscal Policy and Natural Resource Entitlements: Who Benefits from Mexican Oil? OIES Paper WPM 46. The Oxford Institute for Energy Studies (OIES), Oxford, UK.
203. Nolan, P.A. and Thurber, M.C. op. cit. note 17 at 29-30.
204. According to Segal, in Mexico inequality is high and redistribution mechanisms and spend from the fiscus is weak.
205. See also Segal, P. May 2012. How to Spend it: Resource Wealth and the Distribution of Rents. OIES Paper SP 25. The Oxford Institute of Energy Studies (OIES), Oxford, UK.
206. Segal ibid at 3.
207. Twine, T. January 2012. Karoo Shale gas Report: A Special Report on Economic Considerations Surrounding Potential Shale gas Resources in the Southern Karoo of South Africa. Econometrix (Pty) Ltd, South Africa. The report’s assumptions regarding wellhead costs as well as the assumptions that went into its Keynesian multiplier are questionable.
208. A critique of of the Econometrix paper was also done by some academics. See Wait, R and Rossouw, R. 2014. A Comparative Assessment of the Economic Benefits from Shale gas Extraction in the Karoo, South Africa. South African Business Review 18(2).
209. Many of the tables above can also be drawn from Kaiser’s work.
210. See Khater, M. 2013. Assessing the Economic Feasibility of Shale gas: A North American Perspective. Master of Arts, Department D’Economique Faculte Des Science Sociales Universite Laval, Quebec. Khater’s thesis contains detailed models and analysis of decline curves. He also covers optimum strategies to pursue when thinking about royalties.
211. About 275 million years ago the Karoo was a vast anoxic lake. Organic material accumulated within it that was later cooked up or underwent extreme thermogenesis. Since then free gas and oil has leaked from deep beneath the surface. Several years ago rich black organic shales were found using magnetotelluric (MT) imaging methods. This involves placing electrodes in the ground and measuring the interference of electric currents. See De Wit, M.J. 2011. The Great Shale Debate in the Karoo. South African Journal of Science 107 (7/8).
212. DMR. July 2012. Report on the Investigation of Hydraulic Fracturing in the Karoo Basin in South Africa. Department of Mineral Resources (DMR), South Africa. [Online] Available at: http://www.dmr.gov.za/publications/viewdownload/182-report-on-hydraulic-fracturing/854-annexures-full-report-on-investigation-of-hydraulic-fracturing-in-the-karoo-basin-of-south-africa-18-september-2012.html See also, Hedden, S., Moyer, J.D. and J. Retting. December 2013. Fracking for Shale gas in South Africa: Blessing or Curse? African Futures Paper 9. Institute for Security Studies Africa (ISS), South Africa. [Online] Available at: http://www.issafrica.org/publications/papers/fracking-for-shale gas-in-south-africa-blessing-or-curse
213. Dwyka group also contain black shales between 0.1 to 4.3% TOC, averaging 1.9%. However, these shales are said to be too narrow. Dolerite intrusions can also create difficult conditions for drilling if lower shale formations are to be accessed.
214. Based on vitrinite reflectance measures, the values for Whitehills range from 3.5 to 5.3% and 4 to 6.4% for the Prince Albert Formation all indicate very mature thermogenesis. Whitehills contain the highest TOCs and so would likely produce the most gas. However, dolerites have been found to commonly intrude the Whitehill formation and they have possibly burned off the gas in areas that were in contact with these dolerites.
215. Steyl, G., van Tonder, G.L. and L. Chevalier. February 2012. State of the Art: Fracking for Shale gas Exploration in South Africa and the Impact on Water Resources. WRC Report KV 294/11. Water Research Commission (WRC), South Africa.
216. The Whitehill formation has a thickness of 1-72m, and carbon content of between 0.5-14%. The Prince Albert formation, another target area has a thickness of 12-270m with carbon richness of between 0.3%-20%.
217. Vermeulen, P.D. 2012. A South African Perspective on Shale gas Hydraulic Fracturing. Annual Conference of the International Mine Water Association.
218. Blake, D. and Hartnady, C.J.H. Undated. Shale gas Exploration in South Africa and Possible Future Groundwater Quantity and Quality Issues. Umvoto Africa (Pty) Ltd.
219. Presentation by Doug Cole from the Council of Geoscience, Fossil Fuel Foundation conference Wednesday 21 May 2014, Glenhove Conferencing, Melrose, Johannesburg.
220. These would not only take into account drilling and completion costs, but also land and general administration expenses. We would add here externality costs and long term provisions as part of the full-cycle economic estimations.
57
221. Some experts attribute these high costs to the fact that the geology is challenging. This is mainly due to complex internal structure of volcanics that make mapping difficult as well as drilling through resistant rock.
222. Eardley-Taylor, P. May 21, 2014. Commercial Aspects of Shale gas Development in Southern Africa. Standard Bank, South Africa. Presented at the Fossil Fuel Foundation conference op cit 220. Eardley-Taylor drew these figures from a Wood McKenzie study that is not publicly available.
223. Geel, S. Schulz, H.M., Booth, P., de Wit, M. and B. Horsfield. 2012. Shale gas Characteristics of Permian Shales in South Africa: Results From the Recent Drilling in the Ecca Group (Eastern Cape). Energy Procedia 40: pp. 256-265.
224. South Africa seems to be the only shale formation in the world intruded by dolerite.
225. Du Toit, J. June 26, 2014. Dolerite, The Karoo’s Fracking Game-Changer. Karoo Space, South Africa. [Online] Available at: http://karoospace.co.za/dolerite-karoos-fracking-game-changer/
226. McKibben, B. March 8, 2012. Why Not Frack? The New York Review of Books. [Online] Available at: http://www.nybooks.com/articles/archives/2012/mar/08/why-not-frack/
227. Capping of methane is now becoming a big issue in the US following Obama’s Climate Action Plan and the need to hold true to the claim that natural gas is a better substitute for coal. Estimates suggest that over a twenty-year period, the green-house gas effects of methane can be 84-86 times more impactful than carbon dioxide. See Nocera, J. October 8, 2014. ‘Moment of Truth’ on Emissions. International New York Times.Available at http://www.nytimes.com/2014/10/07/opinion/joe-nocera-moment-of-truth-on-emissions.html?_r=0
228. Some proxies can be generated in South Africa based on experiences with road haulage of coal from coal mines to coal-fired power plants. These externality costs are already being established as a routine budget item in Eskom’s Multi-Year Price Determinations (MYPD).
229. DEA. 2014. Research Project: Greenhouse Gas Emissions Associated with Shale gas. Department of Environmental Affairs (DEA), South Africa.
230. Foss op. cit. note 78 at 47.
231. Scientific techniques for detecting methane or brine sources from natural and fracked wells already exist. These methods of traceability should be applied in South Africa to ensure robust enforcement and liability.
232. This is being subject to litigation in the US. Recently, Lisa Parr took Aruba Petroleum and Encana to the Dallas County Court for environmental and health damages. For more information see Buckel, B. April 12, 2014. Trial Gets Underway: Parr v. Aruba Takes Centre Stage in Dallas Courtroom. WCMessenger.co. [Online] Available at: http://www.wcmessenger.com/2014/news/trial-gets-underway-parr-v-aruba-takes-center-stage-in-dallas-courtroom/.
233. Furlow, J.G. and Hays, J.R. 2012. Disclosure with Protection of Trade Secrets Comes to the Hydraulic Fracturing Revolution. Texas Journal of Oil, Gas & Energy Law 7(2). [Online] Available at: http://connection.ebscohost.com/c/articles/78114337/disclosure-protection-trade-secrets-comes-hydraulic-fracturing-revolution.
234. In the US most of the reported cases of seismicity have been attributed to well-injection of fracked wastewater. The most severe seismicity has been experienced in the State of Oklahoma.
235. llsworth, W.L. July 12, 2013. Injection-Induced Earthquakes. Science 341 (6142). [Online] Available at: http://www.sciencemag.org/content/341/6142/1225942.abstract?sid=226d10ef-328e-416d-97c3-f1229397e9e8.
236. Goldenberg, S. July 3, 2014. Oklahoma Earthquakes Linked to Fracking Wastewater Wells, Study Says. The Guardian. [Online] Available at: http://www.theguardian.com/environment/2014/jul/03/oklahoma-earthquakes-fracking-wastewater-wells.
237. Robertson, C. and Krauss, C. September 4, 2014. BP May Be Fined Up to $18 Billion for Spill in Gulf. New York Times. [Online] Available at: http://www.nytimes.com/2014/09/05/business/bp-negligent-in-2010-oil-spill-us-judge-rules.html?_r=0.
238. See Ingraffea, A.R., Wells, M.T., Santoro, R. and S.B.C. Shonkoff. 2014. Assessment and Risk Analysis of Casing and Cement Impairment in Oil and Gas Wells in Pennsylvania, 2000-2012. PNAS 111(30): pp. 10955-10960. [Online] Available at: http://www.pnas.org/content/111/30/10955/suppl/DCSupplemental. See also Romm, J. July 2, 2014. Four of 10 Fracked Wells in Pennsylvania Are Projected To Fail, Spewing Methane Into Air and Water. Climateprogress. [Online] Available at: http://thinkprogress.org/climate/2014/07/02/3453533/fracked-wells-methane/.
239. Mitchell, A.L. and Casman, E.A. 2011. Economic Incentives and Regulatory Framework for Shale gas Well Site Reclamation in Pennsylvania. Environmental Science Technology 45(22): pp. 9506-9514. [Online] Available at: http://pubs.acs.org/doi/abs/10.1021/es2021796.
240. See a WWF-South Africa study on the financial provisions for mine closure and rehabilitation. Van Zyl, H., Bond-Smith, M., Minter, T., Botha, M. and A. Leiman. 2012. Financial Provisions for Rehabilitation and Closure in South African Mining: Discussion Document on Challenges and Recommended Improvements. World Wide Fund for Nature (WWF), South Africa. [Online] Available at: http://www.wwf.org.za/media_room/publications/?6620/miningreport.
241. Jackson, R.B., Vengosh, A., Darrah, T.H., Warner, N.R., Down, A., Poreda, R.J., Osborn, S.G., Zhao, K. and J.D. Karr.
58
June 2013. Increased Stray Gas Abundance in a Subset of Drinking Water Wells Near Marcellus Shale gas Extraction. PNAS 110(28): pp. 11250-11255. [Online] Available at: www.pnas.org/cgi/doi/10.1073/pnas.1221635110.
242. Davies, R.J., Almond, S., Ward, R.S., Jackson, R.B., Adams, C., Worrall, F., Herringshaw, L.G., Gluyas, J.G. and M.A. Whitehead. 2014. Oil and Gas Wells and Their Integrity: Implications for Shale and Unconventional Resource Exploitation. Marine and Petroleum Geology 56: pp.1-16.
243. Mitchell et al op. cit. note 239 at C.
244. Broderick, J., Wood, R., Gilbert, P., Sharmina, M., Anderson, K., Footitt, A., Glynn, S. and F. Nicholls. November 2011. Shale gas: An Updated Assessment of Environmental and Climate Change Impacts. A report commissioned by The Co-operative and undertaken by researchers at the Tyndall Centre, University of Manchester. Tyndall Centre for Climate Change Research, University of Manchester, UK. This report also covers other environmental impacts other than green-house gas effects from shale gas exploitation.
245. Mitchell et al op. cit. note 239 at B.
246. Deane-Shinbrot, S., Ruggles, K., Walker, G. and S. Werth. Undated. Marcellus Shale: Cementing and Well Casing Violations. An Interactive Qualifying Project Submitted to the faculty of Worcester Polytechnic Institute in partial fulfillment of the requirements for the Degree of Bachelor of Science. Worcester Polytechnic Institute, USA.
247. The American Petroleum Institute (API) has different grades of cement for different depths, temperatures and pressure conditions.
248. For a useful report on water stress see Freyman, M. February 2014. Hydraulic Fracturing and Water Stress: Water Demand by the Numbers. Ceres, USA. [Online] Available at: http://www.ceres.org/resources/reports/hydraulic-fracturing-water-stress-water-demand-by-the-numbers/view.
249. Clark, P. and Crooks E. September 2, 2014. Water Shortages Pose Larger Than Expected Threat to Shale gas. Financial Times. [Online] Available at: http://www.ft.com/intl/cms/s/0/d6004afe-32b8-11e4-93c6-00144feabdc0.html#axzz3JQ5rTwAQ
250. Foss op. cit. note 78 at 47.
251. Euzen op. cit. note 61 at 59.
252. Rahm, B.G., Bates, J.T., Bertoia, L.R., Galford, A.E., Yoxtheimer, D.A. and S.J. Riha. 2013. Wastewater Management and Marcellus Shale gas Development: Trends, Drivers and Planning Implications. Journal of Environmental Management 120: pp. 105-113.
253. See Cohen op. cit. note 158.
254. The following Credit Suisse report covers some interesting ground on the US shale gas beneficiation. Credit Suisse. October 1, 2013. The Shale Revolution II. Securities Research and Analytics, Credit Suisse. [Online] Available at: http://www.credit-suisse.com/researchandanalytics.
255. See Glebova, O. November 2013. Gas to Liquids: Historical Development and Future Prospects. OIES Paper NG 80. The Oxford Institute for Energy Studies (OIES), Oxford, UK.
256. See Le Fevre, C. March 2014. The Prospects for Natural Gas as a Transport Fuel in Europe. OIES Paper NG 84. The Oxford Institute for Energy Studies (OIES), Oxford, UK.
257. See Creamer, T. September 8, 2014. SASOL Repositions Itself for Gas-Based Future. Engineering News, South Africa. [Online] Available at: http://www.engineeringnews.co.za/article/sasol-repositions-itself-for-gas-based-future-2014-09-08.
258. Spencer, T., Sartor, O., and M. Mathieu. February 2014. Unconventional Wisdom: An Economic Analysis of US Shale gas and Implications for the EU. Policy Briefs 5. The Institute for Sustainable Development and International Relations (IDDRI), Paris. [Online] Available at: http://www.iddri.org/Publications/Unconventional-wisdom-an-economic-analysis-of-US-shale gas-and-implications-for-the-EU.
259. It refers to flammable liquid mixtures of hydrocarbon derived from the refining of crude oil. It can be used to produce a variety of products from paraffin to cleaning solutions. It can also converted into ammonia and ethylene and used as a base product for plastics.
260. Berlingieri, G. September 25, 2014. Outsourcing and the Shift from Manufacturing to Services. VOX, USA. [Online] Available at: http://www.voxeu.org/article/outsourcing-and-shift-manufacturing-services
261. Mexico provides an interesting example. For more information see Bower, J. and Fuentes, R. May 2014. In Search of the Mexican Way: How to Kick Start Competition in the Electricity Sector and Achieve Lower Tariffs. Oxford Energy Comment. The Oxford Institute for Energy Studies (OIES), Oxford, UK.
262. Palmer, K., Burtraw, D., Woerman, M. and B. Beasley. August 2012. The Effect of Natural Gas Supply on Retail Electricity Prices. Issue Brief 12-05. Resources for the Future (RFF), USA.
59
263. See Christopherson, S. and Rightor, N. May 2011. How Should We Think About the Economic Consequences of Shale gas Drilling. Working Paper Series. City and Regional Planning, Cornell University, USA.
264. Weinstein, A.L. November 2012. Local Labor Market Restructuring in Shale Booms. (Draft) Department of Agriculture, Environmental and Development Economics, Ohio State University, USA.
265. Considine, T.J., Watson, R. and S. Blumsack. July 20, 2011. The Pennsylvania Marcellus Natural Gas Industry: Status, Economic Impacts and Future Potential. College of Earth and Mineral Sciences, Penn State University, USA.
266. See also IHS Global Insight (USA) Inc. December 2011. The Economic and Employment Contributions of Shale gas in the United States. Prepared for America’s Natural Gas Alliance.
267. Muehlenbachs, L., Spiller, B. and C. Timmins. September 29, 2012. Are Property Values Affected by Concerns Over Groundwater Contamination from Shale? VOX, USA. [Online] Available at: http://www.voxeu.org/article/property-prices-and-groundwater-contamination.
268. Weber, J.G. 2012. The Effects of a Natural Gas Boom on Employment and Income in Colorado, Texas and Wyoming. Energy Economics 34: pp. 1580-1588. This study looks more closely at the direct relationship between capital spend and job numbers. It finds that for every $1 million spent, only 2.35 jobs are created. The author points out that their estimates are much lower than other reports, by at least a fifth. Despite this, the author qualifies that employment impacts of shale gas, even with low job numbers, still have tangible effects on local economies.
269. For a more erudite discussion on this, see Teulings, C. and Baldwin, R. (Eds) 2014. Secular Stagnation: Facts, Causes and Cures. CEPR Press, UK. [Online] Available at: . http://www.voxeu.org/sites/default/files/Vox_secular_stagnation.pdf. The concept of ‘secular stagnation’ was originally described by Alvin Hansen in a paper he wrote in 1938. Lawrence Summers revived the idea in a speech he delivered a few years ago.
270. See a useful article by Horwitt, D. February 22, 2012. Federal Scientist Warn on NY Fracking Risks. Environmental Working Group, USA. [Online] Available at: http://www.ewg.org/research/federal-scientists-warn-ny-fracking-risks.

WWF-SA is a registered Non-Profit Organisation, number 003-226 NPO. © 1986 panda symbol and ® “WWF” Registered Trademark ofWWF-World Wide Fund For Nature (formerly World Wildlife Fund), Boundary Terraces, Bridge House, 1st Floor, Mariendahl Lane,Newlands, 7700, P O Box 23273, Claremont 7735, Tel: +27 21 657 6600, Fax: 086 535 9433, www.wwf.org.za
Why we are here
panda.org.za
To stop the degradation of the planet’s natural environment andto build a future in which humans live in harmony with nature.
WWF.ORG.ZA•
FRAMING THE ECONOMICS OF SHALE GAS IN SOUTH AFRICA ZA