Embed Size (px)
Citation preview
Teaching Statistics Through Data Investigations – Spring 2015 Page 1
Framework for Supporting Students’ Approaches to Statistical Investigations A Guiding Framework for the Teaching Statistics through Data Investigations
Hollylynne Lee and Dung Tran Friday Institute for Educational Innovation
NC State University
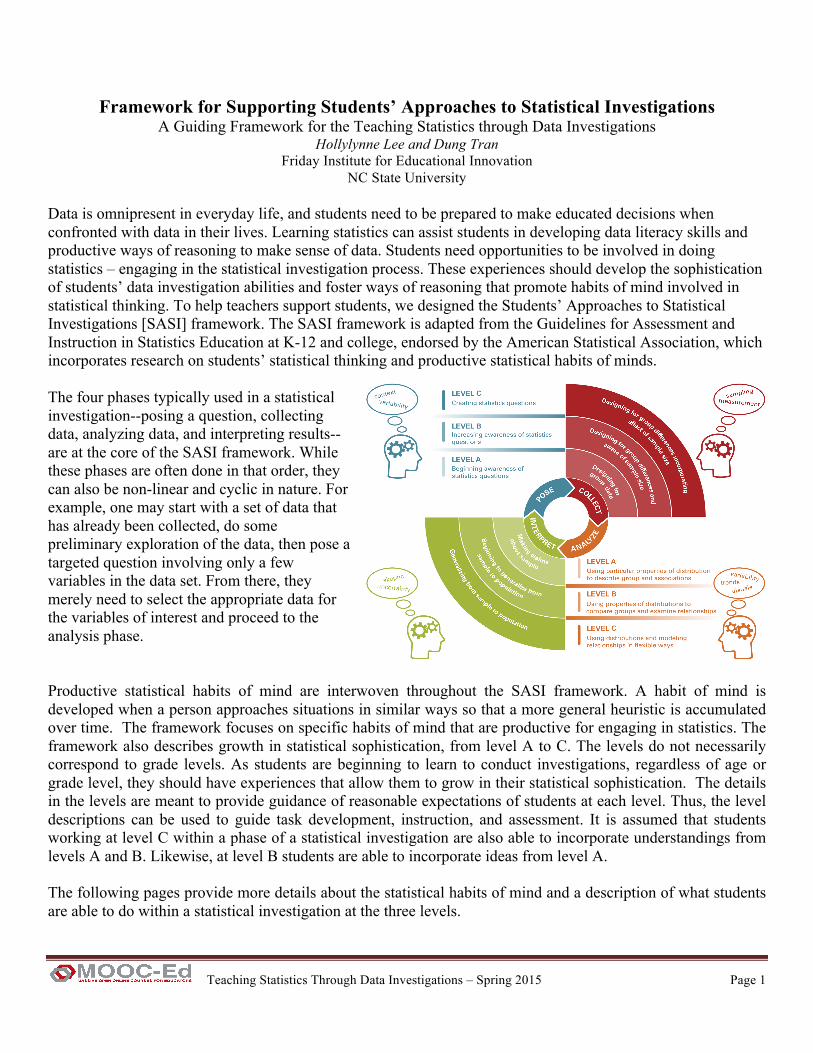
Data is omnipresent in everyday life, and students need to be prepared to make educated decisions when confronted with data in their lives. Learning statistics can assist students in developing data literacy skills and productive ways of reasoning to make sense of data. Students need opportunities to be involved in doing statistics – engaging in the statistical investigation process. These experiences should develop the sophistication of students’ data investigation abilities and foster ways of reasoning that promote habits of mind involved in statistical thinking. To help teachers support students, we designed the Students’ Approaches to Statistical Investigations [SASI] framework. The SASI framework is adapted from the Guidelines for Assessment and Instruction in Statistics Education at K-12 and college, endorsed by the American Statistical Association, which incorporates research on students’ statistical thinking and productive statistical habits of minds. The four phases typically used in a statistical investigation--posing a question, collecting data, analyzing data, and interpreting results-- are at the core of the SASI framework. While these phases are often done in that order, they can also be non-linear and cyclic in nature. For example, one may start with a set of data that has already been collected, do some preliminary exploration of the data, then pose a targeted question involving only a few variables in the data set. From there, they merely need to select the appropriate data for the variables of interest and proceed to the analysis phase. Productive statistical habits of mind are interwoven throughout the SASI framework. A habit of mind is developed when a person approaches situations in similar ways so that a more general heuristic is accumulated over time. The framework focuses on specific habits of mind that are productive for engaging in statistics. The framework also describes growth in statistical sophistication, from level A to C. The levels do not necessarily correspond to grade levels. As students are beginning to learn to conduct investigations, regardless of age or grade level, they should have experiences that allow them to grow in their statistical sophistication. The details in the levels are meant to provide guidance of reasonable expectations of students at each level. Thus, the level descriptions can be used to guide task development, instruction, and assessment. It is assumed that students working at level C within a phase of a statistical investigation are also able to incorporate understandings from levels A and B. Likewise, at level B students are able to incorporate ideas from level A. The following pages provide more details about the statistical habits of mind and a description of what students are able to do within a statistical investigation at the three levels.
Teaching Statistics Through Data Investigations – Spring 2015 Page 2
Statistical Habits of Mind
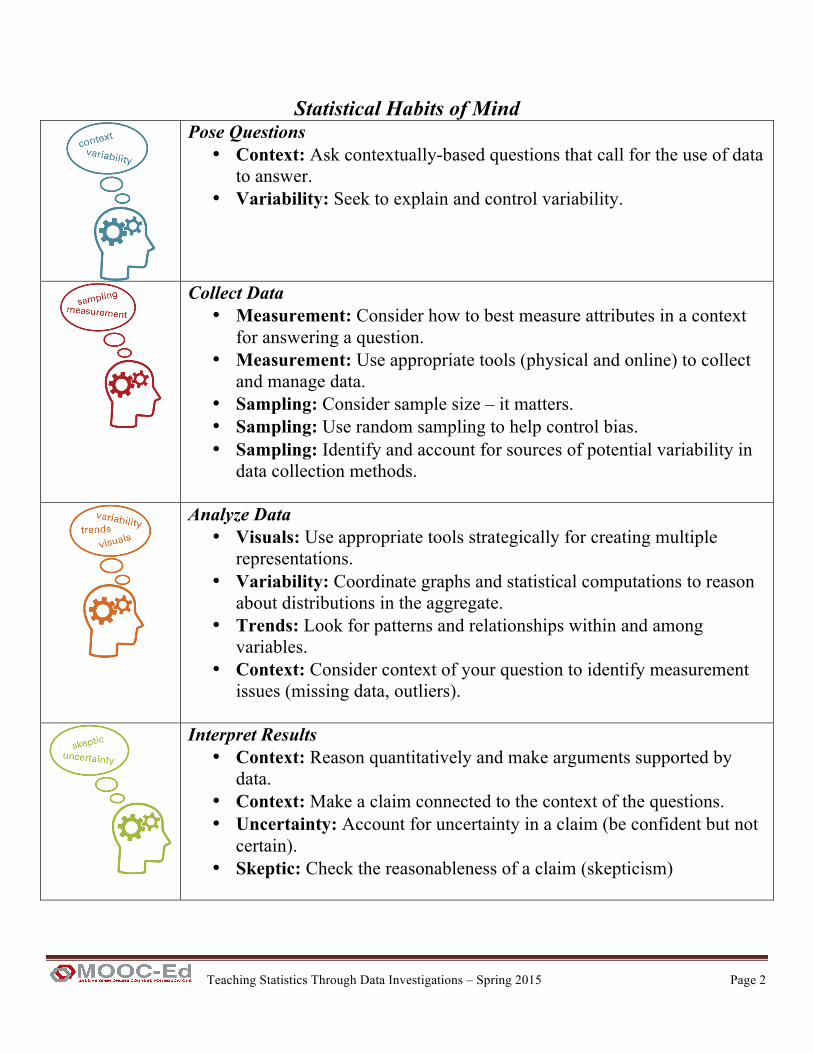
Pose Questions • Context: Ask contextually-based questions that call for the use of data
to answer. • Variability: Seek to explain and control variability.
Collect Data • Measurement: Consider how to best measure attributes in a context
for answering a question. • Measurement: Use appropriate tools (physical and online) to collect
and manage data. • Sampling: Consider sample size – it matters. • Sampling: Use random sampling to help control bias. • Sampling: Identify and account for sources of potential variability in
data collection methods.
Analyze Data • Visuals: Use appropriate tools strategically for creating multiple
representations. • Variability: Coordinate graphs and statistical computations to reason
about distributions in the aggregate. • Trends: Look for patterns and relationships within and among
variables. • Context: Consider context of your question to identify measurement
issues (missing data, outliers).
Interpret Results • Context: Reason quantitatively and make arguments supported by
data. • Context: Make a claim connected to the context of the questions. • Uncertainty: Account for uncertainty in a claim (be confident but not
certain). • Skeptic: Check the reasonableness of a claim (skepticism)
Teaching Statistics Through Data Investigations – Spring 2015 Page 3
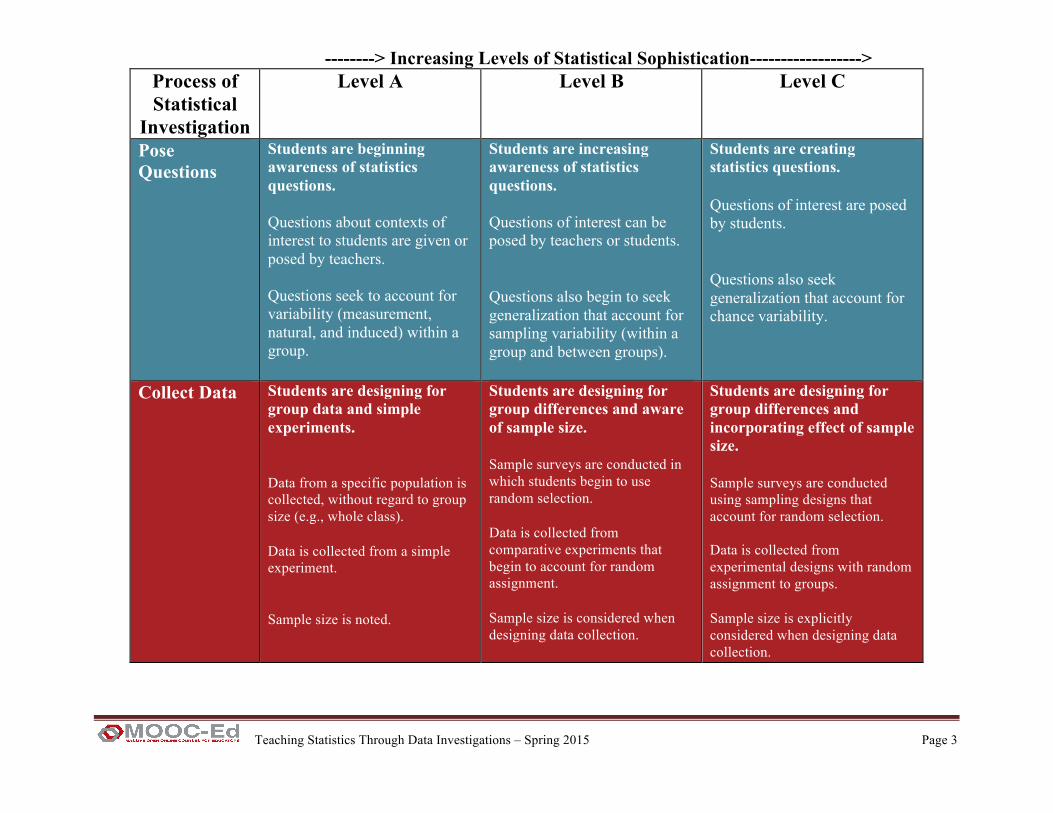
--------> Increasing Levels of Statistical Sophistication------------------>
Process of Statistical
Investigation
Level A Level B Level C
Pose Questions
Students are beginning awareness of statistics questions. Questions about contexts of interest to students are given or posed by teachers. Questions seek to account for variability (measurement, natural, and induced) within a group.
Students are increasing awareness of statistics questions. Questions of interest can be posed by teachers or students. Questions also begin to seek generalization that account for sampling variability (within a group and between groups).
Students are creating statistics questions. Questions of interest are posed by students. Questions also seek generalization that account for chance variability.
Collect Data Students are designing for group data and simple experiments. Data from a specific population is collected, without regard to group size (e.g., whole class). Data is collected from a simple experiment. Sample size is noted.
Students are designing for group differences and aware of sample size. Sample surveys are conducted in which students begin to use random selection. Data is collected from comparative experiments that begin to account for random assignment. Sample size is considered when designing data collection.
Students are designing for group differences and incorporating effect of sample size. Sample surveys are conducted using sampling designs that account for random selection. Data is collected from experimental designs with random assignment to groups. Sample size is explicitly considered when designing data collection.
Teaching Statistics Through Data Investigations – Spring 2015 Page 4
Process of Statistical
Investigation
Level A Level B Level C
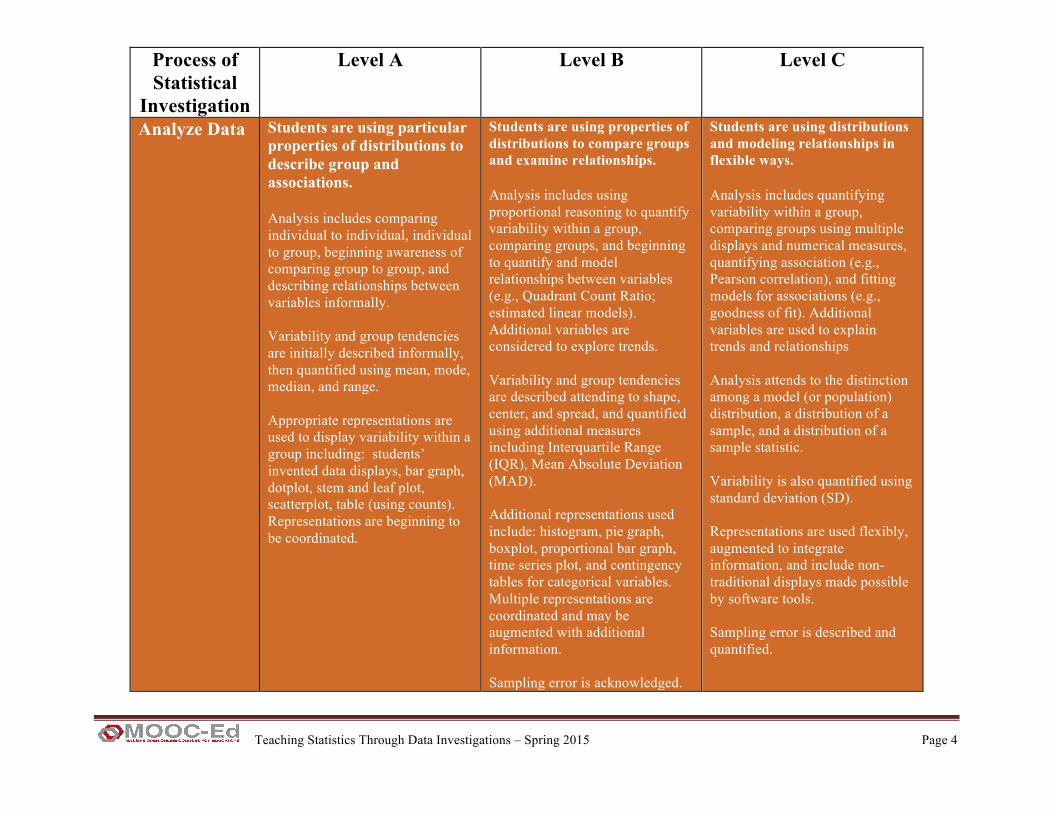
Analyze Data Students are using particular properties of distributions to describe group and associations. Analysis includes comparing individual to individual, individual to group, beginning awareness of comparing group to group, and describing relationships between variables informally. Variability and group tendencies are initially described informally, then quantified using mean, mode, median, and range. Appropriate representations are used to display variability within a group including: students’ invented data displays, bar graph, dotplot, stem and leaf plot, scatterplot, table (using counts). Representations are beginning to be coordinated.
Students are using properties of distributions to compare groups and examine relationships. Analysis includes using proportional reasoning to quantify variability within a group, comparing groups, and beginning to quantify and model relationships between variables (e.g., Quadrant Count Ratio; estimated linear models). Additional variables are considered to explore trends. Variability and group tendencies are described attending to shape, center, and spread, and quantified using additional measures including Interquartile Range (IQR), Mean Absolute Deviation (MAD). Additional representations used include: histogram, pie graph, boxplot, proportional bar graph, time series plot, and contingency tables for categorical variables. Multiple representations are coordinated and may be augmented with additional information. Sampling error is acknowledged.
Students are using distributions and modeling relationships in flexible ways. Analysis includes quantifying variability within a group, comparing groups using multiple displays and numerical measures, quantifying association (e.g., Pearson correlation), and fitting models for associations (e.g., goodness of fit). Additional variables are used to explain trends and relationships Analysis attends to the distinction among a model (or population) distribution, a distribution of a sample, and a distribution of a sample statistic. Variability is also quantified using standard deviation (SD). Representations are used flexibly, augmented to integrate information, and include non-traditional displays made possible by software tools. Sampling error is described and quantified.
Teaching Statistics Through Data Investigations – Spring 2015 Page 5
Process of Statistical
Investigation
Level A Level B Level C
Interpret Results
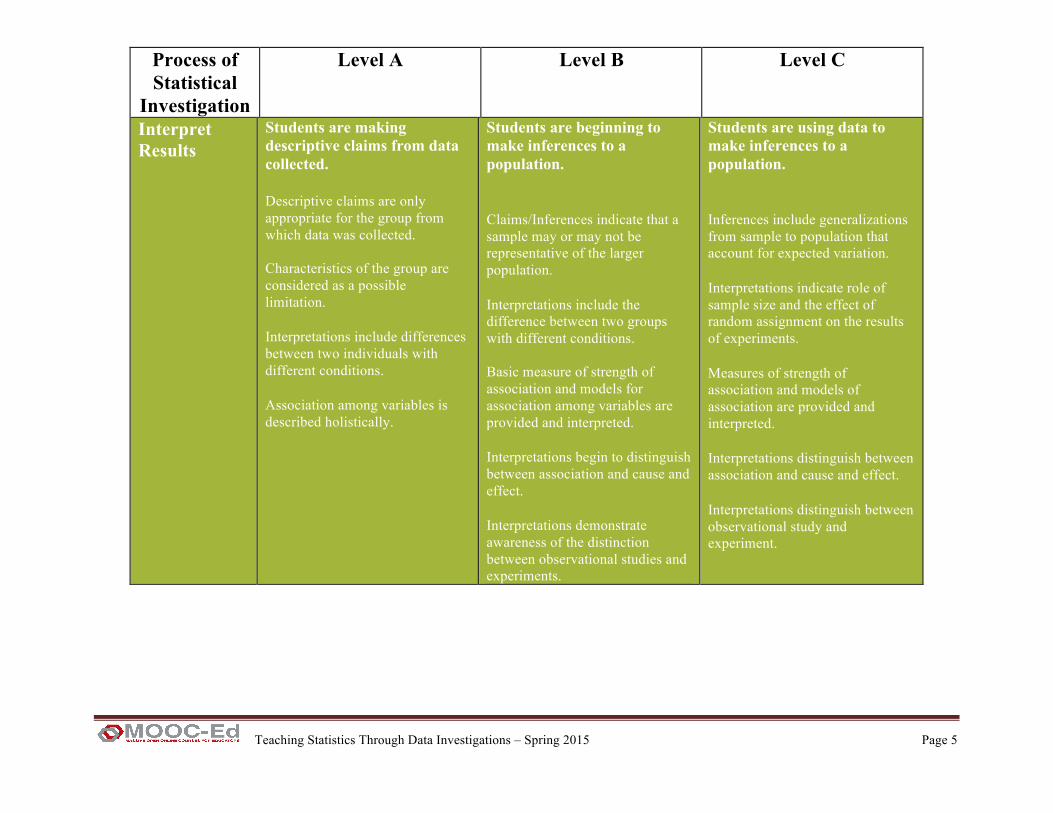
Students are making descriptive claims from data collected. Descriptive claims are only appropriate for the group from which data was collected. Characteristics of the group are considered as a possible limitation. Interpretations include differences between two individuals with different conditions. Association among variables is described holistically.
Students are beginning to make inferences to a population. Claims/Inferences indicate that a sample may or may not be representative of the larger population. Interpretations include the difference between two groups with different conditions. Basic measure of strength of association and models for association among variables are provided and interpreted. Interpretations begin to distinguish between association and cause and effect. Interpretations demonstrate awareness of the distinction between observational studies and experiments.
Students are using data to make inferences to a population. Inferences include generalizations from sample to population that account for expected variation. Interpretations indicate role of sample size and the effect of random assignment on the results of experiments. Measures of strength of association and models of association are provided and interpreted. Interpretations distinguish between association and cause and effect. Interpretations distinguish between observational study and experiment.
Teaching Statistics Through Data Investigations – Spring 2015 Page 6
References Ben Zvi, D., & Garfield, J. (2004). Statistical literacy, reasoning, and thinking: goals, definitions and
challenges. In D. Ben-Zvi & J. Garfield (Ed.). The challenge of developing statistical literacy, reasoning, and thinking (pp. 3-15). Kluwer.
Burgess, T. A. (2011). Teacher knowledge of and for statistical investigations. In C. Batanero, G. Burrill, C. Reading, & A. Rossman (Eds.), Teaching Statistics in School Mathematics-Challenges for Teaching and Teacher Education (pp. 259-270). Springer Netherlands.
Burrill G., & Biehler, R. (2011). Fundamental statistical ideas in the school curriculum and in training teachers. In C. Batanero, G. Burrill, C. Reading, & A. Rossman (Eds.), Teaching Statistics in School Mathematics - Challenges for Teaching and Teacher Education (pp. 57-69). Springer Netherlands.
Cuoco, A., Paul Goldenberg, E., & Mark, J. (1996). Habits of mind: An organizing principle for mathematics curricula. The Journal of Mathematical Behavior, 15(4), 375-402.
Franklin, C., Kader, G., Mewborn, D., Moreno, J., Peck, R., Perry, M., & Scheaffer, R. (2007). Guidelines for assessment and instruction in statistics education (GAISE) report. American Statistical Association. Online at http://www.amstat.org/education/gaise/.
Friel, S.N., O'Connor, W., & Mamer, J.D. (2006). More than “Meanmedianmode” and a bar graph: What's needed to have a statistical conversation. In G. F. Burrill (Ed.), Thinking and reasoning with data and chance (pp. 117-137). National Council of Teachers of Mathematics.
Garfield, J., Aliaga, M., Cobb, G., Cuff, C., Gould, R., Lock, R., ... & Witmer, J. (2005). Guidelines for assessment and instruction in statistics education (GAISE): College report. Alexandria, Virginia: The American Statistical Association.
Konold, C., & Higgins, T. L. (2003). Reasoning about data. In J. Kilpatrick, W. G. Martin, & D. Schifter (Eds.), A research companion to Principles and Standards for School Mathematics (pp. 193–215). Reston, VA: National Council of Teachers of Mathematics.
Lee, H. S., & Hollebrands, K. F. (2011). Characterizing and developing teachers’ knowledge for teaching statistics. In C. Batanero, G. Burrill, C. Reading, & A. Rossman (Eds.), Teaching Statistics in School Mathematics - Challenges for Teaching and Teacher Education (pp. 359-369). Springer Netherlands.
Peters, S. (2011). Robust understanding of statistical variation. Statistics Education Research Journal, 10(1), 52-88
Shaughnessy, J. M. (2007). Research on statistics learning and reasoning. In F. K. Lester (Ed.), Second handbook of research on mathematics teaching and learning. Charlotte, NC: Information Age.
Shaughnessy, M., Chance, B. L., & Kranendonk, H. (2009). Focus in high school mathematics: Reasoning and sense making in statistics and probability. National Council of Teachers of Mathematics.
Wild, C. J., & Pfannkuch, M. (1999). Statistical thinking in empirical enquiry. International Statistical Review, 67(3), 223-248.