Embed Size (px)
Citation preview

Policy, Research, and External Affairs
WORKING PAPERS
Country Operations
Eastern Africa DepartmentAfrica Regional Office
The World BankSeptember 1991
WPS 767
Frameworkfor Macroeconomic
Analysis
(Applied to Kenya)
Colin A. Bruceand
David Ndii
Models of the RMSM-X genre can - while preserving theirlogical structure - incorporate behavioral equations and pro-vide useful insights into policy actions thiat would correctinternal and external macroeconomic imbalances.
The Policy, Research, and Extemal Affairs Complex distobutes PRE Working Papers to dissemuate the findings of work in progress andto encourage the cxchange of ideas ar-ong Bank staff and all others interested in deselopmnent issues. These papers carry the names ofthe authors, reflect only their views, and should be used and cited accordingly. The findings, unterpretauons, and conclusions are theauthors' own. They should not be attributed to the World Bank, Its Board of Directors, its managcment, or any of its member countries.
Pub
lic D
iscl
osur
e A
utho
rized
Pub
lic D
iscl
osur
e A
utho
rized
Pub
lic D
iscl
osur
e A
utho
rized
Pub
lic D
iscl
osur
e A
utho
rized
Pub
lic D
iscl
osur
e A
utho
rized
Pub
lic D
iscl
osur
e A
utho
rized
Pub
lic D
iscl
osur
e A
utho
rized
Pub
lic D
iscl
osur
e A
utho
rized
Policy, Research, and External Affairs
Country Operations
WPS 767
This paper- a product of the Country Opcrations Division, Eastern Africa Department, Africa RegionalOffice - is part of a larger PRE effort, led by the Macroeconomic Adjustment and Growtlh Division,Country Economics Department, to develop a macroeconomic projection model that will improve andextend the Bank's RMSM model. Copies are available free from the World Bank, 1818 H Street NW,Washingtor DC 20433. Please contact Margaret Lynch, room 110-271, extension 34046 (10(4 pages,including figures and tables).
Bruce anl Ndii develop a macroeconomic model projections. For ease of exposition, these gapsfor Kenya that projects detailed national, fiscal, are assumed to be independent.monetary, and private sector accounts, and thebalance of payments. With no changes in its Next, Bruce and Ndii illustrate the model'slogical structure, the model also calculates the usefulness in calculating the policy adjustmentsmagnitude of policy adjustments that would - exchange rate, interest rate, and monetizationeliminate external and internal imbalances. - that would eliminate intemal and extemal
macroeconomic imbalances. The policy adjust-Their approach emphasizes transparcticy and ments are applied independently and jointly.
user-friendliness, which they achieve in two Predictably, the exchange rate depreciates toways. First, historical data - the basis for eliminate the external financing gap. Similarly,projections - are entered in worksheets that are the real domestic loan interest rate rises, crowdssimilar (in format, coverage, and units of ac- out private investment, and releases financing forcount) to standard tables produced by the data the residual PSBR. The model also calculatesgenerating agencies. Second, key behavioral the level to which domestic inflation would haveassumptions and targets are entered in a clearly to rise to finance the residual PSBR throughi andesignated worksheet. This worksheet contains inflation tax.details such as commodity price projections andthe LIBOR rate that would nornally be provided When activated jointly with exchange rateby the Bank's International Trade Division. This depreciation, a smaller increase in the interestworksheet also accommodates coefficients for rate eliminates the residual PSBR. This isthe import and export price and income elastici- because the exchange rate adjustment improvesties by major commodity groups; the interest and the net foreign assets position and increases theincome elasticities of private investment; and the scope for creating domestic credit. Understand-impact of inflation, income growth, and changes ably, therefore, the increase in interest rate isin interest rates on the demand for currency, even smaller whCIl action in the exchange rate isdemand deposits, and time deposits. The targets combined with partial monetization of the fiscalinclude domestic inflation and sectoral growth deficit.rates.
As an important by-product. these simula-Initially, they use the f'ramework to project tions also illustrate the impact of exchange rate
detailed national and sectoral accounts, including and interest rate adjustments on the fiscal deficit.the financeable fiscal deficit. But they arcespecially interested in the external financing Subsequent versions of the model willgap and the residual public sector borrowing endogeniize growth andi extend coverage to therequirement (PSBR) that emerge in these base consolidated public sector.
The PRE Working Paper Serics disseminates thc findings of work under way in the Bank's l'olicy, Research, and ExtemalAffairsCornplcx. An objectiveofthcseries is to get these finidingsout quickly. even if presentations are less than fully polishedThe findings, interpretations, and conclusions in these papers do not necessarily represent offic ial Bank policy.
ProdUced hy the PRE Dissemination Center
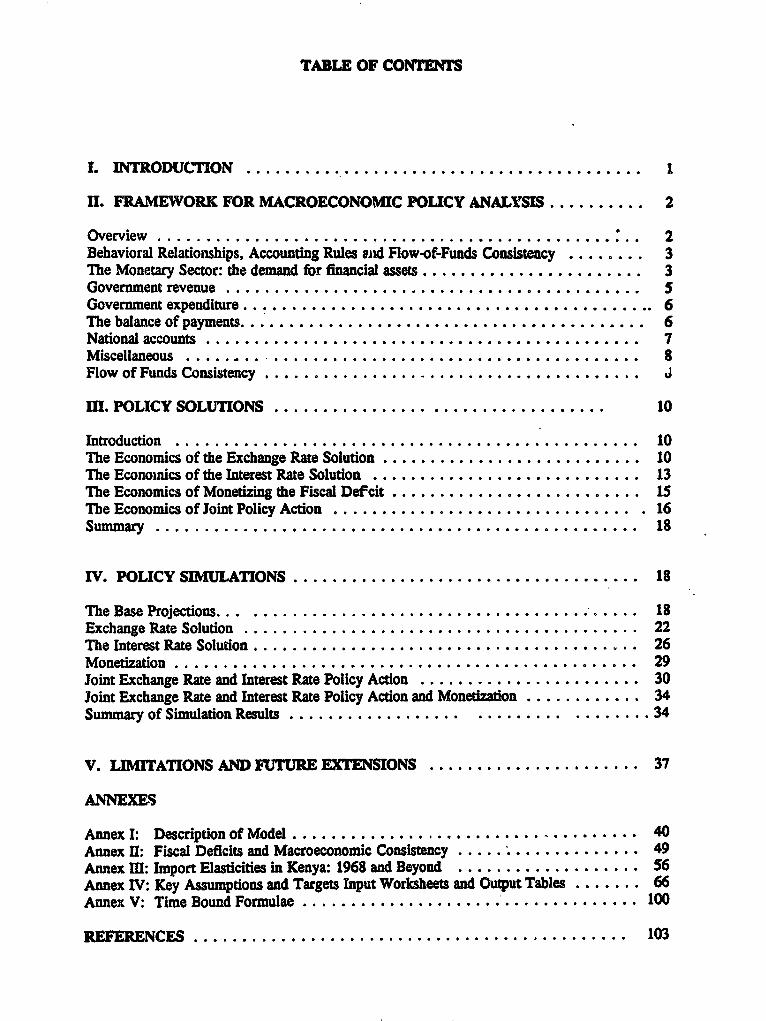
TABLE OF CONTENIS
I. INTRODUCTION ............... I1
U. FRAMEWORK FOR MACROECONOMIC POLICY ANALYSIS. 2
Overview 2..... : 2Behavioral Relationships, Accounting Rules md Flow-of-Funds Consistency 3The Monetary Sector: the demand for fimancial assets. 3Government revenue ............... 5.. ............... SGovernment expenditure ............... 6The balance of payments ............... 6National accounts ............... 7Miscellaneous .............................................. 8Flow of Funds Consistency ................................ 8
III. POLICY SOLUTIONS .10
Introduction .10The Economics of the Exchange Rate Solu.on .10The Econouics of the Interest Rate Solution .13The Economics of Monetizing the Fiscal Defcit .15The Economics of Joint Policy Action. . 16Summary .18
IV. POLICYSIMLATIONS .18
The Base Projections ... . ........................................ 18Exchange Rate Solution ......................................... 22The Interest Rate Solution ..................................... 26Monetization ....... 29loint Exchange Rate and Interest Rate Policy Action.ii*v***@*********** 30Joint Exchange Rate and Interest Rate Policy Action and Monetzati.on .34Summary of Simulation Results. .............. ....... ... 34
V. LIMITATIONS AND FUTURE EXTENSIONS .......... 37
ANNEXES
Annex I: Descripdon of Model . ............................. 40Annex 11: Fiscal Deficits and Macroeconomic Consistency .................... 49Annex III: Import Elasdcities in Kenya: 1968 and Beyond 56Annex IV: Key Assumptions and Targets Input Worksheets and Output Tables 66Annex V: Time Bound Formulae ..................... I 100
REEEESNCS .103
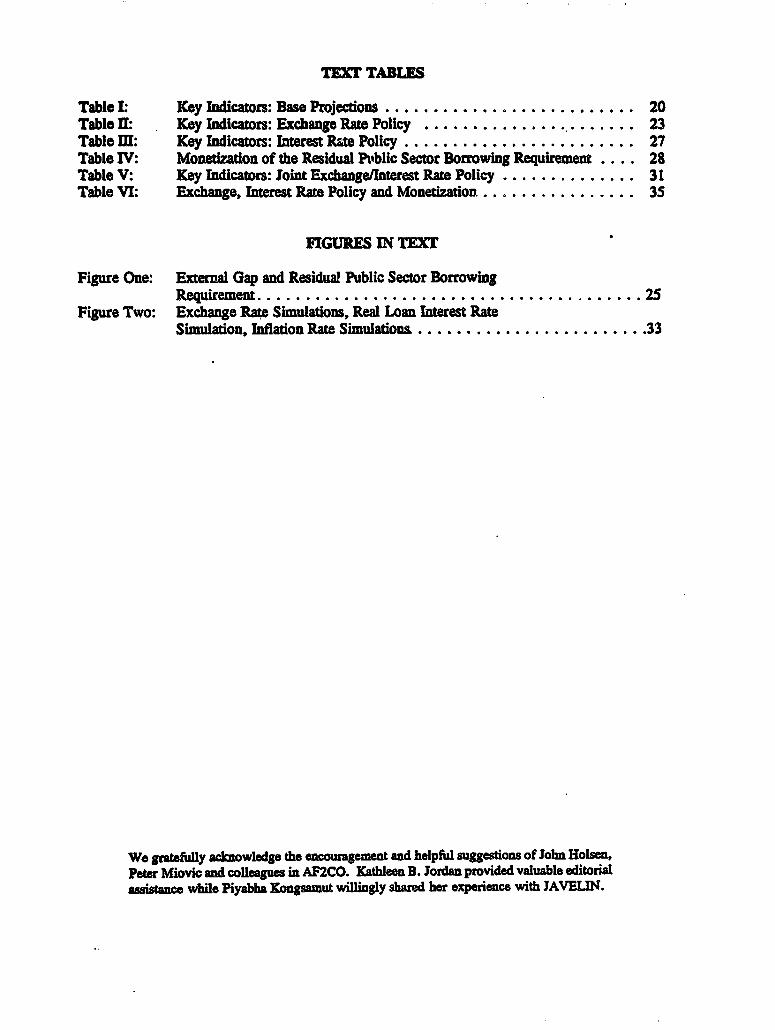
TEff TABLES
Table I: Key Indicators: Base Projections .......................... 20Table 11: Key Indicators: ExchageRate Policy ........ ............... 23Table m: Key Indicators: Interest RatePolicy ........................ 27Table TV: Monetzaton of the Residual Pt'blic Sector Borrowing Requirement .... 28Table V: Key Indicators: Joint Exchange/Inters Rate Policy ..... ......... 31Table VI: Exchange, Interest Rate Policy and Monedizatio ................ 35
FIGURES IN TEXT
Figure One: External Gap and Residual Public Sector BorrowingRequirement .......... ......................... 25
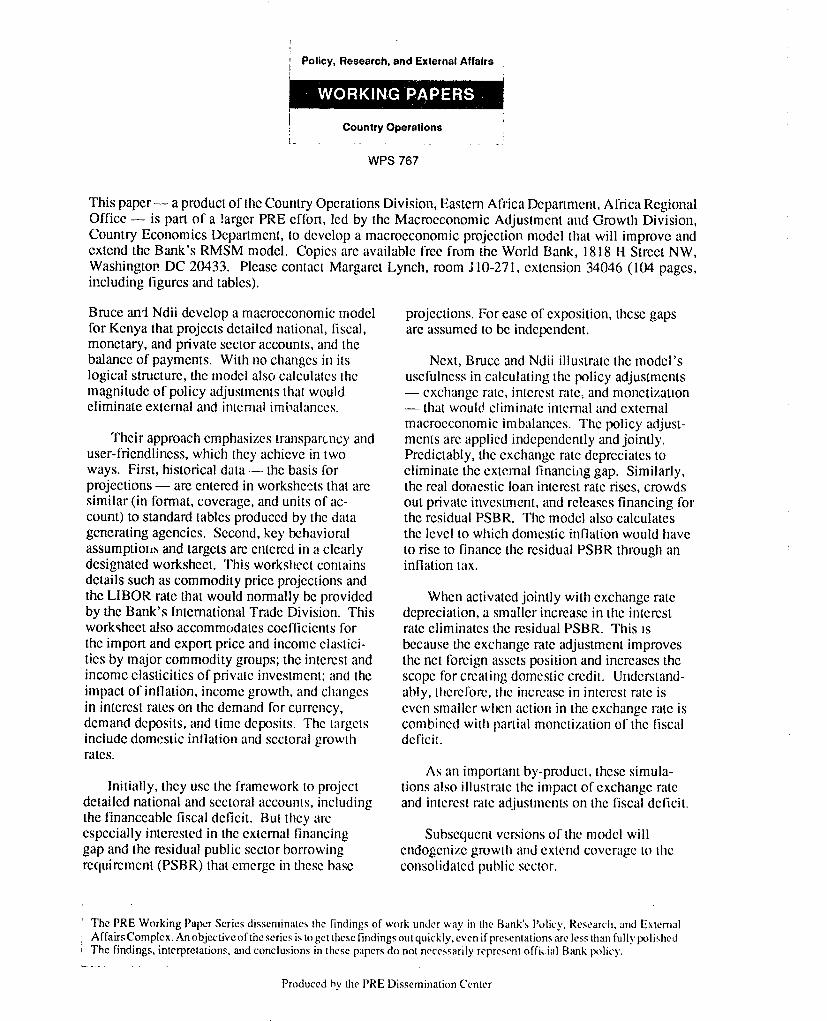
Figure Two: Exchange Ra Simulations, Real Loan nterest RateSimuaion, flation Rate Simulaions ........................ 33
We gtezly wknowledge the ugemeand helpful suggestio of John Holem,Pew Miovic and coleague i AF2CO. Katheen B. Jordan provided valuable editonalausitanc whil plyabha Kongsamut wiligly shared her experence with JAVELIN.

Introduction
1.1 This paper presents a transparent, user-friendly framework for analyzing macroeconomic
policy issues in Kenya. It adheres to flow-of-funds consistency, covers the fiscal, monetry,
national and private sector accounts, and balance of payments, and is an analytical tool for
grappling with the economic relationships and institutional realities which ultimately dictate the
design, implementation and effectiveness of macroeconomic policies. The model is programmed
in JAVELIN.
1.2 A recent report concluded that Kenya's "... recovery ... is somewhat fagile as it has
relied on foreign savings, leaving the economy vulnerable to external shocks, and the remaining
domestic macroeconomic imbalances, unless corrected, threaten to undermine recent economic
and stabilization gains." (World Bank, 1990). The model presented in this paper is usefil to the
policy analyst who may wish to project the broad magnitude of these imbalances under different
fiure growth assumptions. With these results in hand, the policy analyst may choose to revise
growth targets in an ad hoc, piecemeal manner until acceptable" imbalances are obtained and
then focus on mobilizing inflows to fill the resource gaps. Alternatively, the policy analyst may
wish to determine what levels of imbalances are sustainable, financeable and consistent with other
development goals. Here judgment about institutional/political feasibility is indispensable. But
so too is a map of inviolable accounting macro-relationships, their evolution under different
behavioral assumptions, and the technical limitations they impose on policy selection and
effectiveness. The model developed in ftis paper is such a map which could also demonstrate
-2-
the usefulness of instruments such as the interest rate, exchange rate and monetary policy in
managing macroeconomic imbalances and steering the economy doser to its development goals.
1.3 The paper is organized as follows. Chapter Two sketches the analytical firamework and
discusses the econemics of its structure. Chapter Three contains the policy solutions (the
technical details are presented in Annex I). Chapter Three illustrates three policy options-
exchange rate adjusunent, interest rate adjustment and monetization-and highlights their
implications when used individually and jointly. Chapter Five identifies the model's limitations
and scope for expansion.
II. Framework for Macroeconomic Policy Analysis
Ovrview
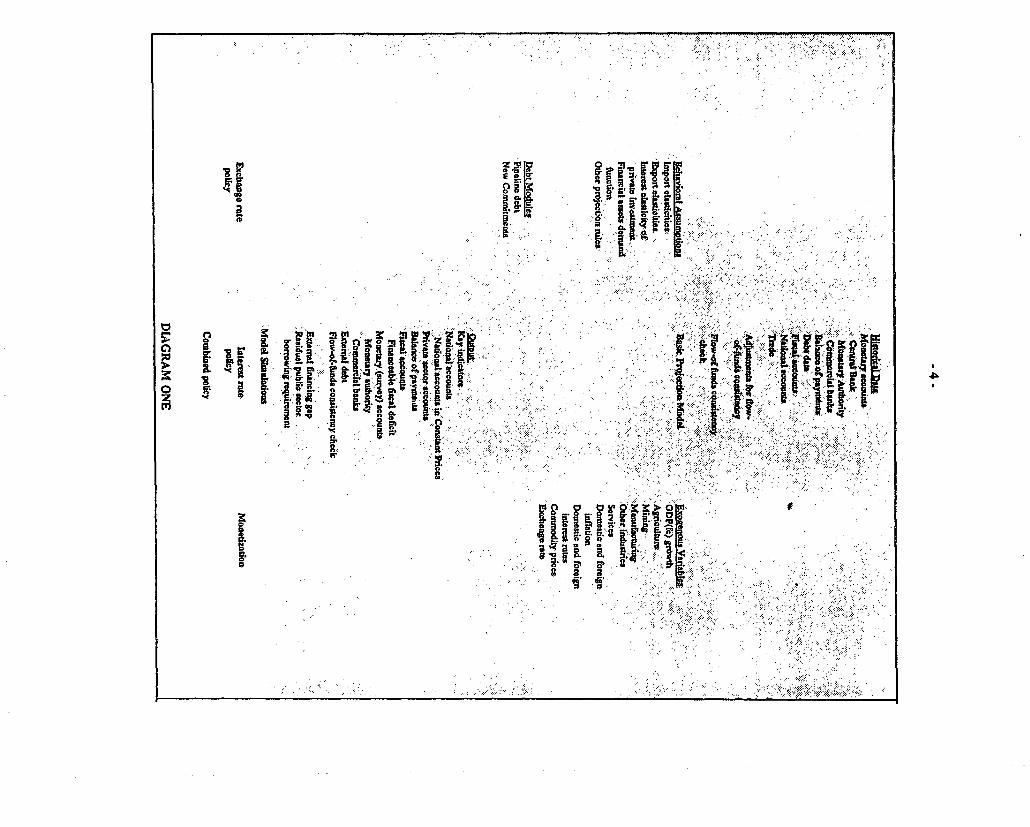
2.1 The model comprises .ix data input worksheets, debt modules for existing and new
external debt, and output tables (Diag:am One). There is also one central worksheet which
contains key behavioral assumptions and macroeconomic targets. The model covers the national
accounts as well as the accounts of the central bank, the monetary authority, the commercial
banks, the central government, the external sector (trade, balance of payments and external debt)
and the non-financial private sector. 11 The projection period is 1990-96.
2.2 The data inpit worksheets contain annual historical data for 1987-89. In general the
format, units of account and coverage of these worksheets are similar to standard tables produced
by the data-generating agencies of the GovernAent of Kenya. The exceptions are the worksheets
.L1/. TM accounts of monewy auhority consolidate the accounts of the central bank with the accounts arising frommoncay funiions undertaken by other insitutions or tho cntral govemment.

3 -
for central government finances and exteumal debt which eome from the IM and the World Bank
respectively. Ihese historical data must be consistent within and across sectors, and conform to
standard macroeconomic accounting rules. Both of these requirements obtain in the flow of finds
famework. Accordingly, the model reconciles historical data for flow of fumds consistency and
then uses them as the basis for projections.
Behavioral Relationships, Accoundng Rules and Flow-of-Funds Consistency
2.3 Macroeconomic accounting rules and flow of funds consistency set limits within which
economic behavior takes place in the model. The accounting rules and flow of funds consistency
requirements are the same as those set out in Holsen (1989), Khadr et al. (1989) and Easterly et
al. (1990). The behavioral relationships are the projection rules for variables. Some originate
in econometric analysis that has yielded coefficients linking the variable of interest to its
determinants. Others are constant ratios of other vaiables with which they had, or are exp -- ted
to have, a stable long run relationship. Yet others are projected on the basis of their relationship
to variables whiclt are exogenous to the model.
2.4 To simplify the exposition of the model, this section only specifies and discusses the main
behavioral relationships in the monetary sector, the central government accounts, the external
sector and the national accounts. A more comprehensive notational presentation of the behavioral
relationships, with their flow-of-fimds accounting identities, is provided in Annex I.
The Monetar Sector: the demand for financial assets
2.5 The model identifies demand functions for three financial assets-currency, demand
deposits and time deposits (quasi-money). The demand for currency is a positive fniction of real
income growth and a negative function of the real deposit interest rate and the rate of inflation.
C ~ ~ ~ ~ ~ ~ ~~ D . , ..l .
t t i , 0 t i | [!|i W. : .
C2 Li~~~~~~~~~~~~~~~~~~~~~~~~~~~~~~~~~~~~~~~~~~~~~~~~~~~~~~~~~~~~~~~~~~~~~~~~~~~~~~~~~~~~~~~~~~~~~~~~~~~~~~~~~~~~~~~~~~~~~~~~~~~~~~~~
. ',' . ' '' 00 'S' ,, z"'V i; ', ''. ii >. "''0 2'.'z,y,'
~~~~~~jj; : ¢.. :"Ij tr ', ,,, '- -i.'
~~~~~~~X:'',.''' .- .. , 4 ,a.:, . .... :,, ., . , :.>; ,ieQ

-5-w
The demand for demand deposits and time deposits is a positive fnction of real income growth,
a negative function of the rate of inflation, and a positive function of the real interest rate on
deposits. In essence, the demand for currency, demand deposits and time deposits increases with
national income but is eroded by inflation. Demand and time deposits, unlike currency, earn
interest and therefore move in the same direction as interest rates. The coefficients entering the
framework are based on econometric estimates discussed in Annex H. The model ensures
consistency between financial stocks and flows by expressing flows as changes in the respective
stocks over the specified period. Where appropriate, stocks are derived by aggregating flows.
Government revenue
2.6 In the model, government revenue falls into two main categories, recurrent revenue and
capital revenue. Recurrent revenue is subdivided into direct taxes, indirect taxes and other
recurrent items. Direct taxes throughout the projection period are assumed to maintain the ratio
of direct taxes to GDP (at factor cost) estimated for the base period, 1987-89. Other recurrent
items obey a similar projection rule. Indirect taxes are disaggregated into sales taxes on domestic
manufactures and imports, duties on imports, and other taxes and licenses. 21 In turn, each of
these revenue categories is projected with respect to the activities which generate them. Sales
taxes on imports (in local currency) are assumed to maintain the ratio of sales taxes to total
imports (in local currency) esimated for the base period, 1987-89. The same relationship is
assumed for sales taxes on exports with respect to exports and for duties on imports with respect
to imports. Other indirect taxes are projected in a similar way but are linked instead to the pool
of tax revenues (net of indirect taxes).
Z/ Duties on exports have been discontinued by the Government of Kenya.
-6-:
Governm t penditure
2.7 Govenment consumpdon expenditr has two main cowponents. The first is wages and
salaries which are determined by an exogenous nominal growth target. The second component
is expenditure on goods and services. Its relationship to government consumpdon expenditue
is assumed to be the same in the future as in 19874B9. Subsidies, trnsfers and other current
expenditures are projected in a similar mner but with respect to GDP. Interest on foreign debt
is calculated by the debt module on the basis of the debt stock. Interest on domestic debt is
calculated in a similar manner.
2.8 External inflows are an important source of funding for and determinant of government
capital expenditure. Often these inflows finance imported investment goods. Accordingly, the
model projects government capital expenditure as a fixod ratio of government imports, based on
the ratio in 1987-89. In turn, govermment imports are linked to long-term capital inflows (as
at 198749) which are computed in the debt module.
The balance of payments
2.9 Exports are disaggregated into commodity groups-coffee, tea, horticulture, petroleum,
maize, manufacatring, re-exports, other goods and non-factor services. The import groups
idendfied are food, petroleum, other consumption goods, primary intermediate goods,
manufacturing intermediate goods, capital goods, leases, government imports, and non-factor
services. With the exception of leases of aircrafts and government imports, these traded goods
are projected solely on the basis of their estimated elasticities with respect to GDP and to their
prices in local currency (Annex o).
2.10 Thrughout the projecon peiod net crret fer, nct direct rbr?ign investment,
offici gram and short-term captal are deemined by their respective ratios to GDP estiated
for 1987-89. Long-term public and publicly guamteed inflows, Don-guaranteed private medium
and long-tem inflows together with their amorzation and interest obligadons are calculated in
the debt module. Short-term public and private debt are assumed to be a fixed ratio of total long-
term inflvuw. Interest on short-term extenal debt and on reserves is determined by applying
the exogenous foreign interest rate to their stocks. Reserve accumlation is derived from the
overall balance of payments or stated as an explicit target.
National accounts
2.11 Several items for the national accounts are determined in the sectoral accounts described
in paras. 2.6 to 2.10. They include indirect taxes, subsidies, the net current transfers in the
balance of payments, Government consumption and investment. Domestic savings is simply the
difference between total investment and the external resource gap. LikbwiLe, national savings
is the difference between total investment and the current account balance. Private savings is the
residual after public savings-defined as the current balances in the fiscal accounts-is subtracted
from national savings.
2.12 GDP at ftctor cost is broken down into value added in agriculture, mining,
imanufacturing, other industry and services. Growth in each of these sectors is projected
exogenously. GDP at market prices is then determined in conjunction with net direct taxes which
are calculated in the fiscal account.
2.13 Public investment and consumption are projected in the public sector accounts. Private
Iinestment is a negative function of the change in the real domestic loan interest rate and a
-8-
positive function of GDP growth. Private consumption is the residual item for balancing GDP
at market prices with gross domestic expenditure
Miscellaneous
2.14 Tle projected population growth rate, dollar prices of Imports and exports including the
manufactuing uiit index, and LIBCOR are external to the model and are obtained from sources
within the World Bank. The commodity prices from these sources serve as inputs into the
exl,ort, import, investment, consumption and GDP deflators. All deflators are weighted by the
shares of commodities whose prices enter their calculation.
Flow of Funds Consistency
2.15 Economic flows generated in one sector may be used within that sector or other sectors
of the economy. This is the fundamental organizing principle of the flow of funds consistency
framework as presented in Holsen (19S9), Khadr et al. (1989) and Easterly et al. (1990). It
classifies each variable as a source of funds or a use of funds. The sources and uses may be
current or capital. Consistency prevails when current sources of funds equal current u;es of
funds within eack. sector and in the overall economy. The same condition holds for capita
sources and uses of finds.
2.16 The flow of funds identities for the nonetary sector, central government finances, the
balance of payments and the national accounts are presented in Annex I. They include the stocks
and flows of the central bank, monetary authority and commercial banks, as well as the non-
financial private sector. The projectigns derived from the behavioral relationships satisfy these
identities at the sectoral and aggregate level. Historical data, however, required several
adjustments to achieve consistency. An adjustment was made for consistency among the capital

-9-
fiows and stocks implied by the debt data, the balance of payments, the fiscal accoun and the
monetary accounts. Similar calculations were done after balance of payments data in the national
accounts were compared with the figures in the balance of paymen. The rule of thvmb was to
identify those adjustments which made the data in each input worksheet internally consistent,
reconciled stocks with flows and achieved intersectoral consistency in relation to the national
accounts.
2.17 Historical net foreign assets of the central bank and monetary authority were also adjusted
for consistency with their capital sourcm. This adjuement became the balancing item in the
capital sources of the balance of payments. An adjustment was also needed to make the capital
uses of government revenue equal to the capital sources. This adjustment balanced the private
sector's sources and uses of funds. Finally, the total historical sources of the capital funds of
the central government were changed by an amount which became the balancing item for the
historical uses of capital funds by the private sector. After reconciliation for flow-of-funds
consistency, the historical data are used by the model as the basis for projections and policy
simulations.
- 10-
HI. POLICY SOLUTIONS
Introduction
3.1 This chapter discusses the economics of using exchange rate policy, interest rate policy
and monetization of the fiscal deficit, independently and jointly, to redress macroeconomic
imbalances. These policy instruments have been selected because of their increasing role in
managing the Kenyan economy. Prior to 1982, Kenya had a fixed exchange rate regime.
Increasingly since 1985, the exchange rate adjustments have been used to ensure Kenya's external
competitiveness, support the import liberalization program, and strengthen the overall
macroeconomic policy environment. The regulation of interest rates in Kenya dates back to
1974 but movement toward market-determined interest rates is expected to be completed by June
1991. Other instruments for managing monetary aggregates are also being strengthened.
The Economics of the Exchange Rate Solution
3.2 The exchange rate policy simulation computes the exchange rate at which the specified
external financing gap would be closed at a given GDP level. ai The solution depends largely
on the negative relationship between import demand and import prices, and the positive
relationship between export supply and export prices. A devaluation of the exchange rate would,
other things being equal, raise the domestic currency prices of traded goods, increase the supply
of exports, decrease the demand for imports and narrow the resource gap. Because the exports
and imports are each subdivided into major commodity groups-each with its own price and
income elasticity-the model can account in a realistic way for differences in response lags. For
/ 'MTho ternal fancing gap is the additional capital inflows-over and above those already accounted *br-whichare required to finance the current account deficit in the balance of payments and to meet the reserveaccumulaton target.

- I1 -
example, in the absence of large stocks, the supply response of coffee exports to coffee price
increases is likely to be slower than manufactured items. Imported food, with its many local
substitutes, is likely to be more sensitive to price changes than imported crude oil which has no
close local substitutes. Similarly, to the extent that government imports are financed by donors,
their demand is expected to be fairly inelastic with respect to prices.
3.3 All other variables in the model which are linked to exports, imports and the exchange
rate are affected by this solution. When the exchange rate is devalued, governnent revenue from
imports falls if there is a reduction in the local currency value of imports. An exchange rate
devaluation would also increase the domestic currency expenditure on foreign debt service and
externally financed activities. In addition, it would increase the domestic currency receipts from
external transfers, loans and grants. The impact of the exchange rate depreciation on the fiscal
deficit therefore would be ambiguous.
3.4 To maintain macroeconomic consistency, domestic investment and/or savings must adjust
when an exchange rate devaluation results in the importation of fewer goods and the export of
more goods. Consider the simple macroeconomic identity:
+ ?-
GDP(fc) + Ti (net) = Cp + Cg + Ip + Ig + X -M (1)
where GDP(fc) is gross domestic product at factor cost, Ti (net) is net indirect taxes, Cp and Cg
are private and public consumption respectively, Ip and Ig are private and public investment
respectively, X is exports and M is imports-all in domestic currency units. Equation (1) equates
the total current sources of fimds with the total current uses of funds in the national accounts. The
12 -
signs above the variables indicaze their possible response ('+' is positive,'-' is negative) to an
exchange rate devaluation. Equation (1) shows that variables on left and right hand sides of
equation (1) may have to adjust to maintain equality.
3.5 GDP at factor cost (measured in domestic prices) is exogenous and therefore does not
change with exchange rate movements in the model. In contrast, indirctames could rise or fall.
Public consumption comprises government consumption and wage targets, and therefore is not
affected in the model by exchange rate changes (paras. 2.7, 2.12). Private investment is
deternined by the real domestic loan interest rate and GDP at factor cost. Neither is affected by
exchange rate movements in the model. By definition, the increase in the resource balance (X-M)
would be greater than any increase in net indirect taxes Ti) (for a given tax rate). Accordingly,
Cp and/or Ig must fall to maintain equality in equaion (1). Ig could only fall on economic
grounds if government imports, including inputs into investment, fall in response to the exchange
rate devaluation. Ultimately, if government investment does not contract sufficiently, the
residual variable-private consumption-must fall. In essence, private domestic savings must rise
to finance the unchanged level of private investment and a largely unchanged or slightly reduced
level of government investment, becuse of the reduction in foreign savings (X-M).
3.6 The exchange rate solution affects monetary aggregates via its impact on the net foreign
exchange assets and the demand for financial assets. Equation (2):
M g+ +* . +4.
M1 (rd,wr,gdpfc) + QM (rd,Tr,gdpfc) + Nol = NFA + Lcg + Ldg + Lmip (2)
- 13 -
represents equilibrium in the monetary sector, where MI is currency (negative function of the
real interest rate) and demand deposits (positive function of the real interest rate), QM is time
deposits (quasi-money), rd is the real domestic loan interest rate, X is the rate of domestic
inflation, NOL is the flow of net other liabilities of the monetary system, NFA is the net foreign
assets, Lcg is the flow of net credit from the central bank to the government, Ldg is the flow of
net lending from the commercial banks to the government and Lmp is the flow of net credit to
the private sector. Equation (2) equates the total capital sources of funds with the total'capital
uses of funds in the monetary survey; that is, equality of the liabilities and assets of the banking
system as a whole. While it is obvious that NFA could be affected by an exchange rate
devaluation, it is also conceivable that only variables on the left hand side of the equation would
change. MI and QM are negatively affected by inflation which could be induced by the exchange
rate policy but they are driven in different directions by real interest rates. The important point
is that equation (2) has economically meaningful behavioral flexibility to achieve overaU balance
after an exchange rate adjustment.
The Economics of the Interest Rate Solution
3.7 The interest rate simulation computes the interest rate at which the residual public sector
borrowing requirement would be met by borrowing from domestic commercial banks, given the
level of GDP and the private sector's demand for credit from these banks. _4/ Because of data
limitations, the 'public sector" is limited to the central government in the model.
3.8 The recent Country Economic Memorandum ascribes three main objectives to interest
rate policy in Kenya. The first is to maintain positive real interest rates in order to encourage
41 The residual public sector borrowing requirement is defined in the model u the additional domestic financing--net of the anticipated current and capital revenues, and domestic and foreign financing-which would covertotal government expenditure.

- 14 -
savings and thereby contribute to the mobilization of financial resources. The second objectve
is to move gradually to market determined interest rates which in turn would encourage a more
efficient allocation of credit across and within sectors. The third goal is to encourage competition
between commercial banks and near-bank financial institutions by reducing the artificial
differentials between their lending rates (World Bank, 1990). Towards this end, restrictions on
commercial bank fees and charges were lifted as of April 1, 1990, providing these institutions
with greater flexibility in determining the cost of borrowing and lending. The Government plans
to adopt a fully liberalized interest rate structure by June 1991.
3.9 In recognition of this policy direction, the model uses the real interest rate to reallocate
domestic credit between the private sector and the public sector, given the pool of credit in the
economy. This means that net credit to the private sector must fall when net credit to the public
sector increases, other things being equal (equation (2)). Accordingly, the private sector's
demand for credit is negatively related to real interest rates, reflecting the negative relationship
between the real interest rate and private investment.
3.10 Research in several countries suggests that the transition from negative to positive
interest rates, rather than the levels themselves, has a more significant impact on the level of
domestic savings. Once the rate becomes positive, further increases appear not to affect savings.
The reasons may be two-fold. First, target savers-persons wishing to reach a certain level of
savings-would not need to increase their savings because of rising interest income from a given
level of savings. This income effect may actually lower savings at higher interest rates. Second,
and in contrast to the first, higher real interest rates raise the opportuniy cost of consumption-
savings and its interest income. Savers may therefore switch from consumption to savings when
real interest rates rise. Because of this indeterminate impact of interest rates and savings in
- 15 -
theory, and indeed in practice, no direct link is forged In the model between domestic savings
and interest rates. Increases in the government's demand for credit would raise the real domestic
loan interest rate and cause private investment (and d.rivatively, private sector credit demand)
to contract. However, aggregate consumpdon need not fall or savings rise if the additional credit
to the govermment is spent on consumption.
3.11 Increases in the real domestic interest rates in the model affect tke demand for currency
negatively, but affect the demand for demand deposits and quasi-money positively (para. 2.5).
In equation (2) therefore, both right and left hand side variables may change. Accordingly, the
policy solution for the residual public sector borrowing requirement of the government which is
fimanced by domestic borrowing would be higher real domestic interest rates, subject to the
indirect changes induced in the assets (currency, deposits, etc) of the monetary system. The
interest rate solution provided by the model also covers any incremental financing which may be
required if higher real, and derivatively nominal, interest rates increase the residual public sector
borrowing requirement. Such increases in the residual public sector requirement are possible
because the debt service obligations of the government would rise as interest rates rise.
The Economics of Monetizing the Fiscal Defcit
3.12 Instead of borrowing domestically to finance the public sector borrowing requirement,
the Government could print money. However, 'excessive' monetary expansion creates inflation.
Loosely speaking, monetary expansion is excessive if it exceeds what individuals would
ordinarily hold at given levels of real income. Annex m shows how the willingness of
individuals to hold mon'v helps to determine the *financeable" fiscal deficit. One of its
conclusions is that the Government mighg be able to monetize a larger fiscal deficit if it is also
willing to tolerate a higher level of domestic inflation.
- 16 *
3.13 Ihe model computes the rate of inflation, measured as the change in the GDP deflator,
which would be required to maintain macroeconomic consistency when given fiscal defichs (or
portions thereof) are monetized at the given level of GDP. Higher inflation raises nominal values
of the domestic interest rates, the exchange rate and GDP growth (at factor cost) but leaves their
real values unchanged. In consequence, real private investment remains unchanged. In contrast,
the demand for currency, demand deposits and quasi-deposits all fail as inflation rises. To
maintain macroeconomic consistency at the fixed level of GDP, the reduction in the demand for
the financial assets-currency, demand deposits and quasi-deposits-must be offset by an increase
in the demand for government debt; that is, the residual public sector borrowing requirement.
In practice, the portfolio reallocation to government debt would be induced by monetary
expansion which raises inflation, reduces real money balances, and yields the government an
inflation tax which eliminates the public sector borrowing requirement.
The Economics of Joint Policy Action
3.14 This solution calculates the exchange rate, interest rate and level of inflation which, if
applied together, would eliminate the residual public sector borrowing requirement and close the
external financing gap. Put differendy, it shows how the same outcome may be obtained by
various combinations of policies. The underlying economies is the same as in the application of
individual policy instruments. But the magnitude of the required adjustment may differ because
of the indirect effects of each policy instrument on the policy target to which it is not directly
assigned. For example, exchange rate depreciation reduces the external financing gap but may
simultaneously worsen govenament revenue (from indirect taxes). It may also worsen the residual
public sector borrowing requirement if the reduction in recurrent revenue is less than the
reduction in govermnent investment expenditure. At the same time however, higher real interest
- 17-
PolicyTarget External Residual Primary
Financing Public Sectr AdjustingPolicy Gap Borrowing VariablesSolution Requirement
Exchange Rate Exports &
X Imports
Interest Rate X PrivateInvestment
Deficit MoneyMonedzation Private Sector
x ~~~~CreditX Net ForeignAssets
Joint PolicyAction: ExportsExchange Rate Imports& Interest X X PrivateRate Investment
Joint PolicyAction:Exchange Rate, All of theInterest Rate X X AboveandMonetization
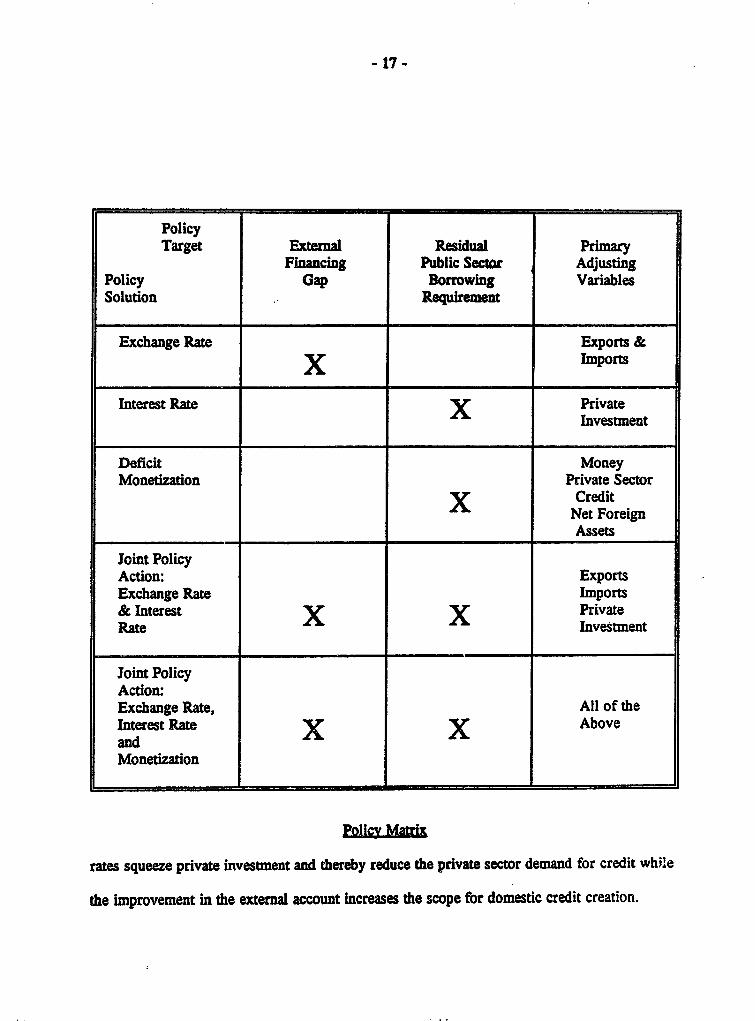
Poligy Matrix
rates squeeze private investment and thereby reduce the private sector demand for credit while
the improvement in the extemal account increases the scope for domestic credit creation.

- 18 -
Summary
3.1S Ita policy solutions discussed in paras. 3.2 to 3.14 are distlled in the policy matrix
above for easy reference. In brief, the exchange rate solution depends on export expansion and
Import contraction to meet the economy's surplus demand for foreign exchange. The interest rate
solution crowds out private Investment and releases domestic credit to finance the residual public
sector borrowing requirement. Finally, the fiscal deficit could be financed through monetary
expansion which raises inflation and the resulting inflation tax. Our next task is to illustrate these
solutions and thereby demonstrate how the analytical framework presented in this paper could be
helpful in designing macroeconomic policy packages for Kenya.
IV. POLICY SIMULATIONS
4.1 This chapter is illustrative, not predictive or prescriptive. The first and only order of
business is to demonstrate that the tool-the analytical framework sketched in Chapter E-can
calculate policy adjustments which would be required to achieve particular policy targets, given
selected behavioral assumptions and inviolable macroeconomic accounting rules. S/ However,
the leap from illustration to prescription would merely involve agreement on base year data and
behavioral coefficients, most of which are conveniently assembled in one worksheet (Annex IV).
Base Projections
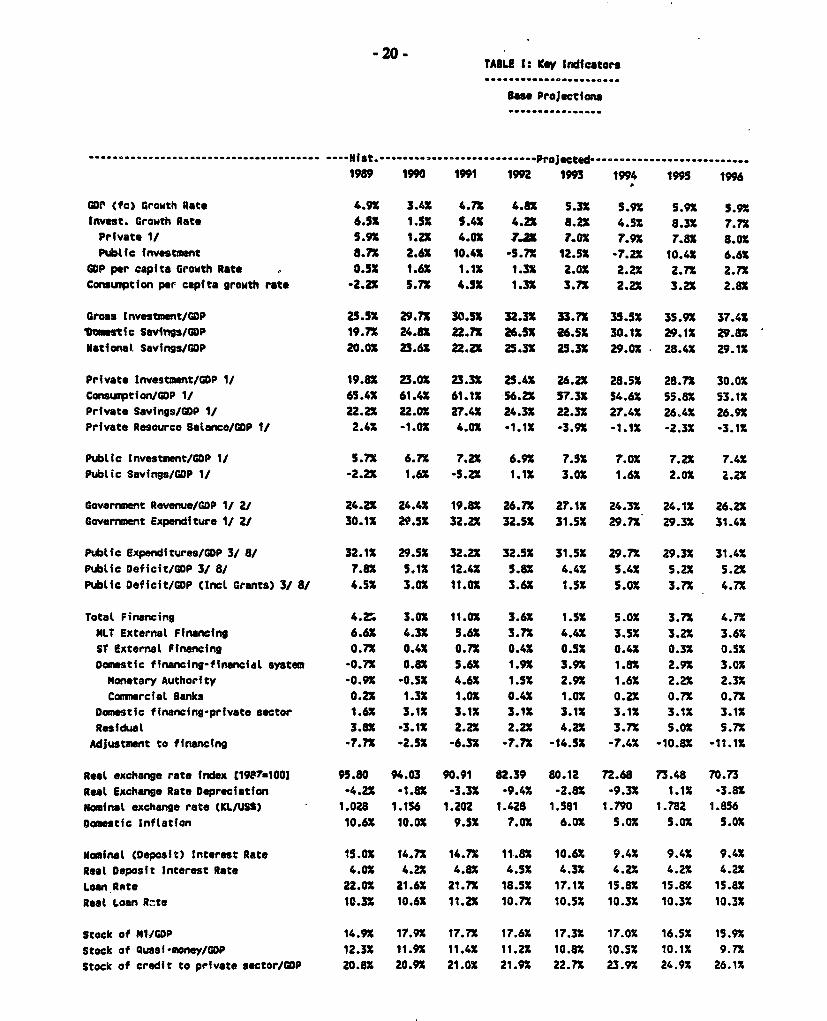
4.2 Table 1 shows key indicators of the Kenyan economy as they would evolve under the
projection rules and assumptions discussed in Chapter 2 and base year data in the input
worksheets in Annex IV. In these base projections, domestic interest rates are based on
I/ . To better demonstmte how the interest rate solution of the modd works, an adjustment factor was used toInflate the residual public sector borrowing requirement (albeit without violating flow of funds consistency).
v 19 -
exogenous fbrecasts for LIBOR, while the exchange rate is adjusted to reflect the differential
between the future inflation rates which are assumed for Kenya and the rest of the world.
Accordingly, the exchange rate (K£1US$) moves from 1.202 in 1991 to 1.581 in 1993 and 1.856
in 1996. The real domestic loan interest rate is 11.2 percent in 1991, 10.5 percent in 1993 and
10.3 percent in 1996. The corresponding domestic inflation target is 9.5 percent, 6.0 percent and
S.0 percent. The complete set of input and output tables of the model fori e base projections,
including the flow of funds consistency check, is at Annex IV.
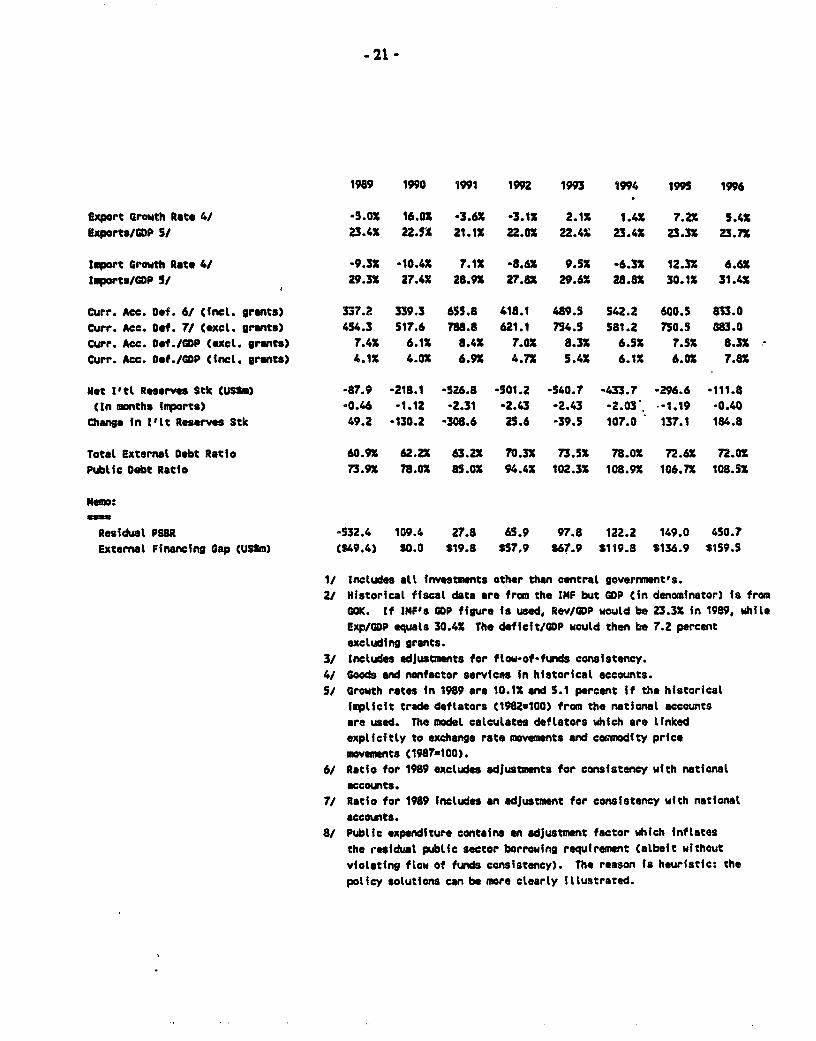
4.3 In this base scenario, the current account deficit falls from 8.4 percent of GDP
(excluding grants) in 1991 to 8.3 percent of GDP (excluding grants) in 1996. Exports (goods
and nonfactor services) and imports (goods and nonfactor services) are 21.1 percent of GDP and
28.9 percent of GDP respectively in 1991 compared with 23.7 percent of GDP and 31.4 percent
of GDP in 1996. 6/ In dollar terms, the external financing gap moves from US$19.8 million
in 1991 to US$159.5 million by the end of the period (Table I). Meanwhile, government revenue
and expenditure reach 26.2 percent of GDP (excluding grants) and 31.4 percent of GDP
respectively in 1996, from 19.8 percent (excluding grants) and 32.2 percent of GDP in 1991.
The residual public sector borrowing requirement is 27.8 million Kenya pounds in 1991, 97.8
million Kenya pounds in 1993 and 450.7 million Kenya pounds in 1996.
f lThroughout, exports and imports refer to goods and nonflactor services.
-20 -TABLE I: Key Indfcators..... ......... - - 0,,,
lase Projectlos
. . . . . . .. .Nut......................... Projected. .........................
1989 1990 1991 199Z 1993 1994 195 1996
Gor (fc) Growth Rate 4.9X 3.4X 4.7X 4.82 5.32 5.92 5.92 5.9°tnvest. Growth Rate 6.5X 1.52 5.4X 4.2X 8.22 4.52 8.3X 7.7X
Private 1/ 5.92 1.22 4.02 I?. 7.02 7.9X 7.82 8.02Pubtlic investmnt 8.72 2.6 10.42 5.7X 12.52 -7.2X 10.42 6.6o
GOP per capita Growth Rate 0.32 1.6" 1.1X 1.32 2.02 2.22 2.72 2.72Consumption per capita growth rate -2.2X 5.7X 4.5X 1.32 3.7X 2.2X 3.22 2.82
Gross Investment/GOP 25.52 29.72 30.52 32.3X 33.7S 33.52 35.92 37.42hostic Savings/GOP 19.72 24.82 22.72 26.52 26.52 30.12 29.12 29.82National Savings/GOP 20.0X 23.6S 22.2Z2 25.32 25.3X 29.02 28.42 29.1X
Private Investment/GOP 1/ 19.82 23.02 23.32 25.42 26.2X 28.52 28.72 30.02Consumwtion/GDP 1/ 65.42 61.4X 61.12 56.22 57.3X S4.61 55.8X 53.12Private Savings/GOP 1/ 22.2X 22.02 27.42 24.32 22.32 27.42 26.42 26.92Private Resource Balance/GDP 1/ 2.42 -1.02 4.02 -1.12 -3.9X -1.12 -2.3X -3.12
Public Investment/GOP 1/ 5.7X 6.72 7.22 6.92 7.52 7.02 7.22 7.42Public Savings/GOP 1/ -2.22 1.4X -5.22 1.12 3.02 1.62 2.02 2.22
Governmeent Revenue/GDP 1/ 2/ 24.22 24.42 19.8S 26.72 27.1X 24.32 24.12 26.21Government Expenditure 1/ 2/ 30.12 29.52 32.2X 32.S 31.52 29.72 29.3X 31.42
Public Expenditures/GDP 3/ 8/ 32.12 29.52 32.22 32.52 31.52 29.72 29.3X 31.42PubLic Deficit/GDP 3/ 8/ 7.8% 5.1% 12.42 5.82 4.42 S.42 5.2Z 5.2XPublic Deficit/GDP (Inct Grants) 3/ 8/ 4.52 3.02 11.02 3.61 1.52 5.0X 3.72 4.7X
Total Financing 4.2 3.0X 11.02 3.62 1.52 5.02 3.72 4.7XNLT External Financing 6.62 4.3X 5.6" 3.72 4.42 3.52 3.22 3.6%ST External Financing 0.72 0.42 0.7X 0.42 0.52 0.42 0.32 O.S5Domestic financing-financifL system -0.7X 0.82 5.62 1.9X 3.9X 1.82 2.9X 3.0%
monetary Authority -0.92 -0.52 4.6X 1.52 2.9% 1.62 2.22 2.32CommerciaL Banks 0.2X 1.3X 1.02 0.4X 1.02 0.2% 0.7X 0.72
Domestic financing-private sector 1.6X 3.1X 3.1X 3.1X 3.12 3.12 3.12 3.1%Residual 3.80 -3.1X 2.22 2.22 4.2X 3.7X 5.0X 5.72Adjustment to financing -7.72 -2.52 -6.32 -7.72 -14.5 -.7.4 -10.82 -11.12
Real exchange rate Index C1987s1001 95.80 94.03 90.91 82.39 80.12 72.68 73.48 7o.73Real Exchange Rate Depreciation -4.22 -1.82 -3.3X -9.42 -2.82 -9.3% 1.12 -3.8XNominal exchange rate CKL/USS) 1.028 1.1%6 1.202 1.428 1.581 1.790 1.782 1.856Domestic Inftation 10.62 10.02 9.52 7.02 6.02 5.02 5.02 5.02
omfinal (Deposit) Interest Rate 15.0X 14.72 14.72 11.82 10.62 9.42 9.42 9.42Real Deposit Interest Rate 4.02 4.22 4.8X 4.52 4.3X 4.22 4.22 4.22Loan Rate 22.02 21.62 21.72 18.52 17.12 15.8 15.8 15.82Real Loan Rcte 10.3Z 10.62 11.2X 10.7X 10.5X 10.3% 10.32 10.3X
Stock of Wi/COP 14.92 17.92 17.7X 17.62 17.32 17.0% 16.52 15.9°Stock of auasi-money/GOP 12.32 11.9X 11.42 11.22 10.82 10.5% 10.12 9.7XStock of credit to private sectr/GOP 20.8X 20.9X 21.02 21.9X 22.7X 23.9X 24.92 26.1X
- 21 -
1989 1990 1991 1992 1993 194 1995 1996
Export Growth Rate 4/ 5.0X 16.01 -3.6X 3.11 2.1X 1.4X 7.2X 5.4X
Experts/GDP 5/ 23.46 22.5X 21.1X 22.0X 22.4X 23.41 23.31 23.7X
Import Growth Rate 4/ -9.31 -10.4. T.11 -8.6" 9.5X -6.3X 12.31 6.60
1 arts/GOP 5/ 29.31 27.41 28.91 27.81 29.61 28.81 30.11 31.41
Curr. Ace. Def. 6/ (ineL. grants) 337.2 339.3 655.8 418.1 489.5 542.2 600.5 833.0
Curr. Ace. De.. 7/ (exct. grants) 454.3 517.6 788.8 621.1 754.S 581.2 730.5 883.0
Curr. Acc. Oef./GDP CexcI. grants) 7.41 6.11 8.41 7.01 8.31 6.51 7.51 8.31
Curr. Ace. Oet./GOP (lncl. grants) 4.1X 4.02 6.91 4.71 5.41 6.1X 6.01 7.81
Net I'tl Reserves Stk CUSS.) -87.9 -218.1 *526.8 -501.2 -540.7 -433.7 -296.6 *111.8
Cln months inports) -0.46 -1.12 -2.31 -2.43 -2.43 -2.03 -1.19 -0.40
Change in Ilt% Resrves Stk 49.2 -130.2 -308.6 25.6 -39.5 107.0 137.1 184.8
TotaL ExternaL Debt Ratio 60.91 62.21 63.21 70.31 73.51 78.0x 72.6 72.o0
Pubtic Debt Ratio 73.91 78.01 85.01 94.41 102.31 108.91 106.71 108.51
Memo:
Residual PSIR -532.4 109.4 27.8 65.9 97.8 122.2 149.0 4SO.?
External Financing Gap (USSm) CS49.4) 80.0 819.8 s57.9 S67.9 S119.8 S136.9 S159.5
1/ Includes aLl lnvestmn ts other than central government's.
2/ Historical fiscal data are from the IMF but GOP Cin denomfnator) Is from
GOK. Itf IMFs GDP figure is used, Rev/GDP would be 23.31 in 1989, while
Exp/GOP equals 30.41 The deffcit/GDP would then be 7.2 percent
excluding grants.
3/ Includes adjustments for flow-of-funds consistency.
4/ Goods and nonfactor services in historical accounts.
5/ Growth rates In 1989 are 10.11 and s.1 percent if the historical
implicit trade deflators C1982u1D0) from the national accounts
are used. The model calculates deftlators which are linked
explfcitly to exchange rate movements and comeodity price
movements (198a7100).6/ Ratio for 1989 exeludes adjustments for consistency with national
accounts.7/ Ratio for 1989 fncLudes an adjustment for consistency with national
accounts.8/ Publie expenditure contains an adjustment factor whfch Inftlates
the residual pubife sector borrowing requirement (albeit without
violating flow of funds consistency). The reason Is heuristic: the
policy solutions can be more elearly illustrated.
-22 -
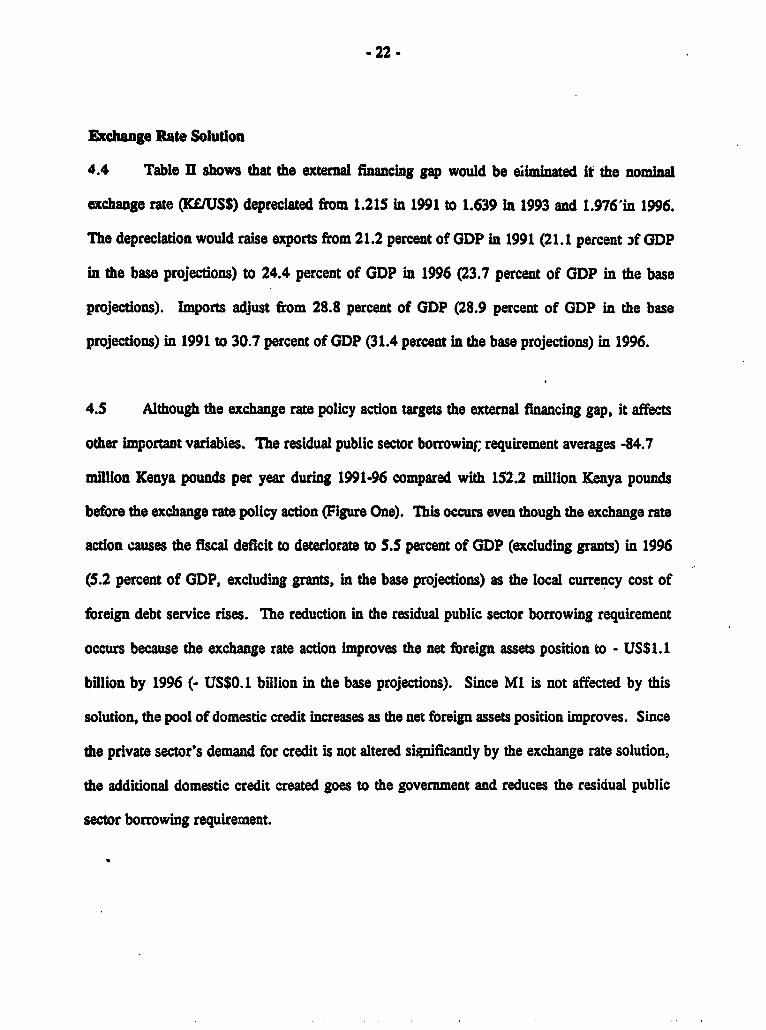
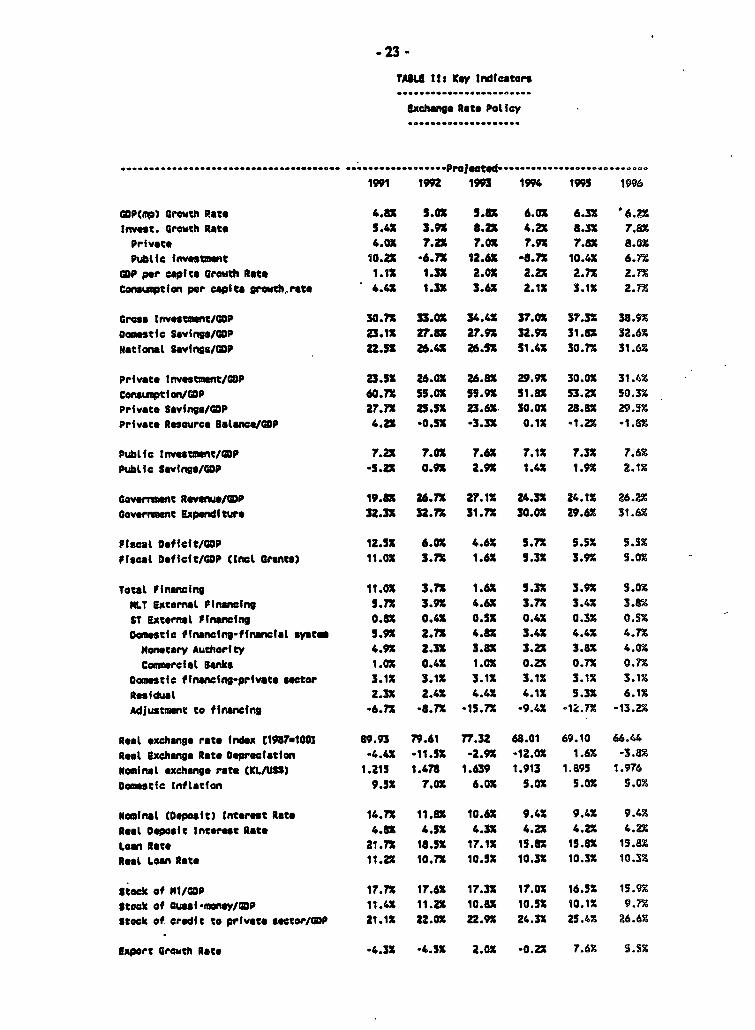
Exchange Rate Solution
4.4 Table II shows that the external financing gap would be eiim;nated It the nominal
exchange rate (K£/USS) depreciated from 1.215 in 1991 to 1.639 in 1993 and 1.976'in 1996.
The depreciation would raise exports from 21.2 percent of GDP in 1991 (21.1 percent 3f GDP
in the base projections) to 24.4 percent of GDP in 1996 (23.7 percent of GDP in the base
projections). Imports adjust from 28.8 percent of GDP (28.9 percent of GDP in the base
projections) in 1991 to 30.7 percent of GDP (31.4 percent in the base projections) in 1996.
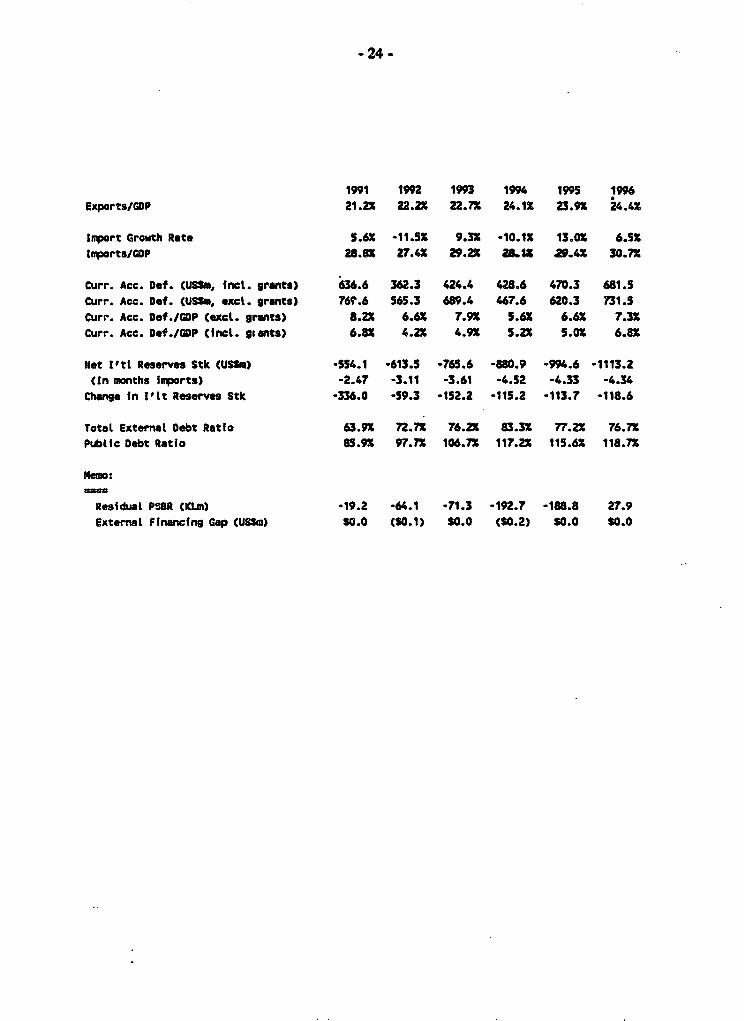
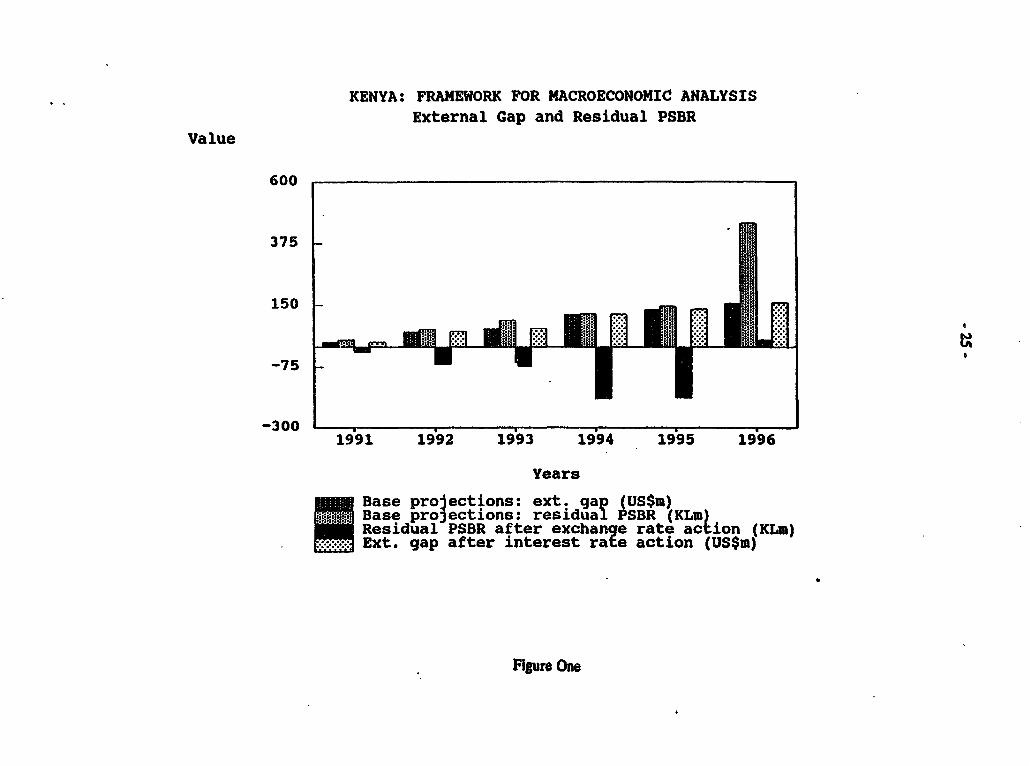
4.5 Although the exchange rate policy action targets the external financing gap, it affects
other important variables. The residual public sector borrowing requirement averages -84.7
million Kenya pounds per year during 1991-96 compared with 152.2 million Kenya pounds
before the exchange rate policy action (Figure One). This occurs even though the exchange rate
action causes the fiscal deficit to deteriorate to S.5 percent of GDP (excluding grants) in 1996
(5.2 percent of GDP, excluding grants, in the base projections) as the local currency cost of
foreign debt service rises. The reduction in the residual public sector borrowing requirement
occurs because the exchange rate action improves the net foreign assets position to - US$1.1
billion by 1996 (- US$0.1 billion in the base projections). Since Ml is not affected by this
solution, the pool of domestic credit increases as the net foreign assets position improves. Since
the private sector's demand for credit is not altered significantly by the exchange rate solution,
the additional domestic credit created goes to the government and reduces the residual public
sector borrowing requirement.
-23-
TABU tt: Key tditcartos
xchawge Rate Pot icy....................
,, ,,,,,,,,,,.,,,,,,,,,, ............. Prolected......................
1991 1992 199 1994 1995 1996
UDP(tp) Growth Rate 4.8J 5.03 5.X 6.02 6.3X 6.2Invest. Growth Rate 5.4X 3.9X 8.2X 4.2X 8.32 7.82Private 4.02 7.23 7.ox 7.92 78X 8.0XPubtic investmet 10.2X 6.7X 12.62 -8.72 10.41 6.72
GOP per capita Growth Rate 1.1 1.3X 2.0X 2.2X 2.73 2.72Conswptifn per capita grcosh rat 4.X 1.33 3.62 2.1X 3.1X 2.7X
Gross Investment/UP 30.73 33.0% 34.42 37.02 37.32 38.92Doamestfc Savings/GOP 23.1X 27.8x 27.92 32.9X 31.82 32.62Naltialt Savings/GP 2.5X 26.4X 26.52 31.42 30.7Z 31.62
Private tnvestment/GOP 23.53 26.02 26.82 29.9X 30.02 31.4bConsmptifa/GDP 60.72 55.02 55.92 51.82 53.2% 50.3%Prfvate Savfngs/DP z2.7x 25.52 23.62 30.02 28.82 29.5sPrivate Resource Bata COP 4.2X *0.5X -3.32X O.X -1.2 -1,2X
Pubtfc Investment/COP 7.2x 7.0x 7.6X 7.1X 7.3x 7.62Pubic Savings/GOP -5.ZX 0.9X 2.92 1.42 1.92 2.12
Government Revenue/U0P 19.80 26.72 27.12 24.33 24.1X 26.2%Government Expenditure 32.33 32.7X 31.72 30.02 29.62 31.6X
Fiscalt Defict/UP 12.52X 6.0 4.6X 5.72 5.52 5.35
Ffscal Deficit/GP CInol Grants) 11.0X 3.7X 1.62 5.32 3.9z 5.02
Totat financing l1.OX 3.72 1.62 5.3X 3.9X 5.0XNLT Externml Financing 5.72 3.9X 4.62 3.72 3.42 3.8%
ST External Financfng 0.82 0.42X O.5 0.42 0.33 0.5XDomestec financing-ffnancitl syats 5.92 2.72 4.82 3.42 4.42 4.7Z
Monetary Authority 4.92 2.32 3.82 3.2X 3.82 4.02Commrciat Banks 1.OX 0.4X 1.02 0.2 0.7X 0.7%
Ocm tic fInncing-prfvate setor 3.1X 3.12 3.12 3.12 3.12 3.12Residual 2.3X 2.42 4.42 4.12 5.3X 6.12Adjustment to financing -6.72 -8.7 15.7X -9.42 -12.7% -13.2X
Rest exchange rate index C198741003 89.93 79.61 77.32 68.01 69.10 66.44Rest Exchange Rate Deprecatfon -4.42 -11.32 -2.92 -12.02 1.68 -3.82Nominat exchange rate CKL/U35) 1.215 1.478 1.639 1.913 1 .B9 1.976Domestic Inflatfon 9.53 7.02 6.02 5.0X 5.0X 5.0J
Nominal (Oeposit) Interest Rats 14.72 11.82 10.6X 9.4X 9.42 9.4%
Rest Deposit Interest Rate 4.82 4.52 4.3X 4.2Z 4.22 4.2XLoan Rate 21.72 18.5X 17.1X 19.82 15.82 15.82Reat Loan Rate 11.2X 10.7X 10.52 10.32 10.3X 10.32
Stock of MI/GOP 17.72 17.62 17.32 17.0X 16.52 15.9%Stock of uai-mney/GDP 11.42 11.22 108 10.52 10.12 9.72stock of credit to private setor/UP 21.12 22.0X 22.92 24.32 25.42 26.62
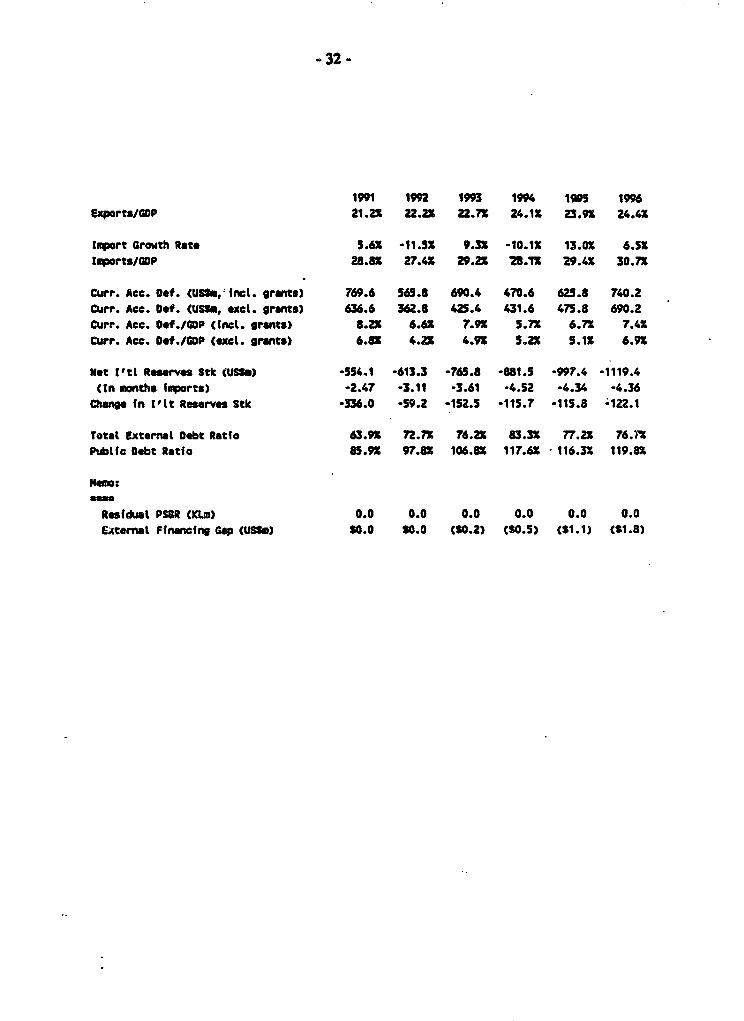
Export Growth Rate .4.32 -4.53 2.02 -0.22 7.62 5.52
-24-
1991 1992 1993 1994 1995 1996Exports/GOP 21.2X 22.2X 22.7X 24.12 23.9X 24.42
Inport Growth Rate S.6 -11.52 9.32 -10.12 13.0X 6.52Imports/GOP 28.82 2.42 29.2 ZaLIX 29.4x 30.7X
Curr. Acc. Oef. CUSS, inct. grants) 636.6 362.3 424.4 428.6 470.3 681.SCurr. Ace. Oef. (USS., exel. grants) 769.6 565.3 689.4 467.6 620.3 731.5Curr. Ace. Oaf .GOP (axeL. grants) 8.22 6.62 7.92 5.62 6.62 7.32Curr. Ace. D*f./GDP Cnet. giants) 6.8X 4.22 4.92 5.22 5.02 6.82
Net I'tl Reserves Stk USSW) -554.1 .613.5 -765.6 -880.9 -994.6 -1113.2(Cn months Imports) -2.47 -3.11 -3.61 -4.52 -4.33 -4.34
Change fn Pllt Reserves Stk -336.0 -59.3 -152.2 -115.2 -113.7 -118.6
TotaL Extemal Debt Ratio 63.9X 72.72 76.22 83.32 77.22 76.72Public Debt Ratio 85.92 97.72 106.72 117.22 115.62 118.72
Memo:
Residual PS5R CKLm) -19.2 -64.1 .71.3 -192.7 -188.8 27.9ExternaL Financig Gap CUSSm) SO.0 CSO.1) 90.0 CS0.2) S0.0 80.0
KENYA: FRAMEWORK FOR MACROECONOMIC ANALYSISExternal Gap and Residual PSBR
Value
600
375-
150
-75-
-300 1991 1992 1993 1994 1995 1996
Years
Base projections: ext. gap (US$m)gRR Base projections: residual PSBR (KLm)
Residual PSBR after exchange rate action (KLm)Ext. gap after interest rate action (US$m)
Figure One
26 -
The Interest Rate Solution
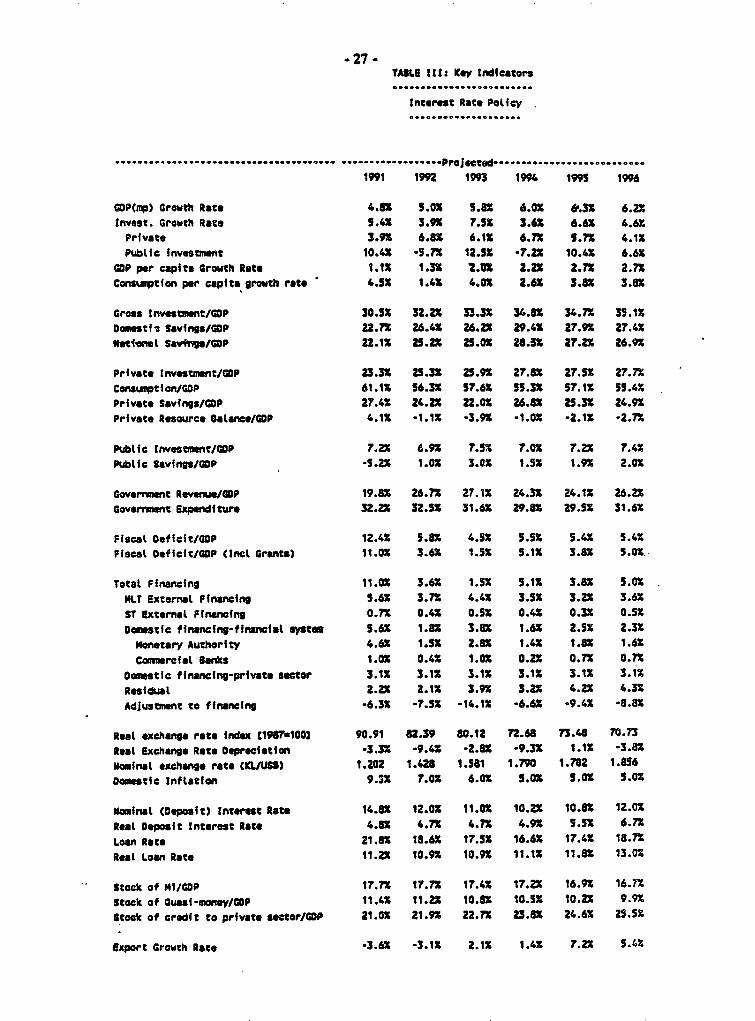
4.6 The results of the interest rate policy action are presented in Table m. The real
domestic loan interest rate which would eliminate the residual public sector borrowing
requirement is 11.2 percent in 1991, 10.9 percent in 1993 and 13.0 percent in 1996. The figures
for the base projections are 11.2 percent, 10.5 percent and 10.3 percent respectively. The kty
adjusting variable is private investment which is 23.3 percent of GDP in 1991, 25.9 percent of
GDP in 1993 and 27.7 percent of GDP in 1996 (Table Im). In comparison, it is 23.3 percent of
GDP in 1991, 26.2 percent of GDP in 1993 and 30.0 percent of GDP in 1996 in the base
projections (Table 1). Similarly, the stock of credit to the private sector in 1996 is 25.5 percent
of GDP after interest rate policy action but is 26.1 percent of GDP in the base projections.
4.7 The interest rate policy action causes government expenditure to reach 31.6 percent of
GDP in 1996 (31.4 percent in the base projections), reflecting higher interest payments and larger
domestic debt. Since loan and deposits interest rates move in the same direction under this
scenario, the policy action also affects the demand for currency, demand deposits and time
deposits. Table m shows a marginal increase in the stock of MI and quasi-money in 1996 to
26.6 percent of GDP relative to 25.6 percent of GDP in the base projections. Since the policy
action leaves domestic credit unchanged, the net foreign assets position worsens slightly from - -
- US$111.8 million in 1996 in the base projections to - US$104.2 million after the interest rate
policy action. In turn, the external financing gap rises marginally to US$161.8 million compared
with US$159.5 million in the base projections (Figure One).
-27 -TA3LB ItSS Key Indicators.......... ................. ,0
Interest Rate Policy....................
--... .-.. .-... .. Projected. ...................
199 1992 199 1994 1995 199
GOP(mp) Growth Rate 4.IIX 5OX 5.83 6.0b 6&.3X 6.23
tnvest. Growth Rate 5.4X 3.93 7.53 3.6X 6.6X 4.61
Private 3.93 6.8 6.1X 6.7 5.73 4.1X
PublIc invesmnt 10.4IX *9.7 12.53 7.21 10.4X 6.6X
GOP per capita Growth Rate 1.1X 1.3X 2LU 2.ZX 2.73 2.73Conswpton per capita growth rate 4.5X 1.4X 4.03 2.61 3.8X 3.81
Gross Investenwt/GOP 30.5X 32.2X 33.3X 34.8X 34.73 35.13
Damestfi Savings/GOP Z.7X 26.4X 26.2 29.4$ 27.93 27.43
9tfiol Sav+in/GDP 22.1Z 25.2 Z5.0X 28.5X 27.21 26.93
Private Investment/GOP 23.3X 25.3X 25.93 27.83 27.5 27.73
Coneusttion/GOP 61.13 56.3X 57.63 55.31 57.13 59.41
Private Savings/COP 27.41 24.2X 22.03 o 26.X 25.33 24.91
Private Resource Balance/GOP 4.13 -1.13 -3.9X -1.01 -2.13 -2.7X
Public Investment/GOP r.2 6.93 7.52 7.03 7.23 7.43
Pubifc Savings/GDP -5.2X 1.03 3.DX 1.5X 1.93 2.01
Government ReveCD/GOP 19.86 26.7X 27.11 24.3X 24.13 26.22
Goverrent Expenditure 32.2X 32.53 31.6 29.8X 29.51 31.6X
Fiscat efficit/GOP 12.4S 5.sx 4.53 5.5X 5.41 5.43
Fiscal Deffcit/GOP (tmc Grants) 11.03 3.61 1.53 5.11 3.8X 5.0S
Total Financing 11.0X 3.6Z 1.53 5.11 3.8x 5.03
NLT External Finncing 5.6X 3.77 4.4X 3.5X 3.23 3.6X
ST External financing 0.73 0.41 0.53 0.43 0.31 0.53
Domestc financing-financial syetem 5.61 1.86 3.Z 1.61 2.53 2.33
ne14tary Authority 4.61 1.51 2.86 1.43 1.83 1.61
Conarcial Banks 1.01 0.43 1.03 0.2X 0.73 0.73
Domestic financing-private seator 3.13 3.11 3.13 3.13 3.13 3.13
Residual Z.2X 2.1X 3.9x 3.21 4.21 4.33
Adjustment to financing -6.35 -7.5X -14.11 -6.61 -9.43 -8.8%
Resl exchange rate index C1981o0o] 90.91 82.39 80.12 72.68 7148 70.73
Real Exchane Rate Depreciation -3.3S -9.41 -2.86 -9.33 1.13 -3.81
Nominal exchange rate CU L/USS) 1.202 1.428 1.581 1.790 1.7a2 1.856
oamstic inflatfon 9.21 7.o0 6.03 5.03 5.0X 5.03
mina l COepasit) Interest Rate 14.6X 12.03 11.01 10.23 10.83 12.03
Real Deposit Interest Rate 4.81 4.73 4.7X 4.9X S.X 6.73
Loan Rate 21.8X 18.63 17.53 16.63 17.43 18a.7Real Loan Rate 11 .ZX l.93 lo.9x 11.11 11.63 13.03
Stock of M1/GOP 17.73 17.73 17.41 17.2X 16.93 16.73
Stock of Guasf-money/GOP 11.43 11.21 10.63 10.53 10.23 9.93
Stock of credit to private sector/GOP 21.03 21.93 22.73 23.8X 24.63 25.5S
Export Growth Rage .3.61 -3.13 2.13 1.41 7.2x 5.46

- 28 -
1991 1992 1993 199 1995 196Exprtas/OP 21.1t 22.02 22.4X 23.X 23.3X 23.7X
taort Grath Rate 7.1X -8.6 9.52 -6.3X 12.3X 6.62Imorts/GOP 28.9X 27.8 29.6X 28.8X 30.12 31.42
Curr. Acc. Def. CMs, Mld. grants). 655.7 417.? 488.3 539.5 595.1 821.6Curr. Ace. Otf. (USM,6 exel. grants) 78.7 620.7 73.3 578.5 745.1 871.6Curr. Ace. D*f./GDP Cexal. gornts) 8.4X 7.0 8.32 6.52 7.5s 8.22Curr. Ace. Def./GOP (Inst. grants) 6.9X 4.72 5.4 6.12 6.0X 7.72
Net I'tt Rserves Stk CIUSM) -S26.7 -501.1 -540.3 -432.3 -293.2 -104.2(in months aports) -2.31 -2.43 -2.43 -2.03 -1.17 -0.37
Change in Iltt Reseves Stk -308.6 25.7 -39.2 108.0 139.1 189.0
Total Extermt Debt Ratfo 63.22 70.3 n73.52 78.02 72.6 72.02Publle Debt Ratfo 84.92 94.42 102.12 108.52 106.02 107.12
Ne:
Residuat PSI CKL.) 0.0 0.A 0.0 0.0 0.0 0.0External Ffnrclng Cap (UP.) 119.8 158.0 S68.1 1120.3 1138.0 1161.8
- 29 -
Monetization
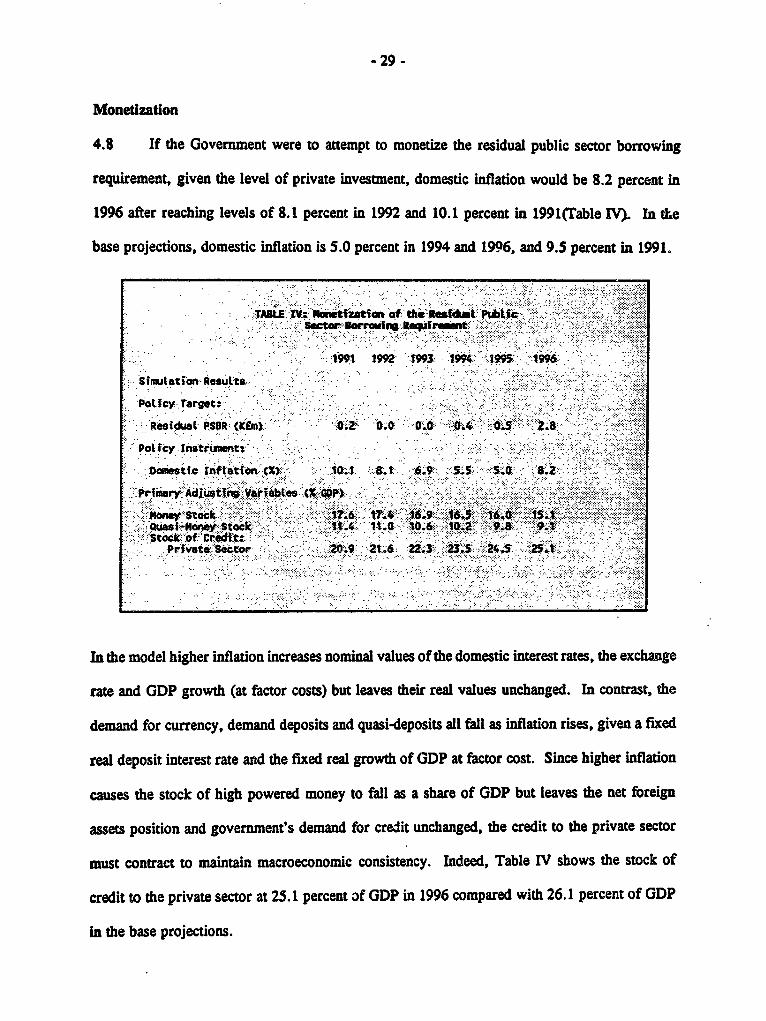
4.8 If the Government were to attempt to monetize the residual public sector borrowing
requirement, given the level of private investment, domestic inflation would be 8.2 percent in
1996 after reaching levels of 8.1 percent in 1992 and 10.1 percent in 199 1(Table IV)- In the
base projections, domestic inflation is 5.0 percent in 1994 and 1996, and 9.5 percent in 1991.
.. . ,: NTBe.:.t .,:.:::.:.tiati of.. t,es i .ph .t
sector ' .. Mem -'.f-.:'.-.f ..̀.. ... . .- . ... ..
1991 1992 t993 194 .199 1:996
Simutation ResuLts. ... -
PoQty Target.-
ResidL PSSR (KEin) 0.' O.GX D.0 0 Ov 4. 05....... 2, & :. .. .du: : - O iR- .K M.: . . a
-Pot fcy r nsteument.. : ,
cm: est1.C tInfation (X): - .:11 .-. t .6.9 -5< -5* :S. a iz
. :;mry Adui tJ4 V taestX . .
.Oe .. i Stack 17:< 'F .6 1.4 :~. 1:.'4. 16 0t7 IS{ fi$ 8v.5 ~~~~~~~~~~~~~~~~~~~~~~~~~~~~~~~~~~~~~~~~~..'t o , .". : dX*. ' C<*.......
0uasi-morey S3tockt. A106 0Z 9& 91.::stock". o Cre zt:
Prfvate or 2 2. 9 : . 23.5 2 25A
In the model higher inflation increases nominal values of the domestic interest rates, the exchange
rate and GDP growth (at factor costs) but leaves their real values unchanged. In contrast, the
demand for currency, demand deposits and quasi-deposits all fall as inflation rises, given a fixed
real deposit interest rate and the fixed real growth of GDP at factor cost. Since higher inflation
causes the stock of high powered money to fall as a share of GDP but leaves the net foreign
assets position and government's demand for credit unchanged, the credit to the private sector
must contract to maintain macroeconomic consistency. Indeed, Table IV shows the stock of
credit to the private sector at 25.1 percent of GDP in 1996 compared with 26.1 percent of GDP
in the base projections.

-30 -
Joint Exchange Rate and Interest Rate PoUcy Action
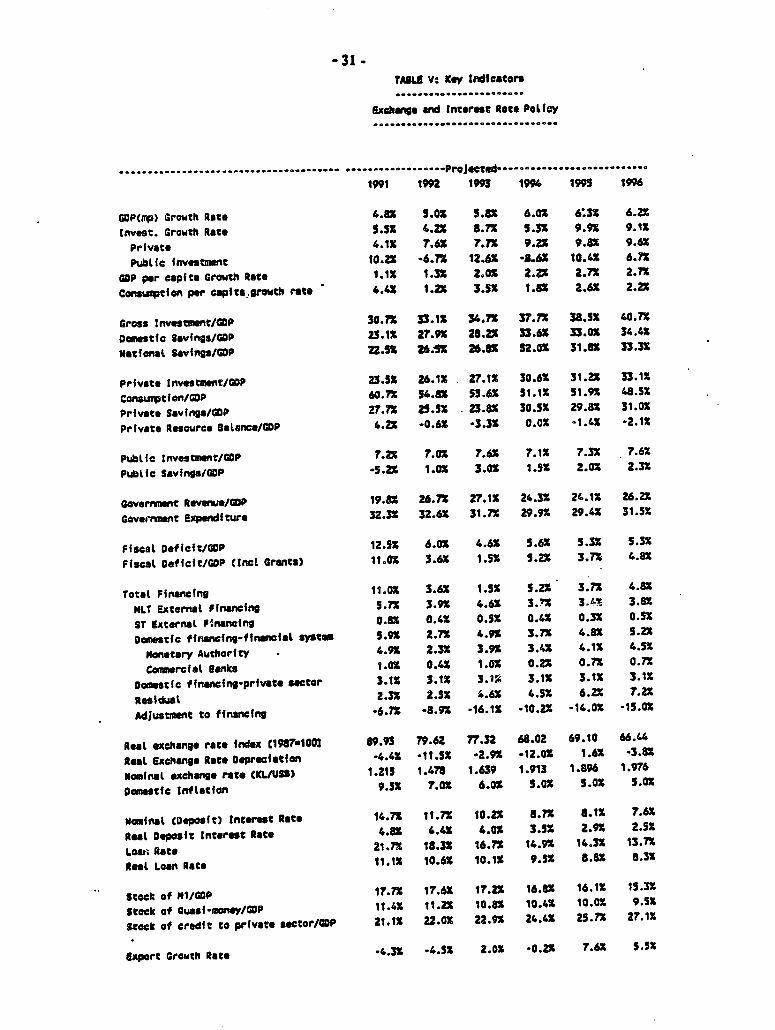
4.9 Table V presents the key economic indicators when joint exchange rate and interest rate
policy action is taken to eliminate a public sector borrowing requirement which is additional to
an external financing gap. Exchange rate action retuces the residual public sector borrowing
requirement compared to a situation in which no such action is taken (para. 4.5).
In principle, the interest rate policy action also reduces the overall demand for credit in the
economy relative to the base projections. From this perspective therefore, the required exchange
rate adjustment would be expected to approximat that of the independent exchange rate policy
solution while the required interest rate adjustment would be less than in the independent interest
rate policy solution (Figure Two). These expectations are confirmed by the simulation results
presented in Table V.
4.10 The required real domestic loan inerest rate is 11.1 perce' a 1991, 10.1 percent in
1993 and 8.3 percent in 1996. In comparison, it is 11.2 percent in 1991, 10.9 percent in 1993
and 13.0 percent in 1996 when only interest rate policy action is taken. The equilibrating
interest rate is lower because the net foreign assets increase to - US$1119.4 million in i996 aoint
exchange rate and interest rate action) compared with - US$104.2 million (mterest rate action
only). Because the pool of domesdc credit increases when joint exchange rate and interest rate
action are taken, more private investment can be accommodated for a given level of residual
public sector borrowing. Thus, private investment is only 27.7 percent of GDP in 1996 when
interest rate policy action is used (33.1 percent with joint policy action).
-31 -TAILS VS Key tndieators........ .............. .,..,
Ixoange wad Interest Rate PolICy.................................
,, ,,,,,,....- P r d........ ,,,.,,,,,........ - "Prol ed ..........................
191 1992 193 19K 199S 1996
GOP(ap) Growth Rate 4.82 5.0X 5.8X 6.02 6 3X 6.2%Invest. Growth Rate 5.52 4.22 8.72 5.32 9.92 9.12
Private 4.12 7.62 7r.7 9.22 9.82 9.62Public investment 10.22 -6.72 12.62 -8.6X 10.41 6.71
GOP per capita rowth Rate 1.1X 1.32 2.02 2.2X 2.72 2.?XConaurptifn per capita.growth r ate 4.4X 1.2X 3.12 1.82 2.62 2.2X
Gross Investment/GUP 30.7X 33.12 34.?X 37.7X 38.52 40.72Domestic Savings/GUP 23.12 27.92 28.2% 33.6X 33.02 34.42lational SavIngs/GP 22.5 26.51 26.82 52.02 31.82 33.32
Private tnvestment/UP 23.52 26.12 27.12 30.62 31.22 33.12Consuiption/GDP 60.7X 54.82 55.62 51.12 51.92 48.5XPrivste Savings/UOP 27.72 25.52 23.82 30.52 29.82 31.02Private Resource Balanne/CP 4.22 -0.62 -3.32 0.02 -1.42 -2.12
Pubtlc InvestmnUt/GOP 7.Z4 7.0o 7.61 7.12 7.3x 7.62PubLic Savings/GUP -5.22 1.02 3.02 1.52 2.02 2.32
Government Revenue/UP 19.82 26.72 27.12 24.3X 24.12 26.22Govenrant Expendfture 32.32 32.62 31.7% 29.92 29.42 31.5X
Fifscal Deficit/GP 12.52 6.0X 4.6X 5.62 5.32 5.32FIscat Defifit/GDP (Inct Grants) 11.0X 3.62 1.52 1.2% 3.71 4.8%
Total Ffnancfng 11.02 3.6X 1.52 5.22 3.71 4.82NLT External Financfng 1.72 3.92 4.62 3.7X 3.t% 3.82ST External Penancing 0.82 0.42 0.5% 0.41 0.32 O.5Danmestic ffnancing-ff fnaal sstom 5.92 2.72 4.92 3.7X 4.82 5.22
Monetary Authority . 4.92 2.32 3.92 3.42 4.1S 4.5%Conmercfel Banks 1.02 0.42 1.02 0.21 0.71 0.7X
Doamstfc ffnaning-prfvate owstor 3.1X 3.1% 3. W 3.1X 3.12 3.11Residual 2.32 2.52 9.6X 4.52 6.22 7.22Adjustmn t to financing -6.72 -8.92 .16.1X -10.22 -14.02 -15.02
Real exchange rate Index t1987*1003 89.93 79.62 77.32 68.02 69.10 66.44Real Exchange Rate Depreciatfon -4.4Z -11.51 -2.9% -12.02 1.6X -3.82Nominal oxchwne rate CKL/USS) 1.215 1.478 1.639 1.913 1.896 1.976Domestic Inflatfin 9.5X 7.ox 6.02 5.0X 5.0X 5.02
ominafl (Deposit) Internet Rate 14.7X 11.72 10.2% 1.72 8.12 7.62Real Dwosit Interest Rste 6.82 4.42 4.02 3.52 2.9X 2.32Loan Rate 21.72 18.32 16.72 14.92 14.32 13.71Rtes Loan Rate 11.11 10.6X 10.12 9.52 8.82 8.32
Stockz of Mi/UP 17.72 17.62 17.2% 16.82 16.12 15.32Stock of Quas-monay/GDP 11.42 11.2X 10.82 10.42 10.0 9.52Stock of credft to private sector/UDP 21.12 22.02 22.9% 24.42 25.71 27.12
export Growth Rate -4.32 .4.5X 2.02 -0.22 7.62 5.52
-32 -
1W1 1992 1993 1994 Sws 1996Exports/GOP 21.2X 22.2X 22.7X 24.1X 23.9X 24.4X
lIport Growth Rate 5.6X -11.52 9.32 -10.12 13.02 6.52Imports/GOP 28.82 27.42 29.2X 5.1M 29.42 30.72
Curr. Ace. Daf. CUSS., rct. grants) 769.6 565.8 690.4 470.6 625.8 740.2Curr. Ace. Def. (USSm, exet. grants) 636.6 362.8 425.4 431.6 475.8 690.2COrr. Ace. Oe /ClDP (anct. grants) 8.2X 6.62 7.9X 5.72 6.72 7.4XCurr. Ace. Def./GDP texel. grants) 6.82 4.21 4.9X 5.2X 5.1X 6.92
Net I'tL Reserves Stk (USSW) -554.1 -613.3 -765.8 -881.5 -997.4 -1119.4(In onths faports) -2.47 -3.11 -3.61 -4.52 -4.34 -4.36
Change fn [lOt Reserves Stk -336.0 -59.2 -152.5 -115.7 -115.8 .122.1
Totat External Debt Ratio 63.92 72.7X 76.2X 83.32 77.22 76.i%Pubtic Debt Ratio 8S.92 97.82 106.82 117.oX 116.32 119.82
1e:
Residual PS8R tKLM) 0.0 0.0 0.0 0.0 0.0 0.0EAternat Financing G Up tU) S0.0 0.0 (30.2) (30.5) (31.1) tS1.8)

uue1 iieah - -'USA
.~~~~~~~~~~~~~~~~~
am~~~~~~~~~
T2
142.eiwm,ms m¶a2135
"i mo "Oumi tw9 is"yai
............ . t
9441 1661 91 144 244 leSsn
S.n
.~~~~~~~~~~~~~~~~~,
onWTn Ab t va S.OM WM To".insftwv A" XMAOM & ...
awl~~~~~~~I2
$2.1
; n Iw .lmmmi *33 ESmt £t * 4 t
..................... .....
u..w-- --m- -A°t1 w
63 m ,=.B OMV
9461 4441 9641 1461 3441 164!-- ~ ~ ~ ~ ~ ~ ~ ~ ~~~3
nzs
.* £63.1~~~~~~~~~~~~~~*
uzui. azm i E.U - ' YUUt
-34 -
Joint Exchange Rate and Intereat Rate Policy Actiop and Monetization
4.11 The simulation results in Table VI are from joint exchange rate and interest rate policy
action and monedzation of the residual public sector borrowing requirement. Viewed
appropriately, this scenario is one of exchange rate and interest rate policy action when the
domestic inflation target is not of primary concern. In &ict, under this scenario infladon is
allowed to reach 8.5 percent in 1992 and 6.5 percent in 1993 compared with 7.0 pecent and 6.0
percent respectively in the base projections. Real domestic interest rates also behave differently:
11.1 percent in 1991, 9.7 percent In 1993 and 5.3 percent in 1996 when the exchange rate,
interest rate and monetization are used; 11.2 percent in 1991, 1O.S percent in 1993 and 10.3
percent in the base projections; 11.2 percent in 1991, 10.9 percent in 1993 and 13.0 percent in
1996 when the interest rate is used alone; and 11.1 percent in 1991, 10.1 percent in 1993 and
8.3 percent in 1996 when joint exchange rate and interest rate policy action is taken (Figure
Two). Clearly, the interest rates are lowest when all three policy options are activated
simultaneously. Then private investment reaches 36.0 percent of GDP in 1996 compared with
27.7 percent of GDP in 1996 when the interest rate policy is used aloae, and 33.1 percent when
interest rate policy is supported by exchange rate policy action. In sum, the economy reaches
a higher equilibrium path but experiences slightly higher inflation than all scenarios except when
the fiscal deficit is monetized.
Summary of Simulation Results
4.12 Para. 1.2 identified domestic macroeconomic imbalances as threats to recent economic
and stabilization gains In Kenya. The prevailing threats arise, in part, from high fiscal deficits,
monetary expansion and external shocks. The gains originated, in part, in adjustment programs
which reduced the fiscal deficit and lowered its domestic financing, maintained positive real
borrowing prudently. Other reforms in key sectors such as agriculture, industry and interest

-35 -
tASLE Vl: Key Indtceton....... ............ , -..
ExchOnge wa Interest Pace Potliy...........................................
eNd MoneStzatan................
..................................... .................. Projected..........................
1991 1992 1993 1994 1995 1996
GOP(wp) Growth Rate 4.81 4.91 5.82 6.01 6.3S 6.ZXInvest. Growth Rats 5.31 4.2X 9.41 5.43 12.01 12.61Private 4.1X 7.81 8.62 10.61 12.41 13.91Pubtic Investment 10.21 -7.31 12.31 -9.1X 10.2S 6.91
GOP per capita Growth Rate 1.1X 1.2X 2.11 2.21 2.7X 2.71Consumpcian per coplu growth rate 4.4X 1.0X 3.31 1.3X 1.81 0.8X
Grosa Investment/COP 30.71 33.0X 34.9X 38.82 39.8S 43.4aOomestic savings/COP 23.1X 27.81 28.41 34.11 34.31 37.01National S5vings/cOP 22.51 26.31 27.0S 32.31 33.11 35.81
Private Investm nt/GOP 23.51 26.11 27.4X 31.21 32.61 36.01Consumption/GDP 60.71 55.11 55.71 51.01 51.11 46.31Prfvate Savings/GOP 27.7X 25.63 23.81 30.61 30.4X 32.81Private Reource Baltae*/GOP 4.21 -0.61 -3.61 -0.61 -2.2% -3.21
Pubtic tnvestment/GOP 7.21 6.91 7.51 7.01 7.21 7.41Pubtle Savings/GOP -5.21 0.91 3.2t 1.81 2.61 3.0X
Gcvernment Revenue/COP 19.8X 26.53 27.01 24.2X 24.11 26.11Govenernt Expenditure 32.31 32.51 31.31 29.41 28.71 30.61
Fiscat OeffcVt/GDP 12.5 6.0X 4.31 5.2Z 4.6o 4.46Fiscal Deicit/GOP trtnt Grants) 11.01 3.71 1.31 4.71 3.01 3.91
TotaL Ffinacing 11.01 3.71 1.31 4.7T 3.01 3.91
MLT Extemnal Financing 5.72 3.9' 4.61 3.71 3.31 3.81
ST ExternaL Financing 0.81 0.4X 0 .S 0.41 0.31 0.51
Domestic tfnancing-financiat ysctm 5.91 2.8t 5.11 3.91 5.31 6.1X
Monetary Authority 4.91 2.4X 4.11 3.71 4.61 5.41
Cemerciat Banks 1.01 0.41 1.01 0.21 0.72 0.71Oemstfic *inacing-prvatce sector 3.11 3.11 3.11 3.1X 3.11 3.11Residual 2.31 2.61 4.9X 5.21 7.82 9.3%Adjustmen'. to financfng -6.71 -9.11 -16.8S -11.51 -16.31 -18.91
Rest exchange rate fndex n1987r1002 89.93 79.97 77.41 68..1 69.40 66.80Real Exchange Rate Depreciation -4.41 -I1.11 -3.2X -11.61 1.bX -3.7?
Nominel exchange rate CtL/U5 ) 1.215 1.492 1.668 1.956 1.941 2.021Domestic Inftacion 9.51 8.51 6.31 6.01 5.01 5.01
Noaminat (Deposft) Interest Rate 14.71 13.11 10.41 8.91 6.51 4.7X
Reat Oeposit Interest Rate 4.81 4.3X 3.61 2.71 1.41 -0.31Loan Rate 21.71 19.91 16.81 15.2X 12.51 10.51
Resl Loan Rate 11.11 10.5X 9.71 8.61 7.11 5.32
SCock .a* MI/GOP 17.7X 17.3X 16.81 16.1X 15.21 14.0XStock of auwsl-morteyC/OP 11.4X 11.01 10.61 10.11 9.51 8.81Stock of credft to prfvate sectoe/GDP 21.11 21.81 22.71 24.11 25.61 27.41
-36-
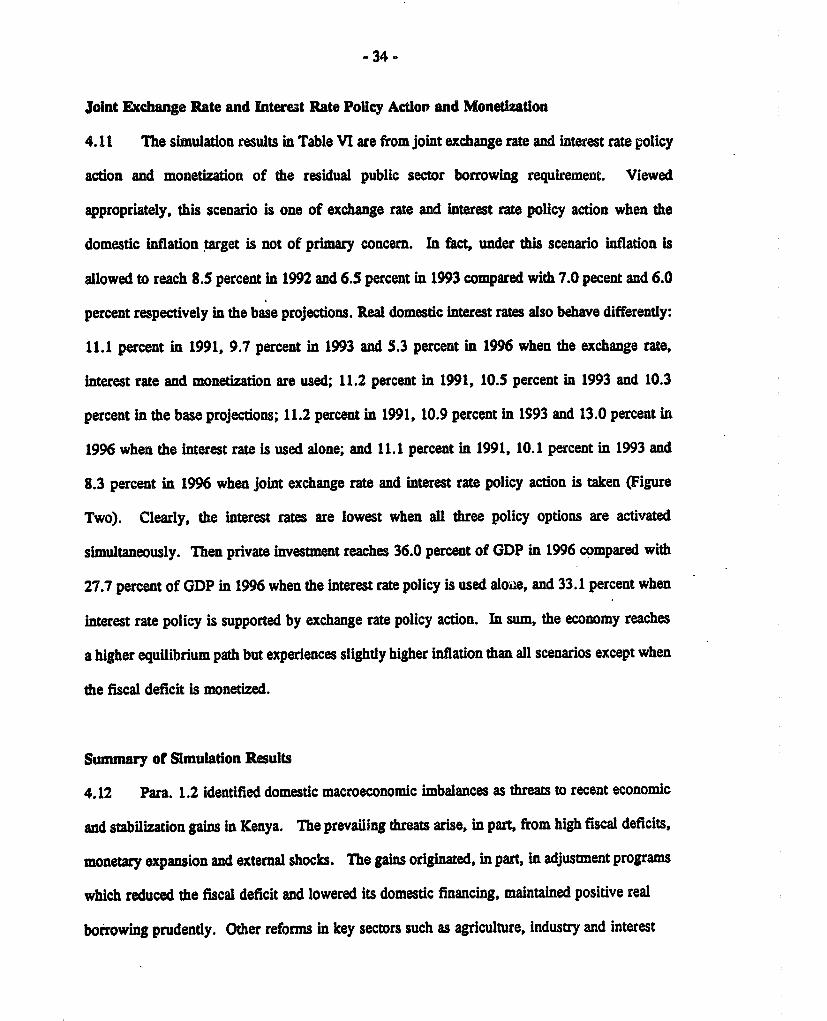
1991 1992 1993 1994 1995 1996
Export Growth Rate -4.31 -4.1X 2.0Z 0.4% 7.6X 5.61Exparras/P . 21.21 22.3X 22.81 24.21 24.01 24.5X
lRport Growth Rate 5.61 -11.2X 9.2 -9.6X 12.9X 6.81eportas/GDP 2Z.8X 27.5X 29.31 23.31 29.6X 30.91
Curr. Ace. Ocf. CUSS. lncl. grants) 636.6 364.1 423.s 438.0 486.8 714.8Curr. Ace. Oot. Cln USS, cxcl. grants) 769.6 567.1 693. 47r.o 436.8 764.8Curr. Ace. Dcf./GDP (out. grants) 8.21 6.61 7.91 5.71 6.81 7.61Curr. Ace. D*t./GDP (tntl. grans) 6.81 4.21 4.91 5.2X 5.21 7.11
Net l'tl Reseves Stk (USS.) -554.1 .614.0 -769.6 -889.2 -1010.6 -1131.8(in months fwports) -2.47 -3.10 *3.61 -4.52 -4.36 *4.37
Change fn I1t1 Reserves Stk -336.0 -59.9 -155.6 -119.6 -121.4 -121.2
Total External Debt Ratfo 63.9X 72.51 76.11 82.91 76.91 76.31Piubtl Debt Ratio 85.9X 97.4X 106.6X 117.0X 116.3X 120.6X
Memo:
Residual PS8R (M) 0.0 0.0 0.0 0.0 0.0 0.0Externat Finamcing Cap CUSS.) 30.0 (SO.1) CSO.4) CS1.2) (M2.6) 30.0
- 37.-
interest rates, adopted an appropriate exchange rate policy, and generally managed exenal
finance have begun to remove structural constaints and to foster an eninm ent which Is more
conducive to efficient resource use.
4.13 Ihe simulations discussed in paras. 4.24.12 suggest that exchange rate, interest rate and
fiscal policy have an important role to play in managing future macroeconomic imbalances in
Kenya. A 5 percent devaluation of the real exchange rate appears to reduce the current deficit
by about one percent of GDP. However, it also appears to have a negative impact on the fiscal
deficit Likewise, in a constrained credit envivonment, every one percentage point (of GDP)
increase in domestic borrowing to finance the iscal deficit appears to increase the real domestic
loan rate by around 0.5 percentage points. However, the required increase in the real domestic
interest rate falls as domestic inflation rises.
4.14 In summary, the simulations suggest the need for joint exchange rate and interest rate
flexibility in managing the macroeconomic imbalances in Kenya. More important perhaps,
aggressive exchange rate action is necessary if the economy is o reduce its dependence on
foreign savings. On the fiscal front, greater discipline is warranted since it would reduce the
public sector borrowing requirement, lower the equilibrium real interest rate and accommodate
a higher level of investment in the private secmr.
V. Limitations and Future Extensions
5.1 The model is only as useful as the accuracy of the response functions. The coefficients
used in the simulations reported in Chapter IV are based on our econometric analysis using
Kenyan data (import elasticities, the demand for financial assets), the econometric studies of other
-38 -
researchers on Kenya and comparable economies, and judgment based on casual empiricism
(export elasticities, private investment elasticities). But the most sophisticated quantiative
techniques are still guty of projecdng the future on the basis of past behavior. nhis approach
is particularly uncomfortable because current adjustment policies in Kenya are changing,.however
slowly, the macroeconomic Incentives and the scope for responding to them. Estimates of import
eldasticities deal with these changing circumstances explicitly. As observation points become
available, this would need to be done especially for exports and private investment.
S.2 The interest rate and exchange rate adjustments required for solving the model are
cumulative. That is, the adjustment required in any given year is based on the interest rate and
exchange rate level in the previous year and not to some fixed point in the past. In contrast, the
gaps are dealt with annually, not cumulatively. As a result, the adjustments in the policy
variables could be large fxom year to year if the gaps exhibit large annual fluctuations. For
example, to finance a large public sector borrowing requirement in a given year, the model may
produce a large increase in the real domestic loan interest rate. Because interest rate adjustments
are cumulative, the real interest rate may actually fall or even become negadve in the next year
If the public sector borrowing requirement is small. The economic logic of this solution is that
the previous year's high real interest rate must fall if private sector investment is to absorb the
additional domestic credit which is no longer required to finance the public sector. Similar
results obtain for the exchange rate when there are large fluctuations in the external gap. Such
drastic adjustments in policy variables from year to year are not likely to occur in practice. Still,
this is not a problem for the model to deal with as much as a signal about how to frame the
policy questions and interpret the policy solutions. When the gaps fluctuate widely from year to
year, it may be appropriate to ask the model to solve for the average annual gap over the period.
Another approach would be to treat the solution for the largest annual gap as an indication of the
upper limit of the policy adjustnents needed during the projection period.
-39 -
5.3 Ihe model treats the residual public sector borrowing requirement and the external
fundlg gap as mutually exclusive and independen. This simplifies the exposition of the model.
However, the residual public sector borrowing requirement may be a component of the external
financing requirement. Under this scenario, closure of the exteral gap would amount to
elimination of the public sector borrowing requirement. Reality is somewhere between the two
extremes, one in which the extenal gap includes the residual public sector borrowing requirement
and the other in which they are completely independent. To capture this reality, a simple
specification would be required to indicate the relationship between the public sector borrowing
requirement and the external financing gap. The model could then solve for the interest rate
and/or the exchange rate which closes the net gap.
5.4 Recent economic work on Kenya recognizes the need for data on the consolidated public
sector but this information is only just being gathered and coUated by the Central Government
In time, this data should be used to extend the coverage of the public sector accounts in the
model. Parastatal imports also need to be disaggregated from private imports and a more reliable
series on government imports obtained. As progress is made in public sector investment
programming, the recurrent expenditure implications of capital outlays should also be captured
explicitly.
5.5 With relatively few modifications, the model could endogenize economic growth (at
factor cost). At this stage however, it may be more rewarding to concentrate on refining the
response functions and to widening the coverage of the public sector finances. Econometric
work should also be done on the income and price elasticities of exports, the interest elasticity
of private investment and the behavior of private consumpdon.
-40-
ANNEX I
DESCRIPTION OF MODEL
Overview
1. The model comprises six data input worksheets, a debt module for pipeline and new externaldebt, and output tables. There is also one central worksheet wh contains key behavioralassumptions and macroeconomic targets.
7782. The data input worksheets are similar in fornat, units of account and coverage to standardtables produced by the Government. These input worksheets are:
(a) Original Data: CB (GOK)(b) Original Data: BOP (GOK)(c) Original Data: Fiscal Data (FY) (GOK & IM)(d) Original Data: DRS (World Bank)(e) Original Data: National Accounts (GOK)(t) Original Data: Trade (GOK)
3. The debt module comprises two files which are separate from the central model, the first fileis analogous to the Input Debt file for the LOTUS-based RMSM. Historical data are entered inmillions of US dollars. Medium and long-term debt is subdivided into multilateral and bilateraldonors and financial markets, including commercial banks and suppliers credits. The standarddefinitions of the World Bank's debtor reporting system are used. The second file is analogous tothe Debt file of the LOTUS-based RMSM. Projected commitment of loans together with their terms-interest rate, maturity, grace period and disbursement profie-and grants are entered individually orby donor ty,e. The module calculates annual disbursements and debt service of ihe projectedcommitments and aggregates them by donor types in a manner which is consistent with the pipelinedata. It also aggregates the projected debt variables with the historical pipeline data. A buildingblock is then used to import this combined pipeline and projected debt data into the central model.
4. There are eleven output tables covering:
(a) National Accounts (percentage of GDP)(b) National Accounts in Constant Prices(c) Private Sector Account(d) Balance of Payments(e) Fiscal Accounts(f) Financeable Fiscal Deficit(g) Monetary Survey(h) Monetary Authority Accounts(i) Commercial Bank Accounts(j) External Debt(k) Flow of Funds Consistency Check
Most variables in the output tables, apart from growth rates, are expressed as percentages of GDPat market prices but could be easily expressed in levels. These levels would generally be denominated
- 41 -
in million of Kenya pounds, with the exception of balance of payments data which are in million ofUS dollars. The model produces a flow of funds consistency output table. The sectoral aggregatesin these tables allow easy inspection of the consistency between the capitaland current sources and uses of funds in the central government, the balance of payments, themonetary sector-disaggregated into the monetary authority and commerical banks-the nationalaccounts, and the prvate sector. The key flow-of-funds identities and the projection rules for theimportant variables are summarized in Table 1.
Inputting Historical Data
5. For convenience, the input worksheets closely resemble the format and presentation of databy the key data-generating government agencies. Information on banking comes from the CentralBank's Quarterly Economic Review and is expressed in millions of shillings as in the original source.Assets and liabilities are disaggregated and entered separately for the central bank, the monetaryauthority, commercial banks and the monetry survey. The model checks for intemal consistencyacross these historical accounts and adjusts other liabilities" when there are imbalances in individualaccounts. A more difficult problem arises when the inconsistencies are found between the monetarysurvey and its components, the accounts of the monetary authority and the commercial banks. Therule of thumb used is to treat the monetary survey as accurate and adjust "other liabilities" of themonetary authority if the source of the discrepancy is not obvious.
6. The source of the balance of payments data, in millions of Kenya shillings, is the Balance ofPayments (BOP) Unit within the Ministry of Finance. The format and sequence of data items areidentical to the standard table generated by this government agency. For ease of comparison withother data sources, the worksheet routinely produces a table in millions of US dollars which isidentical to the original input table in all other respects.
7. Data on stocks of medium and long-term and short-term external debt come from the DRSsystem of the World Bank and accords with that system's nomenclature and definitions. DRS is alsothe source of historical data on debt disbursements, IMF purchases, and interest and amortizationpayments. Information on grants comes from the BOP Unit of the Ministry of Finance.
8. The fiscal data input worksheet is a composite of standard tables produced by the IMF andis designated in millions of kenya pounds in fiscal years (July to June). Only data on centralgovernment finances are currently available. Sources of revenue are identified in a way which allowseasy transcription of data from the standard data sources and allows revenue projections to respondto policy simulations. For similar reasons, recurrent expenditure is subdivided into wages andsalaries, other goods and services, interest payments on foreign and domestic debt, etc. Fiscal datais converted from fiscal to calendar year, on the recommendation of the Budget Department of theMinistry of Finance, by using a factor of .351.65. For example, government expenditure in 1990would comprise 35 percent of the expenditure in FY1989/90 and 65 percent of the expenditure in FY1990/91.
9. The national accounts data cover gross national product by expenditure and are entered inmillions of current Kenya pounds. The source of this information is the Central Bureau of Staistcsof the Government of Kenya. A memo item, showing the breakdown of GDP at factor cost bysector-agriculture, mining, manufacturing, other industry, services-is also compiled from this sourceand serves as the base year data for projecting GDP growth at factor cost. This breakdown replicatesthe categories from the national accounts section of the LOTUS-based RMSM, to which manyanalysts have become accustomed.

TABLE I OENAVIU. -eJATIUSUIP FUol Of mm-DS IDENITY
Denvd for Selected Ffafact Iawssets
3
Nd,. I C~16.s1j).C1 t ea).C(g*fc).(t+ aa.(r.)).Cl * @-.(i))1 TOTNOCapS a goL * Ni * G
k-1 TOTNonetpa a Lcg t Ldg t Lp .NFA
where: where:
as - stock of currency TOTHonCepS - swietary survey: total capital
a - stock of demand deposits sources of fundsa, - stock of quasi money (time deposits) TOTNmeapU monetary survey: total capital
uses of fiAsigdpfc - real GDP (at factor cost) growth Nol - flow of other liabilities (net)
"I flow of currency and demandrd - growth rate of real daomstic deposit rate depositsI - domestic inflation ON - flow of qas-mey (tim deposits)k - 1987* 198B, 1989 Lcg - flo of net credit from the central
bank to the govermmnta - coefficients Lds flow of net lendino frm cinwrcula
banks to the govrmntLap - flow of net credit to the private
setorUFA - flow of net foreign assts
Central nnnt fInuEAs Cntral Gow_ement Flnce
levi
3
I Id lOTGoiCapS - Sg Lce g dg + Notg Lfgk-I + Lsf*
Td _ _. GDPfc, TOGovCapU - 19 Lgp
3 TOTGovCurS l Td + Othrm-Sihg
L TOTGoVCurt - Cg + Tp * lNgp * Ilgf * Sg.
GDPfc , llsgfk-i
ujhere: ibere:
Td - direct taxes TOTGOvCa46 - Central gwneruent: totalsources of capital funds
TOTGovCapU - Central goveranent: totaluses of capital ftwds

TA81E I CodT D wuvEUAVIAL EELATIINSUP FLOW OF MNS IDENTITY
Central roernot finences cont'd Central CoveIvaet Finnces cont'd
Sg - current balence3 Xotg flow of other lisbilitiesI Ti , (net) of monetary sector to
central goverimentLpg flow of net lending by private
Tic Sector, sector to central governmontLfg - floa of medi and long term external
borrowing (not) (NLT)3 Lsff taflow of external short-termY. Setor ^ borrowing (net)k-i l gross Investnt
Lgp - flow of net lending by centralgovenMent to private sector.
sAere:
n (t - 5) - correspond to the five min categories of OthrR 1 other governnent revemuesindirect taxes: sales taxes on domestic Subsg susidiesanufactures, sales taxes on Iqports, datles Co central governmnt consumption
on imports, dutles on exports, and other Tgp - goverrnent transfersindirect taxes Nga.Ngp - interest on dmoestic borrowingSector - refers to activity shich generates the taxes Hof - Interest on NLT foreign debtlsgf Interest on short-term forefgn de't
3
E wtk-i
CApr, _ _ . GDPfc,3
I GDPfc 4",k-i
where:
CAPr - capital reverne
I/ Includescapia ve.
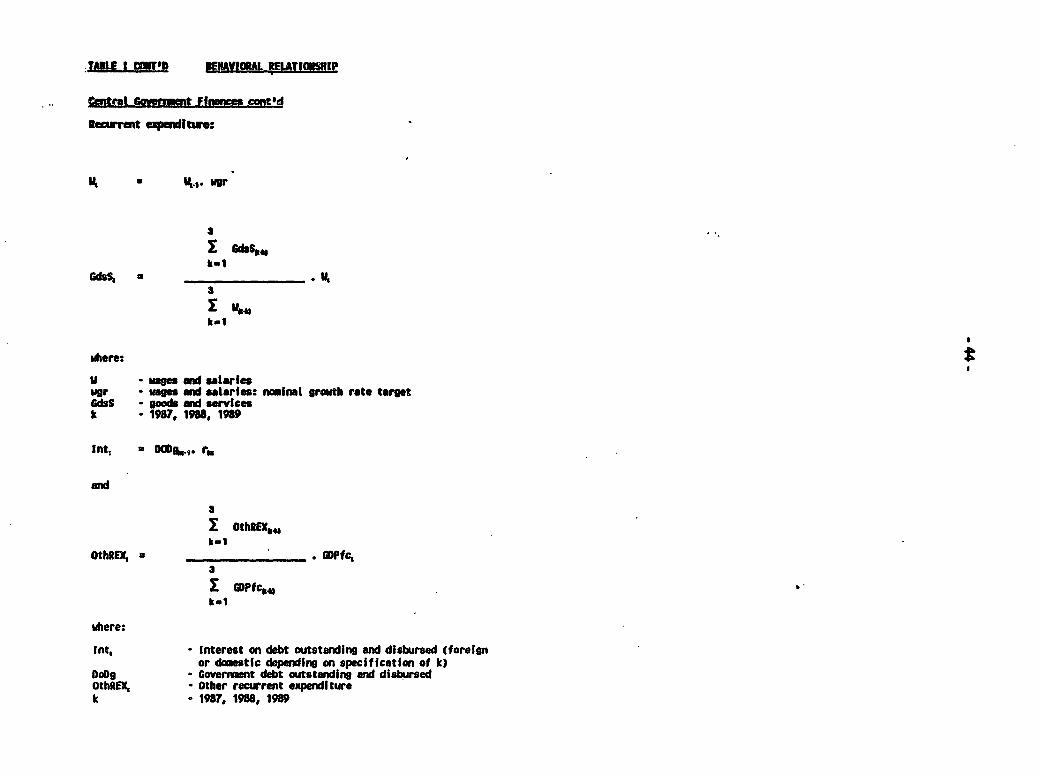
TAILE I CfTfD ENAIm AL REIATIOU8UIP
Central CovenwMt Ffnwices cont$d
Recurrent expaiitsure:
* V,. wugr
k-IGds, * . U,
3
k-1
where:
V waes aN salwieswar wages and salaries: nominal growth rate targetGd9S - goods nd servicesk - 197, 198. 1t89
Int 9 DCD6g#. r
I OthREX..k-I
OthiEX, u _ _ _ _ __ _ _ DPIc,3
I SPfc 5 ,k-I
where:
Into - Interest on debt outstanding and disbursed (foreignor domestic depending on specification of k)DoDg - Governrent debt outstanding and disbursedothREX, - Other recurrent empenditure
k - 187, 1988, 1989
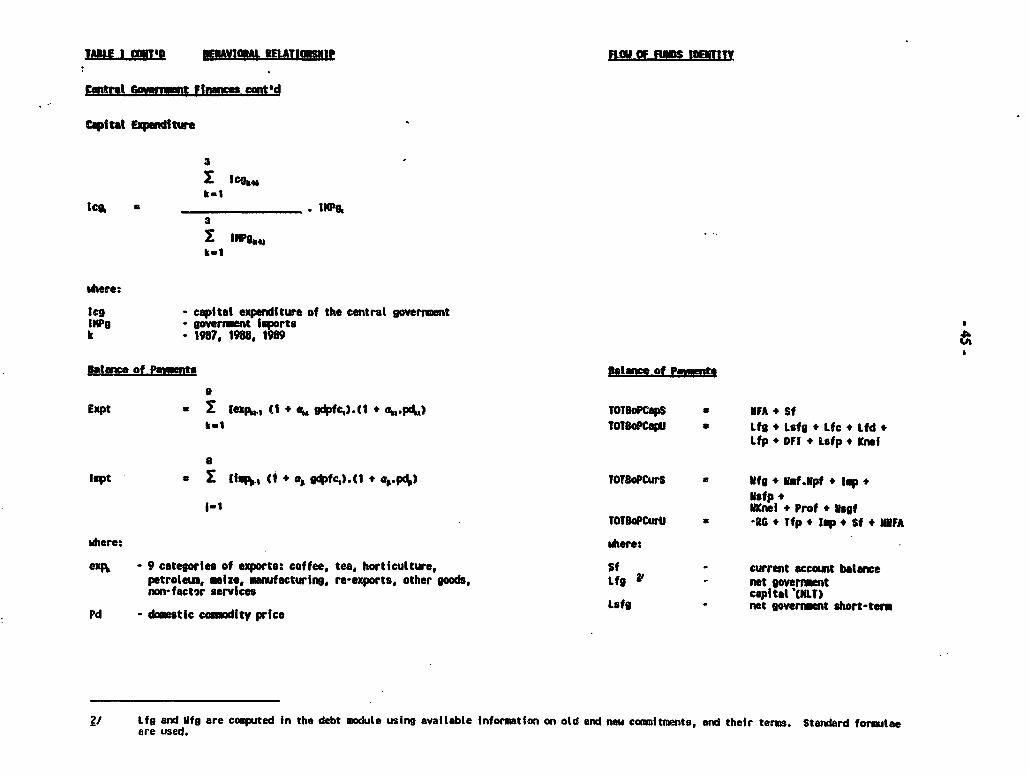
TIJ I D I£T1AVWAI Ilt I &C OF fUWS IDEIITIIY
Central Ginnut FInenes ant'd
capitat EDpwituwe
3
Ik-I
leg, 3 _ _ _ _ _ INPg,3
I IIPO..k-I
where:
lcg - capital expenditure of the central governmtIlPg - goverment lwortsk 1 1987. 1988, 1989
3ialncef PaI Ut of Pemnt
9
Expt I geq ., tl + 4 gdpfc,).t1 + a.pd.) TOTOPCpS a NFA + Sfk-i TOTOPCaIU a Lfg + Lsfg + Lfc + Ifd +
Lfp + DFI + Lsfp + Kne
lapt w I (~l ti + , gcltc).(l + a-.p4) TOTBOPCurS a Mfg + Vf.Vpf I aplsfpI+m Ine + Prof + Yrgf
TOTBoPCurU -RC * Tfp .I p + Sf + IFA
where: where:
exp - 9 categories of exports: coffee, tea, horticulture, Sf - current account balancepetroleus, mile, mmafacturlng, re-exports, other goods, Lfg t net overn entnon-factor services capital '(NIt)
Lsfg ~~~~net boverneent short-termPd - domestic commodity price
/ Ltfg and Mfg are computed In the debt module using available Information on old and new comitments, and their terms. Standard for utaeare used.
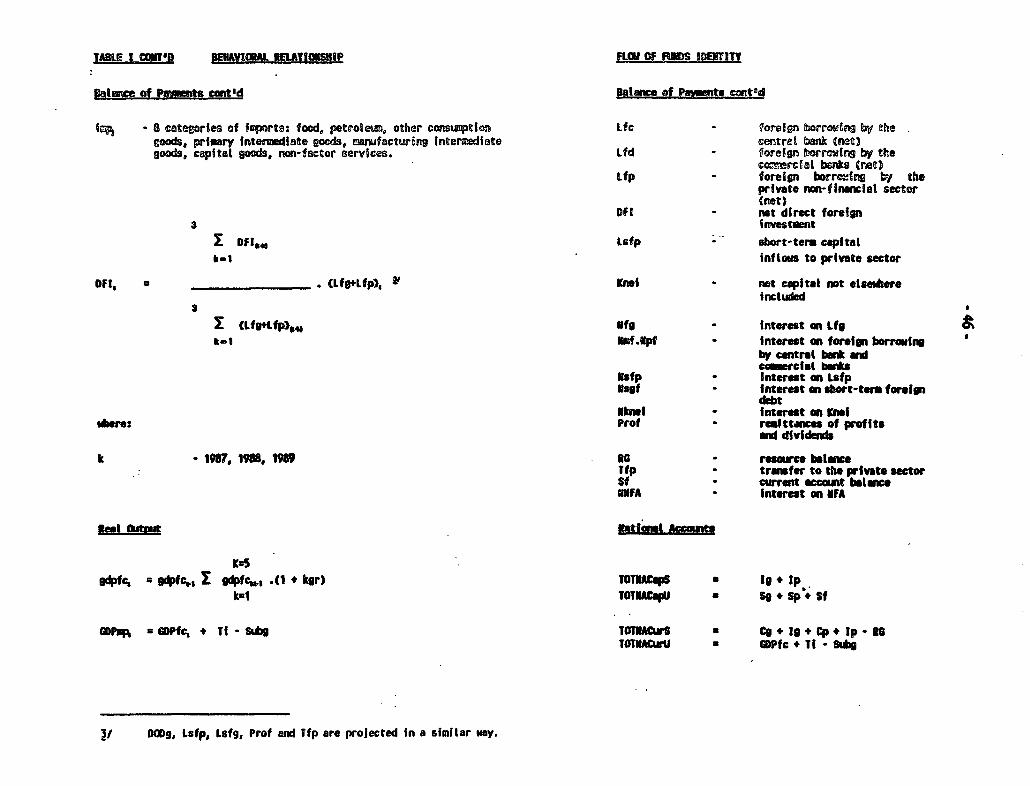
TAsLE ~ ~ ~ ~ ~ ~ ~ ~ ~ ~ ~ ~~~~~~~~~~Fl OFTe RUSStIU IIIAElMYIT
Bale of Pnts cmtSd Bulymie of ha -gnts cntd
1E - 8 categories of iprts: food, petroleun, other cnsumption Lfe - foreign borrowing by thegoods, primary Intermediate goods, mafacturfng Intermediate central beatn 03goods, capital goods, non-factor services. Lfd . foreign borrorn by the
ccmerclat bssks (net)Lfp - foreign borrecng by the
private non-finwnclet sector(net)
DFI - not direct foreign3 investmentI DFI0 Lsfp - short-term capital
inflows to privet sectorOFI, (Lfe*Lfp), a Kel net capital not elsere
ircluded
I (Lfgttfpl. Ifg - Interest on LfgNs llUpf - interest an foreian borrwing
by central bank ancecrclat bait
Isfp - Interest on LsfpEsgf - Interest an short-tem foreign
debt11Wi intert on Knolhere: Prof reittances of profits
nd dividends
k - 1987. 1988. 1989 C rsrce balatUtp - trfer to the private sectorSf - current ecount balUFA - Interest an NFA
NMIin
K=Sgi4ifc, a gifc, I gdf .(1 . kgr) TOTIApS a l *Ip
kIl TOTUCFaI a so + Sp; Sf
GDPx% a 0Pfc , Ti - Subg TOTIUCuarS * C + l + Cp. Ip - oTOTUACurU a GDPfc Ti -abg
OODg, Lsfp, Lsfg, Prof and Tfp are projected in a similar way.
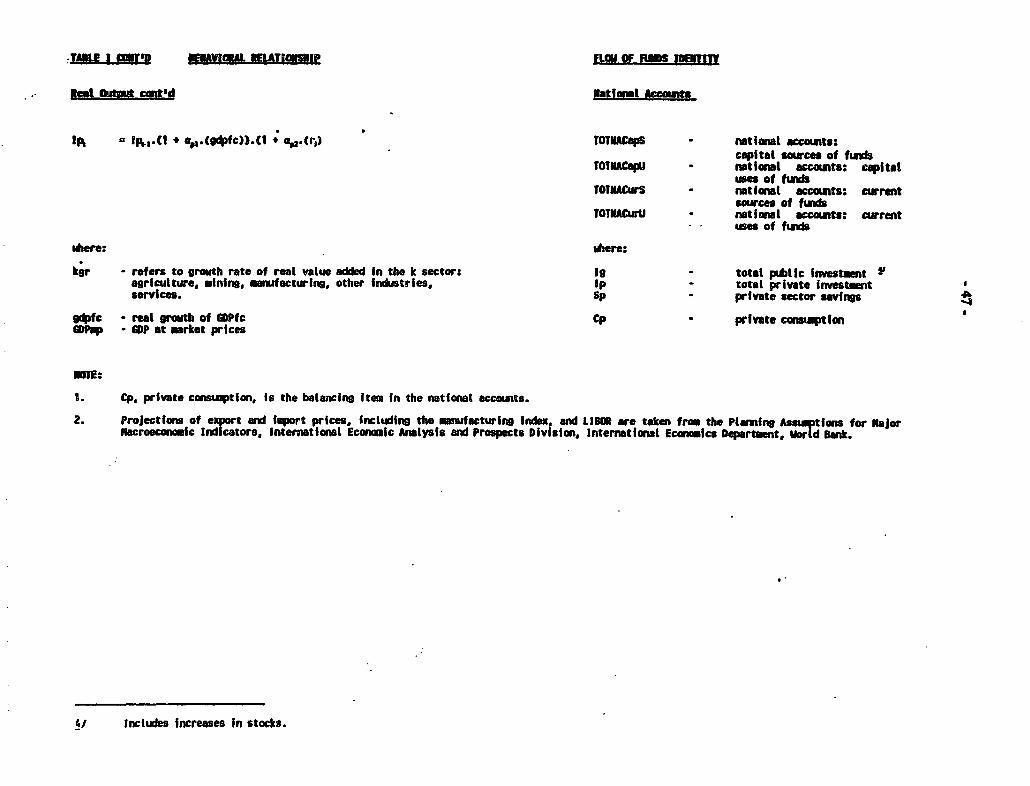
.JTA [IfO FLW O uLAT IlP FLOWF RDS gm tpeII
Redl *M cont'd al Ac
Ip, Ip,1-C 1 a$.gtcfl.(1 e e,.(r 1 ) TOTUACpS - ational acccnts:capital sxurce of funds
TOTCI - natinal accosuts: capitalues of fus
TOTNAurS nat onal accounts: currentsources of ftun
TOTNACuIrU national acosuts: awrrentuses of ud
where: where:kgr - refers to growth rate of real value added In the k sector: 19 - total pltlic Investment agriculture, mining, manufacturing. other industries, Ip - total private investmentservices. Sp - private sector savingsgtWfe - real growth of iDPfc Cp private censu ptfonGDPsp 0P at market prices
mm:
1. Cp. private consumptfon, is the balancing Item In the national accounts.
2. ProJections of export and isport prices. including the maeufacturing Index, and LIBOR are taken from the Plwning Assuspti4um for KajorMacroeconomic Indicators, international Economic Analysis and Prospests Division, International Economics Departent, irid Bank.
4/ includes increases in stocks.

- 48 -
10. Trade data come from the BOP Unit of the Ministry of Finance. Because this data comesfrom the same source as the balance of payments figures, they are expected to be consistent. Thetrade table provides information on major items in the merchandise account, including export earningsof coffee, tea, petroleum, horticulture and manufactured goods as well as imports offood, petroleum, primary intermediate goods, manufacturing intermediate g&. Is and capital goods.These items serve as the basis for projecting the trade account.
11. Apart from ensuring that columns add up correctly, the model checks for consistency betweenstocks and flows within given worksheets, and identifies inconsistencies aross data input sheets. Forexample, it checks for consistency between the capital flows implied by the DRS debt data, thebalance of payments, the fiscal accounts and the monetary accounts, and calculates the adjustmentswhich are required for consistency between capital and current sources and uses of funds. Similarcalculations are done after trade data in the nadonal accounts are compared with the figures in thebalance of payments. Because the national accounts are viewed as the 'umbrella,' the rule of thumbis to identify those adjustments which make the input tables internally consistent, reconcile stockswith flows and achieve intersectoral consistency in relation to the national accounts. The modelspecifies these adjustments explicitly.
Updating Historical Data
12. The model has been designed so that in general, historical data entered in the data inputworksheets automatically override projected data. The task of updating the model is simply one ofentering the most recent year's data in the appropriate data entry worksheet. For example, thenational accounts projected by the model for 1990 could be replaced by the actuals for 1990when they are entered in the national accounts data entry worksheet. If similar data is not availablefor monetary aggregates or other sectors, the model would continue to apply the projection rules foryears (including 1990) for which historical data are available. However, the projections would nowbe consistent with national accounts information for 1990.
13. Exceptions to this simple rule for updating the model are projected variables which usehistorical input data for explicidy specified years Mn are programmed to apply from a given startingdate. Many of these formulae and their calculated variables are time-bound to avoid simultaneitywhich JAVELIN is unable to handle or to anchor the base year of an index. The time-boundformulae are presented in Annex V.
Programming Information
14. The model is programmed in JAVELIN, a spreadsheet and database management softwarepackage. The program solves the model recursively, subject to the convergence criteria which theuser of the model could change easily. The solutions reported in this paper satisfy the criterion offalling within -5 and 5 units of the target.
15. A 'macro' has been written for each of the solutions discussed in Chapters m and IV:exchange rate solution, interest rate solution, monetization, exchange rate and interest rate solution,and the exchange rate, interest rate and monetization solution. Each of these macros operatessequendally from 1990 through 1996. For flexibility, additional macros have been written whichactivate each of the foregoing solutions one year at a time.
- 49 -
ANNEXII
FISCAL DEFICITS AND MACROECONOMIC CONSISTENCY
A. Introduction
1. Fiscal deficits could be financed through external borrowing, domestic borrowing or/andmonetization, that is, creation of base money. Each of these optiom as important macroeconomicconsequences. The most frequently discussed of these consequences in applied macroeconomicanalysis is the crowding out of private investment which could occur if the budget is financed throughdomestic borrowing. Often reference is also made to the potential inflationary effect of monetizingthe deficit. By this is usually meant the potential impact of increasing the money supply on thedemand for goods and services. However, at a given level of output, an increase in the moneysupply would only raise inflation if it exceeds what individuals would normally hold, other thingsbeing equal. Similarly, at a given level of inflation, a money supply increase would only be"excessive' if it exceeds what individuals would normally hold as output increases, other things beingequal. Accordingly, the level of inflation and the demand for financial assets limit the extent towhich the fiscal deficit can be financed through monetization. One corollary is that there may bea unique "financeable fiscal" deficit which is consistent with a macroeconomic policy package whichsets targets for inflation, external borrowing, domestic borrowing and output growth.
2. This Annex explores this issue in the context of Kenya. It uses a simple framework whichlinks the financing of fiscal deficit to domestic borrowing, the interest rate, the inflation rate, outputgrowth rate and the real exchange rate. This approach draws on the methodology developed byAnand and van Wijnbergen (1989) and Catsambas and Pigato (1989) but includes disaggregatedbehavioral equations for money demand.
3. The' Annex begins by reviewing definitions of the budget and then selects the onerationAconcept as the one most suited for determining the financeable deficit. Next, a budget constraint isspecified and manipulated to obtain an accoundng idendty which includes money creation, inflationand borrowing. Tbe specification also captures the role of the inflation tax and seignorage in deficitfinancing. Linkages are then made to selected policy targets, the behavior of money demand and theconditions for consistency between fiscal imbalances and selected macroeconomic objectives.
4. After sketching and discussing the integrated framework, the section assembles data fromChapter 3 to evaluate the consistency of fiscal performance with other macroeconomic parameters.
B. The Budget Constraint and Macroeconomic Targets
5. The operational, primary and cash deficits are three measures of fiscal imbalance. Theoerational deficit is expressed in real terms and excludes the inflation component of interestpayments by the government. The rationale for using real values is the view that interest paymentsby the government may contain an inflation premium which is not regarded as income by therecipients but as a restoration of inflation-induced capital losses. In consequence, the inflationcomponent of interest receipts would not be spent, at least not fully, and therefore would not (fully)translate into a claim on resources. The primary budget goes a step further and focuses on the non-interest component of the budgetary accounts. Hence, this concept is useful for analyzing the impactof curren fiscal policy on aggregate demand, since the interest paid on debt is only the result of ps
so.
fiscal policies. £ Finally, there is the cash or observed deficit which is pacticularly useful whentracing the movement of financial resources between the central government and the rest of theer.onomy. 'The view is now widely held that the ogeradjonalg deficit best reflects the abso.pdion ofreal resources by a government, and thus is the most appropriate measure of fiscal plicy within thefamework of stabilization and adjustment." #6. The analysis which follows Is anchored in the govemnment budget identity whichacknowledges that the sum of the real non-interest defcit (d), including the real inerest due ondomestic debt (ib) and foreign debt ([be), is equal to the sum of financing from all soum es.Financing could take the form of real external debt (b'), domestic debt (b) or central bank credit tothe government (dc). Formally,
d 4' ib + ib-e 3 b + b"e + dc, (1)
where i is the real domestic intarest rate, i^ is the real foreign interest rate, e is the real exchangerate, and " ' indicates the change in the specified variable.
7. Eq. (1) would come closer to reality if it were to include deficit financing which may not bereflected in the account of the central government. It is conceivable, for istance, that some foreigndebts of the central government could be handled by the central bank without being adequatelyrecorded in the budget. To cover such cases, consider a simplified balance sheet of a central bank.The assets therein are real credit to the central goverment, dc, and real net foreign assets (valuedin local currency), nfae. The liabilities consist of currency held by the public, Cu, and commercialbank reserves, RR, so that:
M/P = (Cu + RR)IP o
where P is the domsstic price level and M/P is the real value of the central bank's nominal basemoney or the central bank's net liability to the p,ivate sector. The balancing item is assumed to benw, the real net worth of the central bank, where:
nw M/P = dc, + ae .. (3)
Eq. (3) indicates that the net worth and base money are used, in this illustration, to extend credit tothe central government and to obtain foreign assets. Intuitively,:
nw ifwe ... (4)
that is, that the real value of interest earnings on foreign assets Increases the central bank's real netwoeth.
S. Eq. I can now be rewritten to reflect the inc!usion of the central bank in the budget constraint:
I/ Tis claim makes th simplisic aumpion tha no idtrs payments oa deb conttd during the ourent period all duewithin dha patiod.
I/ Catamba at i. (t989). p. 4.
d + ib + i(b - ab)e = b + (b- -nfale + dc,+ nfe -nw
The &eft hand side of eq. S consolidates the defbit of the central govenmuent and the central bank bynettng out the net worth of the latter. On the right hand side, the change in net worth-equivalentin this context to the change in net foreign assets-is introduced (and then subtracted to mainainequality between the right and left sides) to forge a link between the deficit and the money supply,MIP, where:
MIP = dc, + nfae - .. (
Eq. (6) is the dynamic form of eq. 3 and permits eq. S to be rewritten as:
d + ib + i7(b* - nfa)e = b + (b- -nfa)e + m ... (7)
In eq. (7), *m" excludes private sector deposits in the banking system which would be offset in aninflationary situation by the erosion of liabilities outstanding to the private sector. Otherwise, "m"would not represent a U revenue increase-the inflation tax-which partly finances the deficit. 1'A logical extension of this argument is the conclusion that the ggnratonal definition of the budget,the one which excludes the inflationary component of interest payments, is the one most appropriatefor this analysis (para. 2).
9. In eq. (7) a link is establisned between the deficits of the cenal government and the centralbank, and the money supply. The next step is to find a way to reflect capital losses which arise fromreal exchange rate changes and which are a part of the cost of servicing the foreign debt. This isdone by decomposing the change in real net foreign debt (valued, in local currency) into the impactof the real exchange rate movement on the sto^k and flow of debt; that is,
[(b-nfa)e] - (b-nfa)e + e'(b - nfa)e ... (8)
If The appropriate deriniclon of money for this exercise should coincide with the central bankc's aet liabides; tha is,ba money (currency plus commecial bank reevs with the central bank) should exsclude credits which the centnabank may have extended to the ptivae sectot and to commercial benka. This is becas net revenue via the inMadtiontax should exclude revenue derived feom the inflationaty erosion of the priva setom's deposit in the banking system.which Is offset by the inflationary erosion of loans ousanding to the private sactor. What remains is the central bankd non.wnterestbwaring liabilities to the privat sector. For this eaon it would bo neccuay to adjust da reportedas reserve money in the Interntional Finance Sistics to exclude any loans by the canta bank to the nongovernmentsetot.
2 2-I
where "'" is the percentage change of the variable. Similarly, the change in the real value of thenominal base money may be decomposed into:
MIP m + P'm ... (9
The first variable on the right hand side of eq. (9) represents ana egL-t change in the realmoney balances which economic agents hold at a Ma rate of ifation. Conceivably, as nationalincome grows, agents may wish to hold higher real money balances. 1 y be a source of deficitfinancing in that it would allow the government to increase the real money stock (in line with thisincrease holding of real money balances) without fueling inflation. The second term on the right handside of eq. (9) represents the inflation tax or the amount by which the nominal money balances haveto be increased to keep the real value of the money stock constant.
10. Eqs. (8W) may be substituted in eq. (7) to produce:
d *- ib + (i! + e')(b- n)e = b + (be -nfa')e + [(b- nfa)e]
+ m + P'm .. (10)
Eq. (10) restates the budget constraint as the requirement that the operational fiscal deficit, includingreal interest payments and the real value of the profits of the ceural bank, must equal the changesin the real value of domestic and foreign debt (net of the real value of the profits of the central bank),and revenue from seignorage and the inflation tax.
C. The Budget Deficit and Macroeconomic Targets: From Design to Application
11. The practical question for the policy analyst is to determine the level of fiscal imbalance whichis consistent with the growth target, the inflation target, the real exchange rate and interest rate, andthe limits on domestic and external borrowing. The first step towards an answer is to derive theactual annual deficits of the central government in accordance with the left hand side of eq. (10).The second step is to calculate the financeable deficit using the target value for P' and the ratio ofdebt of GDP a la the right hand side of eq. (10). However, although eq. (10) is useful, it ignoresthe relationship between exchange rate changes and inflation and vice versa. It also ignores the factthat inflation may have an independent negative impact on the size of the monetary base from whichthe inflation tax is derived and omits the influence of factors such as interest rates on differentfinancial instruments. e'
12. The econometric results in Tables I and 2 are an input into the calculation of the demand forbase money and thereby, an input into the calculation of the seignorage, the inflation tax and thefinanceable deficit. Tae signs and magnitudes of these results are theoretically plausible andeconomically sound. The relationship between real income growth and real money balances ispositive. Inflation appears to have an understandable negative impact on the growth rate of real
11 Finnncial rogulaions-reserve requirenents. cash ratios, a-e-would also play a pan in determining the currency held bycommercial banks and nonbanic uLancial instiions, and thereby, in determining the finaAceable deficit. Thea factors didnot appar to be sazaiaically significant and cconomically meaningful in the esimated money demand functions reported inTable 1. This is probably understandable since flnaeal seatr ratoms were sed only recently In Keya. However.subsequene reserch will analyze the impact of finaneal forms on the demand tor money.
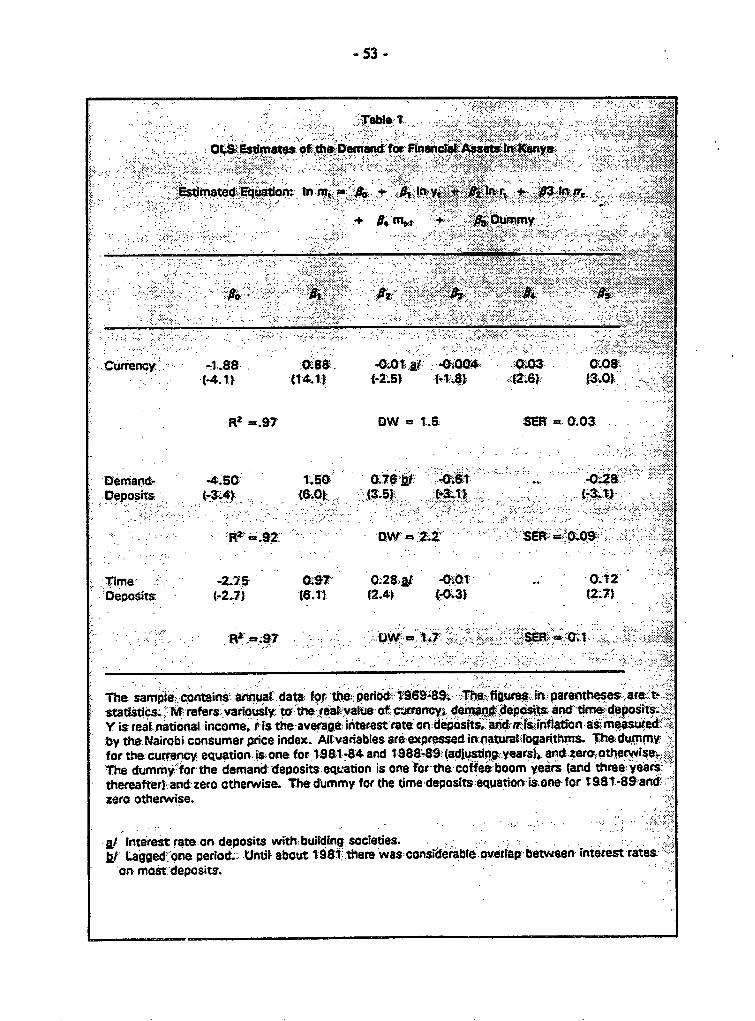
-53 -
- fat FTnanc~. .... . :. :y. .....
,,,,, .:., '.,^..,'<>,or,ln.~~~~~~~~~~~~~.... ... .- ...m8ed~ut~*1 Inm~-j,~~ * ny;, p¢1rbrt .. " .. h:a......;
+ D~~.m 'QiOG 3f Dmm
Rt .97 OW1BSER' 0.03
,Demand- 4.:'50' 1.'76 a. '' .; i, :2 ,
T:'' :'im' - .'e -2; .15 0, ? 0.2 . -01 . .
O:epodits: (-2J) (.) (2.4) -0.31' (2.7)
s ~~a.... ~. v ., ;'"
T he. sam'.e contain a a ' . peroed: .o . :..: p .: ' ' .: | -i: .:T:. h :,igue e estatti Mrefers+ variously: to* thea eavalue. O crrency es a tame deosts
by the. Nairobi consumer price index. Al varables are exese&.exq d ir .natul logaFithms. The. dt-mmfor the currency equ;tioni. ^sone for119.81-84 and 1-98849(adjustingyears) and. zero,otherwiseThe dumnmyfor the demand deposits.eqt~ation is one f' h cffeboo er (arnd three er
. .~~~~~~~~~~~~~~~frtec .:e .- ,c yers a. .: . .,:
thereafterdandzero otherwise T-he dummy for the timedeposits:equat. t-is.one for8 8 an
zera otheswise.
./ nterest rate on. deposits wit .bui.l.ing. societies.
lt- Lagged-.one period.-. Untit about 1981 -.there'was:considerable overflap bestween interes -rateson Most: deposits.

-54.
money demand while the demand for demand deposits and time deposits and their respectiveinterest rates is understandably positive. Currency does not eam interest and is therefore negativelycorrelated with the interest rate on time deposits which are an alternative asset. Table 2 shows themagnitude of these relationship in the long-nm. These coefficients are used tO simulate the behaviorof base money as inflation and real growth change, to esdmate the inflation tax and seignorage andthereby, to determine the fiscal imbalanceswhich are consistent with the stabilization and.t.adjustment objectives.
13. The results in Table 3 are obtained fromthe financeable deficit shell of the model usingthe methodology and coefficients in pra. 6-12.The operational and financeable deficits arecalculated and the sources of fiacing-seignorage, the inflation tax, domesticborrowing and foreign borrowing - are shown.By disaggregating the sources offinancing, the Table is also able to provide a pardatl it ...equUibrium perspective on what the consistent j0e ̀:t:>financeable deficit would be under each scenario{f that source of Jinancing does not materialize Ol97 ;. .001
14. Generally, the availability of foreign " ' _'''';____>:
financing is the largest single determinant of thefinanceable fiscal deficit when exchange rate and , , . .; Oe.4trora .Ta , .
the interest rate policy are used and in the basicprojections. The inflation tax is also a . .... ..
significant contributor especially when the fiscaldeficit is monetized.
D. Limitations of the Framework
15. Whereas this framework is useful in calculating the level of fiscal imbalance which is consistentwith given macroeconomic targets, it does not deal with the desirability of one form of deficitfinancing versus another. 2 It also neglects the implications of financial sector reform for moneydemand.
2/ 'Me model is aiso inappropriate for dealing with the microeconomics of various revenue instruments.

- 55 -
Table 3Tbe Fiancable Fisal Deicit in Selected Scenarios
Sconario" I19 1992 1993 1994 1995 1996
Base Projections Model (%GDP)
Operational Deficit (excl. grants) 6.5 S.9 6.5 5.9 6.3 6.5
Financeable Deficit 12.7 S.0 2.2 S.S 4.2 4.6
Seignorage 0.8 0.9 0.9 0.8 0.7 O.S
Inflation Tax 2.7 2.0 1.6 1.3 1.3 1.2
Domestic Borrowing 4.7 0.5 -3.4 1.2 0.2 0.6
Foreign Borrowing 4.S 2.6 3.1 2.2 2.0 2.3
Exchange Rate Soluton (% GDP) _
Oporational Deficit (excl. grts) 6.5 5.9 6.5 5.9 6.3 6.6
Financeable Deficit 12.6 4.9 2.1 5.5 4.1 4.6
Seignorage 0.8 0.9 09 0.8 0.7 0.5
LIflation Tax 2.7 2.0 1.6 1.3 1.3 1.2
Domestic Borrowing 4.6 .0.6 -3.5 1.2 0.1 0.6
Foreign Borrowing 4.S 2.6 3.1 2.2 2.0 2.3
Interest Rate Solutlon (% GDP)
Operational Deficit (excl. grants) 6.5 5.9 6.5 5.9 6.3 6.5
Fiuanceablo Deficit 12.7 5.1 2.4 5.8 4.7 5.4
Seignorage 0.8 1.0 1.0 1.0 1.0 0.9
Inflation Tax 2.7 2.0 1.7 1.3 1.3 1.3
Domestic Borrowing 4.7 O.S -3.4 1.3 0.4 0.9
Foreign Borrowing 4.S 2.6 3.1 2.2 2.0 2.3
Monetization (% GDP)
Operational Deficit (excl. grants) 6.5 5.9 6.4 5.8 6.2 6.3
Financeable Deficit 12.7 4.9 1.9 S.0 3.6 3.8
Scignorage 0.6 0.6 0.6 0.7 0.7 -0.3
InflaioaoTax 2.9 2.2 1.8 1.4 1.2 1.9
Domestic Borrowing 4.7 O.S -3.6 0.7 .0.3 | 0.1
Foreign Borrowing 4.S 2.6 3.1 1 2.2 2.0 2.3
A deficit carries a positive sign. A negative deficit is a surplus.

-56 -
ANNEX m
IMPORT ELASTIC IS IN KENYA: 196849 AND BEYOND
1. In Kenya import restrictions were used pervasively during 1968-89 to close the gap betweenthe notional demand for imports and the available foreign exchange, as weil as to protect domesdcproduction. This Annex explores how Import elasticides are likely to behave after import restrictionsare lifted. The broad conclusion Is that traditional esdmates witi1gnort import restrictionsunderstate the otrue" import and price elasticities of demand. Comparative stadc analysis suggestsdtt with import liberalization in Kenya, the income elasticities of demand for imports of goods andnonafctor sevices would rise to about 1.00 but would be dominated by an aggregate price elasticityof approximately -1.45.
2. Section One reviews the traditional and modified traditional approaches to import demandspecification, idendfies their weaknesses and suggests modified, disaggregated import demandfunctions for Kenya that take into account import restrictions and the influence of sector specificactivity. Section Two reports and analyzes the econometric results and enumerates their implicationsfor import behavior after trade liberalization. Finally, Section Three identifies areas for additionalempirical work on import elasticities in Kenya.
&WnnAnoroaches to the Sgeciflcatdon of m=t Elasticities
3. The traditional specification of import demand is:
In M bo + b, In Y, + b 2 In (P/PJ + u, (1)
where M is real imports, Y is real income, P. is import prices, Pd is domestic prices and u is theerror term with the properties u, - NID (0,oa:). As the equation is specified in logarithms, theparameters b, (usually bt >0) and b2 (usually b2 <0) are the real income and price elasticities ofimports, respectively. Tbis traditional approach has three major operational weaknesses. First, ittends to focus on aggregate imports but for developing countries in pardcular, different categoriesof imported items may behave very differently. Second, the traditional approach tends to emphasizeaggregate real income even when imports and prices are treated at a disaggregated level. i' Itis therefore unable to capture movements in imports, aggregate or disaggregate, which may beassociated with changes in the sectoral origin of national income. Third, eq. (1) does not take intoaccount trade restrictions which may suppress actual demand below its notional level.
4. To overcome these shortcomings of the traditional approach, this paper relates broad categoriesof imports to aggregate income as well as valued added in specific sectors. The methodology of Chuet al. (1983) and more recently Faini et al. (1988) and Moran (1989) is also followed by introducing
indicators of foreign exchange availability into eq. (1). The new specification is:
j2i Kha (1975) discusses the problem of using aggegage imports in the traditional demand equaion but ignores thepractice of using aggrega income. See M. S. Khan, The Strtucture and Behavior of Imaport of Venaeuela.Rovi n ics anStatistics. vol. 57. pp. 221424.

-57-
lnM4 bo + bt In Ys, + b2 In (P,P&J - b, ln F,+ b, ln R.L + bs ln M, + 4u (2)
whre Ys is valued added in the named sector, F is the sum of export earnins and not capitalinflows, R is the end-year reserve posidon and MN,, Is the laged values of the dependent variable.All variables are expressed in millions of real Kenya pounds exceptn prices which are In indicesderived therefrom.
S. Eq. 2 is a mixed blessing. k diaggrgates the relationship between categories of Impors andvalue added by sector and includes foreign exchange variables which, at least In the Kenanl case,were likely to have influenced import demand. However, it does not allow the stuctural parameters-the real income and price elasticities of demand-to be reovered. IV Moreover, as with eq. (1),prices are assumed to be exogenous. w
6. Faini (1988) and Moran (1989) suggest a system of simultaneous equations which includes theforeign exchange constraint but which also allows unconditional elasticities to be recovered. Theequations are as follows:
InM - ao + a, 1 nYs + 4 2 In [1P.JPJ + a3 InM .+ut (3)
InM.A bo + b, InF + + In Pt +b,lnIMn t+ v, (4)
where M, is the supply of foreign exchange; other variables are as defined in eq. (2).
IV If eq. (1) were the correct import demand fucdon. b, and b would be inctpru resecively as the real income end
price cagltjides. If eq. (2) were the cocrec specitlladon, bt and b2 would reresent the influence ot Income andprice, sM the influence ot the other stauistically gnliticant variable.
W The a.i.f. pricm ot impocu may be exogenous but policy-induced masures such as txe. tAriffs and non-ariff
baniers may affect the price ai is aculy paid. Similarly. demcsdc prices may be influened to considerablemeasure by governmantierlvetons rsch as price controls. Thus, PJP may not be exovocus.
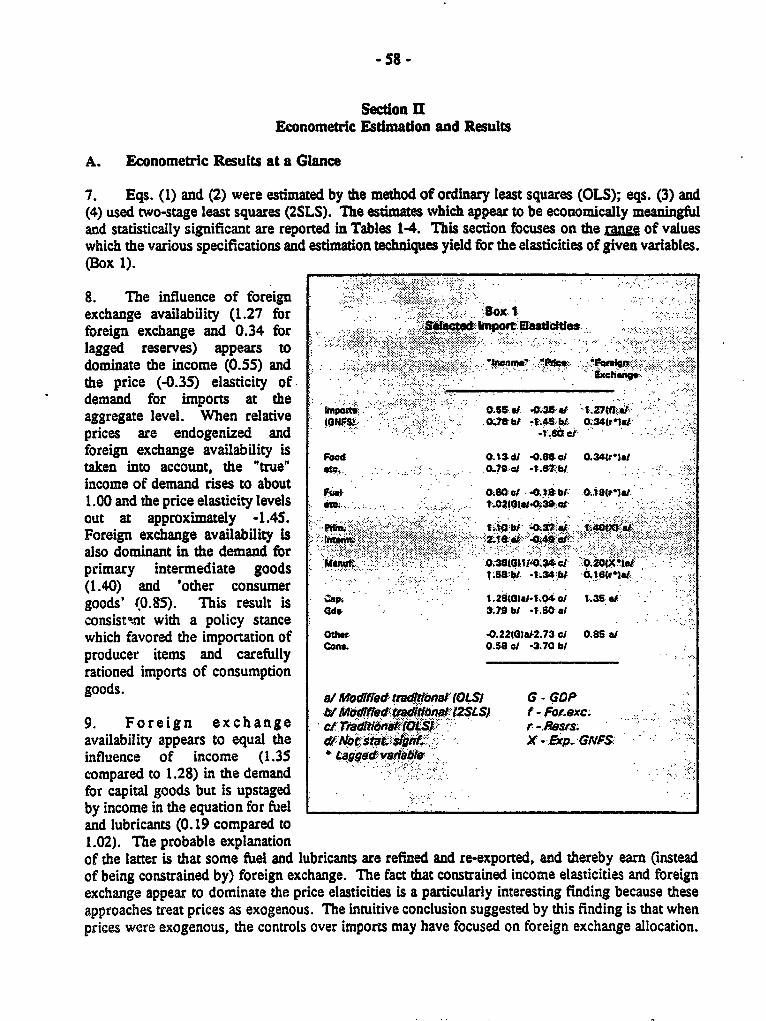
Section EIEconometric Estimation and Results
A. Econometric Results at a Glance
7. Eqs. (1) and (2) were estimated by the method of ordinary least squares (OLS); eqs. (3) and(4) used two-stage least squares (2SLS). The estmates which appear to be economically meaningfuland sutistically significant are reported in Tables 1-4. This secdon focuses on the range of valueswhich the various specifications and esdmation techniques yield for the elasticities of given variables.(Box 1).
8. The influence of foreignexchange availability (1.27 for -Box 1foreign exchange and 0.34 for *. *e6n lOIErastlcitfs
lagged reserves) appears todominate the income (0.55) and .g s- - P<;ep
the price (-0.35) elasticity of ._:_:::_____i;___-demand for imports at theaggregate level. When relative i 055. .0.25.1 lJ7fflet(GP4FW 0.75~~W b/ 4.46,4. bl O34W14prices are endogenized and -1.60 @1
foreign exchange availability is .03501 0.3t-1 ..taken into account, the "true" ... : ;. Q?9 i -. 8W -income of demand rises to about . .O1: .1.00 and the price elasticity levels ; ,;o02ot.o. ;7agout at approximately -1.45. > .Foreign exchange availability is , tste, XY.s1
also dominant in the demand for0 38 .1.4~I02OtX eprimary intermediate goods XM'; o -1.3461 .
(1.40) and 'other consumergoods' (0.85). This result is 79 t t.64@1 1
Qdw ~~~~3.79b1 15.consist,.nt with a policy stancewhich favored the importation of o -0.22(01W-2.73 el 0.85 a
producer items and carefully COe. 0.58 el -370 bI
rationed imports of consumptiongoods. a/ModIfiedtadJ,trzfonaI'OLSI G - GOP
IV MgdtedtIat (2SLS) f. fo,.exc.9. Foreign exchange c/.t: 6 SI r-Resis.availability appears to equal the odl ot;* stX --..6p GNFS'influence of income (1.35 . aggudvauab/.compared to 1.28) in the demandfor capital goods but is upstagedby income in the equation for fuel .and lubricants (0. 19 compared to1.02). The probable explanationof the latter is that some fuel and lubricants are refined and re-exported, and thereby earn (insteadof being constrained by) foreign exchange. The fact that constrained income elasticities and foreignexchange appear to dominate the price elasticities is a particularly interesting finding because theseapproaches treat prices as exogenous. The intuitive conclusion suggested by this finding is that whenprices were exogenous, the controls over imports may have focused on foreign exchange allocation.
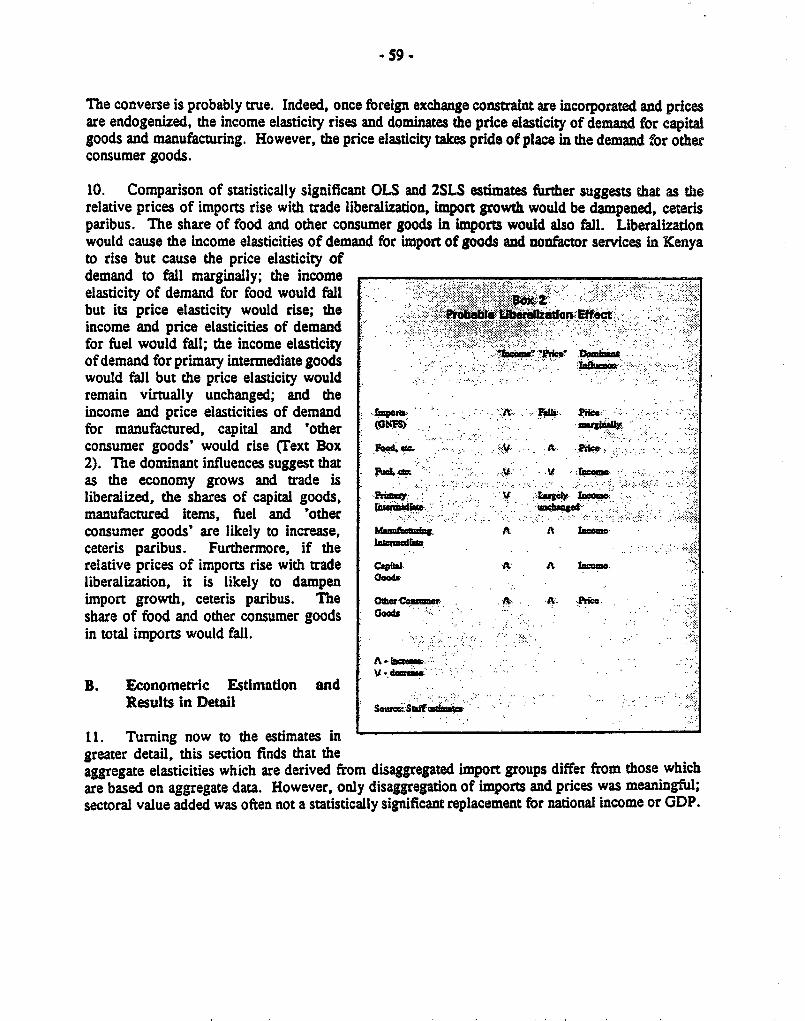
59 e
The converse is probably true. Indeed, once foreign exchange constraint are incorporated and pricesare endogenized, the income elasticity rises and dominates the price elasticity of demand for capitalgoods and manufacturing. However, the price elasticity takes pride of place in the demand for otherconsumer goods.
10. Comparison of statistically significant OLS and 2SLS estimates fiuther suggests that as therelative prices of imports rise with trade liberalization, import growth would be dampened, ceterisparibus. The share of food and other consumer goods in imports would also fall. Liberalizationwould cause the income elasticities of demand for import of goods and nonfactor services in Kenyato rise but cause the price elasticity ofdemand to fall marginally; the incomeelasticity of demand for food would fallbut its price elasticity would rise; the prb¢ g i miii tanEStc.income and price elasticities of demandfor fuel would fall; the income elasticity ; ;; ,s -of demand for primary intermediate goods . * .
would fall but the price elasticity wouldremain virtually unchanged; and theincome and price elasticities of demand : E . i P ;for manufactured, capital and 'other m: --consumer goods' would rise (Text Box J.|,. ;- v h Pe
2). The dominant influences suggest that ras the economy grows and trade isliberalized, the shares of capital goods, Pd . ' Le - a;manufactured items, fuel and 'other ;-consumer goods' are likely to increase, _A A Ihusoi
ceteris paribus. Furthermore, if the :relative prices of imports rise with trade caita A A ince.
liberalization, it is likely to dampen aimport growth, ceteris paribus. The od ncs A .I.A
share of food and other consumer goods Gos
in total imports would fall.
A*.... .- .. . - ... :.
B. Econometric Estimation andResults in Detail
11. Turning now to the estimates ingreater detail, this section finds that theaggregate elasticities which are derived from disaggregated import groups differ from those whichare based on aggregate data. However, only disaggregation of imnports and prices was meaningful;sectoral value added was often not a statistically significant replacement for national income or GDP.
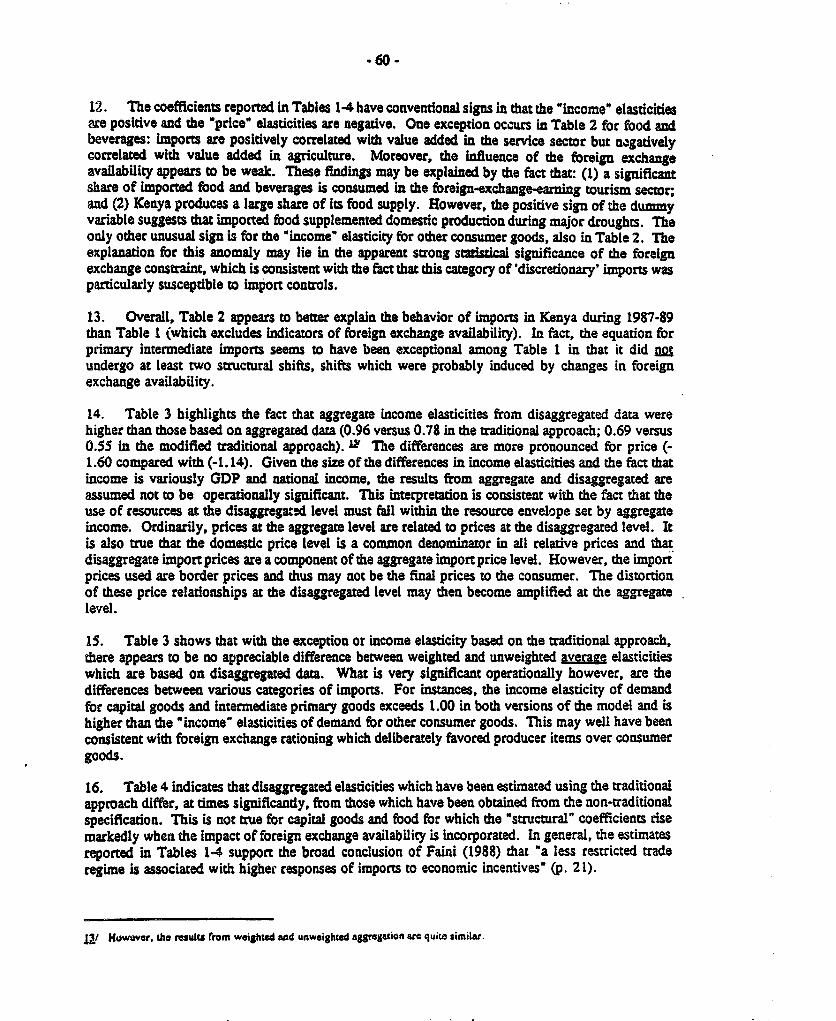
60-
12. The coefficients reported in Tables 14 have convendonal signs in that the 'income' elasticitiesare positive and the 'price' elasticities are negative. One exception occurs in Table 2 for food andbeverages: imports are positively correlated with value added in the service sector but nagativelycorrelated with value added in agriculture. Moreover, the influence of the foreign exchangeavailability appears to be weak. These findings may be explained by the fact that: (1) a significantshare of imported food and beverages is consumed in the foreign-exchange-earning tourism sector;and (2) Kenya produces a large share of its food supply. However, the positive sign of the dummyvariable suggests that imported food supplemented domestic production during major droughts. Theoaly other unusual sign is for the "income' elasticity for other consumer goods, also in Table 2. Theexplanation for this anomaly may lie in the apparent strong statistical significance of the foreignexchange constraint, which is consistent with the fact that this category of 'discretionary' imports wasparticularly suscepdble to Import controls.
13. Overall, Table 2 appears to betuer explain the behavior of imports in Kenya during 1987-89than Table 1 (which excludes indicators of foreign exchange availability). In fact, the equation forprimary intermediate imports seems to have been exceptional among Table 1 in that it did flDundergo at least two structural shifts, shifts which were probably induced by changes in foreignexchange availability.
14. Table 3 highlights the fact that aggregate income elasticities from disaggregated data werehigher than those based on aggregated data (0.96 versus 0.78 in the tradidonal approach; 0.69 versus0.55 in the modified traditional approach). I The differences are more pronounced for price (-1.60 compared with (-1.14). Given the size of the differences in income elasticities and the fact thatincome is variously GDP and national income, the results from aggregate and disaggregated areassumed not to be operationally significant. This interpretation is consistent with the fact that theuse of resources at the disaggregat2d level must fall within the resource envelope set by aggregateincome. Ordinarily, prices at the aggregate level are related to prices at the disaggregated level. Itis also true that the domestic price level is a common denominator in all relative prices and thatdisaggregate import prices are a component of the aggregate import price level. However, the importprices used are border prices and thus may not be the final prices to the consumer. The distortionof these price relationships at the disaggregated level may then become amplified at the aggregatelevel.
15. Table 3 shows that with the exception or income elasdcity based on the traditional approach,there appears to be no appreciable difference between weighted and unweighted average elasticitieswhich are based on disaggregated data. What is very significant operationally however, are thedifferences between various categories of imports. For instances, the income elasticity of demandfor capital goods and intermediate primary goods exceeds 1.00 in both versions of the model and ishigher than the "income' elasticities of demand for other consumer goods. This may well have beenconsistent with foreign exchange rationing which deliberately favored producer items over consumergoods.
16. Table 4 indicates that disaggregated elasticities which have been estimated using the traditionalapproach differ, at times significandy, from those which have been obtained from the non-traditionalspecification. This is not true for capital goods and food for which the "structural" coefficients risemarkedly when the impact of foreign exchange availability is incorporated. In general, the estimatesreported in Tables 14 support the broad conclusion of Faini (1988) that "a less restricted traderegime is associated with higher responses of imports to economic incentives' (p. 21).
at1 Htiweovr. the reults rtomn weighted and unweighwcd aggregation arc quite similar.

- 61-*
Table IUmpirical Results: TraditIonal Appvoach
(OLS Estimates)
Importsof goods Food Fuels Primaryand non- and and inter- Manu- Othetfactor beve- lubr- mediate factured Capital cons.services rages cants goods goods goods goods
Constant -3.70 -5.05 -2.1 -14.2 9.8.6 -13.1 -4.83N(-1.) (-1.6) (-1.01 (4.01 (-3.0) (-3.6) (4-.41
Nathonal 0.78 0.79 0.80 1.70 1.7S 1.63 0.58Income (4.6) (2.6) (4.01 (4.5) (4.2) (5.4) (2.1)
Relative -1.60 .0.86 -0.39 40.40 -1.04 -1.04 -2.73prIce (-6.3J (4.01 (-5.91 (-2.7J (-5.5) (-2.51 (8.71
Dummy 0.09 (a) -0.28 (ci 0.62 (bi 0.15 (Hi -0.19 (eJ 0.21 (aJ(1.7) (-1.91 (5.81 (1.91 (7.9) (2.9J
Dummy 0.48 bJ 40.21 (i 0.13 fa -0. IO6(dl -0.34 (*7 -0.20 (c(3.91 (-7.41 (2.71 (-1.9) (2.8) (-1.8)
Dummy 0.2(1 (d 0.28 (b) -0.15 (gi 0.77 )3.1 (2.0) (71.91 (5.O
Dummy 0.28 (ci(-3.3J
R2 0.68 0.51 0.80 0.66 0.89 0.70 0.69
D.W. 2.7 1.9 2.5 1.9 2.0 1.4 1.9
SSR 0.19 0.6 0.19 0.50 0.29 0.40 0.34
The dummy (ai ls one for the oil shock years and zero otherwise; (bJ is oine for post-1973 oiol shock) periodand zero otherwise; (cJ Is one for the adjustment perlod beginning In 1987 and zero otherwise; (dii one forthe adJustment period in the early and late 1980s and zero otherwlse; (el is one for the droughts in the 1970sand 1980s and zero otherwise; (f Is one for the period after the second oil shock and zeo otherwise; and (giIs one for the perlod years following the oil price Increases up 40 the commencement of sector adjustmentoperations, and zero otherwise.

-62
rable 2Empldlcal Results: Modfled Traditonal Approwh
IOLS Estimates)
imports of goods Food Fuels Pdmaryand non- and and Inter- Manu- Otherfactor beve- uhdb- meato e fwctwd Capital cons.sewices rages cants goods goods goods goods
Constant -4.38 -3.46 -7.55 -16.7 4.84 -19.0 .0.74(3.0) (0.91 (-3.01 (4.31 (-2.2J (-6.2) (.0.471
Dopendent verfabIoV.55 0.22' 0.21*(-3.1) (2.71 (2.3)
Foreign exchange 1.27' 0.40 1.35 0.85(6.6) 12.01 (9. 1J (5.7)
Exp. GNFS 1.40(2.4)
Reserves 0.34* 0.790 0.20-(3.61 (4.71 (2.5)
Notional Income 0.55 1.10(4.6) (2.61
Gross dom. product 1.02 0.38 1.28 -0.22(4.9i /i-OJ 15.5i /-1.9)
Agriculture -1.51(1.51)
Services 1.32(2.0)
Relative prlce 40.35 -0.67 .0.07 -0.37 40.34 -1.5 -0.30(-2.8J (4.1) (-7.3) (-2.5) (-2.0) (4.7J (-7.2J
Dummy 0.37(d) 0.33(a) -0.071h)(3.6) (3.7) (4.91
Dummy 0.12(d)(2.7)
Ra 0.86 0.72 0.88 0.65 0.82 0.84 0.95
D.W. 2.5 2.4 2.3 2.0 2.0 2.3 2.7
SSR 0.08 0.32 0.06 0.38 0.20 0.21 0.74
(hi is a time trend. See Table t for other deflnItlons.
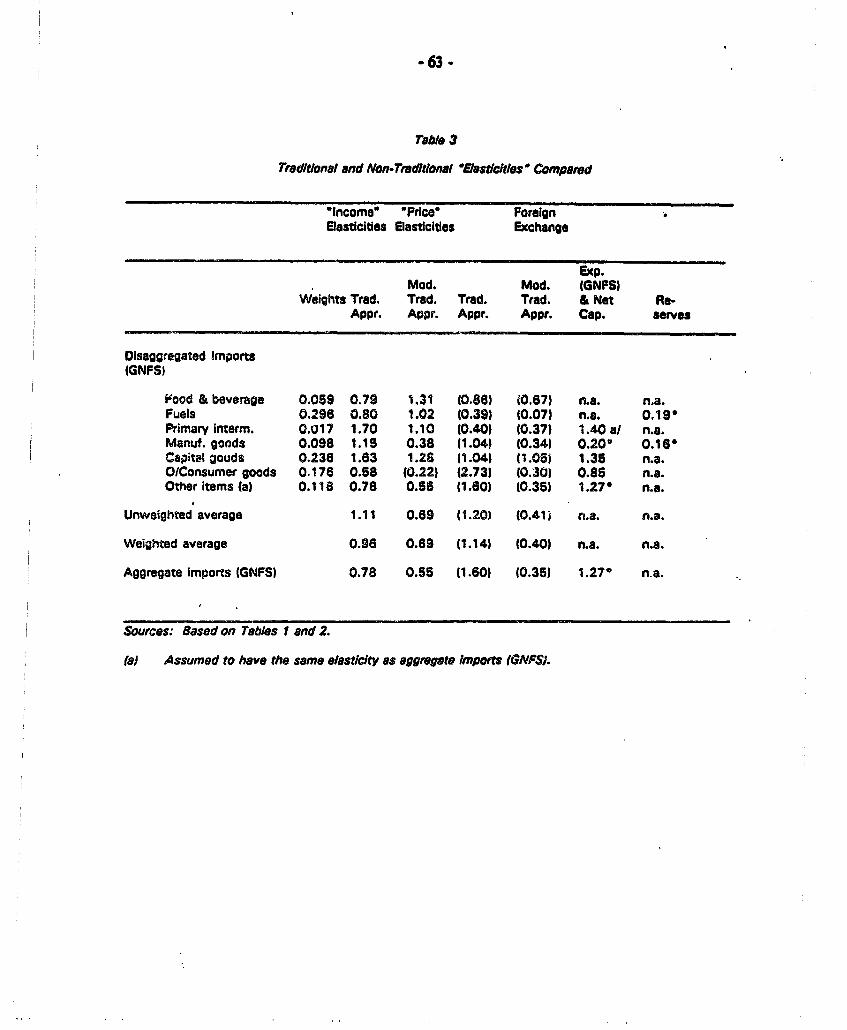
-63 -
Table 3
Traditional and NonT0tadhtnl "lastlcltles Conp,ed
lIncome 'Price ForeignElasticities Elasticities Exchange
Exp.Mod. Mod. (GNFS)
Weights Trad. Trod. Trad. Tead. & Net Re-Appn. Appr. Appr. Appr. Cap. serves
Disaggregated Imports(GNFS)
iFood & beverage 0.059 0.79 1.31 (0.88) A0.67) n.a. n.a.Fuels 0.296 0.80 1.02 (0.39) (0.07) n.a. 0,19Primary interm. 0.017 1.70 1.10 (0.40) (0.37) 1.40 a/ n.s.Manuf. goods 0.098 1.15 0.38 (1.04) (0.34) 0.20' 0.16-Capital gouds 0.236 1.63 1.26 (1.04) (1.05) 1.35 n.a.O/Consumer goods 0.176 0.58 (0.22) (2.731 (0.301 0.85 n.s.Other items (a) 0.118 0.78 0.55 (1.60) (0.35) 1.27- n.a.
Unweighted average 1.11 0.69 (1.20) (0.413 n.a. n.a.
Weighted average 0.96 0.69 (1.14) (0.40) n.a. n.a.
Aggregate Imports (GNFS) 0.78 0.55 (1.60) (0.35) 1.27' n a.
Sources: Based on Tables 1 and 2.
(a) Assumed to have the same elasticity as aggregate Imports (GNFS).
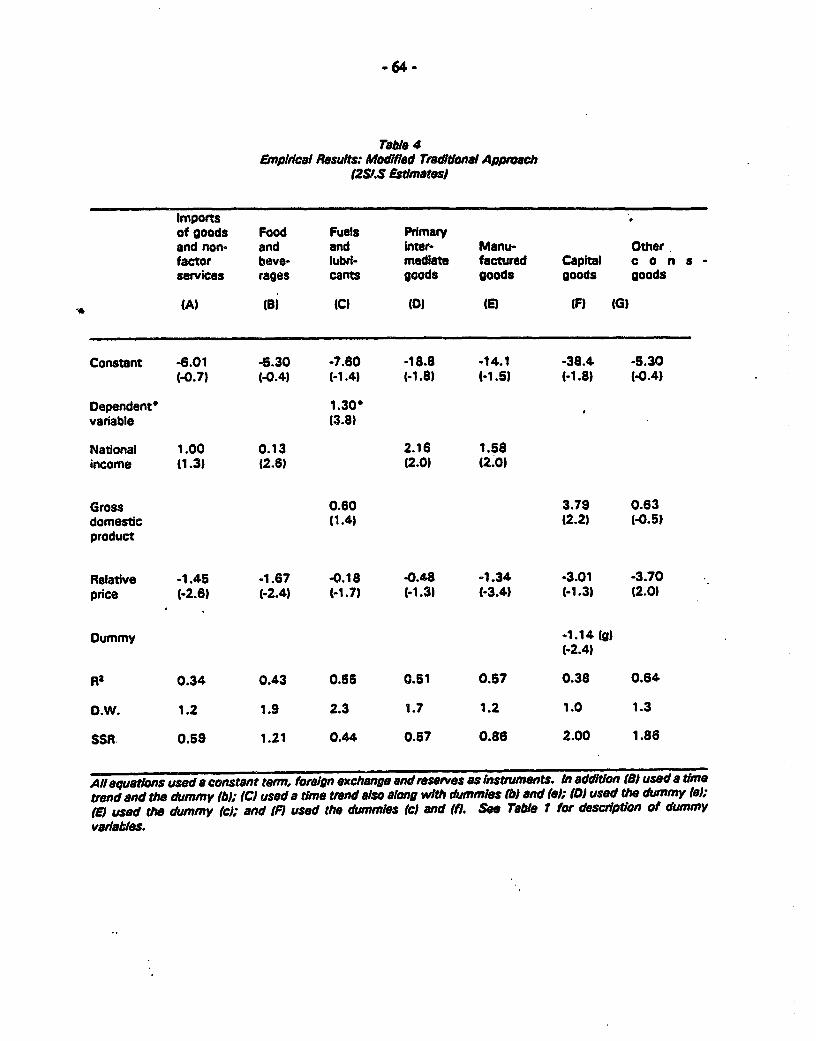
-64 -
Table 4Empidcal Results: Modifled Traditional Approach
(2SLS Estimates)
Importsof goods Food Fuels Primaryand non- and and Inter- Manu- Otherfactor beve- lubri- mediate factured Capkal c a n s -
services rages cants goods goods goods goods
(A) (B) (C) (0) (E) (F) IG)
Constant -6.01 -5.30 -7.60 -18.8 -14.1 -38.4 -5.30(-0.7) (-0.4) (-1.4) (-1.8) (-1.5) (-1.8) (-0.4)
Dependent' 1.300variable (3.8)
National 1.00 0.13 2.16 1.58income (1.3) (2.8) (2.0) (2.0)
Gross 0.60 3.79 0.63domestic (1.4) (2.2) (-0.5)product
Relative -1.45 -1.67 .0.18 -0.48 -1.34 -3.01 -3.70price (-2.6) (-2.4) (-1.7) (-1.3) (-3.4) (-1.3) (2.0)
Dummy -1.14 (a)(-2.4)
R2 0.34 0.43 0.55 0.51 0.57 0.38 0.64
D.W. 1.2 1.9 2.3 1.7 1.2 1.0 1.3
SSR. 0.59 1.21 0.44 0.57 0.86 2.00 1.86
Au equations used a constant term, foreign exchange and reseres as lnstnUments. In addition (81 used a tfmetrend and the dummy (bh; (Ci used a time trend also along with dummIes 0b) and (el; (DI used the dummy tei;(EJ used the dummy fci; and Inf used the dummies (cJ and Ifl. See Table I for descriptfon of dummyvaritiAes.
-65 -
In keeping with the fact that import controls in Kenya dudng 196849 focused more on incomevariables - particularly foreign exchange - than on prices, the income elasdicity of demand estimatedIs found in this paper to rse markedly with liberalization while price responsiveness appears to faimarginally.
Secdon IVUnfinished Buslness
17. Capital goods prices and income elasticides in all Tables are very large, possiblyreflecting the bulky nature of several items in this category. At a lar stge it would be useful todisaggregate this category of goods and to separate government imporm from private imports.
18. Foreign exchange receipts, including export eanings, are assumed to be exogenous inthis paper. This is not likely to be the case in practice, because exports volume may be determinedin part by the availability of imported inputs. In tur, the capacity to import may be affected byexport earnings. The precise linkages between dtese variables could be the subject of futre research.
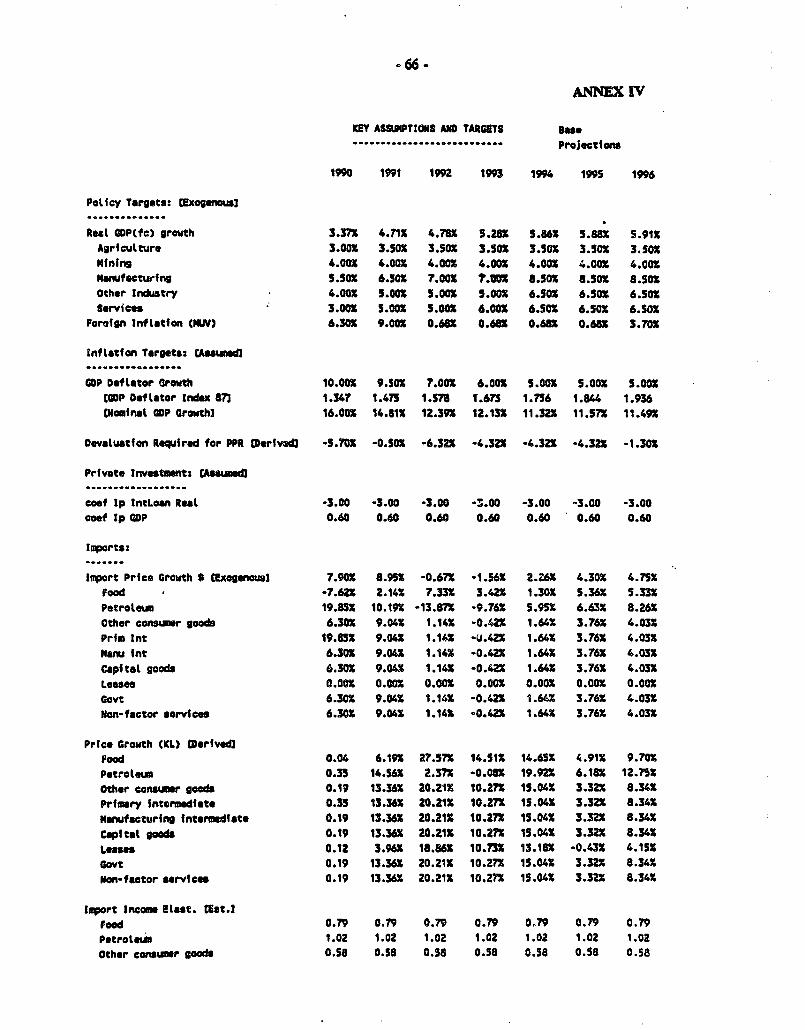
-66-o
ANNEX IV
KEY ASSUIPTtONS AND TARGETS Base-- --- -----.--- Projections
1990 1991 1992 1993 1994 199S 1996
Poticy Targets: Cixogenous).............. ..............
Retl COPCfc) growth 3.372 4.71n 4.7EX 5.28 5.862 5.88X 5.91XAgriculturo 3.00X 3.50x 3.50 3.50X 3.50X 3.502 3.50XMining 4.002 4.00 4.002 4.00 4.002 4.00 4.002nutfactur1ng 5.502 6.502 7.00X T.UW 8.502 8.502 8.50s
Other Industry 4.002 5.002 5.00X 5.002 6.50X 6.502 6.502Services 3.002 5.002 5.002 6.002 6.50 6.502 6.SOX
Forefgn tnft ttan CNN) 6.302 9.002 0.682 0.68x 0.682 0.682 3.702
tnflatf0n Targets: (sasmed].................
MDP DatLator arowth 10.00# 9.502 7.00T 6.00x 5.002 5.00 5.002[COP Deflator Index 87n 1.347 1.47! 1.57T T.673 1.756 1.844 1.936(Nanfnat CDP Growth] 16.002 14.812 12.392 12.132 11.32X 11.572 11.492
Devaluation Reqwired for PPR WerIvd) -5.70X -0.502 -6.32 -4.32X .4.32 -4.322 -1.302
Private Investment: CAassumd3. .................
coof tp IntLoan Rest -3.00 -3.00 -3.00 -3.00 -3.00 -3.00 -3.00coof Ip ODP 0.60 0.60 0.60 0.60 0.60 0.60 0.60
mnports:
Inport Price Growth S Mxogenoual 7.902 8.95X -0.67X -1.562 2.262 4.302 4.75XFood -7.62X 2.14S 7.332 3.422 1.30X 5.36X 5.332Petroteun 19.85X 10.192 -13.87X -. 76X 5.95X 6.63X 8.26XOther consar goods 6.302 9.04X 1.142 -0.42X 1.64X 3.76X 4.03XPrim Int 19.85X 9.04X 1.14% -U.422 1.64X 3.76X 4.03XMenu fnt 6.302 9.04X 1.14X -0.42Z 1.64" 3.76X 4.032Capital goods 6.302 9.042 1.14t -0.422 1.642 3.76X 4.032Lease$ 0.002 0.00 0.002 0.002 0.002 0.00 0.002Govt 6.302 9.042 1.142 -0.422 1.6"% 3.762 4.03XHon-factor services 6.302 9.04S 1.14X -0.42X 1.642 3.762 4.03X
Prico Growth (KL) (Derived)Food 0.04 6.192 27.572 14.51X 14.652 4.91X 9.702Petrotels 0.35 14.562 2.372 -0.082 19.922 6.182 12.732Other cosumr goods 0.19 13.362 20.212 10.272 15.042 3.32X 8.342Primary fntermediate 0.35 13.36X 20.21X 10.272 15.042 3.32Z 8.342Maufaecturfng intermediate 0.19 13.362 20.212 10.27X 15.042 3.32X 8.34XCapitat goods 0.19 13.362 20.212 10.272 15.042 3.32X 8.34XLoases 0.12 3.962 18.86 10.732 13.18X -0.432 4.152Govt 0.19 13.362 20.212 10.27X 15.042 3.32X 8.342Non-factor services 0.19 13.36X 20.212 10.27X 15.04X 3.322 8.342
laport Income Olset. LEst.]Food 0.79 0.79 0.79 0.79 0.79 0.79 0.79Petroteua 1.02 1.02 1.02 1.02 1.02 1.02 1.02
Other consumr goods 0.58 0.58 0.58 0.58 0.58 0.58 0.58
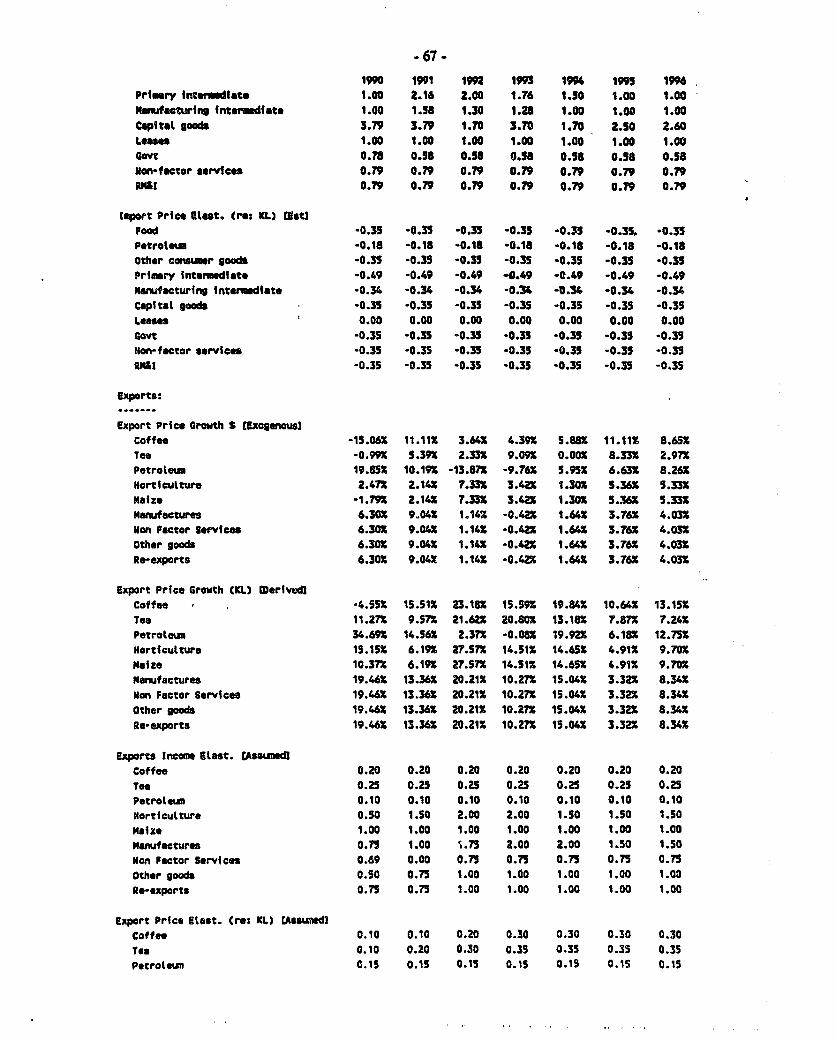
-67 -
1990 1991 1992 1993 1994 1995 1996Prisry Intof1ate, 1.00 2.16 2.00 1.76 1.50 1.00 1.00Naufafhcturing intermediate 1.00 1.58 1.30 1.28 1.00 1.00 1.00Capitat goods 3.79 3.79 1.70 3.70 1.70 2.50 2.60Leases 1.00 1.00 1.00 1.00 1.00 1.00 1.00Govt 0.78 0.58 0.58 0m8 0.58 0.58 0.58Non-factor services 0.79 0.79 0.79 0.79 0.79 0.79 0.79RM&I 0.79 0.79 0.79 0.79 0.79 0.79 0.79
l[port Price Elest. (re: XL) CistlFood -0.35 -0.35 -0.35 -0.35 40.33 -0.35. -0.35Petroteqm -0.18 -0.18 -0.18 *0.18 -0.18 -0.18 -0.18other consu r goods -0.35 *0.35 0.35 -0.35 -0.35 -0.35 0.35Primary Intermedlato -0.49 -0.49 -0.49 -0.49 -0.49 -0.49 -0.49Manufacturing Interwmdiate -0.34 -0.34 -0.34 -0.31 -0.34 -0.34 -0.34Capital goods -0.35 -0.35 -0.35 -0.35 -0.35 -0.35 .0.35Leasm 0.00 0.00 0.00 0.00 0.00 0.00 0.00Govt -0.35 -0.35 -0.35 -0.35 -0.35 -0.35 -0.35Non-factor * rvices -0.35 -0.35 -0.35 -0.35 -0.35 -0.35 -0.35RUI -0.35 -0.35 -0.35 -0.35 -0.35 -0.35 -0.35
Exports:
Export Price Growth S CExmgenous]Coffee -15.06X 11.11 3.64X 4.391 5.881 11.111 8.65XTea -0.99 5.391 2.33X 9.091 0.00 8.331 2.971PetroteL. 19.85 10.19S -13.871 -9.76t 5.95X 6.631 8.261Horticulture 2.471 2.14S 7.331 3.421 1.301 5.362 5.331Maize -1.791 2.14S 7.33X 3.421 1.30X 5.36X 5.331Manufactures 6.301 9.041 1.14X -0.42X 1.64X 3.761 4.031Mon Factor Services 6.301 9.04S 1.141 -0.42X 1.64X 3.76X 4.031other goods 6.302 9.04X 1.14X -0.421 1.64X 3.76X 4.031Re-exports 6.301 9.04X 1.14X -0.421 1.64X 3.761 4.03X
Export Price Growth CXL) D erivedlCoffee -4.SSX 15.511 23.181 15.591 19.841 10.641 13.151Tea 11.27X 9.571 21.62X 20.801 13.181 7.871 7.24XPetroteun 34.691 14.561 2.371 -0.08o 19.92X 6.181 12.751Horticutture 15.151 6.191 2V.571 14.511 14.65 4.91t 9.701Maize 10.371 6.19X 27.571 14.51X 14.651 4.911 9.701Manufactures 19.46X 13.36X 20.21X 10.27X 15.041 3.321 8.341Nan Factor Services 19.463 13.363 20.21X 10.27X 15.041 3.321 8.341Other goods 19.46X 13.361 20.211 10.27X 15.041 3.321 8.34XRe-exports 19.46X 13.361 20.21X 10.27X 15.041 3.321 8.34%
Exports Income Elsst. (Assuned)Coffee 0.20 0.20 0.20 0.20 0.20 0.20 0.20Tea 0.25 0.25 0.25 0.25 0.25 0.25 0.25Petroleu 0.10 0.10 0.10 0.10 0.10 0.10 0.10Horticulture 0.50 1.S0 2.00 2.00 1.50 1.50 1.50maize 1.00 1.00 1.00 1.00 1.00 1.00 1.00Manufactures 0.75 1.00 1.75 2.00 2.00 1.50 1.50Non Factor Services 0.69 0.00 0.75 0.75 0.75 0.75 0.75Other good 0.50 0.75 1.00 1.00 1.00 1.00 1.00Re-exports 0.75 0.75 1.00 1.00 1.00 1.00 1.00
Export Price Etect. (rot KL) UAssumedlCoffee 0.10 0.10 0.20 0.30 0.30 0.30 0.30Tea 0.10 0.20 0.30 0.35 0.35 0.3S 0.35Petrole 0.15 0.S 0.15 0.1S 0.19 0.1S 0.15

-68 -
1990 199 12 1994 1993 1996Horticulture 0.30 0.30 0.30 0.30 0.30 0.30 0.30Maize 0.20 0.20 0.50 0.50 0.50 0.50 0.50Mnufactures 0.43 0.45 0.66 0.80 1.00 1.00 1.00Non Factor Serv1ces 0.20 0.30 0.30 0.30 0.30 0.30 0.30
Other goods 0.50 0.50 0.60 0.70 1.00 1.00 1.00
Re-experts 0.30 1.00 1.00 1.00 1.00 1.00 1.00
Fiscal Accoumts CF)
Wages:nominal growth CFY) UAS4.sed 0.00 35.001 20.001 5.00X 5.00 10.001 27z.00o
Oemand for Finfncial Assets Cst.]
Elest. curr/inflation -0.004 -0.004 -0.004 -0.004 -0.004 -0.004 -0.004
Elaet. curr/reel Interest -0.010 -0.010 0.010 -0.010 -0.010 -0.010 -0.010
Elest. curr/real GOP 0.910 0.910 0.910 0.910 0.910 0.910 0.910
Elest. qtasl-gfinftttion o0o0Q -0.010 -0.010 -0.010 -0.010 -0.010 0.010
Elost. quasi-oJreat lnterest 0.280 0.260 0.260 0.280 0.280 0.280 0.280
Elest. quasf-r/resL GOP 0.970 0.970 0.97M 0.970 0.970 0.970 0. 970
Elest. d-d.p/Inflation -0.610 -0.610 -0.610 -0.610 -0.610 -0.610 -0.610
Elast. d-dep/reei fnterest 0.790 0.790 0.790 0.790 0.790 0.79 0.790
Elast. d-dep/reel GOP 1.500 1.500 1.500 1.500 1.500 1.500 1.500
other WGP Assumptions:
Target UFA accum. (USS) (IMF Prog.] 50.0 -276.6 -40.0 -92.9 -60.0 -60.0 -60.0
Ronetary Accounts:... . . . ......
-HARAMBSE"/Ml RATIO O.OO 0.00 0.00 0.001 0.00 0.00 0.00X
Nominal Interest Rates: CExogenats]......................
(Pubifc to Foreign in USS. 9.401 8.101 8.10X 8.101 6.601 6.60X 6.601
EST Public to Foreign In USS1 9.401 8.10X 8.10X 8.10X 6.601 6.601 6.601
EPrivato to Foreign in US$] 9.401 8.10X 8.10X 8.101 6.60X 6.601 6.601
(ST Priv. to ForeIgn fn USS] 9.401 8.101 8.10X 8.101 6.602 6.601 6.601
(Reserves] 9.401 8.10X 8.101 8.101 6.60X 6.601 6.601
fibor 9.401 8.10X 6.101 8.101 6.601 6.601 6.601
Domestic Interest Rates EEndogerionu.............. ...............
Real Interest Rate 4.24X 4.79M 4.521 4.32 4.19X 4.191 4.191
Nominal IntereSt Rate 14.661 14.75X l1.841 10.58X 9.401 9.40X 9.401
Loan Rate 21.621 21.721 18.481 17.081 15.771 15.77X 15.771
Real Loan Rate 10.57X 11.161 10.73X 10.45X 10.26X 10.261 10.26X
Exchange Ratc! ClndMogouas..... .........
Real Oevalustion -1.851 -3.331 -9.371 -2.76X -a.281 1.10 -3.75X
Nominal Exchange Rate CPounds/USt) 1.156 1.202 1.428 1.581 1.790 1.782 1.856
(Nonainl Ineix (198100)1 129.6 134.8 160.2 177.4 200.8 1W.9 208.2
tReal Index (1987100)3 94.0 90.9 82.4 80.1 72.7 73.5 70.7
DevaluatfOn (IMF Methodology) 11.021 3.611 15.87X 9.69X 11.651 -0.43X 3.981

II w$
SW3
. ~ ~~~ e
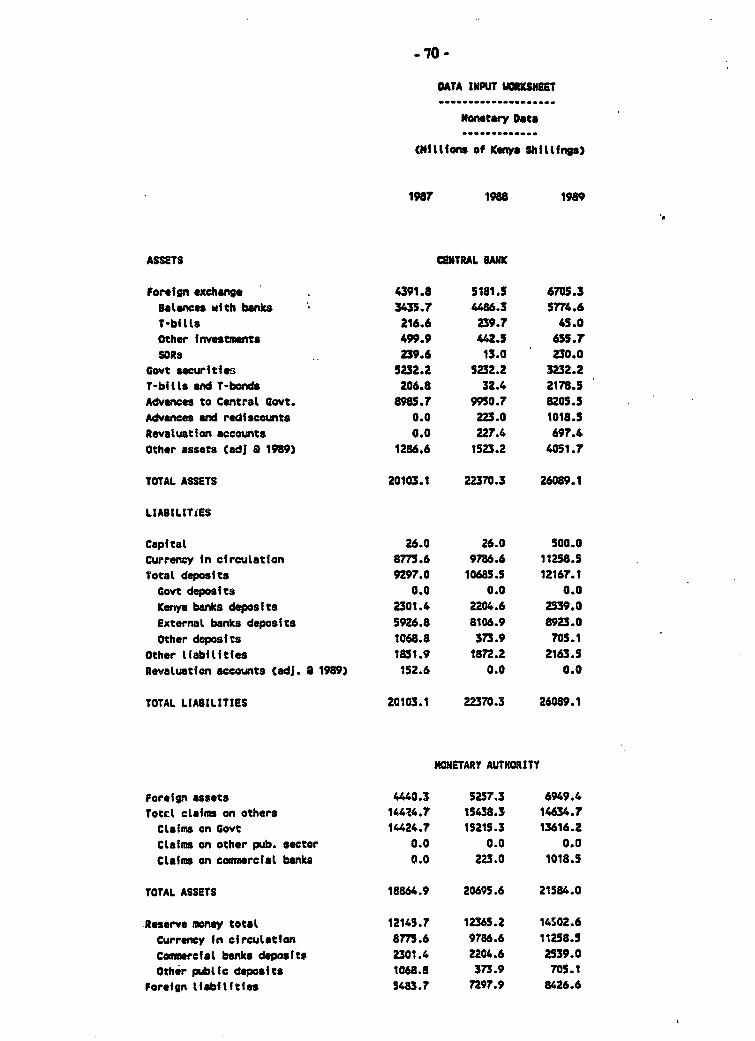
-70-
DATA INPUT U0SHEET."...................
Monstery Data
.............
(Mittfons of Kenya Shilfings)
1987 198 1989
ASSETS CENTRAL SANK
Foreign exchange 4391.8 5181.5 6705.3Batnces with bans 3435.r 4486.3 5774.6T-bills 216.6 239.7 45.0Other Investments 499.9 442.5 655.7SORS 239.6 13.0 230.0
Govt securities 5232.2 5232.2 3232.2T-bills nd T-bonds 206.8 32.4 2178.5Advances to Central Govt. 98.r 9O.7 820S.5Advances and rediscounts 0.0 223.0 1018.5Revaluation accounts 0.0 227.4 697.4Other assets Cad] a 1989) 1286.6 1523.2 4051.7
TOTAL ASSETS 20103.1 22370.3 26089.1
LIA81LITIES
Capital 26.0 26.0 500.0currency In circulation 8775.6 9786.6 11258.5Total deposits 9297.0 10685.5 12167.1Govt deposits 0.0 0.0 0.0
Kenya banks deposits 2301.4 2204.6 2539.0External banks deposits 5926.8 8106.9 8923.0Other deposits 1068.8 373.9 705.1
Other liabilities 1851.9 1872.2 2163.5Revaluation accounts CadJ. a 1989) 152.6 0.0 0.0
TOTAL LtABILITIES 20103.1 22370.3 26089.1
MONETARY AUTHORITY
Foreign assets 4440.3 5257.3 6949.4Totcl claims on others 14U4.7 15438.3 14634.7
Claims on Govt 14424.7 15215.3 13616.2Claims on other pub. sector 0.0 0.0 0.0
Claims on commerciat banks 0.0 223.0 1018.5
TOTAL ASSETS 18864.9 20695.6 21584.0
.Reserve money total 12145.7 12365.2 14502.6Currency fn circulation 8773.6 9786.6 11258.5Commerciel banks deposlit 2301.4 2204.6 2539.0Other pubifc deposits 1068.8 373.9 705.1
Foreign liabiltiles 5483.7 n97.9 8426.6
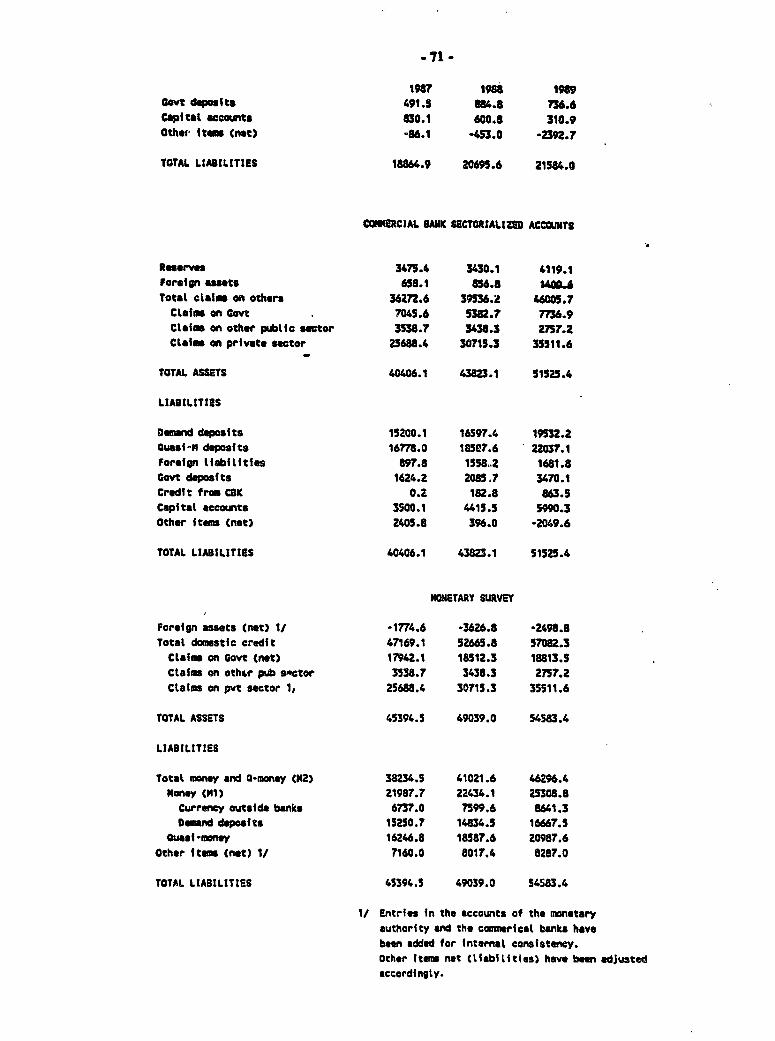
198 1988 1"99aot deposits 491.5 884.8 736.6Capital accounts 830.1 600.8 310.9Othei ites (not) -86.1 -453.0 -2392.7
TOTAL LIABILITIES 18864.9 20695.6 21584.0
COUERCIAL BANK SICTORIALIZD ACC011TS
Reserves 3475.4 3430.1 4119.1Foreign assts 658.1 656.8 Total claim on others 362n.6 39536.2 46005.7CLams on Govt 7045.6 S382.7 7736.9ClSaiw on other pubtSc sctor 3538.7 3438.3 2757.2Claim on private sector 25688.4 30715.3 35511.6
TOTAL ASSETS 40406.1 4382.1 51525.4
LIAILITTtES
Deand deposits 15200.1 16597.4 19532.2Quasi-1 deposits 16778.0 185C7.6 22037.1Forefgn liabilities 897.8 1558.2 1681.8Govt deposits 1624.2 20857 3470.1Credit from CBSK 0. 182.8 863.5Capital accouts 3500.1 4415.5 5990.3Other ftems (net) 2405.8 396.0 -2049.6
TOTAL LIABILITIES 40406.1 43823.1 51525.4
MONETARY SURVEY
Foreign assets (net) 1/ -1774.6 -3626.8 -2498.8Total domestic credit 47169.1 52665.8 57082.3
Claim on Govt (net) 17942.1 18512.3 18813.5Claims on othor pub sactor 3538.7 3438.3 2757.2Claims on pvt sector 1, 25688.4 30715.3 35511.6
TOTAL ASSETS 45394.5 49039.0 54383.4
LIABILITIES
Total mow and y O-y CM2) 38234.5 41021.6 46296.4money ("I) 21987.7 22434.1 25308.8
Currency outside banks 6737.0 ?599.6 8641.3DOmnd deposits 15250.7 14834.5 16667.5
Quasi-momny 16246.8 18387.6 20987.6Other Its (net) 1/ 7160.0 8017.4 8287.0
TOTAL LIABILITIES 45394.5 49039.0 54583.4
1/ Entries in the ccoumts of the monetaryauthority ond the commericat banks havebeen added for Internal consistency.other Item net Ctlabilities) have ben adjustedaccordingly.

-72 -
1987 19a8 1969
Source: Central a*k, @uwtertyEconaolc R*view
.,~~~~~~~~~~
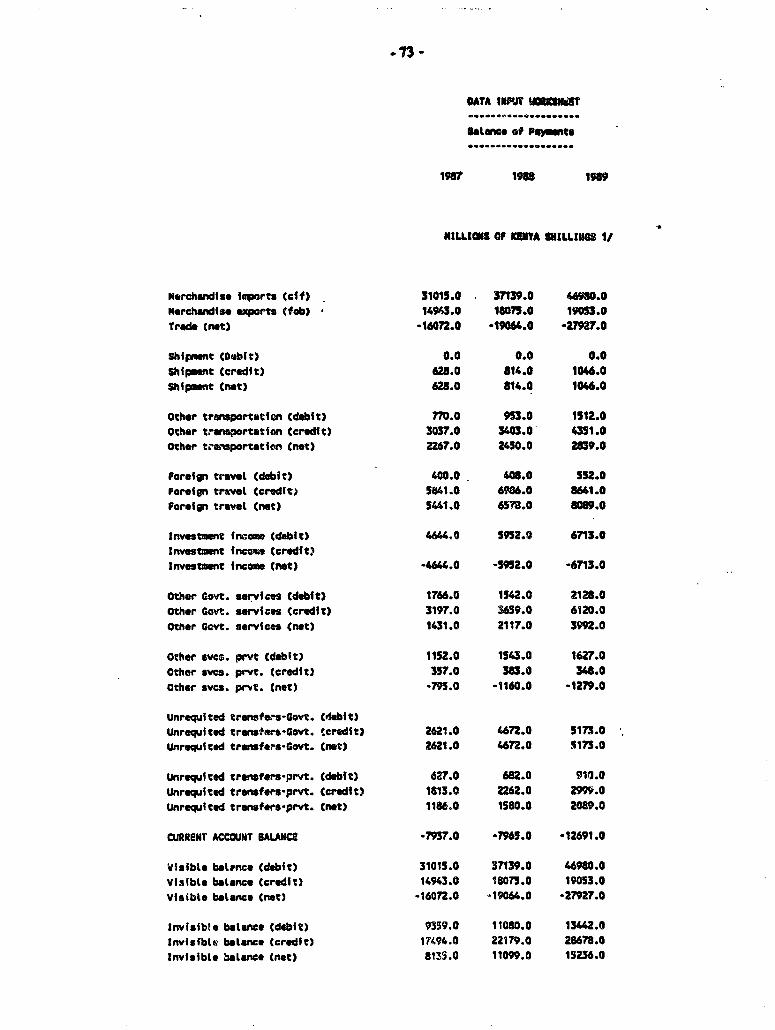
-73-
DATA IWNT UIUNkET
$&Lawe of Payumts
1987 198 198
NILLKUS OF KENYA SHILLIUGS 1/
Perchandise imports cift) 31015.0 37139.0 46960.0erchandse exports (fob) 149*3.0 18075.0 19053.0
Trud (net) -16072.0 -19064.0 -27927.0
Shipment (Debit) 0.0 0.0 0.0Shipment (credft) 628.0 814.0 1046.0Shipment (net) 628.0 814.0 1046.0
Other transportatifn (debit) 770.0 953.0 1512.0Other transportation (credit) 3037.0 3403.0 4351.0Other transportaticn (not) 2267.0 2450.0 2E39.0
Foreign travet (debit) 400.0 408.0 552.0Foreign travel (credit) 5861.0 6986.0 8641.0Foreign travl (net) 5441.0 6578.0 8089.0
Investment fnca.. (debit) 4644.0 5952.0 6713.0Investment incas (credit)Investment income (net) -4644.0 -5952.0 -6713.0
Other Govt. servics (debit) 1766.0 1542.0 2128.0Other Govt. services (credit) 3197.0 3639.0 6120.0Other Govt. services (net) 1431.0 2117.0 3M2.0
Other sves. prvt (debit) 1152.0 1543.0 16Z7.0Other sves. prvt. (credit) 357.0 383.0 348.0Other avcs. prvt. (net) 795.0 -1160.0 -1279.0
Unrequited transfers-Govt. (debit)Unrequited transtars-Govt. (credit) 2621.0 4672.0 5173.0Unrequited transfers-Govt. (net) 2621.0 4672.0 5173.0
Unrequited trwnsfers-prvt. (debit) 627.0 682.0 910.0Unrequited transfers-prvt. (credit) 1813.0 2262.0 299. 0Unrequited transfers-prvt. (net) 1186.0 1S80.0 2089.0
CURRENT ACCOUNT BAULNCE -7937.0 -75.0 -12691.0
Visible baltnce Cdebit) 31015.0 37139.0 46980.0Visibte balance (credit) 14943.0 18071.0 19053.0Vlsibte balance (net) -160n.0 -19064.0 -27927.0
Irvisible balance (debit) 9359.0 1080.00 13442.0Invisfble balance (credit) 17L94.0 22179.0 28678.0Invisible batanco Cnet) 8W3M.0 11099.0 13236.0
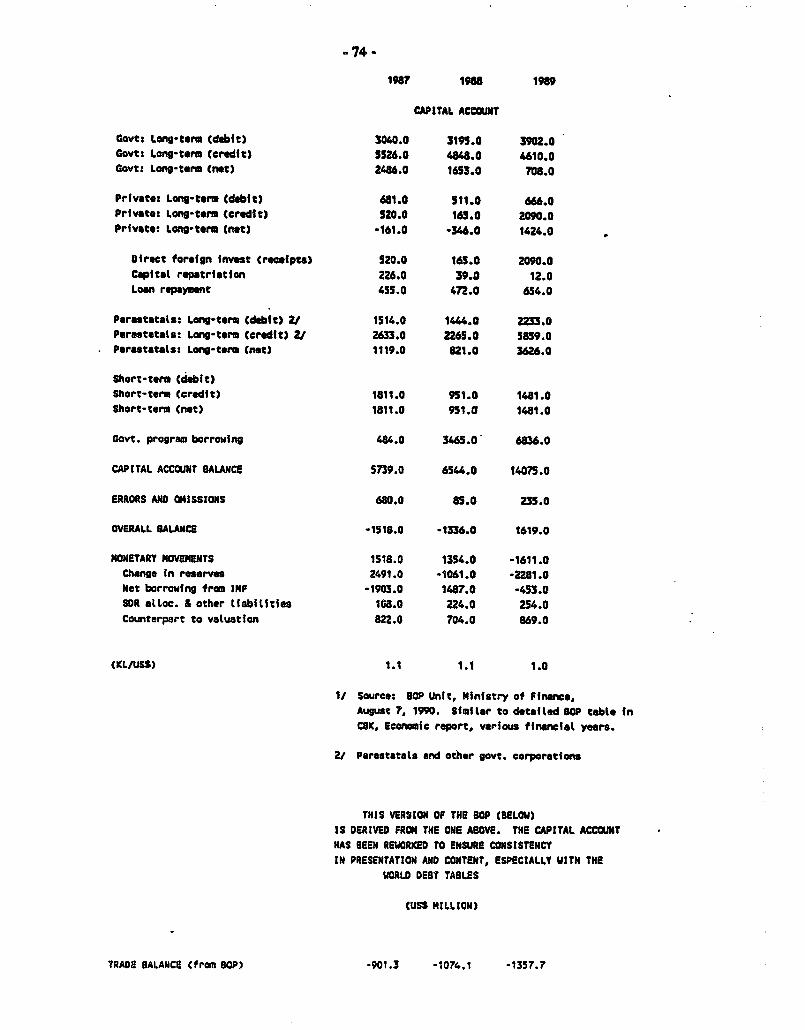
-74-
1987 1988 1989
CAPITAL ACCOUNT
Govts Log-term (debit) 3040.0 3195.0 3902.0Govt: Long-term (credit) 5526.0 4848.0 U610.0Got: Long-torm (net) 2486.0 1653.0 708.0
Private: Long-term (debit) 681.0 511.0 666.0Private: Long-term (credit) 520.0 163.0 2090.0Prfvate: Long-term Cnet) -161.0 -346.0 1424.0
Direct foreign invest Crecaipts) 520.0 163.0 2090.0Capital repatriatfon 226.0 39.0 12.0Loan repaymnnt 455.0 472.0 654.0
Parastatals: Long-term (debit) 2/ 1514.0 1444.0 2233.0Perastetals: Long-term (credit) 2/ 2633.0 2265.0 5859.0Parastattls: Long-term (net) 1119.0 821.0 3626.0
short-term cdbbit)
Short-term (credft) 1811.0 951.0 1481.0Short-term (net) 1811.0 MC1.C 1481.0
Govt. program borrowing 484.0 3465.0 6836.0
CAPITAL ACCOUNT BALANCE 5739.0 6564.0 14075.0
ERRORS AND OMISSIONS 680.0 85.0 235.0
OVERALL BALANCE -1518.0 -1336.0 1619.0
MONETARY MOVEMENTS 1518.0 1354.0 -1611.0Change in reserves 2491.0 -1061.0 -2281.0Not borrowing from IMF -1903.0 1487.0 -453.0SDR alloc. & other liabilities 108.0 224.0 254.0Counterpart to vaLuatfon 822.0 704.0 869.0
(KL/USS) 1.1 1.1 1.0
1/ Source: SOP Unit, Ministry of Finance,
Augswt 7. 190. Similar to detafled SOP table InCBK. Ecorwmic report, various finncial years.
2/ Parestatats and othor govt. corporations
THIS VERSION OF THE BOP (BELOW)
IS DERIVED FROM THE ONE AEOVE. THE CAPITAL ACCOUNTHAS BEEN Rh0RIKED TO ENSURE CONSISTENCYIN PRESENTATION ANO CONTENT, ESPECtALLY WITH THE
WORLD DEBT TABLES
CUSS MILLION)
TRADO BALANCE (from BOP) -901.3 -1074.1 -1357.7
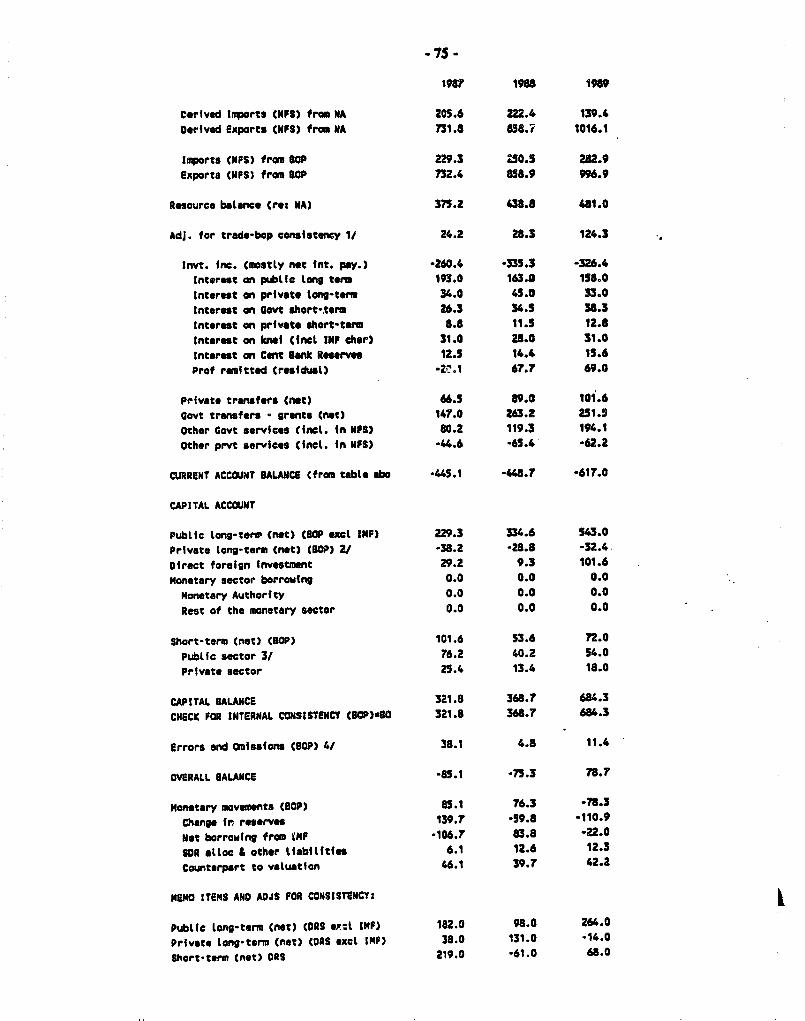
-75 -
196 1988 198
Derived Iports CNFS) from NA 205.6 222.4 139.4
Derived Exports CNFS) from NA 731.6 658.? 1016.1
Imports (NFS) from BOP 229.3 S0.5 282.9
Exports (NFS) from SOP 732.4 858.9 996.9
Resource balance Cre: NA) 375.2 438.8 481.0
AdJ. for trade-bop consistency I/ 24.2 28.3 124.3
Invt. fnc. (mostly net fnt. pay.) -260.4 -335.3 -326.4
Interest on public lons term 193.0 163.0 158.0
Interest on private long-term 34.0 45.0 33.0Interest on Govt short-term 26.3 34.5 38.3
Interest an private short-term 8.8 11.5 12.8
Interest on kneI (Insl INF ehar) 31.0 28.0 31.0
Interest on Cent Bank Reserves 12.5 14.4 1t.6
Prof remItted (resfdual20) r67.7 69.0
Private transfers (net) 66.5 69.0 10i.6
Govt transfers - grants (net) 147.0 263.2 251.5
Other Govt servfces (inct. In NFS) 80.2 119.3 194.1
other prvt services (Int. In NfS) -44.6 -65.4 -62.2
cURRENT ACCOUNT BALANCE (from table *bo 445.t -448.? *617.0
CAPITAL ACCOUNT
Public long-terv (net) (SOP excl IMP) 229.3 334.6 543.0
Private Iongterm (net) (BOP) 2/ -38.2 -28.8 -32.4.
Direct foreign Investment 29.2 9.3 101.6
Monetary sector borrowing 0.0 0.0 0.0
Monetary AuthorIty 0.0 0.0 0.0
Rest of the monetary sector 0.0 0.0 0.0
Short-term (net) (COP) 101.6 53.6 72.0
PublIe sector 3/ 76.2 40.2 54.0
Private sector 25.4 13.4 18.0
CAPITAL BALANCE 321.8 368.7 684.3
CHECK FOR INTERNAL CONSISTENCY (BQP)80 321.8 368.7 684.3
Errors and 0uissions (SOP) 4/ 38.1 4.8 11.4
OVERALL BALANCE -85.1 -75.3 78.7
monetery movements (OOP) 85.1 76.3 -78.3
Change Ir reserves 139.7 -59.8 -110.9
Not borrowing from IMF .106.7 83.8 -22.0
sDR ol,oc & other liabilitIes 6.1 12.6 12.3
Courterpart to valuation 46.1 39.7 42.2
MEMO ITEMS AND ADJS FOR CONSISTENCY:
Pubtlic long-term (net) (ORS ex:l IMF) 182.0 98.0 264.0
Private long-term (net) (ORS excl IMF) 38.0 131.0 -14.0
Short-term (net) ORS 219.0 *61.0 68.0

-76-
Ad). to Uacapital Ct(u) 26.9 -76.8 -260.7AdJ. to UP capital (short) 117.4 -114.6 -4.0
Totat adj. to sPco pital re: ON8 5/ 146.3 -191.4 -M4.r
Zntest psynts (OD$) m.0 26.0 273.0
If Is etrsted from the resourco balance In he Doerfved UP9 Tab*2/ Ixeludes diret foreign fnvestmet3/ Assued to be 7X percent of the totat shwt-tem4/ 19T error and owl"fum h. bee adJusted for consistencS/ Total discrepany betwnen tapitt tnflos
re: thie SP and capitat inflow re: DOSCaim. sian indicates that shortfatll Itn O dota vsgP data)
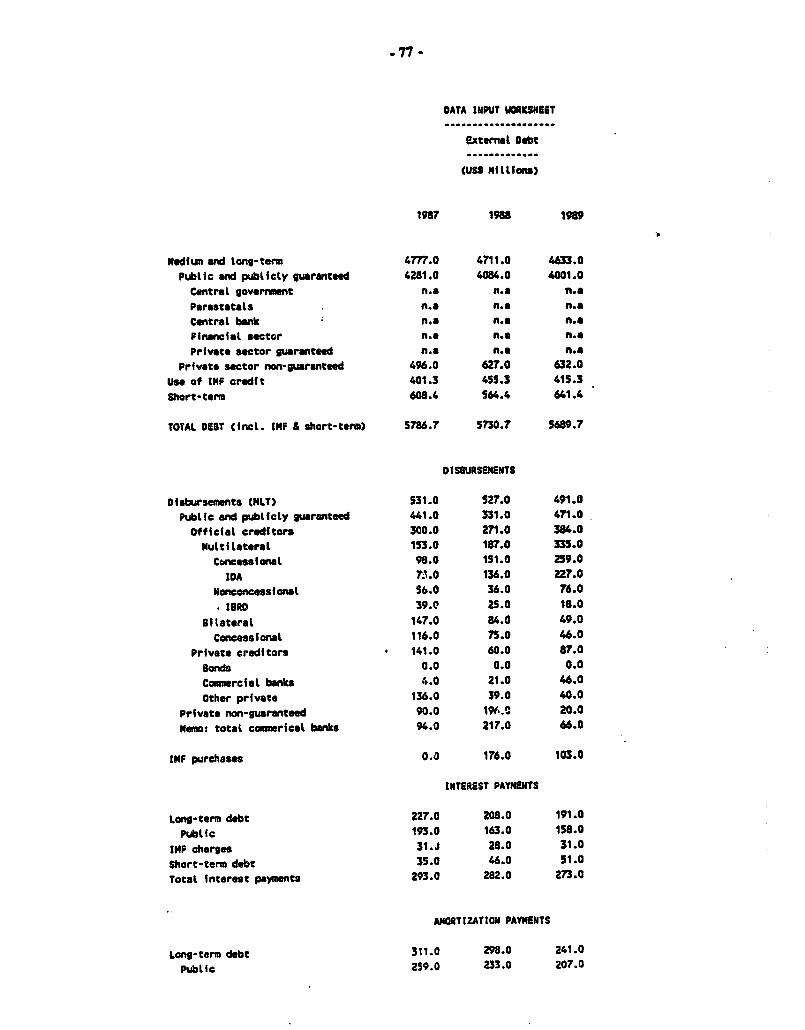
-77 -
DATA INPUT WARKSHEIT................................ _
external Debt..... ....... 0
(USS Millions)
1987 1988 1989
Medfun and long-term 4777.0 4711.0 4633.0
Public and publicly guranted 4281.0 4084.0 4001.0
Central goverrssnt n.a n.a fi.n
Parastatals n.e n.a n.4
Central bank nMa n.a n.e
Financiel sector n.s n.s n.a
Private sector guaranteed n.e n.a n.a
Private sector non-guaranteed 496.0 627.0 632.0
Use of IMF credift 401.3 455.3 415.3
Short-term 608.4 564.4 641.4
TOTAL OEBT Cincl. ItF & short-term) 5786.7 5730.7 5689.7
DISUURS!MENTS
Disbursements CMLT) 531.0 527.0 491.0
Publfc and publicty guranteed 441.0 331.0 471.0
official credftors 300.0 271.0 384.0
Multilateral 153.0 187.0 335.0
Concessionat 98.0 151.0 259.0
IDA 7;i.0 136.0 227.0Nonconcessiona 56.0 36.0 76.0
18RD 39.0 25.0 18.0
8ilateral 147.0 84.0 49.0
Coneessional 116.0 75.0 46.0
Private creditors 141.0 60.0 87.0
Bonds 0.0 0.0 0.0
Commercial banks 4.0 21.0 4.O
Other private 136.0 39.0 40.0
Private non-guaranteed 90.0 190..0 20.0
emo: total coamerical banks 94.0 217.0 66.0
IMF purchases 0. 176.0 103.0
INTEREST PAYNTS
Lang-term debt 227.0 208.0 191.0
Public 193.0 163.0 158.0
IHP charges 31.J 28.0 31.0
Short-tern debt 35.0 46.0 51.0
Total Interest payments 293.0 282.0 273.0
ANORTIZATION PAYMENTS
Lon-term debt 311.0 298.0 241.0
PublIc 259.0 233.0 207.0

-78 -
198? 1986 1989IMF repurcehaes 122.0 101.0 132.0Total aortizattan (exol. /t) 433.0 399.0 373.0
Net short-term flows 219.0 -61.0 6B.0
NM ITEM CZ)
taplfcit t-rate on L-term debt 4.8 4.4 4.1IlptIcIt I-rate on 8-term debt 5.8 8.2 8.0lopicit I-rate on IMF credit 7.? 6.1 7.5Ispticft avrege I-rate 5.1 4.9 4.8
Domestic lown Interest rate 0.2 0.2 0.2Dometic deposit Intorest rate 0.1 0.2 0.2
1/ Data source fs Swasry Debt Data table from ODS,cfrculated with _ COctaobr 10, 1990) from LAS, IECOR, CECOR *ndFRSDR, for cLatrance by CODs.
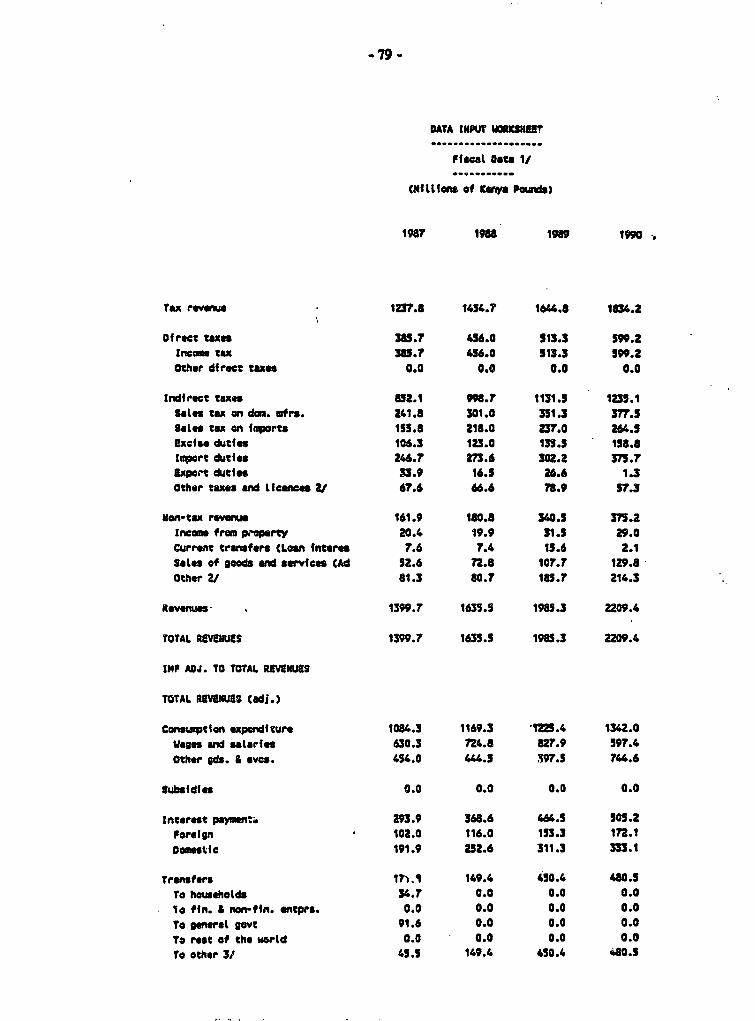
.79 -
DATA INt W1111....................
Pftcat Oats 1/..................... _
(NfNtis of Kenya Pourds)
1987 196 198 199J
Tax revenue 1237.8 1454.7 1644.8 1834.2
Direct taxe 365.7 46.0 513.3 599.2Incoe tax 365.7 456.0 513.3 599.2other direct taxes 0.0 0.0 0.0 0.0
Indirect taxes 52.1 99.7 1131.5 1235.1Sles tax an dam. mfrs. 241.8 301.0 331.3 377.5aLes tax on Iports 155.8 218.0 z3r.0 264.5
Excise dutfes 106.3 123.0 133.5 158.1Iaport dities 246.7 m.6 302.2 375.75xport dutes 33.9 16.5 26.6 1.3other taxes and LIcowas 21 67.6 66.6 73.9 57.3
mon-tax revwnu 161.9 180.8 340.5 373.2Income from property 20.4 19.9 31.5 29.0Current trarsfers (Loan fntere 7.6 7.4 15.6 2.1Sales of soods sad services CAd 52.6 72.8 107.7 129.8Other 2/ 81.3 60.7 185.7 214.3
Reves . 1399.7 163S.5 1985.3 2209.4
TOTAL REVEWES 1399.7 1635.5 1985.3 2Z09.4
I1PF ADJ. TO TOTAL REVENUES
TOTAL REVEINES (ad].)
Consumption expediture 1084.3 1169.3 t25.4 1342.0Wages nd sa taries 630.3 724.6 U7r.9 597.4Other adf. & evcs. 454.0 444.5 M39.5 744.6
Subsidies 0.0 0.0 0.0 0.0
Interest paymen. 293.9 368.6 464.5 503.2Foreign A02.0 116.0 153.3 172.1Does tic 191.9 252.6 311.3 333.1
Transfers MAi 149.4 450.4 480.5To hoeholds 34.7 0.0 0.0 0.0lo fin. 4 non-fin. entprs. 0.0 0.0 0.0 0.0To gwraL gowt 91.6 0.0 0.0 0.0To rest of the worLd 0.0 0.0 0.0 0.0to other 3/ 45.5 149.4 450.4 4 0.5
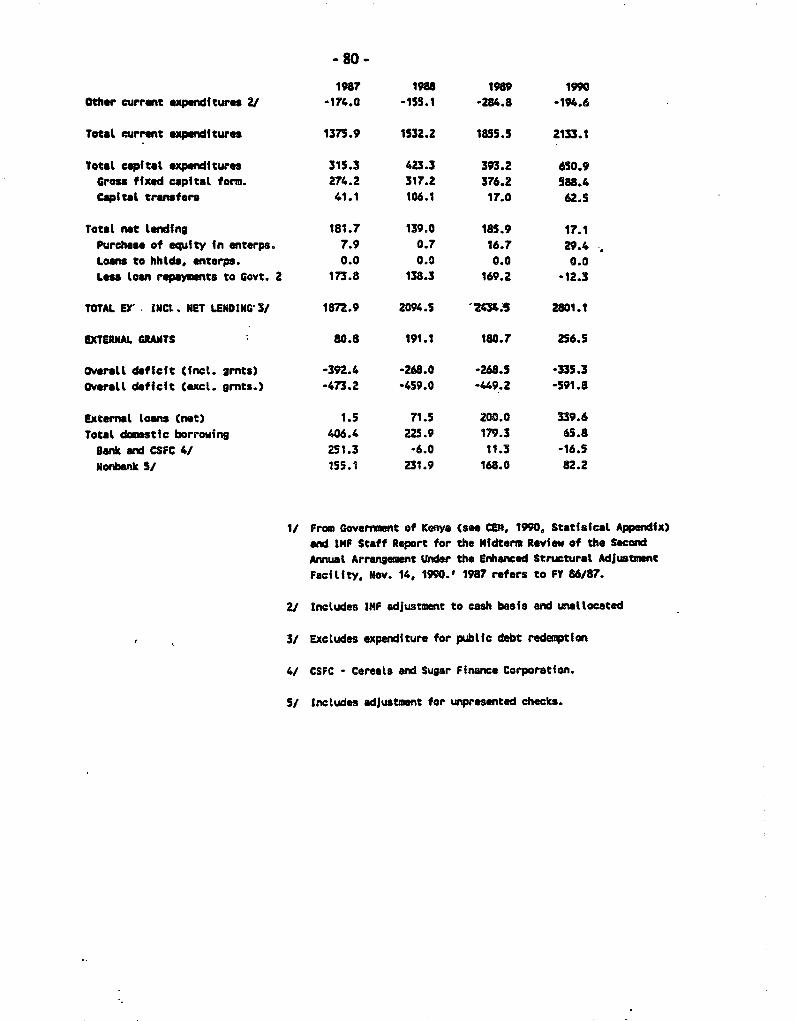
-80 -
1987 1988 1989 1990Other current expenditures Z/ -174.0 -155.1 -284.8 -194.6
Totat current expenditures 137S.9 1532.2 1855.5 2133.1
Total capital expendtures 315.3 423.3 393.2 650.9Gross fixed capitat form. 274.2 317.2 376.2 588.4Capitat trasfers 41.1 106.1 17.0 62.5
TotaL net lending 181.7 139.0 185.9 17.1Purchase of equlty In enterps. 7.9 0.7 16.7 29.4 Loans to hhLds, enterps. 0.0 0.0 0.0 0.0Les loan repyments to Govt. 2 173.8 138.3 169.2 -12.3
TOTAL EY' INCL NIET LENDtNGH3/ 1872.9 2094.5 2"4N S 2801.1
EXTERNAL GRANTS 80.8 191.1 180.7 256.5
Overall deficit Ctnt. grnts) -392.4 -268.0 -268.5 -335.3Overltl deficit (axct. grnts.) -473.2 -459.0 -49.2 -591.8
External Loans (net) 1.5 71.5 200.0 339.6Total damestic borrowing 406.4 25.9 179.3 65.8
gank and CSFC 4/ 251.3 -6.0 11.3 -16.5Nonbank S/ 155.1 231.9 168.0 82.2
1/ From Goverrhnt of Kenya (see CEM, 1990. StatisfcaL Appendix)and IMF Staff Report for the Nidterm Review of the SecondAnnual Arrangewnt Under the Enhanced Structural AdjustmentFacility. Nov. 14, 1990.' 1987 refers to FY 86/87.
2/ IncLudes IMf adjustment to cash basis and uwillocated
3/ Excludes expenditure for pubLic debt redeption
4/ CSFC - Careals and Sugar Finance Corporation.
5/ Includes adjustment for unpresented checks.
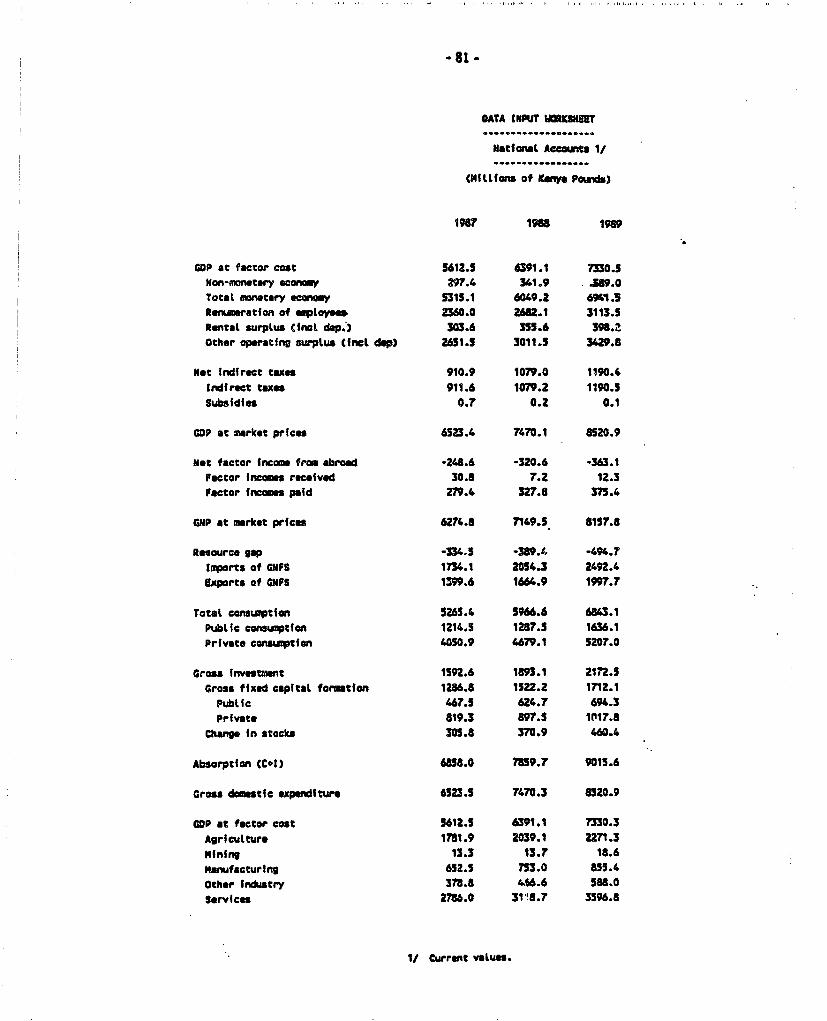
j ~~~~~~~~~~~~-81 -
DATA tNPUT UOISNWET
NatfamL Accow,eS 1/I .......... .. ~~~~~~~~~~~~~~.................
(MiLLons of Kenya Pounds)
1987 1988 1989
GOP at factor cost 5612.5 6391.1 7330.5Non-monetary econoy 29t4 341.9 W.39.0
Total maneUtary economy 5315.1 6049.2 691.1.3Rerumeratfon of aaploysn 2360.0 2682.1 3113.5Rentat surptus (Inet dsp.) 303.6 355.6 398.2Other operating surpLus mfl.t dsp) 2631.5 3011.5 3429.8
Not Indirect taxes 910.9 1079.0 1190.4Indirect taxes 911.6 1079.2 1190.5
Subsidfas 0.7 0.2 0.1
GOP at sarket prfces 6523.4 7470.1 8520.9
Not factor incom from abroad -248.6 -320.6 -363.1Factor incomes receivad 30.8 7.2 12.3Factor Incomse paid 279.4 327.8 375.4
GNP at a.rk.t prfces 6274.8 7149.5 8157.8
Resource gap -334.5 -389.4 -494.7toports of GCfS 174.1 2054.3 2492.4Exports of OFS 13t99.6 1664.9 1997.7
Total consumption 5265.4 5966.6 6843.1Pubtic consumptfon 1214.5 1287.5 1636.1Private consunptfon 40S0.9 4679.1 5207.0
Gros Investmmnt 1592.6 1893.1 217"2.5Gross fixed capitat formtion 1286.8 1522.2 1712.1
Pubic 467.5 624.7 694.3Private 819.3 897.5 1(117.8
Change In stocks 305.8 370.9 460.4
Absorptf on CC4) 6858.0 7859.7 9015.6
Gross domstic expediture 6523.5 7470.3 8520.9
GOP at factor cost 5612.5 6391.1 7330.3Agrfcutture 1781.9 2039.1 2271.3
ifning 13.3 13.7 18.6marnufacturing 652.5 753.0 855.4Other industry 378.8 a16.6 S8.0services 276.0 3118.7 3596.8
I/ Current vaLues.
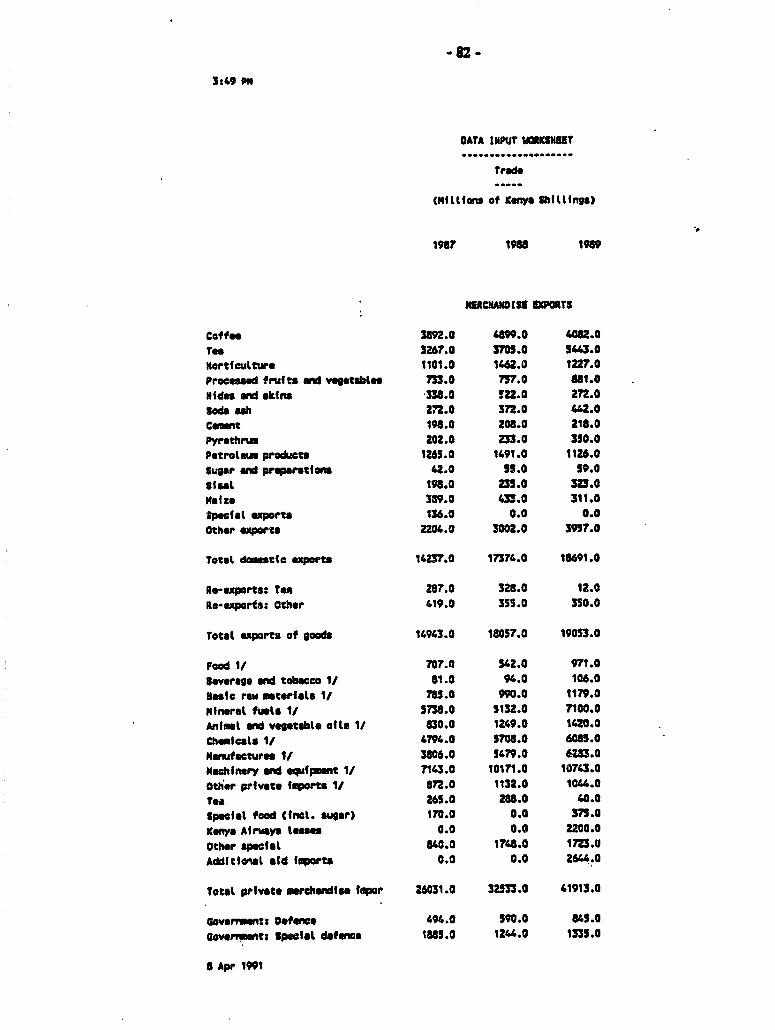
-82-*
3:49 Pa
DATA INPUT VEKIET
Trad0;.....
CHMiits otfnya Shitngs)
198I 19t8 1989
NIRCHAND 11 8PORTS
Coffee 3892.0 4899.0 4082.0
Too 3267.0 3705.0 5443.0Horticulture 1101.0 1462.0 122t.0
Processed frufts md veetable 733.0 7m7.0 881.0Hides aN sns 338.0 !22.0 27.0goda ash 272.0 3. 442.0
Cament 108.0 208.0 218.0Pyrethrum 202.0 233.0 310.0
Petrolem produacts 1265.0 1491.0 1126.0
sugar and prepration 42.0 55.0 59.0
Si"sl 198.0 m.o 323.0
1Mize 389.0 433.0 311.0
-pecial exort 136.0 0.0 0.0
Other exports 2204.0 3002.0 3957.0
Total dcmsttc exports 14237.0 17374.0 18691.0
Re-exports: Toa z27.0 328.0 12.0
Re-exports: Other 419.0 353.0 350.0
Total exports of aoods 14943.0 18057.0 19053.0
Food 1/ 707.0 542.0 971.0
leverage ad tobacco 1/ 81.0 94.0 106.0
U"sc raw aterfias 1/ 785.0 990.0 1179.0
ifnerat fuets 1 578.0 5132.0 7100.0
Anfmal nd vegetable oils 1/ 830.0 1249.0 1420.0
Chemicals 1/ 4794.0 5708.0 6085.0Manufactures I/ 3806.0 5479.0 6223.O
MachInery and eqatpment I/ 7143.0 10171.0 10743.0Other privato eIports / 872.0 1132.0 10C4.0
To& 265.0 Z88.0 40.0specIal food Ctnfl. suqar) 170.0 0.0 373.0Keya Airways leases 0.0 0.0 2200.0
Other ap cIal 840.0 1748.0 1723.0
Additional aId Imports 0.0 0.0 2644.0
Total private merchandIse leper 26031.0 32533.0 41913.0
GSovsrvntg Defec4 494.0 590.0 841.0Goverunwtts Speiafl defmece 1885.0 1244.0 1335.0
A Apr 1991
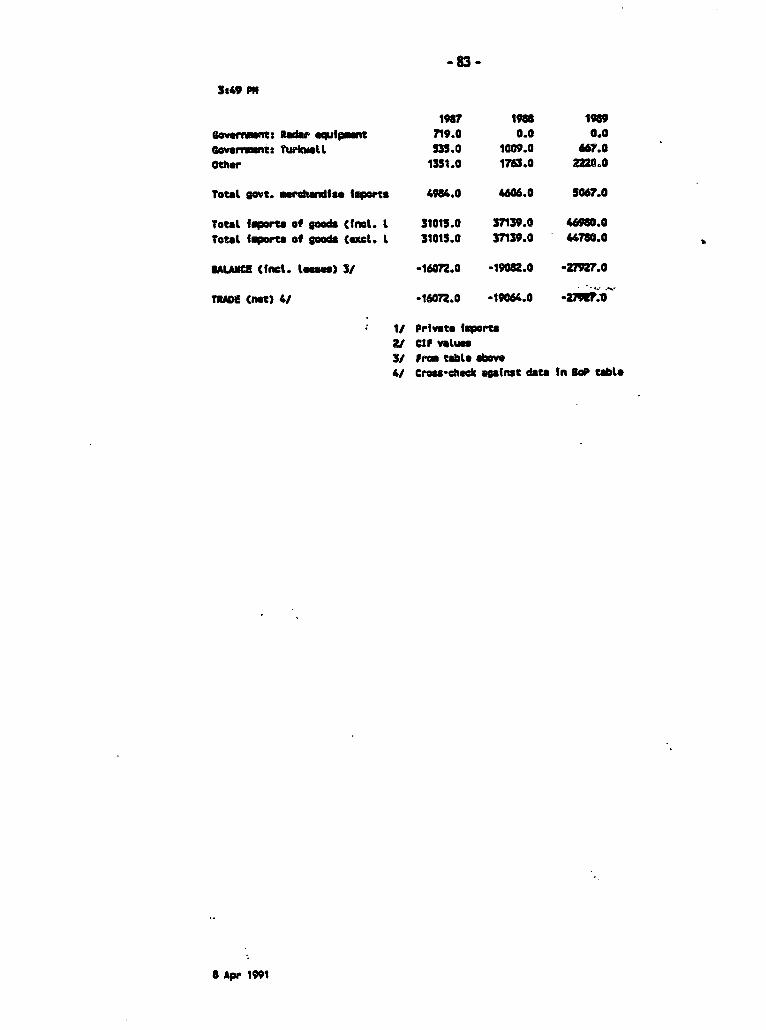
-83 -
3NO9 Pn
198? 1966 1939G smrmwt: Radar lpmnt 719.0 0.0 0.0Gornav innu Turiwatt 550 1009.0 mM7.0Other 1351.0 1763.0 2220.0
Total amt. m.rhadfse iorts 49W4.0 406.0 t07.0
Total fmofl of look (mlas. l 31015.0 37139.0 469".0Total tworts of goods Cen. l 31015.0 37139.0 4780.0
LAC Ctnes. eI s) 3/ -16072.0 -1908.0 -21927.0
TROfI Cnet) 4/ -16072.0 19064.0 -27"P.0
I/ Private tport2/ CIP vatue3/ Fri table abo-4/ Crs-ack against data tn W table
8 Apr 199
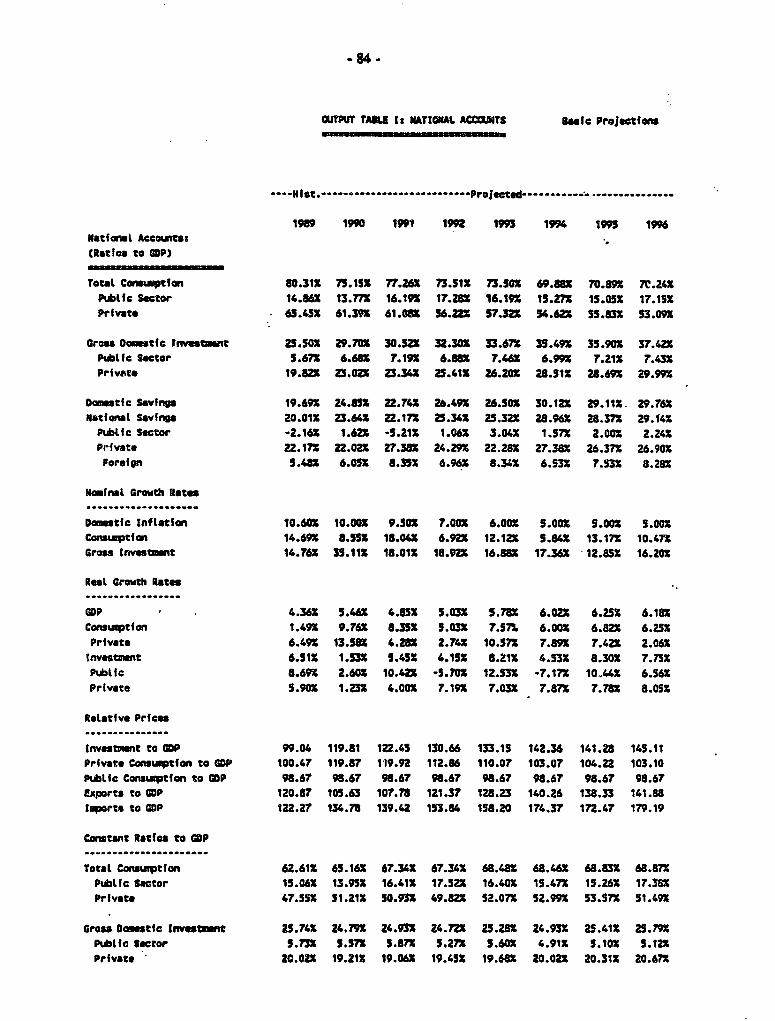
-84 -
*UPUT TAIU 1s NATIONL ACCONTS asle Projectfon
HIt.t -----------*-v--------------Proj eted ----------- e .............
1989 1990 1991 1992 13 1994 1995 1996Natfonal Accounts:
CRatfos to GOP)
Total ConuWtfan 80.312 7n.15u 77.2z2 73.512 73.502 69.88X 70.89M 7c.24xPublif Seetor 14.86X 13.77S 16.19X 17.282 16.192 13.27Z 15.05X 17.15X
Prfvate 65.45X 61.392 61.0X 56.22X 57.32 54.622 55.832 53.09X
Gros Domestic frvvesntt 25.50X 29.702 30.522 32.30x 33.672 35.492 35.90X 37.422Public Sector 5.67X 6.682 7.19X 6.882 7.46 6.99M 7.21t 7.432Private 19.8X 53.02X 23.34X 25.41t 26.202 28.5t1 28.692 29.992
DOamestic Savfngs 19.692 24.85X 22.74X 26.492 26.50X 30.12X 29.11X 29.762Natfonl Savings 20.01Z 23.64 22.172 25.34X 25.322 28.96X 28.371 29.142
Pubtic Sector -2.16X 1.622 -5.212 1.06X 3.043 1.57X 2.00X 2.24XPrivate 22.17X 22.02X 27.382 24.292 22.282 27.38X 26.37X 26.90XForelgn 5.482 6.05 8.35 6.96X 8.342 6.532 7.532 8.282
Nominal Growth Rates.... .. .... . _....
Domestic InfLatian 10.602 10.002 9.50% 7.00Z 6.00Z 5.002 5.00X 5.002Cornuptifn 14.69X 8.552 18.04X 6.92 12.12X 5.843 13.17X 10.47XGross Investmnt 14.762 35.112 18.01 18.922 16.882 17.36X 12.85X 16.202
Real Growth Rates.... .... _ ... ......... _
GDP 4.362 5.46Z 4.85S 5.03S 5.782 6.02X 6.25X 6.182Consuoptfan 1.49X 9.762 8.352 5.03X 7.571 6.002 6.822 6.25XPrivate 6.49X 13.582 4.28X 2.742 10.575 7.892 7.422 2.062
tnvestment 6.512 1.532 5.452 4.15X 8.21t 4.53X 8.30X 7.732Pubifc 8.69i 2.60X 10.42X -5.70X 12.53X -7.17S 10,442 6.562Private 5.902 1.Z32 4.002 7.19X 7.03X 7.871 7.78X 8.05X
Reloative Prices,...... .......
investmnt to GOP 99.04 119.81 12.45 130.66 133.15 142.36 141.28 145.11Prfvate Coswptlon to GOP 100.47 119.87 1i9.92 112.86 110.07 103.07 104.22 103.10Public Cam tfon to GOP 98.67 98.67 98.67 .67 98.67 98.67 98.67 98.67exports to GOP 120.87 105.63 107.78 121.37 128.23 140.26 138.33 141.88IiWorts to GOP 122.27 134.78 139.42 153.84 158.20 174.37 172.47 179.19
Constant Ratfos to GOP......................
Totat Conusptfon 62.612 65.16I 67.343 67.34X 68.482 68.644 68.832 68.872Public Sector 15.062 13.95X 16.412 17.52z 16.40Z 15.471 15.262 17.382Private 47.55X 51.21X 50.932 49.82X 52.07X 52.99M 53.57X 51.492
Gross Domstic Inmve .tt 25.742 24.792 24.932 24.7n 25.282 24.932 25.412 25.792Public Sector 5.732 5.57X 5.87X 5.27r 5.60X 4.91t 5.10X 5.12XPrivate 2C.02X 19.21X 19.062 19.45X 19.612 20.022 20.312 20.672

6UTPUT TABLE A NATIOAL ACCOLNTS IN CONSTANT PRICES............................ ....................... _ -- t^--vv-v-- .a... Bic Projecttans
HNstorical Projected
1987 t988 1989 190 1991 1992 1993 1994 1995 19961. Prices:
GOP Deflator C1987=1) 1.0000 1.0824 1.1830 1.3013 1.4249 1.5247 1.616a 1.6970 1.7818 1.3709
tmport Price index USS 1.0000 1.0867 1.2540 1.3530 1.4741 1.4642 1.4414 1.4739 1.5S 1.6104
Export Price Index US8 1.0000 1.1373 1.2396 1.0603 1.1395 1.1S52 1.1684 1.1856 1.2330 1.2n0
SxchRate tndex CKL/MU#) 1.0000 0.9954 1.1S35 1.2963 1.3477 1.6019 1.M8 2.0076 1.9990 2.0819import Price Index Pounds 1.0000 1.0817 1.4465 1.7m39 1.9866 2.3455 2.5567 2.9591 3.0731 3.3526Export Price Indax Pounds 1.0000 1.1321 1.4299 1.3745 1.538 1.8S05 2.0724 2.3801 2.4649 2.6544
Totat ExpedIture 1.000 1.on 1.197 1.378 1.519 1.614 1.711 1.791 1.891 1.998
PubLic CoraWptifn t.0OO 0.969 1.167 1.284 1.406 1.504 1.595 1.674 1.758 1.84Privace Consuaption 1.000 1.089 1.189 1.560 1.709 1.721 1.779 1.749 1.857 1.929Gross Domtfc Inv. 1.000 1.087 1.172 1.559 1.745 1.992 2.152 2.416 2.517 2.715
Terms of Trade 1987 1.0000 I."6 0.9885 O.837 o.mo 0.7889 0.8106 0.8043 0.8021 0.7917
2. Natioal Accounts:
GOP 6523.4 6901.7 7202.7 7593.7 7964.0 8364.9 8848.5 9381.1 9967.8 10584.0!aports 1734.1 1899.2 1723.1 1543.2 1652.2 1509.6 1653.3 1549.2 1739.5 1854.6Exports 139.6 1470.7 1397.1 1620.5 1561.9 1513.3 1545.0 1566.5 1679.8 1771.3Resource Balance *334.5 *428.5 -326.0 77.3 -90.3 3.7 108.3 17.3 -59.7 -83.3
Total Expenditure 6857.9 7330.2 7528.7 7518.4 8054.3 8361.2 8956.8 9363.8 1C'27.6 10667.3
Consurption
Total 4165.9 4443.3 4509.7 4949.7 s362.8 5632.6 6059.2 6422.6 686W.6 7289.4
Public Sector 1114.0 1227.0 1084.8 1059.8 1306.6 1465.4 1451.6 1451.6 1520.7 1839.3
Private 3051.9 3216.3 3424.9 3889.8 4056.1 4167.2 4607.? 4971.0 5339.9 5450.1
Terms of Trade effect 0.0 68.5 -16.0 *350.5 *3S4.5 -319.4 -292.7 -306.5 *332.5 *368.9
Gross Domestic Income 6523.4 6970.2 7186.7 7245.1 7609.5 8045.5 s5s5.8 9074.6 9635.4 1021S.1
Dooestic Savings 2357.6 2527.0 2677.1 2295.5 2246.7 2413.0 2496.6 2652.0 2774.7 2925.7
NationaL Savings 2125.4 2252.0 2393.3 1913.4 1897.1 1996.8 2054.1 2184.4 2319.1 2455.0
aross National Product 6291.2 6626.8 6919.0 7213.6 7614.4 7948.8 8406.0 8913.5 9512.2 10113.3
Gross National Income 6291.2 6695.3 6903.0 6863.1 7259.9 7629.4 8113.3 8607.0 9179.7 9764.4
Mm:
Real GDP Cfc) 5612.5 5904.8 6196.3 6405.4 6707.3 7028.0 7399.4 7832.7 8293.5 8783.5
Agrfiulture 1781.9 1884.0 1920.0 19t7.6 206.8 2118.4 2192.6 ZZ69.3 2348.7 2430.9
Mining 13.3 12.7 15.8 16.4 17.0 1. 18.4 19.2 19.9 20.7
Manufacturing 62.5 695.7 723.1 762.9 812.5 869.3 930.2 1009.3 1095.0 1188.1
Other Industry 378.8 431.1 497.0 516.9 542.8 569.9 598.4 637.3 678.7 722.8
Service 278.O 2881.4 3040.4 3131.6 3288.2 3452.6 3659.8 3R97.? 4151.0 4420.8

- 86-
OUTPUT TA8E It: PRIVATE SECTOR ACCOUNT kafe Projectfons
(Ratfos to COP) ---- Hist........................ raProJ ------------------------
1989 1990 1991 1992 1993 1994 1995 1996Private Sector:
Ratfo to Ofsp. Ince:
Prfvate Con*awptfon 74.69X 73.603 69.04X 69.a3 72.012 66.61% 67.92X 66.37XPrivate Savings 25.312 26.402 30.96Z 30.172 2V.99M 33.392 32.08X 33.632
CuiuLatfve NSRs:OCS' 25.993 23.492 52.772 33.182 23.692 40.182 35.062 35.132OMR Per Capita 28.40X 25.0a 67.892 47.80% 26.182 63.73S 51.20X 50.52SC0SRd 47.03X -5.792 -7.69X 3.01X 5.982 10.31X 12.11X 13.992
Real Private Saving:index 112.43 117.7 153.5 143.0 138.8 16.8 185.0 200.4Per Capita tndex 108.31 109.3 137.4 123.4 115.5 14e.1 143.5 150.3
R"t Private Corsuptfion:Index 112.22 127.5 132.9 136.5 151.0 162.9 173.0 178.6Per Capita tndex 108.11 118.3 119.0 117.8 125.7 130.7 135.7 133.9
X Chawge In c"otant primntPrfvate ConwAptfon 6.492 13.58S 4.232 2.74X 10.573 7.8 7.42Z 2.06XPer Capita Prfv. Cons. 2.59X 9.42 0.55X -0.93 6.63X 4.04X 3.9Yx -1.292
Aset accumtatfon 7.843 4.24X 16.962 11.242 16.062 13.53m 1S.932 18.262Goverment Debt 1.64X 3.072 3.072 3.072 3.072 3.072 3.072 3.072Currency 0.862 0.74X 0.652 0.582 0.51X 0.46X 4.41% 0.372Dnd Deposits 1.7ZX 1.562 1.503 1.272 1.09M 0.962 0.86J 0.77XQuasi-money 1.412 1.24X 1.12X 0.982 0.863 0.772 0.69X 0.623Other lfabiLities of NS 1.9"% -1.15X 2.5JO 2.402 4.372 3.81. 5.19X 5.84XOther LiabiLities of Ccvt 3.772 -3.072 2.232 2.17X 4.161 3.662 5.03X 5.69XAdj of Priv Lending to Govt 0.262 0.00 0Q 0.003 0.003 0.003 0.002 0.002 0.003Resfduot PBSR 0.002 1.112 0.242 O.522 0.682 0.7rx 0.o4 2.28XAnticfpatad Not Int'l Reerve Acc. 0.003 -1.35X -2.72X 0.20X -0.282 0.67X 0.772 0.932Future Target vot int L Reere 0.002 o.s82 -I.M33 -0.452 -1.033 -0.672 -0.60X -0.56X
Liabitlty jeeualatin 5.49X 5.24X 12.91X 12.37X 19.992 14.66x 18.233 21.352Net tending from ovt 1.492 3.58X 6.54X 8.213 15.20x 8.17X 11.612 13.372Borrofng frca Montary Sectr 2.81X 2.902 2.86x 3.15X 3.21X 3.53X 3.49X 3.68X
uMoery Authority 0.47X 0.182 0.102 0.143 0.112 0.152 0.09X 0.133Comrcaft Banas 2.352 2.73X 2.76x 3.01X 3.102 3.382 3.403 3.553
MLT Foretgn lerrowine -0.392 -1.053 1.19 -0.22 -0.31S -0.212 -0.172 0.633Direct Foreign Investmnt 1.232 0.792 0.4X 1.083 1.233 1.52X 1.52X 1.62ST Foreign Sorrowfng 0.22X 0.125 0.25X 0.13X 0.152 0.12X 0.11X 0.163Not Forelon CapitaL (Knet) 0.14X 0.432 0.561 0.373 0.43X 0.34X 0.313 0.363xtemrnt Ffneneng Cap 0.00 1.902 -0.21t -0.65% -0.732 -1.35X -1.37X -1.502
IMF Disbursements Cnet) 0.00 0.362 0.462 -0.932 -0.70r -0.16X 0.00 0.00
Net esource tupltus(-1) 2.33 -l.OOX 4.05X -1.133 -3.92 -1.12X -2.332 -3.092lsvfng 22.172 22.02X 27.383 24.29X 22.282 27.32 26.372 26.90Xinvestm e 19.62S 23.022 23.3% 25.41X 26.20X 28.51X 28.69S 20.99%
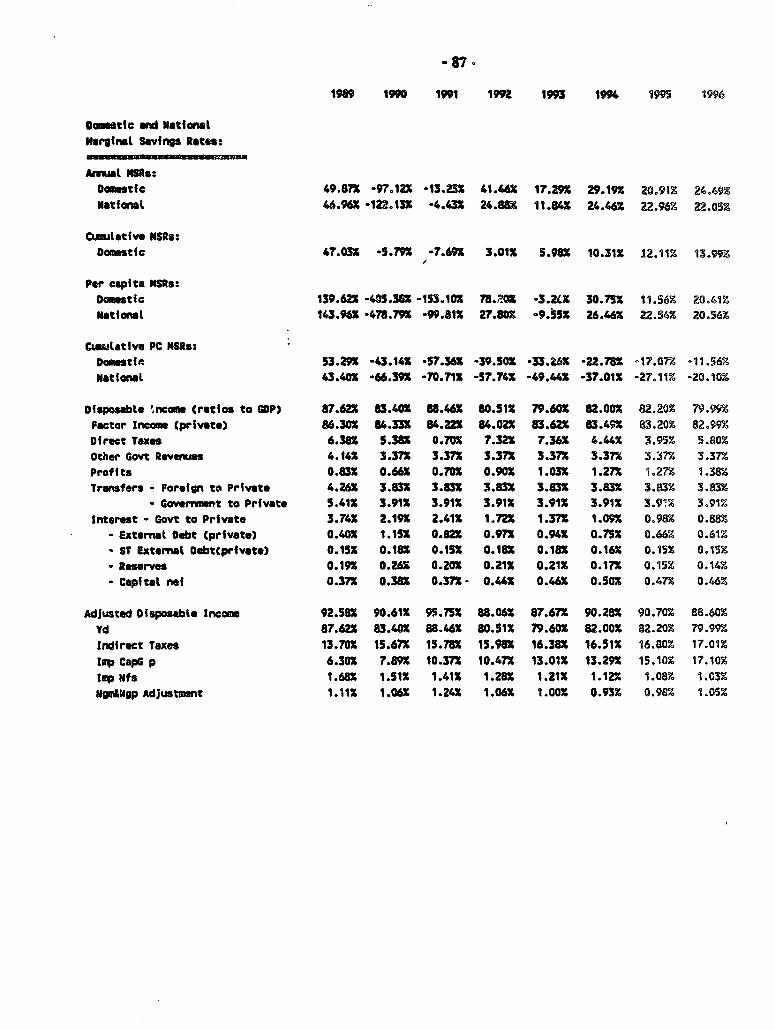
- 87 .
1989 1990 1991 1992 1993 1994 S995 1996
Domestic and NatioaltNarginal Savings Rates:
Aral MSRs:Domustfc 49.871 -97.12X -13.231 41.46 1T.2 29.19X 20.91Z 24.49%
atioaL 46.96% -122.131 -4.431 24.88: 11.846 24.46X 22.962 22.052
Cwalative NSUs:Doeastic 47.031 5.79 -7.691 3.01X 5.9ax 10.31X J2.11X 13.992
Per capita NSRs:Domaestic 139.621 -05.316 -153.101 78.;01 -3.2(1 30.751 11.562 20.41ZNatioal 143.96 -478.791 -".81X 27.6 -9.55 26.461 223.4 20.56X
Cu..tatfve PC MSRS:Dometin 53.291 -43.141 -57.36X -39.50X *33.261 -22.781 -1707% -11.56%National 43.40X -66.391 -70.711 -57.741 -49.44 -37.01X -27.11% -20.10%
Oisposabte ,ncame (ratios to GOP) 87.6ZX 83.401 88.46% 80.51X 79.60o S2.001 82.20% 79.99%Factor Income (private) 86.30X 84.33 84.221 84.021 83.62% 83.49% 83.20X 82.99XDirect Taxes 6.38X 5.38X 0.7M1 7.32X 7.361 4.441 3.95Z 5.80%Other Govt Revenues 4.14X 3.37X 3.37X 3.37X 3.37X 3.371 3.37% 3.37XProfits 0.83X 0.66X 0.70X 0.90X 1.03X 1.27X 1.27% 1.382Transfers - Foreign to Private 4.26X 3.831 3.83X 3.831 3.83x 3.83X 3.832 3.83x
- Government to Private 5.41X 3.911 3.911 3.91X 3.91X 3.91X 3.91% 3.912Interest - Govt to Private 3.74X 2.191 2.41X 1.721 1.371 1.091 0.98% 0.88%
- External Debt (private) 0.40X 1.15X 0.821 0.971 0.94X 0.751 0.662 0.612- ST ExternaL DebtCprf vte) 0.15X 0.18X 0.15X 0.18X 0.181 0.16% 0.15 0.15Z- Rsrves 0.191 0.267 0.201 0.21X 0.21 1 0.117 0.152 0.14%- Capital nel 0.371 0.381 0.371- 0.441 0.461 0.501 0.47% 0.46X
Adjusted Disposable Ineome 92.581 90.611 95.75X 88.061 87.671 90.28X 90.70% 88.60%Yd 87.62X 83.401 88.46% 80.51X 79.601 82.00X 82.20x 79.99M
Indirect Taxes 13.701 15.67X 15.781 15.981 16.381 16.511 16.80% 17.01%Imp CapG p 6.30X 7.89X 10.37X 10.47X 13.011 13.29X 15.10% 17.10%Imp Nfs 1.681 1.511 1.41X 1.281 1.211 1.121 1.08% 1.03ZNgnL&gp Adjustment 1.11X 1.06X 1.24X 1.06X 1.001 0.93n 0.98X 1.05%
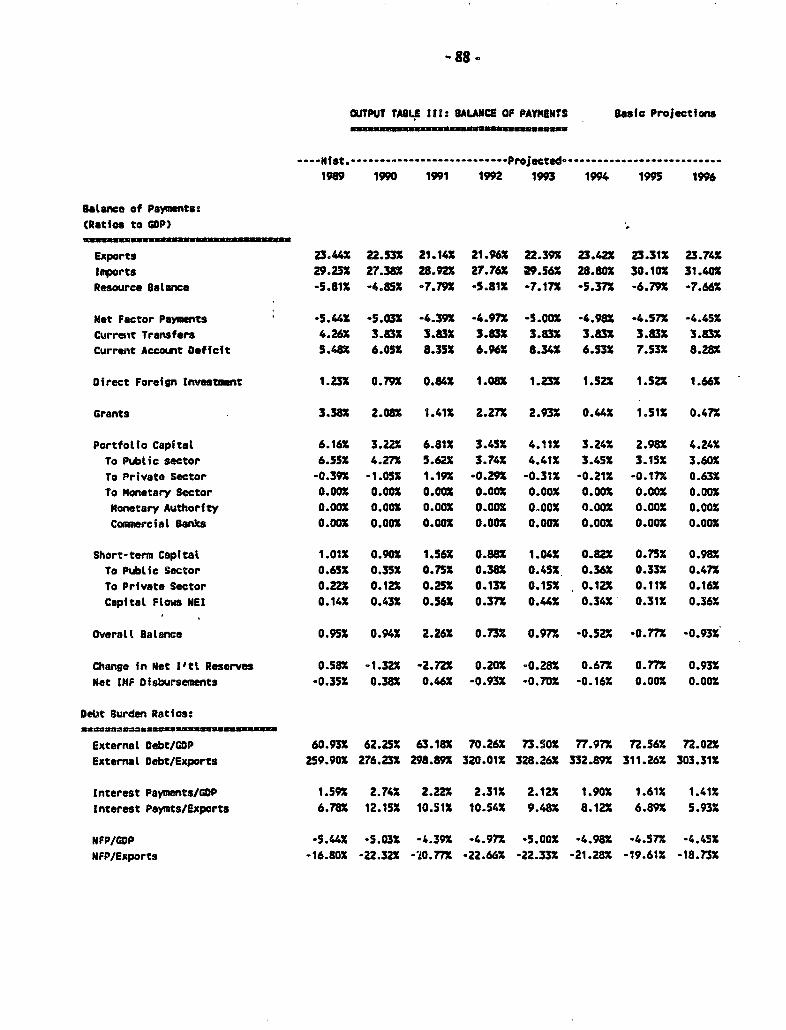
-88 -
OUTPUT TABLE III: BALANCE OF PAYMENTS Basic ProJections
---- ist. P---------r ojecte d------------rcd........
1989 1990 1991 1992 1993 1994 1995 1996
Balance of Payments:
(Ratios to GOP)
Exports 23.44X 22.53X 21.14X 21.96X 22.39X 23.42X 23.31X 23.741Inports 29.232 27.38X 28.92X 27.76X 29.56X 28.80X 30.102 31.402Resource Balance -5.871 -4.85X -7.79M -5.81X -7.17X -5.37X -6.792 -7.662
Met Factor Payments -5.44X -5.032 -4.392 -4.972 -5.002 -4.98X -4.572 -4.452Current Transfers 4.26X 3.83X 3.83X 3.832 3.832 3.83U 3.83X 3.832Current Acconat Deficit 5.482 6.05X 8.35X 6.962 8.342 6.53X 7.53X 8.282
Direct Foreign Investm.nt 1.23X 0.792 0.84X 1.082 1.23X 1.522 1.522 1.66%
Grants 3.382 2.082 1.412 2.27X 2.932 0.44X 1.512 0.472
Portftolio Capital 6.16X 3.222 6.81X 3.452 4.112 3.242 2.982 4.242To Public sector 6.552 4.272 5.622 3.742 4.41t 3.45X 3.152 3.60XTo Private Sector -0.39X -1.052 1.19X -0.292 -0.312 -0.212 -0.17X 0.632To Monetary Sector 0.00 0.002 0.002 0.002 0.002 0.002 0.002 0.002Monetary Authority 0.002 0.002 0.002 0.002 0.00 0.002 0.002 0.002Commercial Banks 0.002 0.002 0.002 0.02O 0.00X 0.002 0.002 0.002
Short-term CapItal 1.012 0.902 1.56X 0.882 1.04X 0.822 0.75x 0.98XTo Public Sector 0.65X 0.35X 0.75 0.382 0.452, 0.362 0.332 0.472To Private Sector 0.222 0.122 0.25X 0.132 0.15X 0.12 0.112 0.162Capital Flows HEI 0.14X 0.432 0.56X 0.372 0.442 0.342 0.312 0.36X
Overall Balance 0.95X 0.942 2.262 0.732 0.97X -0.52% -0.772 -0.932
Change in Net lVtL Reserves 0.582 -1.322 -2.722 0.202 -0.282 0.67X 0.772 0.93MNet IMF Disbursements -0.352 0.382 0.46X -0.932 -0.702 -0.162 0.002 0.002
Debt Burden RatIos:
External Debt/GDP 60.932 62.252 63.182 70.26X 73.SOX 77.97X 72.56X 72.022Externat Debt/Exports 259.90X 276.23X 298.89X 320.01X 328.26X 332.89X 311.262 303.312
Interest Payments/GOP 1.59X 2.74X 2.222 2.312 2.122 1.902 1.61X 1.41%Interest Paymts/Exports 6.78X 12.15 10.51 10.54X 9.48X 8.12% 6.892 5.93X
NFP/GDP -5.442 -5.032 - .392 -4.97X -5.002 -4.982 -4.572 -4.452NFP/Exports -16.802 -22.32 -20.77X -22.66X -22.332 -21.28X -19.61Z -18.732
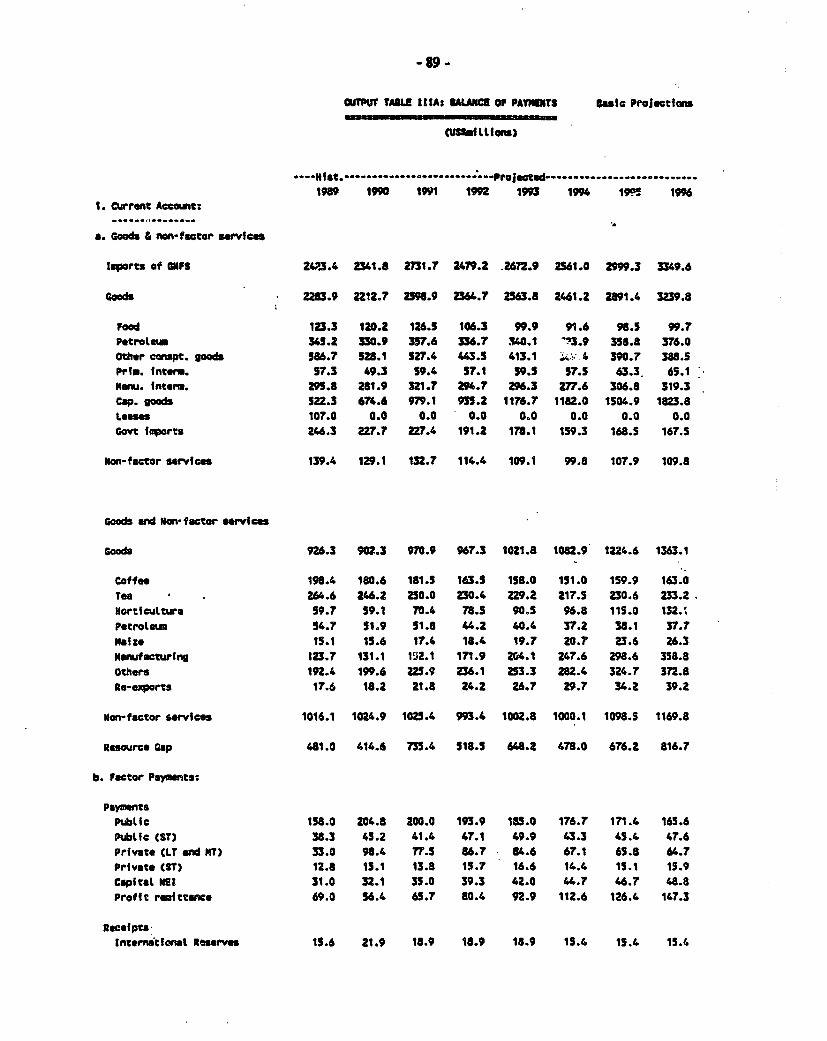
-89 -
WUPUT TABU LI IA: SALANCE Of PAYMNTS 1a"la PreJectians
(Uusmi Wtfon)
--- Nfst---------t-.- Prjoetead .........................1989 1990 1991 1992 1993 1994 19. 1996
1. Current Account:
a. Goods & ronfactor servcefs
luports of GUfS 24;!.4 2341.8 2731.M 2479.2 .2672.9 2S61.0 29°9.3 3349.6
;oods 223.9 2212.7 2598.9 23.? 2563.8 2461.2 Z891.4 3239.8
Food 123.3 120.2 126.5 106.3 W.9 91.6 98.5 99.7Ptrotn 345.2 330.9 357.6 336.7 340.1 -3.9 358.8 376.0Othor canapt. goods 586.7 528.1 527.4 443.5 413.1 ::. .4 390.7 388.5Prim. inteo. 57.3 49.3 59.C 57.1 59.3 57.5 63.3. 65.1MnuA. intoer. 29f.8 281.9 321.7 294.7 296.3 277.6 306.8 319.3Cap. goods 522.3 674.6 979.1 935.2 1176.7 1182.0 1504.9 1623.8Leases 107.0 0.0 0.0 0.0 0.0 0.0 0.0 0.0Govt faports 246.3 227.7 227.4 191.2 178.1 159.3 168.5 167.5
Non-factor services 139.4 129.1 132.7 114.4 109.1 99.8 107.9 109.8
Goods and manfwactor services
Goods 926.3 902.3 970.9 967.3 1021.8 1082.9 1224.6 1363.1
Coffee 198.4 180.6 181.5 163.5 158.0 131.0 159.9 163.0Tea . 264.6 246.2 230.0 230.4 229.2 217.5 230.6 233.2HorticuLture 59.7 59.1 70.4 78.5 90.3 96.8 115.0 132.'Petroteu 34.7 51.9 51.8 44.2 40.4 37.2 38.1 37.7Maize 15.1 15.6 17.4 18.4 19.7 20.7 23.6 26.3Manfacturfng 123.7 131.1 152.1 171.9 2G4.1 247.6 298.6 358.8Others 192.4 199.6 223.9 236.1 253.3 262.4 324.7 372.8Ra-exporrs 17.6 18.2 21.8 24.2 26.7 29.7 34.2 39.2
mon-factor carvices 1016.1 1024.9 1025.4 993.4 1002.8 1000.1 1098.3 1169.8
Rosurce cap 481.0 414.6 m.4 518.5 648.2 478.0 676.2 816.7
b. factor Paymnts:
PaymentsPubtlc 158.0 204.8 200.0 193.9 155.0 176.7 171.6 169.6Public (ST) 38.3 45.2 41.4 47.1 49.9 43.3 45.4 47.6Private CLT and MT) 33.0 98.4 77.5 86.7 84.6 67.1 65.8 64.7Private (ST) 12.8 15.1 13.8 15.7 16.6 14.4 15.1 15.9Capital Iot 31.0 32.1 33.0 39.3 42.0 44.7 46.7 48.8Profft r_i ttawe 69.0 56.4 65.7 80.4 92.9 112.6 126.4 147.3
RecelptsInternationat Reerve 15.6 21.9 18.9 18.9 18.9 15.4 15.4 15.4

-90-
19r 1990 1991 1992 1993 1994 19 1996Net Factof Payants -326. -430.1 .414.6 *444.2 -42.2 -443.3 *4.5 -474.4
c. Current tranf erTo Private 353.0 327.1 361.3 341.6 345.9 340.2 381.2 408.1
d. Curr Acot Deficit:oeagite 454.3 517.6 78.8 621.1 734.5 581.2 750.5 88.0
2. Capitat Account:... _......._...
*. Foreign Invest"nt:DPI 101.6 67.8 78.9 96A 1. 135.2 151.9 176.9
t. NLT Inflotws 491.0 273.0 643.1 308.1 371.5 288.1 296.8 431.9To Gownernt 6 Montary 543.0 365.0 530.3 334.3 399.1 307.0 314.0 384.6- avattable 493.6 .02.3 350.1 392.2 467.0 426.8 430.9 546.1* gaff 49.4 162.7 -19.8 -57.9 -67.9 119.8 -136.9 -159.5To Nn-ffnaclal Putfe 54.0 365.0 50.3 334.3 399.1 307.0 314.0 384.6To Monetary 0.0 0.0 0.0 0.0 0.0 0.0 0.0 0.0- Centrat Bank 0.0 0.0 0.0 0.0 0.0 0.0 0.0 0.0- Coarcial Banks 0.0 0.0 0.0 0.0 0.0 0.0 0.0 0.0To PrIvate -32.4 -90.0 112.8 -26.2 -27.6 -19.0 -17.2 67.3
g. Short-term Capital: 72.0 40.3 94.3 45.2 54.5 42.2 43.5 66.3To Govrnt 54.0 30.2 70.7 33.9 40.9 31.7 32.6 49.7To Private 18.0 10.1 23.6 11.3 13.6 10.6 10.9 16.6
- NFA of Other Pln. instltugions -20.4 131.2 .105.1 96.8 -188.2 -162.6 -250.5 -303.4
h. Net Capital Intlows 676.0 419.6 869.3 483.2 577.5 496.2 523.6 733.5
3. Change In Reerves:........... .........................
NMA Central Bank 27.4 18.5 .362.0 -78.9 -213.2 -102.9 -173.6 -203.8NFA Others 193.6 -25.5 -7.8 -31.4 -16.1 -17.5 0-6 5.3.
Exterat Debt Stedcs:Goverwmnt 4001.0 4366.0 4896.3 5230.6 5629.7 5936.8 6250.8 6635.4Governat (ST) 481.1 511.3 582.0 615.9 656.8 688.4 721.1 770.8Private (NLT) 1047.3 957.3 1070.1 1043.9 1016.2 99T.3 980.1 1047.4Privato CST) 160.4 170.4 194.0 2053 Z18.9 229.5 240.4 256.9
Total External Debt CLT) 5048.3 5323.3 5966.4 6274.3 6646.0 6934.1 7230.9 7682.8Total ST Debt 641.4 681.7 776.0 821.2 873.7 917.9 961.4 1027.7
stock of Int. Reserves: -71.8 -53.3 -419.3 -494.2 -707.4 -810.3 -983.8 1187.6
Exchange Rate CPoude/U8S2 1.028 1.156 1.202 1.428 1.581 1.790 1.782 1.896
NO=
Toe. Ext. Ffn. Req. (USWI 493.6 202.3 550.1 392.2 467.0 426.8 450.9 544.1Avail. Ext. Fin. Req. CUM) 543.0 365.0 30.-3 334.3 399.1 307.0 3V4.0 384.6
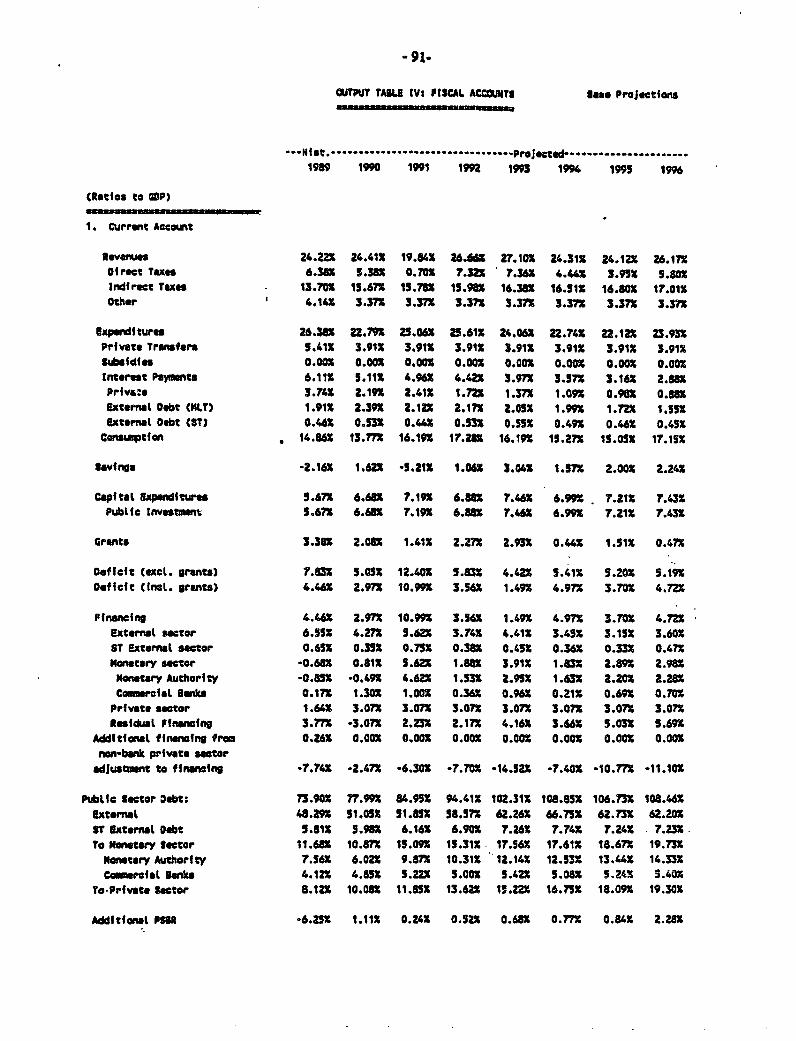
-91-
CUTPUT rTAuI IVs FISCAL ACCOUTS Base Projections
"fat .............. -. P.ro. .-......... Prolfcxed ....................
1989 1990 1991 1992 199 1994 1995 1996
CRatics to GOP)
1 Current Acco nt
Revenues 24.=22 24.412 19.81X 26.I 27.102 24.31X 24.1t2 26.171
Direct Taxes 6.38% 3.38X 0.70X 7.321 7.36 4.44X 3.951 s.s0o
Indirect Taeas 13.70% 15.671 11.78X 15.9 16.38X 16.51Z 16.t0X 17.012
Other 4.141 3.37X 3.371 3.37X 3.371 3.371 3.371 3.371
Expewditures 26.38X 22.7X 25.06 25.611 24.06X 22.74x 22.12 23.931
Private Trawfers 5.41X 3.91X 3.91X 3.91X 3.91X 3.91X 3.91X 3.91X
SufdIfs 0.001 0.001X 0,OX 0.001 0.002 O.OOX 0.001 0.001
Interut Paymonts 6.111 5.11X 4.96 4.42X 3.971 3.57X 3.161 2.88%
PrIvs:e 3.741 2.191 2.41X 1.7X 1.371 1.091 0.9ax 0.
Exteral Debt CML?) 1.911 2.391 2.1ZX 2.171 2.051 1.991 1.72X 1.511
External Debt (ST) 0.462 o.m 0.44x 0.531 0.55X 0.491 0.46X 0.452
Cosa ptfon . 14.86U 13.7 16.191 1t.28 16.191 15.271 15.05X 17.151
savinog -2.16 1.621 -5.211 1.061 3.042 1.571 2.00X 2.24X
Capital Expandftuws 5.671 6.68X 7.19X 6.881 7.462 6.99X 7.211 7.432
Public Invstma 5.671 6.681 7.191 6.881 7.46 6.991 7.211 7.431
Grants 3.381 2.081 1.411 2.271 2.931 0."44 1.51 0.471
Deffict (exct. grants) 7.831 5.05S 12.40% 5.831 4.421 5.41X 5.20X 5.191
Deficft (fmd. grunts) 4.46X 2.971 10.991 3.562 1.491 4.971 3.7aX 4.72X
Ffnancing 4.461 2.971 10.99M 3.561 1.491 4.97X 3.701 4.721
Exteatl stor 6.551 4.271 5.62e 3.741 4.411 3.45S 3.151 3.601
ST Externot setor 0.651 0.352 0.75X 0.3as 0.45X 0.31 0.33Z 0.471
Metary secor -0.681 0.81X 5.e62 1.881 3.911 1.831 2.891 2.981
mtary Authority -0.85X -0.491 4.621 1.53X 2.9SX 1.63X 2.20X 2.281
Crcm al Banks 0.17X 1.30X 1.001 0.36 0.961 0.21X 0.69s 0.701
Private sector 1.641 3.071 3.071 3.07? 3.071 3.071 3.07X 3.071
Rsidual rFfnancng 3.771 -3.071 2.231 2.171 4.16X 3.66X 5.03X 5.69X
Additionl financin from 0.26X 0.00 0.007 0.00 O.00 0.00 0.00 O.OO
non-bank private sector
adJustmant to ffinanng .7.741 -2.471 -6.301 -7.701 -14.532X 7.401 -10.771 -11.101
Putlic Sector Oebt: 73.901 77.991 84.95x 94.411 102.311 108.851 106.731 108.462
External 48.291 51.055 51.85X 58.571 62.261 66.751 62.73X 62.201
ST Extenl Oebt 5.811 5.981 6.161 6.901 7.262 7.741 7.241 7.232
To IMotary Sector 11.681 lO.87 15.091 15.31X 17.56 17.611 18.671 19.731
Monetary Authorfty 7.561 6.02X 9.8N 10.31X 12.14X 12.531 13.44X 14.331
Commercisl Bank 4.121 4.851 5.221 5.001 5.421 5.08X 5.241 S.40%
ToePrfvate 2ctor 8.12X 10.08X 11.85X 13.62X 15.2 16.711 18.09X 19.301
Addftioal PER *6.25% 1.11 0.24X 0.521 0.681 0.771 0.84X 2.281
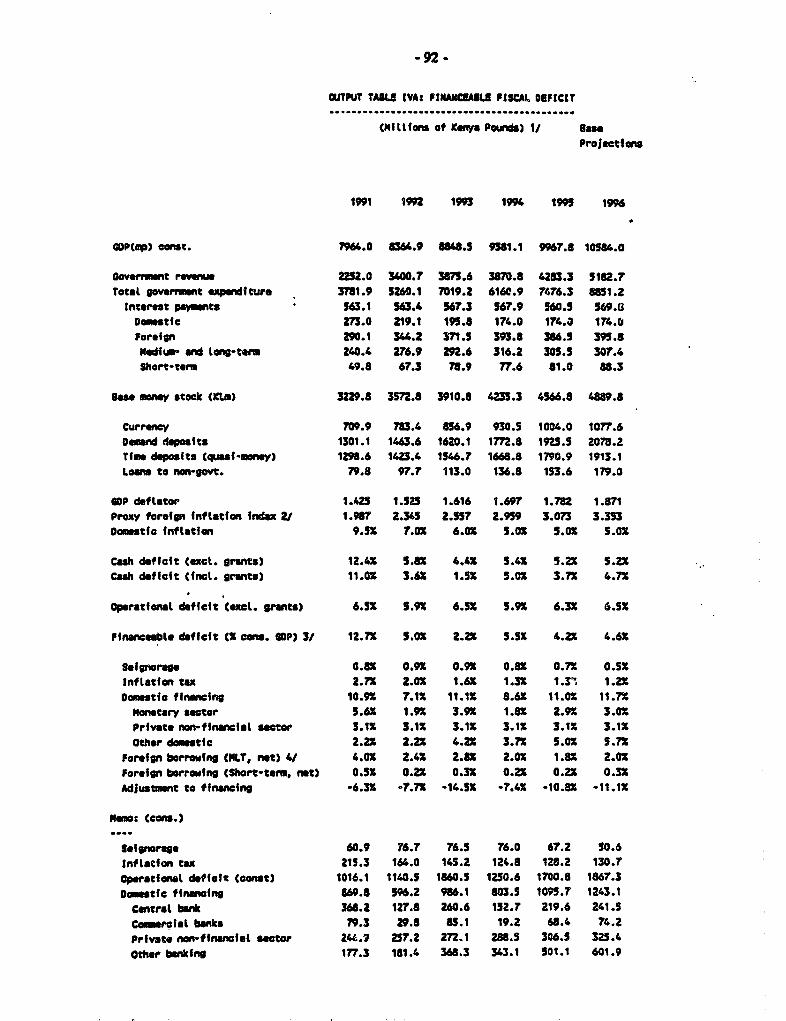
-92 -
ouTPUT TALE IVA: FINAMCEASLS FISCAL OEFICIt............................................
(Milttf. of Kenya Pounds) 1/ a"sProjecti0ns
1991 1992 1993 1994 1995 1996
UOPCtp) const. 7964.0 3364.9 884.5 9361.1 9967.8 10584.0
Goverrnnnt revewe 2252.0 3400.7 3875.6 387.3 423.3 5182.?Total goverraent eXpenditure 3781.9 5260.1 7019.2 6160.9 7476.3 6851.2
Interest pe) nts 563.1 563.4 567.3 567.9 560.5 569.aDomestfi 273.0 219.1 195.6 174.0 174.0 174.0Forefgn 290.1 344.2 371.5 393.8 386.5 395.8
oeditu- and Long-term 240.4 276.9 292.6 316.2 305.5 307.4Short-term 49.8 67.3 78.9 77.6 1.0 88.3
Be mmny stock (KL) 3229.8 3572.8 3910.8 4235.3 4566.8 4889.8
Currency 709.9 783.4 856.9 930.5 1004.0 1077.6emund deposits 1301.1 1463.6 1620.1 1772.8 1925.5 2078.2Tfmo deposfts Cquesf-mney) 1296.6 1423.4 1546.7 1668.8 1790.9 1913.1Loans to non-govt. 79.8 97.7 113.0 136.8 153.6 179.0
GOP deflator 1.425 1.525 1.616 1.697 1.782 1.871Proxy foreign inflation index 2Z 1.987 2.34S 2.557 2.959 3.073 3.353Dometic inflatfin 9.5X 7.0o 6.01 5.01 5.01 5.01
Cah deficit (excl. grants) 12.41 5.81 4.4X S.4X 5.21 5.21Cash deficft (fint. grants) 11.0S 3.6X 1.51 5.01 3.71 4.7X
Operationat defifet (excl. grants) 6.S5 5.9x 6.5X 5.91 6.3X 6.S5
finaceale defifct M cons. GOP) 3/ 12.72 5.01 2.2Z 5.5S 4.21 4.62
Seignorge 0.8 0.91 0.9° 0.82 0.72 0.51Inflation tax 2.72 2.01 1.61 1.32 1.3X 1.21omestie ffnanifng 10.92 7.11 11.12 S.61 11.01 11.72
metary sector s.6 1.91 3.92 1.82 2.91 3.01
Private nrn-financafl sector 3.11 3.11 3.12 3.12 3.1X 3.11Other domstic 2.2X 2.21 4.2X 3.72 5.01 5.7X
Foreign borrowing CMLT, net) 4/ 4.01 2.42 z.82 2.02 1.82 2.0XForeign borrowing (Short-term, net) 0.52 0.21 0.32 0.21 0.21 0.32Adjustmt to finaneing -6.32 -7.72 -14.52 -7.42 -10.82 -11.12
Moo: (con.)
Seignorg e 60,9 76.7 76.5 76.0 67.2 50.6Inflation tax 215.3 164.0 14S.2 124.8 128.2 130.7
Operational deficft (const) 1016.1 1140.5 1860.5 1250.6 1700.8 1867.3Daotfe ffnwcIng 869.$ 596.2 986.1 803.5 1O09.7 1243.1Central bank 36a.2 127.8 Z60.6 152.7 219.6 241.5Cainrcaol banks 79.3 29.3 85.1 19.2 68.4 74.2
Private nrn finafiat sector 254. 257.2 272.1 288. 306.5 325.4
Other banking 177.3 181.4 368.3 343.1 501.1 601.9

-93 -
1991 192 1993 1994 1 1996ForeIgn borrowing CNLT, net) 320.8 203.5 246.9 165.7 162.1 212.9Forefgn borrowing (short-tem, net) 42.8 20.6 25.3 19.2 18.9 27.5
1/ Except otherw se stated.
2/ Supert price deflator (Kenya pounds)
3/ f tlects dinmstif borrowing *nd cretin inflows which are projectedunder thG senwrfo. No additfonas ltfits on financing laposedbut the mechanics of doing so fn the model are straightforward.Exeludes grants.
4/ As uwns that aLl PPG foreign borrowing acrues to the central government.
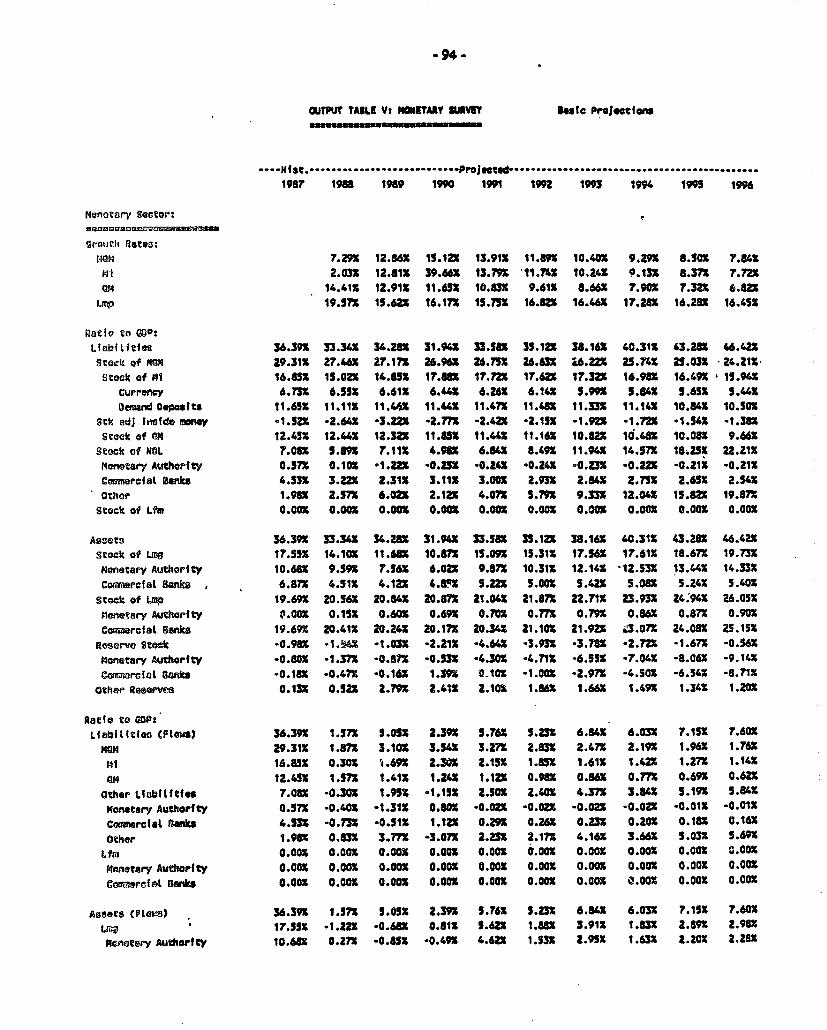
-94-
OUTPUT TAILE V: MOETARY VIr/a BasIc Projections
............................ Projects&----------. ..........................................---..-
1987 198 1989 190 1991 1992 193 19 199 19%
Monotary Sector:
groutih Ratem:
14414 7.29X 12.8" 15.12X 13.91X 11.89M 10.40X 9.M 8.50X 7.84x"Ii 2.03X 12.81t 39.66X 13.792 11.742 10.24X 9.13X 8.37X 7.72xam 14.412 12.91X 11.62 1O.83 9.61X 0.66X 7.90X 7.32X 6.8X
L" 19.57X 15.622 16.17X 15.7S2 16.822 16.46X 17.282 16.282 16.45X
Ratio to CP:Liabilitfot 36.39i 33.3L. 34.28X 31.94X 33.50 35.12X 38.162 40.312 43.28X U.422Stock of WM 29.31 27.462 27.17 26.96X 26.752 26.632 6.Z2X 25.74X 25.032 24.21tXStock of "I 16.852 15.02X 14.855 17.88 17.722 17.622 17.32X 16.982 16.492 15.94X
Currenc 6.73X 6.55X 6.61X 6.442 6.26X 6.14X I.99 5.84X 5.65 5.44XOannd ODposits 11.65X 11.112 11.44X 11."X 11.47X 1148 11.332 11.14X 10.84X 10.50X
Sik adJ inide woney -1.522 -2.643 -3.22 -2.7TX -2.42X *2.15X *1.92X *1.722 -1.542 *1.382Stock of ON 12.45X 12.442 12.32X 11.UX 11.442 11.162 10.8 10.48X 10.082 9.662
Stock of MOL 7.08X 5.M92 7.112 4.982 6.84X 8.49X 11.94X 14.57X 18.252 22.21XMonetary Authorfty 0.57X 0.102 .1.22 0.85X -0.24S -0.242 -0.Z3S *0.222 -0.212 -0.212Comwreat Banks 4.52 3.2 2.312 3.11t 3.002 2.932 2.84X 2.712 2.65X 2.542Other 1.9X2 2.57 6.02X 2.12X 4.071 5.79 9.33X 12.04X 15.8ZX 19.87%
Stock of Lfm 0.00X 0.002 O.OOX 0.002 0.002 0.00X 0.00% 0.00 0.00 0.002
Assets 36.39X 33.343 34.2M2 31.943 33.582 35.122 $8.162 40.312 43.28M *6.422Stock of Lma 17.55X 14.102 11.682 10.87 15.09M 15.312 17.561 17.612 18.671 19.732Monetary Authorify 10.682 9.592 7.562 6.022 9.872 10.31X 12.142 12.53X 13.442 14.332Conerafat Banks 6.872 4.51X 4.122 4.852 5.22X 5.002 5.42X 5.082 S.Z4X 5.402
Stock of Lmp 19.69X 20.5s 20.84X 20.871 21.042 21.87X 22.71t 23.932 24:942 26.05XMnetary Authority 0.002 0.152 0.60X 0.692 0.70M 0.77S 0.79X 0.862 0.87X 0.902Comrcfal Banks 19.692 20.41X 20.24X 20.171 20.343 21.10S 21.92X 3.07X 24.08X 25.15X
Reservo Stock -0.98X -1.X42 -1.032 -2.212 -4.64X 3.932 -3.72 -2.722 -1.67X -0.56214mneary Authorifty -0.80X -1.371 -0.8 -0.532 *4.30 -4.71tX -6.552 -7.042 -8.062 -9.142
Coamreiot Banks -0.1JX -0.47X -0.162 1.39S 0.102 -1.002 -2.97X -4.502 -6.542 -8.71t
Other Reserves 0.13X 0.522 2.792 2.41X 2.10X 1.862 1.6" 1.492 1.342 1.202
Ratio to GOP:Lfabifitiet (Fltes) 36.392 1.57X .052X 2.392 5.7r6 .232 6.842 6.032 r.t5s 7.602
man 29.31X 1.8 3.102 3.54X 3.271 2.832 2.47X 2.192 1.96 1.762MI 16.852 0.302 '1.69X 2.302 2.152 1.852 1.61X 1.42X 1.27X 1.14Xan 12.452 1.571 1.412 1.24X 1.12X 0.982 0.862 0.772 0.69X 0.62X
Other LlabititleS 7.082 -0.302 1.95S -1.15S 2.502 2.402 4.372 3.842 S.19X 5.842Monetary Authorfty 0.571 *0.402 -1.312 O.8OX -0.022 -0.022 -0.02Z -0.02X -0.012 -0.O1X
COmrecal BJns 4.532 -o.ns -0.512 1.12X 0.292 0.26X 0.232 0.202 0.182 0.16XOther 1.982 0.832 3.772 -3.07X 2.232 2.171 4.162 3.66X 5.032 5.69X
Ltm O.OO 0.002 0.002 0.00% 0.00 0.002 0.00o 0.002 0.0OX o0.00ox
monetary Authority 0.002 0.002 0.002 0.002 0.002 0.002 0.002 0.002 0.002 0.002
eooMarcia Banks 0.002 0.002 0.002 0.002 o.0o0 0.00x o.0ox 0.002 0.00x 0.00x
Assets (Ptlois) 36.392 1.5n1 5.052 2.392 5.762 5.23X 6.842 6.03S 7.15X 7.60XLrv 17.552 -1.222 -0.68X 0.81X 5.62X 1.882 3.912 1.832 2.892 2.982Ulcntary Authorf ty lO.682 0.27 -O.85X -0.492 4.622 1.532 2.95X 1.632 2.20S 2.28X
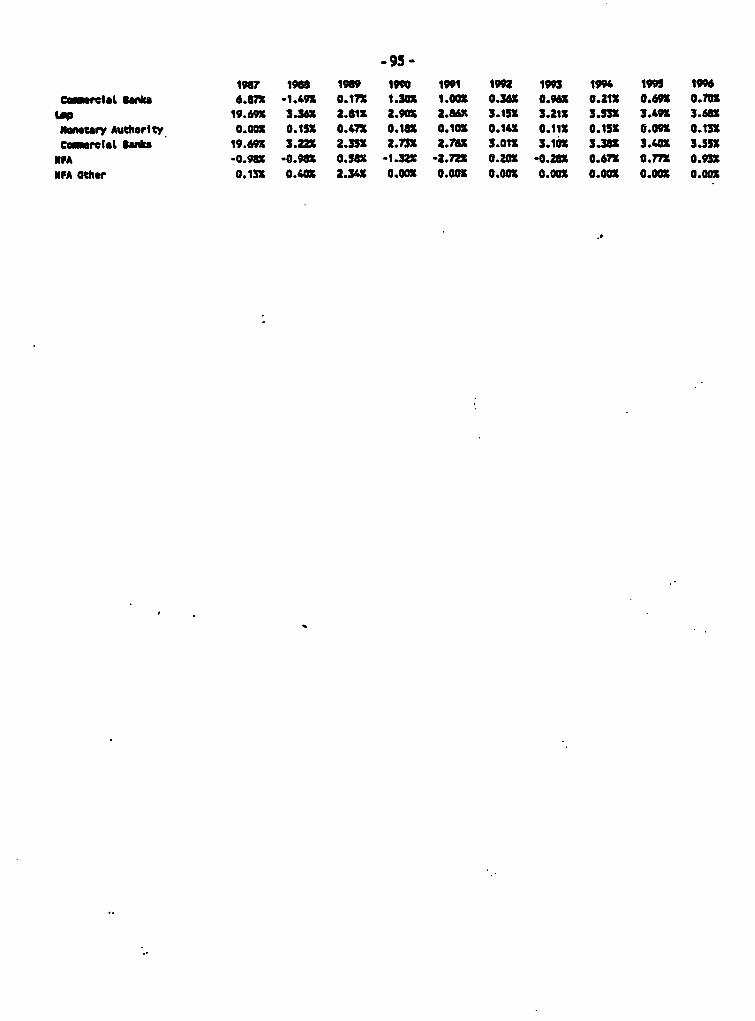
-95 -
1987 196 1969 10 1991 1992 199 199 1995 1996Camerlet Um*k 6.87 -1.493 0.173 1.302 1.OOX O.3X 0.963 02tX 0.693 0.73
LOP 19.693 3.3 2.613 2.903 2.M 3.15 MI.21S 3.3 3.49 3.68XN1ntuy Authtorfty 0.OOX 0.153 0.473 0.18X 0.103 0.13 0.113 0. 153 0.09 0.133C rtlot 1u 19.693 3.=; 2.353 2.7 2.763 3.013 3.103 3.8 3..03 3.552
IP *0.9.3 -0.9 0.S8 -t.= -2.7 0.2 -0.283 0.673 0.77 0.932NrA Other 0.13x 0.40x 2.31X O.OOX O.OX 0.00 0.00 O.OOX 0.00 0.003
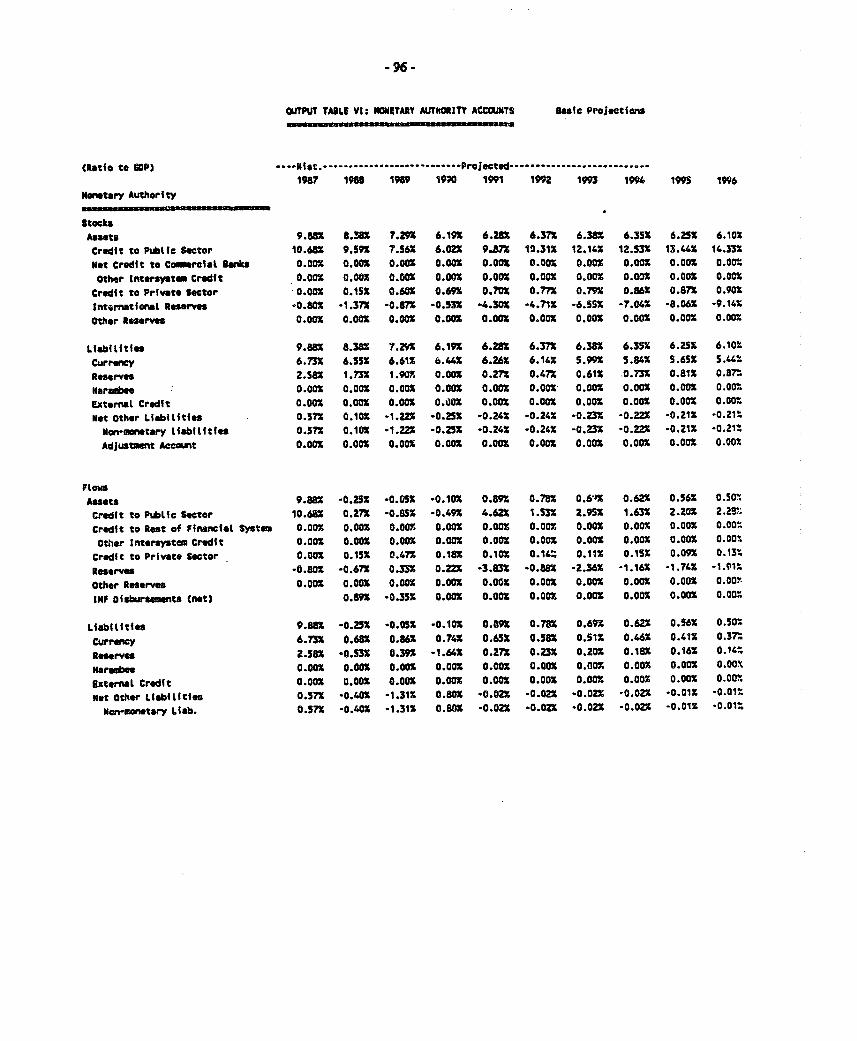
-96-*
OUTPUT TABLE VI: NOETAtY AUTNORITY ACCOUTS Basic Projection
(Ratio to GOP) .-.. Hist............................Projted-------------------- ---1987 191 1989 1950 1991 1992 1993 1994 1995 1996
Nonery Authority
StocksAssets 9.818 8.362 7.29S 6.19X 6.211 6.372 6.382 6.35X 6.25S 6.102Credit to Pubilc Sector 10.682 9.592 7.56X 6.02X 9.87 13.312 12.14 5 12.3 13.42 14.332met Credit to Commrcial Banks 0.0 0.002 o.oox 0.002 0.002 0.00% 0.002 0.002 0.002 0.00o.Other Intersstm Credit 0.00% 0.0o0 0.002 0.002 0.002 0.002 0.002 0.002 0.00o o.002
Credit to Private Sector O.002 0.152 0.60X 0.692 0.702 0.77X 0.792 0.86X 0.872 0.902InternatiamL Resees .0.802 -1.37X -0.872 -0.532 -4.30X -4.712 -6.55X -7.04X -8.06X -9.14SOther Resrves 0.002 0.002 0.002 0.002 0.002., 0.002 0.00 0.002 0.002 0.00.
Lfabitities 9.UX 8.38X 7.29X 6.19X 6.282 6.372 6.382 6.35X 6.252 6.10%Currency 6.735 6.55X 6.612 6.44X 6.26X 6.142 5.99n 5.84X 5.65X 5.44"Resrves 2.58X 1.731 1.905 0.00 0.27S 0.47X 0.61X .0.735 0.81t 0.872Harbee 0.00o 0.00o 0.002 0.00% 0.00o 0.001 0.002 0.002 o.o00 0.002External Credit 0.002 0.00% 0.00 O.OOX O.OO 0.002 0.002 0.002 0.00 0.00,.Met Other Liabilities 0.572 0.102 -1.222 -0.25X -0.24X -0.242 -0.23 -0.222 -0.21t -0.21%
Mon-onetary liabilities 0.57X 0.102 -1.222 -0.252 -0.24X -0.24X -0.232 -0.222 -0.21t -0.21%Adjustmnt Accomt 0.002 0.002 0.002 0.002 0.00 O.002 0.002 0.002 0.002 0.00%
PlowAssets 9.882 -0.25S -0.052 -0.10X 0.89M 0.78X 0.6&M 0.622 0.562 0.50!,Credit to Pubtlc Sector 10.682 0.27X -0.852 -0.492 4.62X 1.532 2.95X 1.632 2.202 2.25V;Credit to Rest of Financall System 0.00 0.00% 0.00 0.00 0.00 0.00 0.00 0.002 O.OO 0.00OtSher Intersystem Credit 0.002 0.002 0.002 o.o00 o.00x 0.002 0.002 0.002 0.002 0.002
Credit to Private Sector 0.002 0.152 0.472 0.182 0.102 0.14% 0.112 0.15% 0.092 0.13:Reserves -0.802 -0.67Z 0.332 0.222 -3.831 -0.882 -2.362 -1.16X -1.742 -1.012Other Reserves 0.002 0.002 0.002 0.002 0.002 O.OOX 0 0.00 0.002 0.002 0.00?IMf Disburssmnts (not) 0.892 -0.352 0.002 0.002 0.002 o.oo0 0.00% o.oo0 0.002
Liabilities 9.88X -0.232 -0.052 -0.10 0.892 0.782 0.692 0.62S 0.56X 0.502currecy 6.732 0.682 0.862 0.74b 0.65X 0.58X 0.512 0.4"% 0.412 0.372Resrve 2.58X -o.532 0.392 -1.64X 0.27X 0.232 0.20X 0.18X 0.161 0.14%Hordue 0.00 0.002 0.002 0.0OX O.OO 0.00 0.00no 0.00o 0.002 0.00oExternal, Credit 0.00o O.002 0.o00 0.00% 0.00o 0.00o 0.002 0.00o 0.00o 0.00%Met Other tiabilfties 0.572 -0.402 -1.312 0.801 -0.022 .0.022 -0.02X -0.022 -0.01X -0.01%
Mon-m5tary Liab. 0.57X -0.402 -1.31t 0.802 -0.022 -0.022 -0.02X -0.02X -0.01 -0.01%
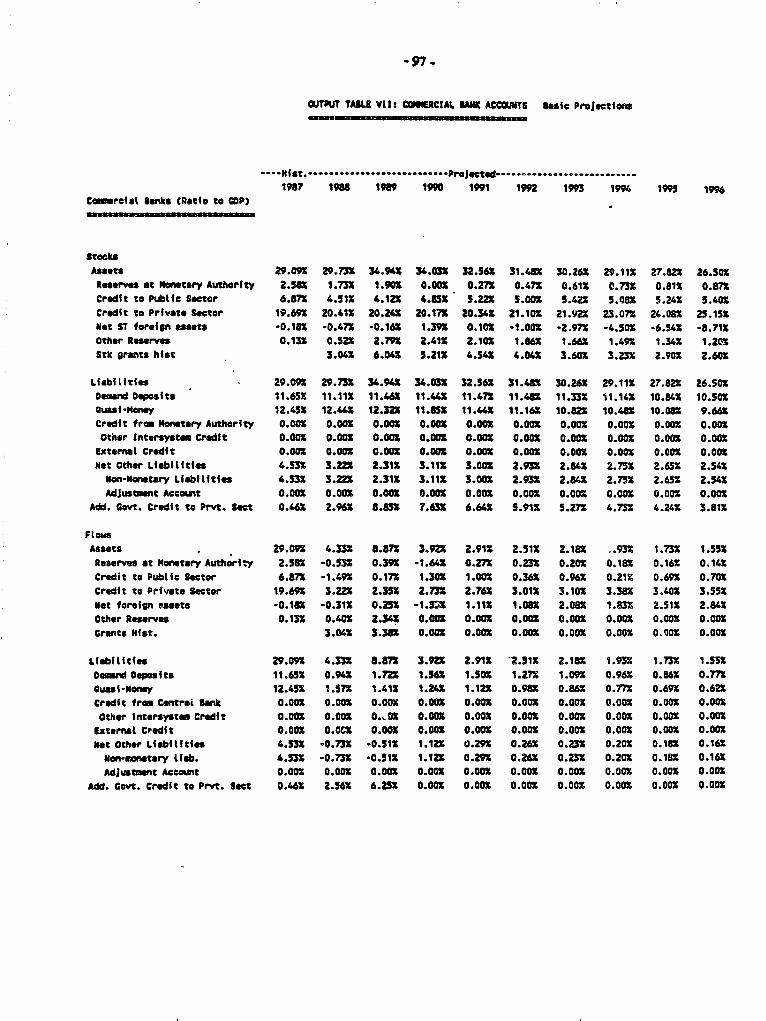
-97-
UTPUT TABLE VII: ChEERCIAL ANK ACCOMIS asic Projections
"fa ............................ Projetzd ------- **---------------
1967 196 1969 1990 1991 192 l19 1994 1995 1994Coinrcla Banks (Ratio to COP)
StocksAssets 29.09X 29.731 34.941 34.03M 32.562 31.48X 30.26X 29.11X 27.82s 26.50.Resrs at Metary Authrifty 2.58S 1.731 1.90X O.X 0.27o 0.47X 0.61X 0.731 0.81a 0.8Credit to Pulic Sector 6.87 4.51X 4.121 4.851 5.221 5.001 S.42X 5.081 5.24x 5.40xCredit to Privat Sector 19.691 20.411 20.24X 20.17X 20.34X 21.101 21.924 23.071 24.081 25.15SNot ST foreign assets -0.186 -0.47X -0.16X 1.39X 0.l01 -1.001 -2.97S -4.50s -6.54S -8.71XOther R re 0.131 0.52x 2.791 2.41X 2.10S 1.86 1.662 1.491 1.34X 1.20QStk grants hist 3.04S 6.04X 5.21X 4.542 4.041 3.601 3.23z 2.901 2.60s
Liabilities 29.09s 29.73X 34.942 34.031 32.561 31.481 30.261 29.111 27.82s 26.50SDow Deposits 11.651 11.11X 11.461 11.4% 11.471 11.481 11.33X 11.141 10.841 10.501ausfi-Monsy 12.45s 12.44Z 12.321 11.851 11."4 11.16X 10.821 10.481 10.081 9.66sCredit from Monetary Authority 0.001 0.01X 0.010 0.001 0.001 0.00% 0.001 0.00% 0.00% 0.00%Other Intersystm Credft 0.00X 0.001 0.00X 0.00X 0.00S 0.00X 0.00X 0.00X 0.00X 0.00%
External Credit 0.00% 0.00K O.0X 0.00 0.00% 0.00% 0.0OO 0.00% 0.00X 0.00XNost Other Liabilities 4.5 3.221 2.31X 3.111 3.001 2.931 2.841 2.751 2.651 2.542
Non-Metary Liabilfties 4.53x 3.22x 2.31X 3.11Z 3.00% 2.931 2.841 2.75 2.651 2.542Adjustmnt Account 0.001 0.001 0.001 0.001 0.001 0.001 0.001 0.001 0.001 0.001
Add. Govt. Credit to Prvt. Sect 0.46 2.962 S.8 7.631 6.64 5.911 5.271 4.731 4.241 3.811
FloisAs"ts , 29.091 4.331 8.871 3.9 2.911 2.511 2.181 ..931 1.731 1.551Reserves at Monetary Authority 2.581 -0.5 0.391 -1.641 0.271 0.2 0.201 0.181 0.16% 0.141Credit to Pubtic Sector 6.871 -1.491 0.171 1.301 1.001 0.362 0.962 0.211 0.691 0.701Crdift to Private Sector 19.691 3.221 2.351 2.731 2.762 3.01X 3.101 3.381 3.401 3.551Net foreign mets -0.181 -0.311 0.251 -1."j 1.11S 1.081 2.081 1.8 2.51 2.841Other Rerves 0.U13 0.401 2.34X 0.001 0.001 0.001 0.001 0.001 0.001 0.001Grants Mist. 3.042 3.381 0.001 0.001 0.001 0.00X 0.001 0.00X 0.001
Liabilities 29.091 4.33 8.71 3.921 2.911 2.511 2.181 1.931 1.731 1.551Domnd Deposits 11.651 0.942 1.721 1.56 1.50X 1.271 1. 0.96 o.86 0.m
uasi-Money 12.451 1.571 1.411 1.242 1.121 0.981 0.86 O0.7 0.697 0.621Credit from Cntrae SBran 0.001 0.001 0.001 0.001 0.001 0.001 0.00X 0.001 0.001 0.001Other Intersystem Credit 0.001 0.001 0. 01 0.001 0.001 0.001 0.001 0.001 0.001 0.001
Externat Credit 0.001 0.OCS 0.001 0.001 0.001 0.001 0.001 0.001 0.00X 0.001Met Other Liabftities 4.m -0.731 -0.511 1.12 0.21 0.26 0.231 0.201 0.181 0.162
Non-matery tlib. 4.53 -0.731 -0.511 1.12 0.2M 0.26 0.231 0.201 0.181 0.161Adjustmnt Arcout 0.001 0.001 0.001 0.001 0.001 0.001 0.001 0.00% 0.001 0.001
Add. GoVt. Credit to Prvt. Sect 0.461 2.56 6.251 0.001 0.00% 0.001 0.001 0.001 0.00 0O.001
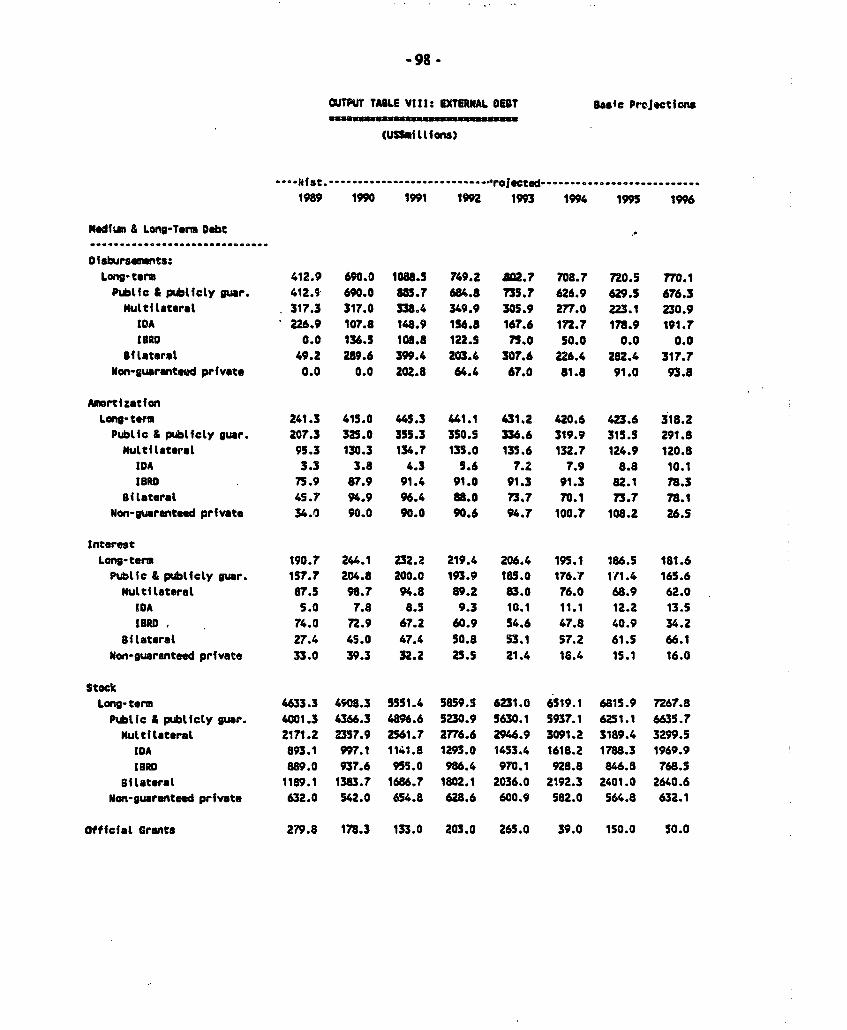
-98 -
OUTPUT TABLE VIII: EXTERNAL OEBT Uac Projections
CUSSMilLions)
............................. Volected -------------------------
1989 1990 1991 1992 l993 1994 1995 1996
Nedium & Long-Term Debt..............................
Ofsbursemcnts:
Long-tarm 412.9 690.0 1088.3 749.2 802. 708.7 720.5 770.1
Publfc & publicly gar. 412.9 690.0 883.7 684.8 733.7 626.9 629.5 676.3
multilateral 317.3 317.0 338.4 349.9 305.9 277.0 223.1 230.9
IDA 226.9 107.8 148.9 156.8 167.6 172.7 178.9 191.7
IZRD 0.0 136.5 108.8 122.3 7n.0 30.0 0.0 0.0
tilateral 49.2 289.6 399.4 203.4 307.6 226.4 282.4 317.7
Non-uarented prlvate 0.0 0.0 202.8 64.4 67.0 81.8 91.0 93.8
Amortizat ion
Lag-term 241.3 415.0 445.3 441.1 431.2 420.6 423.6 318.2
PubLic & publicty gur. 207.3 325.0 355.3 3S0.5 336.6 319.9 315.5 291.8
Multilteral 95.3 130.3 134.7 135.0 133.6 132.7 124.9 120.8
IDA 3.3 3.8 4.3 5.6 7.2 7.9 8.8 10.1
IBRD 73.9 67.9 91.4 91.0 91.3 91.3 82.1 78.3
SilateraL 45.7 94.9 96.4 88.0 73.7 70.1 73.7 78.1
Non-guaranteed private 34.1 90.0 90.0 90.6 94.7 100.7 108.2 26.5
InterestLong-term 190.7 244.1 232.2 219.4 206.4 195.1 186.5 181.6
Public & pubttcly guar. 137.7 204.8 200.0 193.9 185.0 176.7 111.4 165.6
MuLtiltteral 87.5 98.7 94.8 89.2 83.0 76.0 68.9 62.0
IOA 5.0 7.8 8.3 9.3 10.1 11.1 12.2 13.5
IBRD 74.0 72.9 67.2 60.9 54.6 47.8 40.9 34.2
Bilateral 27.4 45.0 47.4 30.8 53.1 57.2 61.5 66.1
Non-guaranteed private 33.0 39.3 32.2 25.5 21.4 18.4 15.1 16.0
StockLong-term 4633.3 4608.3 3331.4 5859.5 6231.0 6319.1 6813.9 7267.8
Publfc & publicly gwar. 4001.3 4366.3 4896.6 5230.9 5630.1 5937.1 6251.1 6635.7
MultiLfatral 2171.2 2337.9 2561.7 2776.6 2946.9 3091.2 3189.4 3299.5
IDA 893.1 997.1 1141.8 1293.0 1453.4 1618.2 1788.3 1969.9
IBRO 889.0 937.6 955.0 986.4 970.1 928.8 846.8 768.5
BiLateral 1189.1 1383.7 1686.7 1802.1 2036.0 2192.3 2401.0 2640.6
Non-guaranteed prfvate 632.0 542.0 654.8 628.6 600.9 582.0 564.8 632.1
Official Grants 279.8 178.3 133.0 203.0 263.0 39.0 150.0 50.0
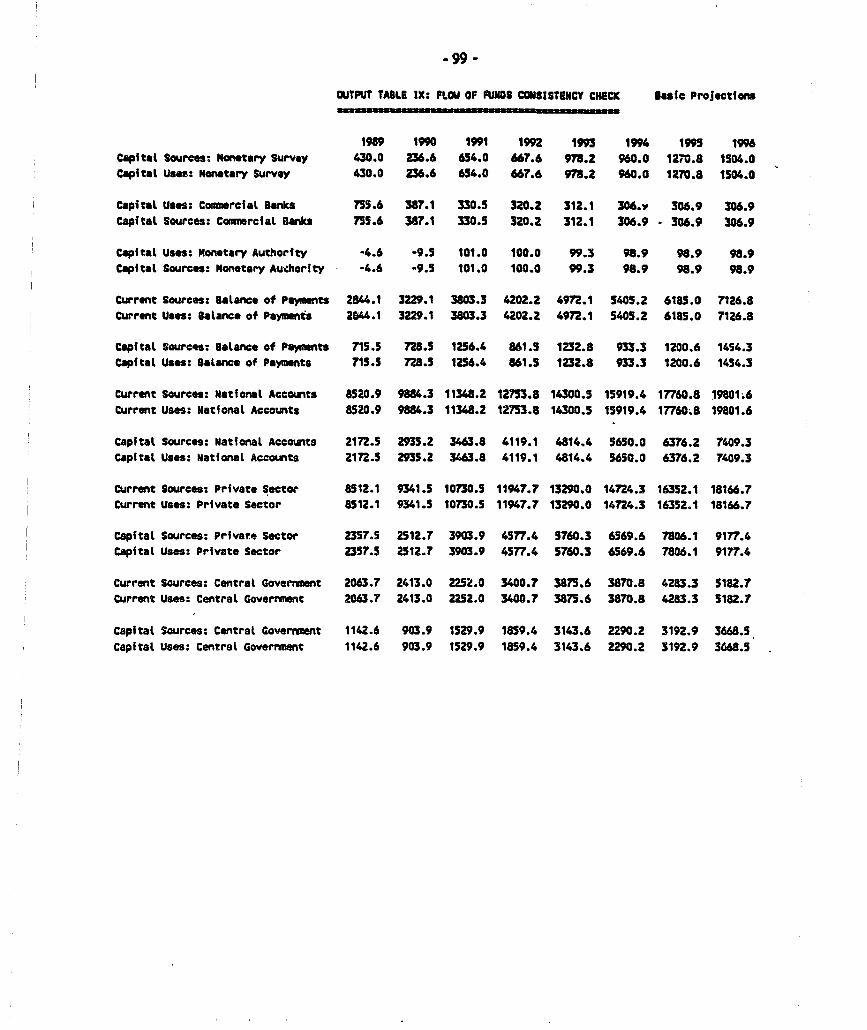
-99 -
OUTPUT TASLE IX: FLOW OF FUNDS CONSISTENCY CHECK BaSic ProJect10ns
198 1990 1991 1992 1993 1994 199S 1996
Capital Sources: Monetary Survey 430.0 236.6 634.0 "67.6 978.2 960.0 1270.8 1504.0
Capital Us": Montary Survey 430.0 236.6 654.0 "67.6 978.2 960.0 1270.8 1504.0
Capital Uses: Cm rcial Banks 755.6 387.1 330.5 320.2 312.1 306.Y 306.9 306.9
Capital Sources: CoamrciaL Banks 755.6 387.1 330.5 320.2 312.1 306.9 . 306.9 306.9
Capital Uses: Monetary Authority -4.6 -9.5 101.0 100.0 99.3 98.9 98.9 98.9
Capital Sources: Monetary Audiornity -4.6 .9.5 101.0 100.0 99.3 98.9 98.9 98.9
Current Sources: Baalnce of Pyo nts 21844.1 3229.1 3803.3 4202.Z 4972.1 5405.2 6185.0 7126.8
Current Usos: Batance of Paymnts 2844.1 3229.1 3803.3 4202.2 4972.1 5405.2 6185.0 7126.8
CapitaL Sources: BaLance of Payants 715.5 728.5 1256.4 861.5 1232.8 933.3 1200.6 1454.3
Capital Uses: Balance of Paymnts 715.5 728.3 1256.4 861.5 1232.8 933.3 1200.6 1454.3
Current Sources: National Accounts 8520.9 9884.3 11348.2 127.8 14300.5 15919.4 17760.8 19801.6
Current Uses: NationaL Accounts 8520.9 9884.3 11348.2 12753.8 14300.5 15919.4 17760.8 19801.6
CapitaL Sources: National Accounts 2172.5 2933.2 3463.8 4119.1 4814.4 5650.0 6376.2 7409.3
Capital Uses: National Accounts 2172.5 2935.2 3463.8 4119.1 4814.4 5650.0 6376.2 7409.3
C-urrent Sources: Private Sector 8S12.1 9341.5 10730.5 11947.7 13290.0 14724.3 16352.1 18166.7
Current Ures: Private Sector 8512.1 9341.5 10730.5 11947.7 13290.0 14724.3 16352.1 18166.7
Cuprtat Surces: Private Sector 8517.5 251..7 3903.9 177.4 571 0.3 6569.6 7816.1 9177.4
CapitaL Uses: Private Sector 23S7.5 2512.7 3903.9 4577.4 5760.3 6569.6 7806.1 9177.4
Current Sces: Pintrat Sove nmeo t 2063.7 2513.0 39.0 3400.4 3875.6 3870.8 4283.3 5182.7
Current Usoes: Central Government 2063.7 2413.0 22S2.0 3400.7 3875.6 3870.8 4283.3 5182.7Curapta USoures: Central Goverent 2063.6 2413.0 22529.0 340.7 3875.6 3870.8313.3 5682.5
CapitaL Sources: Central Goverrvwnt 1142.6 903.9 1529.9 1859.4 3143.6 2290.2 3192.9 3668.5
capitaL Uses: Central Goverret 1142.6 903.9 1529.9 1859.4 3143.6 2290.2 3192.9 368.5
100-
ANNEX V
TIME BOUND FORMULAE
Ad4 g crdt to pnt hist =BEGIN(f1987J,Adj gvt cr* fo prt,3),0Adj Ipg PnvCap U=BEGIN([1987] TotPrPCapS-Lpg-NOLg-Curr-NOLc-DD-Q&-Ip-NOLd,3)ADJ TRADE FOR NA =BEGIN(j7987J.BOP IMPORTS NFS-H Do Imp Nft +BOP EXPOR7S
NFS-H Dol Exp Nfs,3, 0Cg = H Cg;VALUE((MSUM(BEGIN([l9871.H Cg.3))f7'UM(BEGNI(fl987J,0.65*
FYFAEXPl.1 +0.35*NEX(FYFAEXPI.1),3))).f19901)*(z fyfaexpI.7)coef imp food = VALUE((7SUM(BEGIN((1987JDol Imp Food,3))MUM(BEGIN(fl987J,Dol
Imp,3))),[19891)coef inp govt=VALUE((fSUM(BEGIN([1987J,Dol Imp Gow.3))1nUM(BEGIN([1987J,Dol
Imp.3))),[19891)coef imp leases= VALUE(LUM(BEGIN([1987J,Dol Imp Leases,3))rISUM(BEGIN([1987J,Dol
Imp,3))),f19891)coef imp manu mnt=VALUE(h7VUMfBEGIN([1987L,Dol Imp Manu
Inr,3))2SUM(BEGIN([19871,Dol Imp,3)))(fl989]J)coef inp nfs = VALUE((ZSUM(BEGIN(fl9871,Dol Imp Nft,3))JUM(BEGIN(l987,Dol
coef imp pet= VALUE ((7tLSM(BEGIN(fl987J,Dol Imp Per,3V)fTUM(BEGIN([1987J,Dol Imp,3))),fl989J)
coef imp prim int= VALUE((TUM(BEGIN(f1987J,Dol Imp Prim Int,3))1UUM (BEGIV([198 7,Dol Imp,3))),(19891)
d Adj gvt crdt to prt=BEGIN(f1987J,Adj gvt crdt to prvt/GDP,3), 0d Adj gvr crdt to prvt hist. =BEGIN([1987j,Adj gvr crdt to prvt/GDP,3);Jd CMSRd =BEGIN([1988(, (K Sd-VALUE(K Sd,[19871J))/(K GDP-VALUE(K GDP,[1987j)))d CMSRp =BEGIN([19881, (K Sp-VALUE(K Sp,fl9871))/(K GDP-VALUE(K GDP,f1987J)))d CMSRp PC=BEGIN(f19881,(K SpiPop Index-VALUE(K Sp,f19871))/(K GDP/Pop
Index-VALUE(K GDP,fl9871J)))d Q Index=K Cp/VALUE(K Cp,[19871)d Res= BEGIN(j7987],RES M4/GDP,3),Res/GDPd Sp Index=K SpIVALUE(K Sp,f198 7 J)d Stk Res =BEGIN(f1987J, CUM(RES MA)/GDP,3).(PREVIOUS(STK RES MA) +Res)/GDPdol imf disbursements net hist=BEGIN(p1987],dol iffdisbursemenas net,3);0dol imf disbursements net proj=BEGIN(f1987J,0,3);dol imf disbursements netHNFAd =BEGIN([1987J,TotBOPCapU-NFAof-Sf-NFAcb,3)H NOLg =BEGIN([1987J,Lmg +Lmp +NFA +NFAd-MQM-NOLc-NOL4-Lfin,3)Ig = BEGIN([1987J,H Ig,3):(((VALUE(7SUM(BEGIN([1987J,H IgIP Exch Rate,3))17SUM
(BEGIN([1987J,Dol Imp Gow++Dol Lfg.3),[17989J)))*(Dol Imp Govt+Dol Lfg)*PExch Rate) + increase in stock
IntReal =BEGIN(f1987], (1 +H !ntNom)/(1 1 GDPDefGR)-1,3),,z IntRealK IpGR= BEGIN([1987J,PCT7K Ip),3)PBEGIN([1990J, ( +coef Ip IntLoan Reals
(IntLoan Real-PREVIOUS(IraLoan Real)))*1 +coef Ip GDP*K NAGNP1 gr)-1) +kipgr stock
- 101 -
Ldp = BEGIN([1987],IF((MODBA3. 3)120= #BLANK, #BLANK, (MODBA3.3-PREVIOUS(MODBA3.3))120)-Lcp,3);VALUE(dp/llp,1989J)*Ip
Lpg,;VALLUE fYSUM(BEGIN([1 98 7].Lpg,3))P7SUM(BE GIN([19871. GDP.3)))f,l989*GDPntfa proj =BEGIN([1987],0,3);:NFAnfad proj =BEGIN([1987J,0,3),BEGIN([1990J,NFAd)Ngm&Ngp = H Ngm&Ngp;VALUEWl7UM(BEGIN(jl987JH Ngm&Ngp,3))17SUM(BEGIV
([19871,z INTgp,3)V),[1989J)*z I.NTgp *OthRR=IF(VEXT(F YFATAX2.)=#BLANK. VALUEf-(7SUM(BEGIN([19871,0.65*FYFATAX. +N
EXTT(FYFATAX2.) *0. 35,3))/7SUM(BEGIN([19871J GDP,3)))[f989J)*GDP,0.65*FITATAX2. +0.35NEXT(FYFATAX2.);VALUE((TSUM(BEGIN(fl987J0.65*FYFATAX. +NEXT(FYFATAX2.)*0.35,3))17SUM(BEGIN([19871, GDP,3))).[19901)*GDP)
psbr proj =BEGIN([1987],0,3),BEGIN([19901,PSBR)RES MA =H Res ma;VALUE((7SUM(BEGIN([1987J,H Res ma,3))1fSUM(BEGIN
([1987],Res,3))) .[19891) *ResStk adj inside money =BEGIN([19871,Stk Ml-Stk Curr-Stk DD,3),PREVIOUS(Stk adj Inlde
money)Stk Lgp =H Stk Lgp:BEGIN([1990], VALUEf((TSUM(BEGIN([1987,5Stk
Lgp,3))/7SUM(BEGIN([1987]. GDP,3))),[19891J)GDP)srk nfaof=BEGIN([1987J,PREVIOUS(stk nfaofl +NFAqof,3) PREVIOUIS(stk nfaof)-NFAofStk NMLc=Stk NOLc Base-Srk Adj Acac Base; VALUE((7SUM(BEGIN([19871,Stk
NMLc,3))/7SUM(BEGIN([1987J,Stk QM,3))),[19891)*Stk QMSubg = H Subg;VALUE((TSUM(EEGIN([1987J,H Subg,3))17SUM(BEGIN([1987J,
GDP,3))),[19891)'K NAGNPI *P ImplGDPDef87Target NFA accumulation K! proj =BEGIN([1987J,0,3);Targe. NFA accumudadon KZTd= H Tx *H 1t;((VALUE((7SUM(BEGIN(119881,Td,2))VSUM(BE IN
[f19S88J.GDP,2),719891J)*K NAGNPI P ImplGDPDeJ87)+adj to tdTgp = H Tgp;VALUE((7SUM(BEGIN([19871,H Tgp,3J))7SUMlfBEGIN(fl987j.H
GDP,3))),!19891)*GDPTotBOPCapS=BEGIN([19871,NFAcb +NFAof+Sf+A(FAd,3);-NFAof+Sf-NFAcbTotBOPCapU=BEGIN([19871,Lfg+LSfg +Lfc+Lfd+Lfp+DFI+LSfp+Knei,3):BEGIN
([19901,Lfg+LSfg+Lfc+Lfd+Lfp+DFI+LSfp+Knei)+Grants+dol znf disbursementsner*P Exch Rare
TotCombkCapS=BEGIN([1987j,Lcd FF+Lcd Oth+DD+QM+NOLd+Lfd+Adjgvt crdt toprvr hisr. ,3),Lcd FF+Lcd 0th +DD + QM+NOLd+Lfd
TotComBksCapU=BEGIN([19871,Ldg +Res +Inv+Ldp +NFAof+NFAd +grantshisr,3),Ldg +Res +Inv+Ldp-NFAof
TotGovCapS=Sg +Lcg +Ldg +NOLg +Lpg +Lfg +LSfg +Adj lpg PrivCapU+ GrantsTotGovCapU=BEGIN([1987],H Ig+H Lgp+Adj gvt crdt to prvt,3),Ig+Lgp+Adj gvt cred toTotMonCapU=BEGIN([19871,Lcg +Ldg +Lmp +NFAcb+NFAof+NFAd,3),BEGIN(fl9901,Lcg
+Ldg +Lmp +NFAcb +NFAof+NFAd)TotPriCapS=BEGIN([19871,Sp +Lgp +Lcp +Ldp +lfp +DFI+LSfp +Knei,3);Sp +Lgp +Lcp +L
dp+Lfp+DFI+LSfp+Knei+NFA-Dol Lfg Gapfil*PExch Rate+dol lmf disbursements ner*P Exch Rate+Target NFA accumuladon KI-PSBR
TotPriCapU=BEGIN([19871,Lpg + Curr+NOLc +DD +QM+Ip +NOLd+NOLg +AdJ IpgPrivCapU,3),BEGIN([1990J,Lpg + Curr+NOL +DD + QM+lp +NOLg)
z Dol INTlVFAcb = z Dol INTLibor,VALUE(z Dol IN7Libor-TAVG(BEGIN(fl987J,DolNNFAcb,3))/TAVG(BEGIN([19871,Ssk Dol NFAcb,3)),[19891)
z Do! Knei= VALUE((MSUMBEGIN(fl987J,Dol Knei.3))/7SUM(BEGIN([V987Lz DoiLfg,3))),[1989])Yz Dol Lfg
- 102 -
z Dol 4pmDRISDI.12dram-DRSAM.I.I,mgp- gpeBEGINf19877 ,Dol4fto,3))j)7989J)))*Dol lfto)z Dot L BEGEV9700, ((MLUE(rMUM(BEGIN((1987JDol L$fp,3))1tlM
(BEGOW(f1987,Dol Lf.3))),j19891)*Dol Lftot)z Dl Prof=VALUE((WJ(BEGI(1987DDol prof,3))nw(BEGlNfj97,Do
DF7,3))),j7J)*Dol DFRf,taxl .2.2 =FffA TAXI 2.2; (7 0.09) (PR O US() mp)2VALUEfATX.2.2/((
PRF.IO USe(mp) + 4 m)1)Z (1 9 901)z a.2 .3- XFYFA TA XI .2.3;VVA L UE (FlA TA XI .2.3/((PE VMO US (Imp) +Imp) /2), ,(7 990])
z fy.2.4=FF TAX .2.4dPRWOUS(jp)+Fp)12* VA LUE(FYATA X 2.4/((PREO US(Ex) +Ekp)/2),l199J)
z fiyfa=w.2Z5.=BEGN(f9JFYFATMML2.5,3), 0

- 103 -
,1 I~~~~~~~RFRENC:ES
Anand, R., and van Wijnbergen, S. (1989), Inflation and Financing of Government Expenditure:An Introductory Analysis with an Applicadon to Turkey. The Wgrld Ban Economic
vi January 1989, Vol. 3, No. 1, pp. 17-39.
Buiter, W. (1985), A Guide to Public Sector Debts and Deficits, Econgmic Plicy. November 1985,Vol. 1, No. 1, pp. 14-79. Camsambas, T. and Pigato, M. (1989), The Consistency ofGovernment Deficits with Macroeconomic Adjustment An Application to Kenya and Ghana.World Bank PPR Working Paper, No. 287.
Catsambas, T., and Pigato, M. (1989), The Consistency of Government Deficits withMacroeconomic Adjustment: An Application to Kenya and Ghana, The World Bank, PPRWorking Papers, No. 287, p. 3,
Chhlbber, A., Cottani, T., Firuzabadi, R. and Walton, M. (1989), Inflation, Exchange Ratesand Fiscal Policy in Zimbabwe, mimeo, World Bank.
Chu, K., Hwa, E.C. and Krishnamurty, K. (1983), "Economic Instability and Adjustment ofImports, Capital Flows, and External Reserves: A Short-Run Dynamic Model," in D). Bigmanand T. Taya (Eds.), Exh e ant d de Sabil Es dRimedia.
Easterly, W., Rwa, E.C., Kongsamut, P., and Zizek, J., "Modeling the MacroeconomicRequirement of Policy Reforms, PPR Working Paper, May 1990.
Faini, R., Pritchett, L. and Clavijo, F. (1988), Import Demand in Developing Countries. WorldBank PPR Working Papers, November.
Ielpman, E., Razin, A., and Sadka, E. (Eds.) (1988), Egonomic, Effet of the GoveMent BAugw.Cambridge, Massachusetts: MIT Press.
Rolsen, J. (1989), "KENYA.MOD: A Simplified Example of RMSM-X," mimeo, May1989.
Kbadr, A. and Schmidt-Hebbel, K. (1989), "A Framework for Macroeconomic Consistency forZimbabwe," PPR Working Paper 310, December 1989.
Khan, M.S. (1975), "Cyclical and Secular Income Elasticides of Demand for Imports," Rlview oEconomics and Statistics, Vol. 57, pp. 351-361.
-104-
Rhan, M.S., (1975), "MTh Structre and Behavior of Imports of Venezuela," RBIwofEoomica and Stitistdis Vol. 57, pp. 221-224.
McKenzie, G.A. (1989), Are All Summary Indicators of the Stance of Fiscal Policy Misleading?f IMF= Sp ege. Vol. 36, No. 4, pp. 743-'70.
Moran, C. (1989), "Imports Under a Foreign Exchange Constrlut," Wodd fank EcoMicReview Vol 3, No. 2, pp. 279-295.
van Wijnbergen, S. (1988), Inflation, Balance of Payments Crium, ad Public Sector Deficits.In Helpman, E., Razin, A. and Sadka, E. (FAs.) (1988), Economig Effectz of the
mmmeg &g. Cambridge, Massachusetts: Mfl Press, pp. 287-309.
World Bank, (1990), Kenya. Stabilizadon and Adjustment: Toward Accelerated Growth. Report No.9047-KE. Washington, D.C.
PRE Working Pa r .eries
ContactJJUE Author for paer
WPS742 The Cost of the District Hospital: A. J. MillsA Case Study from Malawi
WPS743 Antidumping Enforcement in the Angelika Eymann August 1991 N. ArtisEuropean Community Ludaer Schuknecht 37947
WPS744 Stainless Stee! in Sweden: Anti- Gunnar Fors August 1991 N. Artisdumping Attacks Good International 37947Citizenship
WPS745 The Meaning of "Unfair in U.S. J. Michael Finger August 1991 N. ArtisImport Policy 37947
WPS746 The Impact of Regulation on Dimitri Vittas August 1991 W. PitayatonakarnFinancial Intermediation 37666
WPS747 Credit Policies in Japan and Korea: Dimitri Vittas August 1991 '; PitayatonakarnA Review of the Literature 3,666
WPS7A8 European Trade Patterns After the Oleh Havrylyshyn August 1991 N. CastilloTransition Lant Pritchett 37947
WPS749 Hedging Commodity Price Risks in Stiin Claessens August 1991 S. LipscombPapua New Guinea Jonathan Colenian 33718
WPS750 Reforming and Privatizing Poland's Esra Bennathan August 1991 B. GregoryRoad Freight Industry Jeffrey Gutman 33744
Louis Thompson
WPS751 A Consumption-Based Direct Tax for Charles E. McLure, Jr. August 1991 CECSECountries in Transition from Socialism 37188
WPS752 Inflation and Stabilization in Roberto de Rezende August 1991 L. LyYugoslavia Rocna 37352
WPS753 The CMEA System of Trade and Martin Schrenk August 1991 CECSEPayments: The Legacy and the 37188Aftermath of Its Termination
WPS754 Esti .-.ing Returns to Scale with James R. Tybout August 1991 S. FallonLarge imperfect Panels M. Daniel Westbrook 37947
WPS755 Hedging Crude Oil Imports in Stijn Claessens August 1991 D. GustafsonDeveloping Countries Panos Varangis 33714
WPS756 Taxes Versus Quotas: The Case Arvind Panagariya August 1991 S. Fallonof Cocoa Exports Maurice Schiff 37947
WPS757 Managing the Transition: Enhancing Eric Rice August 1991 P. Infantethe Efficiency of Eastern European 37642Governments
PRE WorkqEPaper Series
ContactJIR Author Dae for paper
WPS758 Is There Excess Co-Movement of Theodosios B. Palaskas August 1991 D. GustafsonPrimary Commodity Prices? A Panos N. Varangis 33714Co-integration Test
WPS759 The Profamilia Family Planning Jesus Amadeo August 1991 0. NadoraProgram, Columbia: An Economic Dov Chernichovsky 31091Perspective Gabriel Ojeda
WPS760 How Conflicting Definit'ons of Alexander J. Yeats September 1991 J. Jacobson"Manufactures" Distort Output and 33710Trade Statistics
W' 1761 Uncertainty and the Discrepancy Gerhard Pohl September 1991 P. Leebetween Rate-of-Return Estimates Dubravko Mihaljek 81950at Project Appraisal and ProjectCompletion
WPS762 Debt, Debt Relief, and Growth: Caniel Cohen September 1991 S. King-WatsonA Bargaining Approach Thierry Verdier 31047
WPS763 A Valuation Formila for LDC Debt Daniel Cohen September 1991 S. King-Watson31047
WPS764 African Financing Needs in the 1990s Jorge CulagovskiVictor GaborMaria Cristina GermanyCharles P. Humphreys
WPS765 Withholding Taxes and International Harry Huizinga Ceptember 1991 S. King-WatsonBank Credit Terms 31047
WPS766 Economic Crisis, Structural Francois Diop September 1991 0. NadoraAdjustment, and Health in Africa Kenneth Hill 31091
Ismail Sirageldin
WP3767 Framework for Macroeconomic Colin A. Bruce September 1991 M. LynciAnalysis (Applied to Kenya) David Ndii 34046


![L'AWi S :138a7 - World Bankdocuments.worldbank.org/curated/en/753431468765038686/pdf/multi0... · [de]centalization by a [de]centralization ratio of taxing or spending powers, i.e.,](https://img.pdfslide.us/doc/110x75/5b92393409d3f2446f8b4624/lawi-s-138a7-world-decentalization-by-a-decentralization-ratio-of-taxing.jpg)