Embed Size (px)
Citation preview

Framework for a conservation plan for the Cape Floristic Region
Main Report December 1999

1
Framework for a conservation plan for the Cape Floristic Region RM Cowling1, RL Pressey2, AT Lombard1, CE Heijnis1, DM Richardson1, and N Cole1
1Institute for Plant Conservation, University of Cape Town 2New South Wales National Parks and Wildlife Services This report contains preliminary data: it may not be quoted nor may any part of it be reproduced A report of the CAPE Project for World Wide Fund: South Africa IPC 9902 December 1999

2
Contents Context 3 Protocol 4 Planning domain 5 Planning units ..7 Biodiversity ..9 Threats 16 Targets 24 Reserve effectiveness 29 Irreplaceability 39 Location and design 45 Implementation 72 Continuity 77 Acknowledgements 78 References 79
3
Context This is a report of the Terrestrial Biodiversity Component of the Global Environmental Facility (GEF)-funded Cape Action Plan for the Environment (CAPE) Project. This component of the Project is being co-ordinated by the Institute for Plant Conservation (IPC) of the University of Cape Town. The report is the Final Report for Phase 1 of the Terrestrial (Module 1) Component. The outcome of Phase 1 is a conservation plan for the Cape Floristic Region (CFR) at the 1: 250 000 scale. Contractual obligation require that the report addresses the following sub-components: • area requirements for mammal conservation • assessment of current conservation status • assessment of threats • identification of priorities • protected area design • guidelines for off-reserve conservation. Aspects of these sub-components have been documented in previous reports submitted to the client (WWF:SA) (Cowling et al 1998, Boshoff and Kerley 1999, IPC 1999a, 1999b, Lloyd et al 1999). Our intention for this report is to provide an explicit and transparent account of the conceptual approach, data and methods for the identification of a notional system of conservation areas for the representation of biodiversity pattern and process in the CFR. Data and analyses that are not directly related to this objective, and that have been reported on elsewhere, are omitted. The report provides as one of many potential options a notional reserve system that will achieve biodiversity pattern and process targets. Aspects of this system represent conservation projects for consideration by Module 3 (Legal, Policy and Institutional Sectors) participants.

4
Protocol In order to fulfill strategic objectives that embody the principles of representivity, complementarity and efficiency, as well as address constraints and options, conservation planning must follow a systematic and transparent process (Pressey 1999a). Such a process is appropriately guided by an explicit protocol. The protocol we followed for this study is outlined in Table 1. Details are given in Cowling et al (1998). Table 1 The protocol for systematic conservation planning in the Cape Floristic Region Step
Action
1
Compile data on pattern (species records, habitats etc)
2
Compile data on processes (and represent spatially where possible)
3
Identify types, patterns and rates of threatening processes
4
Set targets for the representation of pattern
5
Set targets for the representation of processes
6
Lay out options for achieving representation and design targets
7
Locate and design candidate conservation areas for representation of pattern and process

5
Planning domain The planning domain for this study is centered on the Cape Floristic Region (CFR), as delimited by Cowling and Heijnis (subm), an area of 87 892 km2 (Figure 1). The domain encompasses an extension of approximately 60 km beyond the boundaries of the CFR, This was done to accommodate processes that transcend the biophysical boundaries between the CFR and adjacent bioregions (Namaqualand, Tanqua Karoo, Great Karoo etc). The area of the planning domain is 122 590 km2. The CFR has long been recognised as a global priority for conservation action. Owing to its high concentration of endemic taxa, especially of plants and invertebrates, and its vulnerability to processes that threaten this unique biodiversity, the CFR has been identified as a biodiversity hotspot og global significance (Mittermeier et al. 1998). Globally, the region is also listed as a Centre of Plant Diversity (WWF and IUCN 1994), an Endemic Bird Area (Bibby et al. 1992) and a Global 200 Ecoregion (Olson and Dinerstein 1998) The area is home to 1 406 Red Data Book plant species, the highest known concentration of such species in the world (Cowling and Hilton Taylor 1994).

6
Figure 1 The planning domain for the CAPE Project, showing the boundary of the Cape Floristic Region and the extension of the domain into adjacent bioregions.
N
60 0 60 120 Kilometers

7
Planning units Planning units - the units of selection for conservation planning – were established by draping a system of 1/16th degree cells over the planning domain (Figure 2). A 1/16th degree square is approximately 4000 ha in size, depending on its location. The domain included 3218 such cells, 2510 of which fall within the CFR. This resolution was considered appropriate for planning at the 1: 250 000 scale: finer scale units would be constrained by the inevitable inaccuracies inherent in the mapping scale; coarser scale units would encompass too much biophysical heterogeneity.

8
Figure 2 Planning units (1/16th degree cells) used in the CAPE Project.

9
Biodiversity Pattern The biodiversity entity that we used for pattern was the Broad Habitat Unit (BHU) – a land class that is a surrogate for landscape diversity, especially vegetation pattern (Figure 3). The BHUs were derived by intersecting layers of Homogeneous Climate Zones, geology and topography in a geographic information system (GIS). A vegetation type layer (Low and Rebelo 1996) was used to guide the classification under certain circumstances. A total of 16 primary and 102 secondary BHUs were recognized in the greater planning domain. Corresponding figures for the CFR are 15 and 88, respectively. Of the latter, 69 were included in the Fynbos biome, which covered 81.5% of the CFR. A list of BHUs, indicating their unique numbers, together with their biological and biophysical characteristics, is given in Appendix 1. Cowling and Heijnis (subm) provide an account of the derivation of BHUs and their potential application in conservation planning. Process Our intention is to design a notional system of conservation areas that will continue to function ecologically indefinitely, and will continue to sustain evolutionary process that result in lineage turnover. The rationale for this approach – design for persistence - is given in Cowling et al (1998, 1999). In order to incorporate in the conservation plan the ecological and evolutionary processes that maintain and generate biodiversity, we identified a list of such processes that can be located as spatial components (i.e. can be identified on a map). The list is given in Table 2. The spatial surrogates given in Table 2 represent the natural habitat features (area, gradients etc.) required to maintain the corresponding processes. The spatial requirements for different processes may be nested or overlapping in many cases.

10
Figure 3 102 Broad Habitat Units (BHUs) identified for the CAPE Project. Numbers refer to unique codes for each BHU (see Appendix 1 and overleaf for legend). Each polygon represents a separate BHU. See Appendix 1 and Cowling and Heijnis (subm) for details.
3585
77
7535
45
35
75
84
82
84
82
76
78
8310
46
48
10
46 75
47
46
49
3649
10
4
49
11 31
505050
49
4975
4075
31
80
78
79
32
5191
31 929890
98
86
9036 49 79 90
92
90
81
9298
37
6237 984 8690
90 4362 433939
62
31
39 66 436237 62 9898 98 23 9543 2395
99
786888 68
95 2398436639 6252
98976698
53
43
88
62 984388 2343 4462 4497 438944
978938
39 6243
73
26
4443 4489
73
66 899786 39 4497
6661 8967609843
4495
97894 9743 66 97
74 95
97 70721
43 88
87
9231 868624
9497 88
1226 38 42
30412160
4294
2129
213824 102
12
97 8869 7138
302941
30
645964
1003821
100384 100
87 2254
943859
2194 102
2828
10010038
555
341933 93 100101 8
34
100 39620 3 10328 8 910234
318 7 96
33
34
56934 93425 56
1458 92728 14714 341757 776 65 72
166
1813566327
6
15 27 18131 22715 151313

11
Legend for Figure 3.
Humansdorp Grassy Fynbos21
Agulhas Fynbos / Thicket Mosaic6
Albertinia Sand Plain Fynbos14
Algoa Grassy Fynbos22
Ashton Inland Renosterveld38
Blackheath Sand Plain Fynbos12
Blanco Fynbos / Renosterveld Mosaic28
Boland Coast Renosterveld32
Breede Fynbos / Renosterveld Mosaic26
Canca Limestone Fynbos17
Cape Flats Fynbos / Thicket Mosaic5
De Hoop Limestone Fynbos16
Elgin Fynbos / Renosterveld Mosaic25
Elim Fynbos / Renosterveld Mosaic27
Genadendal Grassy Fynbos18
Goukamma Fynbos / Thicket Mosaic8
Hagelkraal Limestone Fynbos15
Hopefield Sand Plain Fynbos11
Keurbooms Grassy Fynbos20
Kouebokkeveld Inland Renosterveld36
Kromme Fynbos / Renosterveld Mosaic30
Langebaan Fynbos / Thicket Mosaic4
Langkloof Fynbos / Renosterveld Mosaic29
Leipoldtville Sand Plain Fynbos10
Matjies Inland Renosterveld39
Niewoudtville Inland Renosterveld35
Overberg Coast Renosterveld33
Perdeberg Fynbos / Renosterveld Mosaic24
Riversdale Coast Renosterveld34
Roggeveld Inland Renosterveld40
South Dune Pioneer2South East Dune Pioneer3
South West Dune Pioneer1
Springfield Sand Plain Fynbos13
St Francis Fynbos / Thicket Mosaic9
Stilbaai Fynbos / Thicket Mosaic7
Suurbrak Grassy Fynbos19
Swartland Coast Renosterveld31
Waveren-Bokkeveld Inland Renosterveld37
Zuurberg Grassy Fynbos23
Addo Xeric Succulent Thicket99
Alexandria Indian Ocean Forest102
Aloes Mesic Succulent Thicket96
Gamka Broken Veld91
Gamtoos Mesic Succulent Thicket94
Garies Broken Veld84
Gouritz Mesic Succulent ThicketSteytlerville Broken Veld92
93
Knysna Afromontane Forest100
Lamberts Bay Strandveld83
Little Karoo Broken Veld88
Loeriesfontein Broken Veld85
Namaqualand Strandveld82
Oudtshoorn Broken Veld89Prince Albert Broken Veld90
Robertson Broken Veld87
Spekboom Xeric Succulent Thicket97
Sundays Mesic Succulent Thicket95
Swellendam Afromontane Forest101
Touws Vygieveld81
Willowmore Xeric Succulent Thicket98
Witrantjies Broken Veld86
Baviaanskloof Mountain Fynbos Complex73
Bokkeveld Mountain Fynbos Complex45
Bredasdorp Mountain Fynbos Complex63
Caledon Swartberg Mountain Fynbos Complex58
Cannaland Inland Renosterveld42
Cape Peninsula Mountain Fynbos Complex55
Cederberg Mountain Fynbos Complex47
Cockscomb Mountain Fynbos Complex74
Franschhoek Mountain Fynbos Complex54
Gifberg Mountain Fynbos Complex46
Groot Swartberg Mountain Fynbos Complex68
Groot Winterhoek Mountain Fynbos Complex51
Hawequas Mountain Fynbos Complex53
Kamanassie Mountain Fynbos Complex70
Kango Inland Renosterveld43
Klawer Vygieveld76
Klein River Mountain Fynbos Complex57
Klein Swartberg Mountain Fynbos Complex66
Knersvlakte Vygieveld77
Kogelberg Mountain Fynbos Complex56
Koo Langeberg Mountain Fynbos Complex60
Kouga Mountain Fynbos Complex72
Laingsberg Vygieveld79
Matroosberg Mountain Fynbos Complex52
Montagu Inland Renosterveld41
Moordenaars Vygieveld80
Olifants River Mountain Fynbos Complex48
Outeniqua Mountain Fynbos Complex69
Piketberg Mountain Fynbos Complex50
Potberg Mountain Fynbos Complex65
Riviersonderend Mountain Fynbos Complex59
Rooiberg Mountain Fynbos Complex67
Southern Langeberg Mountain Fynbos Complex64
Swartruggens Mountain Fynbos Complex49
Tanqua Vygieveld78
Tsitsikamma Mountain Fynbos Complex71
Uniondale Inland Renosterveld44
Waboomsberg Mountain Fynbos Complex61
Western Mountain Vygieveld75
Witteberg Mountain Fynbos Complex62

12
Table 2 Spatial components for ecological and evolutionary processes necessary for biodiversity maintenance and generation in the CFR Process
Spatial components (natural habitat)
Source
Specialist pollinator relationships Small (5-1000 ha) fragments Picker and Midgley (1996), Goldblatt et al (1998), Steiner (1998), Van der Spuy (1999), Colville et al (subm.), Donaldson et al (subm)
Regular, whole-patch fires Small (ca 500-1000 ha) fragments Bond et al (1988)
Plant-herbivore processes involving medium-sized herbivores
Small (ca 1000 ha) fragments in eastern BHUs; larger (ca 5-10 000 ha) fragments in western BHUs
Boshoff and Kerley (1999)
Ecological diversification of plant lineages in relation to fine-scale edaphic gradients
Small (ca 1000 ha) areas of juxtaposed and strongly contrasting edaphic habitats
Cowling and Holmes (1992)
Managed, compartment-based, fire regime
Medium (5000-10000 ha) areas Kruger (1977)

13
Table 2 cont Process
Spatial component
Source
Ecological diversification of plant lineages in relation to mesoclimatic and larger-scale edaphic gradients
Medium (5000-10000 ha) areas that span steep and long edaphic and climatic gradients
Rourke (1972), Williams (1972), Linder and Vlok (1991), Schutte et al (1995), Goldblatt and Manning (1996)
Natural fire regimes Large (50 000-100 000 ha) areas that are remote from human settlement or abut on non fire-prone BHUs
Van Wilgen et al (1992)
Plant herbivore processes involving large herbivores
Large (50 000-100 000 ha) areas Boshoff and Kerley (1999)
Predator-prey processes involving smaller omnivores and predators
Large (50 000-100 000 ha) areas Boshoff and Kerley (1999)
Diversification of plant lineages in relation to macroclimatic and fine-scale geographical gradients
Large (50 000-100 000 ha) areas that encompass maximal heterogeneity
Rourke (1972), Williams (1972), Linder and Vlok (1991), Schutte et al (1995), Goldblatt and Manning (1996)
Plant herbivore processes involving megaherbivores
Mega-sized (250 000-1 000 000 ha) areas
Boshoff and Kerley (1999)

14
Table 2 cont Process
Spatial component
Source
Predator-prey processes involving top predators
Mega-sized (250 000-1 000 000 ha) areas
Boshoff and Kerley (1999)
Inland movement of marine sands and gradients of soil development important for soil-specific plant assemblages and diversification of plant species
Entire sand movement corridors and adjacent habitats
Tinley (1985), Kerley et al (1996), Cowling et al (1999)
Migration and exchange between inland and coastal biotas
Riverine systems that breach the folded belt, thereby linking Karoo basins with interior basins and/or interior basins with coastal forelands
Muir (1929), Geldenhuys (1997)
Faunal seasonal migration Areas spanning lowland-upland gradients Kruger (1977), Rebelo (1992)
Diversification of basal, upland animal lineages in lowland habitats
Areas spanning lowland-upland gradients Endödy-Younga (1988), Coe and Skinner (1992)
15
Table 2 cont Process
Spatial component
Source
Diversification of plant lineages in relation to lowland-upland gradients
Areas spanning lowland-upland gradients Rourke (1972), Cowling (1983), Bruyns and Linder (1991), Manning and Linder (1992), Linder (1995), Linder and Mann (1998)
Diversification of plant lineages in relation to macroclimatic gradients
Large and steep climatic gradients along north-south and east-west axes in lowland and upland regions
Williams (1972), Bruyns and Linder (1991), Manning and Linder (1992), Linder and Mann (1998)
Hydrological regimes Entire catchments
Van Nieuwenhuizen and Day (1999)
Resilience to climate change Large and steep climatic gradients along north-south and east-west axes in lowland and upland regions
Euston-Brown (1995), Rebelo (1991)
16
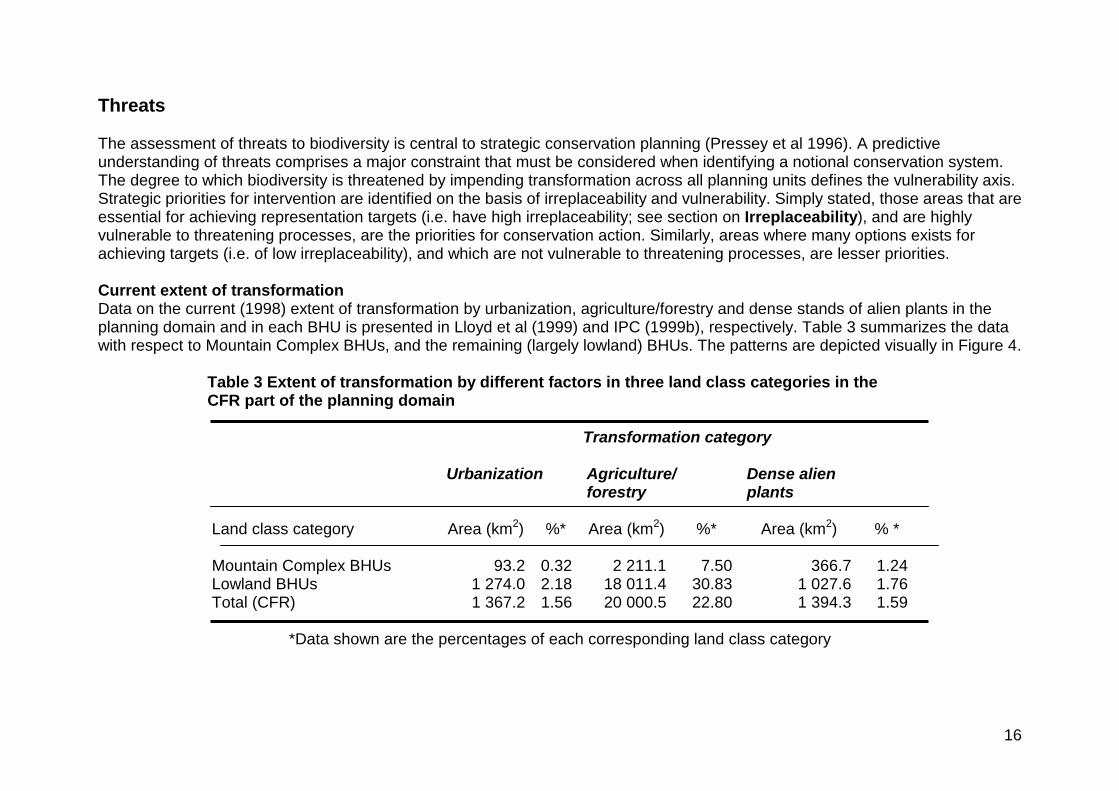
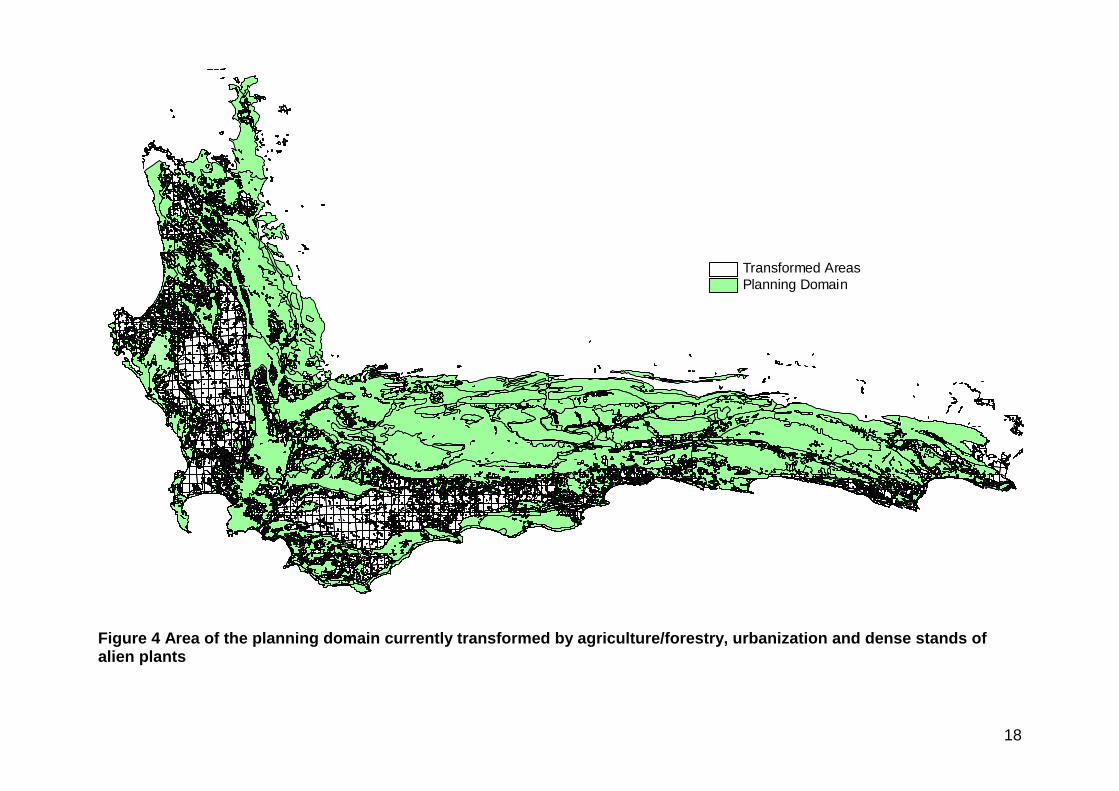
Threats The assessment of threats to biodiversity is central to strategic conservation planning (Pressey et al 1996). A predictive understanding of threats comprises a major constraint that must be considered when identifying a notional conservation system. The degree to which biodiversity is threatened by impending transformation across all planning units defines the vulnerability axis. Strategic priorities for intervention are identified on the basis of irreplaceability and vulnerability. Simply stated, those areas that are essential for achieving representation targets (i.e. have high irreplaceability; see section on Irreplaceability), and are highly vulnerable to threatening processes, are the priorities for conservation action. Similarly, areas where many options exists for achieving targets (i.e. of low irreplaceability), and which are not vulnerable to threatening processes, are lesser priorities. Current extent of transformation Data on the current (1998) extent of transformation by urbanization, agriculture/forestry and dense stands of alien plants in the planning domain and in each BHU is presented in Lloyd et al (1999) and IPC (1999b), respectively. Table 3 summarizes the data with respect to Mountain Complex BHUs, and the remaining (largely lowland) BHUs. The patterns are depicted visually in Figure 4.
Table 3 Extent of transformation by different factors in three land class categories in the CFR part of the planning domain Transformation category
Urbanization Agriculture/
forestry Dense alien plants
Land class category
Area (km2) %* Area (km2) %* Area (km2) % *
Mountain Complex BHUs 93.2 0.32 2 211.1 7.50 366.7 1.24 Lowland BHUs 1 274.0 2.18 18 011.4 30.83 1 027.6 1.76 Total (CFR) 1 367.2 1.56 20 000.5 22.80 1 394.3 1.59
*Data shown are the percentages of each corresponding land class category

17
About 26% of the CFR has been transformed by these three factors (Table 3). The overwhelming factor in terms of extent is agriculture/forestry, especially on the lowlands where 31% of the natural habitat is thus transformed. This form of transformation is concentrated on the mesic and relatively fertile coastal forelands where Coast Renosterveld and Fynbos/Renosterveld BHUs are found (Figure 4). Between 70 and 90% of the four Coast Renosterveld BHUs has disappeared under agriculture. Urban impacts are concentrated in the Greater Cape Town Metropole; the BHUs most affected are Cape Flats (61%), Blackheath (55%) and Cape Peninsula (18%).BHUs in the Port Elizabeth area of the southeastern CFR have also been severely impacted by urbanization: Algoa (26%) and Aloes (24%). Alien plant impacts are most severe on the coastal dune BHUs such as St Francis (54%), South East Dune Pioneer (28%), Aloes (27%) and Goukamma (18%). Future threats We estimated threats associated with agriculture (including forestry), urbanization and alien plants that are likely to materialize over the next two decades. Here we provide a short account of the methods used (excluding technical jargon associated with the GIS methodology), placing strong emphasis on the assumptions made for the analyses. Agriculture An agricultural threat index was developed by categorising the vulnerability of BHUs on the basis of soils (using geology as a surrogate), climate and topography. Thus, BHUs that were associated with fertile soils, sufficient rainfall for dryland agriculture, and level topography (e.g. Coast Renosterveld BHUs) were scored as High, whereas BHUs associated with poor soils, low rainfall and dissected topography (e.g inland Mountain Complexes) were scored as Low. The categorization of BHUs according agricultural potential is shown in Appendix 2. Each planning unit was allocated to a category of agricultural threat based on the categorization of its component BHU(s) using two methods. In the first method, the extant habitat (i.e. land that has not been transformed by urbanization and agriculture) was coded for agricultural potential based on the most extensive BHU in the planning unit; in the second method, categories were allocated with respect to the highest scoring BHU in a planning unit. The results of the second, less conservative, method are shown in Figure 5.
18
Figure 4 Area of the planning domain currently transformed by agriculture/forestry, urbanization and dense stands of alien plants
Planning DomainTransformed Areas

19
Figure 5 Agricltural/forestry threats in non-transformed areas of the planning domain.
Agricultural PotentialHighMediumLow
20
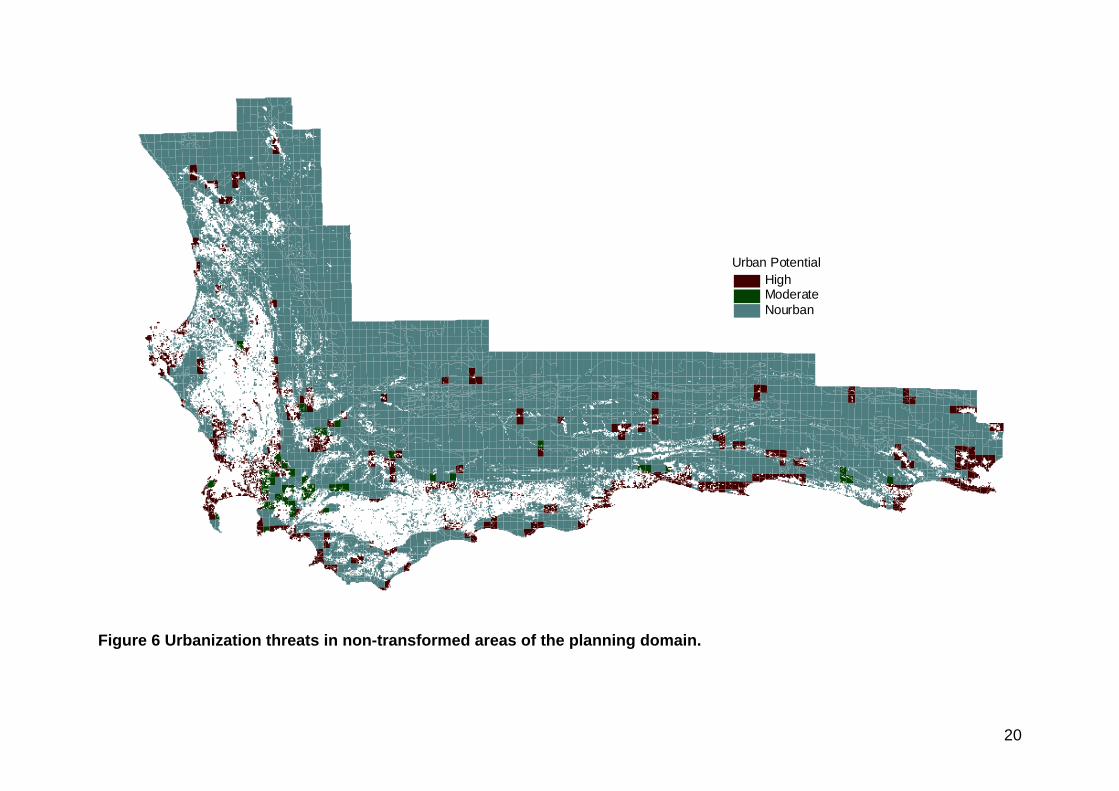
Figure 6 Urbanization threats in non-transformed areas of the planning domain.
Urban PotentialHighModerateNourban

21
Urbanization Urbanization threat was categorised very simplistically: we acknowledge that a detailed study of the complex urbanization processes within the CFR – including rapid growth in the luxury and informal sectors in some areas – might have produced (marginally) different results. Our approach was as follows: • planning units with extant habitat (defined as for agriculture) that were more than 50% urbanized were categorized as extereme
(Extreme); • units within a 5 km buffer around each urban node where the extant habitat (defined as above) was on level terrain, were
categorized as highly threatened (High); • units within a 5 km buffer around each urban node where the extant habitat (defined as above) was on steep terrain, were
categorized as moderately threatened (Moderate); • all remaining BHUs were categorized as low (Nourban). Results of the analysis are shown in Figure 6 where the High and Extreme categories are combined. Alien plants Alien plants were defined as invasive species of Acacia, Eucalyptus, Hakea, Eucalyptus, Leptospermum and Pinus (see Richardson et al 1992). Infestations were mapped at the 1:250 000 scale and classed as high, moderate and low density. Details on the mapping procedure are given in Lloyd et al (1999). Three assumptions were made for the categorization of planning units: 1. Extant habitat in BHUs that were not susceptible to invasion by the alien species specified above, namely karroid habitats
(Figure 7), was regarded non-susceptible, even if alien plants had invaded azonal habitats such as drainage lines. 2. Areas within susceptible BHUs that comprised dense stands of aliens were excluded from extant habitat, since these areas
were, by definition, no longer susceptible to alien plant invasion. 3. When predicting likely increases in the extent of invaded areas in planning units over the next 20 years, we considered the role
of thickening up of moderate-density stands as well as the spatial expansion of invading populations, the latter being mostly adjacent to currently dense stands. We based our predictions on recent studies (reconstructions of actual invasions using historical aerial photographs and modelling studies); an annual increase of 7% in spatial extent was taken as a realistic value across the entire planning domain for our predictions (Le Maitre et al 1996, Higgins et al 1999). We did not consider the spread of aliens between planning units.

22
Definition of non-overlapping land categories within each planning unit were as follows: A = area of dense aliens M = area of moderate-density aliens N1 = area of low-density aliens in susceptible BHUs N2 = area of extant (non-invaded) habitat in non-susceptible BHUs T = area of habitat transformed by agriculture and urbanization. Categories were allocated using the following rules: 1. if N2 > 80% of unit, then alien threat = N (none); 2. if A/(M+N2)*100 > 35%, then alien threat = H (high); 3. if A+M/(M+N1)*100 > 50%, then alien threat = H (high); 4. if A+M/(M+N1)*100 > 5%, then alien threat = M (moderate); 5. in all other cells, alien threat = L (low). Given a 7% average annual expansion rate, and taking into the account both the thickening up of presently sparse and medium-density stands as well as spatial expansion of the invading population, planning units that currently have about 35% cover of dense aliens or 50% cover of dense and medium-density aliens combined, would have 80% coverage of dense stands within 20 years, assuming no intervention. Similarly, areas with currently low cover (> 5%) of moderate and dense stands of aliens would become 20 – 30% thus invaded after 20 years. The results of the analysis are shown in Figure 7. We return to the threat analysis in the section in Implementation.

23
Figure 7 Alien plant threats in non-transformed areas of the planning domain.
Alien PotentialHighMediumLowNone

24
Targets Without explicit and quantitative reservation targets, there can be no conservation plan. Yet the literature is glaringly silent on the topic of reservation targets. The oft-quoted figure of 10% of each habitat – to be set aside for strict reservation – is not strongly underpinned by any rationale, be it scientific or otherwise. We set differential targets for pattern (ha of extant habitat for each BHU) that incorporate (baseline) biodiversity and threat (retention) components, as well as targets for the representation of processes. No other studies have dealt with targets in such a comprehensive way. We set targets only for those BHUs that fall within the CFR part of the planning domain. Although there is a measure of subjectivity in the way in which we established these targets, the methods are explicit and transparent. Furthermore, these targets are not set in stone: they can be adjusted as more knowledge accumulates, or in response to the demands of interested and affected parties. However, the reasons for changing targets should be made explicit and be subject to scrutiny. Pattern Baseline targets The baseline targets were set to accommodate differential patterns of plant species turnover in the CFR, based on species-area relations. The rationale for, and results of these analyses are shown in Appendix 3. As a starting point, we set a baseline target (B) (ha) of the pre-European (or pre-transformation) area (e) (ha) of each BHU. Since species turnover along environmental gradients (beta diversity) and geographical gradients (gamma diversity) is 1.5 fold higher in the winter-rainfall lowlands, and 2.5 fold higher in the winter-rainfall montane areas than the lowlands and uplands of the non-seasonal rainfall zone of the CFR , we applied different biodiversity weightings (b’ ) to these to BHUs within these different geographical regions. Thus: B = b’*e/100 (1) where b’ = • 10 for lowland and montane BHUs in the (eastern) non-seasonal rainfall zone; • 15 for lowlands BHUs in the (western) winter-rainfall zone; • 25 for montane BHUs in the (western) winter-rainfall zone.

25
The baseline (B) targets (ha) for each BHU are given in Appendix 4. In essence, these differential targets seek to capture the same proportion of the total species pool in each BHU. The higher targets in the western, winter-rainfall zones accommodate the higher compositional turnover and incidence of rare species in these regions. Interestingly, plant community diversity shows no significant variation across the CFR (Appendix 3). Retention targets Targets must also accommodate the threats faced by a biodiversity entity as well as the extent of transformation. We adjusted B by applying weighting factors that considered both of these factors. The rationale is to retain a proportion of the extant habitat of BHUs in relation to threats and extent of transformation. Thus, BHUs that are highly threatened by agriculture, urbanization and alien plants, and are already extensively transformed by any of these factors, will receive a higher weighting than BHUs that have a low threat status and are still relatively intact. We call this the retention weighting (r’), comprising a threat weighting component (h’) and a transformation weighting component (t’), and used it to compute a retention target (R). In order to calculate h’, we determined the threat status of each BHU for each threat factor as follows: 1. Agriculture
The agricultural potential of each BHU was scored high (H), medium (M) or low (L) based on its predominant geology (as a surrogate for soil fertility), climate and topography (see Threats section).
2. Urbanization The urbanization potential of each BHU was scored high (H), medium (M) or low (L) according to the following rules: E+H > 50% of BHU area = H E+H+M > 75% = H 25% < E+H+M < 75% = M E+H+M < 25% = L where E = extreme, H = high, M = medium and L = low urbanization threat (see Threats section). 3. Alien plants The alien plant threat potential of each BHU was scored high (H), medium (M) or low (L) according to the following rules: H > 50% = H H+M > 75% = H 25% < H+M < 75% = M H+M < 25% = L where H = high, M = medium and L = low alien plant threat (see Threats section).
26
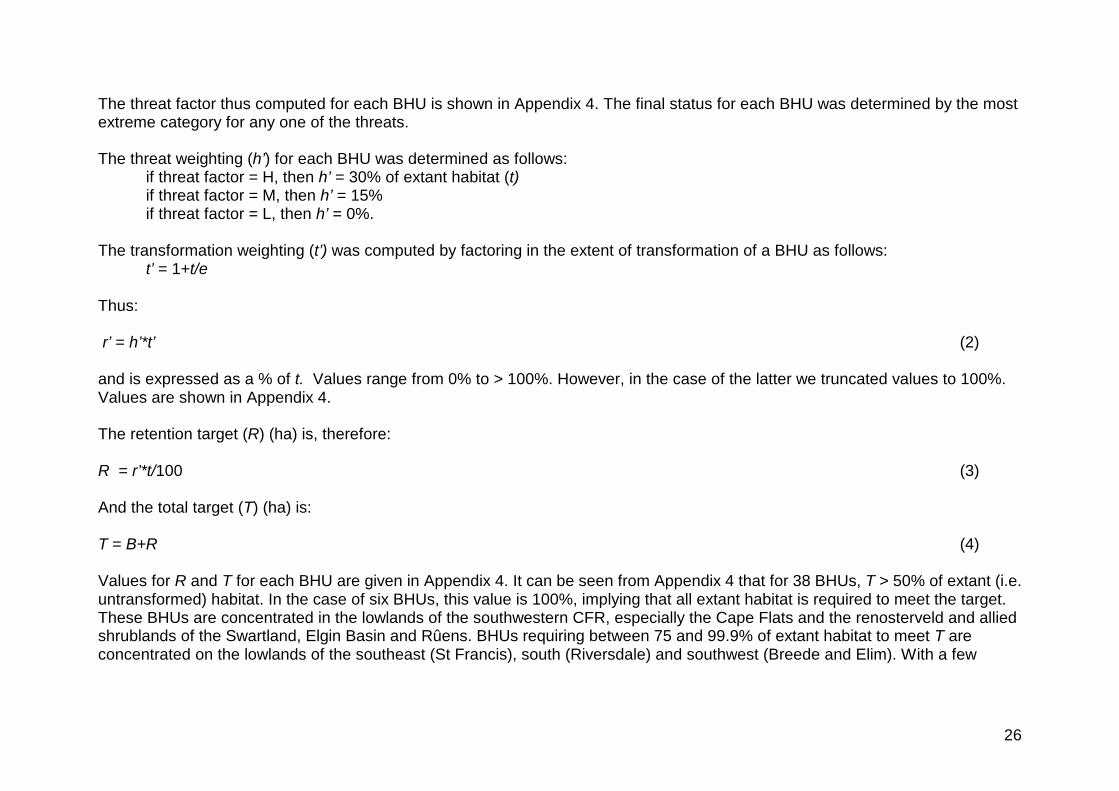
The threat factor thus computed for each BHU is shown in Appendix 4. The final status for each BHU was determined by the most extreme category for any one of the threats. The threat weighting (h’) for each BHU was determined as follows: if threat factor = H, then h’ = 30% of extant habitat (t) if threat factor = M, then h’ = 15% if threat factor = L, then h’ = 0%. The transformation weighting (t’) was computed by factoring in the extent of transformation of a BHU as follows: t’ = 1+t/e Thus: r’ = h’*t’ (2) and is expressed as a % of t. Values range from 0% to > 100%. However, in the case of the latter we truncated values to 100%. Values are shown in Appendix 4. The retention target (R) (ha) is, therefore: R = r’*t/100 (3) And the total target (T) (ha) is: T = B+R (4) Values for R and T for each BHU are given in Appendix 4. It can be seen from Appendix 4 that for 38 BHUs, T > 50% of extant (i.e. untransformed) habitat. In the case of six BHUs, this value is 100%, implying that all extant habitat is required to meet the target. These BHUs are concentrated in the lowlands of the southwestern CFR, especially the Cape Flats and the renosterveld and allied shrublands of the Swartland, Elgin Basin and Rûens. BHUs requiring between 75 and 99.9% of extant habitat to meet T are concentrated on the lowlands of the southeast (St Francis), south (Riversdale) and southwest (Breede and Elim). With a few

27
exceptions in the southwest (Cape Peninsula, Klein River, Caledon Swartberg, Bredasdorp and Potberg), T for Mountain Complexes does not deviate substantially from the baseline target (B) (Appendix 4). Process We addressed process (see Table 2) targets by identifying appropriate spatial components of these processes and then setting quantitative targets for them. Processes associated with the maintenance of species diversity, including plant-pollinator interactions and other processes requiring relatively small (5-1000 ha) habitat patches will be catered for by achieving pattern targets. We focus only on the larger scale processes. We used data in Boshoff and Kerley (1999) to provide an estimate of spatial components required for the conservation of large mammal processes. The analysis is summarized in Table 4, and the location of the spatial components is shown in Figures 14-19 (see section on Location and design). Table 4 Spatial components of processes (see Table 2) identified for conservation action in the CFR. The components are identified geographically and given quantitative targets. Spatial component
Method of identification Target
Juxtaposed edaphically different habitats
Identify planning units with particular combinations of BHUs encompassing strong edaphic contrasts that are known to be associated with plant diversification processes. Filter out “unsuitable” planning units based on: (1) fragmentation; and (2) lack of sufficient contact.
At least one combination of each type over its full extent
Entire sand movement corridors
Identify planning units of the three specific (Dune Pioneer) BHUs.. Filter out any corridors (sediment-source) with limited conservation potential of surrounding land (particularly the sediment-sink or downwind zone). Assume dense aliens make corridors irrecoverable.
At least one entire corridor of each type
28
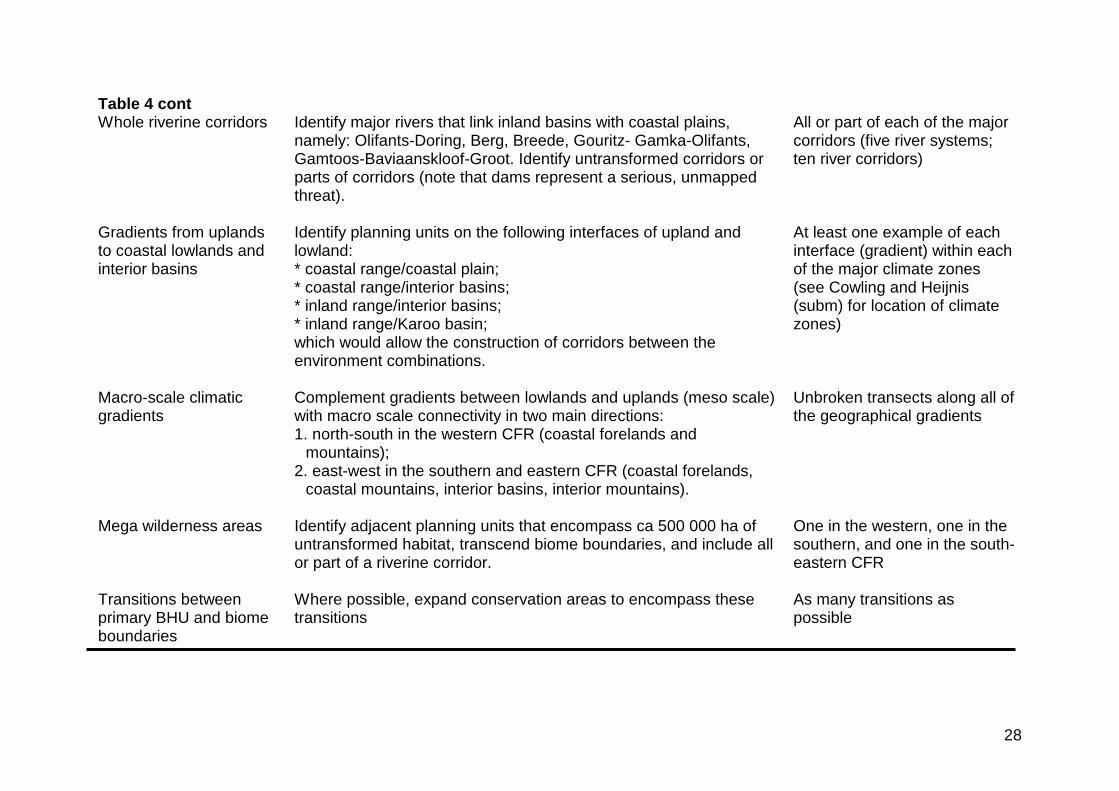
Table 4 cont Whole riverine corridors
Identify major rivers that link inland basins with coastal plains, namely: Olifants-Doring, Berg, Breede, Gouritz- Gamka-Olifants, Gamtoos-Baviaanskloof-Groot. Identify untransformed corridors or parts of corridors (note that dams represent a serious, unmapped threat).
All or part of each of the major corridors (five river systems; ten river corridors)
Gradients from uplands to coastal lowlands and interior basins
Identify planning units on the following interfaces of upland and lowland: * coastal range/coastal plain; * coastal range/interior basins; * inland range/interior basins; * inland range/Karoo basin; which would allow the construction of corridors between the environment combinations.
At least one example of each interface (gradient) within each of the major climate zones (see Cowling and Heijnis (subm) for location of climate zones)
Macro-scale climatic gradients
Complement gradients between lowlands and uplands (meso scale) with macro scale connectivity in two main directions: 1. north-south in the western CFR (coastal forelands and
mountains); 2. east-west in the southern and eastern CFR (coastal forelands,
coastal mountains, interior basins, interior mountains).
Unbroken transects along all of the geographical gradients
Mega wilderness areas Identify adjacent planning units that encompass ca 500 000 ha of untransformed habitat, transcend biome boundaries, and include all or part of a riverine corridor.
One in the western, one in the southern, and one in the south-eastern CFR
Transitions between primary BHU and biome boundaries
Where possible, expand conservation areas to encompass these transitions
As many transitions as possible

29
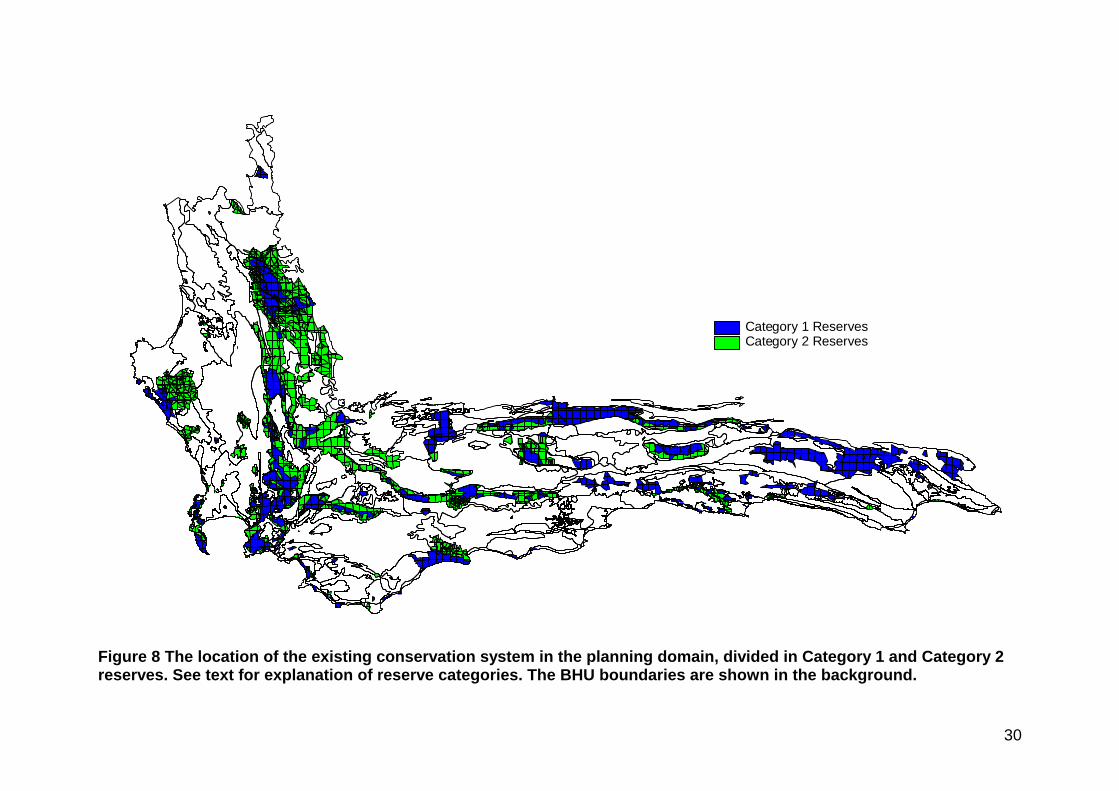
Reserve effectiveness Thus far in this document, we have compiled data on biodiversity, derived a predictive understanding of threats, and set explicit targets for the conservation of pattern and process. We are now in a position to start laying out the options for designing a notional system of conservation areas that is effective (in terms of representation) and efficient (in terms of space). These options are constrained by many factors, notably the existing reserve system. Wherever possible, our plan builds on the existing system and was, therefore, constrained by this system. It is appropriate, therefore, to evaluate the effectiveness of the system, which we do in this section. We focus only on those BHUs that fall within the CFR part of the planning domain. Reserve effectiveness is further discussed in the section on Irreplaceability. The existing conservation system The current (1999) conservation system in the CFR is shown in Figure 8. The system is divided into two categories: Category 1 reserves (national parks, provincial reserves and Dept Water Affairs and Forestry (DWAF) reserves) are those supported by strong legal and institutional structures; Category 2 reserves (conservancies, DWAF demarcated forests, private demarcated forests, local authority reserves, mountain catchment areas, natural heritage sites, protected natural environments and private nature reserves) comprise a heterogeneous assemblage with varying degrees of protection and defensibility. The degree of reservation for BHUs that fall within the boundary of the CFR is shown for Category 1 and 2 reserves in Appendices 5 and 6, respectively. Table 5 summarizes the data with respect to Mountain Complex BHUs, and the remaining (largely lowland) BHUs. As is the case for most conservation systems throughout the world (Beardsly and Stoms 1993, Pressey et al 1996, 2000), the CFR system is strongly biased in favour of remote, rugged and infertile landscapes that offer little potential for economic development. While approximately 22% of the CFR is reserved in some form – the total area being equally shared between Category 1 and 2 reserves – Mountain Complex BHUs are overrepresented in the system (see also Rebelo 1992) (Table 5). Overall, only 9% of the lowlands are conserved with slightly more than 3% of the system comprising Category 1 reserves. On the other hand, almost 50% of the combined area of Mountain Complexes have some form of reservation status. In terms of gaps in the reservation system, 54 of the 88 CFR BHUs have less than 5% of their pre European area included in the Category 1 system; of these 46 are on the lowlands. Of the 27 BHUs that have more than 20% of their area under Category 1 reserve, 20 are Mountain Complex BHUs.
30
Figure 8 The location of the existing conservation system in the planning domain, divided in Category 1 and Category 2 reserves. See text for explanation of reserve categories. The BHU boundaries are shown in the background.
Category 1 ReservesCategory 2 Reserves
31
These biases and gaps are a result of the ad hoc manner in which the reserve system of the CFR has been assembled. Rebelo (1992) provides an account of the history of the development of the reserve system in the region. We discuss further these biases and gaps in the section below and the Location and Design section.
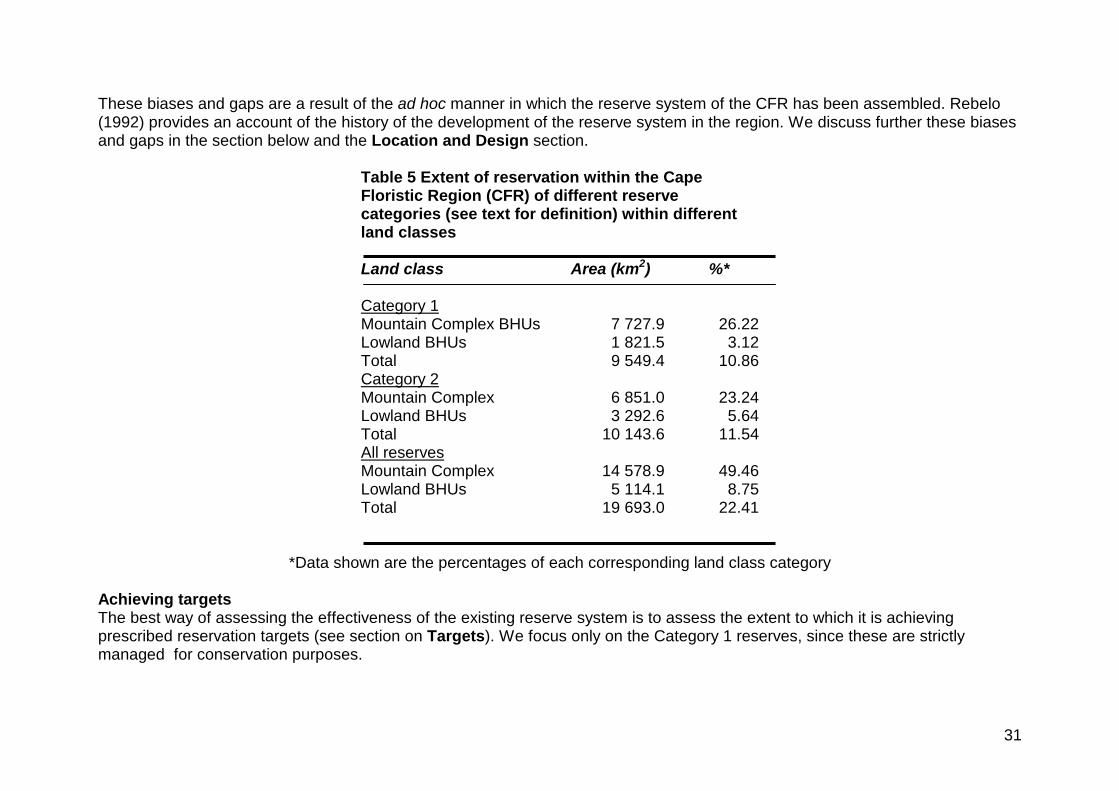
Table 5 Extent of reservation within the Cape Floristic Region (CFR) of different reserve categories (see text for definition) within different land classes Land class Area (km2)
%*
Category 1 Mountain Complex BHUs 7 727.9 26.22Lowland BHUs 1 821.5 3.12Total 9 549.4 10.86Category 2 Mountain Complex 6 851.0 23.24Lowland BHUs 3 292.6 5.64Total 10 143.6 11.54All reserves Mountain Complex 14 578.9 49.46Lowland BHUs 5 114.1 8.75Total 19 693.0 22.41
*Data shown are the percentages of each corresponding land class category Achieving targets The best way of assessing the effectiveness of the existing reserve system is to assess the extent to which it is achieving prescribed reservation targets (see section on Targets). We focus only on the Category 1 reserves, since these are strictly managed for conservation purposes.
32
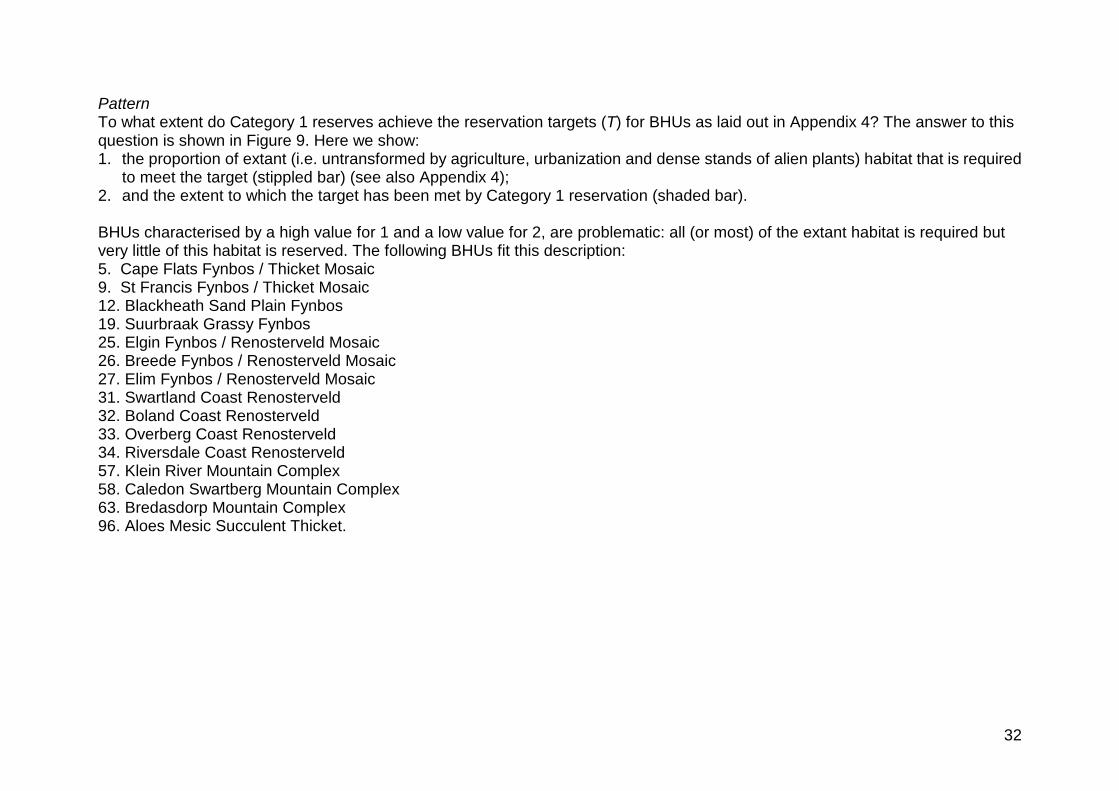
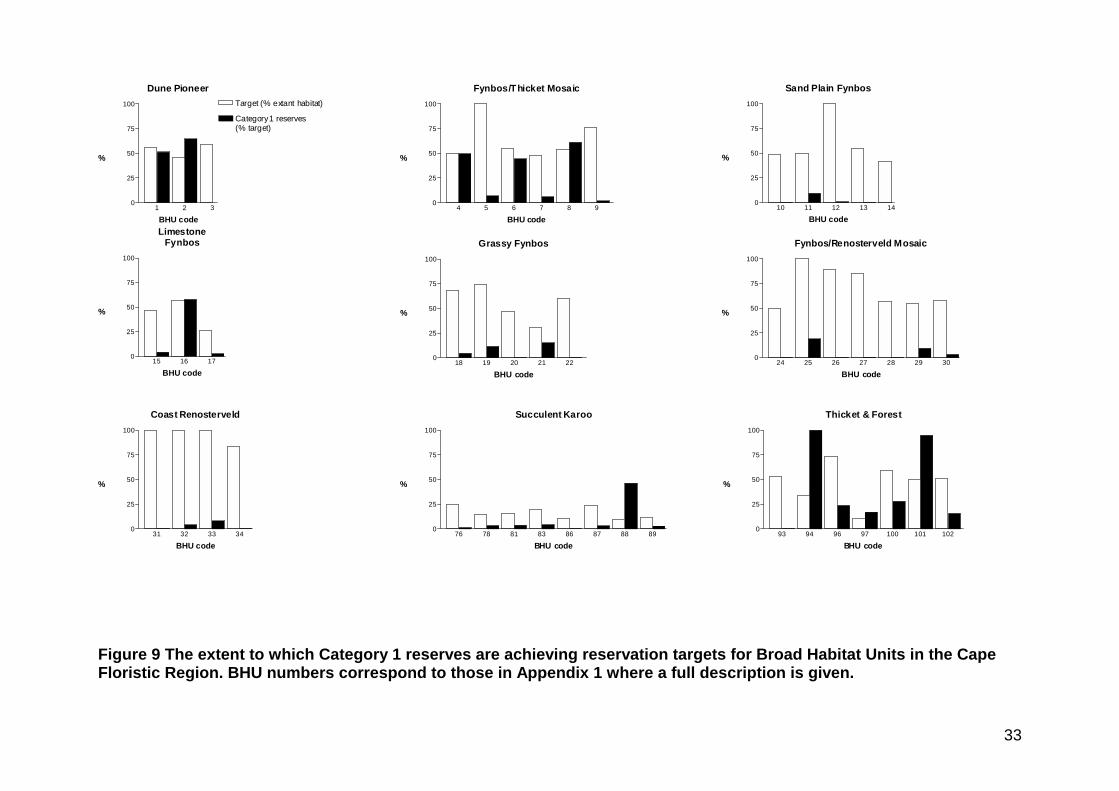
Pattern To what extent do Category 1 reserves achieve the reservation targets (T) for BHUs as laid out in Appendix 4? The answer to this question is shown in Figure 9. Here we show: 1. the proportion of extant (i.e. untransformed by agriculture, urbanization and dense stands of alien plants) habitat that is required
to meet the target (stippled bar) (see also Appendix 4); 2. and the extent to which the target has been met by Category 1 reservation (shaded bar). BHUs characterised by a high value for 1 and a low value for 2, are problematic: all (or most) of the extant habitat is required but very little of this habitat is reserved. The following BHUs fit this description: 5. Cape Flats Fynbos / Thicket Mosaic 9. St Francis Fynbos / Thicket Mosaic 12. Blackheath Sand Plain Fynbos 19. Suurbraak Grassy Fynbos 25. Elgin Fynbos / Renosterveld Mosaic 26. Breede Fynbos / Renosterveld Mosaic 27. Elim Fynbos / Renosterveld Mosaic 31. Swartland Coast Renosterveld 32. Boland Coast Renosterveld 33. Overberg Coast Renosterveld 34. Riversdale Coast Renosterveld 57. Klein River Mountain Complex 58. Caledon Swartberg Mountain Complex 63. Bredasdorp Mountain Complex 96. Aloes Mesic Succulent Thicket.
33
Figure 9 The extent to which Category 1 reserves are achieving reservation targets for Broad Habitat Units in the Cape Floristic Region. BHU numbers correspond to those in Appendix 1 where a full description is given.
Dune Pioneer
1 2 30
25
50
75
100 Target (% extant habitat)
Category1 reserves(% target)
BHU code
%
Fynbos/Thicket Mosaic
4 5 6 7 8 90
25
50
75
100
BHU code
%
Sand Plain Fynbos
10 11 12 13 140
25
50
75
100
BHU code
%
LimestoneFynbos
15 16 170
25
50
75
100
BHU code
%
Grassy Fynbos
18 19 20 21 220
25
50
75
100
BHU code
%
Fynbos/Renosterveld Mosaic
24 25 26 27 28 29 300
25
50
75
100
BHU code
%
Coast Renosterveld
31 32 33 340
25
50
75
100
BHU code
%
Succulent Karoo
76 78 81 83 86 87 88 890
25
50
75
100
BHU code
%
Thicket & Forest
93 94 96 97 100 101 1020
25
50
75
100
BHU code
%

34
Figure 9 cont
Inland Renosterveld
35 36 37 38 39 41 42 43 440
25
50
75
100
Category 1 reserves(% target)
Target (% extant habitat)
BHU code
%
Mountain Complex
45 46 47 48 49 50 51 52 53 54 55 56 57 58 59 60 61 62 63 64 65 66 67 68 69 70 71 72 73 740
25
50
75
100
BHU code
%

35
BHUs with a low value of 1 and a high value of 2 are relatively secure. Pattern targets have been achieved and there is still much extant habitat available for achieving process targets. The following BHUs fit this description (the values in parentheses are Category 1 reserves as a % of the target for those BHUs where this value > 100%; see Figure 9): 39. Matjies Inland Renosterveld (112.0) 47. Cederberg Mountain Complex (113.2) 51. Groot Winterhoek Mountain Complex (133.8) 52. Matroosberg Mountain Complex 53. Hawequas Mountain Complex (119.8) 54. Franschhoek Mountain Complex (146.2) 55. Cape Peninsula Mountain Complex 56. Kogelberg Mountain Complex (101.0) 59. Riviersonderend Mountain Complex (116.7) 64. Southern Langeberg Mountain Complex (282.5) 65. Potberg Mountain Complex 66. Klein Swartberg Mountain Complex (375.3) 67. Rooiberg Mountain Complex (298.3) 68. Groot Swartberg Mountain Complex (736.4) 69. Outeniqua Mountain Complex 70. Kamanassie Mountain Complex (480.9) 71. Tsitsikamma Mountain Complex (195.8) 72. Kouga Mountain Complex (328.8) 73. Baviaanskloof Mountain Complex (546.7) 74. Cockscomb Mountain Complex (314.7) 94. Gamtoos Mesic Succulent Thicket (111.4) 101. Swellendam Afromontane Forest The remaining BHUs have varying degrees of flexibility to achieve pattern targets. Options are greatest in the drier Mountain Complexes and karroid areas, and least on the coastal forelands. In conclusion, the Category 1 reserve system in the CFR is strongly biased in favour of Mountain Complexes: here many BHUs are overrepresented (some massively so) relative to their targets. On the other hand, lowland BHUs are underrepresented relative to
36
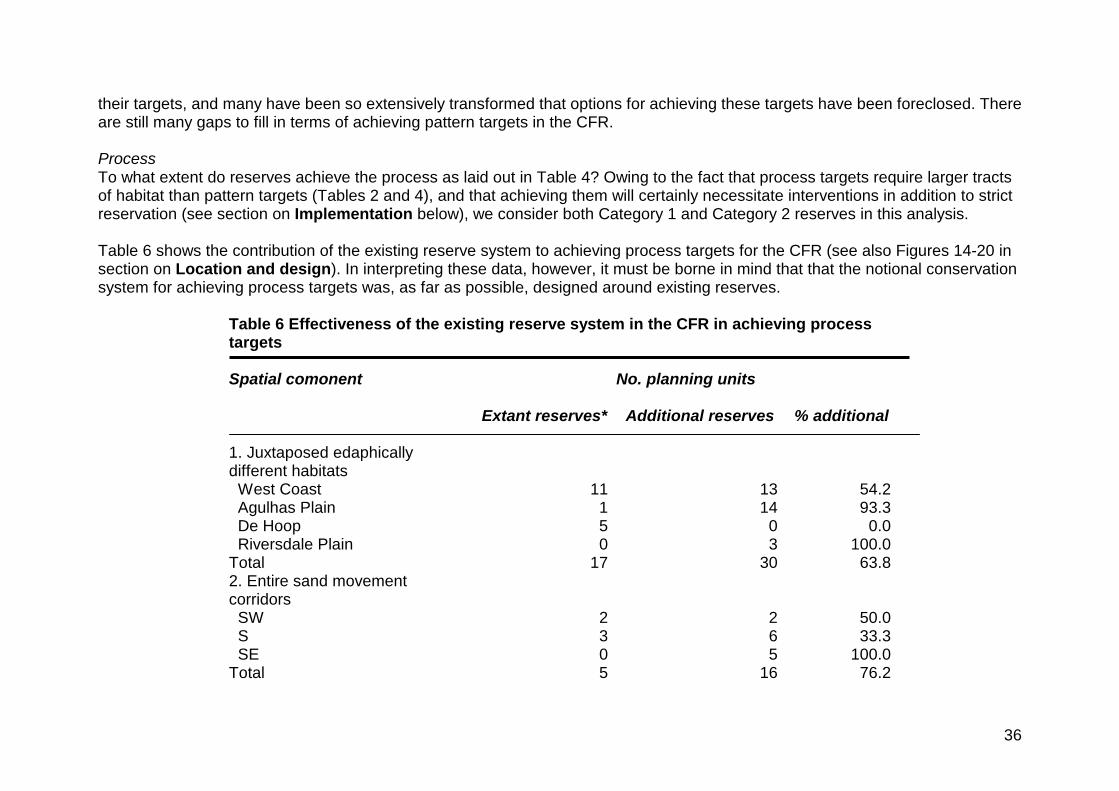
their targets, and many have been so extensively transformed that options for achieving these targets have been foreclosed. There are still many gaps to fill in terms of achieving pattern targets in the CFR. Process To what extent do reserves achieve the process as laid out in Table 4? Owing to the fact that process targets require larger tracts of habitat than pattern targets (Tables 2 and 4), and that achieving them will certainly necessitate interventions in addition to strict reservation (see section on Implementation below), we consider both Category 1 and Category 2 reserves in this analysis. Table 6 shows the contribution of the existing reserve system to achieving process targets for the CFR (see also Figures 14-20 in section on Location and design). In interpreting these data, however, it must be borne in mind that that the notional conservation system for achieving process targets was, as far as possible, designed around existing reserves.
Table 6 Effectiveness of the existing reserve system in the CFR in achieving process targets Spatial comonent
No. planning units
Extant reserves* Additional reserves % additional
1. Juxtaposed edaphically different habitats
West Coast 11 13 54.2 Agulhas Plain 1 14 93.3 De Hoop 5 0 0.0 Riversdale Plain 0 3 100.0 Total 17 30 63.8 2. Entire sand movement corridors
SW 2 2 50.0 S 3 6 33.3 SE 0 5 100.0 Total 5 16 76.2
37
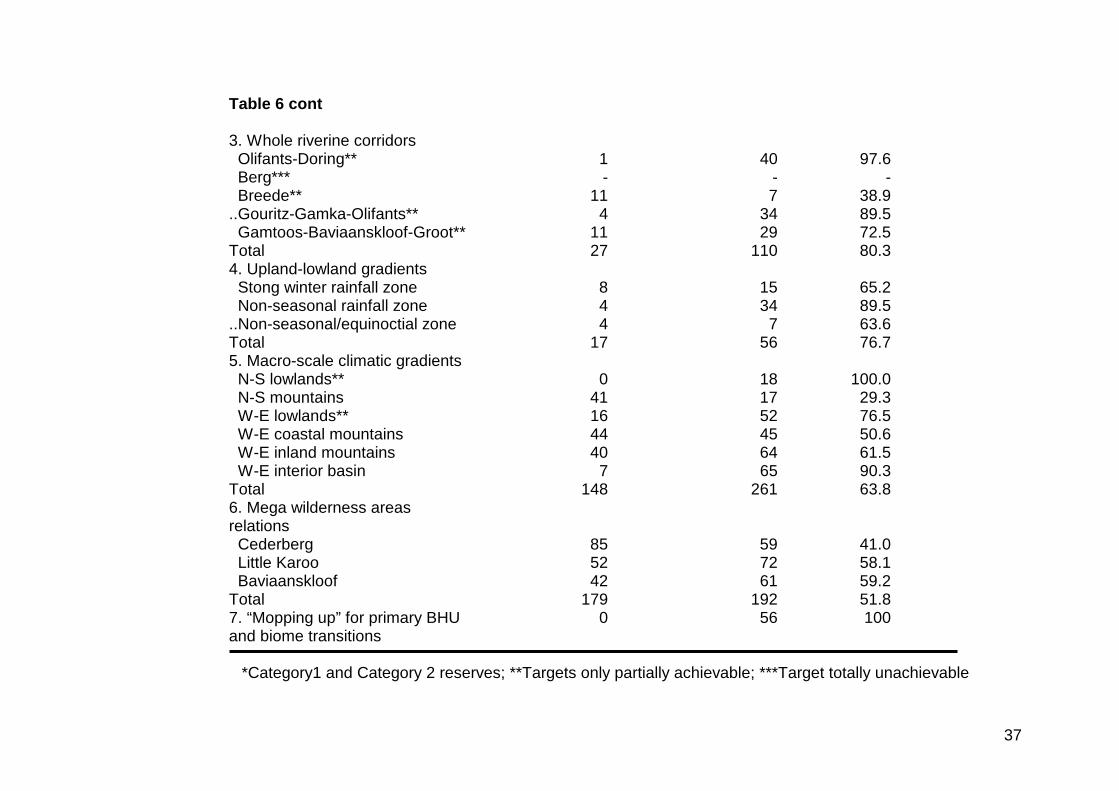
Table 6 cont 3. Whole riverine corridors Olifants-Doring** 1 40 97.6 Berg*** - - - Breede** 11 7 38.9 ..Gouritz-Gamka-Olifants** 4 34 89.5 Gamtoos-Baviaanskloof-Groot** 11 29 72.5 Total 27 110 80.3 4. Upland-lowland gradients Stong winter rainfall zone 8 15 65.2 Non-seasonal rainfall zone 4 34 89.5 ..Non-seasonal/equinoctial zone 4 7 63.6 Total 17 56 76.7 5. Macro-scale climatic gradients N-S lowlands** 0 18 100.0 N-S mountains 41 17 29.3 W-E lowlands** 16 52 76.5 W-E coastal mountains 44 45 50.6 W-E inland mountains 40 64 61.5 W-E interior basin 7 65 90.3 Total 148 261 63.8 6. Mega wilderness areas relations
Cederberg 85 59 41.0 Little Karoo 52 72 58.1 Baviaanskloof 42 61 59.2 Total 179 192 51.8 7. “Mopping up” for primary BHU and biome transitions
0 56 100
*Category1 and Category 2 reserves; **Targets only partially achievable; ***Target totally unachievable

38
It is clear from Table 6 that the extant reserve system is not effective in achieving process targets, especially on the lowlands. For all spatial components, the extant system comprised less than 50% of the total number of planning units required. The situation is better on the mountains than the lowlands; in the latter area there are four cases where up to 100% of the units required to conserve certain process would have to comprise additional reserves. In conclusion, the extant reserve system of the CFR is biased in favour of montane BHUs and is, therefore, inadequate for achieving both pattern and process targets. However, owing to the relatively untransformed nature of the mountains and the interior basin (Little Karoo), options for achieving process targets are much more promising there than on the embattled lowlands.

39
Irreplaceability Thus far, although we have discussed target achievement, we have not formally introduced the concept of irreplaceability. Essentially, irreplaceability is a measure assigned to an area (e.g. a planning unit) that reflects the importance of that area, in the context of the planning domain, for the achievement of the regional conservation targets. Irreplaceability can be defined in two ways (Pressey et al 1994): 1. The potential contribution of any site to a conservation goal or the likelihood of that site being required to achieve the goal; 2. The extent to which the options for achieving a system of conservation areas that is representative (achieves all the
conservation targets) are reduced if that site is lost or made unavailable. A map of irreplaceability values is, therefore, a map of options: in areas of high irreplaceability, all (most) extant habitat is required to achieve targets; in areas of low irreplaceability, there is greater flexibility in the array of available sites required to meet a regional conservation goal (Pressey 1999b) The technical aspects of the calculation of irreplaceability values are discussed in Pressey et al (1994) and Ferrier et al (2000). A very readable account is given in Anon (1999). Simply put, planning units that contribute a relatively large amount of area that is required to achieve a target, have high irreplaceability – the loss of that area would substantially compromise the achievement of that target; planning units that contribute a small proportion of the area required to achieve a target have low irreplaceability. In the extreme case, where all of the extant habitat is required to achieve a target (as is the case for Swartland Coast Renosterveld and several other lowland BHUs in the southwestern CFR), irreplaceability scores a maximum of 1. On the other hand, planning units that comprise BHUs where the extant habitat available exceeds the target several fold (e.g. many Mountain Complexes), have very low irreplaceability. When existing reserves are considered in the calculation of irreplaceability, values may be zero. We calculated irreplaceability of planning units using C-Plan, a decision-support system which, together with a GIS (in this case ArcView 3.1), maps the options for achieving an explicit conservation goal in a region; allows users to decide which sites should be placed under some form of conservation management; accepts and displays these decisions, and then lays out the new pattern of options that results. Anon (1999) provides the technical background and operational features of C-Plan while Pressey et al (1995) describe an application of the software. C-Plan is particularly effective in displaying options and resolving potential conflicts in conservation planning. Figure 10 shows the patterns of site irreplaceability (a multiplicative combination of irreplaceability values for all BHUs in a planning unit) across the planning domain, assuming no reservation. It is important to remember that targets were not set for non-CFR BHUs; hence irreplaceability for corresponding planning units is zero. Several patterns are worth noting:

40
Figure 10 Patterns of site irreplaceability across the planning domain, assuming no extant reservation.
Negotiated ReserveMandatory Reserve
1 (Totally Irreplaceable)>0.8 - <1>0.6 - 0.8>0.4 - 0.6>0.2 - 0.4 >0 - 0.2IRREPL = 0
Site Irreplaceability
41
1. Planning units with a value of site irreplaceability (Is) = 1 (total irreplaceability), include areas of extant habitat of those BHUs (Cape Flats, Blackheath, Elgin, Swartland, Boland and Overberg) with a target that is equivalent to (or exceeds) the total area of extant habitat. Additional unit thus classified are located in the Upper Breede River Valley where two units have Is = 1 (Breede BHU); at the foothills of the Southern Langeberg where one unit has Is = 1 (Swellendam BHU), east of the Gamtoos River mouth (Eastern Cape) where two units have Is = 1 ( Aloes); and south of Port Elizabeth where one unit has Is = 1 (St Francis). The further loss of any extant habitat in theses units will severely compromise the achievement of targets.
2. Planning units with Is values of 0.60 – 0.99 (high irreplaceability) are located along the Bokkeveld Escarpment (driven by the Nieuwoudtville BHU); along the West Coast (Langebaan, Hopefield, SW Dune Pioneer); on the Cape Peninsula (Cape Peninsula); in the upper Breede River valley (Waveren-Bokkeveld, Breede, Ashton); on the Agulhas Plain (Elim, Springfield, Agulhas, Klein River, Bredasdorp, SW Dune Pioneer); the De Hoop coast (De Hoop, S Dune Pioneer); the Southern Langeberg foothills (Suurbraak); the Riversdale Plain (Riversdale, Gouritz, Stilbaai); the Garden Route (Knysna, Goukamma, Keurbooms); the Langkloof (Langkloof), the Humansdorp Plain (Kromme, St Francis, Alexandria); and the Algoa region (Algoa, Alexandria, St Francis, Kromme). In these areas, there is a margin of flexibility in achieving targets; however, any future loss of extant habitat will compromise options substantially.
3. Planning units with Is values of 0.20 – 0.59 (moderate irreplaceability) are mainly clustered around the units identified in 2. above. They provide additional options should the higher-ranked units not be available for reservation. Additional areas with a high concentration of units in this category are the West Coast (driven by Leipoldtville); the Koue Bokkeveld (Koue Bokkeveld); the southern part of the N – S Folded Belt (Hawequas, Franschhoek, Kogelberg); and the eastern Little Karoo (Uniondale).
4. Planning units with Is < 0.19 (low irreplaceability) are associated mainly with the remaining Mountain Complexes and the drier, inland basins (Tanqua Karoo and Little Karoo). Here there are considerable options for achieving pattern targets. Note that only one unit – located on the western Cape Flats – has no extant area of any BHU and, therefore, has an Is value of zero.
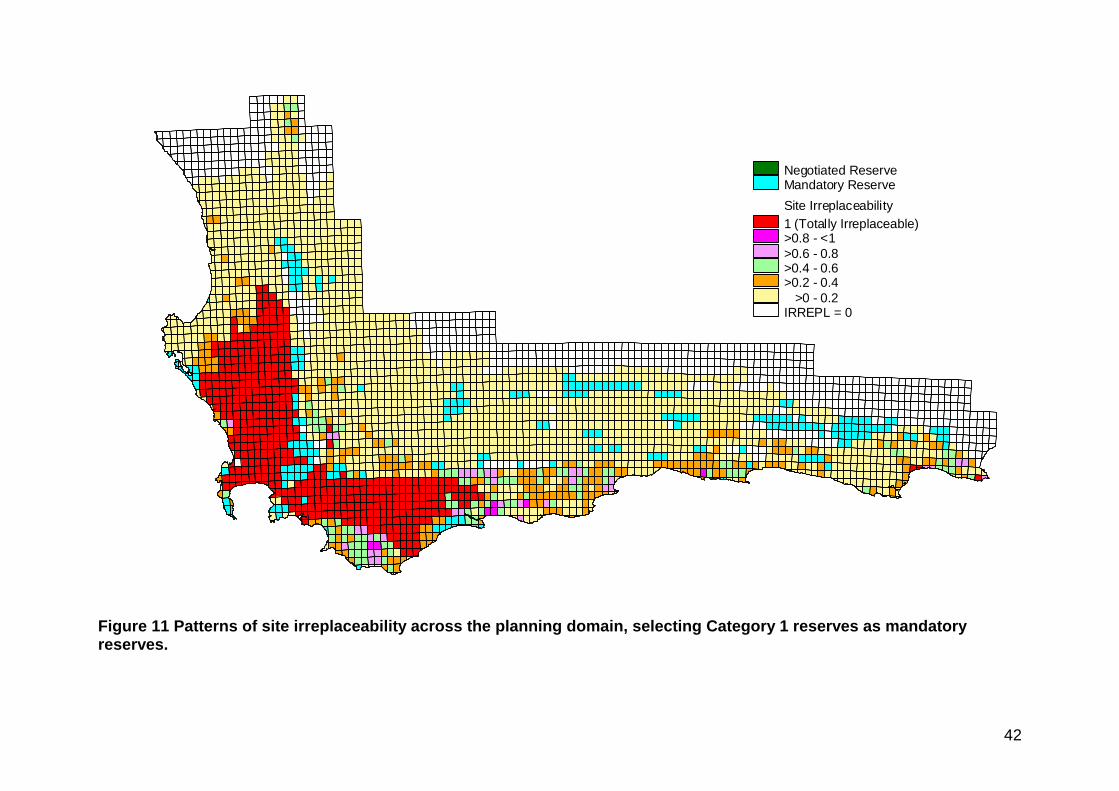
To what extent do reserves affect patterns of irreplaceability, given that reserves contribute to achieving targets? Figure 11 shows patterns of irreplaceability calculated with all planning units having > 50% Category 1 reservation status, categorised as reserved. Overall, with a few exceptions along the mountain chains, irreplaceability patterns remain largely unchanged. This is not surprising for regions of high and total irreplaceability, since many (all) fragments of habitat over large spatial scales are required to achieve targets. We expected that Category 2 reserves – especially conservancies and private nature reserves - might perform better than Category 1 reserves in achieving the targets for certain lowland BHUs. Therefore, we added as mandatory reserves those units with > 50% of their area included as Category 2 reserves. With the exceptions of the Hopefield and lower Breede River valley
42
Figure 11 Patterns of site irreplaceability across the planning domain, selecting Category 1 reserves as mandatory reserves.
Negotiated ReserveMandatory Reserve
1 (Totally Irreplaceable)>0.8 - <1>0.6 - 0.8>0.4 - 0.6>0.2 - 0.4 >0 - 0.2IRREPL = 0
Site Irreplaceability

43
Figure 12 Patterns of site irreplaceability across the planning domain, selecting Category 1 and Category 2 reserves as mandatory reserves.
Negotiated ReserveMandatory Reserve
1 (Totally Irreplaceable)>0.8 - <1>0.6 - 0.8>0.4 - 0.6>0.2 - 0.4 >0 - 0.2IRREPL = 0
Site Irreplaceability

44
Conservancies (see Figure 8), no Category 2 reserves make a significant contribution to achieving targets for embattled lowland BHUs (Figure 12). Indeed, many Category 2 reserves are located in Mountain Complex BHUs where pattern targets have already been achieved by Category 1 reserves. In conclusion, the irreplaceability analysis has provided an integrated assessment of the options for achieving targets for pattern (BHU) representation across the CFR. For several the southwestern lowland BHUs, irreplaceability is total and options are absolutely constrained. In other lowland areas – the northwestern coastal plain, the upper Breede River valley and associated basins, the Agulhas Plain, the De Hoop area, the Riversdale Plain, the Garden Route, the Langkloof, the Humansdorp Plain and the Algoa region – there is a small margin of flexibility for achieving targets for certain BHUs. In the mountains and inland basins, however, there are numerous options for achieving targets. Owing to the large amount of available extant habitat, these regions offer good potential for achieving process targets. We discuss the location and design of a system of conservation areas that will achieve pattern and process targets in the next section.

45
Location and design We used C-Plan (Anon 1999) to locate and design a notional system of conservation areas for achieving pattern and process targets. We start by identifying the minimum set of planning units required to fulfill pattern targets. Next we design a system of conservation areas to achieve process targets. We then integrate the pattern and process systems. Finally identify as components of the notional system the types and location of reserves to fulfill pattern and process targets. It must be borne in mind that the outcomes presented here, especially those relating to design for processes, are preliminary. Many reserve configurations in addition to the ones presented here, are possible. Our conservation system provides but one option for a notional reserve system. Ultimately, the database must be adopted and used by a implementing agencies to examine this and other outcomes in terms of constraints not considered here (e.g. tenure, transport network, tourism potential, management issues), as well as achieving targets. Pattern We used a minimum set algorithm to identify an approximate “minimum set” of planning units that would fulfill specific targets (see section on Targets) for each BHU in the CFR. To achieve this aim the Minset function in C-Plan (and all other minimum set functions, e.g. Rebelo and Siegfried (1992),Pressey at al (1993)) use a set of rules to select one or more sites (planning units in our case) in an iterative search routine. This set of rules is the algorithm. We used the following algorithm: Rule 1 Select the planning unit with the highest site irreplaceability value. (If there is a tie (>1 site) then go to Rule 2). Rule 2 Select the unit with the highest summed irreplaceability∗ value. (If there is a tie then go to Rule 3). ∗ Summed irreplaceability is calculated by adding all of the feature (in our case, BHUs) irreplaceabilities of all features in that site. Values can range form zero to a large number, depending on the number of features in the site. High values indicate that the site is important for achieving conservation targets for many features. As mentioned in the section on Irreplaceability, site irreplaceability combines all features multiplicatively to produce an index for each site (planning unit), ranging from 0 to 1.

46
Rule 3 Select the first unit in the list. Figure 13 shows the minimum set of units required to fulfill pattern targets, in addition to the mandatory Category 1 and Category 2 reserves, selected by the Minset algorithm. All totally irreplaceable units were chosen, as were most of the highly irreplaceable ones (cf Figure 12). While the aim of this analysis is to fulfill all pattern targets, owing to the bias in the reserve system, the reserved areas for many Mountain Complexes are way in excess of targets (Appendix 7). Another way of appreciating this
Table 7 Number of planning units selected to achieve targets for pattern using the Minest function in C-Plan (Anon 1999), and targets for processes using design. Mandatory units are Category 1 (C1) and Category 2 (C2) reserves selected as mandatory reserves. Negotiated units are reserves selected in C-Plan or chosen (design) to achieve targets. % total refers to the percentage of selected planning units of the total planning units in the planning domain (n = 3218) No. planning units Analysis Mandatory %
total Negotiated %
total Total %
total Minset for pattern– no mandatory reserves
0
0
1007
31.3
1007
31.37
Minset for pattern – C1 and C2 mandatory 494 15.4 698 21.7 1192 37.0 Design – process only 494 15.4 555 17.3 1049 32.6 Design (process) and Minset for pattern 494 15.4 1057 32.8 1551 48.2
is to compare the total number of planning units required for the first two analyses in Table 7: the minimum set without mandatory reserves requires 1007 units (or 31% of the planning domain; 40% of the CFR), while the second analysis (Figure 13) requires 1192 units (or 37% of the planning domain; 47% of the CFR). The discrepancy between these two results shows the costs of ad hoc reservation in terms of the location of the existing reserve system. The minimum set of planning units for pattern targets is not intended to provide the definitive conservation system for the CFR. It does, however, provide one set of options. Since our aim is to integrate pattern and process targets, we discuss design for processes before returning to the achievement of pattern targets.

47
Figure 13. Results of a Minset for pattern targets, selecting Category 1 and Category 2 reserves as mandatory. Planning units selected for reservation are identified as negotiated reserves.
Negotiated ReserveMandatory Reserve

48
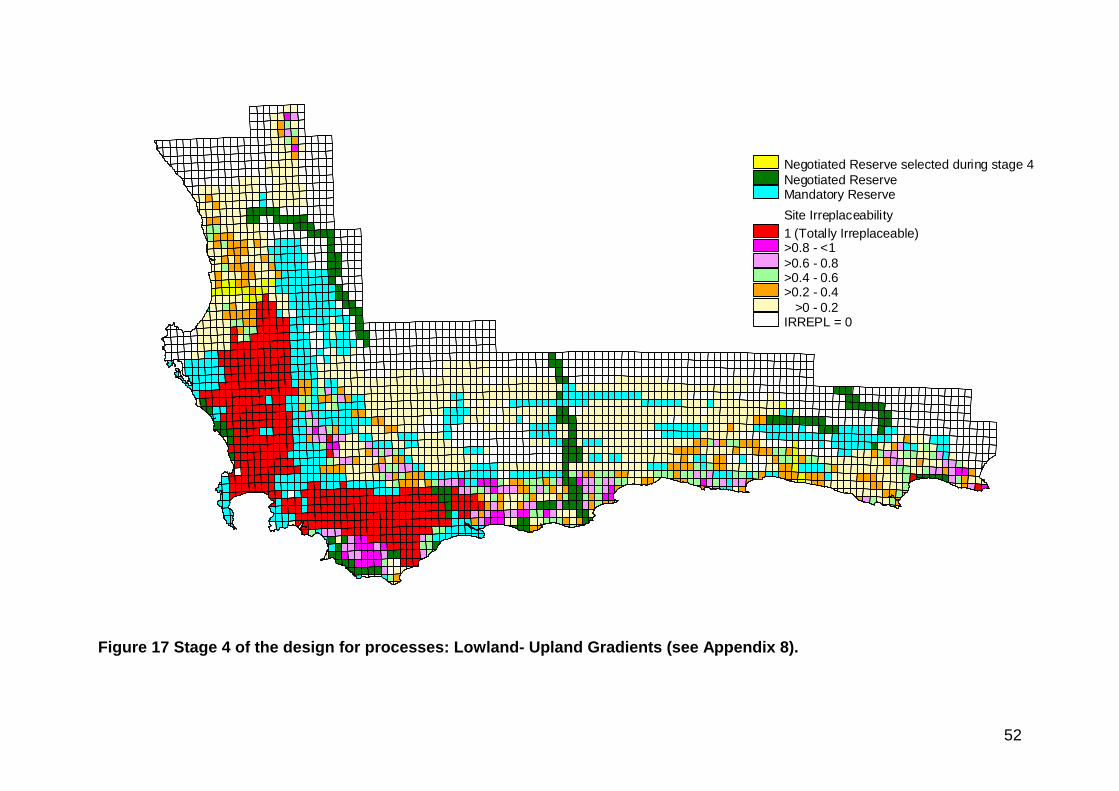
Process We designed a system to achieve process targets by selecting in C-Plan those planning units that corresponded to the spatial components identified in Table 4. The rationale for the selection of planning units, and number of units selected, is given in Appendix 8. The sequential assembly of the system, starting with stage 1 (Juxtaposition of Edaphically Different Habitats), and ending with stage 7 (a “mopping up exercise to capture units of high irreplaceability that encompass transitions between primary BHUs and biomes), is shown in Figures 14-21. In addition to the 494 units comprising mandatory reserves, we chose 555 units to achieve process goals, giving a total of 33% of the planning domain (Table 7). It is evident from Appendix 7 that designing for process does little to achieve pattern targets for the poorly conserved and highly fragmented BHUs of the lowlands. Given the highly transformed nature of this lowland matrix, it is not feasible to achieve processes that require relatively large areas of natural habitat (Table 4). However, processes that operate over smaller spatial scales can be accommodated by achieving pattern targets. In several instances it was not feasible to achieve process targets. This was due to transformation of the requisite habitat. The following targets were either not achieved at all, or only partially achieved (see also Appendix 8): • Olifants - Doring riverine corridor (transformation of the Olifants River valley) (Figure 16); • Berg River riverine corridor (transformation of the entire Berg River valley) (Figure 16); • Breede River riverine corridor (transformation of the upper Breede River valley) (Figure 16); • Gouritz – Gamka – Olifants riverine corridor (transformation of most of the Olifants River valley) (Figure 16); • Gamtoos – Baviaanskloof – Groot riverine corridor (transformation of the Gamtoos River valley) (Figure 16); • Lowland- Upland Gradient in the Moderate Winter Climate Zone (transformation of the requisite lowland habitat) (Figure 17); • Macroclimatic Gradient along the coastal plain in the western CFR (interrupted in the central sector by transformation of
requisite lowland habitat, and restricted to the coastal margin) (Figure 18); • Macroclimatic Gradient along the coastal plain in the southern and eastern CFR (eastern portion is too transformed for
continuity, and the remainder of the gradient is restricted to the coastal margin) (Figure 18). In contrast, the mountains of the western CFR and the coastal and inland mountains of the southern and eastern CFR, as well as the interior basin there (Little Karoo), offer good potential for accommodating process goals. Of great significance are the opportunities to maintain corridors along all macroclimatic gradients in montane regions as well as in the Little Karoo. These gradients are especially important for evolutionary processes and resilience to climate change (see Table 2). It was also possible to design three mega conservation areas, comprising mega wilderness areas, that should be able to accommodate almost all
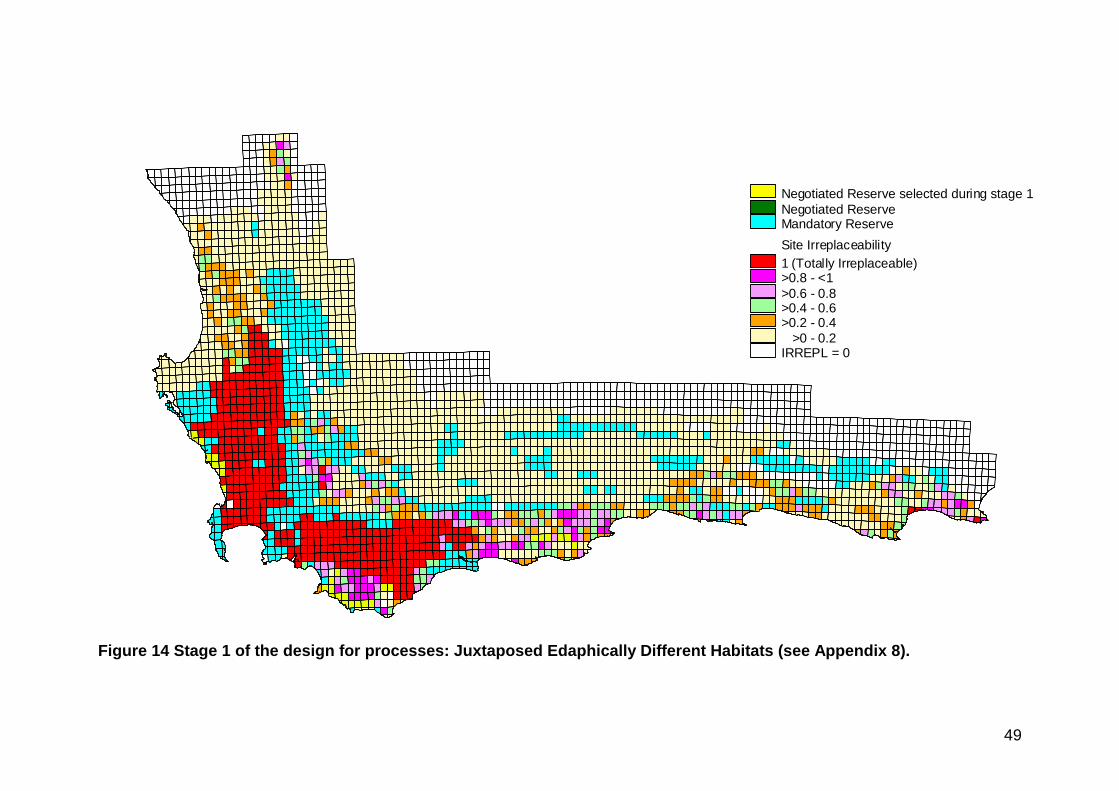
49
Figure 14 Stage 1 of the design for processes: Juxtaposed Edaphically Different Habitats (see Appendix 8).
Negotiated ReserveMandatory Reserve
1 (Totally Irreplaceable)>0.8 - <1>0.6 - 0.8>0.4 - 0.6>0.2 - 0.4 >0 - 0.2IRREPL = 0
Site Irreplaceability
Negotiated Reserve selected during stage 1
50
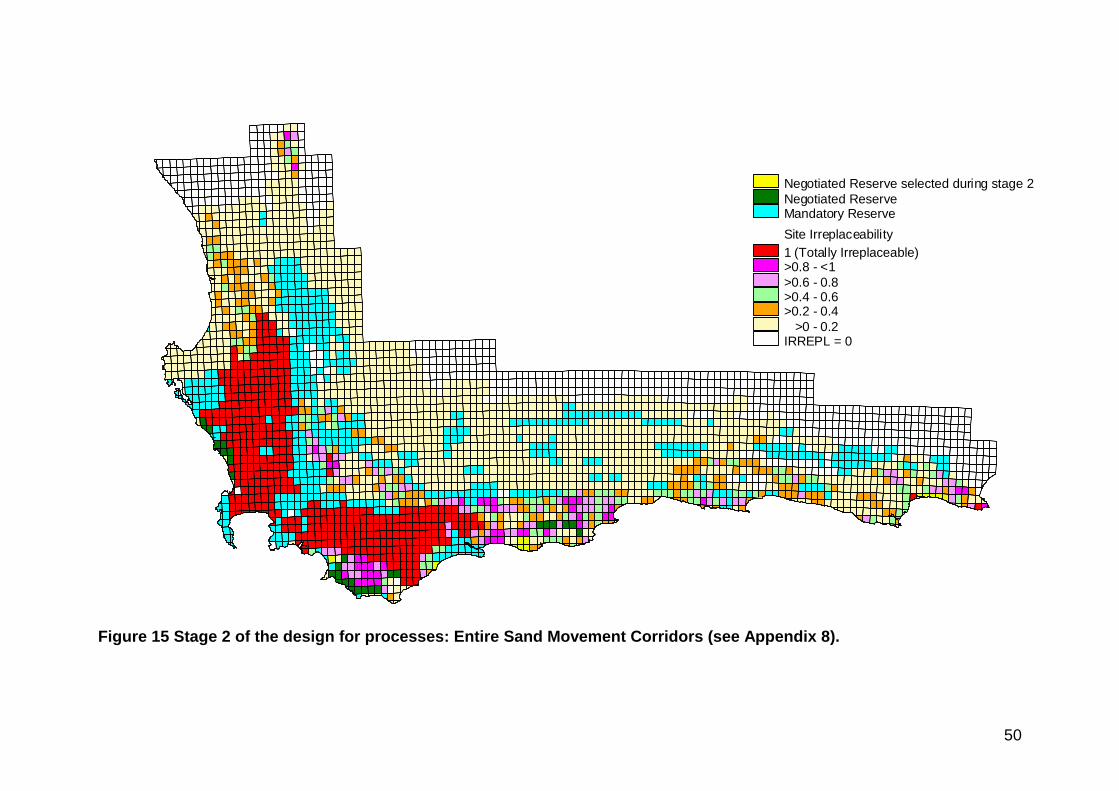
Figure 15 Stage 2 of the design for processes: Entire Sand Movement Corridors (see Appendix 8).
Negotiated ReserveMandatory Reserve
1 (Totally Irreplaceable)>0.8 - <1>0.6 - 0.8>0.4 - 0.6>0.2 - 0.4 >0 - 0.2IRREPL = 0
Site Irreplaceability
Negotiated Reserve selected during stage 2

51
Figure 16 Stage 3 of the design for processes: Whole Riverine Corridors (see Appendix 8).
Negotiated ReserveMandatory Reserve
1 (Totally Irreplaceable)>0.8 - <1>0.6 - 0.8>0.4 - 0.6>0.2 - 0.4 >0 - 0.2IRREPL = 0
Site Irreplaceability
Negotiated Reserve selected during stage 3
52
Figure 17 Stage 4 of the design for processes: Lowland- Upland Gradients (see Appendix 8).
Negotiated ReserveMandatory Reserve
1 (Totally Irreplaceable)>0.8 - <1>0.6 - 0.8>0.4 - 0.6>0.2 - 0.4 >0 - 0.2IRREPL = 0
Site Irreplaceability
Negotiated Reserve selected during stage 4

53
Figure 18 Stage 1 of the design for processes: Macroclimatic Gradients (see Appendix 8).
Negotiated ReserveMandatory Reserve
1 (Totally Irreplaceable)>0.8 - <1>0.6 - 0.8>0.4 - 0.6>0.2 - 0.4 >0 - 0.2IRREPL = 0
Site Irreplaceability
Negotiated Reserve selected during stage 5

54
Figure 19 Stage 6 of the design for processes: Mega Wilderness Areas (see Appendix 8).
Negotiated ReserveMandatory Reserve
1 (Totally Irreplaceable)>0.8 - <1>0.6 - 0.8>0.4 - 0.6>0.2 - 0.4 >0 - 0.2IRREPL = 0
Site Irreplaceability
Negotiated Reserve selected during stage 6

55
Figure 20 Stage 7 of the design for processes: Transitions between Primary BHUs and Biomes (“mopping up”) (see Appendix 8).
Negotiated ReserveMandatory Reserve
1 (Totally Irreplaceable)>0.8 - <1>0.6 - 0.8>0.4 - 0.6>0.2 - 0.4 >0 - 0.2IRREPL = 0
Site Irreplaceability
Negotiated Reserve selected during stage 7

56
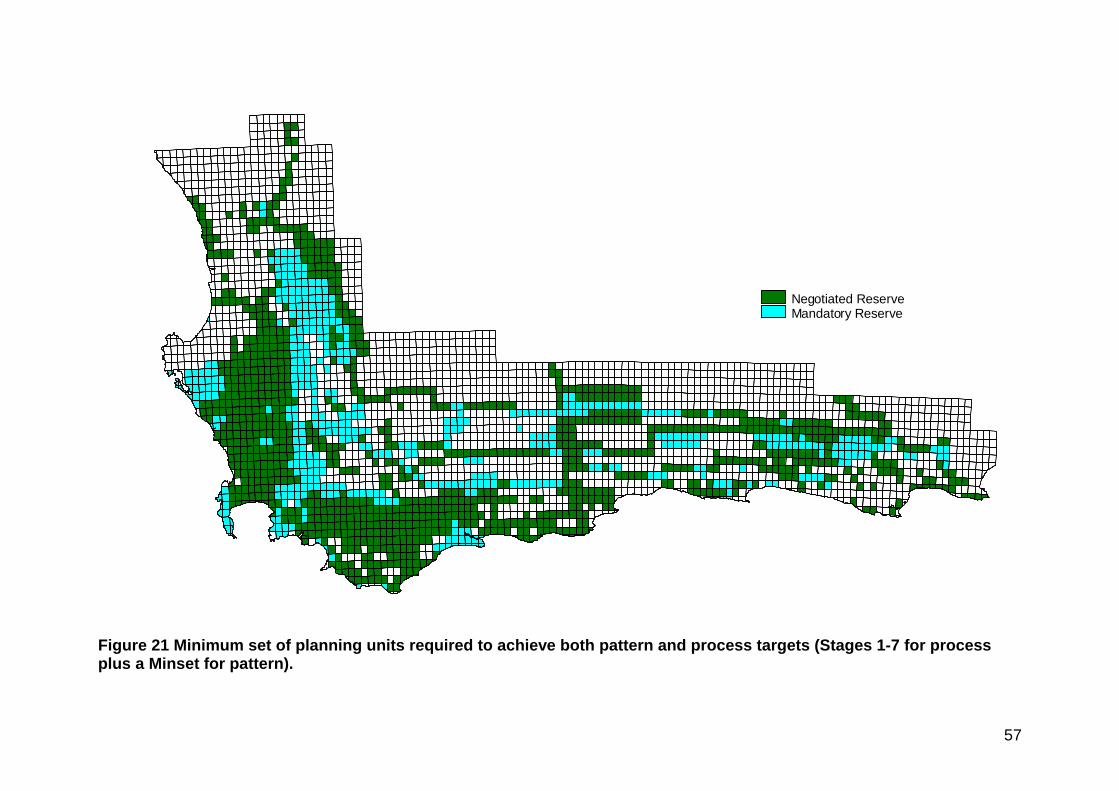
process targets: these are in the Cederberg (ca 600 000 ha), Little Karoo (ca 480 000 ha) and Baviaanskloof (ca 420 000 ha) (Figure 19). Pattern and process The conservation system designed for the for the achievement of both pattern and process targets is shown in Figure 21. This system was identified by selecting all units chosen for process targets as mandatory reserves, and then running a Minset to fulfill pattern targets for those BHUs that are underrepresented in the notional system. This system represents the culmination of the planning process – a system of reserves that is designed to sustain ecological and evolutionary processes indefinitely (Cowling et al 1999). However, owing to extensive habitat loss on the lowlands, the achievement of most process targets, other than for processes that can be sustained in very small to small (5 – 1000 ha) areas, is no longer possible (Table 8). In addition to the 494 mandatory (Category 1 and Category 2) reserves, the system requires 1057 planning units (Table 7). Thus, the entire system comprises about 48% of the planning domain. Most of these additional units for process targets are located in the mountains where there is sufficient available habitat to achieve them (Figures 14-20). Consequently, many Mountain Complex BHUs are massively overrepresented in the system in terms of pattern targets (e.g. Baviaanskloof (956% of total target [T] in Appendix 4), Groot Swartberg (883%), Kamanassie (874%), Koo Langeberg (789%), Kouga (722%), Southern Langeberg (732%), Rooiberg (910%)) (Appendix 7). However, in order to achieve pattern targets, all planning units with extant habitat of lowland BHUs where total targets are in excess of available habitat (see Appendix 4), were selected in the Minset analysis (see also sections on Targets and Irreplaceability). Reserve type and location Table 8 lists the types of reserves, characterized in terms of size; their location; and their role in the conservation of pattern and process, that are required to achieve biodiversity conservation targets in the CFR. Thus, Table 8 comprises a list of actions that should be implemented in order to achieve effective conservation of the region. Actions range from the establishment of very small (5-500 ha) reserves in fragmented BHUs of high overall irreplaceability, to the creation of mega conservation areas comprising more than 500 000 ha. It is important to note that we do not recommend the abandonment of irreplaceable habitat that is located in small fragments within a transformed matrix. There is sufficient evidence to show that both plant and invertebrate diversity persists in very small fragments of renosterveld and fynbos, provided the appropriate fire regime is maintained (Bond et al 1988, Cowling and Bond 1991, Kemper et al 1999, Donaldson et al subm). Clearly, however, implementation of a reserve system in these
57
Figure 21 Minimum set of planning units required to achieve both pattern and process targets (Stages 1-7 for process plus a Minset for pattern).
Negotiated ReserveMandatory Reserve
58
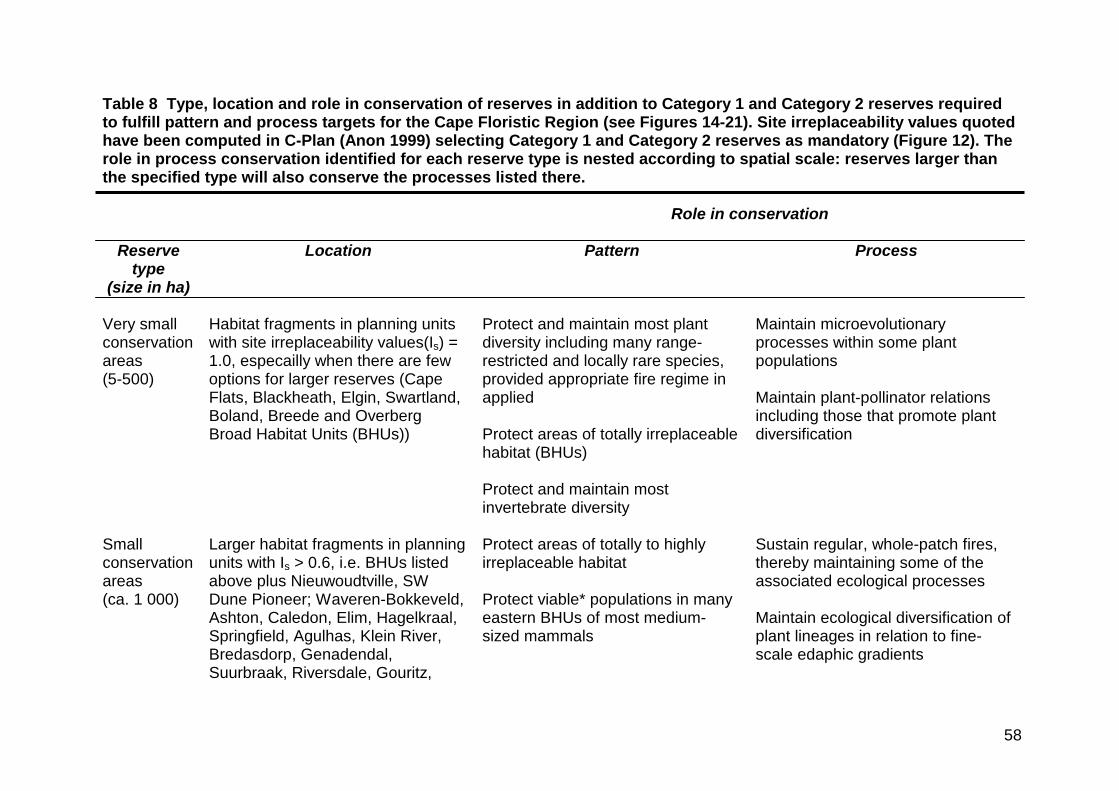
Table 8 Type, location and role in conservation of reserves in addition to Category 1 and Category 2 reserves required to fulfill pattern and process targets for the Cape Floristic Region (see Figures 14-21). Site irreplaceability values quoted have been computed in C-Plan (Anon 1999) selecting Category 1 and Category 2 reserves as mandatory (Figure 12). The role in process conservation identified for each reserve type is nested according to spatial scale: reserves larger than the specified type will also conserve the processes listed there.
Role in conservation
Reserve type
(size in ha)
Location Pattern Process
Very small conservation areas (5-500)
Habitat fragments in planning units with site irreplaceability values(Is) = 1.0, especailly when there are few options for larger reserves (Cape Flats, Blackheath, Elgin, Swartland, Boland, Breede and Overberg Broad Habitat Units (BHUs))
Protect and maintain most plant diversity including many range-restricted and locally rare species, provided appropriate fire regime in applied Protect areas of totally irreplaceable habitat (BHUs) Protect and maintain most invertebrate diversity
Maintain microevolutionary processes within some plant populations Maintain plant-pollinator relations including those that promote plant diversification
Small conservation areas (ca. 1 000)
Larger habitat fragments in planning units with Is > 0.6, i.e. BHUs listed above plus Nieuwoudtville, SW Dune Pioneer; Waveren-Bokkeveld, Ashton, Caledon, Elim, Hagelkraal, Springfield, Agulhas, Klein River, Bredasdorp, Genadendal, Suurbraak, Riversdale, Gouritz,
Protect areas of totally to highly irreplaceable habitat Protect viable* populations in many eastern BHUs of most medium-sized mammals
Sustain regular, whole-patch fires, thereby maintaining some of the associated ecological processes Maintain ecological diversification of plant lineages in relation to fine-scale edaphic gradients

59
Stilbaai, Albertinia, Knysna, Goukamma, Keurbooms, Langkloof, Kromme, St Francis, Aloes, Alexandria and Algoa
Maintain plant-herbivore relationships associated with medium-sized mammals in many eastern BHUs
Medium-sized conservation areas (5 000 – 10 000)
Appropriately-sized, untransformed areas of BHUs with ls values > 0.6 (see above) although options are largely restricted to Niewoudtville, Piketberg, SW Dune Pioneer, Ashton, Caledon, Klein River, Springfield, Hagelkraal, Bredasdorp, S Dune Pioneer, Canca, Knysna, Keurbooms, Kromme, SE Dune Pioneer and Alexandria
Protect areas of highly irreplaceable habitat Protect viable populations in all BHUs of most medium-sized mammals
Support managed, compartment-based, fire regime, thereby maintaining most fire-associated ecological and evolutionary processes Maintain diversification of plant lineages in relation to mesoclimatic and larger-scale edaphic gradients Maintain, for smaller mobile dunefields, inland movement of sands and gradients of soil development important for soil-specific plant assemblages and diversification of plant species.
Large conservation areas (25 000 – 100 000)
1. NW section of N-S climatic gradient on coastal lowlands in the western CFR (Namaqualand, Knersvlakte, Leipoldtville and Lamberts Bay)
2. Coastal section of W-E climatic gradient in the western CFR (Lamberts Bay, Leipoldtville, Olifants River)
3. N section of N-S climatic
Protect some areas of highly irreplaceable habitat Contribute to fulfilling targets for areas of moderate to low irreplaceability Protect viable populations in many BHUs of some megaherbivores
Support - under certain circumstances - a natural fire regime, thereby maintaining associated ecological and evolutionary processes Maintain plant-herbivore relationships associated with some megaherbivores, and predator-prey relationships associated with smaller
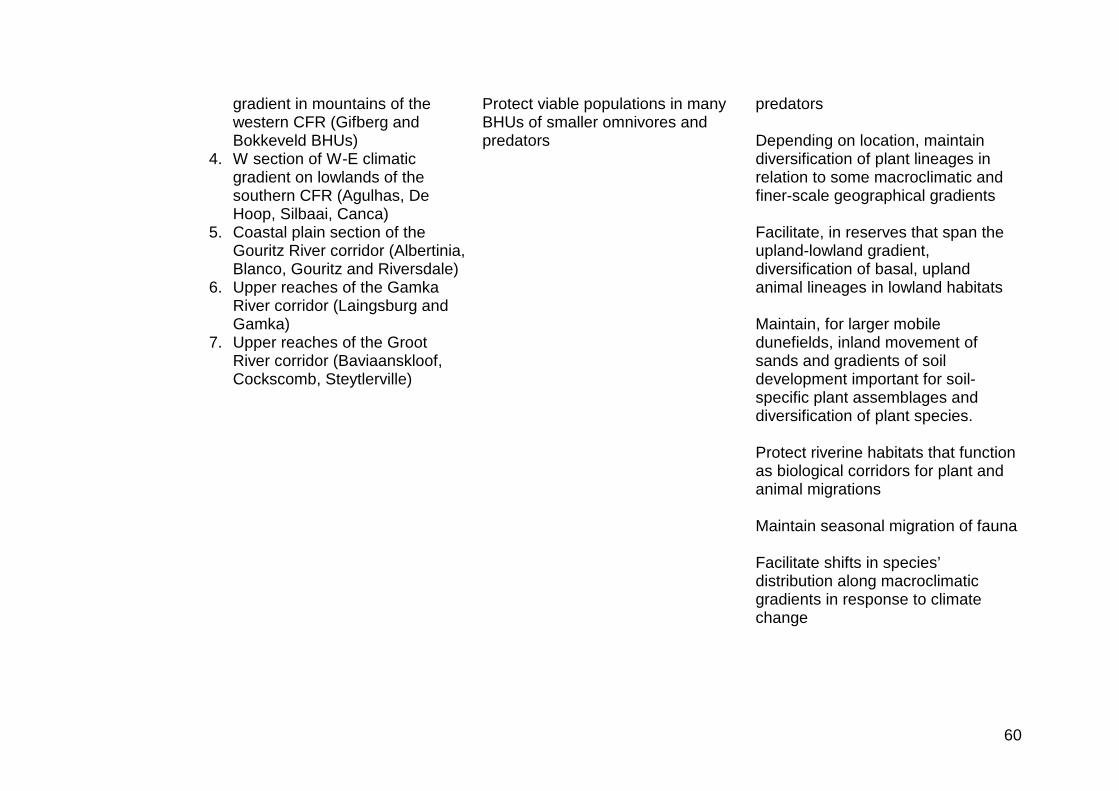
60
gradient in mountains of the western CFR (Gifberg and Bokkeveld BHUs)
4. W section of W-E climatic gradient on lowlands of the southern CFR (Agulhas, De Hoop, Silbaai, Canca)
5. Coastal plain section of the Gouritz River corridor (Albertinia, Blanco, Gouritz and Riversdale)
6. Upper reaches of the Gamka River corridor (Laingsburg and Gamka)
7. Upper reaches of the Groot River corridor (Baviaanskloof, Cockscomb, Steytlerville)
Protect viable populations in many BHUs of smaller omnivores and predators
predators Depending on location, maintain diversification of plant lineages in relation to some macroclimatic and finer-scale geographical gradients Facilitate, in reserves that span the upland-lowland gradient, diversification of basal, upland animal lineages in lowland habitats Maintain, for larger mobile dunefields, inland movement of sands and gradients of soil development important for soil-specific plant assemblages and diversification of plant species. Protect riverine habitats that function as biological corridors for plant and animal migrations Maintain seasonal migration of fauna Facilitate shifts in species’ distribution along macroclimatic gradients in response to climate change

61
Mega conservation areas (250 000 – 1 000 000)
Additions to existing reserves to create mega conservation areas in the following three areas: 1. Cederberg (Gifberg, Tanqua,
Swartruggens, Koue Bokkeveld) 2. Little Karoo (Gamka, Laingsburg,
Prince Albert, Matjies, Willowmore, Klein Swartberg, Cango, Groot Swartberg, Spekboom, Oudtshoorn, Rooiberg, Little Karoo, Cannaland, Langeberg and Outeniqua)
3. Baviaanskloof (Steytlerville, Baviaanskloof, Little Karoo, Cockscomb, Willowmore, Kouga, Humansdorp, Gamtoos, Langkloof)
Protect areas of mainly low irreplacewability Protect viable populations in most BHUs of top predators Protect viable populations in eastern BHUs of all megaherbivores
Support natural fire regime, thereby maintaining associated ecological and evolutionary processes Depending on location, maintain plant-herbivore relationships associated with all megaherbivores, and predator-prey relationships associated with top predators
Mega corridor reserves (250 000 – 500 000)
Additions to existing reserves to create mega corridor conservation along the follwing following four transects: 1. Western CFR: N-S climatic
gradient in mountains (Knersvlakte, Bokkeveld, Gifberg, Groot Winterhoek, Boland, Waveren-Bokkeveld, Kogelberg, Franschhoek)
2. Southern and southeastern CFR: W-E climatic gradient in coastal mountains (Koo Langeberg,
Protect areas of mainly low irreplaceability
Role in process conservation dependent on shape and size of corridor Maintain migratory routes and evolutionary fronts between major climatic zones Facilitate shifts in species’ distribution along macro-scale gradients, in response to climate change

62
Ashton, Robertson, Waboomsberg, Montagu, Langeberg, Suurbraak, Swellendam, Cannaland, Outeniqua, Tsitsikamma)
3. Southern and southeastern CFR: W-E climatic gradient in inland mountains (Swartruggens, Matroosberg, Tanqua, Witteberg, Koue Bokkeveld, Touws, Witrantjies, Klein Swartberg, Prince Albert, Little Karoo, Willowmore, Spekboom, Cango, Groot Swartberg, Uniondale, Baviaanskloof, Steytlerville, Humansdorp, Cockscomb, Sundays)
4. Southern and southeastern CFR: W-E climatic gradient in interior basin (Witrantjies, Montagu, Cannaland, Little Karoo, Oudtshoorn, Rooiberg, Spekboom, Uniondale)
*Genetically viable population assumed to comprise ca 200 individuals (Boshoff and Kerley 1999) fragmented landscapes will require a special approach (see below and section on Implementation). A great deal of work has already been done on identifying candidate conservation areas on the lowlands of the CFR generally (Hall 1984, Jarman 1986, Burgers et al 1987, Rebelo and Siegfried 1992, Rebelo 1997), as well as for specific areas (Hagelkraal, De Hoop and Canca BHUs – Willis et al 1996; Agulhas Plain – Lombard et al 1997; West Coast Biosphere Reserve domain – Heijnis et al 1999; Cape Flats –

63
Maze and Rebelo 1999). In some of these areas (Agulhas Plain, West Coast Biosphere Reserve and Cape Flats), conservation actions are currently being implemented. It is essential that the CAPE Project keeps track of these developments and consults the results of all finer-scale studies when considering recommendations for fine-tuning the outcomes of this study. Case studies In the part of this section we describe some interventions by focusing on specific areas at a finer scale than that in Figures 14 –21. These case studies should provide an assessment of the constraints and opportunities for establishing an effective conservation system for the CFR. West Coast forelands (Figure 22) The final outcome here is very similar to that produced by Heijnis et al (1999). A number of features are worth noting. • High priority units (i.e. with high irreplaceability and high vulnerability; see section on Implementation) containing renosterveld
habitat can incorporated by expanding the existing reserves in the mountains onto the coastal plain. Similalrly, a reserve established for the Piketberg BHU should encompass habitat of Swartland Coast Renosterveld at the base of the Piketberg Mountain.
• Large remnants of renosterveld should be considered as options for developing a small (ca 1000 ha) reserves. Remnant habitat provides the core of the reserve, while restoration of the matrix provides a link between fragments. Such reserves should be adjacent to larger reserves in the mountains. In this way it should be possible to achieve some of the reservation target for the renosterveld BHUs.
• Incentives must be instituted to prevent further loss of renosterveld habitat within the agricultural matrix. • The Hopefield conservancy plays an very important role in achieving pattern as well as process targets (specifically for
sustaining edaphic diversification processes and contributing habitat for the N – S gradient Appendix 8). • The functioning of the Atlantis dunefield has been compromised by habitat loss on its downwind margin. • Category 2 reserves play an important role in conserving the Perdeberg BHU. • The maintenance of processes over much of the forelands has been irreversibly compromised by transformation. Agulhas Plain (Figure 23) The final outcome here is very similar to that produced by Lombard et al (1997). A number of features are worth noting. • Generally, there is sufficient extant habitat to achieve many pattern and process targets within a system of small to medium-
sized reserves (see also Heydenrych et al 1999). • Options for the conservation of the Elim BHU are much better than many allied BHUs on the lowlands. • The area offers the only option for conserving the SW Dune Pioneer BHU.

64
Figure 22 Planning detail: West Coast Forelands.
Negotiated ReserveMandatory ReserveCategory 1 ReservesCategory 2 ReservesTransformed Areas
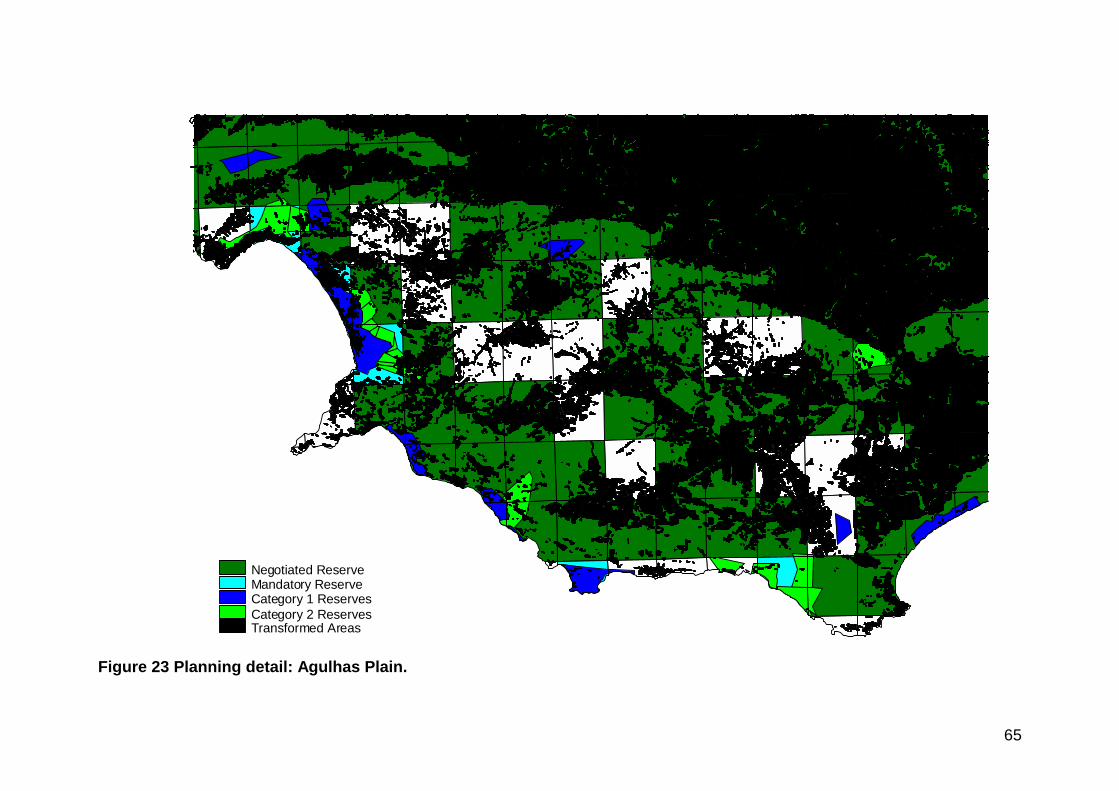
65
Figure 23 Planning detail: Agulhas Plain.
Negotiated ReserveMandatory ReserveCategory 1 ReservesCategory 2 ReservesTransformed Areas
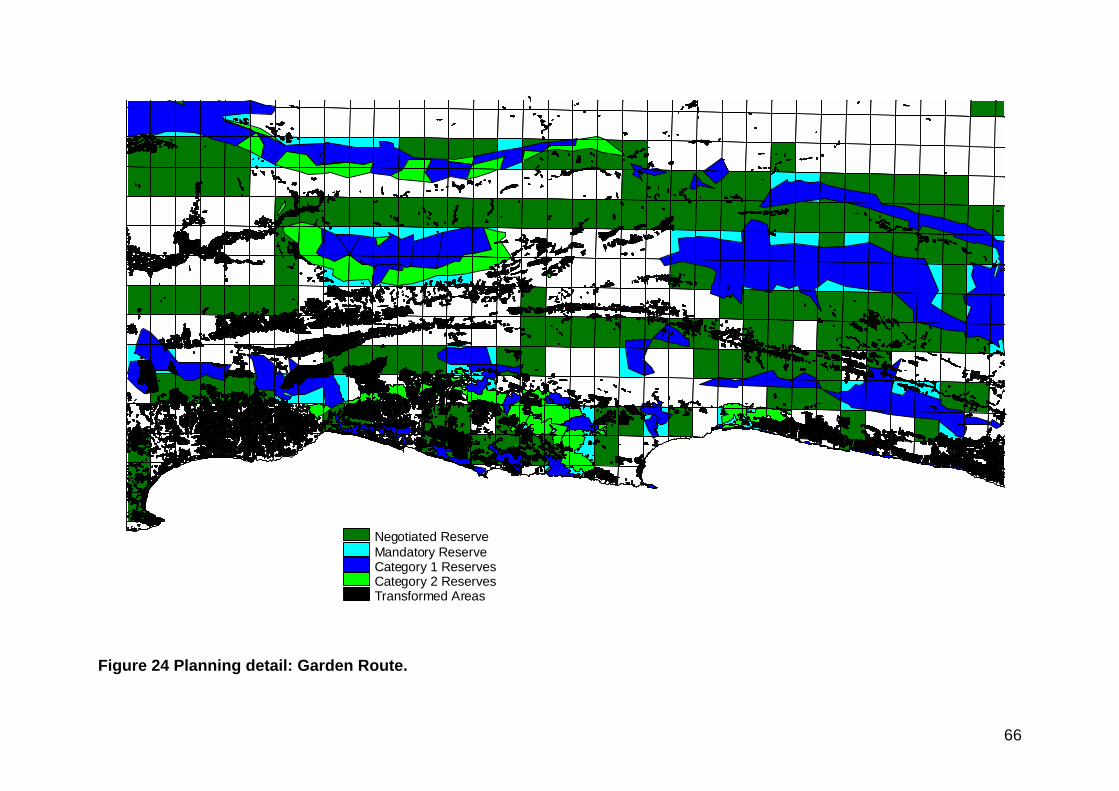
66
Figure 24 Planning detail: Garden Route.
Negotiated ReserveMandatory ReserveCategory 1 ReservesCategory 2 ReservesTransformed Areas

67
Figure 25 Planning detail: Cederberg mega reserve.
Negotiated ReserveMandatory ReserveCategory 1 ReservesCategory 2 ReservesTransformed Areas

68
Figure 26 Planning detail: Little Karoo mega reserve.
Negotiated ReserveMandatory ReserveCategory 1 ReservesCategory 2 ReservesTransformed Areas

69
Figure 27 Planning detail: Baviaanskloof mega reserve.
Negotiated ReserveMandatory ReserveCategory 1 ReservesCategory 2 ReservesTransformed Areas

70
• Category 2 reserves play an important role in the conservation of the coastal margin. • Every effort must be made to prevent further loss of habitat that will compromise the achievement of process targets, especially
the maintenance of gradients from alkaline-soil (coastal) BHUs to acidic-soil (inland) BHUs. Particular attention must be given to sites that are vulnerable to agricultural transformation and coastal resort development (urbanization).
Garden Route (Figure 24) Despite a long history of transformation and threats from agriculture, forestry, alien plants and urbanization (Figures 5-7), no detailed biocentric plans exist for the Garden Route. We make the following comments on the outcomes of our plan. • The mountains are relatively secure, and provide opportunities for maintaining part of a continuos chain of conservation land
from the Matroosberg to the Tsitsikamma BHUs. • The coastal forelands have been heavily transformed and are highly vulnerable to all threatening processes (see Figures 28 –
30). • Of the three major BHUs of the lowlands, Category 1 reserves comprise only 50% of the total reservation target for Goukamma,
25% for Knysna and 0% for Keurbooms. However, there is sufficient extant habitat to achieve targets for all of these BHUs. • There is potential to expand the Tsitsikamma National Park by linking it with mountain reserves. Cederberg mega conservation area (Figure 25) The Cederberg area provides excellent potential for a mega conservation area (ca 600 000 ha) representative of the strong winter rainfall zone of the CFR. We make the following observations. • The area spans the gradient from mesic mountain fynbos to desert conditions, encompassing two biomes and four BHUs. • Owing to the low productivity of the region, it will not be possible to maintain viable populations of megaherbivores and some
top predators, unless the Tanqua Karoo portion is massively expanded. In this respect, a link to the Tanqua Karoo National Park, and hence to the Roggeveld Escarpment, should be given serious attention.
• Category 2 reserves will play an important role in the establishment of the conservation area. Considerable progress has been made in the establishment of conservancies.
• Much of the area is an important water catchment zone. Little Karoo mega conservation area (Figure 26) This area spans an extremely long environmental and biological gradient: from the arid and thermally extreme Nama Karoo to the moist and mild coastal mountains. It encompasses four biomes (as well as small patches of forest), 15 BHUs and an important riverine corridor. We make the following additional comments.

71
• While much of the montane areas are relatively secure and not threatened, the same is not true of the foothills. In this respect, it is absolutely crucial to ensure protection of the link between the Rooiberg and Klein Swartberg BHUs in the north, and between the Rooiberg and Outeniqua BHUs in the south. Both of these links encompass habitat (Inland Renosterveld) that is vulnerable to further transformation (Figure 5).
• Owing to the more productive nature of many of the component BHUs (especially Spekboom, Little Karoo, Willowmore etc), it should be possible to maintain viable populations of most larger mammals, including megaherbivores. However, caution should be exercised when considering the introduction of elephant.
• Category 2 reserves (especially conservancies) play an important role in this area. However, every effort must be made to secure as Category 1 reserves the links between the Rooiberg and the coastal and inland mountains.
• The mountain areas are important water catchment zones. Baviaanskloof mega conservation area (Figure 27) Like the previous area, this reserve spans the gradient from the Nama Karoo to mesic fynbos. However, it also includes a tongue of mesic subtropical thicket (Gamtoos) and other attributes more typical of biomes to the east of the CFR. Overall it encompasses three biomes and nine BHUs. We make the following additional comments. • Owing to the more productive nature of these eastern landscapes, especially the thicket and savanna ecosystems of the
Baviaanskloof valley bottom, this area represents the only potential reserve in the CFR where it should be possible to maintain populations of all mammal species.
• The Baviaanskloof and Kouga Rivers and associated catchments are extremely important for Port Elizabeth’s water supply. In this respect, conservation management of the Baviaanskloof River catchment is an urgent priority. However, the valley still supports settled agriculture, although this is on the decline.
• Most of the remaining area is under little threat at present. • Plans for a Greater Baviaanskloof Wilderness Area are relatively far advanced (Derek Clarke pers comm). In conclusion, we stress once more that we have produced a notional system of conservation areas. Each and every one of the potential reserves should be subject to evaluation for other options and/or further investigation at a finer scale. Furthermore, the expansion of the reserve system is subject to financial, economic, legal and institutional constraints, all of which must be considered. This, however, is the task of the Module 3 component of the CAPE Project (CSIR 1999).
72
Implementation There have been many plans, using a variety of ad hoc and systematic approaches, to identify improvements to the conservation system of the CFR (Kruger 1977, Hall 1984, Jarman 1986, Burgers et al 1987, Rebelo and Siegfried 1992, Trinder-Smith et al 1996, Willis et al 1996, Lombard et al 1997, Rebelo 1997, Heijnis et al 1999, Maze and Rebelo 1999). As mentioned in the section on Location and design, the fine-scale studies on the lowlands (Hall 1984, Jarman 1986, Burgers et al 1987, Willis et al 1996, Lombard et al 1997, Heijnis et al 1999) must be consulted by the implementation agency when considering options for identifying an expanded conservation system. The CFR-wide studies are not systematic in approach (Kruger 1977); are biased in favour of fynbos-centred taxa (Rebelo and Siegfried 1992); or use planning units of too large a scale for the identification of an effective notional system (Rebelo 1997). With the exception of Heijnis et al (1999), none of these studies provides a systematic approach for the identification of priorities for implementation based on impending threats to biodiversity. In this section we provide a brief overview of implementation priorities an actions for a conservation system for the CFR. We stress again the preliminary nature of our study and, therefore, do not provide a detailed account. Priorities Pressey and colleagues (e.g. Pressey et al 1996, 2000) have pioneered an approach for the identification of priorities based on the irreplaceability of a site (see section on Irreplaceability) and its vulnerability to impending threats to biodiveristy (see section on Threats). Those sites that score highly for both of these attributes are the highest priorities for conservation action; sites with low scores are lesser priorities. A problem with this approach is that irreplaceability is based on the contribution to pattern targets only; there is, as yet, no formal way for identifying irreplaceability based on contribution to process targets. What is more important for the allocation of scarce resources: conserving the last remaining fragments of a lowland BHU such as Swartland Coast Renosterveld, or securing the only option for keeping open a migratory corridor, for example the Gouda link in the Mesoclimatic Gradient in the mountains of the Western CFR. This is not a trivial question and there are no easy answers (Cowling et al 1999). This question begs an even more profound and fundamental one: how does one weigh up the relative importance of conserving for pattern versus process? In a changing world, isolated fragments of renosterveld may well be doomed, even if much of the biodiversity in these fragments has persisted in the face of 50 years of transformation (Kemper et al 1999, Donaldson et al subm). The maintenance of a migratory corridor, however, will enable biotas to shift, and lineages to diversify, in response to global environmental change. We present no formal approach to deal with this issue. However, we do recommend that in the fine-tuning and implementation phases of the
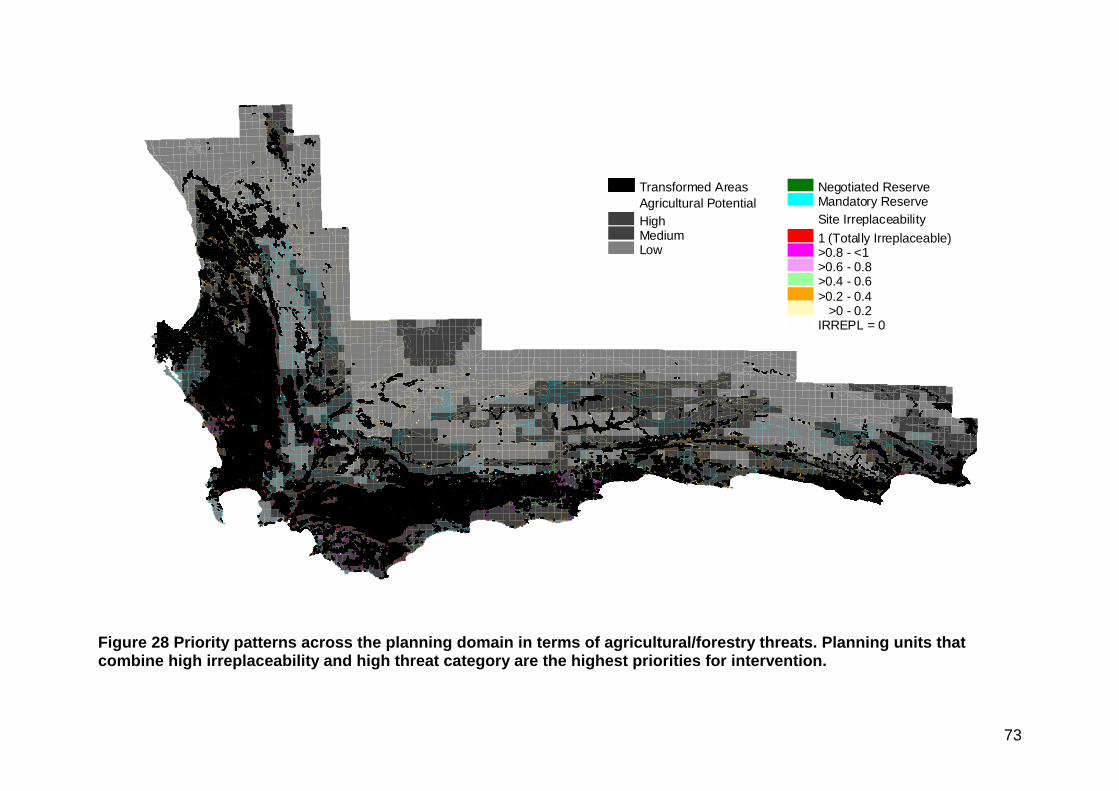
73
Figure 28 Priority patterns across the planning domain in terms of agricultural/forestry threats. Planning units that combine high irreplaceability and high threat category are the highest priorities for intervention.
HighMediumLow
Transformed AreasAgricultural Potential
Negotiated ReserveMandatory ReserveSite Irreplaceability1 (Totally Irreplaceable)>0.8 - <1>0.6 - 0.8>0.4 - 0.6>0.2 - 0.4 >0 - 0.2IRREPL = 0

74
Figure 29 Priority patterns across the planning domain in terms of urbanization threats. Planning units that combine high irreplaceability and high threat category are the highest priorities for intervention.
HighMediumLow
Transformed AreasUrbanisation Potential
Negotiated ReserveMandatory ReserveSite Irreplaceability1 (Totally Irreplaceable)>0.8 - <1>0.6 - 0.8>0.4 - 0.6>0.2 - 0.4 >0 - 0.2IRREPL = 0

75
Figure 30 Priority patterns across the planning domain in terms of alien plant threats. Planning units that combine high irreplaceability and high threat category are the highest priorities for intervention.
HighMediumLow
Transformed AreasAlien Potential
Negotiated ReserveMandatory ReserveSite Irreplaceability1 (Totally Irreplaceable)>0.8 - <1>0.6 - 0.8>0.4 - 0.6>0.2 - 0.4 >0 - 0.2IRREPL = 0

76
CAPE Project, process aspects are considered when interpreting the pattern irreplaceability-vulnerability patterns presented in Figures 27-29. The priority patterns presented in Figures 27-29 are relatively crude both in terms of predictions and spatial scale. Nonetheless, planning units that score high for both irreplaceability and vulnerability should receive special attention in the implementation phase of the project. Finer-scale studies should identify priorities in terms of cadastral units – the appropriate planning units for real-world implementation. How this is done will be shown in the next phase of the Terrestrial Biodiversity Component of the Project, using a 1: 10 000 scale plan for the Agulhas Plain. Conservation action There are a range of conservation actions available for the CAPE Project, using both Category 1 and Category 2 reserves. These are detailed in CSIR (1999). We do not provide recommendations here. Suffice to say that it will not be feasible to achieve all, or even most of the biodiversity targets in strict (Category 1) reserves. Category 2 reserves are likely to play an important role in achieving process targets that are especially land hungry, and in retaining extant habitat in highly fragmented, threatened and irreplaceable BHUs (e.g. Coast Renosterveld). Some category 2 reserves currently play a very important role in achieving targets (e.g. the conservancies in the Hopefield BHU and along the lower reaches of the Breede River). These initiatives need to be strongly supported. Nonetheless, areas that are crucially important for achieving some process targets, such as vulnerable linkages along gradients, must be afforded strict reservation status in order to secure the long-term maintenance of these processes.
77
Continuity The decision support system that we have developed for this Project, comprising C-Plan and ArcView (3.1) databases, is a planning tool that is dynamic. As more and better data become available, and reserves are added to conservation estate, the system will need to be updated. Moreover, it is possible to manipulate feature attributes and targets, thereby achieving different outcomes. The outcomes of our analyses, and any subsequent ones, are notional – they are hypotheses that predict a system of conservation areas that will best achieve pattern and process targets, and hence maintain and sustain biodiversity, over century-long time spans. Although these hypotheses can be tested using simulation techniques, only time can provide a rigorous means of falsifying them. All of the areas that we have identified for the notional conservation system require additional planning at a finer scale. Such planning will need to consider cadastral entities as planning units; improve the delimitation of land classes and incorporate additional biodiversity entities; incorporate spatial components for processes on a finer scale; obtain a better understanding of threats, especially in terms of socio-economic and political aspects; and assess the real world options for implementation. Studies on the Agulhas Plain (Lombard et al 1997, Heydenrych et al 1999) provide a starting point, but even here more work is required. Given the above, it is essential that the decision support system is curated and updated by appropriate implementing agencies. The system must not be allowed to stagnate. If this were to happen, it would no longer be possible to identify additions to the conservation system, and assess the impacts of future habitat loss, in a strategic and systematic way. Given mounting threats and escalating biodiversity loss, this would have tragic implications for the conservation of the CFR’s unique biodiversity.
78
Acknowledgements We gratefully acknowledge the following: • Our loved ones, for forbearance. • The Global Environmental Facility, especially Jan Bojo and Francois Falloux, for funding and guidance. • WWF:SA, especially Amanda Younge and Rob Little, for co-ordination and facilitation, respectively. • Wendy Paisley, of the IPC, for administrative support. • New South Wales National Parks and Wildlife Services for sanctioning Bob Pressey’s participation in the Project. • C Boucher (University of Stellenbosch), CJ Burgers (Western Cape Nature Conservation), N Fairall (University of
Stellenbosch), R Knight (University of the Western Cape), A le Roux (Western Cape Nature Conservation), HP Linder (University of Cape Town), DJ McDonald (National Botanical Institute), AV Rebelo (National Botanical Institute) and J Vlok (private consultant) for comments on the map of BHUs.
• Derek Clark (Directorate of Conservation: Eastern Cape), Jan Vlok (private consultant) and Tom Barry (Western Cape Nature Conservation) for discussions on reserve design.
• Matthew Watts (New South Wales Parks and Wildlife Services) for C-Plan support. • GIMS for GIS (ArcInfo and ArcView) support.
79
References∗∗∗∗ Anon 1999. C-Plan conservation planning software. User manual for C-Plan Version 2.2. New South Wales National Parks and
Wildlife Service, Armidale. Bibby CJ, Collar NJ, Crosby MJ, Heath MF, Imboden C, Johnson TH, Long AJ, Stattersfield AJ, Thirgood SJ. 1992. Putting
biodiversity on the map: priority areas for global conservation. International Council for Bird Preservation, Cambridge, United Kingdom.
Beardsley K and Stoms D 1993. Compiling a map of areas managed for biodiversity in California. Natural Areas Journal 13, 177-190.
Bond WJ, Midgley JJ and Vlok J 1988. When is an island not an island? Insular effects and their causes in fynbos shrublands. Oecologia 77, 512-521.
Boshoff AF and Kerley GIH 1999. Conservation planning in the Cape Floristic Region. Distribution, conservation status and spatial population requirements of medium to large-sized mammals. Report No. 20. Terrestrial Ecological Research Unit, University of Port Elizabeth.
Burgers CJ, Nel JG and Pool R (eds) 1987. Plan for Nature Conservation (Region A1). Recommendations for the conservation of lowland fynbos areas in the South Western Cape. Report for NAKOR. Department of Environment Affairs, Cape Town.
Cowling RM and Bond WJ 1991. How small can reserves be? An empirical approach in Cape fynbos, South Africa. Biological Conservation 58, 243-56.
Cowling RM and Heijnis CJ subm. Broad Habitat Units as biodiversity entities for systematic conservation planning in the Cape Floristic Region. South African Journal of Botany
Cowling RM and Hilton-Taylor C 1994. Patterns of plant diversity and endemism in southern Africa: an overview. In B.J. Huntley, Botanical diversity in southern Africa. Strelitzia 1: 31-52. National Botanical Institute, Pretoria.
Cowling RM, Pressey RL, Heijnis CJ, Richardson DM and Lombard AT 1998. Systematic conservation planning for the CAPE Project. Conceptual approach and protocol for the terrestrial biodiversity component. IPC Report 9803 submitted to WWF:SA.
Cowling RM, Pressey RL, Lombard AT, Desmet PG and Ellis 1999. From representation to persistence: requirements for a sustainable system of conservation areas in the species-rich mediterranean-climate desert of southern Africa. Diversity and Distributions 5, 1-21.
CSIR 1999. Cape Action Plan for the Environment. Module 3, Phase 1. Situation assessment and review. Legal, policy and institutional sectors. Environmentek: CSIR, Stellenbosch.
∗ Only those references presented in the body text (i.e. excluding Tables and Appendices) are listed here
80
Donaldson JS, Nänni I, Kemper J and Zachariades C. subm. Pollinator and plant reproductive potential in a fragmenetd landscape: does pollinator limitation contribute to an extinction debt for perennial plants in renosterveld vegetation, South Africa? Conservation Biology.
Ferrier S, Pressey RL and Barret TW 2000. A new predictor of the irreplaceability of areas for achieving a conservation goal, its application to real-world planning, and a research agenda for further refinements. Biological Conservation (in press).
Hall AV (ed) 1984. Proposals for nature conservation areas in the coastal lowlands of the south-western Cape Province. Report to the Minister of Environment Affairs. Department of Environment Affairs, Cape Town
Heijnis CE, Lombard AT, Cowling RM and Desmet PG 1999. Picking up the pieces: a biosphere reserve framework for a fragmented landscape - the coastal lowlands of the Western Cape. Biodiversity and Conservation 8, 471-496.
Heydenrych BJ, Cowling RM and Lombard AT 1999. Strategic conservation interventions in a region of high biodiversity and high vulnerability: a case study from the Agulhas Plain at the southern tip of Africa. Oryx 33, 256-269.
Higgins SI, Richardson DM, Cowling RM and Trinder-Smith TH 1999. Predicting the landscape-scale distribution of alien plants and their threat to biodiversity. Conservation Biology 13, 303-313.
IPC 1999a. Cape Action Plan for the Environment. Module 1 (Terrestrial Biodiversity Component). Component Report to WWF-South Africa: 1 Nov 1998 – 28 Feb 1999. Institute for Plant Conservation, University of Cape Town
IPC 1999b Cape Action Plan for the Environment. Module 1 (Terrestrial Biodiversity Component). Component Report to WWF-South Africa: 1 Mar – 30 Jun 1999. Institute for Plant Conservation, University of Cape Town.
Jarman ML 1986. Conservation priorities in lowland regions of the fynbos biome. South African national Programmes Report 87. CSIR, Pretoria.
Kemper J, Cowling RM and Richardson DM 1999. Fragmentation of of South African renosterveld shrublands: effects on plant community structure and conservation implications. Biological Conservation 90, 103-111.
Kruger FJ 1977. Ecological reserves in the Cape fynbos: towards a strategy for conservation. South African Journal of Science 73, 81-85.
Le Maitre DC, Van Wilgen BW, Chapman RA and McKelly DH 1996. Invasive plants and water resources in the Western Cape Province, South Africa: modelling the consequences of a lack of management. Journal of Applied ecology 33, 161-172.
Lloyd JW, van den Berg EC and van Wyk E 1999 The mapping of threats to biodiversity in the Cape Floristic Region with the aid of remote sensing and geographic information systems. Agricultural Research Council – Institute for Soil, Climate and Soil Report No. GW/A1999/54. ARC, Pretoria.
Lombard, A.T., Cowling, R.M., Pressey, R.L. & Mustart, P.J. 1997. Reserve design on the Agulhas Plain, South Africa: a flexible tool for conservation in a species-rich and fragmented landscape. Conservation Biology 11, 1101-1116.
Low, A.B. & Rebelo, A.G. (eds) (1996). Vegetation of southern Africa. Department of Environmental Affairs and Tourism, Pretoria.

81
Maze KE and Rebelo AG 1999. Core flora conservation areas on the Cape Flats. FCC Report 99/1. Botanical Society of South Africa, Newlands.
Mittermeier RA, Myers N, Thomsen JB, Fonse GAB and Olivieri S 1998. Biodiversity hotspots and major tropical wilderness areas: approaches to setting conservation priorities. Conservation Biology 12, 516-520.
Olson DM and Dinerstein E 1998. The global 200: a representation approach to conserving the earth’s most biologically valuable ecoregions. Conservation Biology 12, 502-515.
Pressey RL 1999a. Editorial – systematic conservation planning for the real world. Parks 9, 1-6. Pressey RL 1999b. Applications of irreplaceability analysis to planning and management. Parks 9, 42-51. Pressey RL, Ferrier S, Hutchinson CD, Siverstein DP and Manion G 1995. Planning for negotiation: using an interactive
geographic information system to explore alternative protected area networks. Nature conservation 4 – the role of networks (ed. by D.A. Saunders, J.L. Craig and E.M. Mattiske), pp. 23-33. Surrey Beatty and Sons, Sydney.Pressey et al 1996
Pressey RL, Ferrier S, Hager TC, Woods CA, Tully SL and Weiman KM (1996) How well protected are the forests of north-eastern New South Wales? – Analyses of forest environments in relation to formal protection measures, land tenure, and vulnerability to clearing. Forest Ecology and Management. 85, 311-333
Pressey RL, Hager TC, Ryan KM, Schwartz J, Wall S, Ferrier S and Creaser PM 2000. Terrestrial reserves in New South Wales: gaps, biases, and priorities to minimize further loss of native vegetation. Biological Conservation (in press).
Pressey RL, Humphries CJ, Margules CR, Vane-Wright RI and Williams PH (1993) Beyond opportunism: key principles for systematic reserve selection. Trends in Ecology and Evolution 8, 124-128.
Pressey, R.L. Johnson, I.R. and Wilson, P.D. (1994) Shades of irreplaceability: towards a measure of the contribution of sites to a reservation goal. Biodiversity and Conservation 3, 242-262.
Rebelo, A.G. (1992) Preservation of biotic diversity. The ecology of fynbos. Nutrients, fire and diversity (ed. by R.M. Cowling), pp. 309-344. Oxford University Press, Cape Town.
Rebelo, A.G. (1997) Conservation. Vegetation of southern Africa (ed by RM Cowling,. DM Richardson and SM Pierce), pp 571-590. Cambridge University Press, Cambridge.
Rebelo, A.G. & Siegfried, W.R. (1992) Where should nature reserves be located in the Cape Floristic Region, South Africa? Models for the spatial configuration of a reserve network aimed at maximizing the protection of floral diversity. Conservation Biology 6, 243-252
Richardson DM, Macdonald IAW, Holmes PM and Cowling RM 1992. Plant and animal invasions. The ecology of fynbos. Nutrients, fire and diversity (ed by RM Cowling), pp 271-308. Oxford University Press, Cape Town.
Trinder-Smith TH, Lombard AT and Picker MD 1996. Reserve scenarios for the Cape Peninsula: high, middle and low road options for conserving the remaining biodiversity. Biological Conservation 5, 649-669.
82
Willis, C.K., Lombard, A.T., Cowling, R.M., Heydenrych, B.J. & Burgers, C.J. (1996) Reserve systems for the limestone endemic flora of the Cape lowlands: iterative vs linear programming techniques. Biological Conservation 77, 53-62.
WWF and IUCN 1994. Centres of plant diversity: a guide and strategy for their conservation. Volume 1. Europe, Africa, South West Africa and the Middle East. IUCN Publications Unit. Cambridge, United Kingdom.

83