Embed Size (px)
Citation preview

(Supplementary information)
Gas Storage and Separation in Water-Stable [CuI5BTT3]4- Anion
Framework Comprising Giant Multi-prismatic Nanoscale Cage
B. X. Dong,*a S. Y. Zhang,a W. L. Liu,a L. Chen,a J. Ge,a L. Songa and Y. L. Teng*a
College of Chemistry and Chemical Engineering, Yangzhou University, Yangzhou, 225002, P. R.
China. Fax: +86 51487975590-9201; Tel: +86 51487975590-9201; E-mail: [email protected]
(B-X. Dong); [email protected] (Y-L. Teng).
Contents:
1. Table S1. Crystal data and structure refinement for compound 1.
2. Table S2. Selected bond distances (Å) and angles (°) for 1.
3. Table S3. Atomic coordinates (×104) and equivalent isotropic displacement
parameters (Å ×103) for compound 1. U(eq) is defined as one third of the
trace of the orthogonalized Uij tensor.
4. Table S4. Valence bond calculations of three crystallographically independent Cu
centers in compound 1.
5. Figure S1. The structure of the H3BTT ligand.
6. Figure S2. Ortep drawing of the asymmetric unit of the compound 1 after
PLATON/SQUEEZE treatment.
7. Figure S3. Representations of the (a) μ6-btt3- and (b) μ8-btt3- ligand, as well as the
angles between planes in these two BTT ligands.
8. Figure S4. View of the 1D chain constructed by the tri-nuclear Cu3 clusters (a) and
bi-nuclear Cu2 clusters (b); (c) View of the 3D open anion framework of 1
embedded with meso-helical chains.
9. Figure S5. Representations of the four types of channels (a-d) and the giant cavity
(e) in compound 1.
Electronic Supplementary Material (ESI) for ChemComm.This journal is © The Royal Society of Chemistry 2015

10. Figure S6. The PXRD patterns for compound 1 after different test.
11. Figure S7. TG-DSC curves for the as-synthesized sample of 1 and samples after
exchanged with methanol and acetone solvents.
12. Figure S8. N2 and H2 sorption isotherms of 1a at 77K, solid, adsorption; hollow,
desorption.
13. Figure S9. The plot of the linear region for the BET equation of 1a (P0/P=
0.005−0.05).
14. Table S5. Low-pressure CO2 (273–298 K) or H2 (77 K) adsorption capacities in
selected metal-organic frameworks.
15. Table S6. Low-pressure (LP) and high-pressure (HP) gas sorption capacities of 1a
towards CO2, H2, N2 and CH4 at different temperatures.
16. Figure S10. Virial fitting for CO2 isotherms of 1a: (a) The CO2 adsorption
isotherms for 1a (solid circle, adsorption; hollow circle, desorption); (b) The
details of virial equation (solid lines) fitting to the experimental CO2
adsorption data (symbols) for 1a.
17. Figure S11. (a) The CO2 adsorption enthalpy of 1a; (b) CO2 sorption
isotherms of 1a of three consecutive cycles.
18. Figure S12. Comparisons of CO2 uptakes before and after water treatment
(immersion in liquid water for 1 day) at 273 and 298 K.
19. Figure S13. Low-pressure CO2/N2, CO2/CH4 and CO2/H2 initial slope
selectivity studies for 1a at 273 K (a) and 298 K (b).
20. Table S7. Low-pressure CO2/N2, CO2/CH4 and CO2/H2 selectivity results for 1a
analyzed by the initial slope ratio.
21. Figure S14. Low-pressure adsorption isotherms of CO2, H2 and N2 at 273 K (a)
and 298 K (b). Lines are fits to a dual-site Langmuir-Freundlich (DSLF) or
single-site Langmuir (SSL) equation.
23. Table S8. The refined parameters for the DSLF and SSL equations fit for the pure
isotherms of CO2, N2 and H2 in 1a at 273 K.
24. Table S9. The refined parameters for the DSLF and SSL equations fit for the pure
isotherms of CO2, N2 and H2 in 1a at 298 K.
S1

25. Figure S15. IAST selectivities of CO2 over N2 in 1a at different mixture
composition at 273 K (a) and 298 K (b).
26.Figure S16. IAST selectivites of CO2 over H2 in 1a at different mixture
compositions as a function of total pressure at 273 K (a) and 298 K
(b).
27. Figure S17. Gas cycling experiment for 1a under a mixed CO2–N2 (15:85
v/v) flow and a pure N2 flow at a constant temperature of 303 K for
35 cycles.
28. Figure S18. An enlargment of five cycles―TG-DSC curves from cycle 5th to
cycle 9th.
29. Figure S19. The IR spectra of the as-synthesized sample (a) and acetone-
exchanged one (b).
30. Table S10. The weight change for the special cycle in the gas cycling
experiment.
31. Table S11. High-pressure excess sorption and total sorption data of 1a.
S2

General Procedures.
All chemicals purchased were of reagent grade and were used as received. H3BTT
was synthesized according to a documented procedure.1 FT-IR spectrum (KBr pellets)
was recorded in range of 4000−400 cm–1 on a BRUKER TENSOR 27 Fourier-
transform infrared spectrometer. TGA/DSC measurement (TGA, Thermal gravimetric
analyses; DSC, Differential Scanning Calorimetry) were performed on a TG/DSC
Model STA 449 F3 Netzsch instrument at a ramp rate of 5 ºC min–1, by heating the
sample under argon. Powder XRD data were collected with CuKα (λ=1.5406 Å)
radiation on a Bruker-AXS D8 Advance X-ray diffractometer in the angular range 2θ
=5°−50° at 296 K. Each pattern is recorded with a 2 s per step scan.
Synthesis of [NC2H8]4Cu5(BTT)3·xG (G=guest molecule) (1)
16.0 mL DMA (N, N´-Dimethylacetamide) solution was added to a beaker,
which contains CuCl2·2H2O (0.068 g, 0.4 mmol) and H3BTT·2HCl (0.071 g,
0.2 mmol) with stirring for 30 min. Then the mixture was transferred and sealed
in a 23 mL Teflonlined stainless steel container, and heated at 140 °C for 3
days. After slow cooling to room temperature with the rate of 5 °C h–1, brown
crystals 1 were collected and washed with DMA. Finally, the resulting crystals
were dried in a vacuum oven at 80 °C for further treatment and characterization
(yield: ca.40.6 mg, 42.2% based on Cu). Prominent FT-IR peaks for 1 (KBr
Pellet, cm–1): 3379(w), 3059(w), 2781(m), 2472(m), 1663(s), 1610(s), 1465(m),
1414(s), 1259(w), 1099(m), 1020(m), 899(m), 794(s).
I. X-ray Crystallographic Study
Single-crystal X-ray diffraction analysis data was collected on a Bruker Smart
Apex II CCD diffractometer with Mo Kα monochromated radiation (λ=0.71073 Å) at
296 K. All absorption corrections were performed by using the SADABS program.
The structure was solved by direct methods and refined on F2 by full-matrix least-
squares methods using the SHELXTL package.2 Anisotropic thermal parameters were
used to refine all Cu, C and N atoms. After locating and refining the framework and
the counter ions, the difference Fourier map showed many peaks of very low
S3

electronic density, suggesting an extensive disordered of the solvent molecules. Thus,
the solvent molecules reside in those regions of diffuse electron density were treated
by the PLATON/SQUEEZE procedure,3 which suggested a unit cell accessible
volume of 12836.4 Å3 (about 40.5%). The hydrogen atoms attached to carbon
positions were placed in geometrically calculated positions. The crystal data and
structure refinement results of squeezed compound 1 are summarized in Table S1.
Selected bond lengths and angles are listed in Tables S2. Atomic coordinates and
equivalent isotropic displacement parameters are listed in Table S3. Valence bond
calculations for the three independent Cu centers in each asymmetric unit are listed in
Table S4. Crystallographic data for the structure reported in this paper has been
deposited in the Cambridge Crystallographic Data Center with CCDC number
1034129 for 1.
Calculation result of PLATON/SQUEEZE.
S4

II. Gas Sorption Measurements
In the gas sorption measurement, Ultra-high-purity grade N2, He, H2, CO2 (>99.999%
purity) and CH4 (>99.995% purity) gases were used throughout the adsorption
experiments. All of the measured sorption isotherms have been repeated several times
to confirm the reproducibility within experimental error.
Low-Pressure Gas Sorption Measurements
Low-pressure N2 adsorption measurements (up to 1 bar) were performed on a
Micromeritics ASAP 2020 HD88 surface area and pore size analyzer. About 200 mg
of acetone solvent-exchanged sample was degassed at 40 oC at the “degassing station”
of ASAP 2020 surface area and porosity analyzer under dynamic high vaccum (oil
pump) for 24 h and then at “analyzing station” under turbine molecular pump for 12 h.
High vacuum was maintained at a pressure < 1 μm Hg after 8 hours degassing at
“degassing station” and was maintained at a pressure < 0.05 μm Hg for the final 8
hours activation at the “analyzing station”. Helium was used for the estimation of the
dead volume, assuming that it is not adsorbed at any of the studied temperatures. A
part of the N2 sorption isotherm in the P/P0 range 0.005−0.05 was fitted to the BET
equation to estimate the BET surface area4 and the Langmuir surface area calculation
was performed using all data points.5
High-Pressure Gravimetric Gas Sorption Measurements
High-pressure excess adsorption isotherms of CO2, H2 and N2 were measured on a
Rubotherm MSB (magnetic suspension balance) apparatus by the gravimetric method.
About 120 mg fully desolvated samples were used for high-pressure sorption
measurements. The significance of the balance is ≤0.1 mg. Thus, a stainless steel
sample holder was filled with the fully desolvated sample and the balance was
evacuated for 24 h until constant mass was achieved. Afterwards, the gas was dosed
into the balance chamber to elevated pressure. Equilibrium was achieved within 30
min and identified by constant weight and pressure. The temperature was kept
constant with an accuracy of ±0.5 K for each measurement. The total gas uptake was
calculated using the following equation,6
S5
(1))1(100
gaspore
gasporeexcesstotal
VV
NN
where Ntotal is the total uptake amount of gas (wt%), Nexcess is the surface excess
uptake amount of gas (wt%), Vpore is the crystallographic pore volume (0.302 cm3 g−1
in this work) which is determined from the nitrogen isotherm, and ρgas (g cm−3) is the
density of the compressed gas as a function of pressure at certain temperature.7
III. Isosteric Heat of Adsorption (Qst) Calculations
A virial-type8 expression comprising the temperature-independent parameters ai
and bi was employed to calculate the enthalpies of adsorption for CO2 (at 273 and 298
K) on 1a. In each case, the data were fitted using the equation:
(2)j
n
0jj
im
0ii/1lnln NbNaTNP
Here, P is the pressure expressed in Torr, N is the amount adsorbed in mmol g−1, T is
the temperature in K, ai and bi are virial coefficients, and m, n represent the number of
coefficients required to adequately describe the isotherms (m and n were gradually
increased until the contribution of extra added a and b coefficients was deemed to be
statistically insignificant towards the overall fit, and the average value of the squared
deviations from the experimental values was minimized). The values of the virial
coefficients a0 through am were then used to calculate the isosteric heat of adsorption
using the following expression:
(3)i
m
0iist NaRQ
Qst is the coverage-dependent isosteric heat of adsorption and R is the universal gas
constant. The heat of CO2 sorption for 1a in this manuscript is determined by using
the excess sorption data measured in the pressure range from 0−800 mmHg (273 and
298 K), which is fitted by the virial-equation very well (R2>0.999).
IV. Prediction of the Gases Adsorption Selectivity by IAST
IAST (ideal adsorption solution theory)9 was used to predict binary mixture
S6

adsorption from the experimental pure-gas isotherms. In order to perform the
integrations required by IAST, the single-component isotherms should be fitted by a
proper model. In practice, several methods to do this are available. For N2/1a in the
low pressure, the single-site Langmuir model (SSL),10
(4)bPbPqq
1sat
was used for isotherm fitting. Where, b is the parameter in the pure component
Langmuir isotherm (Pa−1), P is the pressure of the bulk gas at equilibrium with the
adsorbed phase P (Pa), q is the adsorbed amount of adsorbent (mol kg−1), qsat is
saturation capacity of species (mol kg−1).
The situations with CO2/1a and H2/1a in low pressure are different and a similar
approach to the above using single-site Langmuir model fits is inadequate. We found
for these sets of data that the dual-site Langmuir-Freundlich equation (DSLF)10-12 was
successful in fitting the data:
(5)2
2
1
1
1/n2
1/n2,2m
1/n1
1/n1m,1
11 PbPbq
PbPbq
q
Here, p is the pressure of the bulk gas at equilibrium with the adsorbed phase (Pa), q
is the adsorbed amount of adsorbent (mol kg−1), qm,1 and qm,2 are the saturation
capacities of sites 1 and 2 (mol kg−1). b1 and b2 are the affinity coefficients of sites 1
and 2 (Pa−1), and n1 and n2 represent the deviations from an ideal homogeneous
surface.
Pure-component isotherm fitting parameters were then used for calculating IAST
binary-gas adsorption selectivities, SA/B, defined as:
(6)BA
BAA/B /
/PPqqS
V. Gas Cycling Mesurements.
CO2 cycling experiments were performed on a TG/DSC Model STA 449 F3
Netzsch instrument. A flow of 15% (v/v) CO2 mixture in N2 was applied followed by
S7

a stream of pure N2 (>99.999%). The flow rates for pure N2 gas and CO2–N2 (15:85
v/v) mixture gas are 60 mL min−1 and 40 mL min−1, respectively.
Table S1. Crystal data and structure refinement for compound 1.
Compound [NC2H8]4C27H9Cu5N36
Empirical formula C35H41Cu5N40
Formula weight 1339.78
Temperature (K) 296(2)
Wavelength (Å) 0.71073
Crystal system Orthorhombic
Space group Fddd
a/Å 16.180(2)
b/Å 43.077(5)
c/Å 45.485(6)
V/Å3 31702(7)
Z 16
D calc (Mg/m3) 1.123
Absorption coefficient (mm-1) 1.368
F(000) 10816
θ range for data collection 1.417 to 24.999 deg
Reflections collected / unique 68507 / 7000 [R(int) = 0.0840]
Limiting indices -19<=h<=19, -49<=k<=51, -54<=l<=54
Completeness to θ= 25.242 97.4 %
Goodness-of-fit on F2 0.993
Final R indices [I>2sigma(I)] R1 = 0.0489, wR2 = 0.1360
R indices (all data) R1 = 0.0853, wR2 = 0.1474
Largest diff. peak and hole (e. Å-3) 0.588 and -0.409
Total potential solvent area Vol Å 3
per Unit Cell Vol 31702.0 Å 3
12836.4 (40.5%)
S8

Table S2. Selected bond distances (Å) and angles (°) for 1.
Cu(1)-N(18) 2.069(2) N(18)-Cu(1)-N(4)#1 104.2(3)
Cu(1)-N(18)#1 2.070(7) N(18)#1-Cu(1)-N(4)#1 119.3 (3)
Cu(1)-N(4) 2.068(2) N(4)-Cu(1)-N(4)#1 99.9 (3)
Cu(1)-N(4)#1 2.068(7) N(3)-Cu(2)-N(14) 113.91(13)
Cu(2)-N(3) 1.978(2) N(3)-Cu(2)-N(5) 114.92(11)
Cu(2)-N(14) 2.010(3) N(14)-Cu(2)-N(5) 114.57(10)
Cu(2)-N(5) 2.064(2) N(3)-Cu(2)-N(17) 113.78(10)
Cu(2)-N(17) 2.097(2) N(14)-Cu(2)-N(17) 99.74(12)
Cu(3)-N(6) 1.963(2) N(5)-Cu(2)-N(17) 97.70(11)
Cu(3)-N(13) 2.063(3) N(6)-Cu(3)-N(13) 107.84(10)
Cu(3)-N(9)#2 2.071(4) N(6)-Cu(3)-N(9)#2 129.71(12)
Cu(3)-N(10) 2.071(4) N(13)-Cu(3)-N(9)#2 99.84(13)
N(18)-Cu(1)-N(18)#1 110.3(3) N(6)-Cu(3)-N(10) 120.02(15)
N(18)-Cu(1)-N(4) 119.26(9) N(13)-Cu(3)-N(10) 97.75(13)
N(18)#1-Cu(1)-N(4) 104.3(3) N(9)#2-Cu(3)-N(10) 95.98(17)
Symmetry transformations used to generate equivalent atoms:
#1 -x+5/4,y,-z+1/4 #2 -x+3/4,-y+3/4,z
S9
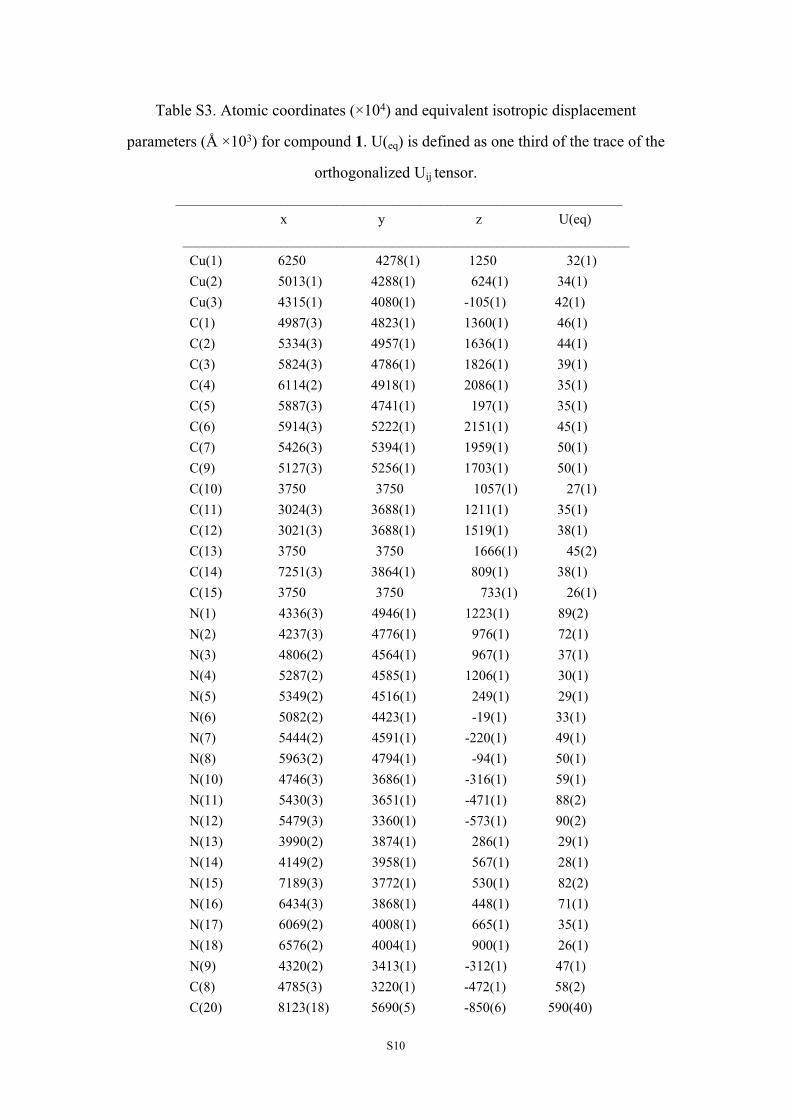
Table S3. Atomic coordinates (×104) and equivalent isotropic displacement
parameters (Å ×103) for compound 1. U(eq) is defined as one third of the trace of the
orthogonalized Uij tensor.________________________________________________________________
x y z U(eq) ________________________________________________________________ Cu(1) 6250 4278(1) 1250 32(1) Cu(2) 5013(1) 4288(1) 624(1) 34(1) Cu(3) 4315(1) 4080(1) -105(1) 42(1) C(1) 4987(3) 4823(1) 1360(1) 46(1) C(2) 5334(3) 4957(1) 1636(1) 44(1) C(3) 5824(3) 4786(1) 1826(1) 39(1) C(4) 6114(2) 4918(1) 2086(1) 35(1) C(5) 5887(3) 4741(1) 197(1) 35(1) C(6) 5914(3) 5222(1) 2151(1) 45(1) C(7) 5426(3) 5394(1) 1959(1) 50(1) C(9) 5127(3) 5256(1) 1703(1) 50(1) C(10) 3750 3750 1057(1) 27(1) C(11) 3024(3) 3688(1) 1211(1) 35(1) C(12) 3021(3) 3688(1) 1519(1) 38(1) C(13) 3750 3750 1666(1) 45(2) C(14) 7251(3) 3864(1) 809(1) 38(1) C(15) 3750 3750 733(1) 26(1) N(1) 4336(3) 4946(1) 1223(1) 89(2) N(2) 4237(3) 4776(1) 976(1) 72(1) N(3) 4806(2) 4564(1) 967(1) 37(1) N(4) 5287(2) 4585(1) 1206(1) 30(1) N(5) 5349(2) 4516(1) 249(1) 29(1) N(6) 5082(2) 4423(1) -19(1) 33(1) N(7) 5444(2) 4591(1) -220(1) 49(1) N(8) 5963(2) 4794(1) -94(1) 50(1) N(10) 4746(3) 3686(1) -316(1) 59(1) N(11) 5430(3) 3651(1) -471(1) 88(2) N(12) 5479(3) 3360(1) -573(1) 90(2) N(13) 3990(2) 3874(1) 286(1) 29(1) N(14) 4149(2) 3958(1) 567(1) 28(1) N(15) 7189(3) 3772(1) 530(1) 82(2) N(16) 6434(3) 3868(1) 448(1) 71(1) N(17) 6069(2) 4008(1) 665(1) 35(1) N(18) 6576(2) 4004(1) 900(1) 26(1)
N(9) 4320(2) 3413(1) -312(1) 47(1) C(8) 4785(3) 3220(1) -472(1) 58(2)
C(20) 8123(18) 5690(5) -850(6) 590(40)
S10

C(21) 8044(14) 5664(4) -280(4) 319(12) C(22) 11066(19) 4392(11) -1538(11) 700(40) C(23) 12749(19) 4241(8) -1529(6) 550(30) N(20) 8261(13) 5497(4) -568(5) 398(14) N(21) 11970(20) 4377(4) -1662(3) 450(20) _______________________________________________________________
Table S4. Valence bond calculations of three crystallographically independent Cu
centers in compound 1.
Distance BVSCu(1)-N(4)#1 2.068(7)Cu(1)-N(4) 2.068(2)Cu(1)-N(18)#1 2.070(7)Cu(1)-N(18) 2.069(2)
∑(Cu1)=1.21
Cu(2)-N(3) 1.978(2)Cu(2)-N(14) 2.010(3)Cu(2)-N(5) 2.064(2)Cu(2)-N(17) 2.097(2)
∑(Cu2)=1.28
Cu(3)-N(6) 1.963(2)Cu(3)-N(10) 2.071(4)Cu(3)-N(13) 2.057(3)Cu(3)-N(9) 2.071(4)
∑(Cu3)=1.26
Figure S1. The structure of the H3BTT ligand.
S11

Figure S2. Ortep drawing of the asymmetric unit of the compound 1 after
PLATON/SQUEEZE treatment.
(a) (b)
Figure S3. Representations of the (a) μ6-btt3- and (b) μ8-btt3- ligand, as well as the
angles between planes in these two BTT ligands.
S12

Figure S4. View of the 1D chain constructed by the tri-nuclear Cu3 clusters (a) and bi-
nuclear Cu2 clusters (b); (c) View of the 3D open anion framework of 1 embedded
with meso-helical chains.
S13

(a) (b) (c) (d)
Figure S5. Representations of the four types of channels (a-d) and the giant cavity (e)
in compound 1.
S14

Figure S6. The PXRD patterns for compound 1 after different test.
Figure S7. TG-DSC curves for the as-synthesized sample of 1 and samples after
exchanged with methanol and acetone solvents.
S15

Thermogravimetric analysis of as-synthesized sample of 1 showed a weight loss of 6.5 % up to 145 ºC, suggesting that the absorbed solvents (DMA and water) both in the surface and in the voids are evacuated at this temperature. To attain a more complete evacuation, DMA was exchanged with methanol or aceton by soaking crystals of 1 in methanol or aceton for 4 days, respectively. TGA results indicate that the acetone, as compared with methanol, is a better solvent for exchanging the higher boiling point solvents of DMA and water remained in the void of 1. The TGA curve for the acetone-exchanged sample shows a weight loss of 0.8% between 50 and 150 ºC, corresponding to the evolution of guest solvent of acetone. A gradual further weight loss of 13.3% between 150 ºC and 280 ºC is corresponding to loss of 4 [NC2H8]+ ions (ca. 13.7%). This process is in agreement with the small exothermic peak at 267 ºC. Further drastic weight loss from 280 ºC is corresponding to the loss of the BTT molecules and the collapse of the framework.
Figure S8. N2 and H2 sorption isotherms of 1a at 77K, solid, adsorption; hollow,
desorption.
S16

Figure S9. The plot of the linear region for the BET equation of 1a (P0/P=
0.005−0.05).
Table S5. Low-pressure CO2 (273–298 K) or H2 (77 K) adsorption capacities in
selected metal-organic frameworks.
Surface Area (m2/g) Capacityb/CO2 Capacityb/H2
MOFsPore
Volume(cm3 g−1) Langmuir BET 1 bar Ref 77 K Ref
1a 0.302 801 7019.61 wt%, a 298 K14.0 wt%,a 273 K
This work
1.03 wt%,a 1 barThis work
Mg2(dobdc) 0.573 2060 1800 26.7 wt%, 298 K 13 - -NTU-105 1.33 - 3543 26.8 wt%, 273 K 14 - -HKUST-1 - - 1400 19.8 wt%, 293 K 15 - -
SIFSIX-2-Cu-i - 821 735 19.2 wt%, 298 K 16 - -SIFSIX-1-Cu 0.683 - 1468 18.5 wt%, 298 K 17 - -TIFSIX-1-Cu 0.696 - 1690 17.3 wt%, 298 K 17 - -
SNIFSIX-1-Cu 0.636 - 1523 15.6 wt%, 298 K 17 - -mmen-Cu-BTTri - - 870 15.4 wt%, 298 K 18 - -MPM-1-TIFSIX - - 840 15.0 wt%, 298 K 19 - -
Cu-BTTri 0.713 1900 1770 14.3 wt%, 298 K 20 1.7 wt%, 1.2 bar 20
Fe-BTT - - 2010 13.5 wt%, 298 K 21 2.3 wt% 22
CPF-6 - 883 599 16.1 wt%, 273 K 23 1.85 wt% 23SIFSIX-2-Cu - 3370 3140 7.5 wt%, 298 K 16en-Cu-BTTri - 376 345 5.5 wt%, 298 K 20 - -
MOF-177 1.89 5400 4690 3.6 wt%, 298 K 13 - -Mn-BTT - 2100 1100 - - 2.1 wt% 24Cu-BTT - - 1710 - - 2.3 wt% 25
a Reported capacity was calculated from the excess adsorption.b It was not clear from the reference whether the reported isotherms were in absolute or excess
adsorption.
S17

Table S6. Low-pressure (LP) and high-pressure (HP) gas sorption capacities of 1a
towards CO2, H2, N2 and CH4 at different temperatures.
77 K 273 K 298 KGas Pressure cm3/g mol/Kg wt% cm3/g mol/Kg wt% cm3/g mol/Kg wt%a
CH4 LP - 18.54 a 0.83 a 1.31 a 10.62
a 0.47 a 0.75 a
LP - 82.80 a 3.69 a 14.0 a 54.17
a 2.42 a 9.61 a
- 5.76 a 20.2 a - 5.30 a 18.9 a
- 6.59 b 22.5 b - 6.45 b 22.1 bCO2
HP -
30 bar 45 bar
LP 195.3 a 8.71 a 19.6
a 4.35 a 0.19 a 0.53 a 2.60 a 0.12 a 0.33 a
- 1.89 a 5.03 a - 1.83 a 4.87 aN2HP
(65 bar) -- 2.87 b 7.44 b - 2.72 b 7.07 b
LP 116.1 a 5.18 a 1.03
a 0.45 a 0.02 a 0.004 a
0.228 a 0.01 a 0.002 a
- 1.48 a 0.30 a - 1.00 a 0.2 aH2 HP(65 bar) -
- 2.32 b 0.46 b - 1.77 b 0.35 b
In this work, wt% is defined as:
% 100 absorbed) gas mass adsorbent (mass
absobed gas mass%wt
a excess adsorption b total adsorption
S18

Figure S10. Virial fitting for CO2 isotherms of 1a: (a) The CO2 adsorption isotherms
for 1a (solid circle, adsorption; hollow circle, desorption); (b) The details of virial
equation (solid lines) fitting to the experimental CO2 adsorption data (symbols) for 1a.
Figure S11. (a) The CO2 adsorption enthalpy of 1a; (b) CO2 sorption isotherms
of 1a of three consecutive cycles.
S19

Figure S12. Comparisons of CO2 uptakes before and after water treatment (immersion
in liquid water for 1 day) at 273 and 298 K.
Figure S13. Low-pressure CO2/N2, CO2/CH4 and CO2/H2 initial slope
selectivity studies for 1a at 273 K (a) and 298 K (b).
S20

Table S7. Low-pressure CO2/N2, CO2/CH4 and CO2/H2 selectivity results for 1a
analyzed by the initial slope ratio.
CO2/N2 selectivity CO2/H2 selectivity CO2/CH4 selectivity273 K 69.7 98.6% 577.2 99.8% 13.3 93.0%
298 K 36.3 97.3% 334.8 99.7% 8.7 89.7%
Figure S14. Low-pressure adsorption isotherms of CO2, H2 and N2 at 273 K (a) and
298 K (b). Lines are fits to a dual-site Langmuir-Freundlich (DSLF) or single-site
Langmuir (SSL) equation.
Table S8. The refined parameters for the DSLF and SSL equations fit for the pure
isotherms of CO2, N2 and H2 in 1a at 273 K.CO2 H2 N2
R2 0.999997 0.999709 R2 0.999991qm,1 5.290562 0.047092 qm 1.408277qm,2 0.140931 4.522968E-2 b 1.496390E-6b1 5.292282E-5 2.876264E-6b2 7.554743E-21 9.558976E-9n1 1.096608 0.932293n2 0.200848 0.380865
S21
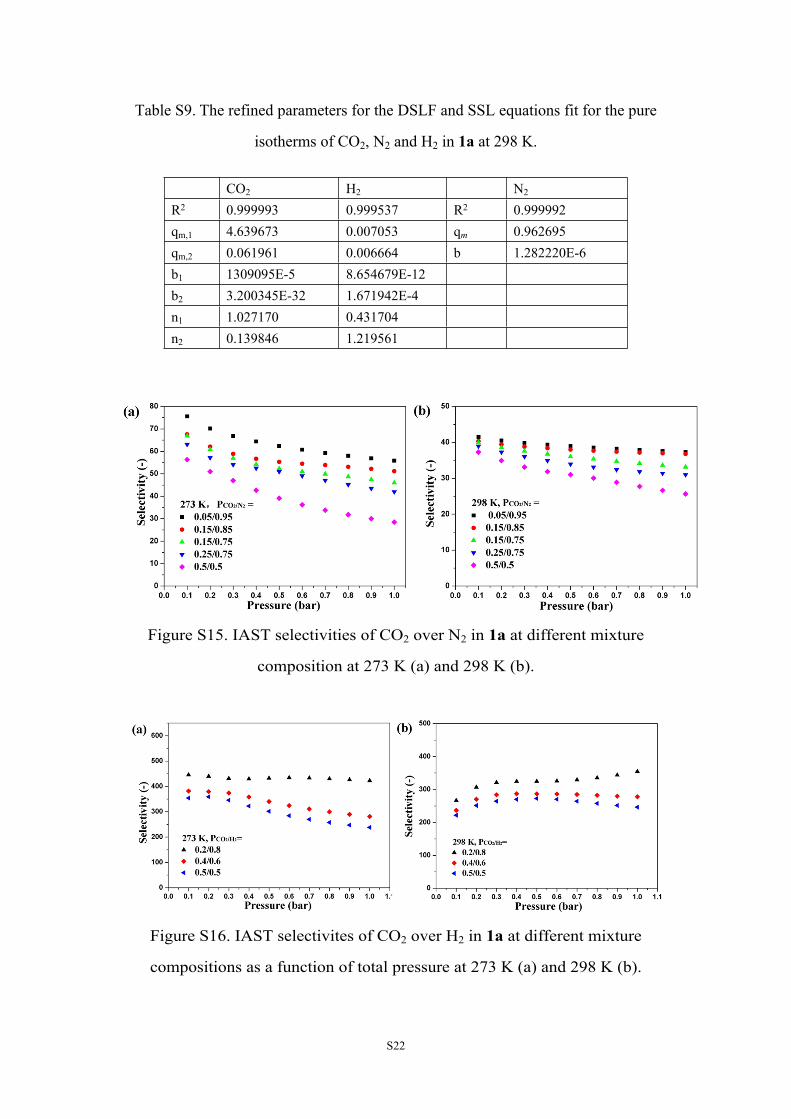
Table S9. The refined parameters for the DSLF and SSL equations fit for the pure
isotherms of CO2, N2 and H2 in 1a at 298 K.
CO2 H2 N2
R2 0.999993 0.999537 R2 0.999992qm,1 4.639673 0.007053 qm 0.962695qm,2 0.061961 0.006664 b 1.282220E-6b1 1309095E-5 8.654679E-12b2 3.200345E-32 1.671942E-4n1 1.027170 0.431704n2 0.139846 1.219561
Figure S15. IAST selectivities of CO2 over N2 in 1a at different mixture
composition at 273 K (a) and 298 K (b).
Figure S16. IAST selectivites of CO2 over H2 in 1a at different mixture
compositions as a function of total pressure at 273 K (a) and 298 K (b).
S22

Figure S17. Gas cycling experiment for 1a under a mixed CO2–N2 (15:85 v/v)
flow and a pure N2 flow at a constant temperature of 303 K for 35 cycles.
Figure S18. An enlargment of five cycles―TG-DSC curves from cycle 5th to cycle 9th.
The flow rates for pure N2 gas and CO2–N2 (15:85 v/v) mixture gas are 60 mL min−1 and 40 mL min−1, respectively.
S23

Figure S19. The IR spectra of the as-synthesized sample (a) and acetone-exchanged
one (b).
Table S10. The weight change for the special cycle in the gas cycling
experiment.
Cycle 2n
d
5th 10t
h
15t
h
20t
h
25t
h
30t
h
35t
h
Weight change
(wt%)
0.8 0.73 0.75 0.76 0.75 0.75 0.75 0.74
Table S11. High-pressure excess sorption and total sorption data of 1a.
CO2 at 273K
P(bar)
Excess Uptake
(%)
TotalUptake
(%)
ExcessUptake
(mmol/g)
TotalUptake
(mmol/g)0.019 2.24709 2.248202 0.52244 0.522706
S24

0.218 7.58666 7.59943 1.86579 1.8691910.417 10.0336 10.05806 2.53468 2.5415530.619 11.52851 11.56474 2.96154 2.972060.817 12.52434 12.57233 3.25398 3.2682431.418 14.30794 14.39152 3.79476 3.8206512.9179 16.23063 16.40458 4.40349 4.459955.9194 17.732 18.09159 4.89862 5.0199079.9176 18.63566 19.25542 5.20545 5.41984813.9188 19.19078 20.08776 5.39733 5.71301617.9184 19.52486 20.71903 5.51408 5.93947222.8337 19.8205 21.41577 5.61822 6.19363727.8341 20.07605 22.13412 5.70885 6.46044429.8341 20.21935 22.48383 5.75993 6.59212226.0268 20.03147 21.9157 5.693 6.37880122.0299 19.82394 21.35044 5.61943 6.16961319.0329 19.66084 20.9422 5.56189 6.02039515.0325 19.35676 20.33375 5.45522 5.80083612.0318 19.02822 19.79184 5.34087 5.608099.0312 18.58693 19.1476 5.18873 5.3823127.029 18.1587 18.589 5.04266 5.1894385.0348 17.5034 17.80749 4.82207 4.9239982.536 15.98438 16.13515 4.32397 4.3726071.2374 13.97763 14.05066 3.69292 3.715365
CO2 at 298K
P(bar)
Excess Uptake
(%)
TotalUptake
(%)
ExcessUptake
(mmol/g)
TotalUptake
(mmol/g)0.018 0.68444 0.685405 0.15663 0.1568490.22 3.55136 3.563171 0.83685 0.8397330.617 6.84884 6.882049 1.671 1.67971.117 9.10571 9.165772 2.2768 2.2933321.918 11.14969 11.25347 2.85201 2.8819233.917 13.62753 13.84149 3.58583 3.651176.9215 15.29985 15.68312 4.10535 4.2273229.9203 16.22361 16.7813 4.40122 4.58302114.92 17.10881 17.96959 4.69093 4.978637
19.9215 17.68845 18.87083 4.88401 5.28641424.8354 18.06204 19.58093 5.0099 5.53377529.836 18.37208 20.25951 5.11525 5.77427434.8338 18.60694 20.89449 5.19559 6.00305639.8337 18.78761 21.51605 5.25771 6.23058944.6492 18.91377 22.11849 5.30125 6.454588
S25

38.0328 18.75359 21.31774 5.24599 6.15760233.032 18.54064 20.67976 5.17287 5.92527828.0309 18.31642 20.06761 5.09628 5.70584823.032 17.9841 19.37688 4.98354 5.46225118.0307 17.55996 18.61832 4.84097 5.19949613.0324 16.89391 17.63819 4.62003 4.867169.0316 16.1128 16.6182 4.36539 4.5296015.0336 14.58749 14.86366 3.88156 3.9678763.036 13.06458 13.2298 3.41543 3.465214
H2 at 273K
P(bar)
Excess Uptake
(%)
TotalUptake
(%)
ExcessUptake
(mmol/g)
TotalUptake
(mmol/g)0.185 0.08061 8.11E-02 0.40337 4.06E-010.38 0.08267 0.083688 0.41367 0.418792
0.7298 0.08618 0.088135 0.43126 0.4410660.981 0.09431 0.096939 0.47198 0.4851654.02 0.11097 0.121723 0.55546 0.609355
6.9763 0.12513 0.143755 0.62643 0.7198119.9868 0.14119 0.167792 0.70694 0.84037111.944 0.15354 0.185316 0.76889 0.928314.9388 0.16743 0.207098 0.83854 1.03763817.9513 0.18461 0.232203 0.92474 1.16371719.9454 0.19314 0.245953 0.96755 1.23279524.8406 0.21214 0.277685 1.06296 1.39229229.8346 0.22719 0.30569 1.13852 1.53313534.8627 0.23726 0.328694 1.18911 1.64889139.8735 0.25441 0.35865 1.27527 1.79970444.698 0.26228 0.37877 1.31483 1.90105349.6993 0.28148 0.410588 1.41137 2.06140554.6696 0.28227 0.423785 1.41536 2.12794359.6921 0.29115 0.445221 1.45999 2.23606364.6707 0.29532 0.461647 1.48098 2.31893969.6691 0.30577 0.484438 1.53353 2.43398363.0292 0.303 0.465277 1.51959 2.33725958.0034 0.29489 0.444766 1.47881 2.23376553.0227 0.28211 0.419508 1.41454 2.10637548.0099 0.27089 0.395745 1.35815 1.98658943.0021 0.25951 0.371663 1.30094 1.86524538.0077 0.24144 0.340886 1.21011 1.71025833.0271 0.22656 0.313251 1.13537 1.57117528.0111 0.20659 0.280351 1.03507 1.405697
S26

23.0134 0.1868 0.247639 0.93574 1.24126919.0176 0.16712 0.217487 0.83702 1.08980713.0284 0.14896 0.183597 0.74589 0.9196748.0299 0.12528 0.146696 0.62718 0.7345583.035 0.10365 0.11177 0.51878 0.5594761.2352 0.08782 0.091129 0.4395 0.456058
H2 at 298K
P(bar)
Excess Uptake
(%)
TotalUptake
(%)
ExcessUptake
(mmol/g)
TotalUptake
(mmol/g)0.191 0.05727 0.057739 0.28649 0.2888630.389 0.06787 0.068825 0.33959 0.3443640.697 0.06582 0.067532 0.32934 0.3378861.002 0.07034 0.0728 0.35196 0.3642664.019 0.08168 0.09153 0.40872 0.4580676.9517 0.09361 0.110617 0.4685 0.5536969.944 0.10365 0.127933 0.51881 0.640485
11.9645 0.11405 0.143241 0.57088 0.71723414.9398 0.12533 0.161859 0.62743 0.81060517.9465 0.13014 0.173911 0.65155 0.87106919.9516 0.13959 0.187887 0.69895 0.94120224.858 0.15017 0.210232 0.752 1.05337429.8578 0.15812 0.230246 0.79184 1.15388634.8792 0.17058 0.254466 0.85437 1.27557439.8694 0.17091 0.266552 0.85599 1.33632444.6804 0.18471 0.291504 0.92526 1.4617849.684 0.18655 0.305095 0.9345 1.53014554.7093 0.19144 0.321433 0.95906 1.61234759.6895 0.19381 0.335248 0.97094 1.68187764.7093 0.19933 0.35221 0.99866 1.76727469.6753 0.20551 0.369529 1.02967 1.85449662.9699 0.19898 0.347946 0.99688 1.74580358.0078 0.19337 0.330893 0.9687 1.65995652.9969 0.17856 0.304637 0.8944 1.52783947.9967 0.17033 0.284958 0.85309 1.42886443.0217 0.15121 0.254086 0.7572 1.27366638.0003 0.13698 0.228101 0.68585 1.14311233.0108 0.1215 0.200863 0.60825 1.00633628.0119 0.11042 0.178022 0.55272 0.89169923.0204 0.09841 0.154249 0.49256 0.77243519.0202 0.09378 0.139965 0.46935 0.70080413.0288 0.07519 0.10689 0.37621 0.535022
S27

8.0306 0.06701 0.086643 0.33528 0.4335923.0355 0.05192 0.059366 0.25973 0.2970071.2355 0.05634 0.059373 0.28186 0.297041
N2 at 273K
P(bar)
Excess Uptake
(%)
TotalUptake
(%)
ExcessUptake
(mmol/g)
TotalUptake
(mmol/g)0.22 0.0661 0.074301 0.02362 2.66E-02
0.6267 0.24688 0.270243 0.08839 9.68E-020.936 0.3735 0.40852 0.13389 1.46E-012.927 1.08293 1.192135 0.39099 4.31E-016.9261 2.07704 2.335486 0.75753 8.54E-019.9181 2.61324 2.98E+00 0.95834 1.10E+0014.9282 3.24337 3.80016 1.19718 1.41E+0019.9191 3.6513 4.394097 1.35346 1.64E+0024.8392 4.01526 4.941887 1.49401 1.86E+0029.838 4.24981 5.362246 1.58516 2.02E+0034.8404 4.42817 5.725718 1.65477 2.17E+0039.8415 4.61009 6.094111 1.72603 2.32E+0049.6761 4.82807 6.674494 1.81179 2.55E+0059.6663 5.00386 7.21725 1.88123 2.78E+0065.0238 5.03202 7.439373 1.89237 2.87E+0055.0196 4.92074 6.964033 1.84836 2.67E+0045.0284 4.73839 6.412852 1.77646 2.45E+0038.0288 4.51402 5.929701 1.68836 2.25E+0033.0258 4.39183 5.621957 1.64056 2.13E+0028.0247 4.1819 5.227253 1.55872 1.97E+0023.0323 3.87654 4.735239 1.44031 1.78E+0018.0314 3.52028 4.192512 1.30312 1.56E+0013.033 3.03767 3.523631 1.11887 1.30E+008.0304 2.29223 2.59182 0.83786 9.50E-015.0337 1.68411 1.871903 0.61177 6.81E-012.536 0.96393 1.058367 0.34761 3.82E-011.2358 0.50087 0.547055 0.17978 1.96E-01
N2 at 298K
P(bar)
Excess Uptake
(%)
TotalUptake
(%)
ExcessUptake
(mmol/g)
TotalUptake
(mmol/g)0.223 0.03731 4.49E-02 0.01333 0.0160520.624 0.18581 0.207125 0.06649 0.074127
S28

0.926 0.28666 0.31836 0.10267 0.1140632.936 0.93524 1.035404 0.33717 0.3736566.9181 1.87834 2.114248 0.68368 0.7713989.9208 2.35038 2.68868 0.85963 0.98677414.9237 2.96945 3.477836 1.09297 1.28683919.9236 3.37648 4.054671 1.24802 1.50929424.8382 3.70286 4.547011 1.3733 1.70129129.8436 4.01946 5.032569 1.49564 1.89259234.8403 4.23522 5.415827 1.57947 2.04497639.84 4.42671 5.775131 1.6542 2.18896249.672 4.72126 6.396014 1.76972 2.44037859.6682 4.91875 6.923486 1.84758 2.65660365.0157 4.88615 7.065452 1.8347 2.71521855.0238 4.66021 6.513034 1.74571 2.48813745.0267 4.3059 5.827131 1.60702 2.20989238.0246 4.07147 5.359308 1.51581 2.02242733.0301 3.8126 4.933304 1.41561 1.85332428.0302 3.54217 4.49458 1.31152 1.6807523.0307 3.16898 3.952522 1.16882 1.46970518.0277 2.8265 3.440598 1.03883 1.27256913.0317 2.27244 2.716813 0.83046 0.9973878.0304 1.63138 1.905447 0.5923 0.6937355.032 1.13161 1.303454 0.40877 0.4716672.536 0.59947 0.686069 0.21539 0.2467171.2358 0.30692 0.349182 0.10995 0.125145
References. 1 M. Hill, M. F. Mahon, K. C. Molloy, J. Chem. Soc. Dalton Trans., 1996, 9, 1857.
2 G. M. Sheldrick, Acta Crystallogr. Sect. A., 2008, 64, 112.
3 A. L. Spek, J. Appl. Crystallogr., 2003, 36, 7.
4 (a) J. Rouquerol, P. Llewellyn, F. Rouquerol, Stud. Surf. Sci. Catal., 2007, 160, 49; (b) K. S. Walton, R. Q. Snurr, J. Am.
Chem. Soc., 2007, 129, 8552.
5 S. Hong, M. Oh, M. Park, J. W. Yoon, J. S. Chang, M. S. Lah, Chem. Commun., 2009, 36, 5397.
6 (a) S. S. Kaye, A. Dailly, O. M. Yaghi, J. R. Long, J. Am. Chem. Soc., 2007, 129, 14176; (b) H. Furukawa, M. A. Miller,
O. M. Yaghi, J. Mater. Chem., 2007, 17, 3197; (c) A. R. Millward, O. M. Yaghi, J. Am. Chem. Soc., 2005, 127, 17998;
(d) L.-J. Li, J. G. Bell, S.-F. Tang, X.-X. Lv, C. Wang, Y.-L. Xing, X.-B. Zhao, K. M. Thomas, Chem. Mater., 2014, 26,
4679.
7 NIST Chemistry WebBook (Thermophysical Properties of Fluid Systems): http:// webbook.nist.gov/chemistry/fluid/.
S29

8 J. L. C. Rowsell, O. M. Yaghi, J. Am. Chem. Soc., 2006, 128, 1304.
9 (a) A. L. Myers, J. M. Prausnitz, AIChE J., 1965, 11, 121; (b) Y. S. Bae, K. L. Mulfort, H. Frost, P. S. Ryan, Broadbelt,
L. J. Punnathanam, J. T. Hupp, R. Q. Snurr, Langmuir, 2008, 24, 8592; (c) B. Mu, F. Li, K. S. Walton, Chem. Commun.,
2009, 18, 2493.
10 J. A. Mason, K. Sumida, Z. R. Herm, R. Krishna, J. R. Long, Energy Environ. Sci., 2011, 4, 3030.
11 Y.-B. He, Z.-J. Zhang, S.-C. Xiang, F. R. Fronczek, R. Krishna, B.-L. Chen, Chem. Commun., 2012, 48, 6493.
12 B.-S. Zheng, J.-F. Bai, J.-G. Duan, L. Wojtas, M. J. Zaworotko, J. Am. Chem. Soc., 2011, 133, 748.
13 Z. R. Herm, J. A. Swisher, B. Smit, R. Krishna, J. R. Long, J. Am. Chem. Soc., 2011, 133, 5664.
14 X.-J. Wang, P.-Z. Li, Y.-F. Chen, Q. Zhang, H.-C. Zhang, X.-X. Chan, R. Ganguly, Y.-X. Li, J.-W. Jiang, Y.-L. Zhao,
Sci Rep., 2013, 3, 1149.
15 P. Aprea, D. Caputo, N. Gargiulo, F. Iucolano, F. Pepe, J. Chem. Eng. Data., 2010, 55, 3655.
16 P. Nugent, Y. Belmabkhout, S. D. Burd, A. J. Cairns, R. Luebke, K. Forrest, T. Pham, S. Q. Ma, B. Space, L, Wojtas,
M. Eddaoudi, M. J. Zaworotko, Nature, 2013, 495, 80.
17 P. Nugent, V. Rhodus, T. Pham, B. Tudor, K. Forrest, L, Wojtas, B. Space, M. J. Zaworotko, Chem. Commun., 2013,
49, 1606.
18 T. M. McDonald, D. M. D’Alessandro, R. Krishna, J. R. Long, Chem. Sci., 2011, 2, 2022.
19 P. Nugent, V. L. Rhodus, T. Pham, K. Forrest, L. Wojtas, B. Space, M. J. Zaworotko, J. Am. Chem. Soc., 2013, 135, 10950.
20 A. Demessence, D. M. D’Alessandro, M. L. Foo, J. R. Long, J. Am. Chem. Soc., 2009, 131, 8784.
21 K. Sumida, S. Horike, S. S. Kaye, Z. R. Herm, W. L. Queen, C. M. Brown, F. Grandjean, G. J. Long, A. Dailly, J. R. Long,
Chem. Sci., 2010, 1, 184.
22 K. Sumida, D. Stück, L. Mino, J. D. Chai, E. D. Bloch, O. Zavorotynska, L. J. Murray, M. Dincǎ, S. Chavan, S. Bordiga, M.
Head-Gordon, J. R. Long, J. Am. Chem. Soc., 2013, 135, 1083.
23 Q.-P. Lin, T. Wu, S.-T. Zheng, X.-H. Bu, P.-Y. Feng, J. Am. Chem.Soc., 2012, 134, 784.
24 M. Dincǎ, A. Dailly, Y. Liu, C. M. Brown, D. A. Neumann, J. R. Long, J. Am. Chem. Soc., 2006, 128, 16876.
25 M. Dincǎ, W. S. Han, Y. Liu, A. Dailly, C. M. Brown, J. R. Long, Angew. Chem. Int. Ed., 2007, 46, 1419.
S30