Embed Size (px)
Citation preview
International Journal of Composite Materials 2014, 4(2): 108-124 DOI: 10.5923/j.cmaterials.20140402.10
Fracture Toughness of AA2024 Aluminum Fly Ash Metal Matrix Composites
Ajit Bhandakkar1,*, R C Prasad1, Shankar M L Sastry2
1Department of Metallurgical Engineering and Materials Science, IIT Bombay 2Mechanical, Aerospace and Structural Engineering, Washington University in St. Louis, USA
Abstract The aluminum fly ash metal matrix composites (MMCs) find important applications in automobile and aerospace where high strength and modulus is important. The fly ash by product of coal burning is drawing lot of attention as reinforcement for MMCs due to its low cost and reduction in environmental pollution. The ash particles, generally being hollow in nature, display lower densities while oxides present as constituents make them possess high modulus and strength thereby enhancing specific strength and stiffness along with lower densities compared to many metal based systems. The uses of MMCs are impeded in critical applications due to its low fracture toughness as compare to metals. LEFM (Linear Elastic Fracture Mechanics) has been used by researchers to characterize the plane strain fracture toughness using various specimen geometries and notches. However there were very few studies using EPFM (Elastic Plastic Fracture Toughness) are reported in open literature. In the present paper the influences of weight fraction of fly ash reinforcement on hardness, tensile strength and fracture toughness have been evaluated. Hardness of aluminium fly ash metal matrix composites increases with the addition of fly ash particulate reinforcement. However the tensile strength and fracture toughness KIC and JIC of the aluminum fly ash composite decreases that of base alloy. The fracture toughness of AA2024 varied between 17-18 MPa√𝒎𝒎 as compared to 21 MPa√𝒎𝒎 for remelted base alloy AA2024, which is consistent with the reported data. The JIC fracture toughness of AA2024 fly ash composites varied between 6-15 KJ/m² as compared to 25 KJ/m² for the re melted base alloy AA2024. The load and COD plot shows hysteresis loop in loading and unloading compliance curve. This hysteresis loop is indicative of crack closure due to fly ash particles. The reason for crack closure may be surface roughness resulting from reinforcement particles in the composites. The fracture behavior and micro-mechanism of failure in base alloy and composites have been observed under SEM and optical microscopy.
Keywords Fracture Toughness, Aluminum Fly Ash Composites, MMCs, Damage Mechanics
1. Introduction The commercial applications of MMCs have been limited
due to their higher cost and low fracture toughness as compared to metal alloys. However in spite of higher cost MMCs has emerged as an important class of materials due to high specific strength and stiffness as well as other desirable properties. The Aluminium alloy matrix composites are being used extensively for high performance applications in automobile and aerospace. Because of several advantages, continued efforts are being made to process Aluminum ceramic reinforced metal matrix composites with low cost reinforcement. Fly ash which is by product of coal burning is drawing lot of attention as reinforcement for MMCs due to its low cost and reduction in environmental pollution. The fly ash particles, generally being hollow in nature, display lower densities while oxides present as constituents make them
* Corresponding author: [email protected] (Ajit Bhandakkar) Published online at http://journal.sapub.org/cmaterials Copyright © 2014 Scientific & Academic Publishing. All Rights Reserved
possess high modulus and strength thereby enhancing specific strength and stiffness along with lower densities compared to many metal based systems. The measurement of valid plane strain fracture toughness, (KIC) and Elastic plastic fracture toughness (JIC) for particulate reinforced metal matrix composites is an important step in the process of developing useful products from these materials and increasing confidence in their properties and performance. However limited work has been reported in open literature on influence of fly ash on fracture toughness of aluminum metal matrix composites.
The value of the KIC and JIC characterizes the fracture resistance of a material in the presence of a sharp crack under tensile loading, where the state of stress near the crack front is a triaxial plane strain, and the crack-tip plastic region is small compared with the crack size and specimen dimensions [3-6]. In 1977 Barker [7] proposed the short-rod specimen for determining plane strain fracture toughness. Waszczak [8] investigated the applicability of LEFM (KIC) to Boron /Aluminium composites and reported the non linear behavior of load vs COD (crack mouth Opening displacement) curve due to large scale plasticity of AA6061
International Journal of Composite Materials 2014, 4(2): 108-124 109
aluminium alloy. The LEFM method of fracture toughness of Al/SiC metal
matrix composites were studied by few researches [9-11] and reported that the fracture toughness of the composites depends on the volume fraction and aspect ratio of the particles. Hong et al. [11] showed that the fracture toughness of SiC/2024 Al alloy composite decreases from 20.16 MPam1/2 to 14.67 MPam1/2 when the volume fraction of the SiC particles increases from 3% to 10%. Hasson and Crowe [12] showed that the KIC value is 15.8 MPam1/2 for a 25 vol.% SiCp reinforced 6061 Al alloy composite in T6 condition, while the value is only 7.1 MPam1/2 for a 20 vol.% SiCw reinforced 6061 Al alloy composite in T6 condition. The uses of MMCs are thus impeded in critical applications. LEFM (Linear Elastic Fracture Mechanics) has been used by researchers to characterize the plane strain fracture toughness using various specimen geometries and notches. [13–23]. However there were very few studies using EPFM (Elastic Plastic Fracture Toughness) are reported in open literature.
In this paper, the aluminum fly ash metal matrix composites AA2024 were processed by low cost liquid metallurgy route. The composites were secondary processed by hot extrusion and evaluate the mechanical properties, fracture toughness and micro-mechanisms of failure. The composites in the present investigation showed a stable crack growth therefore JIc test was conducted using three point bend specimens. Typical loading unloading curves for base alloy and composite are plotted and the fracture toughness KQ for AA2024 base alloy and fly ash composites were calculated from J-R curve at maximum load.
2. Experimental 2.1. Material
Aluminum alloy AA 2024 are used as base matrix with composition (weight percent) listed in Table.1 The reinforcement used are silicon carbide and fly ash having particles of sizes 25-45 in 5%, and 10% by weight and the chemical composition of fly ash reinforcement is as per Table.2.
2.2. Processing of Aluminum Fly Ash Composites
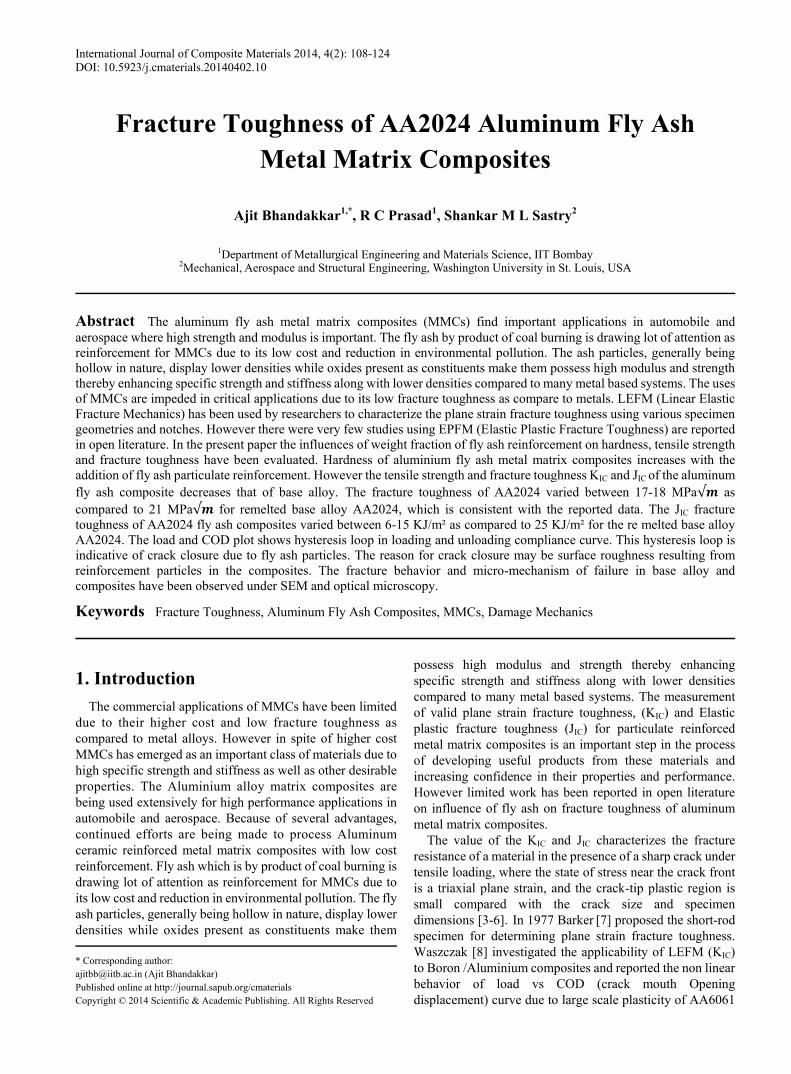
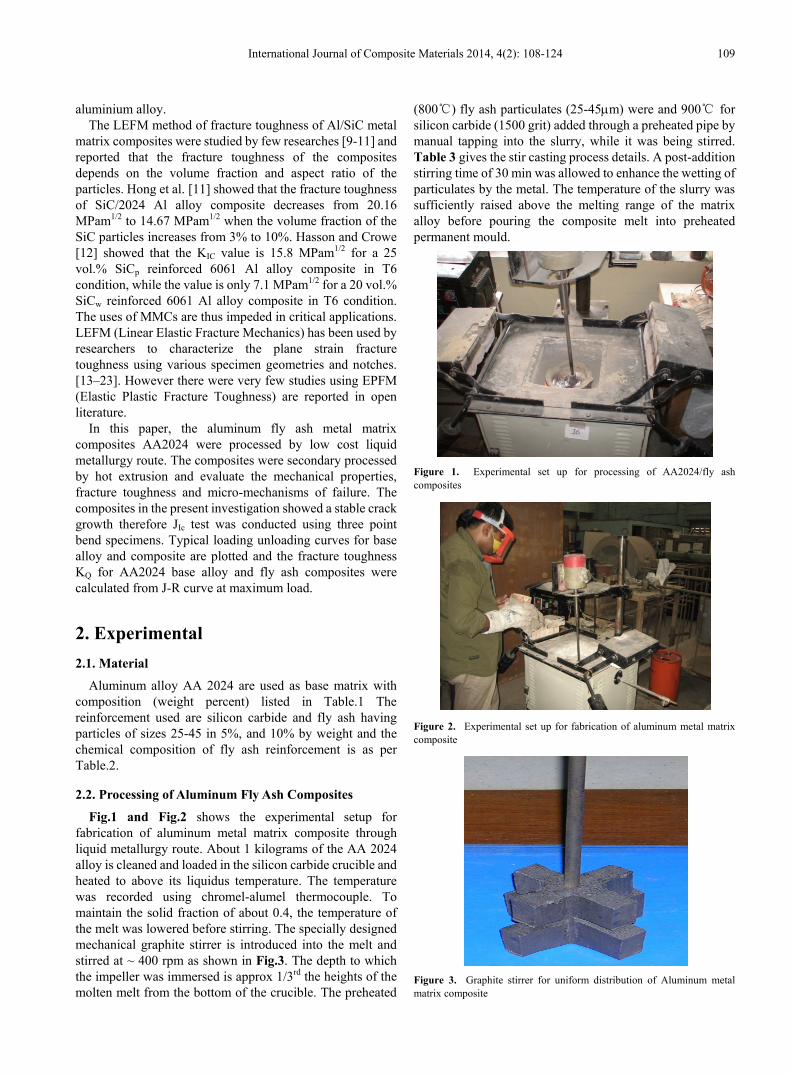
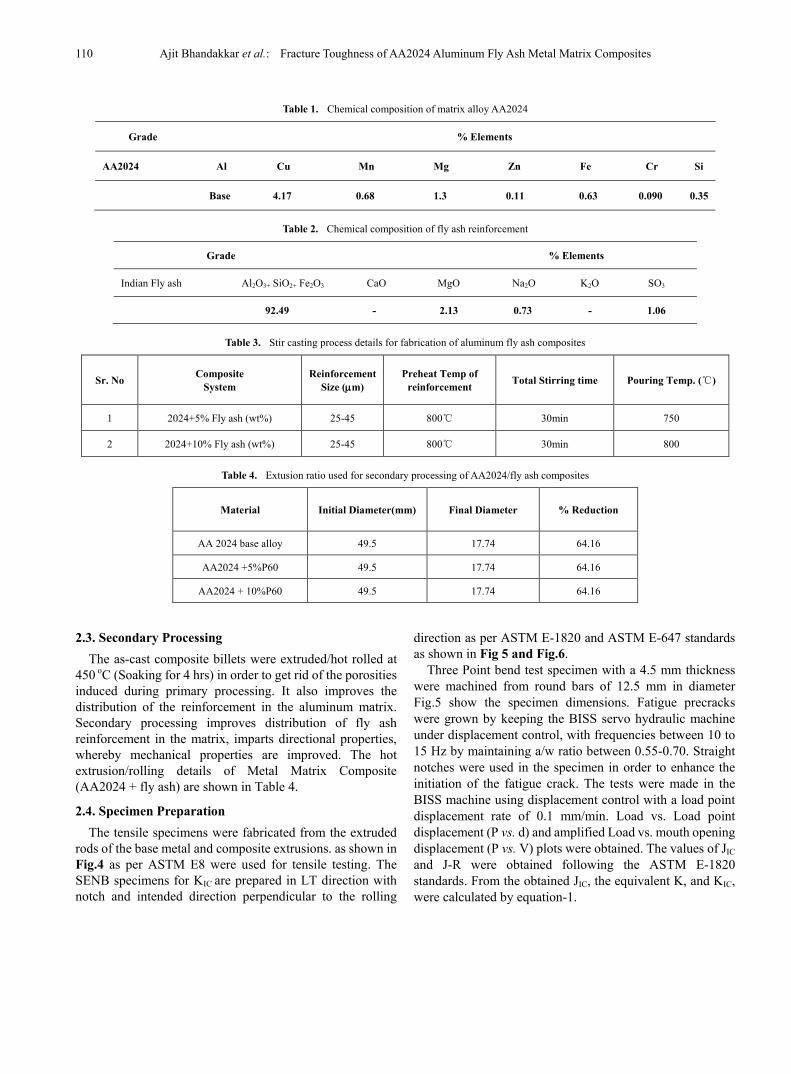
Fig.1 and Fig.2 shows the experimental setup for fabrication of aluminum metal matrix composite through liquid metallurgy route. About 1 kilograms of the AA 2024 alloy is cleaned and loaded in the silicon carbide crucible and heated to above its liquidus temperature. The temperature was recorded using chromel-alumel thermocouple. To maintain the solid fraction of about 0.4, the temperature of the melt was lowered before stirring. The specially designed mechanical graphite stirrer is introduced into the melt and stirred at ~ 400 rpm as shown in Fig.3. The depth to which the impeller was immersed is approx 1/3rd the heights of the molten melt from the bottom of the crucible. The preheated
(800℃) fly ash particulates (25-45µm) were and 900℃ for silicon carbide (1500 grit) added through a preheated pipe by manual tapping into the slurry, while it was being stirred. Table 3 gives the stir casting process details. A post-addition stirring time of 30 min was allowed to enhance the wetting of particulates by the metal. The temperature of the slurry was sufficiently raised above the melting range of the matrix alloy before pouring the composite melt into preheated permanent mould.
Figure 1. Experimental set up for processing of AA2024/fly ash composites
Figure 2. Experimental set up for fabrication of aluminum metal matrix composite
Figure 3. Graphite stirrer for uniform distribution of Aluminum metal matrix composite
110 Ajit Bhandakkar et al.: Fracture Toughness of AA2024 Aluminum Fly Ash Metal Matrix Composites
Table 1. Chemical composition of matrix alloy AA2024
Grade % Elements
AA2024 Al Cu Mn Mg Zn Fe Cr Si
Base 4.17 0.68 1.3 0.11 0.63 0.090 0.35
Table 2. Chemical composition of fly ash reinforcement
Grade % Elements
Indian Fly ash Al2O3+ SiO2+ Fe2O3 CaO MgO Na2O K2O SO3
92.49 - 2.13 0.73 - 1.06
Table 3. Stir casting process details for fabrication of aluminum fly ash composites
Sr. No Composite System
Reinforcement Size (µm)
Preheat Temp of reinforcement Total Stirring time Pouring Temp. (℃)
1 2024+5% Fly ash (wt%) 25-45 800℃ 30min 750
2 2024+10% Fly ash (wt%) 25-45 800℃ 30min 800
Table 4. Extusion ratio used for secondary processing of AA2024/fly ash composites
Material Initial Diameter(mm) Final Diameter % Reduction
AA 2024 base alloy 49.5 17.74 64.16
AA2024 +5%P60 49.5 17.74 64.16
AA2024 + 10%P60 49.5 17.74 64.16
2.3. Secondary Processing The as-cast composite billets were extruded/hot rolled at
450 oC (Soaking for 4 hrs) in order to get rid of the porosities
induced during primary processing. It also improves the distribution of the reinforcement in the aluminum matrix. Secondary processing improves distribution of fly ash reinforcement in the matrix, imparts directional properties, whereby mechanical properties are improved. The hot extrusion/rolling details of Metal Matrix Composite (AA2024 + fly ash) are shown in Table 4.
2.4. Specimen Preparation The tensile specimens were fabricated from the extruded
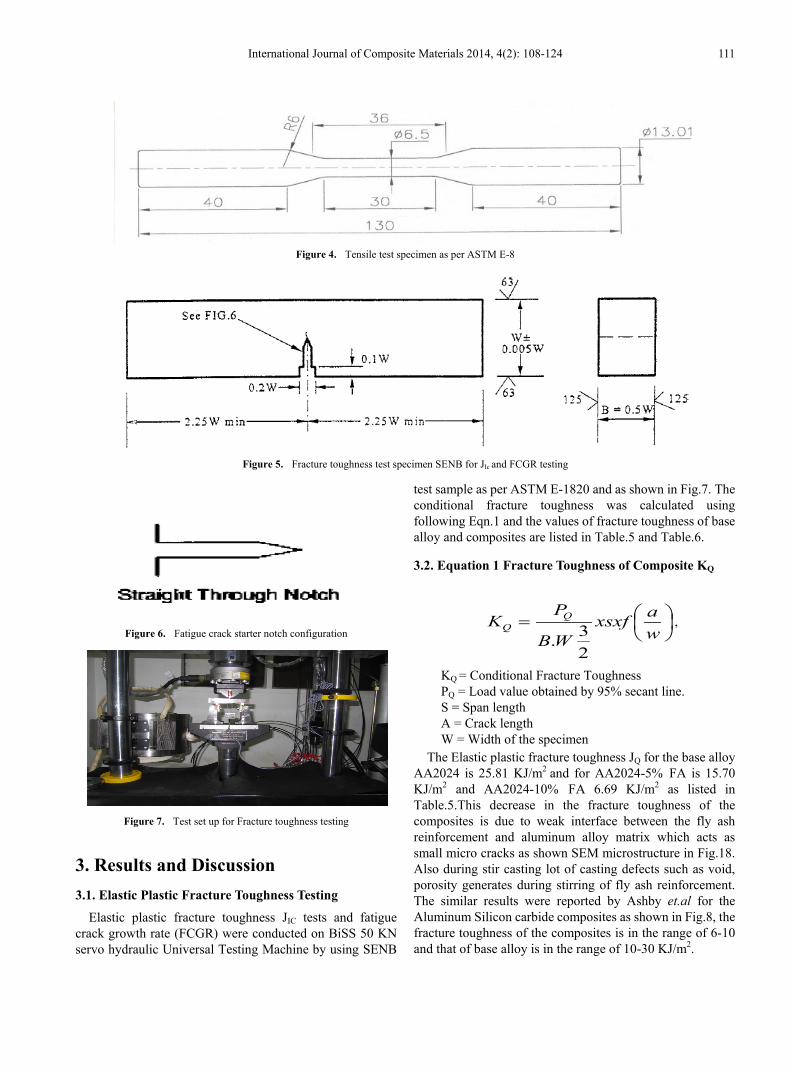
rods of the base metal and composite extrusions. as shown in Fig.4 as per ASTM E8 were used for tensile testing. The SENB specimens for KIC are prepared in LT direction with notch and intended direction perpendicular to the rolling
direction as per ASTM E-1820 and ASTM E-647 standards as shown in Fig 5 and Fig.6.
Three Point bend test specimen with a 4.5 mm thickness were machined from round bars of 12.5 mm in diameter Fig.5 show the specimen dimensions. Fatigue precracks were grown by keeping the BISS servo hydraulic machine under displacement control, with frequencies between 10 to 15 Hz by maintaining a/w ratio between 0.55-0.70. Straight notches were used in the specimen in order to enhance the initiation of the fatigue crack. The tests were made in the BISS machine using displacement control with a load point displacement rate of 0.1 mm/min. Load vs. Load point displacement (P vs. d) and amplified Load vs. mouth opening displacement (P vs. V) plots were obtained. The values of JIC and J-R were obtained following the ASTM E-1820 standards. From the obtained JIC, the equivalent K, and KIC, were calculated by equation-1.
International Journal of Composite Materials 2014, 4(2): 108-124 111
Figure 4. Tensile test specimen as per ASTM E-8
Figure 5. Fracture toughness test specimen SENB for JIc and FCGR testing
Figure 6. Fatigue crack starter notch configuration
Figure 7. Test set up for Fracture toughness testing
3. Results and Discussion 3.1. Elastic Plastic Fracture Toughness Testing
Elastic plastic fracture toughness JIC tests and fatigue crack growth rate (FCGR) were conducted on BiSS 50 KN servo hydraulic Universal Testing Machine by using SENB
test sample as per ASTM E-1820 and as shown in Fig.7. The conditional fracture toughness was calculated using following Eqn.1 and the values of fracture toughness of base alloy and composites are listed in Table.5 and Table.6.
3.2. Equation 1 Fracture Toughness of Composite KQ
=
waxsxf
WB
PK Q
Q
23.
,
KQ = Conditional Fracture Toughness PQ = Load value obtained by 95% secant line. S = Span length A = Crack length W = Width of the specimen
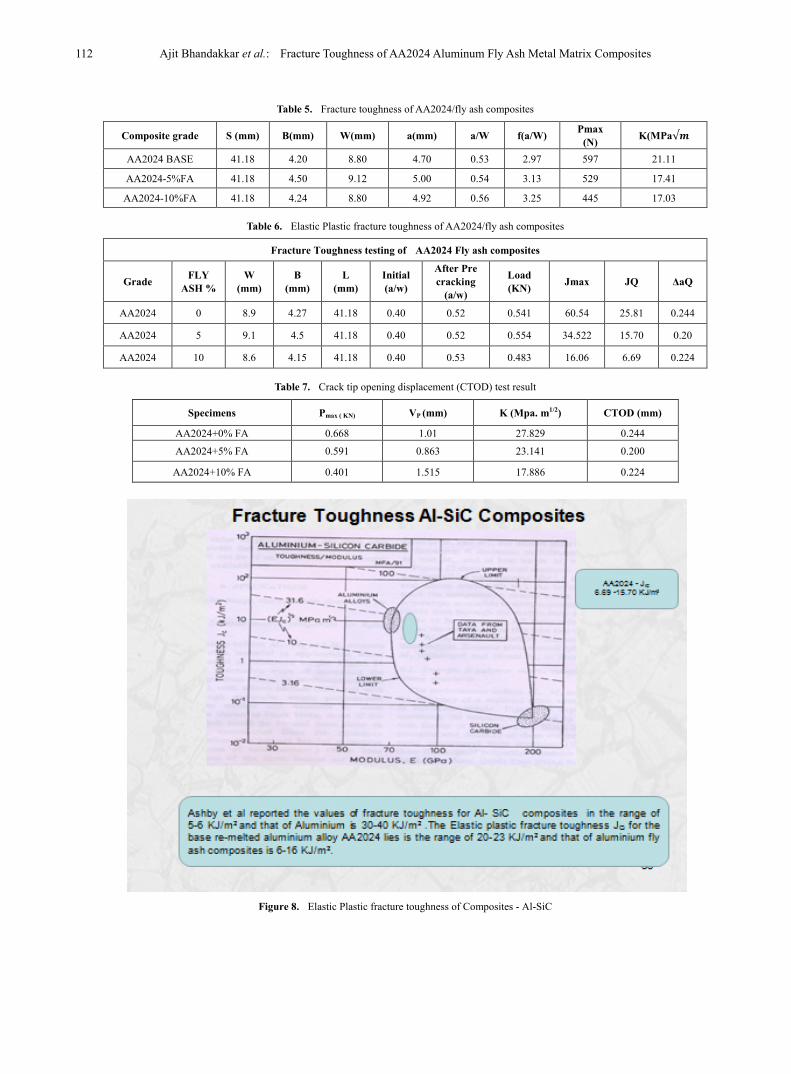
The Elastic plastic fracture toughness JQ for the base alloy AA2024 is 25.81 KJ/m2 and for AA2024-5% FA is 15.70 KJ/m2 and AA2024-10% FA 6.69 KJ/m2 as listed in Table.5.This decrease in the fracture toughness of the composites is due to weak interface between the fly ash reinforcement and aluminum alloy matrix which acts as small micro cracks as shown SEM microstructure in Fig.18. Also during stir casting lot of casting defects such as void, porosity generates during stirring of fly ash reinforcement. The similar results were reported by Ashby et.al for the Aluminum Silicon carbide composites as shown in Fig.8, the fracture toughness of the composites is in the range of 6-10 and that of base alloy is in the range of 10-30 KJ/m2.
112 Ajit Bhandakkar et al.: Fracture Toughness of AA2024 Aluminum Fly Ash Metal Matrix Composites
Table 5. Fracture toughness of AA2024/fly ash composites
Composite grade S (mm) B(mm) W(mm) a(mm) a/W f(a/W) Pmax (N) K(MPa√𝒎𝒎
AA2024 BASE 41.18 4.20 8.80 4.70 0.53 2.97 597 21.11
AA2024-5%FA 41.18 4.50 9.12 5.00 0.54 3.13 529 17.41
AA2024-10%FA 41.18 4.24 8.80 4.92 0.56 3.25 445 17.03
Table 6. Elastic Plastic fracture toughness of AA2024/fly ash composites
Fracture Toughness testing of AA2024 Fly ash composites
Grade FLY ASH %
W (mm)
B (mm)
L (mm)
Initial (a/w)
After Pre cracking
(a/w)
Load (KN) Jmax JQ ΔaQ
AA2024 0 8.9 4.27 41.18 0.40 0.52 0.541 60.54 25.81 0.244
AA2024 5 9.1 4.5 41.18 0.40 0.52 0.554 34.522 15.70 0.20
AA2024 10 8.6 4.15 41.18 0.40 0.53 0.483 16.06 6.69 0.224
Table 7. Crack tip opening displacement (CTOD) test result
Specimens Pmax ( KN) VP (mm) K (Mpa. m1/2) CTOD (mm)
AA2024+0% FA 0.668 1.01 27.829 0.244
AA2024+5% FA 0.591 0.863 23.141 0.200
AA2024+10% FA 0.401 1.515 17.886 0.224
Figure 8. Elastic Plastic fracture toughness of Composites - Al-SiC
International Journal of Composite Materials 2014, 4(2): 108-124 113
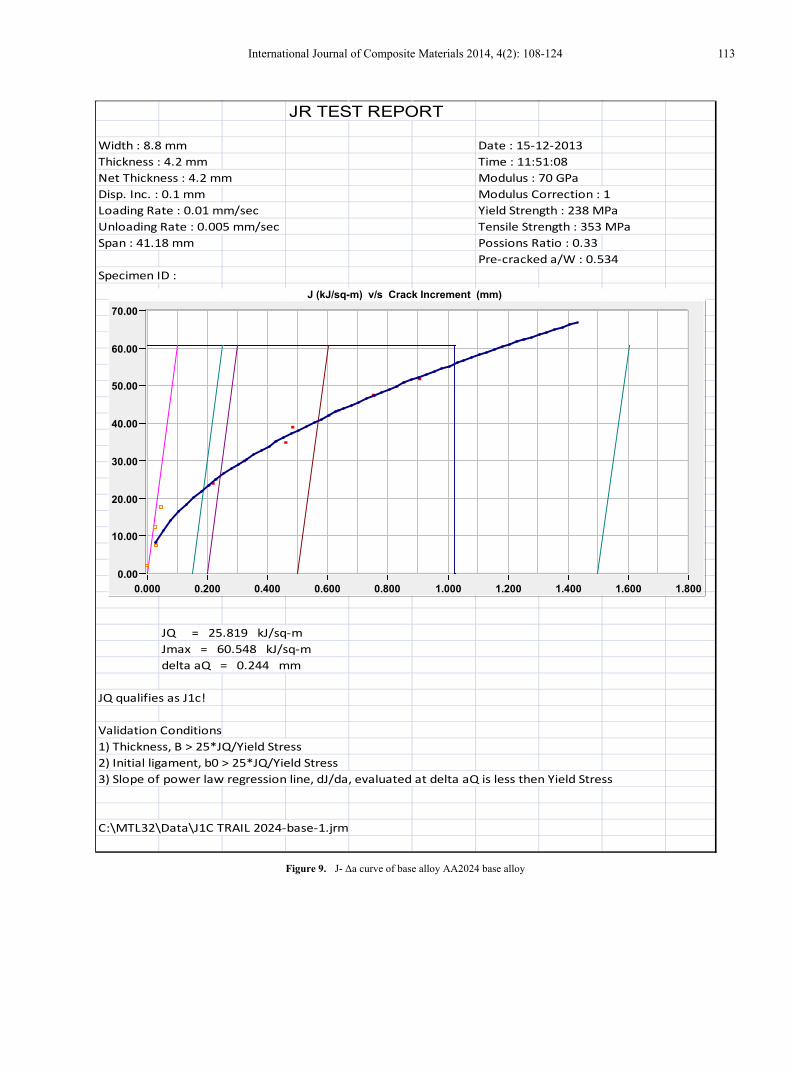
Figure 9. J- Δa curve of base alloy AA2024 base alloy
JR TEST REPORT
Width : 8.8 mm Date : 15-12-2013 Thickness : 4.2 mm Time : 11:51:08 Net Thickness : 4.2 mm Modulus : 70 GPaDisp. Inc. : 0.1 mm Modulus Correction : 1Loading Rate : 0.01 mm/sec Yield Strength : 238 MPaUnloading Rate : 0.005 mm/sec Tensile Strength : 353 MPaSpan : 41.18 mm Possions Ratio : 0.33
Pre-cracked a/W : 0.534Specimen ID :
JQ = 25.819 kJ/sq-mJmax = 60.548 kJ/sq-mdelta aQ = 0.244 mm
JQ qualifies as J1c!
Validation Conditions1) Thickness, B > 25*JQ/Yield Stress 2) Initial ligament, b0 > 25*JQ/Yield Stress3) Slope of power law regression line, dJ/da, evaluated at delta aQ is less then Yield Stress
C:\MTL32\Data\J1C TRAIL 2024-base-1.jrm
J (kJ/sq-m) v/s Crack Increment (mm)
0.00
10.00
20.00
30.00
40.00
50.00
60.00
70.00
0.000 0.200 0.400 0.600 0.800 1.000 1.200 1.400 1.600 1.800
114 Ajit Bhandakkar et al.: Fracture Toughness of AA2024 Aluminum Fly Ash Metal Matrix Composites
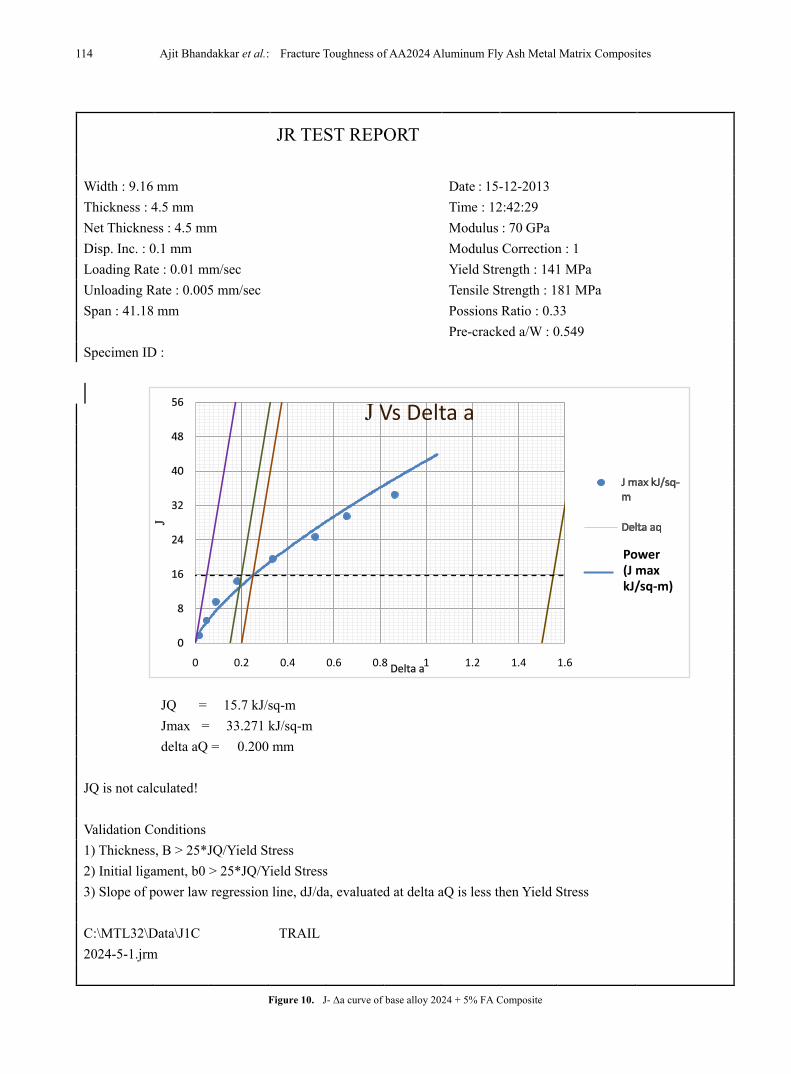
JR TEST REPORT
Width : 9.16 mm
Date : 15-12-2013
Thickness : 4.5 mm
Time : 12:42:29
Net Thickness : 4.5 mm
Modulus : 70 GPa
Disp. Inc. : 0.1 mm
Modulus Correction : 1
Loading Rate : 0.01 mm/sec
Yield Strength : 141 MPa Unloading Rate : 0.005 mm/sec
Tensile Strength : 181 MPa
Span : 41.18 mm
Possions Ratio : 0.33
Pre-cracked a/W : 0.549
Specimen ID :
JQ = 15.7 kJ/sq-m
Jmax = 33.271 kJ/sq-m
delta aQ = 0.200 mm
JQ is not calculated!
Validation Conditions
1) Thickness, B > 25*JQ/Yield Stress
2) Initial ligament, b0 > 25*JQ/Yield Stress
3) Slope of power law regression line, dJ/da, evaluated at delta aQ is less then Yield Stress
C:\MTL32\Data\J1C TRAIL 2024-5-1.jrm
Figure 10. J- Δa curve of base alloy 2024 + 5% FA Composite
0 0.2 0.4 0.6 0.8 1 1.2 1.4 1.6
J Vs Delta a
Power (J max kJ/sq-m)
International Journal of Composite Materials 2014, 4(2): 108-124 115
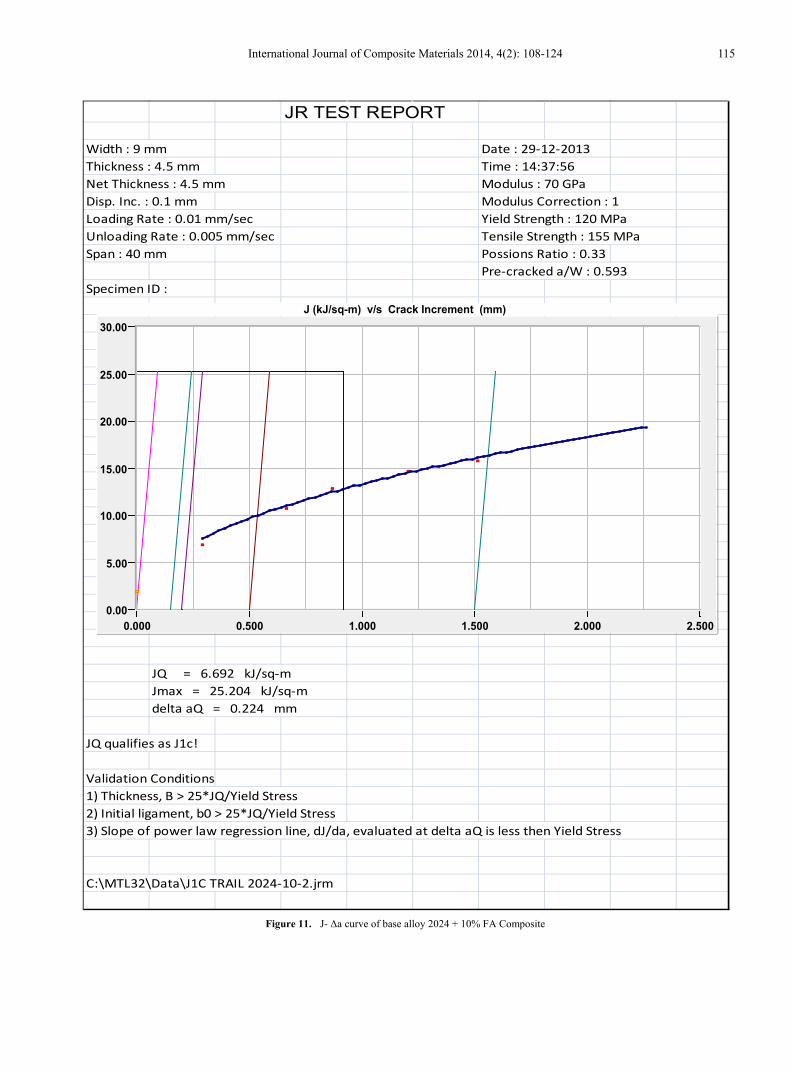
Figure 11. J- Δa curve of base alloy 2024 + 10% FA Composite
JR TEST REPORT
Width : 9 mm Date : 29-12-2013 Thickness : 4.5 mm Time : 14:37:56 Net Thickness : 4.5 mm Modulus : 70 GPaDisp. Inc. : 0.1 mm Modulus Correction : 1Loading Rate : 0.01 mm/sec Yield Strength : 120 MPaUnloading Rate : 0.005 mm/sec Tensile Strength : 155 MPaSpan : 40 mm Possions Ratio : 0.33
Pre-cracked a/W : 0.593Specimen ID :
JQ = 6.692 kJ/sq-mJmax = 25.204 kJ/sq-mdelta aQ = 0.224 mm
JQ qualifies as J1c!
Validation Conditions1) Thickness, B > 25*JQ/Yield Stress 2) Initial ligament, b0 > 25*JQ/Yield Stress3) Slope of power law regression line, dJ/da, evaluated at delta aQ is less then Yield Stress
C:\MTL32\Data\J1C TRAIL 2024-10-2.jrm
J (kJ/sq-m) v/s Crack Increment (mm)
0.00
5.00
10.00
15.00
20.00
25.00
30.00
0.000 0.500 1.000 1.500 2.000 2.500
116 Ajit Bhandakkar et al.: Fracture Toughness of AA2024 Aluminum Fly Ash Metal Matrix Composites
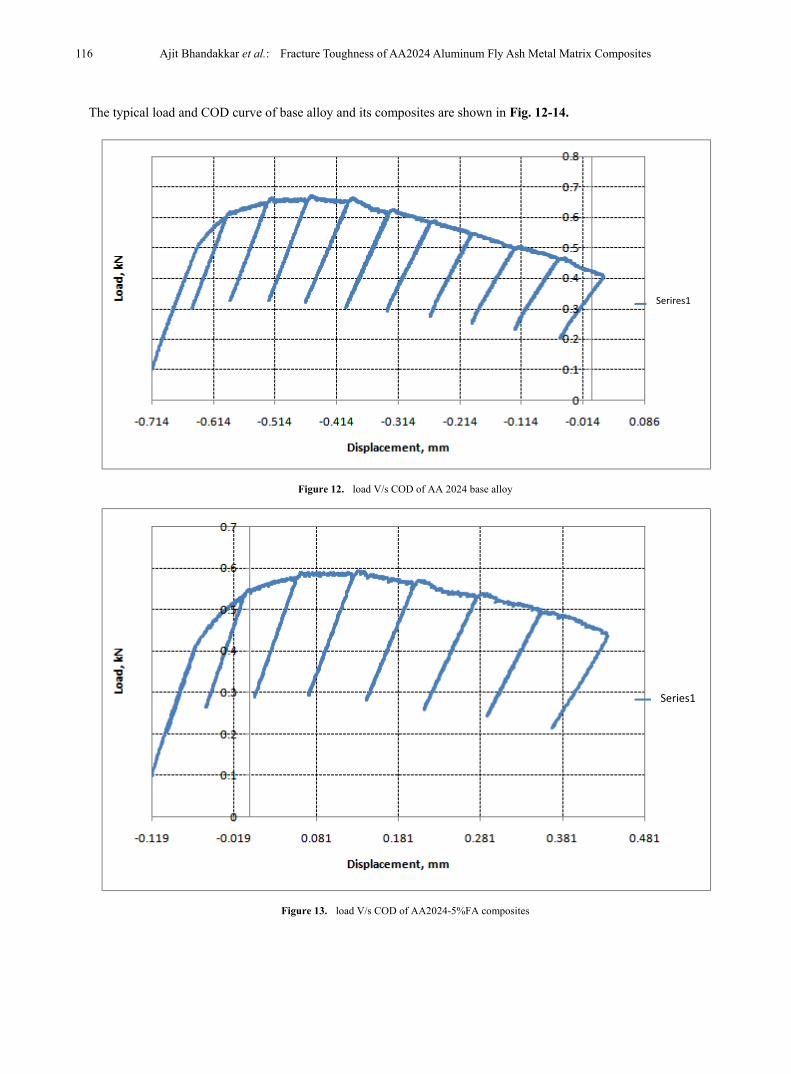
The typical load and COD curve of base alloy and its composites are shown in Fig. 12-14.
Figure 12. load V/s COD of AA 2024 base alloy
Figure 13. load V/s COD of AA2024-5%FA composites
Serires1
Series1
International Journal of Composite Materials 2014, 4(2): 108-124 117
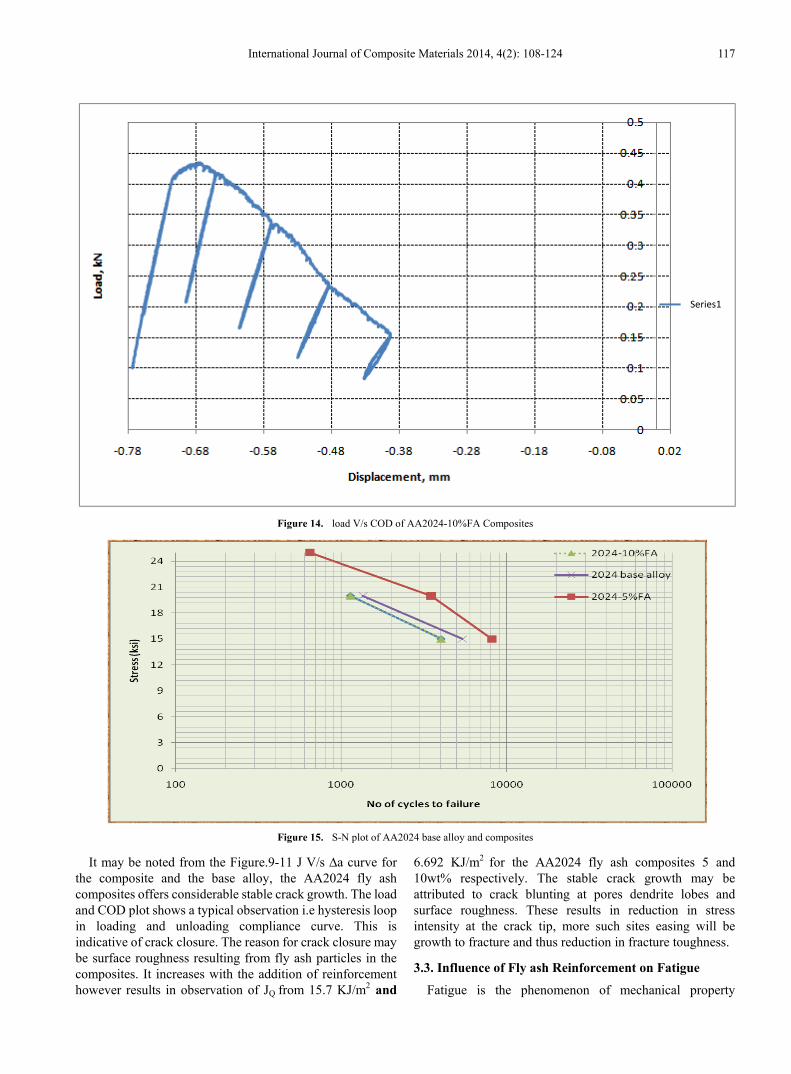
Figure 14. load V/s COD of AA2024-10%FA Composites
Figure 15. S-N plot of AA2024 base alloy and composites
It may be noted from the Figure.9-11 J V/s ∆a curve for the composite and the base alloy, the AA2024 fly ash composites offers considerable stable crack growth. The load and COD plot shows a typical observation i.e hysteresis loop in loading and unloading compliance curve. This is indicative of crack closure. The reason for crack closure may be surface roughness resulting from fly ash particles in the composites. It increases with the addition of reinforcement however results in observation of JQ from 15.7 KJ/m2 and
6.692 KJ/m2 for the AA2024 fly ash composites 5 and 10wt% respectively. The stable crack growth may be attributed to crack blunting at pores dendrite lobes and surface roughness. These results in reduction in stress intensity at the crack tip, more such sites easing will be growth to fracture and thus reduction in fracture toughness.
3.3. Influence of Fly ash Reinforcement on Fatigue
Fatigue is the phenomenon of mechanical property
Series1
118 Ajit Bhandakkar et al.: Fracture Toughness of AA2024 Aluminum Fly Ash Metal Matrix Composites
degradation leading to failure of a material or a component under cyclic loading. There are two approches of fatigue testing i.e. conventional approach (the stress vs cycle S−N) curves) and the fatigue crack growth rates using linear elastic fracture mechanics (LEFM).
In the conventional approch defect free specimen is subjected to cyclic loading at known stress value and the number of cycles at which specimen fails is recorded. The stress value vs number of cycles the specimen withstand during cyclic loding is plotted to get S-N curve.The significant drawback of such studies is that no distinction can be made between the crack initiation stage and the crack propagation stage. In the second approch a specimen containing crack is subjected to cyclic loading with known crack length (a) and load amplitude. The crack growth rate da/dN vs ΔK (stress intensity factor) is plotted to know the fatigue crack growth rate.
3.4. S-N Curve Approch
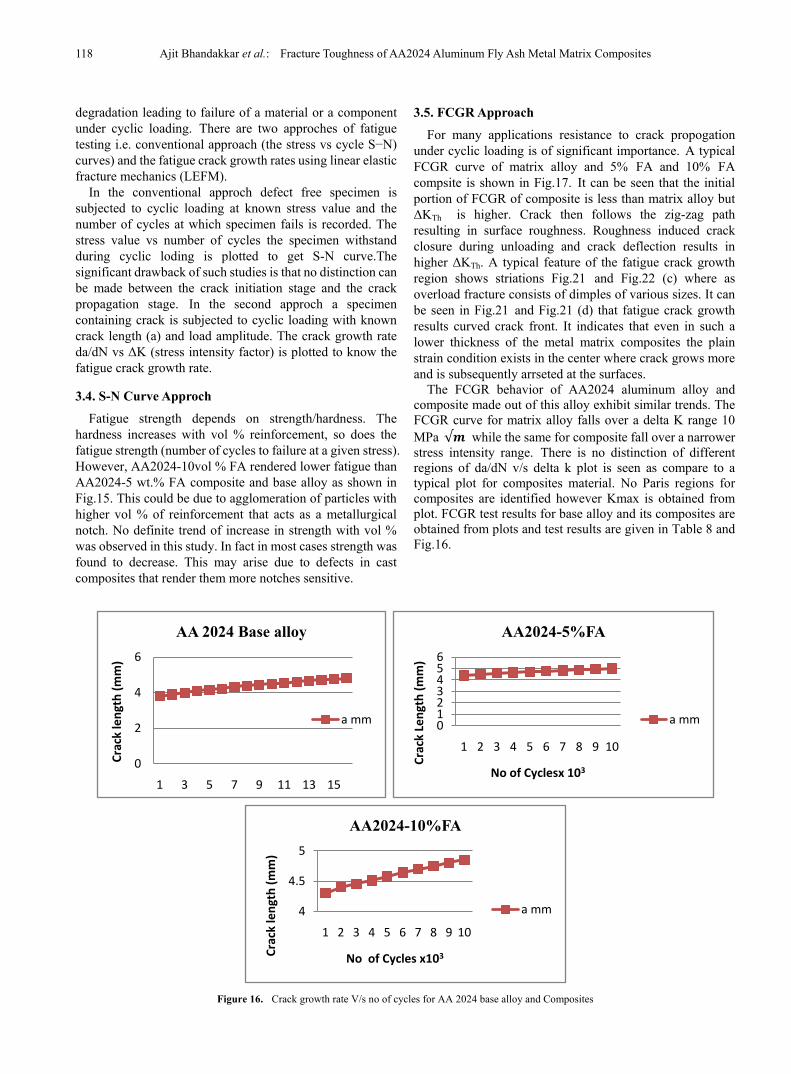
Fatigue strength depends on strength/hardness. The hardness increases with vol % reinforcement, so does the fatigue strength (number of cycles to failure at a given stress). However, AA2024-10vol % FA rendered lower fatigue than AA2024-5 wt.% FA composite and base alloy as shown in Fig.15. This could be due to agglomeration of particles with higher vol % of reinforcement that acts as a metallurgical notch. No definite trend of increase in strength with vol % was observed in this study. In fact in most cases strength was found to decrease. This may arise due to defects in cast composites that render them more notches sensitive.
3.5. FCGR Approach
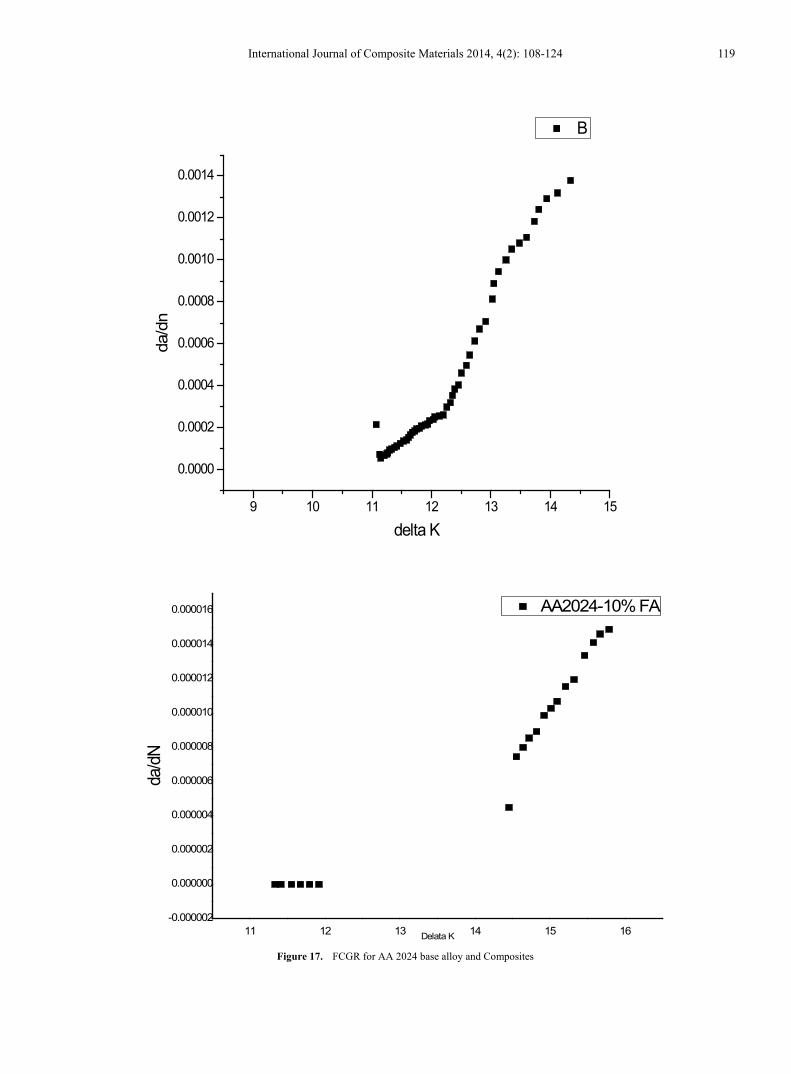
For many applications resistance to crack propogation under cyclic loading is of significant importance. A typical FCGR curve of matrix alloy and 5% FA and 10% FA compsite is shown in Fig.17. It can be seen that the initial portion of FCGR of composite is less than matrix alloy but ΔKTh is higher. Crack then follows the zig-zag path resulting in surface roughness. Roughness induced crack closure during unloading and crack deflection results in higher ΔKTh. A typical feature of the fatigue crack growth region shows striations Fig.21 and Fig.22 (c) where as overload fracture consists of dimples of various sizes. It can be seen in Fig.21 and Fig.21 (d) that fatigue crack growth results curved crack front. It indicates that even in such a lower thickness of the metal matrix composites the plain strain condition exists in the center where crack grows more and is subsequently arrseted at the surfaces.
The FCGR behavior of AA2024 aluminum alloy and composite made out of this alloy exhibit similar trends. The FCGR curve for matrix alloy falls over a delta K range 10 MPa √𝒎𝒎 while the same for composite fall over a narrower stress intensity range. There is no distinction of different regions of da/dN v/s delta k plot is seen as compare to a typical plot for composites material. No Paris regions for composites are identified however Kmax is obtained from plot. FCGR test results for base alloy and its composites are obtained from plots and test results are given in Table 8 and Fig.16.
Figure 16. Crack growth rate V/s no of cycles for AA 2024 base alloy and Composites
0
2
4
6
1 3 5 7 9 11 13 15
Crac
k le
ngth
(mm
)
AA 2024 Base alloy
a mm 0123456
1 2 3 4 5 6 7 8 9 10
Crac
k Le
ngth
(mm
)
No of Cyclesx 103
AA2024-5%FA
a mm
4
4.5
5
1 2 3 4 5 6 7 8 9 10
Crac
k le
ngth
(mm
)
No of Cycles x103
AA2024-10%FA
a mm
International Journal of Composite Materials 2014, 4(2): 108-124 119
9 10 11 12 13 14 15
0.0000
0.0002
0.0004
0.0006
0.0008
0.0010
0.0012
0.0014
B
da/d
n
delta K
Figure 17. FCGR for AA 2024 base alloy and Composites
11 12 13 14 15 16-0.000002
0.000000
0.000002
0.000004
0.000006
0.000008
0.000010
0.000012
0.000014
0.000016
da/d
N
Delata K
AA2024-10% FA
120 Ajit Bhandakkar et al.: Fracture Toughness of AA2024 Aluminum Fly Ash Metal Matrix Composites
7 8 9 10 11 12
0.000025
0.000030
0.000035
0.000040
0.000045
0.000050
0.000055
0.000060da
/dn
delta K
0 2 4 6 8 10
0
2
4
6
8
10
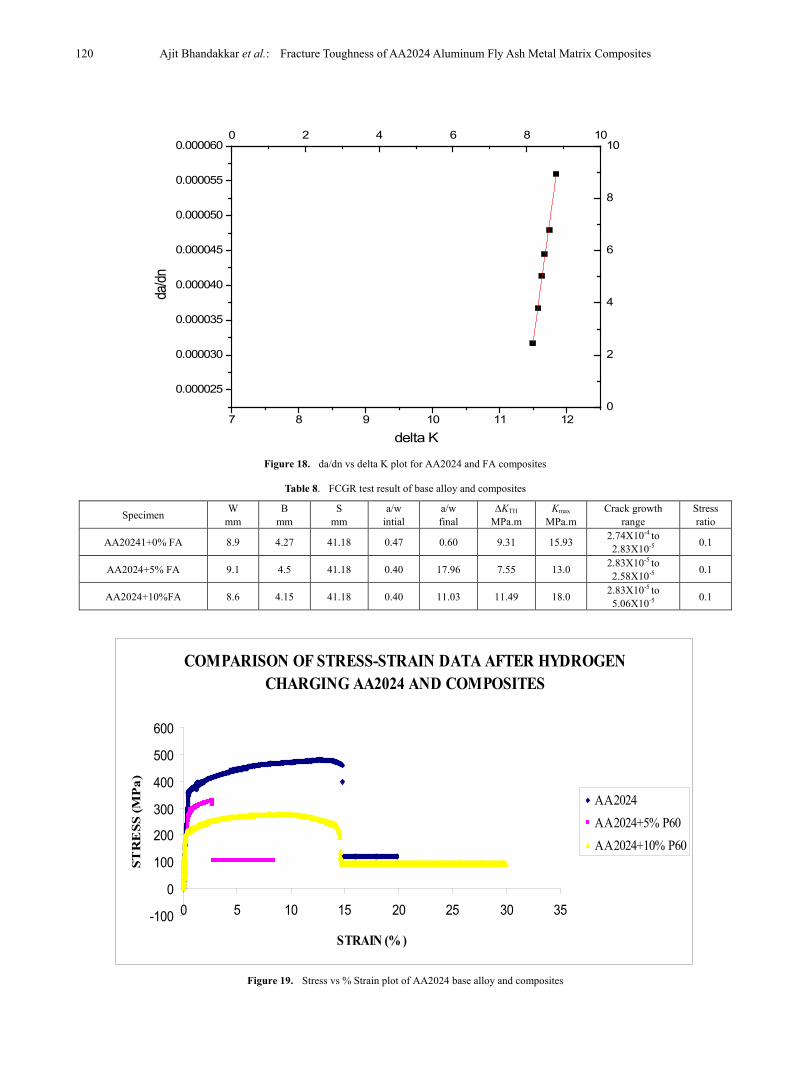
Figure 18. da/dn vs delta K plot for AA2024 and FA composites
Table 8. FCGR test result of base alloy and composites
Specimen W mm
B mm
S mm
a/w intial
a/w final
∆KTH
MPa.m Kmax
MPa.m Crack growth
range Stress ratio
AA20241+0% FA 8.9 4.27 41.18 0.47 0.60 9.31 15.93 2.74X10⁻⁴ to 2.83X10⁻⁵ 0.1
AA2024+5% FA 9.1 4.5 41.18 0.40 17.96 7.55 13.0 2.83X10⁻⁵ to 2.58X10⁻⁵ 0.1
AA2024+10%FA 8.6 4.15 41.18 0.40 11.03 11.49 18.0 2.83X10⁻⁵ to 5.06X10⁻⁵ 0.1
Figure 19. Stress vs % Strain plot of AA2024 base alloy and composites
COMPARISON OF STRESS-STRAIN DATA AFTER HYDROGEN CHARGING AA2024 AND COMPOSITES
-100
0
100
200
300
400
500
600
0 5 10 15 20 25 30 35
STRAIN (% )
STR
ESS
(MP
a)
AA2024AA2024+5% P60AA2024+10% P60
International Journal of Composite Materials 2014, 4(2): 108-124 121
4. Mechanical Properties 4.1. Tensile Properties
The mechanical properties such as ultimate tensile strength, 0.2% yield strength and percentage elongation have been evaluated for AA 2024 base alloy and fly ash composites and are listed in Table.9 and shown in Fig.19. The hardness of the base alloy and composite listed in Table.10.
Table 9. Tensile test results of AA2024 base alloy and AA2024/fly ash composites
Condition (Rolled)
0.2% Y.S (MPa)
UTS (MPa)
% Elongation
AA2024 + 0% wt. fly ash 238 353 10.1
AA 2024 + 5% wt.fly ash 114411 118811 11..1100
AA 2024 + 10% wt. fly ash 112200 115555 22..0099
4.2. Hardness
The hardness have been evaluated for AA2024/fly ash composites with Leco Vickers Micro hardness tester and the
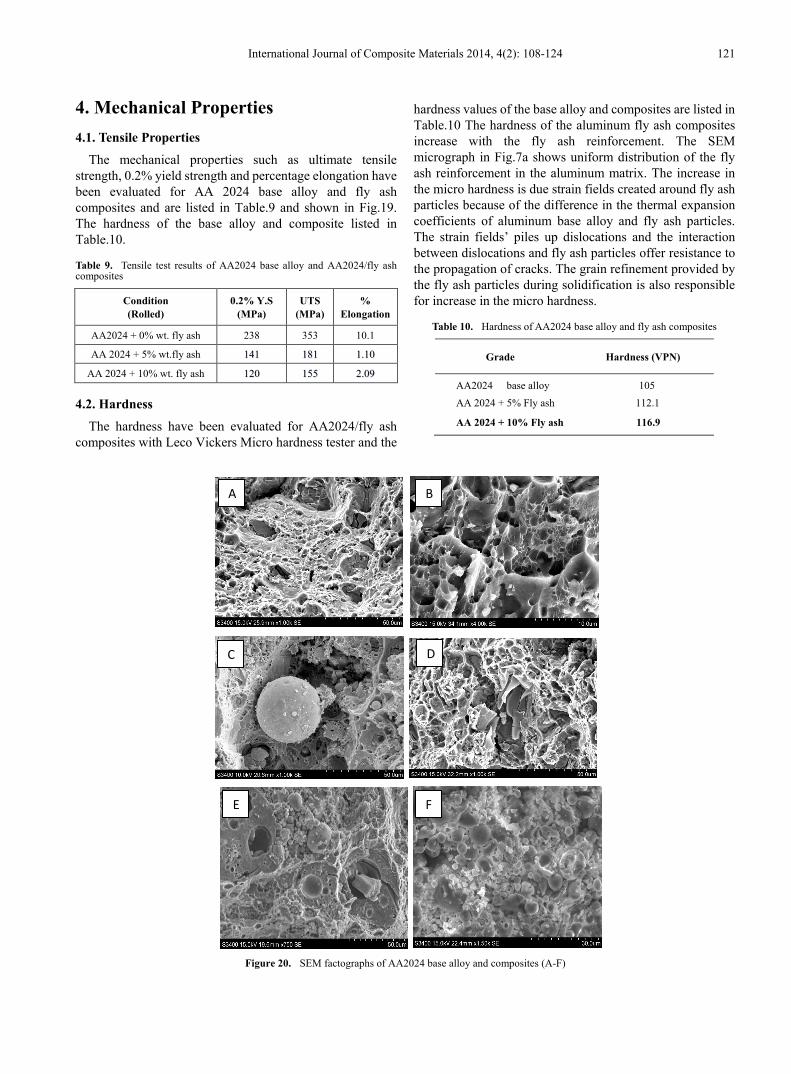
hardness values of the base alloy and composites are listed in Table.10 The hardness of the aluminum fly ash composites increase with the fly ash reinforcement. The SEM micrograph in Fig.7a shows uniform distribution of the fly ash reinforcement in the aluminum matrix. The increase in the micro hardness is due strain fields created around fly ash particles because of the difference in the thermal expansion coefficients of aluminum base alloy and fly ash particles. The strain fields’ piles up dislocations and the interaction between dislocations and fly ash particles offer resistance to the propagation of cracks. The grain refinement provided by the fly ash particles during solidification is also responsible for increase in the micro hardness.
Table 10. Hardness of AA2024 base alloy and fly ash composites
Grade Hardness (VPN)
AA2024 base alloy 105 AA 2024 + 5% Fly ash 112.1
AA 2024 + 10% Fly ash 116.9
Figure 20. SEM factographs of AA2024 base alloy and composites (A-F)
A B
C
D
E F
122 Ajit Bhandakkar et al.: Fracture Toughness of AA2024 Aluminum Fly Ash Metal Matrix Composites
Tensile test results as listed in Table.9 and Figure.19 of aluminum fly ash composites at room temperature indicates that with the increase in the fly ash reinforcement from 0% to 10% the yield strength decreases from 238 MPa to 120 MPa and the tensile strength decreases from 353 MPa to 155 MPa. This decrease in the yield strength and tensile strength may be attributed due to the presence of casting defects in the fly ash composite during addition of fly ash particulate reinforcement. The tensile fracture surface was observed under SEM to study the modes of fracture as shown in Fig.20 (a-f).The large dimples are associated with the reinforcing particles and small dimples are associated with the fine second phase particles in the matrix. The dimples observed in the aluminum fly ash composites were shallow compared to that observed in unreinforced alloy. The presence of particles in the ductile aluminum alloy matrix promotes low plasticity and condition of high stress triaxiality and voids nucleate at low strain and coalescence is dominated only by their transverse growth. This prevents the extensive growth of voids results in shallow dimples in composites alloy as compared to base alloy.
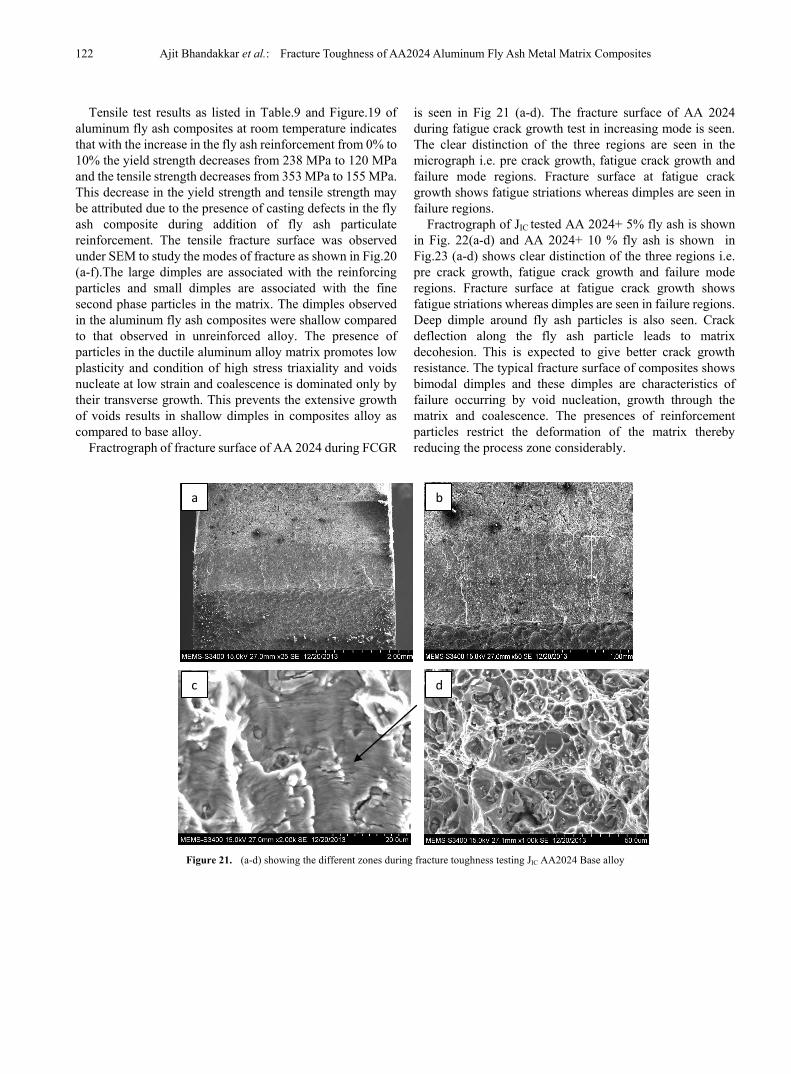
Fractrograph of fracture surface of AA 2024 during FCGR
is seen in Fig 21 (a-d). The fracture surface of AA 2024 during fatigue crack growth test in increasing mode is seen. The clear distinction of the three regions are seen in the micrograph i.e. pre crack growth, fatigue crack growth and failure mode regions. Fracture surface at fatigue crack growth shows fatigue striations whereas dimples are seen in failure regions.
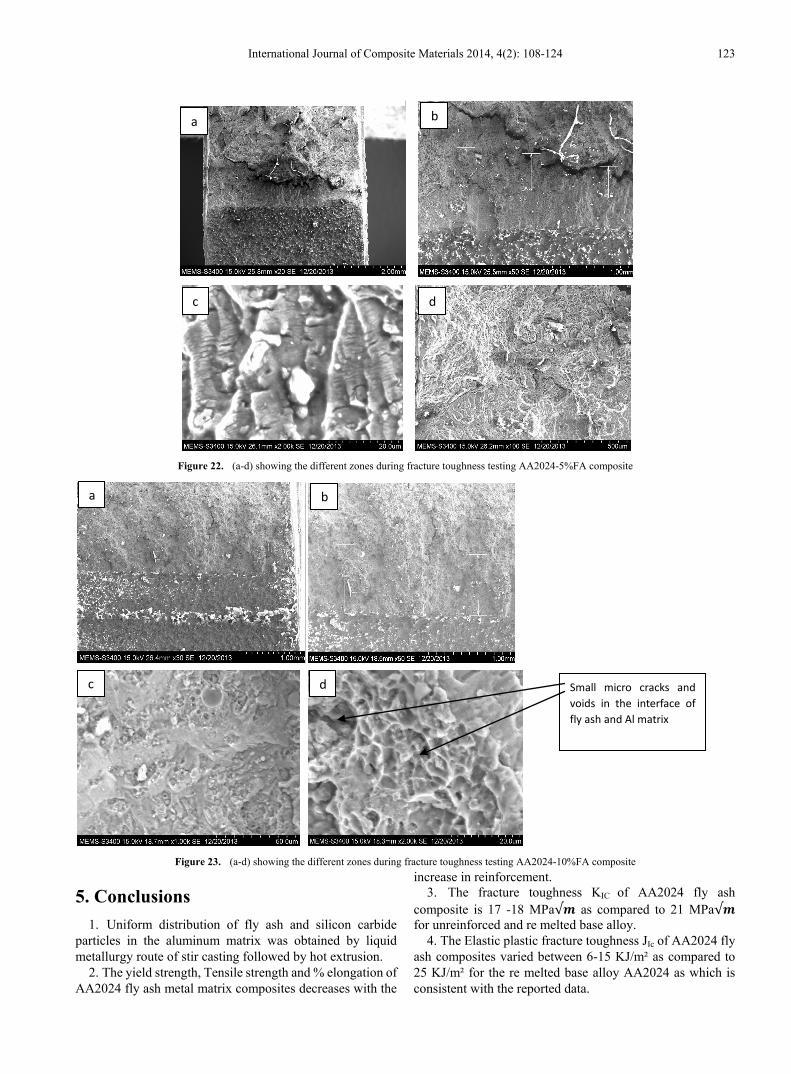
Fractrograph of JIC tested AA 2024+ 5% fly ash is shown in Fig. 22(a-d) and AA 2024+ 10 % fly ash is shown in Fig.23 (a-d) shows clear distinction of the three regions i.e. pre crack growth, fatigue crack growth and failure mode regions. Fracture surface at fatigue crack growth shows fatigue striations whereas dimples are seen in failure regions. Deep dimple around fly ash particles is also seen. Crack deflection along the fly ash particle leads to matrix decohesion. This is expected to give better crack growth resistance. The typical fracture surface of composites shows bimodal dimples and these dimples are characteristics of failure occurring by void nucleation, growth through the matrix and coalescence. The presences of reinforcement particles restrict the deformation of the matrix thereby reducing the process zone considerably.
Figure 21. (a-d) showing the different zones during fracture toughness testing JIC AA2024 Base alloy
c
a
d
b
International Journal of Composite Materials 2014, 4(2): 108-124 123
Figure 22. (a-d) showing the different zones during fracture toughness testing AA2024-5%FA composite
Figure 23. (a-d) showing the different zones during fracture toughness testing AA2024-10%FA composite
5. Conclusions 1. Uniform distribution of fly ash and silicon carbide
particles in the aluminum matrix was obtained by liquid metallurgy route of stir casting followed by hot extrusion.
2. The yield strength, Tensile strength and % elongation of AA2024 fly ash metal matrix composites decreases with the
increase in reinforcement. 3. The fracture toughness KIC of AA2024 fly ash
composite is 17 -18 MPa√𝒎𝒎 as compared to 21 MPa√𝒎𝒎 for unreinforced and re melted base alloy.
4. The Elastic plastic fracture toughness JIc of AA2024 fly ash composites varied between 6-15 KJ/m² as compared to 25 KJ/m² for the re melted base alloy AA2024 as which is consistent with the reported data.
c
d
a b
a b
c d Small micro cracks and voids in the interface of fly ash and Al matrix
124 Ajit Bhandakkar et al.: Fracture Toughness of AA2024 Aluminum Fly Ash Metal Matrix Composites
5. The load and COD plot of the composite shows a hysteresis loop in loading and unloading compliance curve. This is indicative of crack closure. The reason for crack closure may be surface roughness resulting from fly ash particles in the composites.
6. The FCGR curve for matrix alloy falls over a delta K range 10 MPa √𝒎𝒎 while the same for composite fall over a narrower stress intensity range. Hence the composite may therefore, be considered as potential candidate materials for aerospace sectors.
REFERENCES [1] J.E. Perez Ipiñaa, A.A. Yawny, R. Stuke, C. Gonzalez Oliver,
“Fracture Toughness in Metal Matrix Composites”, Materials Research, Vol. 3, No. 3, 74-78, 2000.
[2] VK Lindroos & MJ Talvitie, “Recent advances in metal matrix composites”, Journal of Materials Processing Technology, 53(1995) pp 273-284.
[3] P.J. Withers, W.M. Stobbs, O.B. Pedersen, Acta Metall. 37 (1989) 3061–3084.
[4] V.C. Nardone, K.M. Prewo, Scr. Metall. 20 (1986) 43–48.
[5] V.C. Nardone, Scr. Metall. 21 (1987) 1313–1318.
[6] T.W. Clyne, An Introduction to MetalMatrix Composites, Cambridge University Press, Cambridge, 1993.
[7] V.K. Varma, Y.R. Mahajan, V.V. Kutumbarao, Scr. Mater. 37 (1997) 485–489.
[8] K. Tanaka, Y. Akiniwa, K. Shimizu, H. Kimura, S. Adachi, Int. J. Fatigue 22 (2000) 431–439.
[9] H. Sekine, R. Chen, Composites 26 (1995) 183–18.
[10] Yu Qiao, “Fracture toughness of composite materials reinforced by debondable particulates” Scripta Materialia 49 (2003) 491–496.
[11] S.J. Hong, H.M. Kim, D. Huh, C. Suryanarayana, B.S. Chun, Mater. Sci. Eng. A 347 2003) 198–204.
[12] D.F. Hasson, C.R. Crowe, Strength of Metals and Alloys (Conf. Proc.), Pergamon Press, Oxford, 1985, pp. 1515–1520.
[13] Y. Flom, R.J. Arsenault, Proceedings of the Sixth
International Conference on Composite Materials and Second European Conference on Composite Materials (Conf. Proc.), vol. 2, Elsevier Applied Science, Barking, Essex, 1987, pp. 189–198.
[14] H.H. Hunt, O. Richmond, R.D. Young, Proceedings of the Sixth International Conference on Composite Materials and Second European Conference on Composite Materials (Conf. Proc.), vol. 2, Elsevier Applied Science, Barking, Essex, 1987, pp. 209–22.
[15] Vikram Singh and R.C. Prasad, “Tensile and Fracture behavior of 6061 Al-SiC Metal Matrix composites” International Symposium of Research Students on Materials Science and Engineering December 20-22, 2004, Chennai, India.
[16] M.T. Milan and P. 2004. Tensile and Fracture Toughness Properties of SiCp Reinforced Al Alloys: Effects of Particle Size, Particle Volume Fraction, and Matrix Strength. JMEPEG. 13: 775-783.
[17] John nunes and John Slepetz, “Fracture toughness testing of metal matrix composites”, Composites Science and Technology Vol. 30, (1988) pp. 565-577.
[18] B Roebuck, J Lord. Plane strain fracture toughness test procedures for particulate metal matrix composites. Materials Science & Technology, Dec 1990, Vol 6, pp1199-1209.
[19] P S Robi, “Processing, Mechanical Properties and micromechanism of fracture of Aluminium Matrix composites” PhD Thesis, 1995.
[20] J J Lewandowski and PM Singh,” Intrinsic and Extrinsic Fracture mechanics in organic composite systems” TMS, 1995, P129-147.
[21] Bretz, P.E.Bucci, R.J.Malcolm, RC and Vasudevan, A.K,” Constant amplitude fatigue crack growth behavior of 7XXX Aluminium alloys”, Fracture mechanics-Fourteen symposium: Testing and applications, I ASTM STP-791.
[22] Stofanak, R.J., Hertzberg, R.W., Millers, G., Jaccard, R., Donald, K.,” On the cyclic behavior of cast and extruded aluminum alloys. Part A: Fatigue crack propagation”, Engineering Fracture Mechanics, Volume 17, Issue 6, 1983, Pages 527-539Nix.
[23] K.J., Flower, H.M.,” The micromechanisms of fatigue crack growth in a commercial Al-Zn-Mg-Cu alloy”, Acta Metallurgica, Volume 30, Issue 8, August 1982, Pages 1549-1559.