Embed Size (px)
Citation preview
Heriot-Watt University Research Gateway
Heriot-Watt University
Fracture-matrix interactions during immiscible three-phase flowElfeel, Mohamed Ahmed; Al-Dhahli, Adnan Rashid Saif; Geiger, Sebastian; Van Dijke,Marinus Izaak JanPublished in:Journal of Petroleum Science and Engineering
DOI:10.1016/j.petrol.2016.02.012
Publication date:2016
Document VersionPeer reviewed version
Link to publication in Heriot-Watt University Research Portal
Citation for published version (APA):Elfeel, M. A., Al-Dhahli, A. R. S., Geiger, S., & Van Dijke, M. I. J. (2016). Fracture-matrix interactions duringimmiscible three-phase flow. Journal of Petroleum Science and Engineering, 143, 171–186. DOI:10.1016/j.petrol.2016.02.012
General rightsCopyright and moral rights for the publications made accessible in the public portal are retained by the authors and/or other copyright ownersand it is a condition of accessing publications that users recognise and abide by the legal requirements associated with these rights.
If you believe that this document breaches copyright please contact us providing details, and we will remove access to the work immediatelyand investigate your claim.

Download date: 30. Jun. 2018
Author’s Accepted Manuscript
Fracture-matrix interactions during immisciblethree-phase flow
Mohamed Ahmed Elfeel, Adnan Al-Dhahli,Sebastian Geiger, Marinus I.J van Dijke
PII: S0920-4105(16)30055-9DOI: http://dx.doi.org/10.1016/j.petrol.2016.02.012Reference: PETROL3355
To appear in: Journal of Petroleum Science and Engineering
Received date: 23 December 2013Revised date: 3 December 2015Accepted date: 16 February 2016
Cite this article as: Mohamed Ahmed Elfeel, Adnan Al-Dhahli, Sebastian Geigerand Marinus I.J van Dijke, Fracture-matrix interactions during immiscible three-phase flow, Journal of Petroleum Science and Engineering,http://dx.doi.org/10.1016/j.petrol.2016.02.012
This is a PDF file of an unedited manuscript that has been accepted forpublication. As a service to our customers we are providing this early version ofthe manuscript. The manuscript will undergo copyediting, typesetting, andreview of the resulting galley proof before it is published in its final citable form.Please note that during the production process errors may be discovered whichcould affect the content, and all legal disclaimers that apply to the journal pertain.
www.elsevier.com/locate/petrol
1
Fracture-matrix interactions during immiscible three-phase flow Mohamed Ahmed Elfeel1*, Adnan Al-Dhahli2, Sebastian Geiger, Marinus I.J van Dijke
Institute of Petroleum Engineering, Heriot-Watt University, Edinburgh EH14 4AS, United Kingdom *Corresponding author
Abstract
Naturally Fractured Reservoirs (NFR) contain a significant amount of remaining petroleum reserves
and are now considered for Enhanced Oil Recovery (EOR) schemes that involve three-phase flow
such as water-alternating-gas (WAG) injection. Reservoir simulation of three phase flow is
challenging because a proper set of flow functions, i.e. relative permeability and capillary pressure
functions, that describe the underlying physics of fluid displacement is vitally important to obtain
reliable production forecasts but associated with high uncertainty. For NFR, another challenge is the
upscaling of recovery processes, particularly fracture-matrix transfer during three-phase flow, to the
reservoir scale using dual porosity or dual permeability models.
In this work we approach a solution to these challenges by analysing three-phase flow during WAG
injection at various scales, starting at the pore scale and then move on to an intermediate scale
which is comparable to the scale of a single reservoir simulation grid block. At this scale, we
represent fractures and matrix using a fine-grid model that employs empirical and pore-network
modelling derived three-phase flow functions to study the effect of capillary and gravity forces on
fracture-matrix transfer. We also consider different matrix wettabilities and permeabilities, as well
as matrix block size distributions. We then perform an upscaling step that is typical for field-scale
recovery simulations and use the dual porosity model to represent fracture-matrix transfer
processes that were observed at the grid-block scale. This enables us to analyse and improve the
accuracy of dual porosity models for three-phase displacement processes inherent to WAG in NFR.
We find that different three-phase saturation profiles develop inside matrix blocks, which are
strongly dependent on wettability of the matrix. These profiles have a profound impact on recovery
during WAG injection. The classical dual porosity model fails to capture these saturation profiles and
hence miscalculates recovery during early WAG cycles. We present a double block dual porosity
model, i.e. a simple multiple continua model, which better matches the fine grid simulation results.
Keywords: fracture-matrix transfer, WAG injection, dual porosity, three-phase flow
1. Introduction Fractures can occur naturally in carbonate and clastic formations. Naturally fractured reservoirs
comprise complex heterogeneities because the fractures are typically highly conductive but have
small storage. Vice-versa, the rock matrix has high storage but normally only a small contribution to
1 Now at Schlumberger, Abingdon Technology Center, Oxfordshire, UK. 2 Now at Petroleum Development Oman, Muscat, Oman.
2
flow. This renders the design of enhanced oil recovery (EOR) schemes difficult because of poor
injection fluid sweep efficiency and early water and/or gas breakthrough. In petroleum reservoirs,
the latter often renders overall hydrocarbon recovery very low in fractured reservoirs. This has been
shown in numerous case studies (e.g. Davidson and Snowdon, 1978; Denoyelle et al., 1988; Panda et
al., 2009).
Continuous water injection into petroleum reservoirs is a well-established secondary recovery
method which aims primarily to displace the oil and maintain the reservoir pressure. Oil
displacement from the rock matrix in fractured reservoirs by injected water is capillary dominated
and hence strongly dependent on the wettability of the rock (e.g., Behbahani and Blunt, 2005; Fernø
et al., 2011; Schmid and Geiger, 2013). For unfavourable, i.e. mixed- to oil-wet matrix wettability,
water flooding can be ineffective. In such cases, secondary recovery plans can be changed from
water to gas injection to increase recovery (O'Neill, 1988; van Dijkum and Walker, 1991). In
particular, gas oil gravity drainage (GOGD) provides an important drive mechanism in such cases
because it can increase recovery factors irrespective of the reservoir wettability (e.g., Hagoort,
1980). Fractures extend the exposure of the injected gas with oil in reservoir rock, which renders
GOGD more effective compared to unfractured reservoirs. Hence gas injection has been applied in
many NFR (e.g., O’Neill, 1988; van Dijkum and Walker, 1991; Jakobsson and Christian, 1994; Saidi,
1996). However, as the gas mobility is high compared to water and oil, so is the risk of by-passed oil
and gravity override, which can lead to early gas breakthrough (e.g., Panda et al., 2009). This is
particularly true for NFR. In addition, the lack of availability of gas may limit implementation of a
recovery scheme that solely relies on gas injection.
Water-alternating-gas (WAG) injection, both at miscible and immiscible conditions, combines the
merits of the two injection fluids described above on macroscopic and microscopic scales while
stabilizing the injection front, delaying breakthroughs, and therefore leading to increased oil
recovery compared to continuous water or gas injection. This has been demonstrated in micro-
model experiments that mimic multi-phase flow in conventional (Sohrabi et al., 2004) and fractured
porous media (Er et al., 2010; Dehghan et al., 2012). In almost all reported cases, WAG application
on the field-scale was observed to improve recovery (Awan et al., 2008; Brodie et al., 2012;
Christensen et al., 2001).
Gas (continuous or as part of WAG flooding) injection represents more than 80% of EOR projects in
carbonate reservoirs in the United States (Manrique et al., 2007) where the majority of the world’s
WAG injections are applied (Christensen et al., 2001). In the North Sea, WAG is the most widely used
EOR method (48%) and is typically applied in clastic reservoirs. In terms of incremental recovery,
WAG has been regarded as the most successful EOR method in the North Sea (Awan et al., 2008).
This is excluding other successful forms of WAG EOR methods, such as the Simultaneous WAG
(SWAG) and Foam Assisted WAG (FAWAG). Elsewhere, preparations are underway to apply WAG to
carbonate reservoirs in the Middle East (Arayni et al., 2013; Kalam et al., 2011; Rawahi et al., 2012)
as well as the pre-salt carbonate reservoirs offshore Brazil (Pizarro and Branco, 2012).
Reservoir simulation of WAG injection includes additional complexities because all three phases, oil,
gas and water, are mobile in parts of the reservoir. Hence representative three-phase relative
permeability and capillary pressure functions, hereafter termed ”flow functions”, are required to
characterise the corresponding three-phase displacement processes. Three-phase relative
permeability and capillary pressure data are very difficult to measure experimentally and there are
3
an infinite number of saturation paths that can occur. To overcome these challenges, empirical
models are typically employed to predict three-phase flow functions from two-phase experiments
(cf. Blunt, 2000). Empirical models are continuously improved to account for more processes that
occur when three phases coexist (e.g., Fayers and Matthews 1984; Larsen and Skauge 1998; Blunt
2000). Although producing more accurate results, these improvements cannot easily overcome the
major deficiency of the empirical models: They are mainly based on interpolating the much simpler
physics of two-phase displacements, expressed in two-phase flow functions. They hence often fail to
predict experimentally derived three-phase flow functions accurately, particularly when the rock is
mixed or oil-wet (Delshad and Pope, 1989; Oak et al., 1990; Petersen et al., 2008; van Spronsen,
1982; Egermann et al., 2014).
Since most oil in a NFR is contained in the rock matrix, capillary and gravity forces can be more
important in NFR in WAG compared to unfractured reservoirs. For example, capillary forces may
either enhance or reduce recovery from matrix blocks depending on wettability (e.g., Gilman and
Kazemi, 1988; Gang and Kelkar, 2008). Moreover, under some conditions, WAG may lead to water
and gas displacing each other, while leaving the oil phase located in the rock matrix in place. Hence
the choice of three-phase capillary pressure and relative permeability functions, which encapsulate
how oil- or water-wet the rock is, will have a major impact on how fracture-matrix fluid transfer is
predicted during reservoir simulation of WAG injection in NFRs.
At the field scale, the exchange between fractures and matrix is commonly modelled using dual
porosity or dual permeability models. Both approaches employ transfer functions that simplify the
exchange of fluids between fractures and matrix and resemble a fundamental upscaling process (e.g.
Ramirez et al., 2009; Al-Kobaisi et al., 2009). This upscaling also neglects that the matrix properties
are often heterogeneous, particularly in carbonate reservoirs. For example, Lichaa et al. (1993)
found that that wettability indices in a Middle Eastern carbonate reservoir cover the full range from
strongly water- to strongly oil-wet while the permeability varied over several orders of magnitude.
These changes were observed in sections from two wells over a total length of less than 20 meters,
i.e. at a length that is typically at or below the scale of a common reservoir simulation grid block.
In addition to the heterogeneities in matrix wettability and permeability, there are further
heterogeneities to consider related to the scales at which natural fractures occur. Often the
distribution of the matrix block sizes in a reservoir simulation grid block does not follow Warren and
Root’s (1963) classical assumption that the matrix can be represented as uniform sugar-cube blocks.
Instead, even at the scale below a single reservoir simulation grid block, individual blocks of the rock
matrix often have multiple shapes and aspect ratios, which give rise to a distribution of fracture-
matrix transfer rates (e.g., Haggerty et al., 2001; Di Donato et al., 2007; Geiger et al., 2013; Maier
and Geiger, 2013). Since the classical dual porosity model assumes uniform matrix permeability,
wettability, and uniform block sizes in each simulation grid-block, it is likely that some important
recovery processes are misrepresented in the dual porosity upscaling process during WAG.
For two-phase flow processes in NFR, it has been demonstrated that lumping of capillary pressures
can be used to account for heterogeneities in matrix permeability and wettability. Capillary pressure
lumping involves the use of fine-grid simulations that represent matrix heterogeneities explicitly.
The transfer function is then tuned to match the fine-grid results by readjusting the capillary
pressure curve (Fung, 1993). To investigate fracture-matrix transfer during three-phase flow when
WAG is applied to a NFR with a heterogeneous rock matrix, we follow a similar approach and use
4
fine-grid simulations to analyse the complex three-phase flow displacement processes. We then use
the results from the fine-grid simulations to test how the dual porosity model could be adapted to
capture three-phase fracture-matrix fluid transfer more accurately.
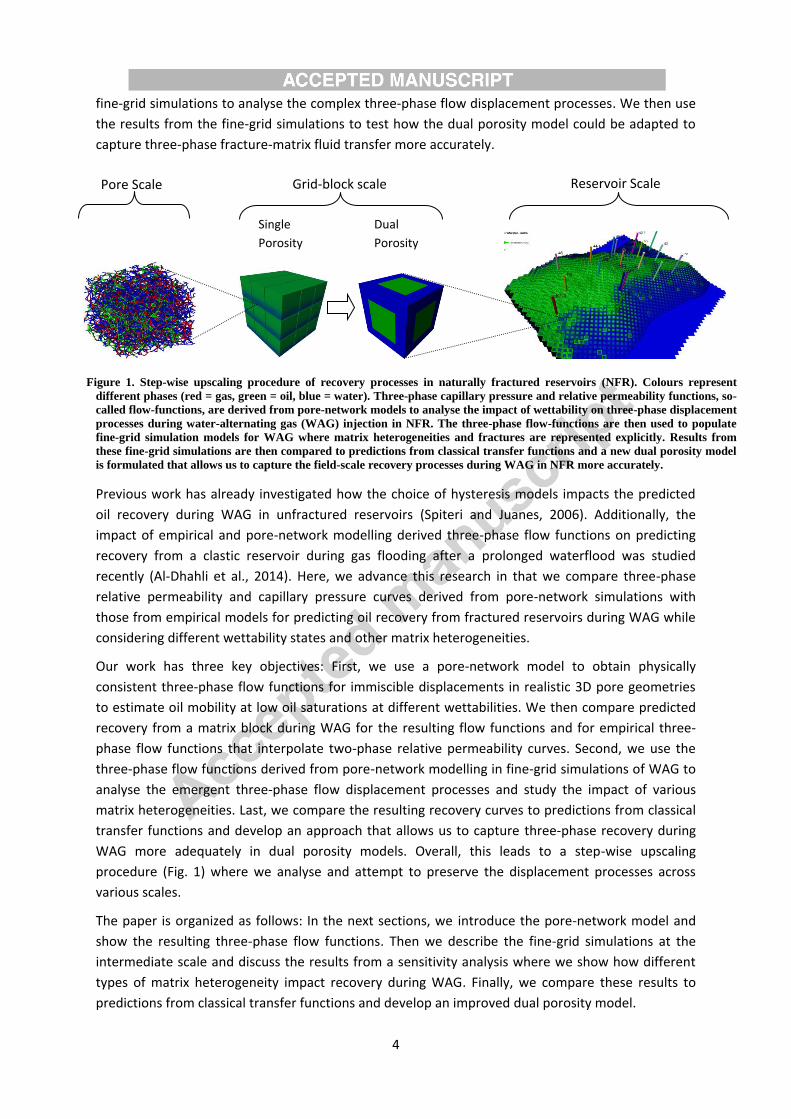
Figure 1. Step-wise upscaling procedure of recovery processes in naturally fractured reservoirs (NFR). Colours represent
different phases (red = gas, green = oil, blue = water). Three-phase capillary pressure and relative permeability functions, so-
called flow-functions, are derived from pore-network models to analyse the impact of wettability on three-phase displacement
processes during water-alternating gas (WAG) injection in NFR. The three-phase flow-functions are then used to populate
fine-grid simulation models for WAG where matrix heterogeneities and fractures are represented explicitly. Results from
these fine-grid simulations are then compared to predictions from classical transfer functions and a new dual porosity model
is formulated that allows us to capture the field-scale recovery processes during WAG in NFR more accurately.
Previous work has already investigated how the choice of hysteresis models impacts the predicted
oil recovery during WAG in unfractured reservoirs (Spiteri and Juanes, 2006). Additionally, the
impact of empirical and pore-network modelling derived three-phase flow functions on predicting
recovery from a clastic reservoir during gas flooding after a prolonged waterflood was studied
recently (Al-Dhahli et al., 2014). Here, we advance this research in that we compare three-phase
relative permeability and capillary pressure curves derived from pore-network simulations with
those from empirical models for predicting oil recovery from fractured reservoirs during WAG while
considering different wettability states and other matrix heterogeneities.
Our work has three key objectives: First, we use a pore-network model to obtain physically
consistent three-phase flow functions for immiscible displacements in realistic 3D pore geometries
to estimate oil mobility at low oil saturations at different wettabilities. We then compare predicted
recovery from a matrix block during WAG for the resulting flow functions and for empirical three-
phase flow functions that interpolate two-phase relative permeability curves. Second, we use the
three-phase flow functions derived from pore-network modelling in fine-grid simulations of WAG to
analyse the emergent three-phase flow displacement processes and study the impact of various
matrix heterogeneities. Last, we compare the resulting recovery curves to predictions from classical
transfer functions and develop an approach that allows us to capture three-phase recovery during
WAG more adequately in dual porosity models. Overall, this leads to a step-wise upscaling
procedure (Fig. 1) where we analyse and attempt to preserve the displacement processes across
various scales.
The paper is organized as follows: In the next sections, we introduce the pore-network model and
show the resulting three-phase flow functions. Then we describe the fine-grid simulations at the
intermediate scale and discuss the results from a sensitivity analysis where we show how different
types of matrix heterogeneity impact recovery during WAG. Finally, we compare these results to
predictions from classical transfer functions and develop an improved dual porosity model.
Single
Porosity
Dual
Porosity
Pore Scale Grid-block scale Reservoir Scale
5
2. Pore-scale modelling of three-phase flow functions
We use a state-of-the-art pore-network model to compute the three-phase flow functions for
immiscible displacement (Al-Dhahli et al., 2013a, 2013b). The model encompasses a number of
features that enable us to capture a wide range of pore scale physics. Firstly, the model uses pore-
network geometries from realistic 3D and multi-scale digital rocks as input. This is based on the work
of Jiang et al. (2013a; 2013b). Secondly, the model comprises an improved pore shape
characterization, which allows representation of complex pore throats and hence the computation
of more accurate capillary entry pressures and hydraulic conductivities (Ryazanov et al., 2009).
Thirdly, a novel thermodynamic criterion for oil layer formation and collapse (van Dijke and Sorbie,
2006) has been incorporated that allows for more accurate calculation of flow functions at low oil
saturations in oil-wet pore systems. Finally, the model also accounts for multiple displacement
chains occurring during three-phase flow that has been observed to cause low oil saturations during
gas injection (Sohrabi et al., 2004). The model has been benchmarked against published three-phase
relative permeability data for water-wet sandstone and oil-wet micro-model experiments (Al-Dhahli
et al., 2013a, 2013b).
The pore-network we consider in this work is extracted using a process-based reconstruction of
Berea sandstone (Øren and Bakke, 2003). It comprises 12348 nodes and 26146 bonds, resulting in
permeability of 2673 mD and porosity of 18.3%. Further details of the pore-network are discussed in
Al-Dhahli et al (2013a). We have selected the Berea sandstone because the three-phase flow
functions obtained from pore-network modelling can be readily compared to experimental data for
water-wet rocks (Oak et al., 1990; Blunt, 2000). Also, recovery processes in unfractured formations
using three-phase flow functions from Berea sandstone have been discussed in the literature (Al-
Dhali et al., 2014). However, the methods discussed here can be readily extended to more complex
pore-networks extracted from carbonate rocks, as shown in Ahmed Elfeel et al. (2013) and Al-Dhahli
et al. (2014).
Note that we only use the two- and three-phase flow functions from the pore-network model as
input for the subsequent fine-grid simulations, not the permeability or porosity as especially the
former would lead to a unrealistically high matrix permeability. We compute three-phase flow
functions at various degrees of wettability by varying the contact angles. This allows us to quickly
analyse how subtle changes in wettability impact recovery processes during three-phase flow. In this
work, we consider two wettability cases: a strongly water-wet and a strongly oil-wet rock where we
alter the contact angles after primary drainage.
For the strongly water-wet case, the oil/water contact angles are fixed (from 0 to 70°) and we
generate relative permeability and capillary pressure data as follows: The network is initially
saturated with water and oil flooding is simulated to model primary drainage. Then a series of water
flooding (imbibition) simulations are carried out until the water saturation in the network reaches
certain predefined values. Each water injection simulation is followed by a simulation of gas
flooding. This leads to a series of saturation paths for water and gas injections. Hence, the effect of
hysteresis due to a decrease in water and oil saturation during gas injection is automatically
accounted for in the three-phase flow functions. However, hysteresis is not accounted for during
subsequent water injections.
6
We carry out four two-phase displacements simulations to compute flow functions that provide the
input for empirical three-phase models. These two-phase simulations model drainage and imbibition
during water-oil flow as well as drainage and imbibition during gas-oil flow. The resulting flow
functions match the experimental results of Oak et al. (1990) well, as discussed in Al-Dhahli et al.
(2013a). The two-phase flow functions are a special case of three-phase flow functions and can be
readily computed from the three-phase pore-network model. We use the resulting two-phase flow
functions to initialise three different empirical models: Stone I and II (Stone 1970, 1973) and the
saturation weighted interpolation (SWI) method of Baker (1988). Hysteresis was implemented in the
empirical models using Carlson’s method for the two-phase flow functions (Carlson, 1981).
For the strongly oil-wet case, three-phase flow functions were computed following the same
flooding sequence as above, but the oil-water contact angles are changed after the primary drainage
to values ranging from 140 to 160°. This mimics ageing of the reservoir rock. Three-phase flow
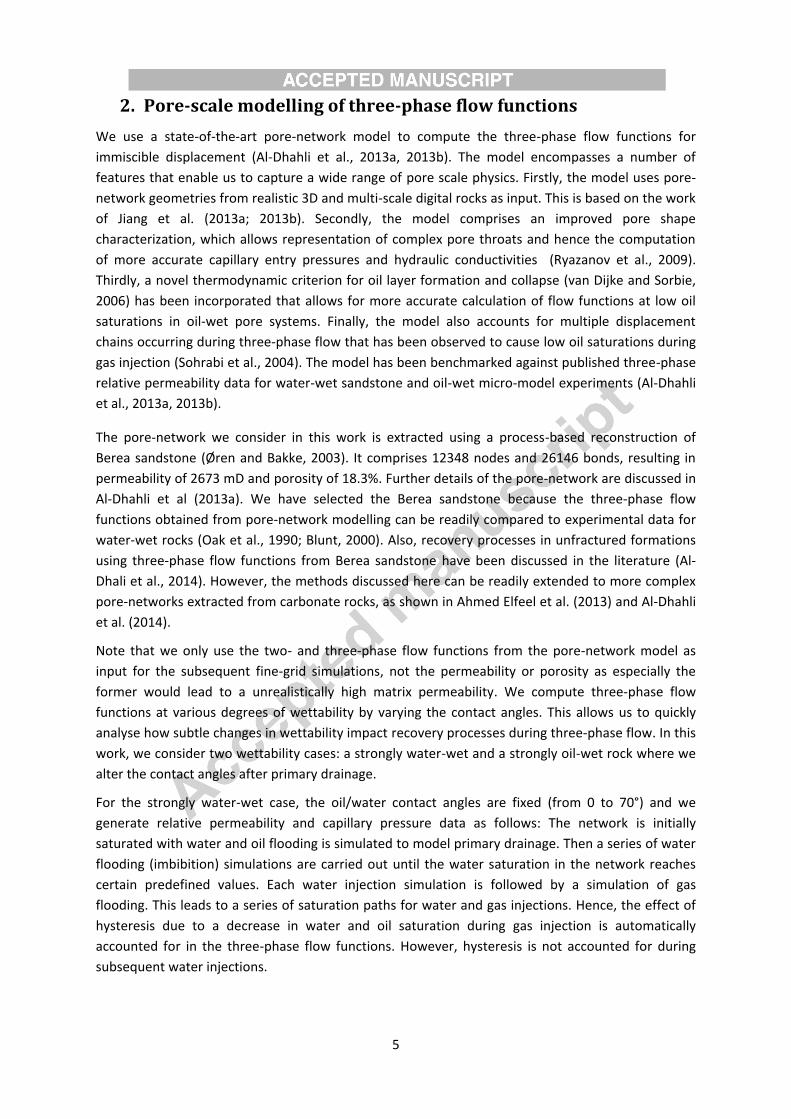
functions are represented by two-dimensional tables where relative permeability and capillary
pressure of a given phase (e.g. oil) are functions of the other two saturations (e.g. water and gas)
(Figs. 2 and 3 and Appendix A). The resulting relative permeability and capillary pressure data are
smoothed to ensure monotonicity and enhance numerical convergence in the subsequent fine-grid
reservoir simulations.
Figure 2. Three-phase relative permeability functions for water-wet (top) and oil-wet (bottom) Berea sandstone for
the oil (kro), water (krw) and gas (krg) phases, respectively. Note the different colour scale for the water relative
permeability. Coloured surfaces are fitted to pore-network modelling results (represented by the red dots) and have
been smoothed to generate input tables for reservoir simulation
kro
krw
krg
kro krw krg
7
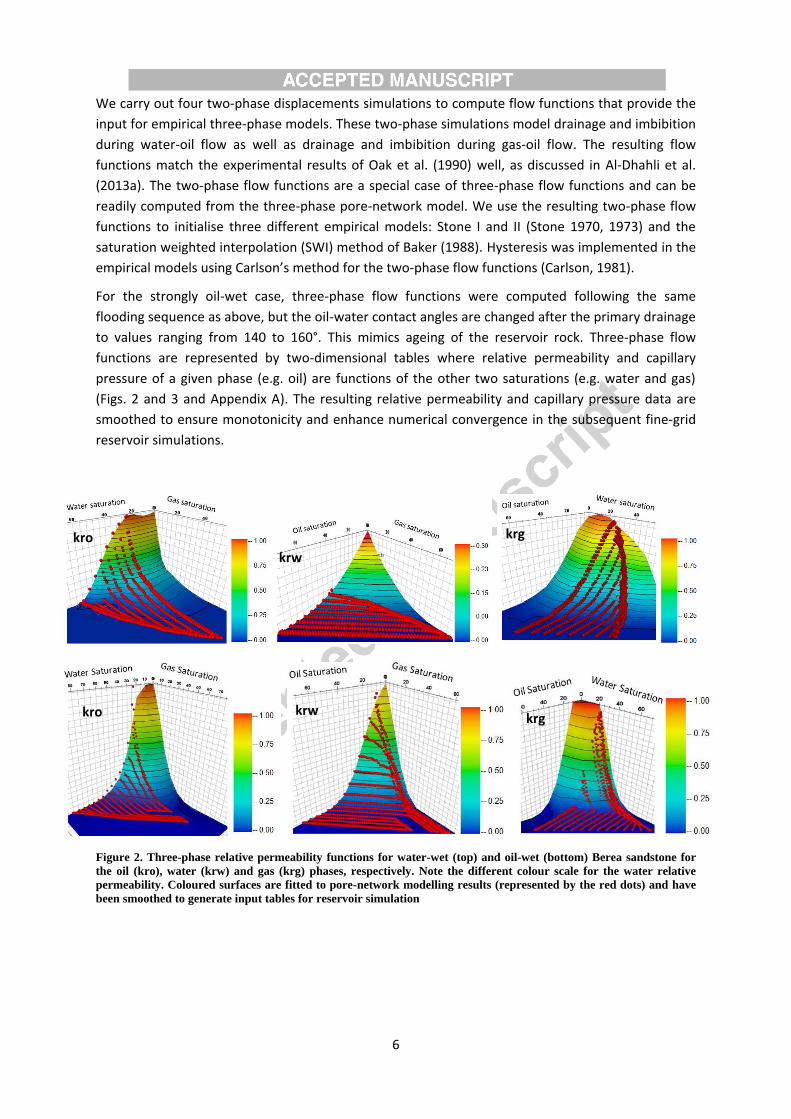
Figure 3. Three-phase capillary pressure functions for water-wet (top) and oil-wet (bottom) Berea sandstone for
water-oil (Pcw) and gas-oil (Pcg). The capillary pressure values are in psi. The coloured surfaces are fitted to pore-
network modelling results (represented by the red dots) and have been smoothed to generate input tables for
reservoir simulation.
3. Fine-grid simulations A fine-grid simulation model comprising 64,000 cells was constructed at the approximate scale of a
single reservoir simulation grid block. The fine-grid simulation model enables us to investigate how
the three-phase flow functions generated above impact fracture-matrix transfer. For simplicity, the
size of the grid block is uniform at 50x50x50 ft (15x15x15 m) with 27 (3x3x3) matrix blocks of
12x12x12 ft each. This resembles the classical, but highly idealized, sugar cube array of Warren and
Root’s (1963) original dual porosity model (Fig. 4). The aim of this grid-block scale model is to
incorporate the pore scale three-phase displacement processes, in the form of relative permeability
and capillary pressure tables, at the continuum scale where fractures and matrix are present. We
tested the effect of numerical dispersion by running simulations on a grid that was refined by a
factor three but only observed negligible differences in the resulting recovery curves.
To simulate oil recovery from the matrix by water and gas injection, the fractures are initially filled
with water. The initial saturations are the same in all models. For subsequent WAG cycles, the
saturations of all three phases in the matrix are taken from the previous WAG cycle. However, the
fracture saturation is changed instantly from water to gas and back to water during each WAG cycle.
Matrix blocks were assigned two- and three-phase flow functions discussed in the previous section.
The fractures were represented as high permeability features (1000 mD) in which we use linear
relative permeability curves and assume zero capillary pressure. Further rock and fluid properties
are summarized in Table 1. We note that the WAG cycle length in all simulations is two years to
allow water and/or gas fronts to advance deep into the matrix blocks. We use the commercial
reservoir simulator ECLIPSE in this analysis (Schlumberger, 2012).
Pcw
Pcw
Pcg
Pcg
8
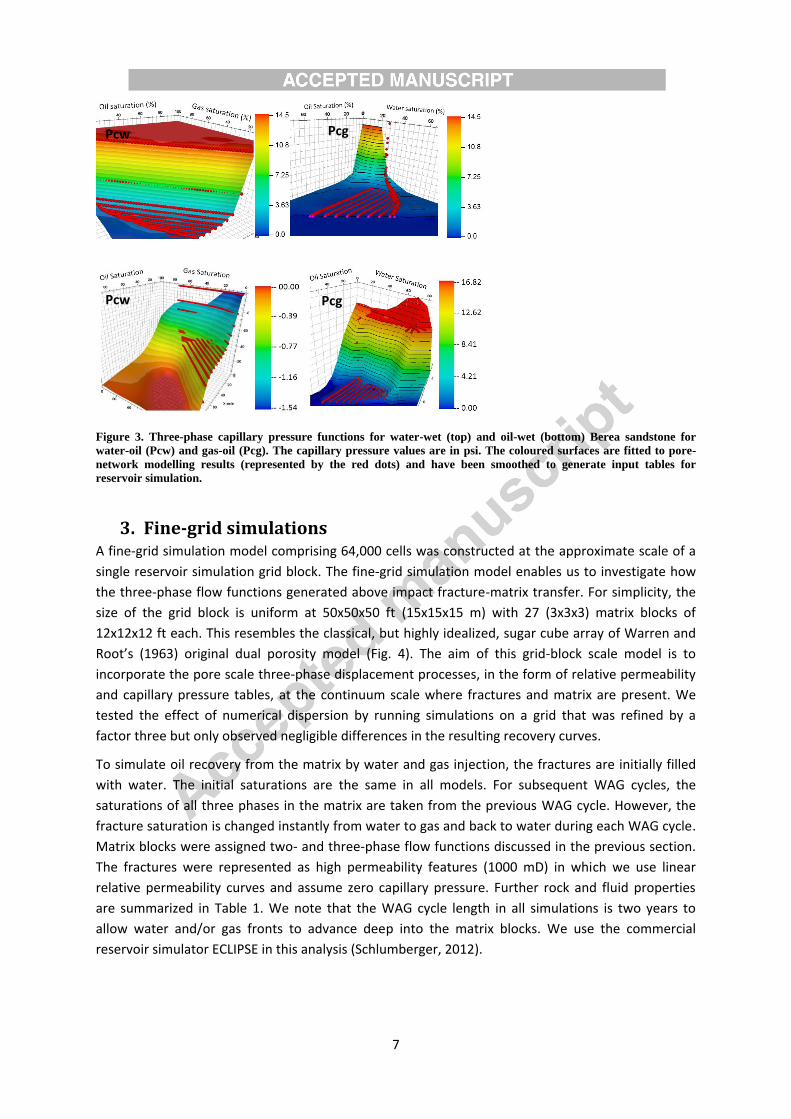
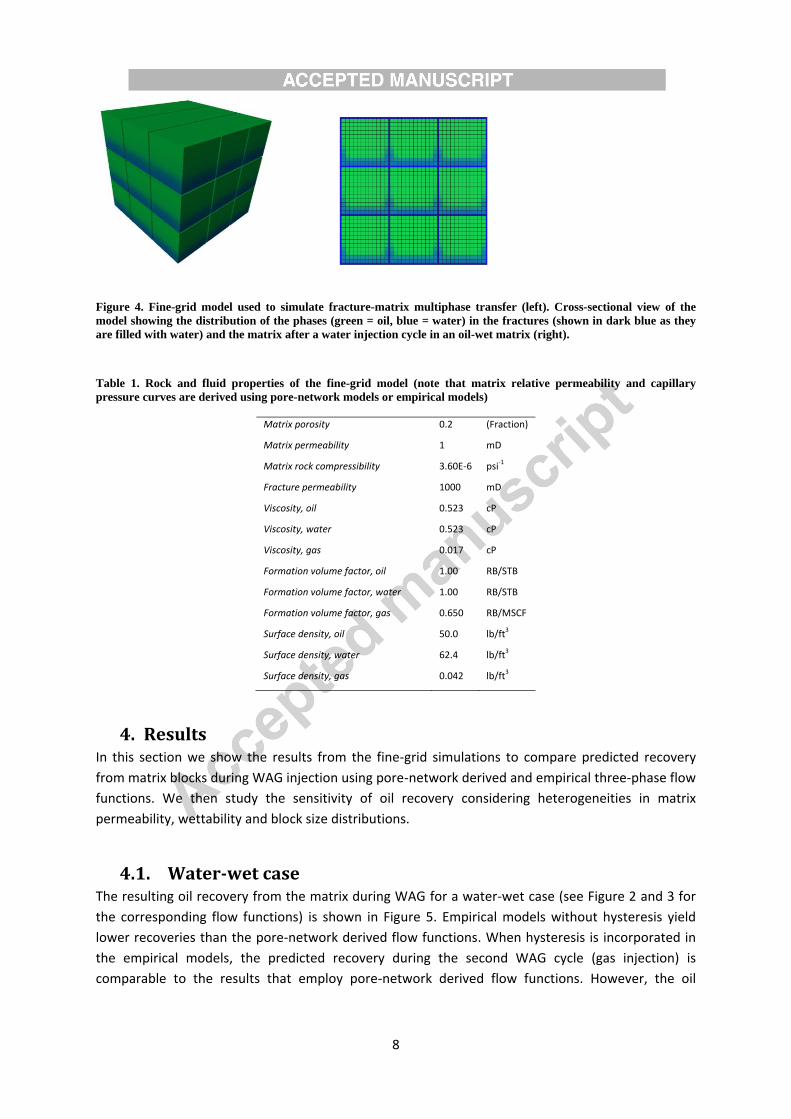
Figure 4. Fine-grid model used to simulate fracture-matrix multiphase transfer (left). Cross-sectional view of the
model showing the distribution of the phases (green = oil, blue = water) in the fractures (shown in dark blue as they
are filled with water) and the matrix after a water injection cycle in an oil-wet matrix (right).
Table 1. Rock and fluid properties of the fine-grid model (note that matrix relative permeability and capillary
pressure curves are derived using pore-network models or empirical models)
Matrix porosity 0.2 (Fraction)
Matrix permeability 1 mD
Matrix rock compressibility 3.60E-6 psi-1
Fracture permeability 1000 mD
Viscosity, oil 0.523 cP
Viscosity, water 0.523 cP
Viscosity, gas 0.017 cP
Formation volume factor, oil 1.00 RB/STB
Formation volume factor, water 1.00 RB/STB
Formation volume factor, gas 0.650 RB/MSCF
Surface density, oil 50.0 lb/ft3
Surface density, water 62.4 lb/ft3
Surface density, gas 0.042 lb/ft3
4. Results In this section we show the results from the fine-grid simulations to compare predicted recovery
from matrix blocks during WAG injection using pore-network derived and empirical three-phase flow
functions. We then study the sensitivity of oil recovery considering heterogeneities in matrix
permeability, wettability and block size distributions.
4.1. Water-wet case The resulting oil recovery from the matrix during WAG for a water-wet case (see Figure 2 and 3 for
the corresponding flow functions) is shown in Figure 5. Empirical models without hysteresis yield
lower recoveries than the pore-network derived flow functions. When hysteresis is incorporated in
the empirical models, the predicted recovery during the second WAG cycle (gas injection) is
comparable to the results that employ pore-network derived flow functions. However, the oil
9
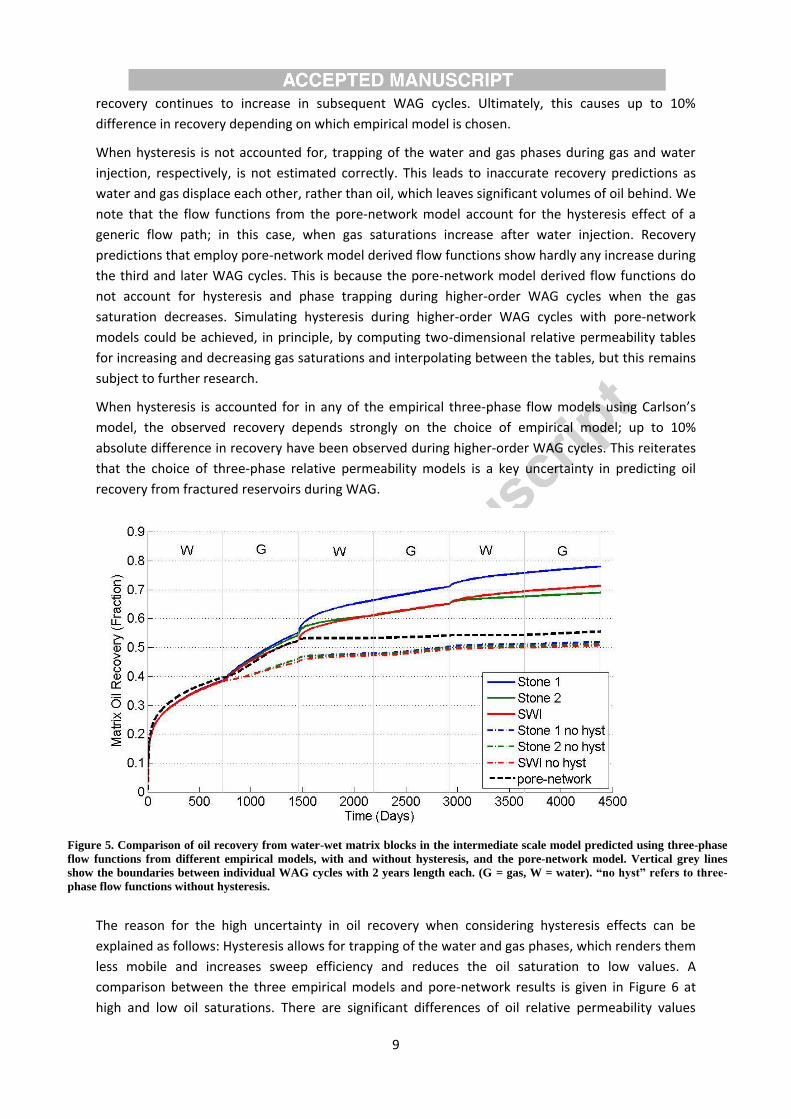
recovery continues to increase in subsequent WAG cycles. Ultimately, this causes up to 10%
difference in recovery depending on which empirical model is chosen.
When hysteresis is not accounted for, trapping of the water and gas phases during gas and water
injection, respectively, is not estimated correctly. This leads to inaccurate recovery predictions as
water and gas displace each other, rather than oil, which leaves significant volumes of oil behind. We
note that the flow functions from the pore-network model account for the hysteresis effect of a
generic flow path; in this case, when gas saturations increase after water injection. Recovery
predictions that employ pore-network model derived flow functions show hardly any increase during
the third and later WAG cycles. This is because the pore-network model derived flow functions do
not account for hysteresis and phase trapping during higher-order WAG cycles when the gas
saturation decreases. Simulating hysteresis during higher-order WAG cycles with pore-network
models could be achieved, in principle, by computing two-dimensional relative permeability tables
for increasing and decreasing gas saturations and interpolating between the tables, but this remains
subject to further research.
When hysteresis is accounted for in any of the empirical three-phase flow models using Carlson’s
model, the observed recovery depends strongly on the choice of empirical model; up to 10%
absolute difference in recovery have been observed during higher-order WAG cycles. This reiterates
that the choice of three-phase relative permeability models is a key uncertainty in predicting oil
recovery from fractured reservoirs during WAG.
Figure 5. Comparison of oil recovery from water-wet matrix blocks in the intermediate scale model predicted using three-phase
flow functions from different empirical models, with and without hysteresis, and the pore-network model. Vertical grey lines
show the boundaries between individual WAG cycles with 2 years length each. (G = gas, W = water). “no hyst” refers to three-
phase flow functions without hysteresis.
The reason for the high uncertainty in oil recovery when considering hysteresis effects can be
explained as follows: Hysteresis allows for trapping of the water and gas phases, which renders them
less mobile and increases sweep efficiency and reduces the oil saturation to low values. A
comparison between the three empirical models and pore-network results is given in Figure 6 at
high and low oil saturations. There are significant differences of oil relative permeability values
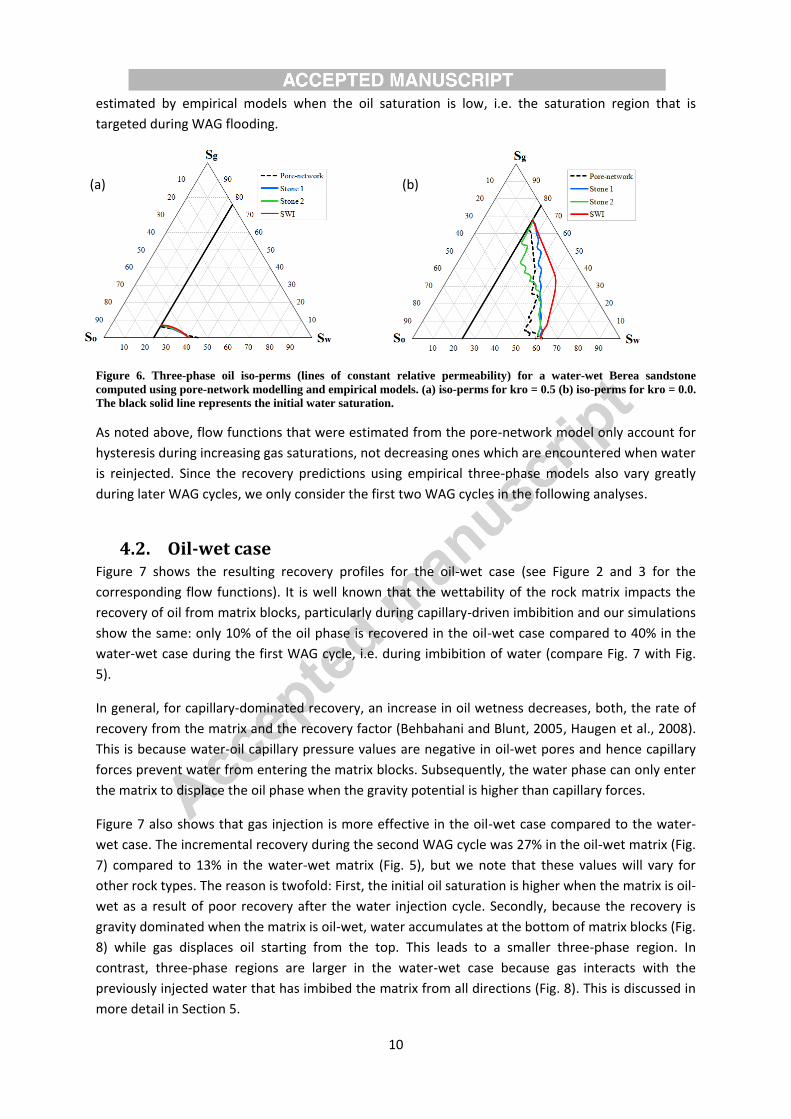
10
estimated by empirical models when the oil saturation is low, i.e. the saturation region that is
targeted during WAG flooding.
Figure 6. Three-phase oil iso-perms (lines of constant relative permeability) for a water-wet Berea sandstone
computed using pore-network modelling and empirical models. (a) iso-perms for kro = 0.5 (b) iso-perms for kro = 0.0.
The black solid line represents the initial water saturation.
As noted above, flow functions that were estimated from the pore-network model only account for
hysteresis during increasing gas saturations, not decreasing ones which are encountered when water
is reinjected. Since the recovery predictions using empirical three-phase models also vary greatly
during later WAG cycles, we only consider the first two WAG cycles in the following analyses.
4.2. Oil-wet case Figure 7 shows the resulting recovery profiles for the oil-wet case (see Figure 2 and 3 for the
corresponding flow functions). It is well known that the wettability of the rock matrix impacts the
recovery of oil from matrix blocks, particularly during capillary-driven imbibition and our simulations
show the same: only 10% of the oil phase is recovered in the oil-wet case compared to 40% in the
water-wet case during the first WAG cycle, i.e. during imbibition of water (compare Fig. 7 with Fig.
5).
In general, for capillary-dominated recovery, an increase in oil wetness decreases, both, the rate of
recovery from the matrix and the recovery factor (Behbahani and Blunt, 2005, Haugen et al., 2008).
This is because water-oil capillary pressure values are negative in oil-wet pores and hence capillary
forces prevent water from entering the matrix blocks. Subsequently, the water phase can only enter
the matrix to displace the oil phase when the gravity potential is higher than capillary forces.
Figure 7 also shows that gas injection is more effective in the oil-wet case compared to the water-
wet case. The incremental recovery during the second WAG cycle was 27% in the oil-wet matrix (Fig.
7) compared to 13% in the water-wet matrix (Fig. 5), but we note that these values will vary for
other rock types. The reason is twofold: First, the initial oil saturation is higher when the matrix is oil-
wet as a result of poor recovery after the water injection cycle. Secondly, because the recovery is
gravity dominated when the matrix is oil-wet, water accumulates at the bottom of matrix blocks (Fig.
8) while gas displaces oil starting from the top. This leads to a smaller three-phase region. In
contrast, three-phase regions are larger in the water-wet case because gas interacts with the
previously injected water that has imbibed the matrix from all directions (Fig. 8). This is discussed in
more detail in Section 5.
(a) (b)
11
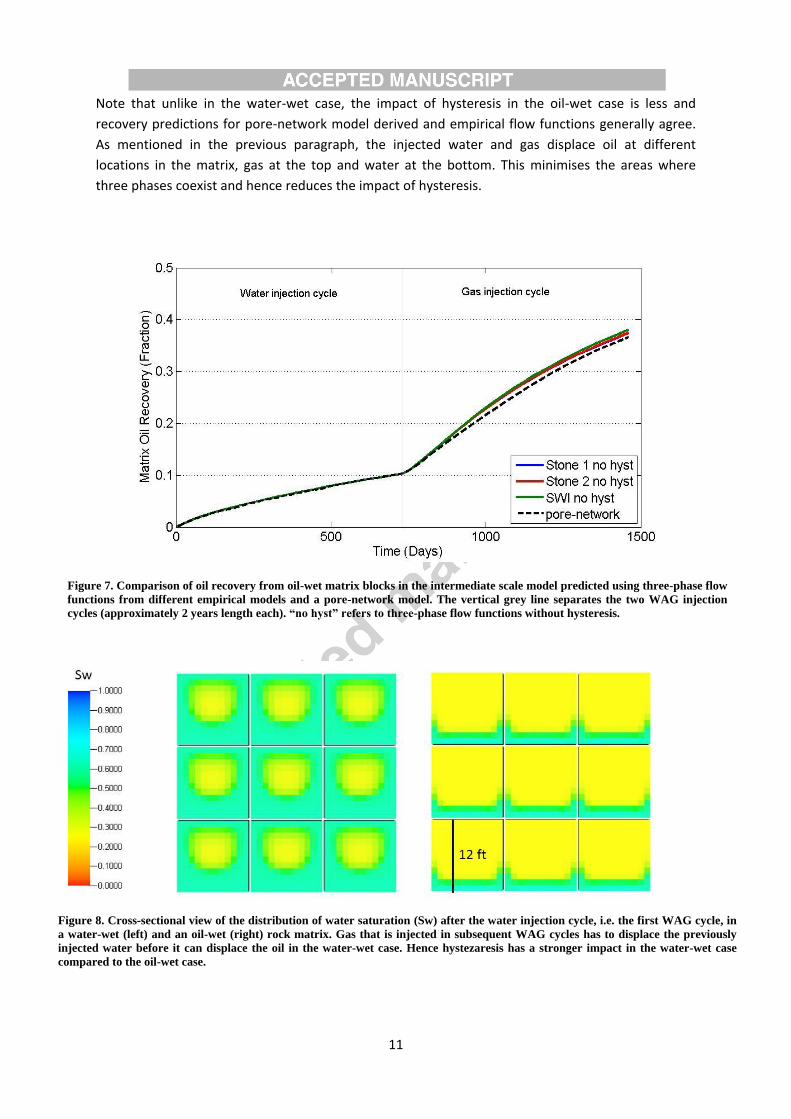
Note that unlike in the water-wet case, the impact of hysteresis in the oil-wet case is less and
recovery predictions for pore-network model derived and empirical flow functions generally agree.
As mentioned in the previous paragraph, the injected water and gas displace oil at different
locations in the matrix, gas at the top and water at the bottom. This minimises the areas where
three phases coexist and hence reduces the impact of hysteresis.
Figure 7. Comparison of oil recovery from oil-wet matrix blocks in the intermediate scale model predicted using three-phase flow
functions from different empirical models and a pore-network model. The vertical grey line separates the two WAG injection
cycles (approximately 2 years length each). “no hyst” refers to three-phase flow functions without hysteresis.
Figure 8. Cross-sectional view of the distribution of water saturation (Sw) after the water injection cycle, i.e. the first WAG cycle, in
a water-wet (left) and an oil-wet (right) rock matrix. Gas that is injected in subsequent WAG cycles has to displace the previously
injected water before it can displace the oil in the water-wet case. Hence hystezaresis has a stronger impact in the water-wet case
compared to the oil-wet case.
12
4.3. Effect of variations in matrix block size
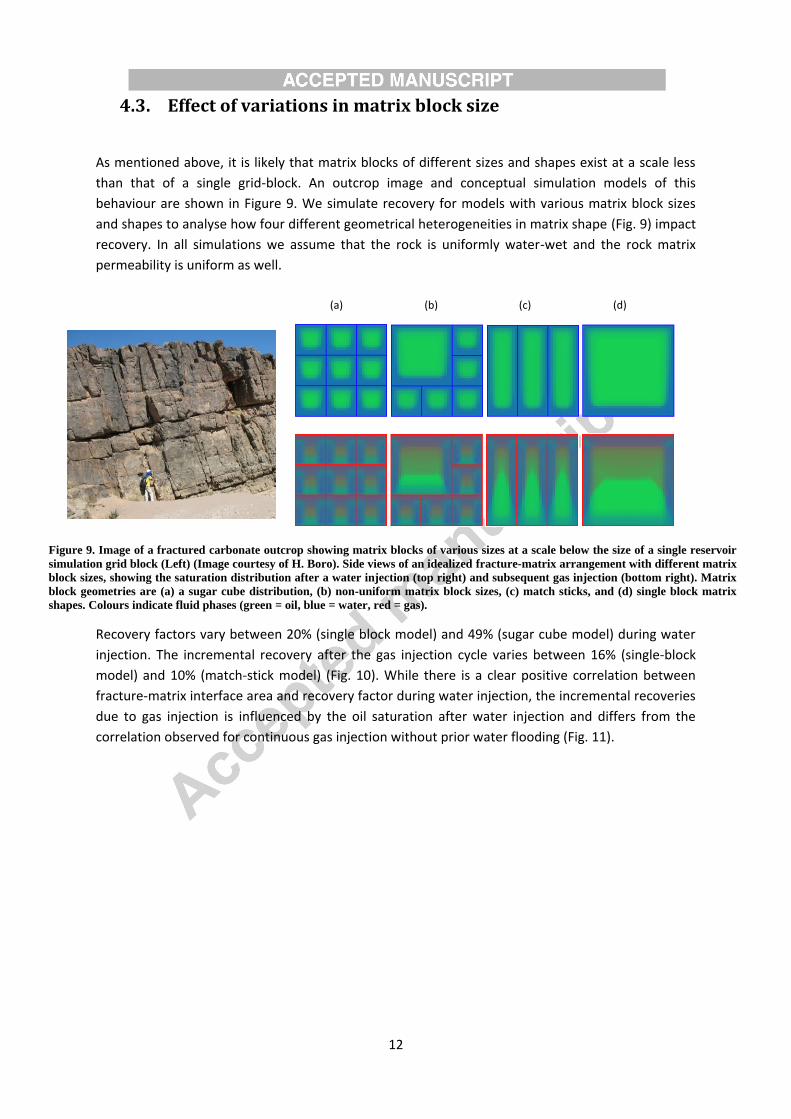
As mentioned above, it is likely that matrix blocks of different sizes and shapes exist at a scale less
than that of a single grid-block. An outcrop image and conceptual simulation models of this
behaviour are shown in Figure 9. We simulate recovery for models with various matrix block sizes
and shapes to analyse how four different geometrical heterogeneities in matrix shape (Fig. 9) impact
recovery. In all simulations we assume that the rock is uniformly water-wet and the rock matrix
permeability is uniform as well.
Figure 9. Image of a fractured carbonate outcrop showing matrix blocks of various sizes at a scale below the size of a single reservoir
simulation grid block (Left) (Image courtesy of H. Boro). Side views of an idealized fracture-matrix arrangement with different matrix
block sizes, showing the saturation distribution after a water injection (top right) and subsequent gas injection (bottom right). Matrix
block geometries are (a) a sugar cube distribution, (b) non-uniform matrix block sizes, (c) match sticks, and (d) single block matrix
shapes. Colours indicate fluid phases (green = oil, blue = water, red = gas).
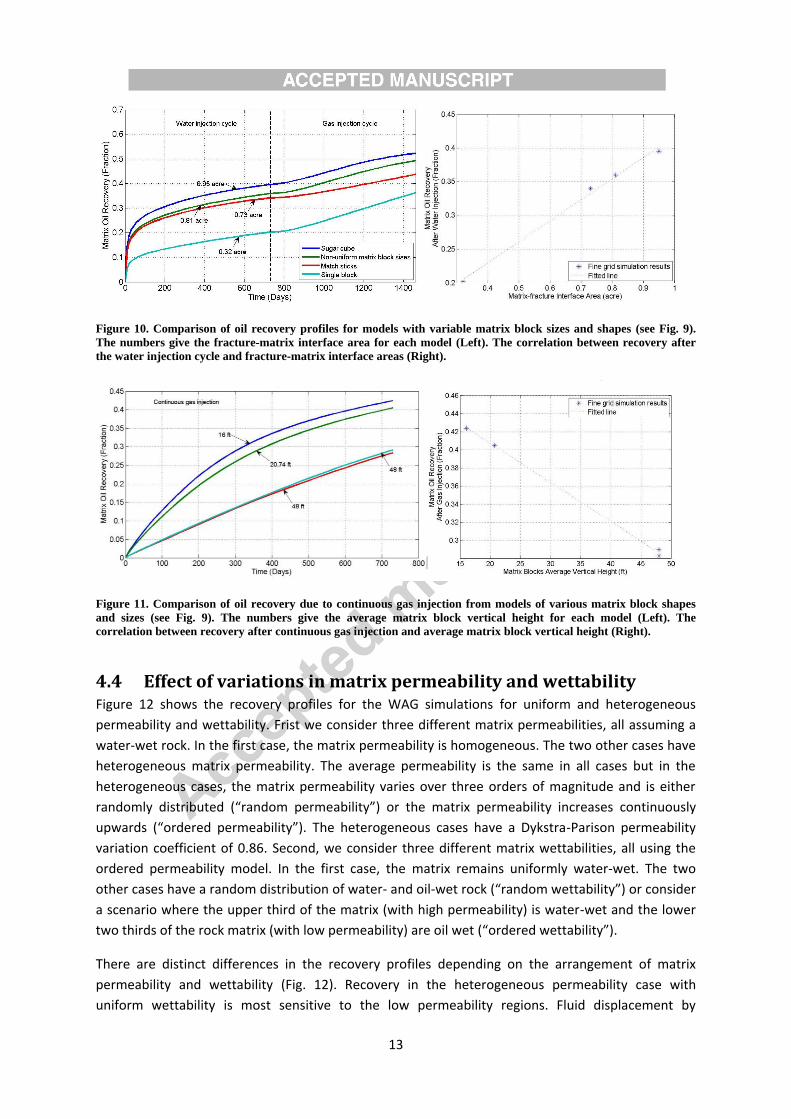
Recovery factors vary between 20% (single block model) and 49% (sugar cube model) during water
injection. The incremental recovery after the gas injection cycle varies between 16% (single-block
model) and 10% (match-stick model) (Fig. 10). While there is a clear positive correlation between
fracture-matrix interface area and recovery factor during water injection, the incremental recoveries
due to gas injection is influenced by the oil saturation after water injection and differs from the
correlation observed for continuous gas injection without prior water flooding (Fig. 11).
(a) (b) (c) (d)
13
Figure 10. Comparison of oil recovery profiles for models with variable matrix block sizes and shapes (see Fig. 9).
The numbers give the fracture-matrix interface area for each model (Left). The correlation between recovery after
the water injection cycle and fracture-matrix interface areas (Right).
Figure 11. Comparison of oil recovery due to continuous gas injection from models of various matrix block shapes
and sizes (see Fig. 9). The numbers give the average matrix block vertical height for each model (Left). The
correlation between recovery after continuous gas injection and average matrix block vertical height (Right).
4.4 Effect of variations in matrix permeability and wettability Figure 12 shows the recovery profiles for the WAG simulations for uniform and heterogeneous
permeability and wettability. Frist we consider three different matrix permeabilities, all assuming a
water-wet rock. In the first case, the matrix permeability is homogeneous. The two other cases have
heterogeneous matrix permeability. The average permeability is the same in all cases but in the
heterogeneous cases, the matrix permeability varies over three orders of magnitude and is either
randomly distributed (“random permeability”) or the matrix permeability increases continuously
upwards (“ordered permeability”). The heterogeneous cases have a Dykstra-Parison permeability
variation coefficient of 0.86. Second, we consider three different matrix wettabilities, all using the
ordered permeability model. In the first case, the matrix remains uniformly water-wet. The two
other cases have a random distribution of water- and oil-wet rock (“random wettability”) or consider
a scenario where the upper third of the matrix (with high permeability) is water-wet and the lower
two thirds of the rock matrix (with low permeability) are oil wet (“ordered wettability”).
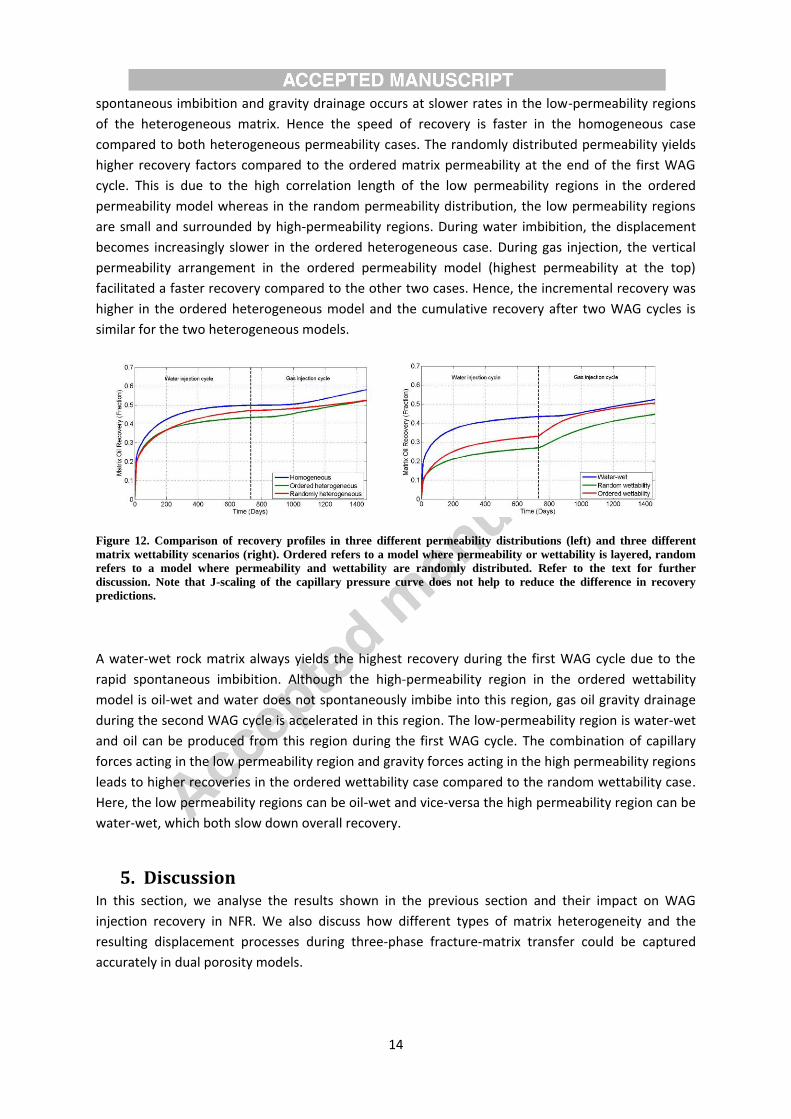
There are distinct differences in the recovery profiles depending on the arrangement of matrix
permeability and wettability (Fig. 12). Recovery in the heterogeneous permeability case with
uniform wettability is most sensitive to the low permeability regions. Fluid displacement by
14
spontaneous imbibition and gravity drainage occurs at slower rates in the low-permeability regions
of the heterogeneous matrix. Hence the speed of recovery is faster in the homogeneous case
compared to both heterogeneous permeability cases. The randomly distributed permeability yields
higher recovery factors compared to the ordered matrix permeability at the end of the first WAG
cycle. This is due to the high correlation length of the low permeability regions in the ordered
permeability model whereas in the random permeability distribution, the low permeability regions
are small and surrounded by high-permeability regions. During water imbibition, the displacement
becomes increasingly slower in the ordered heterogeneous case. During gas injection, the vertical
permeability arrangement in the ordered permeability model (highest permeability at the top)
facilitated a faster recovery compared to the other two cases. Hence, the incremental recovery was
higher in the ordered heterogeneous model and the cumulative recovery after two WAG cycles is
similar for the two heterogeneous models.
Figure 12. Comparison of recovery profiles in three different permeability distributions (left) and three different
matrix wettability scenarios (right). Ordered refers to a model where permeability or wettability is layered, random
refers to a model where permeability and wettability are randomly distributed. Refer to the text for further
discussion. Note that J-scaling of the capillary pressure curve does not help to reduce the difference in recovery
predictions.
A water-wet rock matrix always yields the highest recovery during the first WAG cycle due to the
rapid spontaneous imbibition. Although the high-permeability region in the ordered wettability
model is oil-wet and water does not spontaneously imbibe into this region, gas oil gravity drainage
during the second WAG cycle is accelerated in this region. The low-permeability region is water-wet
and oil can be produced from this region during the first WAG cycle. The combination of capillary
forces acting in the low permeability region and gravity forces acting in the high permeability regions
leads to higher recoveries in the ordered wettability case compared to the random wettability case.
Here, the low permeability regions can be oil-wet and vice-versa the high permeability region can be
water-wet, which both slow down overall recovery.
5. Discussion In this section, we analyse the results shown in the previous section and their impact on WAG
injection recovery in NFR. We also discuss how different types of matrix heterogeneity and the
resulting displacement processes during three-phase fracture-matrix transfer could be captured
accurately in dual porosity models.
15
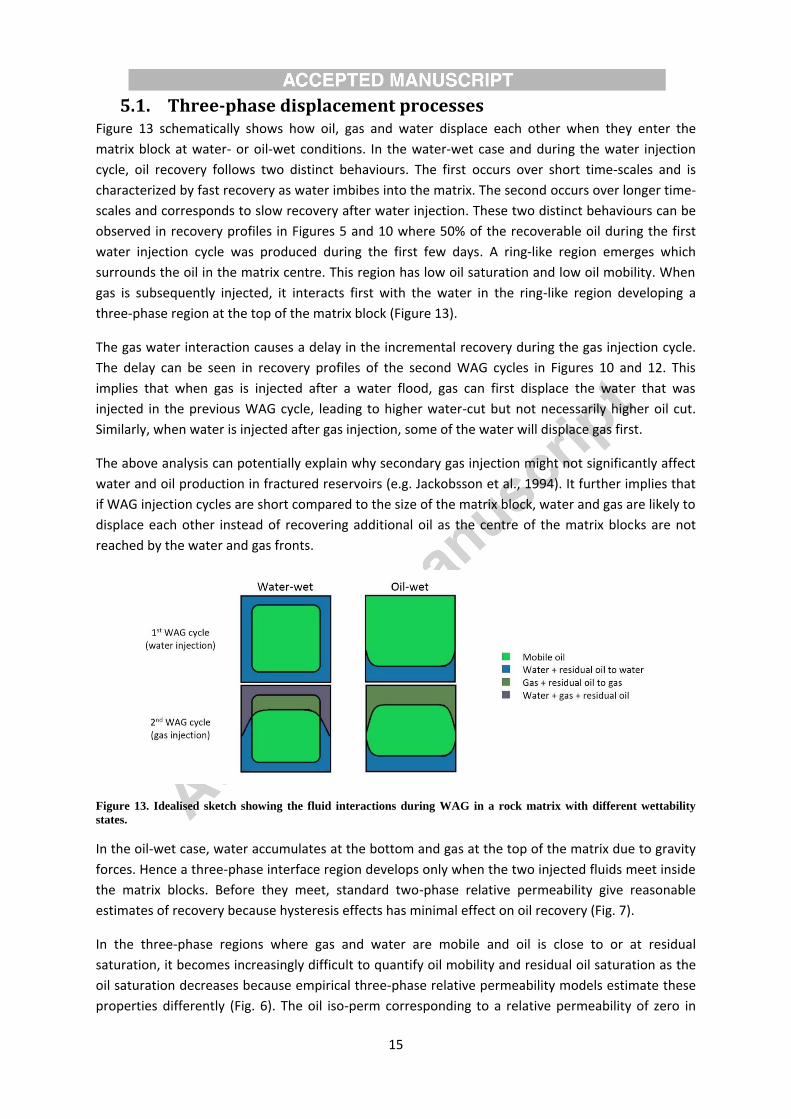
5.1. Three-phase displacement processes Figure 13 schematically shows how oil, gas and water displace each other when they enter the
matrix block at water- or oil-wet conditions. In the water-wet case and during the water injection
cycle, oil recovery follows two distinct behaviours. The first occurs over short time-scales and is
characterized by fast recovery as water imbibes into the matrix. The second occurs over longer time-
scales and corresponds to slow recovery after water injection. These two distinct behaviours can be
observed in recovery profiles in Figures 5 and 10 where 50% of the recoverable oil during the first
water injection cycle was produced during the first few days. A ring-like region emerges which
surrounds the oil in the matrix centre. This region has low oil saturation and low oil mobility. When
gas is subsequently injected, it interacts first with the water in the ring-like region developing a
three-phase region at the top of the matrix block (Figure 13).
The gas water interaction causes a delay in the incremental recovery during the gas injection cycle.
The delay can be seen in recovery profiles of the second WAG cycles in Figures 10 and 12. This
implies that when gas is injected after a water flood, gas can first displace the water that was
injected in the previous WAG cycle, leading to higher water-cut but not necessarily higher oil cut.
Similarly, when water is injected after gas injection, some of the water will displace gas first.
The above analysis can potentially explain why secondary gas injection might not significantly affect
water and oil production in fractured reservoirs (e.g. Jackobsson et al., 1994). It further implies that
if WAG injection cycles are short compared to the size of the matrix block, water and gas are likely to
displace each other instead of recovering additional oil as the centre of the matrix blocks are not
reached by the water and gas fronts.
Figure 13. Idealised sketch showing the fluid interactions during WAG in a rock matrix with different wettability
states.
In the oil-wet case, water accumulates at the bottom and gas at the top of the matrix due to gravity
forces. Hence a three-phase interface region develops only when the two injected fluids meet inside
the matrix blocks. Before they meet, standard two-phase relative permeability give reasonable
estimates of recovery because hysteresis effects has minimal effect on oil recovery (Fig. 7).
In the three-phase regions where gas and water are mobile and oil is close to or at residual
saturation, it becomes increasingly difficult to quantify oil mobility and residual oil saturation as the
oil saturation decreases because empirical three-phase relative permeability models estimate these
properties differently (Fig. 6). The oil iso-perm corresponding to a relative permeability of zero in
16
Figure 6.b is of particular importance in this context because it defines the residual oil saturation,
which varies significantly based on the selected three-phase relative permeability model. Of the
three empirical relative permeability models considered in this work, only the Stone 1 model can be
modified so that its three-phase residual oil saturation matches that computed using pore-network
modelling. We reiterate that pore-network derived relative permeabilities at low oil saturations are
physically consistent and agree well with experimental measurements (Al-Dhahli et al., 2013a;
2013b). Therefore, the choice of empirical three-phase relative permeability model impacts the
estimation of three-phase residual oil saturation values, which impacts fracture-matrix fluid
exchange and ultimately affects the field-scale forecasting of oil production.
5.2. Upscaling to dual porosity models The detailed fine-grid simulations shown in the previous sections are not possible at the field scale.
Hence recovery processes in NFR are typically upscaled using appropriate transfer functions in dual
porosity and dual permeability models (e.g. Kazemi et al., 1976; Thomas et al., 1983; Ramirez et al.,
2009; Al-Kobaisi, 2009). The transfer function employs parameters that can grouped into three
categories, (1) fluid properties, (2) three-phase flow functions, and (3) shape factors. While the fluid
properties are normally well known, the choice of three-phase flow function will have a great impact
on recovery, as discussed above.
The shape factors are the imbibition shape factor ( ), gravity drainage shape factor ( ) and the
matrix vertical block height ( ). They impact the ratio of capillary to gravity forces during the
individual WAG cycles. A frequent assumption is that imbibition and gravity drainage shape factors
are the same. However, this assumption can lead to inaccurate results during WAG injection in NFR
because gravitational and capillary forces interact differently with each other depending on the size
and shape of the matrix blocks. For example the match sticks and single block cases in Figures 10 and
11 have similar recovery results during gas injection but very different recovery results during water
injection.
Saturation profiles in the matrix blocks that were obtained from the fine-grid simulations show that
there is a significant period of transient flow during water injection that is not captured by a classical
dual porosity model that assumes a steady-state exchange of fluids between fracture and matrix
(Fig. 14). This leads to significant differences in the predicted recoveries at early and late time
Zimmermann et al., 1995). It is possible to capture this transient behaviour in a dual porosity model
by adjusting the shape factors so that the dual porosity model matches the fine-grid simulation
results (Ueda et al., 1989; Thomas et al., 1983). However, a change in shape factor only increases or
decreases the rate of recovery, but does not change the shape of the recovery curve (Abushiaka and
Gosselin, 2008). Hence the match between the fine-grid simulations and dual porosity model
predictions remains poor (Fig.15). Additionally, shape factors values should reflect matrix block sizes
which are very well defined in the fine-grid model. As shown in Ahmed Elfeel et al. (2013), the dual
porosity model overpredicts recovery during three-phase flow for both, structurally simple pore-
networks such as those corresponding to a Berea sandstone and more complex pore-networks
corresponding to carbonate rocks. The general features during WAG injection were observed to be
similar for the sandstone and carbonate samples in that wettability affects recovery profiles and the
mutual displacement of gas and water leaves the oil phase largely untouched.
17
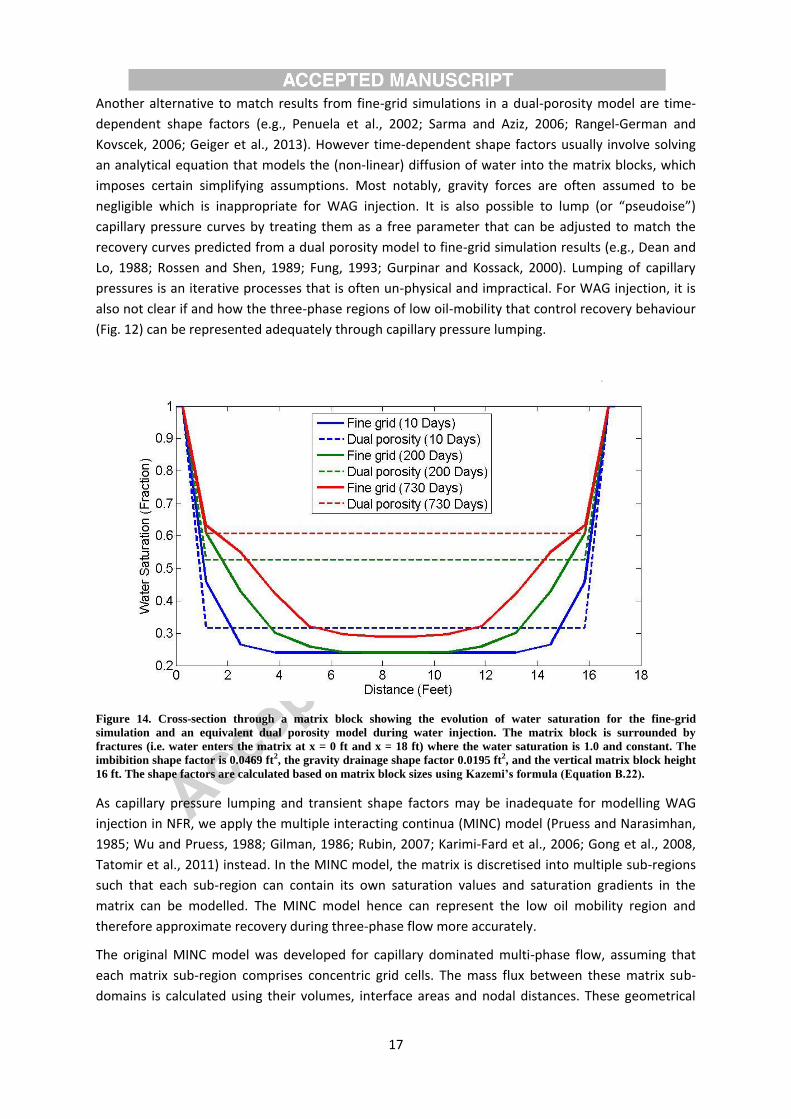
Another alternative to match results from fine-grid simulations in a dual-porosity model are time-
dependent shape factors (e.g., Penuela et al., 2002; Sarma and Aziz, 2006; Rangel-German and
Kovscek, 2006; Geiger et al., 2013). However time-dependent shape factors usually involve solving
an analytical equation that models the (non-linear) diffusion of water into the matrix blocks, which
imposes certain simplifying assumptions. Most notably, gravity forces are often assumed to be
negligible which is inappropriate for WAG injection. It is also possible to lump (or “pseudoise”)
capillary pressure curves by treating them as a free parameter that can be adjusted to match the
recovery curves predicted from a dual porosity model to fine-grid simulation results (e.g., Dean and
Lo, 1988; Rossen and Shen, 1989; Fung, 1993; Gurpinar and Kossack, 2000). Lumping of capillary
pressures is an iterative processes that is often un-physical and impractical. For WAG injection, it is
also not clear if and how the three-phase regions of low oil-mobility that control recovery behaviour
(Fig. 12) can be represented adequately through capillary pressure lumping.
Figure 14. Cross-section through a matrix block showing the evolution of water saturation for the fine-grid
simulation and an equivalent dual porosity model during water injection. The matrix block is surrounded by
fractures (i.e. water enters the matrix at x = 0 ft and x = 18 ft) where the water saturation is 1.0 and constant. The
imbibition shape factor is 0.0469 ft2, the gravity drainage shape factor 0.0195 ft
2, and the vertical matrix block height
16 ft. The shape factors are calculated based on matrix block sizes using Kazemi’s formula (Equation B.22).
As capillary pressure lumping and transient shape factors may be inadequate for modelling WAG
injection in NFR, we apply the multiple interacting continua (MINC) model (Pruess and Narasimhan,
1985; Wu and Pruess, 1988; Gilman, 1986; Rubin, 2007; Karimi-Fard et al., 2006; Gong et al., 2008,
Tatomir et al., 2011) instead. In the MINC model, the matrix is discretised into multiple sub-regions
such that each sub-region can contain its own saturation values and saturation gradients in the
matrix can be modelled. The MINC model hence can represent the low oil mobility region and
therefore approximate recovery during three-phase flow more accurately.
The original MINC model was developed for capillary dominated multi-phase flow, assuming that
each matrix sub-region comprises concentric grid cells. The mass flux between these matrix sub-
domains is calculated using their volumes, interface areas and nodal distances. These geometrical
18
parameters are computed once for a given matrix block size. Changes in matrix block sizes, e.g. as
part of reservoir history matching, can be implemented by changing matrix permeability (Wu and
Pruess, 1988). For gravity-dominated displacement, the MINC model can be recast such that the
matrix sub-regions comprise horizontal layers that preserve vertical gradients in saturation (e.g.,
Gilman, 1986; Fung, 1993; Rubin, 2007).
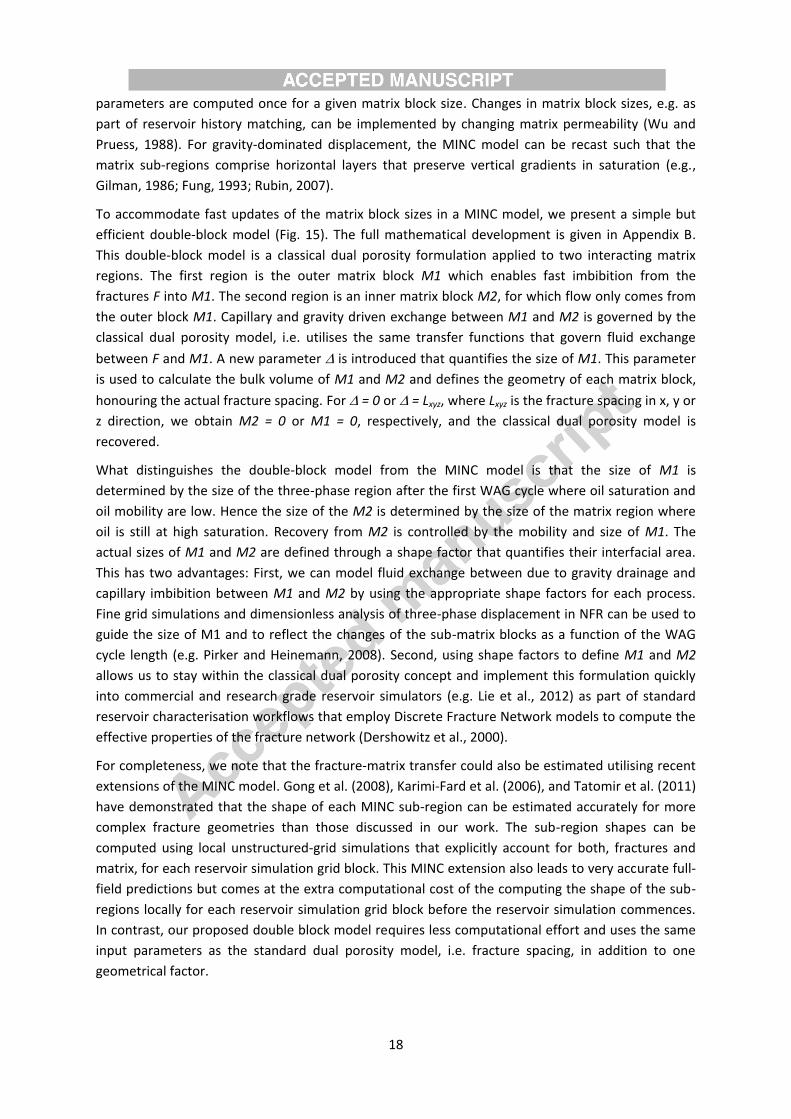
To accommodate fast updates of the matrix block sizes in a MINC model, we present a simple but
efficient double-block model (Fig. 15). The full mathematical development is given in Appendix B.
This double-block model is a classical dual porosity formulation applied to two interacting matrix
regions. The first region is the outer matrix block M1 which enables fast imbibition from the
fractures F into M1. The second region is an inner matrix block M2, for which flow only comes from
the outer block M1. Capillary and gravity driven exchange between M1 and M2 is governed by the
classical dual porosity model, i.e. utilises the same transfer functions that govern fluid exchange
between F and M1. A new parameter is introduced that quantifies the size of M1. This parameter
is used to calculate the bulk volume of M1 and M2 and defines the geometry of each matrix block,
honouring the actual fracture spacing. For = 0 or = Lxyz, where Lxyz is the fracture spacing in x, y or
z direction, we obtain M2 = 0 or M1 = 0, respectively, and the classical dual porosity model is
recovered.
What distinguishes the double-block model from the MINC model is that the size of M1 is
determined by the size of the three-phase region after the first WAG cycle where oil saturation and
oil mobility are low. Hence the size of the M2 is determined by the size of the matrix region where
oil is still at high saturation. Recovery from M2 is controlled by the mobility and size of M1. The
actual sizes of M1 and M2 are defined through a shape factor that quantifies their interfacial area.
This has two advantages: First, we can model fluid exchange between due to gravity drainage and
capillary imbibition between M1 and M2 by using the appropriate shape factors for each process.
Fine grid simulations and dimensionless analysis of three-phase displacement in NFR can be used to
guide the size of M1 and to reflect the changes of the sub-matrix blocks as a function of the WAG
cycle length (e.g. Pirker and Heinemann, 2008). Second, using shape factors to define M1 and M2
allows us to stay within the classical dual porosity concept and implement this formulation quickly
into commercial and research grade reservoir simulators (e.g. Lie et al., 2012) as part of standard
reservoir characterisation workflows that employ Discrete Fracture Network models to compute the
effective properties of the fracture network (Dershowitz et al., 2000).
For completeness, we note that the fracture-matrix transfer could also be estimated utilising recent
extensions of the MINC model. Gong et al. (2008), Karimi-Fard et al. (2006), and Tatomir et al. (2011)
have demonstrated that the shape of each MINC sub-region can be estimated accurately for more
complex fracture geometries than those discussed in our work. The sub-region shapes can be
computed using local unstructured-grid simulations that explicitly account for both, fractures and
matrix, for each reservoir simulation grid block. This MINC extension also leads to very accurate full-
field predictions but comes at the extra computational cost of the computing the shape of the sub-
regions locally for each reservoir simulation grid block before the reservoir simulation commences.
In contrast, our proposed double block model requires less computational effort and uses the same
input parameters as the standard dual porosity model, i.e. fracture spacing, in addition to one
geometrical factor.
19
Figure 15. Conceptual image for the double-block model, i.e. the simple-most form of the MINC model. A matrix
region is surrounded by fractures F which communicate with the outer matrix region M1 that is coupled to the inner
matrix region M2. The size of M1 is related to the size of the three-phase region after the first WAG cycle where oil
saturation and oil mobility are low (Fig. 5). Oil recovery from M2 where the oil saturation is high is hence controlled
by the oil mobility in M1.
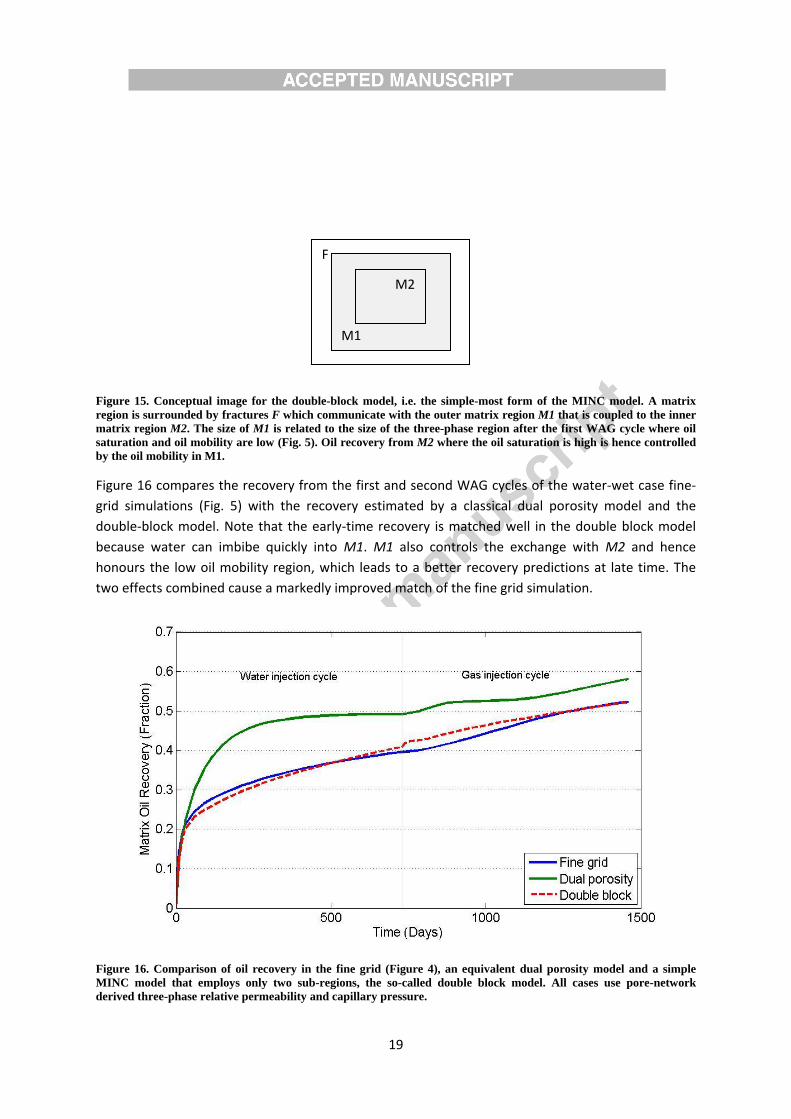
Figure 16 compares the recovery from the first and second WAG cycles of the water-wet case fine-
grid simulations (Fig. 5) with the recovery estimated by a classical dual porosity model and the
double-block model. Note that the early-time recovery is matched well in the double block model
because water can imbibe quickly into M1. M1 also controls the exchange with M2 and hence
honours the low oil mobility region, which leads to a better recovery predictions at late time. The
two effects combined cause a markedly improved match of the fine grid simulation.
Figure 16. Comparison of oil recovery in the fine grid (Figure 4), an equivalent dual porosity model and a simple
MINC model that employs only two sub-regions, the so-called double block model. All cases use pore-network
derived three-phase relative permeability and capillary pressure.
F
M1
M2
20
5.3. Effect of sub-cell heterogeneity So far, our analysis of recovery processes and related upscaling to dual porosity models only
considered uniform matrix properties in terms of wettability and block size distribution. However,
we showed that oil recovery is sensitive to these heterogeneities (Figs. 10).
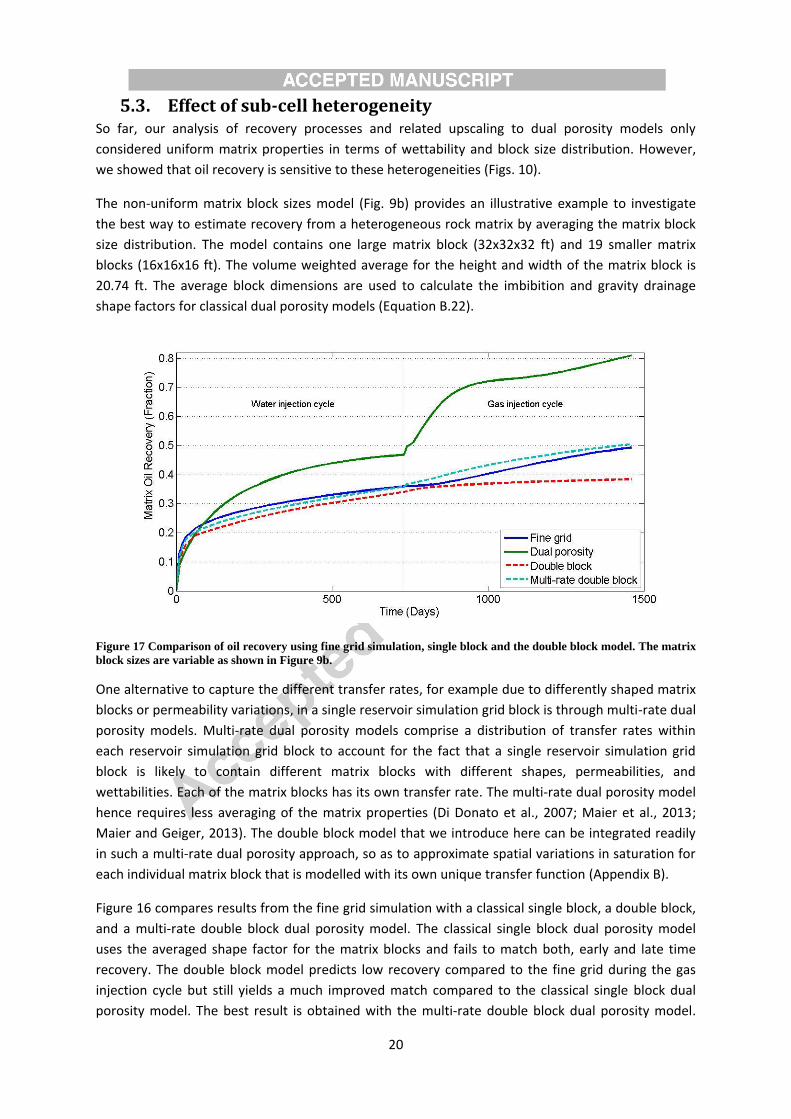
The non-uniform matrix block sizes model (Fig. 9b) provides an illustrative example to investigate
the best way to estimate recovery from a heterogeneous rock matrix by averaging the matrix block
size distribution. The model contains one large matrix block (32x32x32 ft) and 19 smaller matrix
blocks (16x16x16 ft). The volume weighted average for the height and width of the matrix block is
20.74 ft. The average block dimensions are used to calculate the imbibition and gravity drainage
shape factors for classical dual porosity models (Equation B.22).
Figure 17 Comparison of oil recovery using fine grid simulation, single block and the double block model. The matrix
block sizes are variable as shown in Figure 9b.
One alternative to capture the different transfer rates, for example due to differently shaped matrix
blocks or permeability variations, in a single reservoir simulation grid block is through multi-rate dual
porosity models. Multi-rate dual porosity models comprise a distribution of transfer rates within
each reservoir simulation grid block to account for the fact that a single reservoir simulation grid
block is likely to contain different matrix blocks with different shapes, permeabilities, and
wettabilities. Each of the matrix blocks has its own transfer rate. The multi-rate dual porosity model
hence requires less averaging of the matrix properties (Di Donato et al., 2007; Maier et al., 2013;
Maier and Geiger, 2013). The double block model that we introduce here can be integrated readily
in such a multi-rate dual porosity approach, so as to approximate spatial variations in saturation for
each individual matrix block that is modelled with its own unique transfer function (Appendix B).
Figure 16 compares results from the fine grid simulation with a classical single block, a double block,
and a multi-rate double block dual porosity model. The classical single block dual porosity model
uses the averaged shape factor for the matrix blocks and fails to match both, early and late time
recovery. The double block model predicts low recovery compared to the fine grid during the gas
injection cycle but still yields a much improved match compared to the classical single block dual
porosity model. The best result is obtained with the multi-rate double block dual porosity model.
21
However, this model did not completely match fine grid simulation results during gravity drainage
because the outer matrix blocks geometry as discussed previously. Nevertheless, the multi-rate dual
double block model is capable to match recovery significantly more accurately compared to the
other dual porosity models.
The reason why the single-rate double block model matches the recovery during the second WAG
cycle less well is the averaging of fracture spacing. The size and geometry of the matrix block
controls the speed of recovery (Figs. 10 and 11). Hence the variably sized blocks will have different
phase saturations and the sizes of M1 and M2 vary depending on the overall dimensions of the
matrix blocks. If only one average matrix block size is considered, M1 and M2 will also be averaged
and the size of the three-phase region, which controls the release of oil from the centre of the
matrix block, will be estimated inaccurately.
The question that arises then is whether we can actually characterize a multi-rate dual porosity
medium from the data that are typically collected for a fractured reservoir. Clustering analysis and
spatial organization of wellbore intersecting fractures can be used in approximating matrix block size
distribution. Outcrop analogues provide information on fracture spacing and matrix block sizes. This
information can be used in combination with discrete fracture network (DFN) modelling to obtain
different likelihoods of block sizes and shape factor distributions (e.g., Sarda et al., 1997; Dershowitz
et al., 2000). Classical geomodelling of the rock matrix already provides information on permeability
and wettability distributions in the rock matrix.
6. Conclusion We examined capillary and gravity dominated fluid exchange between matrix blocks and fractures
during three-phase flow using models at multiple scales. Three-phase relative permeability and
capillary pressure data were derived from a state-of-the-art pore-network model and compared with
flow functions computed with empirical models (Stone I, Stone II, Saturation weighted interpolation
and Carlson’s hysteresis model). A high-resolution fine grid simulation model enabled us to
investigate the first-order parameters that control three-phase fracture-matrix transfer processes.
Our work shows that, like for unfractured reservoirs, hysteresis is key parameter that influences the
prediction of oil recovery during WAG in fractured reservoirs. The choice of three-phase model and
hysteresis model, can cause up to 10 % difference in predicted oil recovery from a water-wet rock
matrix. The difference in recovery is smaller for an oil-wet rock matrix because of a smaller size of
the three-phase region and less impact of hysteresis.
A sensitivity study showed that matrix heterogeneities in terms of wettability, block geometry and
permeability affect fracture-matrix transfer rates significantly. The different transfer rates arising
from these heterogeneities cannot be averaged using classical dual porosity models. We found that
the classic dual porosity model provides incorrect estimates of recovery because the assumption
that saturations are uniformly distributed in the rock matrix leads to wrong estimates of the transfer
rates. This effect is well-known for two-phase flow and exacerbated for three-phase flow because
regions where three phases coexist and oil mobility is low or hysteresis is important cannot be
modelled properly.
We therefore presented a new form of the Multiple Interacting Continua (MINC) model, a double
block model comprising an inner and outer matrix block. This new model already provides
22
significantly better estimates of fracture-matrix transfer rates during three-phase flow at negligible
computational cost. The double block uses shape factors estimated from the geometries of the sub-
domain grid blocks and the fracture spacing and can be extended easily to a multi-rate dual porosity
model. The multi-rate model incorporates different transfer rates arising from matrix
heterogeneities (e.g. different block size distributions), provides the best estimates for fracture-
matrix transfer rates as it captures these sub-cell heterogeneities more adequately than a classical
single- or the new double block model. Multi-rate dual porosity models can be combined readily
with the double block dual porosity approach to account for both, multiple transfer rates due to
matrix heterogeneity and heterogeneous saturation distributions in each rock matrix block.
7. References AbuShaikha, A. S., and Gosselin, O. R., 2008, Fracture-matrix Transfer Function in Dual-Medium Flow
Simulation: Review, Comparison, and Validation - SPE-113890-MS, Europec/EAGE Conference and Exhibition:
Rome, Italy, Society of Petroleum Engineers.
Ahmed Elfeel, M., Al-Dhahli, A., Jiang, Z., Geiger, S., van Dijke, M.I.J., 2013, Effect of Rock and Wettability
Heterogeneity on the Efficiency of WAG Flooding in Carbonate Reservoirs, SPE 166054. In SPE Reservoir
Characterisation and Simulation Conference and Exhibition, Abu Dhabi, UAE.
Al-Dhahli, A., Geiger, S., and van Dijke, M. I. J., 2013a, Three-phase pore-network modeling for reservoirs with
arbitrary wettability: SPE Journal, v. 18, no. 2, p. 285-295.
Al-Dhahli, A., van Dijke, M. I. J., and Geiger, S., 2013b, Accurate Modelling of Pore-Scale Films and Layers for
Three-Phase Flow Processes in Clastic and Carbonate Rocks with Arbitrary Wettability: Transport in Porous
Media, p. 1-28.
Al-Dhahli, A., Geiger, S, van Dijke, M. I. J., 2014, Impact of pore-scale three-phase flow for arbitrary wettability
on reservoir-scale oil recovery. Journal of Petroleum Science and Engineering, 121, 110-121,
doi:10.1016/j.petrol.2014.06.018.
Arayni, F. A., Obeidi, A., Brahmakulam, J., and Ramamoorthy, R., 2013, Pulsed-Neutron Monitoring of the First
CO2 Enhanced-Oil-Recovery Pilot in the Middle East: SPE RESERVOIR EVALUATION & ENGINEERING, v. 16, no.
1, p. pp. 72-84.
Awan, A. R., Teigland, R., and Kleppe, J., 2008, A survey of North Sea enhanced-oil-recovery projects initiated
during the years 1975 to 2005: SPE RESERVOIR EVALUATION & ENGINEERING, v. 11, no. 3, p. 497-512.
Baker, L. E., 1988, Three-Phase Relative Permeability Correlations - SPE 17369, SPE Enhanced Oil Recovery
Symposium: Tulsa, Oklahoma, 1988.
Behbahani, H., and Blunt, M., 2005, Analysis of imbibition in mixed-wet rocks using pore-scale modeling: SPE
Journal, v. 10, no. 4, p. 466-474.
Blunt, M. J., 2000, An empirical model for three-phase relative permeability: SPE Journal, v. 5, no. 4, p. 435-
445.
Brodie, J. A., Jhaveri, B. S., Moulds, T. P., and Hetland, S. M., 2012, Review Of Gas Injection Projects In BP - SPE
154008, SPE Improved Oil Recovery Symposium: Tulsa, Oklahoma, USA, Society of Petroleum Engineers.
Carlson, C., 1981, Simulation of relative permeability hysteresis to the non-wetting phase, SPE Annual
Conference San Antonio, TX B2 - SPE Annual Conference San Antonio, TX: San Antonio, TX.
Christensen, J. R., Stenby, E. H., and Skauge, A., 2001, Review of WAG Field Experience: SPE RESERVOIR
EVALUATION & ENGINEERING, v. 4, no. 2, p. 97-106.
Davidson, D. A., and Snowdon, D. M., 1978, Beaver River Middle Devonian Carbonate: Performance Review of
a High-Relief, Fractured Gas Reservoir With Water Influx: SPE Journal of Petroleum Technology, v. 30, no. 12,
p. 1672-1678.
23
Dean, R., and Lo, L., 1988, Simulations of naturally fractured reservoirs: SPE Reservoir Engineering, v. 3, no. 02,
p. 638-648.
Dehghan, A., Ghorbanizadeh, S., and Ayatollahi, S., 2012, Investigating the Fracture Network Effects on Sweep
Efficiency during WAG Injection Process: Transport in Porous Media, v. 93, no. 3, p. 577.
Delshad, M., and Pope, G. A., 1989, Comparison of the three-phase oil relative permeability models: Transport
in Porous Media, v. 4, no. 1, p. 59-83.
Denoyelle, L., Bardon, C. P., and Couve de Murville, E., 1988, Interpretation of a CO2/N2 Injection Field Test in
a Moderately Fractured Carbonate Reservoir: SPE Reservoir Engineering, v. 3, no. 1, p. 220-226.
Dershowitz, B., LaPointe, P., Eiben, T., and Wei, L., 2000, Integration of Discrete Feature Network Methods
With Conventional Simulator Approaches: SPE RESERVOIR EVALUATION & ENGINEERING, no. 04.
Di Donato, G., Lu, H., Tavassoli, Z., and Blunt, M. J., 2007, Multirate-Transfer Dual-Porosity Modeling of Gravity
Drainage and Imbibition: SPE Journal, v. 12, no. 1, p. pp. 77-88.
Egermann, P., Mejdoub, K., Lombard, J.-M., Vizika, O., & Kalam, Z., 2014, Drainage Three-Phase Flow Relative
Permeability on Oil-Wet Carbonate Reservoir Rock Types: Experiments, Interpretation and Comparison with
Standard Correlations. Society of Petrophysicists and Well-Log Analysts
Er, V., Babadagli, T., and Xu, Z. H., 2010, Pore-Scale Investigation of the Fracture-matrix Interaction During CO2
Injection in Naturally Fractured Oil Reservoirs: ENERGY & FUELS, v. 24, p. 1421-1430.
Fayers, F. J., and Matthews, J. D., 1984, Evaluation of normalized Stone's methods for estimating three-phase
relative permeabilities: Society of Petroleum Engineers Journal, v. 24, p. 224-232.
Fernø, M., Haugen, Å., and Graue, A., 2011, Wettability effects on the matrix–fracture fluid transfer in
fractured carbonate rocks: JOURNAL OF PETROLEUM SCIENCE AND ENGINEERING, v. 77, no. 1, p. 146-153.
Fung, S-K. (1993). Numerical Simulation of Naturally Fractured Reservoirs - SPE 25616. Society of Petroleum
Engineers. doi:10.2118/25616-MS
Gang, T., and Kelkar, M., 2008, History Matching for Determination of Fracture Permeability and Capillary
Pressure: SPE RESERVOIR EVALUATION & ENGINEERING, v. 11, no. 5, p. 813-822.
Geiger, S., Dentz, M., and Neuweiler, I., 2013, A Novel Multi-Rate Dual-Porosity Model for Improved Simulation
of Fractured and Multiporosity Reservoirs: SPE Journal, v. 18, no. 4, p. pp. 670-684.
Gilman, J. R., 1986, An Efficient Finite-Difference Method for Simulating Phase Segregation in the Matrix Blocks
in Double-Porosity Reservoirs: SPE Reservoir Engineering, v. 1, no. 4, p. 403-413.
Gilman, J. R., and Kazemi, H., 1988, Improved Calculations for Viscous and Gravity Displacement in Matrix
Blocks in Dual-Porosity Simulators (includes associated papers 17851, 17921, 18017, 18018, 18939, 19038,
19361 and 20174 ): Journal of Petroleum Technology, v. 40, no. 1, p. 60-70.
Gong, B., Karimi-Fard, M., and Durlofsky, L. J., 2008, Upscaling discrete fracture characterizations to dual-
porosity, dual-permeability models for efficient simulation of flow with strong gravitational effects: SPE
Journal, v. 13, no. 1, p. 58-67.
Hagoort, J., 1980, Oil Recovery by Gravity Drainage: Society of Petroleum Engineers Journal, v. 20, no. 3, p.
139-150.
Haugen, A., Ferno, M. A., and Graue, A., 2008, Numerical Simulation and Sensitivity Analysis of In-Situ Fluid
Flow in MRI Laboratory Waterfloods of Fractured Carbonate Rocks at Different Wettabilities - SPE-116145-MS,
SPE Annual Technical Conference and Exhibition: Denver, Colorado, USA, Society of Petroleum Engineers.
Jakobsson, N. M., and Christian, T. M., 1994, Historical Performance of Gas Injection of Ekofisk - SPE 28933,
SPE Annual Technical Conference and Exhibition: New Orleans, Louisiana, Copyright 1994, Society of
Petroleum Engineers Inc.
Jiang, Z., Al-Dhahli, A., van Dijke, M. I. J., Geiger, S., and Ma, J., 2013a, Multi-scale Pore-network Modelling of
WAG in Carbonates, IOR 2013 - From Fundamental Science to Deployment St. Petersburg, Russia.
24
Jiang, Z., van Dijke, M., Sorbie, K., and Couples, G., 2013b, Representation of multi-scale heterogeneity via
multi-scale pore networks: WATER RESOURCES RESEARCH.
Kalam, M. Z., Negahban, S., Al-Rawahi, A. S., and Hosani, I. A., 2011, Miscible Gas Injection Tests in Carbonates
and its impact on Field Development - SPE 148374, SPE Reservoir Characterisation and Simulation Conference
and Exhibition: Abu Dhabi, UAE, Society of Petroleum Engineers.
Karimi-Fard, M., Gong, B., and Durlofsky, L. J., 2006, Generation of coarse-scale continuum flow models from
detailed fracture characterizations: WATER RESOURCES RESEARCH, v. 42, no. 10.
Kazemi, H., Gilman, J. R., and Elsharkawy, A. M., 1992, Analytical and Numerical Solution of Oil Recovery From
Fractured Reservoirs With Empirical Transfer Functions (includes associated papers 25528 and 25818): SPE
Reservoir Engineering, v. 7, no. 2, p. 219-227.
Kazemi, H., Merrill, L. S., Porterfield, J. L., and Zeman, P. R., 1976, Numerical simulation, of water-oil flow in
naturally fractured reservoirs, SPEJ.
Larsen, J. A., and Skauge, A., 1998, Methodology for Numerical Simulation With Cycle-Dependent Relative
Permeabilities: SPE JOURNAL -RICHARDSON-, v. 3, no. 2, p. 163-173.
Lichaa, P. M., Alpustun, H., Abdul, J. H., Nofal, W. A., and Fuseni, A. B., 1993, Wettability Evaluation of a
Carbonate Reservoir Rock: Advances in Core Evaluation III, Reservoir Management, v. 327.
Lie, K. A., Krogstad, S., Ligaarden, I. S., Natvig, J. R., Nilsen, H. M., and Skaflestad, B., 2012, Open-source
MATLAB implementation of consistent discretisations on complex grids: COMPUTATIONAL GEOSCIENCES, v.
16, no. 2, p. 297-322.
Maier, C., and Geiger, S., 2013, Combining Unstructured Grids, Discrete Fracture Representation and Dual-
Porosity Models for Improved Simulation of Naturally Fractured Reservoirs - SPE 166049, SPE Reservoir
Characterisation and Simulation Conference and Exhibition: Abu Dhabi, UAE, Society of Petroleum Engineers.
Maier, C., Schmid, K. S., Elfeel, M. A., and Geiger, S., 2013, Multi-Rate Mass-Transfer Dual-Porosity Modeling
Using the Exact Analytical Solution for Spontaneous Imbibition - SPE 164926, SPE Europec/EAGE Annual
Conference: London, United Kingdom, Society of Petroleum Engineers.
Manrique, E. J., Muci, V. E., and Gurfinkel, M. E., 2007, EOR field experiences in carbonate reservoirs in the
United States: SPE RESERVOIR EVALUATION & ENGINEERING, v. 10, no. 6, p. 667-686.
O'Neill, N., 1988, Fahud Field Review: A Switch From Water to Gas Injection: SPE Journal of Petroleum
Technology, v. 40, no. 5, p. 609-618.
Oak, M., Baker, L., and Thomas, D., 1990, Three-phase relative permeability of Berea sandstone: Journal of
Petroleum Technology, v. 42, no. 8, p. 1054-1061.
Øren, P. E., and Bakke, S., 2003, Reconstruction of Berea sandstone and pore-scale modelling of wettability
effects: JOURNAL OF PETROLEUM SCIENCE AND ENGINEERING, v. 39, no. 3, p. 177-199.
Panda, M. N., Ambrose, J. G., Beuhler, G., and McGuire, P. L., 2009, Optimized EOR Design for the Eileen West
End Area, Greater Prudhoe Bay: SPE RESERVOIR EVALUATION & ENGINEERING, v. 12, no. 1, p. 25-32.
Penuela, G., Hughes, R., Civan, F., and Wiggins, M., 2002, Time-dependent shape factors for secondary
recovery in naturally fractured reservoirs - SPE 75234,in Proceedings SPE/DOE Improved Oil Recovery
Symposium, Society ofPetroleum Engineers.
Petersen, E., Lohne, A., Vatne, K. O., Helland, J. O., Virnovsky, G., and Øren, P. E., Relative Permeabilities for
Two-and Three Phase Flow Processes Relevant to the Depressurization of the Statfjord Field, in Proceedings
International Symposium of the Society of Core Analysts. Abu Dhabi, UAE2008, Volume 29.
Pirker, B., and Heinemann, Z. E., 2008, Method to Preliminary Estimation of the Reserves and Production
Forecast for Dual Porosity Fractured Reservoirs, in Proceedings Europec/EAGE Conference and Exhibition,
Society of Petroleum Engineers.
25
Pizarro, J. O. D. S., and Branco, C. C. M., 2012, Challenges in Implementing an EOR Project in the Pre-Salt
Province in Deep Offshore Brasil - SPE 155665, SPE EOR Conference at Oil and Gas West Asia: Muscat, Oman,
Society of Petroleum Engineers.
Pruess, K., and Narasimhan, T. N., 1985, A Practical Method for Modeling Fluid and Heat Flow in Fractured
Porous Media: Society of Petroleum Engineers Journal, v. 25, no. 1, p. 14-26.
Quandalle, P., and Sabathier, J. C., 1989, Typical Features of a Multipurpose Reservoir Simulator: SPE Reservoir
Engineering, v. 4, no. 4, p. 475-480.
Ramirez, B., Kazemi, H., Al-kobaisi, M., Ozkan, E., and Atan, S., 2009, A Critical Review for Proper Use of
Water/Oil/Gas Transfer Functions in Dual-Porosity Naturally Fractured Reservoirs: Part I: SPE RESERVOIR
EVALUATION & ENGINEERING, v. 12, no. 2, p. pp. 200-210.
Rangel-German, E. R., and Kovscek, A. R., 2006, Time-dependent fracture-matrix shape factors for partially and
completely immersed fractures: JOURNAL OF PETROLEUM SCIENCE AND ENGINEERING, v. 54, no. 3, p. 149-
163.
Rangel-German, E. R., Kovscek, A. R., and Akin, S., 2010, Time-dependent shape factors for uniform and non-
uniform pressure boundary conditions: Transport in Porous Media, v. 83, no. 3, p. 591-601.
Rawahi, A., Hafez, H. H., Al-yafei, A., Ghori, S. G., Putney, K., and Matthews, T. R., 2012, Maximize the Ultimate
Recovery by Designing & Optimizing a CO2 Miscible Gas Injection Pilot in Giant Carbonate Oil Reservoir, Abu
Dhabi -SPE-162277-MS, Abu Dhabi International Petroleum Conference and Exhibition: Abu Dhabi, UAE,
Society of Petroleum Engineers.
Rossen, R., and Shen, E., 1989, Simulation of gas/oil drainage and water/oil imbibition in naturally fractured
reservoirs: SPE Reservoir Engineering, v. 4, no. 04, p. 464-470.
Rubin, B., 2007, Simulating Gravity Drainage and Reinfiltration With a Subdomain-Dual-Permeability Hybrid
Fracture Model - SPE 106191, SPE Reservoir Simulation Symposium: Houston, Texas, U.S.A., Society of
Petroleum Engineers.
Ryazanov, A., van Dijke, M. I. J., and Sorbie, K., 2009, Two-phase pore-network modelling: existence of oil
layers during water invasion: Transport in Porous Media, v. 80, no. 1, p. 79-99.
Saidi, A. M., 1996, Twenty years of gas injection history into well-fractured Haft Kel Field (Iran) - SPE 35309,
SPE International Petroleum Conference and Exhibition, Villahermosa, Mexico, March 5-7.
Sarda, S., Bourbiaux, B. J., Cacas, M. C., and Sabathier, J. C., An Innovative Procedure to Compute Equivalent
Block Size in a Dual-Porosity Model1997, European Association of Geoscientists & Engineers, p. 017.
Sarma, P., and Aziz, K., 2006, New Transfer Functions for Simulation of Naturally Fractured Reservoirs with
Dual-Porosity Models: SPE Journal, v. 11,no. 3, p. pp. 328-340.Schlumberger, 2012, ECLIPSE reservoir
simulation software.
Schmid, K. S., and Geiger, S., 2013, Universal scaling of spontaneous imbibition for arbitrary petrophysical
properties: Water-wet and mixed-wet states and Handy's conjecture: JOURNAL OF PETROLEUM SCIENCE AND
ENGINEERING, v. 101, no. 0, p. 44-61.
Sohrabi, M., Tehrani, D. H., Danesh, A., and Henderson, G. D., 2004, Visualization of oil recovery by water-
alternating-gas injection using high-pressure micromodels: SPE Journal, v. 9, no. 3, p. 290-301.
Spiteri, E., Juanes, R., Blunt, M., and Orr, F., 2008, A new model of trapping and relative permeability hysteresis
for all wettability characteristics: SPE Journal, v. 13, no. 3, p. 277-288.
Spiteri, E. J., and Juanes, R., 2006, Impact of relative permeability hysteresis on the numerical simulation of
WAG injection: JOURNAL OF PETROLEUM SCIENCE AND ENGINEERING, v. 50, p. 115-139.
Stone, H., 1970, Probability model for estimating three-phase relative permeability: Journal of Petroleum
Technology, v. 22, no. 2, p. 214-218.
26
Stone, H. L., 1973, Estimation of Three-Phase Relative Permeability and Residual Oil Data: JOURNAL OF
CANADIAN PETROLEUM TECHNOLOGY, v. 12, no. 4, p. 53.
Tatomir, A., Szymkiewicz, A., Class, H., and Helmig, R., 2011, Modeling two phase flow in large scale fractured
porous media with an extended multiple interacting continua method: Computer Modeling in Engineering &
Sciences(CMES), v. 77, no. 2, p. 81-111.
Tecklenburg, J., Neuweiler, I., Dentz, M., Carrera, J., Geiger, S., Abramowski, C., and Silva, O., 2013, A Non-Local
Two-Phase Flow Model For Immiscible Displacement in Highly Heterogeneous Porous Media And Its
Parametrization: ADVANCES IN WATER RESOURCES.
Thomas, L. K., Dixon, T. N., and Pierson, R. G., 1983, Fractured Reservoir Simulation: Society of Petroleum
Engineers Journal, v. 23, no. 1, p. 42-54.
Ueda, Y., Murata, S., Watanabe, Y., and Funatsu, K., 1989, Investigation of the shape factor used in the dual-
porosity reservoir simulator, SPE 19469, in Proceedings SPE Asia-Pacific Conference, Society of Petroleum
Engineers.
van Dijke, M. I. J., and Sorbie, K., 2006, Existence of fluid layers in the corners of a capillary with non-uniform
wettability: Journal of colloid and interface science, v. 293, no. 2, p. 455-463.
van Dijkum, C. E., and Walker, T., 1991, Fractured Reservoir Simulation and Field Development, Natih Field,
Oman - SPE 22917, SPE Annual Technical Conference and Exhibition: Dallas, Texas, 1991 Copyright 1991,
Society of Petroleum Engineers, Inc.
van Spronsen, E., 1982, Three-phase relative permeability measurements using the centrifuge method: K/Shell
Explor en Prod Lab, Neth.
Warren, J. E., and Root, P. J., 1963, The Behavior of Naturally Fractured Reservoirs, no. 09.
Wu, Y.-S., and Pruess, K., 1988, A Multiple-Porosity Method for Simulation of Naturally Fractured Petroleum
Reservoirs: SPE Reservoir Engineering, v. 3, no. 1, p. 327-336.
Zhou, D., Kamath, J., Zuo, L., and Chen, Y., 2013, Three-Phase Relative Permeability Modeling in the Simulation
of WAG Injection - SPE 166138, SPE Annual Technical Conference and Exhibition: New Orleans, Louisiana, USA,
2013, Society of Petroleum Engineers.
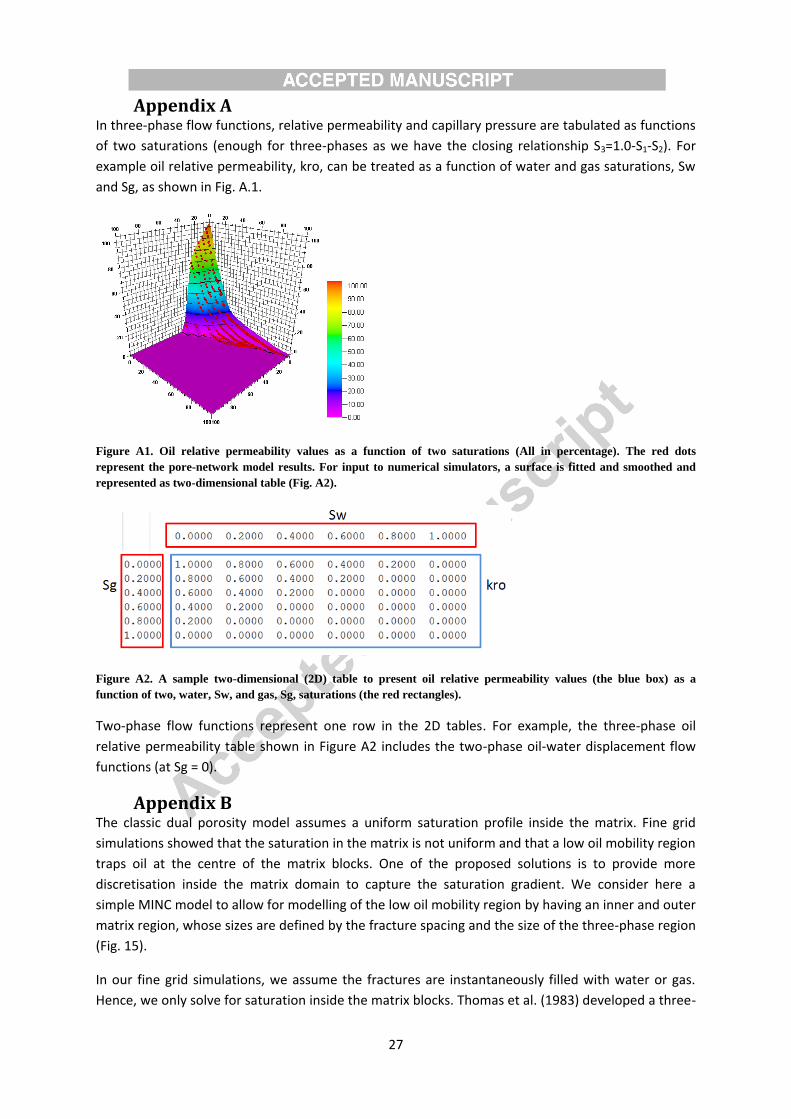
27
Appendix A In three-phase flow functions, relative permeability and capillary pressure are tabulated as functions
of two saturations (enough for three-phases as we have the closing relationship S3=1.0-S1-S2). For
example oil relative permeability, kro, can be treated as a function of water and gas saturations, Sw
and Sg, as shown in Fig. A.1.
Figure A1. Oil relative permeability values as a function of two saturations (All in percentage). The red dots
represent the pore-network model results. For input to numerical simulators, a surface is fitted and smoothed and
represented as two-dimensional table (Fig. A2).
Figure A2. A sample two-dimensional (2D) table to present oil relative permeability values (the blue box) as a
function of two, water, Sw, and gas, Sg, saturations (the red rectangles).
Two-phase flow functions represent one row in the 2D tables. For example, the three-phase oil
relative permeability table shown in Figure A2 includes the two-phase oil-water displacement flow
functions (at Sg = 0).
Appendix B The classic dual porosity model assumes a uniform saturation profile inside the matrix. Fine grid
simulations showed that the saturation in the matrix is not uniform and that a low oil mobility region
traps oil at the centre of the matrix blocks. One of the proposed solutions is to provide more
discretisation inside the matrix domain to capture the saturation gradient. We consider here a
simple MINC model to allow for modelling of the low oil mobility region by having an inner and outer
matrix region, whose sizes are defined by the fracture spacing and the size of the three-phase region
(Fig. 15).
In our fine grid simulations, we assume the fractures are instantaneously filled with water or gas.
Hence, we only solve for saturation inside the matrix blocks. Thomas et al. (1983) developed a three-
28
phase model for simulating flow of water, oil and gas in a NFR using the dual porosity system. We
describe the fracture matrix transfer based on their equations.
For the fractures, we assume zero capillary pressure values. Therefore,
fgfofwf pppp B. 1
The matrix/fracture flow equations for M1 (Thomas et al., 1983):
11
1111 wwb
wowgfwmw Sbt
VGGpp
, B. 2
11
1111 oob
owogfomo Sbt
VGGpp
B. 3
and
11
1111 ggb
gwgofgmg Sbt
VGGpp
. B. 4
The phase mobilities are defined as follows (Thomas et al., 1983)
B
kVk b
rM1
111 , B. 5
where the subscript denotes the phase, relative permeability is based on the upstream value.
The multiphase gravity terms are pseudo capillary pressure terms that are defined as follows:
)(2
11
1
1fm
z
M
zM hhgL
G
, B. 6
Where the subscripts and denote two different phases and h is a dimensionless variable that
depends on the saturation of , i.e.
orSS
SSh
)min(1
)min(. B. 7
Equations B. 2 to B. 4 are three equations to solve for six unknowns: 1wmp , 1omp , 1gmp , 1wmS , 1omS
and 1gmS . The closing equations are:
1111 omgmwm SSS , B. 8
111 cwmomwm ppp B. 9
and
111 cgmomgm ppp . B. 10
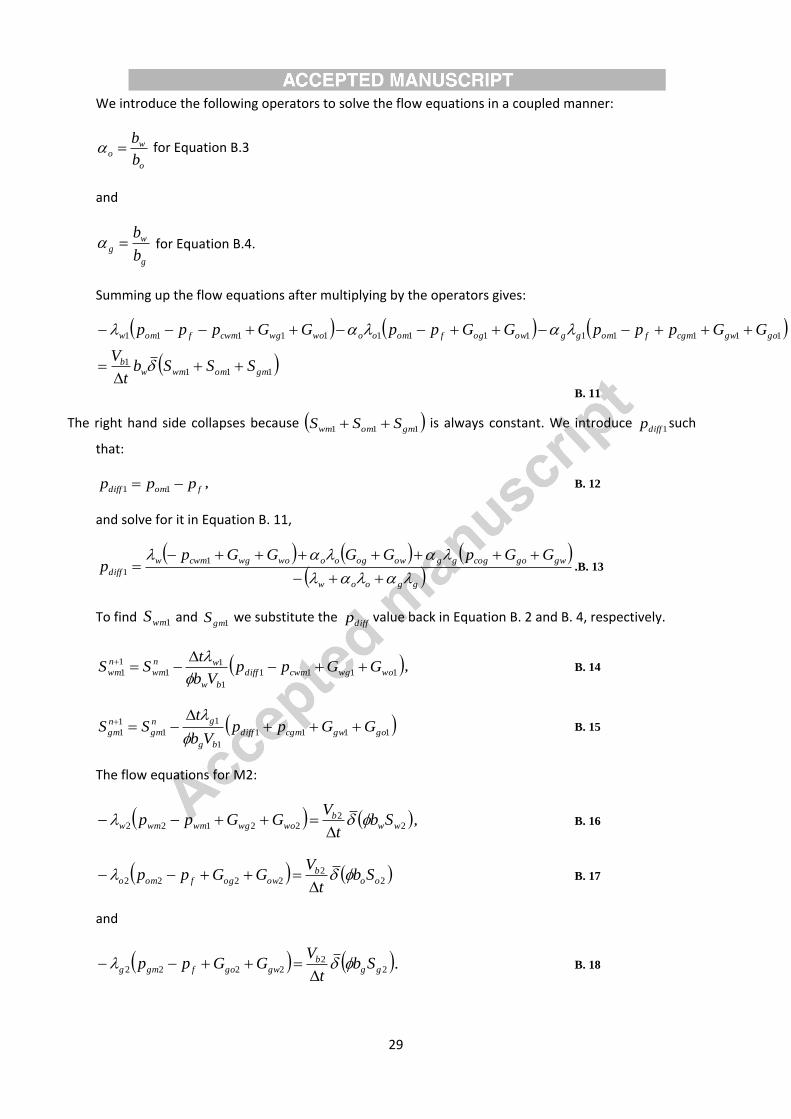
29
We introduce the following operators to solve the flow equations in a coupled manner:
o
wo
b
b for Equation B.3
and
g
wg
b
b for Equation B.4.
Summing up the flow equations after multiplying by the operators gives:
111
1
11111111111111
gmomwmwb
gogwcgmfomggowogfomoowowgcwmfomw
SSSbt
V
GGpppGGppGGppp
B. 11
The right hand side collapses because 111 gmomwm SSS is always constant. We introduce 1diffp such
that:
fomdiff ppp 11, B. 12
and solve for it in Equation B. 11,
ggoow
gwgocogggowogoowowgcwmw
diff
GGpGGGGpp
1
1.B. 13
To find 1wmS and 1gmS we substitute the
diffp value back in Equation B. 2 and B. 4, respectively.
1111
1
11
1
1 wowgcwmdiff
bw
wn
wm
n
wm GGppVb
tSS
, B. 14
1111
1
1
1
1
1 gogwcgmdiff
bg
gn
gm
n
gm GGppVb
tSS
B. 15
The flow equations for M2:
22
22122 wwb
wowgwmwmw Sbt
VGGpp
, B. 16
22
2222 oob
owogfomo Sbt
VGGpp
B. 17
and
2
22222 gg
bgwgofgmg Sb
t
VGGpp
. B. 18
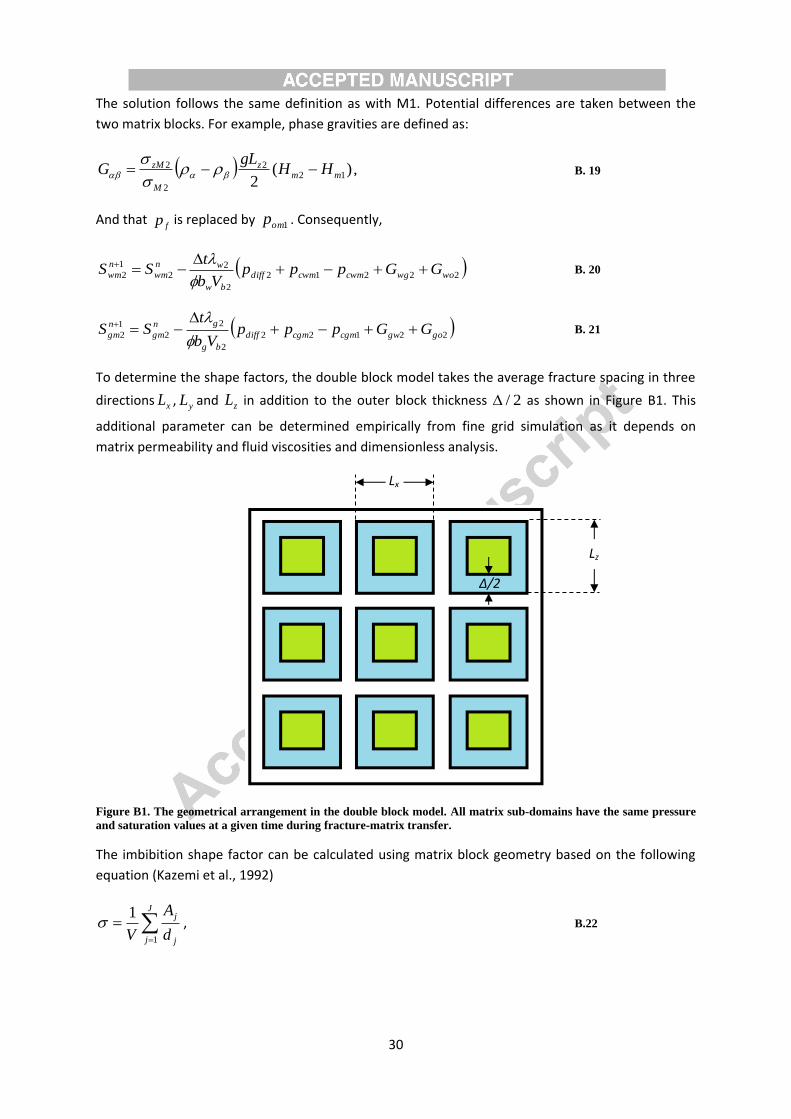
30
The solution follows the same definition as with M1. Potential differences are taken between the
two matrix blocks. For example, phase gravities are defined as:
)(2
122
2
2mm
z
M
zM HHgL
G
, B. 19
And that fp is replaced by 1omp . Consequently,
22212
2
22
1
2 wowgcwmcwmdiff
bw
wn
wm
n
wm GGpppVb
tSS
B. 20
22122
2
2
2
1
2 gogwcgmcgmdiff
bg
gn
gm
n
gm GGpppVb
tSS
B. 21
To determine the shape factors, the double block model takes the average fracture spacing in three
directions xL , yL and zL in addition to the outer block thickness 2/ as shown in Figure B1. This
additional parameter can be determined empirically from fine grid simulation as it depends on
matrix permeability and fluid viscosities and dimensionless analysis.
Figure B1. The geometrical arrangement in the double block model. All matrix sub-domains have the same pressure
and saturation values at a given time during fracture-matrix transfer.
The imbibition shape factor can be calculated using matrix block geometry based on the following
equation (Kazemi et al., 1992)
J
j j
j
d
A
V 1
1 , B.22
Δ/2
Lz
Lx
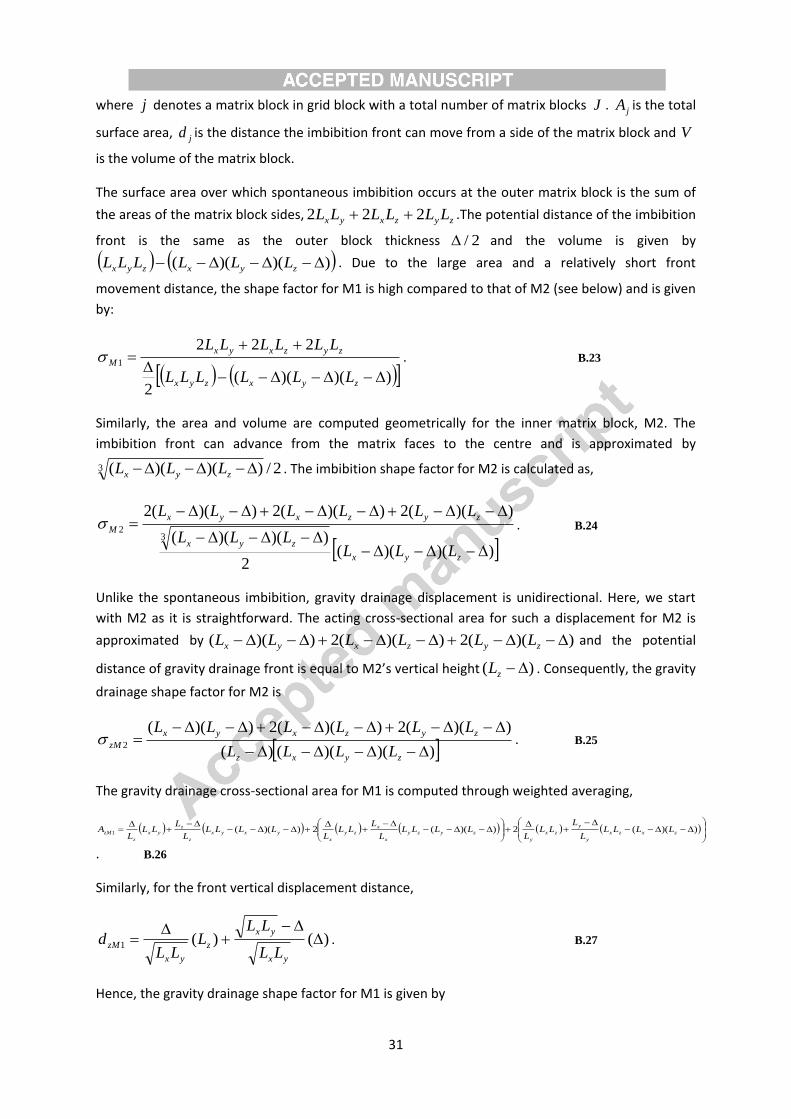
31
where j denotes a matrix block in grid block with a total number of matrix blocks J . jA is the total
surface area, jd is the distance the imbibition front can move from a side of the matrix block and V
is the volume of the matrix block.
The surface area over which spontaneous imbibition occurs at the outer matrix block is the sum of
the areas of the matrix block sides, zyzxyx LLLLLL 222 .The potential distance of the imbibition
front is the same as the outer block thickness 2/ and the volume is given by
))()(( zyxzyx LLLLLL . Due to the large area and a relatively short front
movement distance, the shape factor for M1 is high compared to that of M2 (see below) and is given
by:
))()((2
2221
zyxzyx
zyzxyx
M
LLLLLL
LLLLLL . B.23
Similarly, the area and volume are computed geometrically for the inner matrix block, M2. The
imbibition front can advance from the matrix faces to the centre and is approximated by
2/))()((3 zyx LLL . The imbibition shape factor for M2 is calculated as,
))()((2
))()((
))((2))((2))((2
32
zyx
zyx
zyzxyx
M
LLLLLL
LLLLLL . B.24
Unlike the spontaneous imbibition, gravity drainage displacement is unidirectional. Here, we start
with M2 as it is straightforward. The acting cross-sectional area for such a displacement for M2 is
approximated by ))((2))((2))(( zyzxyx LLLLLL and the potential
distance of gravity drainage front is equal to M2’s vertical height )( zL . Consequently, the gravity
drainage shape factor for M2 is
))()(()(
))((2))((2))((2
zyxz
zyzxyx
zMLLLL
LLLLLL . B.25
The gravity drainage cross-sectional area for M1 is computed through weighted averaging,
))((2))((2))((1 zxzx
y
y
zx
y
zyzy
x
x
zy
x
yxyx
z
zyx
z
zM LLLLL
LLL
LLLLL
L
LLL
LLLLL
L
LLL
LA
. B.26
Similarly, for the front vertical displacement distance,
)()(1
yx
yx
z
yx
zMLL
LLL
LLd . B.27
Hence, the gravity drainage shape factor for M1 is given by
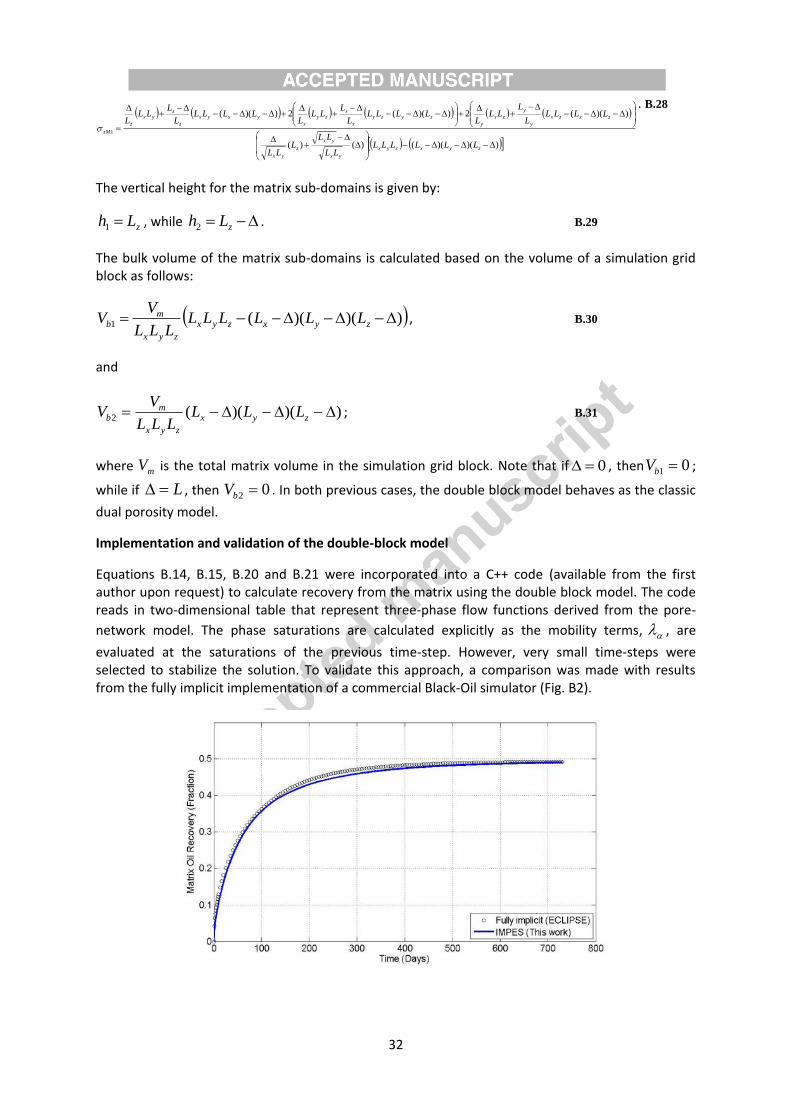
32
))()(()()(
))((2))((2))((
1
zyxzyx
yx
yx
z
yx
zxzx
y
y
zx
y
zyzy
x
xzy
x
yxyx
z
zyx
z
zM
LLLLLLLL
LLL
LL
LLLLL
LLL
LLLLL
L
LLL
LLLLL
L
LLL
L
. B.28
The vertical height for the matrix sub-domains is given by:
zLh 1 , while zLh2 . B.29
The bulk volume of the matrix sub-domains is calculated based on the volume of a simulation grid block as follows:
))()((1 zyxzyx
zyx
mb LLLLLL
LLL
VV , B.30
and
))()((2 zyx
zyx
mb LLL
LLL
VV ; B.31
where mV is the total matrix volume in the simulation grid block. Note that if 0 , then 01 bV ;
while if L , then 02 bV . In both previous cases, the double block model behaves as the classic
dual porosity model.
Implementation and validation of the double-block model
Equations B.14, B.15, B.20 and B.21 were incorporated into a C++ code (available from the first author upon request) to calculate recovery from the matrix using the double block model. The code reads in two-dimensional table that represent three-phase flow functions derived from the pore-
network model. The phase saturations are calculated explicitly as the mobility terms, , are
evaluated at the saturations of the previous time-step. However, very small time-steps were selected to stabilize the solution. To validate this approach, a comparison was made with results from the fully implicit implementation of a commercial Black-Oil simulator (Fig. B2).
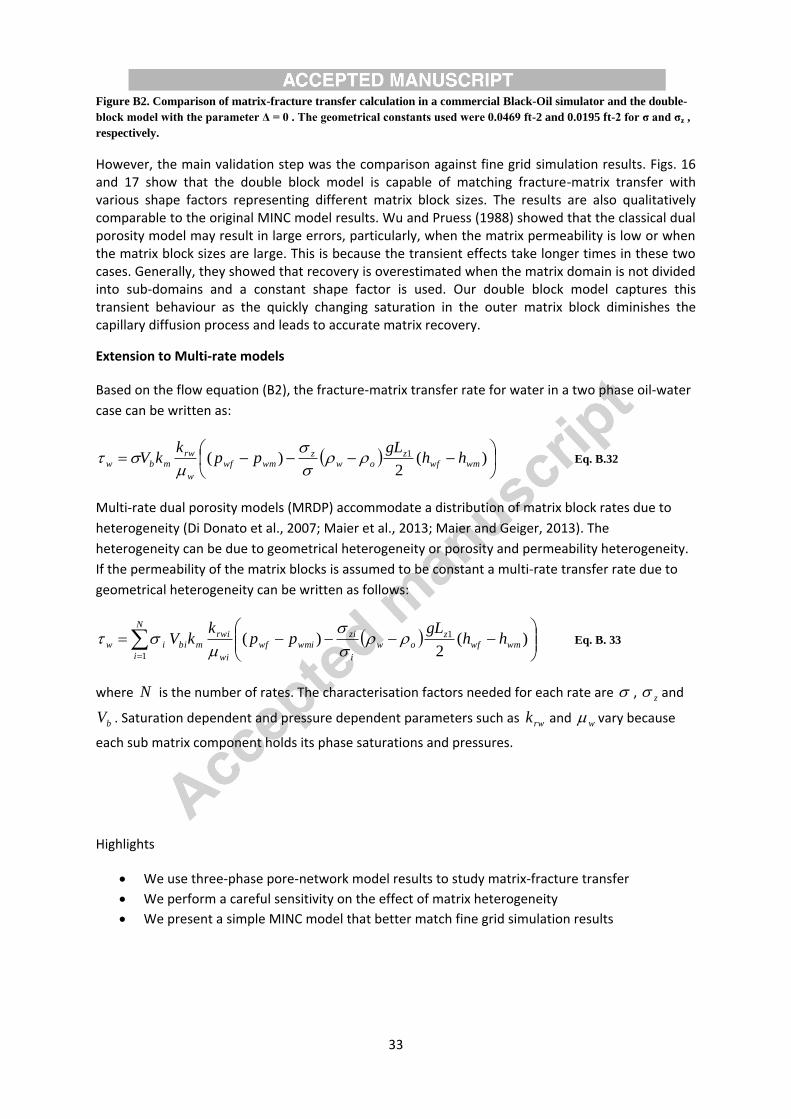
33
Figure B2. Comparison of matrix-fracture transfer calculation in a commercial Black-Oil simulator and the double-
block model with the parameter Δ = 0 . The geometrical constants used were 0.0469 ft-2 and 0.0195 ft-2 for σ and σz ,
respectively.
However, the main validation step was the comparison against fine grid simulation results. Figs. 16 and 17 show that the double block model is capable of matching fracture-matrix transfer with various shape factors representing different matrix block sizes. The results are also qualitatively comparable to the original MINC model results. Wu and Pruess (1988) showed that the classical dual porosity model may result in large errors, particularly, when the matrix permeability is low or when the matrix block sizes are large. This is because the transient effects take longer times in these two cases. Generally, they showed that recovery is overestimated when the matrix domain is not divided into sub-domains and a constant shape factor is used. Our double block model captures this transient behaviour as the quickly changing saturation in the outer matrix block diminishes the capillary diffusion process and leads to accurate matrix recovery.
Extension to Multi-rate models
Based on the flow equation (B2), the fracture-matrix transfer rate for water in a two phase oil-water
case can be written as:
)(
2)( 1
wmwfz
owz
wmwf
w
rw
mbw hhgL
ppk
kV
Eq. B.32
Multi-rate dual porosity models (MRDP) accommodate a distribution of matrix block rates due to
heterogeneity (Di Donato et al., 2007; Maier et al., 2013; Maier and Geiger, 2013). The
heterogeneity can be due to geometrical heterogeneity or porosity and permeability heterogeneity.
If the permeability of the matrix blocks is assumed to be constant a multi-rate transfer rate due to
geometrical heterogeneity can be written as follows:
N
i
wmwfz
ow
i
zi
wmiwf
wi
rwi
mbiiw hhgL
ppk
kV1
1 )(2
)(
Eq. B. 33
where N is the number of rates. The characterisation factors needed for each rate are , z and
bV . Saturation dependent and pressure dependent parameters such as rwk and w vary because
each sub matrix component holds its phase saturations and pressures.
Highlights
We use three-phase pore-network model results to study matrix-fracture transfer
We perform a careful sensitivity on the effect of matrix heterogeneity
We present a simple MINC model that better match fine grid simulation results