Embed Size (px)
Citation preview
1
FRACTURE INVESTIGATION IN FRP PLATE DEBONDING
G.X. Guan1 and C.J. Burgoyne1 1 Department of Engineering, University of Cambridge, UK.
Email: [email protected] ABSTRACT RC beams retrofitted with FRP plates commonly fail in a sudden manner by premature debonding before the target flexural capacity. The plate debonding is clearly a fracture event that is initiated from the inevitable flaws in the concrete cover layer between the FRP plate and the steel level. In FRP retrofitted RC beams, these small flaws can trigger structure collapse, so should be investigated in detail. There is a lack of direct fracture observation for the plate debonding failure that occurs in the concrete cover layer. This paper presents experimental observations of plate debonding fracture propagation in a plated double-cantilever beam specimen, which is designed to simulate the concrete cover layer. Using non-destructive image correlation techniques, which obtain real strain field distributions from digital photographs, it is possible to provide estimates for the fracture energy related to FRP plate debonding. The test setup is first explained, followed by a brief introduction to the image correlation technique used for strain observation. The detailed debonding fracture propagation is then presented, and finally a method of estimating the fracture energy associated with FRP plate debonding is proposed. KEYWORDS Debonding fracture, plated double-cantilever beam, image correlation technique, strain field, fracture process zone, fracture energy. INTRODUCTION Debonding is inherently the fracture of concrete in the cover layer, and its studyany review should start from concrete fracture studies. Concrete fracture has been studied for half a century, but is still considered difficult and debatable. A main objective of concrete fracture study is to determine the concrete fracture energy Gf and the factors that affect it. Various tests, e.g. three-point-bend (TPB) test and wedge-split test, have been used to determine Gf. The cohesive crack model by Hillerborg (1985) and the crack band model by Bazant & Oh (1983, 1985), together with various modifications, are commonly used to interpret the test results and identify the influencing factors. It is now well recognised that Gf depends on the aggregate properties and varies with fracture propagation, however, there is little understanding of the exact variation of Gf . Furthermore, the debates on the most fundamental concepts in concrete fracture such as size of fracture process zone (FPZ) and fracture modes are far from resolved. As a result, except for the concrete Gf value obtained from centre-notched TPB test for relatively small specimens, which is claimed to obtain a Mode I Gf (commonly around 0.07-0.2 N/mm, Bazant & Becq-Giraudon (2002)), there are no agreed Gf values for concrete. Meanwhile, the fracture approach using an energy criterion has been widely used in debonding studies such as Guan & Burgoyne (2012), Achintha & Burgoyne (2008), Gunes et al. (2009), Carpinteri et al. (2009), and Rabinovitch (2004), where a constant Gf value from conventional Mode I concrete fracture, around 0.062~0.15 N/mm, was used for debonding consideration for beams of different size, and showed good agreement with experiments. Is this just a coincidence ? Debonding fracture has been considered as Mode I (peel-off), II (slip-off) and “mixed” by different researchers, and the corresponding Gf is found to be very different using different test setups. A majority of the literature has claimed that debonding fracture is mode II, and uses a bond slip test to determine the fracture energy, e.g. Carloni & Subramaniam (2010), and Mazzotti et al. (2008). This Mode II fracture energy ranges from 0.5~2 N/mm and is much greater than the value used in above. More interestingly, the higher Gf value has not been used, even by the works that claim debonding is a Mode II fracture, e.g. in Gunes et al. (2009), Carpinteri et al. (2009), and Rabinovitch (2004). Very limited peel-off tests could be found for debonding fracture as Mode I and mixed mode. Plate peel-off tests were used to obtain a Mode I or mixed mode Gf ranging from 0.05~0.3
2
N/mm, such as in Karbhari & Engineer (1996), Lyons et al. (2002) and Tuakta & Buyukozturk (2011). Qiao & Wu (2004) and Lau & Buyukozturk (2010) conducted modified centre-notched TPB tests to determine the Mode I peel-off debonding fracture energy, giving values in the range of 0.05~0.15 N/mm in. The debonding fracture energy values from Mode I and mixed mode TPB or peel-off tests are similar, and close to the corresponding fracture energy for bulk concrete, which is much lower than the Mode II debonding energy from bond-slip tests. It is evident from the fracture energy that debonding is similar to an opening fracture rather than a slip-off fracture. Furthermore, the debonding phenomenon is peel-off rather than slip-off. Since there exist limited test datas for the peel-off debonding fracture energy, it was necessary to conduct debonding fracture tests to further study the real debonding fracture resistance. WEDGE-SPLIT PEEL-OFF TEST A double-cantilever beam (DCB) specimen was designed to simulate the concrete cover layer in size and shape, as shown in Fig.1(a), to study debonding: CFRP plates were attached to the top and bottom sides of the specimen and a pre-notch was made in the concrete casting to simulate the inevitable flaws in concrete. The cantilever arms were shaped to provide space for installation of the loading clamp, and ∅4 steel bars were placed inside the arms to prevent arm failure. The specimen would be loaded with a wedge, as for the conventional wedge-split concrete fracture test. With this setup, the specimen was easy to prepare, and the peel-off load was exerted via compression, which is easier to control than tension. A digital image correlation (DIC) technique was used to investigate the crack propagation and to construct a strain field for the debonding fracture. The DIC technique uses photos taken before loading, and at different loading stages. The loading photos are compared with the photo before loading to identify the changes (cracks and strains). SThere exist some commercial DIC techniques are commonly sold as part of complete camera systems, but they are expensive and the codes are hidden, and considered unsuitable for this work. The DIC technique used here was developed by the authors with special features for interface crack investigation, using a low-cost common commercial digital camera system (Nikon D80 having 3872 × 2592 pixels, and Sigma 150 mm 2.8f macro lens). 16-bit raw digital images wereas used for this inspection, withand around 30~40 raw pixels were zoomed into a 1 mm length. A template of 80×80 pixels was used for tracing, and the interpolation in the correlation space was used to determine the sub-pixel position. This DIC technique can easily be made available in conventional structural labs.
Figure 1 Wedge-split test for DCB specimen with DIC techniques.
Fig.1 (b) & (c) show the test setup: A roller bearing system at the clamp head is used to transfer the wedge compression into the splitting load, while the bottom of the specimen is supported on a roller to allow horizontal sliding during splitting. A loading rate of 1-5 mm per minute was used. The region around the pre-notched tip is inspected using DIC techniques. The area to be photographed was given random patterns by attaching fine sands or pen sketching to improve specimen texture. Concrete fracture energy is affected by the aggregate type: here concrete with maximum aggregate of 10 and 20 mm was used;, and the detailed material properties are in Table 1.
3
Table 1 Material properties for the test
Concrete (kg/m3) Max. Agg 10 mm Max. Agg 20 mm Adhesive Aggregate (10 mm) 840 208
Sikadur® 30 (cement like, thick, and hard)
Aggregate (20 mm) − 764 Fine 746 617 Cement 485 425 Water 228 185
Plate: Sika® CarboDur® S1012 (CFRP plate)
Cube Strength (MPa) 50.9 52.1 Cylinder Strength (MPa) 38.7 37.7 Cylinder Split Strength (MPa) 3.63 3.52
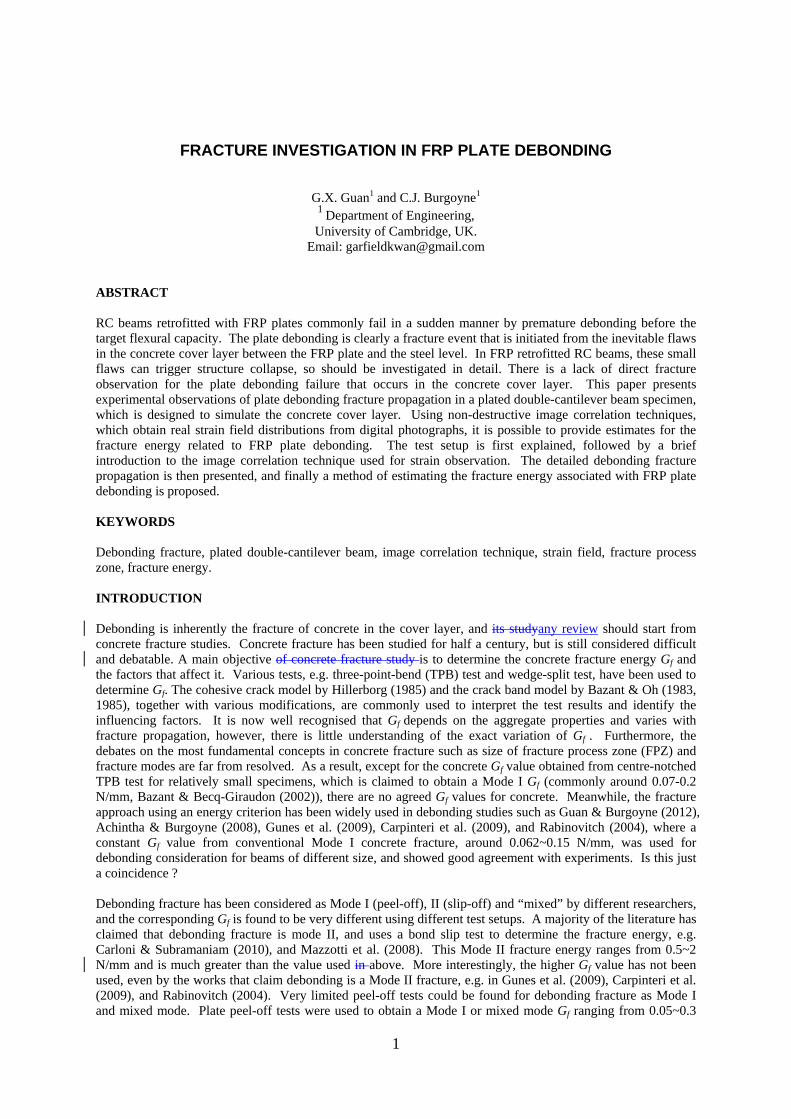
Typical Failure of Specimens A typical failure of a DCB specimen is shown in Fig. 2: a cross-crack in the transverse direction occurs first starting from the pre-notch tip; after the cross-crack reaches the edge, a debonding crack propagates in the longitudinal direction along the concrete-plate interface; a thin layer of concrete is commonly found attached to the debonded plate, which indicates that the failure is in concrete. This is similar to the behaviour in a real RC beam, where debonding initiates from shear-flexural cracks similar to the cross-cracks here.
Figure 2 Typical failure of the DCB specimen
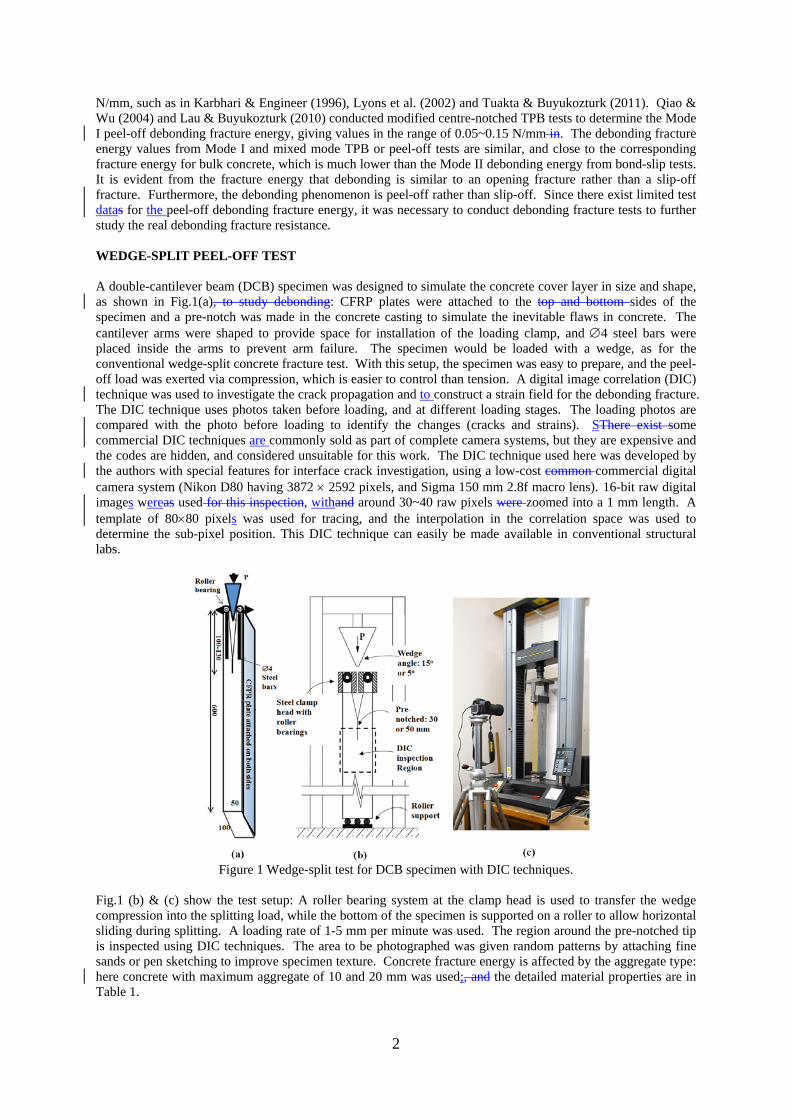
This cracking manner does not follow the pre-notched direction and is different from conventional wedge-split and DCB tests in concrete fracture studies, as shown in Fig. 3(a). In these conventional tests, the crack Cl would develop while Ch would not. From a fracture mechanics point of view, a crack would develop along the direction with least resistance. In detailed fracture studies, the concrete crack resistance is affected by the confinement condition. The confinement potential for crack Ch is made purposely much higher, and much more material would contribute to the fracture resistance for the three conventional specimens. In the tapered DCB specimen especially, it is designed with the shape and size to ensure the Cl crack propagation.
Figure 3 Failure in various concrete fracture tests
However, it this is not the case for thein debonding crack, shown in Fig. 3(b). A centred Cl along the pre-notched direction does not develop, since there is more confinement. Instead, Ch develops followed by the debonding crack Cl. In this manner, both the development of the cross-crack and the debonding crack follow the direction with least resistance. This is similar to real debonding where flexural and shear cracks are usually found in the cover layer before debonding. In order to study only the debonding crack a timber-head DCB
4
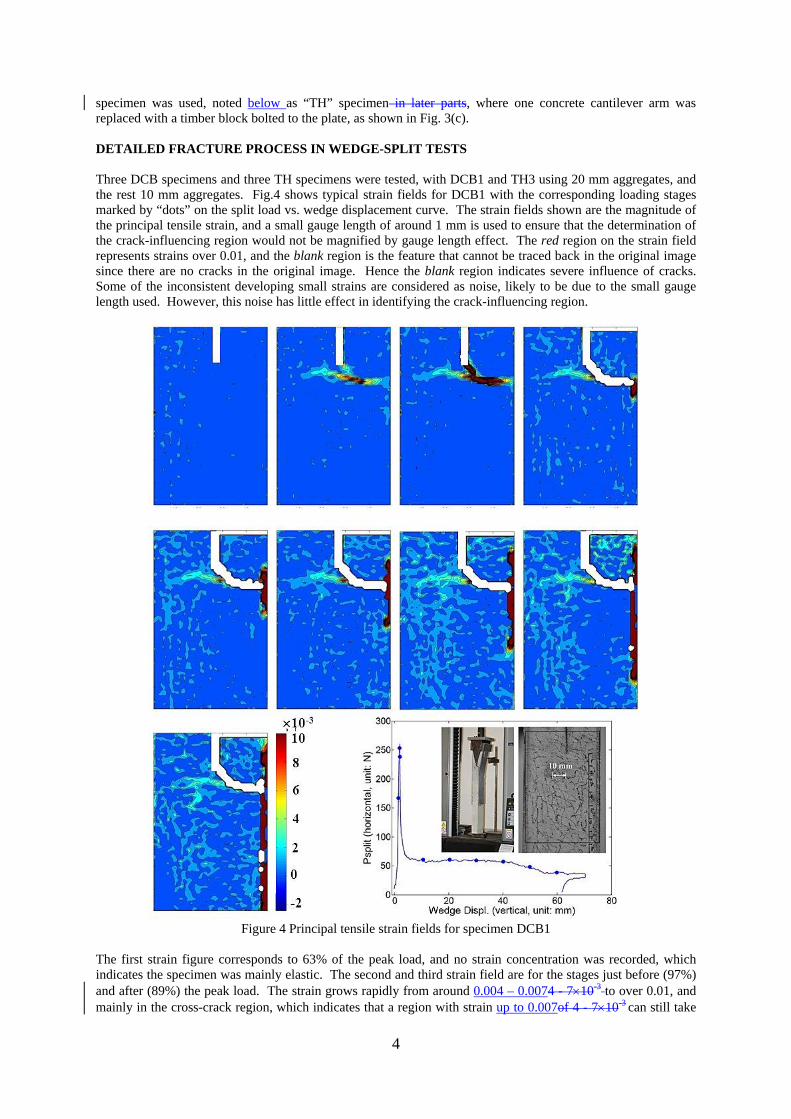
specimen was used, noted below as “TH” specimen in later parts, where one concrete cantilever arm was replaced with a timber block bolted to the plate, as shown in Fig. 3(c). DETAILED FRACTURE PROCESS IN WEDGE-SPLIT TESTS Three DCB specimens and three TH specimens were tested, with DCB1 and TH3 using 20 mm aggregates, and the rest 10 mm aggregates. Fig.4 shows typical strain fields for DCB1 with the corresponding loading stages marked by “dots” on the split load vs. wedge displacement curve. The strain fields shown are the magnitude of the principal tensile strain, and a small gauge length of around 1 mm is used to ensure that the determination of the crack-influencing region would not be magnified by gauge length effect. The red region on the strain field represents strains over 0.01, and the blank region is the feature that cannot be traced back in the original image since there are no cracks in the original image. Hence the blank region indicates severe influence of cracks. Some of the inconsistent developing small strains are considered as noise, likely to be due to the small gauge length used. However, this noise has little effect in identifying the crack-influencing region.
Figure 4 Principal tensile strain fields for specimen DCB1
The first strain figure corresponds to 63% of the peak load, and no strain concentration was recorded, which indicates the specimen was mainly elastic. The second and third strain field are for the stages just before (97%) and after (89%) the peak load. The strain grows rapidly from around 0.004 – 0.0074 - 7×10⁻³ to over 0.01, and mainly in the cross-crack region, which indicates that a region with strain up to 0.007of 4 - 7×10⁻³
can still take
5
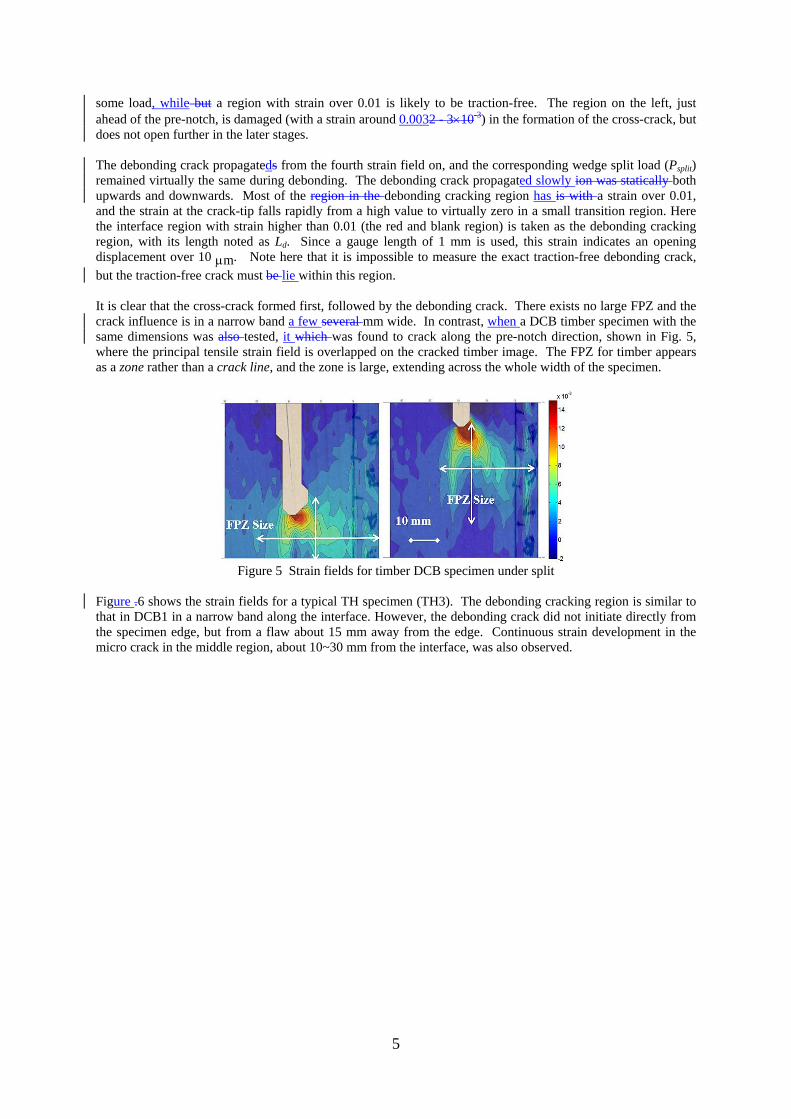
some load, while but a region with strain over 0.01 is likely to be traction-free. The region on the left, just ahead of the pre-notch, is damaged (with a strain around 0.0032 - 3×10⁻³) in the formation of the cross-crack, but does not open further in the later stages. The debonding crack propagateds from the fourth strain field on, and the corresponding wedge split load (Psplit) remained virtually the same during debonding. The debonding crack propagated slowly ion was statically both upwards and downwards. Most of the region in the debonding cracking region has is with a strain over 0.01, and the strain at the crack-tip falls rapidly from a high value to virtually zero in a small transition region. Here the interface region with strain higher than 0.01 (the red and blank region) is taken as the debonding cracking region, with its length noted as Ld. Since a gauge length of 1 mm is used, this strain indicates an opening displacement over 10 μm. Note here that it is impossible to measure the exact traction-free debonding crack, but the traction-free crack must be lie within this region. It is clear that the cross-crack formed first, followed by the debonding crack. There exists no large FPZ and the crack influence is in a narrow band a few several mm wide. In contrast, when a DCB timber specimen with the same dimensions was also tested, it which was found to crack along the pre-notch direction, shown in Fig. 5, where the principal tensile strain field is overlapped on the cracked timber image. The FPZ for timber appears as a zone rather than a crack line, and the zone is large, extending across the whole width of the specimen.
Figure 5 Strain fields for timber DCB specimen under split
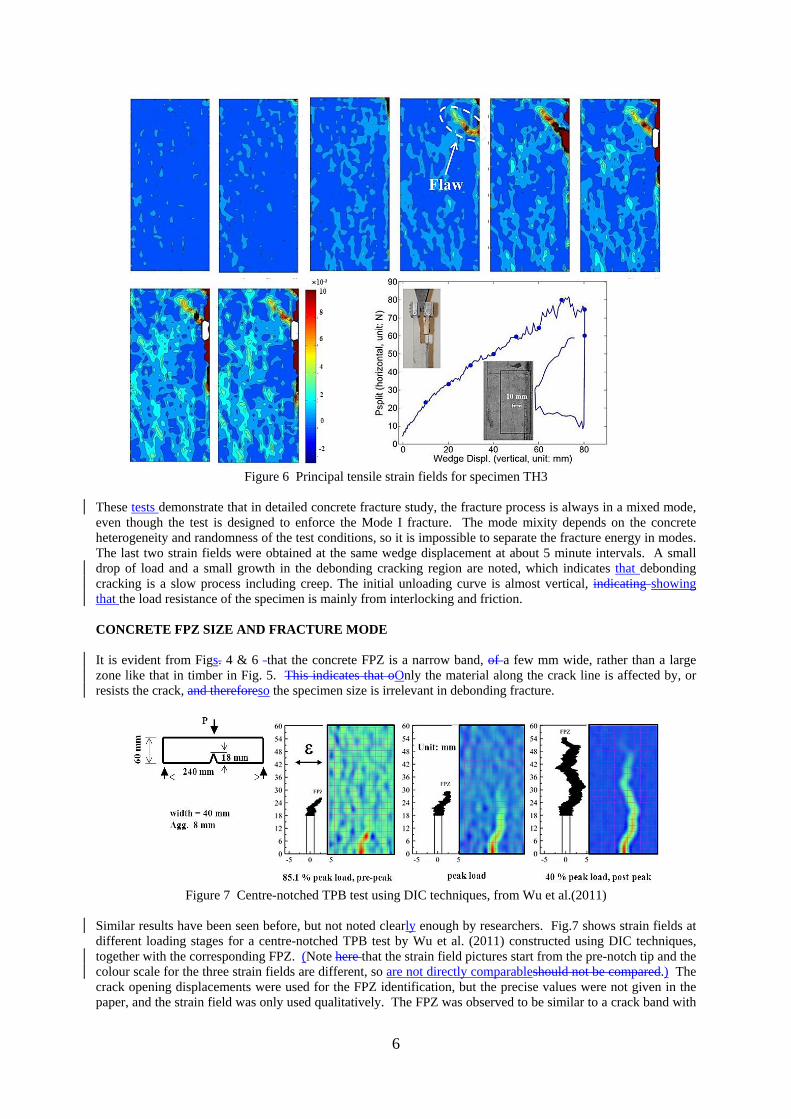
Figure .6 shows the strain fields for a typical TH specimen (TH3). The debonding cracking region is similar to that in DCB1 in a narrow band along the interface. However, the debonding crack did not initiate directly from the specimen edge, but from a flaw about 15 mm away from the edge. Continuous strain development in the micro crack in the middle region, about 10~30 mm from the interface, was also observed.
6
Figure 6 Principal tensile strain fields for specimen TH3
These tests demonstrate that in detailed concrete fracture study, the fracture process is always in a mixed mode, even though the test is designed to enforce the Mode I fracture. The mode mixity depends on the concrete heterogeneity and randomness of the test conditions, so it is impossible to separate the fracture energy in modes. The last two strain fields were obtained at the same wedge displacement at about 5 minute intervals. A small drop of load and a small growth in the debonding cracking region are noted, which indicates that debonding cracking is a slow process including creep. The initial unloading curve is almost vertical, indicating showing that the load resistance of the specimen is mainly from interlocking and friction. CONCRETE FPZ SIZE AND FRACTURE MODE It is evident from Figs. 4 & 6 that the concrete FPZ is a narrow band, of a few mm wide, rather than a large zone like that in timber in Fig. 5. This indicates that oOnly the material along the crack line is affected by, or resists the crack, and thereforeso the specimen size is irrelevant in debonding fracture.
Figure 7 Centre-notched TPB test using DIC techniques, from Wu et al.(2011)
Similar results have been seen before, but not noted clearly enough by researchers. Fig.7 shows strain fields at different loading stages for a centre-notched TPB test by Wu et al. (2011) constructed using DIC techniques, together with the corresponding FPZ. (Note here that the strain field pictures start from the pre-notch tip and the colour scale for the three strain fields are different, so are not directly comparableshould not be compared.) The crack opening displacements were used for the FPZ identification, but the precise values were not given in the paper, and the strain field was only used qualitatively. The FPZ was observed to be similar to a crack band with
7
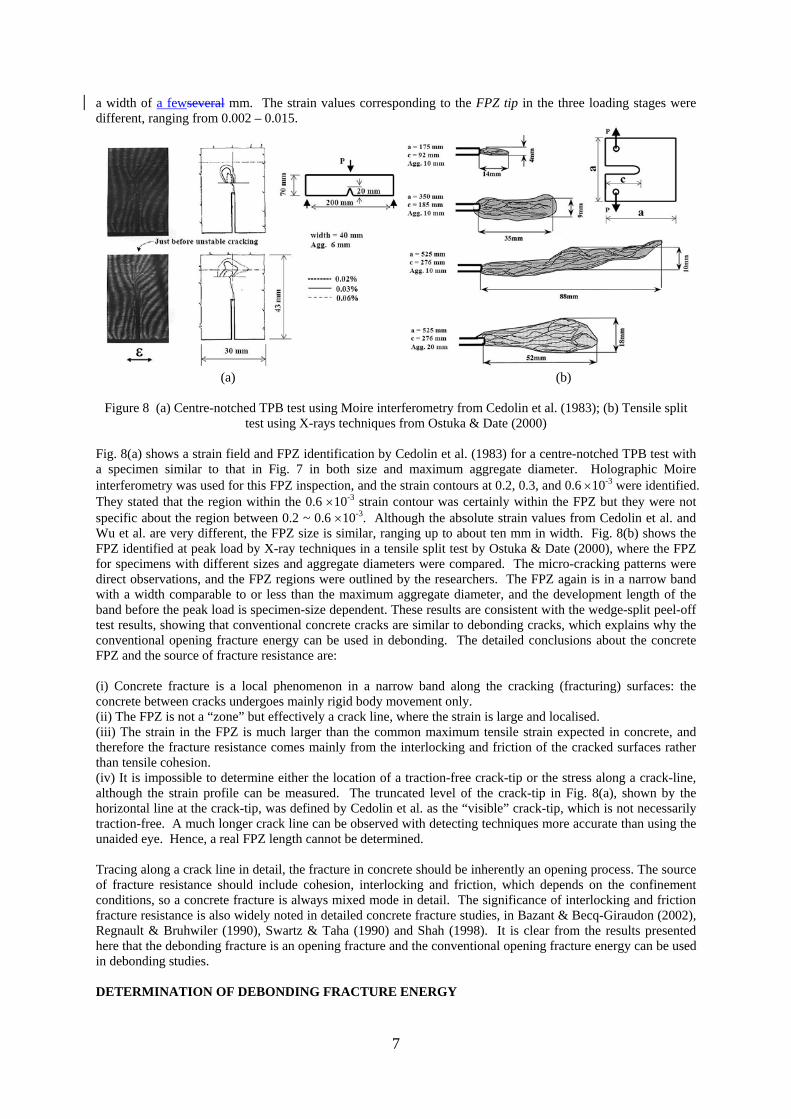
a width of a fewseveral mm. The strain values corresponding to the FPZ tip in the three loading stages were different, ranging from 0.002 – 0.015.
(a) (b)
Figure 8 (a) Centre-notched TPB test using Moire interferometry from Cedolin et al. (1983); (b) Tensile split
test using X-rays techniques from Ostuka & Date (2000) Fig. 8(a) shows a strain field and FPZ identification by Cedolin et al. (1983) for a centre-notched TPB test with a specimen similar to that in Fig. 7 in both size and maximum aggregate diameter. Holographic Moire interferometry was used for this FPZ inspection, and the strain contours at 0.2, 0.3, and 0.6 ×10⁻³ were identified. They stated that the region within the 0.6 ×10⁻³ strain contour was certainly within the FPZ but they were not specific about the region between 0.2 ~ 0.6 ×10⁻³. Although the absolute strain values from Cedolin et al. and Wu et al. are very different, the FPZ size is similar, ranging up to about ten mm in width. Fig. 8(b) shows the FPZ identified at peak load by X-ray techniques in a tensile split test by Ostuka & Date (2000), where the FPZ for specimens with different sizes and aggregate diameters were compared. The micro-cracking patterns were direct observations, and the FPZ regions were outlined by the researchers. The FPZ again is in a narrow band with a width comparable to or less than the maximum aggregate diameter, and the development length of the band before the peak load is specimen-size dependent. These results are consistent with the wedge-split peel-off test results, showing that conventional concrete cracks are similar to debonding cracks, which explains why the conventional opening fracture energy can be used in debonding. The detailed conclusions about the concrete FPZ and the source of fracture resistance are: (i) Concrete fracture is a local phenomenon in a narrow band along the cracking (fracturing) surfaces: the concrete between cracks undergoes mainly rigid body movement only. (ii) The FPZ is not a “zone” but effectively a crack line, where the strain is large and localised. (iii) The strain in the FPZ is much larger than the common maximum tensile strain expected in concrete, and therefore the fracture resistance comes mainly from the interlocking and friction of the cracked surfaces rather than tensile cohesion. (iv) It is impossible to determine either the location of a traction-free crack-tip or the stress along a crack-line, although the strain profile can be measured. The truncated level of the crack-tip in Fig. 8(a), shown by the horizontal line at the crack-tip, was defined by Cedolin et al. as the “visible” crack-tip, which is not necessarily traction-free. A much longer crack line can be observed with detecting techniques more accurate than using the unaided eye. Hence, a real FPZ length cannot be determined. Tracing along a crack line in detail, the fracture in concrete should be inherently an opening process. The source of fracture resistance should include cohesion, interlocking and friction, which depends on the confinement conditions, so a concrete fracture is always mixed mode in detail. The significance of interlocking and friction fracture resistance is also widely noted in detailed concrete fracture studies, in Bazant & Becq-Giraudon (2002), Regnault & Bruhwiler (1990), Swartz & Taha (1990) and Shah (1998). It is clear from the results presented here that the debonding fracture is an opening fracture and the conventional opening fracture energy can be used in debonding studies. DETERMINATION OF DEBONDING FRACTURE ENERGY
8
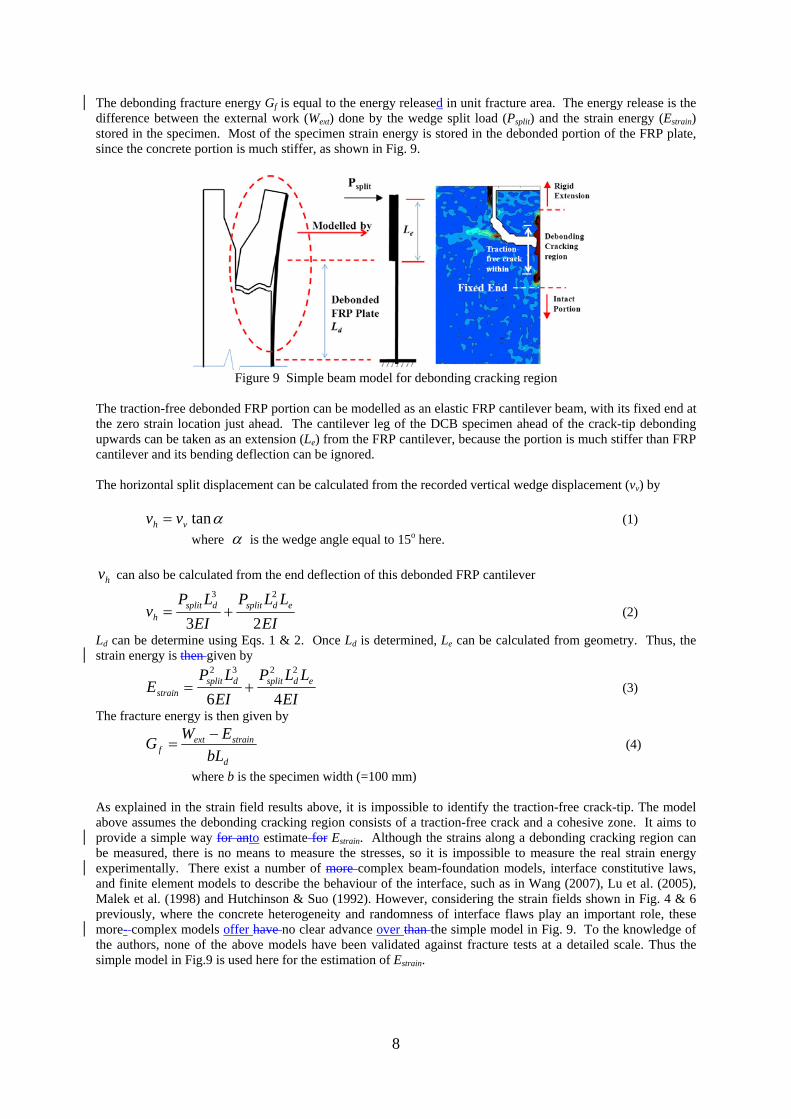
The debonding fracture energy Gf is equal to the energy released in unit fracture area. The energy release is the difference between the external work (Wext) done by the wedge split load (Psplit) and the strain energy (Estrain) stored in the specimen. Most of the specimen strain energy is stored in the debonded portion of the FRP plate, since the concrete portion is much stiffer, as shown in Fig. 9.
Figure 9 Simple beam model for debonding cracking region
The traction-free debonded FRP portion can be modelled as an elastic FRP cantilever beam, with its fixed end at the zero strain location just ahead. The cantilever leg of the DCB specimen ahead of the crack-tip debonding upwards can be taken as an extension (Le) from the FRP cantilever, because the portion is much stiffer than FRP cantilever and its bending deflection can be ignored. The horizontal split displacement can be calculated from the recorded vertical wedge displacement (vv) by
αtanvh vv = (1) where α is the wedge angle equal to 15o here.
hv can also be calculated from the end deflection of this debonded FRP cantilever
EILLP
EILP
v edsplitdsplith 23
23
+= (2)
Ld can be determine using Eqs. 1 & 2. Once Ld is determined, Le can be calculated from geometry. Thus, the strain energy is then given by
EILLP
EILP
E edsplitdsplitstrain 46
2232
+= (3)
The fracture energy is then given by
d
strainextf bL
EWG −= (4)
where b is the specimen width (=100 mm)
As explained in the strain field results above, it is impossible to identify the traction-free crack-tip. The model above assumes the debonding cracking region consists of a traction-free crack and a cohesive zone. It aims to provide a simple way for anto estimate for Estrain. Although the strains along a debonding cracking region can be measured, there is no means to measure the stresses, so it is impossible to measure the real strain energy experimentally. There exist a number of more complex beam-foundation models, interface constitutive laws, and finite element models to describe the behaviour of the interface, such as in Wang (2007), Lu et al. (2005), Malek et al. (1998) and Hutchinson & Suo (1992). However, considering the strain fields shown in Fig. 4 & 6 previously, where the concrete heterogeneity and randomness of interface flaws play an important role, these more- complex models offer have no clear advance over than the simple model in Fig. 9. To the knowledge of the authors, none of the above models have been validated against fracture tests at a detailed scale. Thus the simple model in Fig.9 is used here for the estimation of Estrain.
9
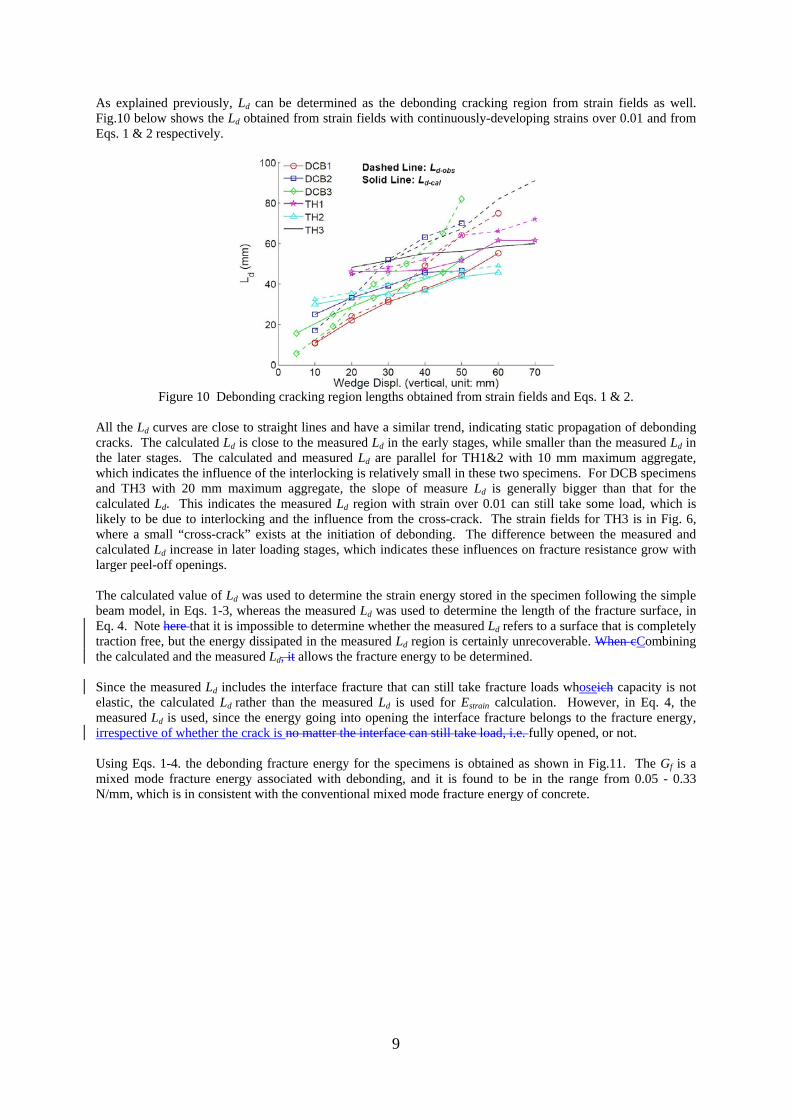
As explained previously, Ld can be determined as the debonding cracking region from strain fields as well. Fig.10 below shows the Ld obtained from strain fields with continuously-developing strains over 0.01 and from Eqs. 1 & 2 respectively.
Figure 10 Debonding cracking region lengths obtained from strain fields and Eqs. 1 & 2.
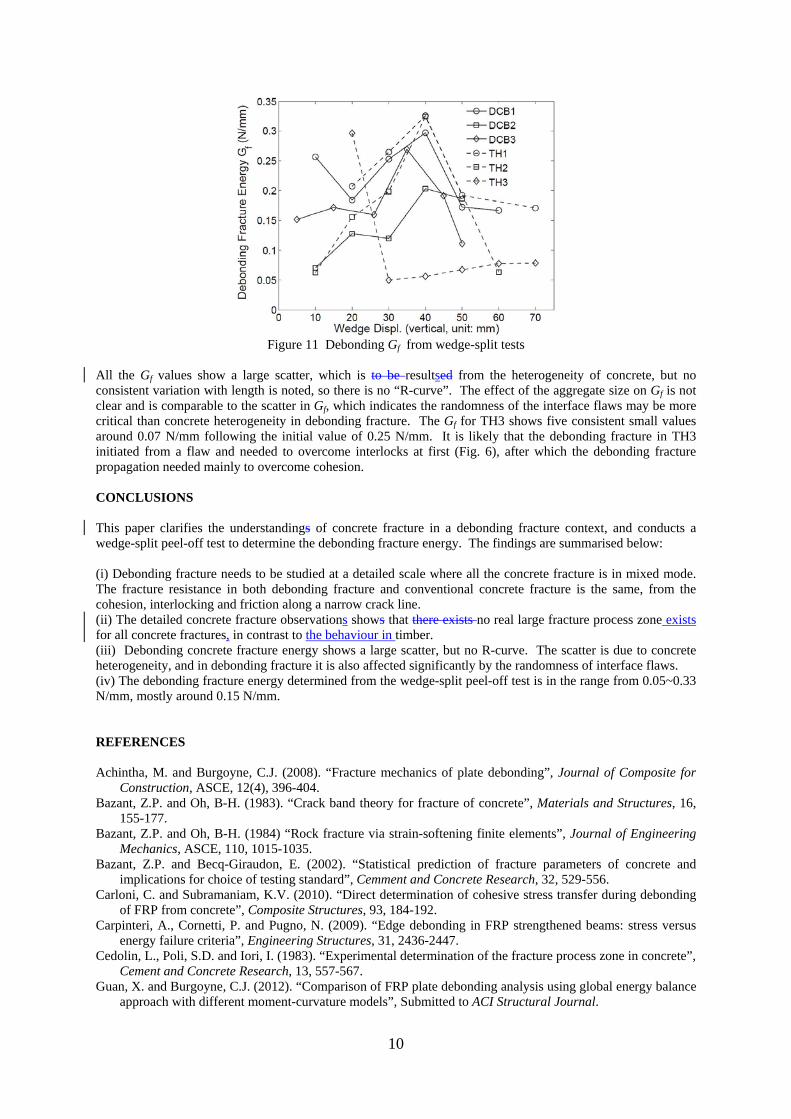
All the Ld curves are close to straight lines and have a similar trend, indicating static propagation of debonding cracks. The calculated Ld is close to the measured Ld in the early stages, while smaller than the measured Ld in the later stages. The calculated and measured Ld are parallel for TH1&2 with 10 mm maximum aggregate, which indicates the influence of the interlocking is relatively small in these two specimens. For DCB specimens and TH3 with 20 mm maximum aggregate, the slope of measure Ld is generally bigger than that for the calculated Ld. This indicates the measured Ld region with strain over 0.01 can still take some load, which is likely to be due to interlocking and the influence from the cross-crack. The strain fields for TH3 is in Fig. 6, where a small “cross-crack” exists at the initiation of debonding. The difference between the measured and calculated Ld increase in later loading stages, which indicates these influences on fracture resistance grow with larger peel-off openings. The calculated value of Ld was used to determine the strain energy stored in the specimen following the simple beam model, in Eqs. 1-3, whereas the measured Ld was used to determine the length of the fracture surface, in Eq. 4. Note here that it is impossible to determine whether the measured Ld refers to a surface that is completely traction free, but the energy dissipated in the measured Ld region is certainly unrecoverable. When cCombining the calculated and the measured Ld, it allows the fracture energy to be determined. Since the measured Ld includes the interface fracture that can still take fracture loads whoseich capacity is not elastic, the calculated Ld rather than the measured Ld is used for Estrain calculation. However, in Eq. 4, the measured Ld is used, since the energy going into opening the interface fracture belongs to the fracture energy, irrespective of whether the crack is no matter the interface can still take load, i.e. fully opened, or not. Using Eqs. 1-4. the debonding fracture energy for the specimens is obtained as shown in Fig.11. The Gf is a mixed mode fracture energy associated with debonding, and it is found to be in the range from 0.05 - 0.33 N/mm, which is in consistent with the conventional mixed mode fracture energy of concrete.
10
Figure 11 Debonding Gf from wedge-split tests
All the Gf values show a large scatter, which is to be resultsed from the heterogeneity of concrete, but no consistent variation with length is noted, so there is no “R-curve”. The effect of the aggregate size on Gf is not clear and is comparable to the scatter in Gf, which indicates the randomness of the interface flaws may be more critical than concrete heterogeneity in debonding fracture. The Gf for TH3 shows five consistent small values around 0.07 N/mm following the initial value of 0.25 N/mm. It is likely that the debonding fracture in TH3 initiated from a flaw and needed to overcome interlocks at first (Fig. 6), after which the debonding fracture propagation needed mainly to overcome cohesion. CONCLUSIONS This paper clarifies the understandings of concrete fracture in a debonding fracture context, and conducts a wedge-split peel-off test to determine the debonding fracture energy. The findings are summarised below: (i) Debonding fracture needs to be studied at a detailed scale where all the concrete fracture is in mixed mode. The fracture resistance in both debonding fracture and conventional concrete fracture is the same, from the cohesion, interlocking and friction along a narrow crack line. (ii) The detailed concrete fracture observations shows that there exists no real large fracture process zone exists for all concrete fractures, in contrast to the behaviour in timber. (iii) Debonding concrete fracture energy shows a large scatter, but no R-curve. The scatter is due to concrete heterogeneity, and in debonding fracture it is also affected significantly by the randomness of interface flaws. (iv) The debonding fracture energy determined from the wedge-split peel-off test is in the range from 0.05~0.33 N/mm, mostly around 0.15 N/mm. REFERENCES Achintha, M. and Burgoyne, C.J. (2008). “Fracture mechanics of plate debonding”, Journal of Composite for
Construction, ASCE, 12(4), 396-404. Bazant, Z.P. and Oh, B-H. (1983). “Crack band theory for fracture of concrete”, Materials and Structures, 16,
155-177. Bazant, Z.P. and Oh, B-H. (1984) “Rock fracture via strain-softening finite elements”, Journal of Engineering
Mechanics, ASCE, 110, 1015-1035. Bazant, Z.P. and Becq-Giraudon, E. (2002). “Statistical prediction of fracture parameters of concrete and
implications for choice of testing standard”, Cemment and Concrete Research, 32, 529-556. Carloni, C. and Subramaniam, K.V. (2010). “Direct determination of cohesive stress transfer during debonding
of FRP from concrete”, Composite Structures, 93, 184-192. Carpinteri, A., Cornetti, P. and Pugno, N. (2009). “Edge debonding in FRP strengthened beams: stress versus
energy failure criteria”, Engineering Structures, 31, 2436-2447. Cedolin, L., Poli, S.D. and Iori, I. (1983). “Experimental determination of the fracture process zone in concrete”,
Cement and Concrete Research, 13, 557-567. Guan, X. and Burgoyne, C.J. (2012). “Comparison of FRP plate debonding analysis using global energy balance
approach with different moment-curvature models”, Submitted to ACI Structural Journal.
11
Gunes, O., Buyukozturk, O. and Karaca, E. (2009). “A fracture-based model for FRP debonding in strengthened beams”, Engineering Fracture Mechanics, 76,1897-1909.
Hillerborg, A. (1985). “The theoretical basis of a method to determine the fracture energy Gf of concrete”, Materials and Structures, 18(4), 291-296.
Hutchinson, J.W. and Suo, Z. (1992). “Mixed mode cracking in layered materials”, Advances in Applied Mechanics, 29, 163–199.
Karbhari, V.M. and Engineer, M. (1996). Investigation of bond between concrete and composites: use of a peel test. Journal of Reinforced Plastics and Composites, 15(2), 208-227.
Lau, D. and Buyukozturk, O. (2010). “Fracture characterization of concrete/epoxy interface affected by moisture”, Mechanics of Materials, 42, 1031-1042.
Lu, X.Z., Ye, L.P., Teng, J.G. and Jiang, J.J. (2005). “Meso-scale finite element model for FRP sheets/plates bonded to concrete”, Engineering Structures, 27(4), 564–575
Lyons, J., Laub, D., Giurgiutiu, V., Petrou, M. and Salem, H. (2002). “Effect of hygrothermal aging on the fracture of composite overlays on concrete”, Journal of Reinforced Plastics and Composites, 21, 293–309.
Malek, A., Saadatmanesh, H., and Ehsani, M. (1998). “Prediction of failure load of R/C beams strengthened with FRP plate due to stress concentration at the plate end”, ACI Structure Journal, 95,142-152.
Mazzotti, C., Savoia, M. and Ferracuti B. (2008). “An experimental study on delamination of FRP plates bonded to concrete”, Construction and Building Materials, 22, 1409-1421.
Ostuka, K. and Date, H. (2000). “Fracture process zone in concrete tension specimen”, Engineering Fracture Mechanics, 65, 111-131.
Qiao, P.Z. and Xu, Y.W. (2004). “Evaluation of the fracture energy of composite-concrete bonded interfaces using three-point bend tests”, Journal of Composite Construction, 8 (3), 352–359.
Rabinovitch, O. (2004). “Fracture-mechanics failure criteria for RC beams strengthened with FRP strips – a simplified approach”, Composite Structures, 64, 479-492.
Regnault, P.H. and Bruhwiler, E. (1990). “Holographic interferometry for the determination of fracture process zone in concrete”, Engineering Fracture Mechanics, 33, 29-38.
Shah, S.P. (1988). “Fracture toughness of cement-based materials”, Materials and Structures, 21, 145-50. Swartz, S.E. and Taha, N.M. (1990). “Mixed mode crack propagation and fracture in concrete”, Engineering
Fracture Mechanics, 35, 137-144. Tuakta, C. and Buyukozturk, O. (2011). “Deterioration of FRP/concrete bond system under variable moisture
conditions quantified by fracture mechanics”, Composites Part B: Engineering, 42, 145-154. Wang, J. (2007). “Cohesive zone model of FRP-concrete interface debonding under mixed-mode loading”,
International Journal of Solids and Structures, 44, 6551-6568. Wu, Z., Rong, H., Zheng, J., Xu, F. and Dong, W. (2011). “An experimental investigation on the FPZ properties
in concrete using digital image correlation techniques”, Engineering Fracture Mechanics, 78, 2978-2990.