Embed Size (px)
Citation preview
FRACTAL DIMENSION IMAGES FROM SAR IMAGES
Daniele Riccio1, Gerardo Di Martino1, Antonio Iodice1, Giuseppe Ruello1, Ivana Zinno2
1Università di Napoli Federico II - DIETI, Naples, Italy
2 Istituto per il Rilevamento Elettromagnetico dell’Ambiente, CNR, Naples, Italy
ABSTRACT In this paper we present the description of the image-processing issues underlying the estimation of the fractal dimension of natural surfaces from their corresponding synthetic aperture radar images. The choice of the spectral-estimation method is a key issue, due to the special nature of the problem at hand. In particular, fractal spectra present well-known leakage problems; moreover, high-variance issues can arise, due to the limited sample size dictated by the local nature of the problem. Meaningful examples of fractal dimension images are provided and discussed.
Index Terms— SAR, fractals, spectral estimation
1. INTRODUCTION Fractal models are frequently adopted for the description of rough natural surfaces, since they are able to take into account specific features of this kind of surfaces, and, in particular, their self-similar (or self-affine) behavior [1]. The fractal dimension D is a mathematical parameter with a clear geophysical meaning describing the roughness of a wide class of natural surfaces. Its use is widespread in many scientific communities, and in particular among geologists, geophysicists, mathematicians, astronomers and engineers. The knowledge of the fractal dimension can be exploited for the characterization of the surface, i.e. for the identification of some geophysical and geodynamical properties of the observed surface [2].
For remote-sensing images relevant to natural areas, the obtained texture can be fruitfully analyzed using fractal-derived concepts, useful for segmentation, classification, edge detection, denoising, etc. [3]. With regard to optical images, for which the observed surfaces hold a Lambertian behavior, the fractal dimension of the surface can be estimated from image texture, according to the classical spectral-domain model of [4]. Conversely, for microwave images, the surface behavior cannot be assumed Lambertian, and a different framework is necessary to retrieve D.
In this paper the focus is on Synthetic Aperture Radar (SAR) data. SAR is a side-looking sensor that measures the reflectivity of the observed scene at microwave frequencies. SAR is an extremely powerful instrument, because it allows
the acquisition of information in any moment of the day and with any weather condition. The reflectivity function, which is strongly related to the sensor acquisition geometry, carries information on the geometric (surface roughness) and the electromagnetic (dielectric permittivity and conductivity) properties of the observed surface [5].
Therefore, as opposed to optical images, whose observed intensity essentially depends on surface orientation, SAR image formation strongly depends on chemical-physical features of the observed surface and on the acquisition geometry of the sensor [5]. In the SAR case, specific knowledge of scattering theory concepts, SAR system issues, and SAR signal processing are necessary. The side-looking configuration of the sensor dictates a preferential direction, implying that the final image intensity depends mainly (i.e. in a first order approximation) on surface slopes in the range direction. The authors exploited this key observation in [6] to develop a model and devise an algorithm aimed at estimating the fractal dimension of a surface from its SAR amplitude image. The proposed model is based on the estimation of the spectra of range cuts of the image and on a linear regression step to retrieve the slope of these spectra in a log-log plane [6].
In this paper we present a description of the image-processing concepts necessary to obtain the fractal dimension images from SAR amplitude images. The theoretical aspects of the problem were presented in [6], where also a local approach to obtain fractal dimension images was introduced. However, a systematic discussion regarding the image-processing necessary to obtain reliable estimates of the fractal dimension were not yet provided. The power-law spectral behavior of fractal surfaces and the local nature of the estimation, performed using a sliding window, imply specific requirements for the spectral estimation problem. Without specific clever solutions to this problem the attained fractal dimension estimates would not be reliable.
2. FRACTAL MODELS FOR SAR IMAGES We use the regular stochastic fractional Brownian motion (fBm) process to model the observed surface. It completely describes the natural surface by means of two independent parameters: the Hurst coefficient, 0<H<1 (which is linked to the fractal dimension D=3−H) and the standard deviation of
978-1-4799-5751-4/14/$31.00 ©2014 IEEE ICIP 2014106

surface increments at unitary distance, s [m1−H]. The process is an fBm if, for every x, y, x', y', it satisfies the
following relationship [1], [7]:
(1)
The power spectral density (PSD) of the isotropic two-
dimensional fBm process exhibits the following power-law behavior [1], [7]:
, (2) wherein S0 and are functions of the fractal parameters [7]. As opposed to optical images of Lambertian surfaces, for which we can use a very simple imaging model to relate the fractal dimension of the observed surface to acquired image intensity, in the case of SAR we need a more refined direct model. In particular, it should take into account the involved relation between surface slopes and image intensity, through the electromagnetic characterization of the surface [7].
The model presented in [6] assumes a small-slope regime for the observed surface: this leads to a linear dependence of image intensity on the range slopes of the observed surface. Within this assumption, the PSDs of azimuth and range cuts of the SAR image show very different behaviors, highlighting an intrinsic asymmetry in the structure of SAR data, which is intuitively referable to the specific acquisition geometry of a side-looking mono-static radar. In particular, the spectra of image range cuts, in an appropriate range of sufficiently low spatial frequencies, present a power-law behavior, thus showing on a log-log plane a linear graph whose slope is related to the Hurst coefficient H of the observed surface. In fact, the expression of the PSD of range cuts of a SAR image, for adequately low wavenumbers, turns out to be [6]:
where ky is the wavenumber of the range cut of the image and is the Euler Gamma function.
3. FRACTAL DIMENSION IMAGES
The PSD expression in (3) suggests a simple way to retrieve the fractal dimension, consisting in a linear regression on the spectrum of image range cuts in a log-log plane.
Hence, in order to apply the inversion algorithm on actual SAR amplitude images, we must estimate the PSD of range cuts. The analysis of actual SAR images of natural surfaces requires spectral estimators able to work effectively with a small number of samples: in fact, the fractal dimension is a local property of the surface and can exhibit
significant variations depending on both the position and the scales taken into account. Therefore, the estimation of the fractal parameters of a physical fractal surface from the relevant SAR image requires the use of a sliding window of small dimension in order to obtain an adequate resolution for the image of the retrieved values. Moreover, the estimation of power-law spectra is particularly subject to leakage problems. 3.1. Capon spectral estimator
Power law spectra introduce unique difficulties in spectral estimation since they greatly suffer leakage effects and high variance problems, which can give rise to deep modifications of the original spectral slope. In order to reduce the variance of the spectral estimates the use of large data sets allowing the evaluation of appropriate average spectra would be desirable. In our case the limited dimension of the data set, due to the use of a relatively small sliding windows, requires to resort to spectral estimators able to reduce as much as possible both leakage and variance of the estimates, also in presence of a small number of samples [8]. Hence, for our application the use of classical spectral estimators, such as the periodogram obtained using Fourier-based techniques, does not represent a good solution. Conversely, the Capon estimator strongly reduces the above-discussed effects and is particularly well suited when facing short data records [8], [9].
The Capon estimator essentially performs a filtering customized for each frequency of interest and aimed at minimizing the total power output, with the constraint that the gain at the frequency of interest is unity [9]. In particular, in the power law case the sidelobes of the filter are adjusted in order to avoid leakage from low frequency components. In order to estimate the power spectrum, the Capon method requires the evaluation of an estimate of the autocorrelation matrix. In this paper we use the modified autocovariance method, which provides an unbiased and consistent estimator of the autocorrelation [9].
The Capon estimate of the spectrum from an N-sample data sequence is:
wherein p<N is the dimension of the autocorrelation matrix,
is the ground range resolution of the SAR image, is the inverse of the estimated autocorrelation matrix, * stands for conjugate transpose and
The bias of the Capon estimator is independent of N,
but it is dependent on p. An increase in p determines a decrease in the bias at the expense of an increased variance. Indeed, p is the longest lag for which the autocorrelation
ICIP 2014107
is estimated and, obviously, the range of p is constrained by N. For this estimator the region of high accuracy for the estimated spectra is . 3.2. Algorithm implementation
The implemented algorithm estimates the local fractal dimension of the imaged surface working on patches of the SAR image, using a window spanning the whole image. The size of this elaboration window can be set by the user according to its specific needs, resulting from a trade-off between achieved accuracy and resolution of the output fractal dimension map.
In each instance of the elaborating window, the spectra of the range cuts are evaluated and averaged using the Capon spectral estimator described in the previous sub-section. Finally, a linear regression is performed on the obtained average PSD. As a result, we obtain an image of the fractal dimension of the observed scene: the resolution of this image depends on both the resolution of the input image and the dimension of the estimation window.
Furthermore, another important difference with respect to optical images is the presence on SAR images of speckle, which is responsible for the well-known speckle effect on SAR amplitude images [4]-[5]. Actually, radar single-look images hold small-scale spatial properties dominated by the speckle effect, hence in the wavenumber domain the high frequency range of the image spectrum is degraded. However, our algorithm performs the linear regression in a range of sufficiently low spatial frequencies, in which the spectrum is not significantly affected by speckle. 3.3. Special properties The effectiveness of information extraction from SAR data depends on the ability to separate the effects of one specific parameter from other effects, in order to obtain a value-added SAR product, ideally reporting the variation of the single parameter of interest. This is a complex task because the list of parameters influencing SAR image formation is very long, enclosing both scene and sensor parameters. From this viewpoint, the fractal dimension seems to fit excellently this last requirement, because it clearly depends on a single feature of the observed scene, namely its roughness.
We demonstrated that the fractal dimension estimation is independent not only of other scene physical properties, but also of the acquisition geometry. In fact, in [10] we analyzed a wide set of multi-angle SAR images of the same area and verified that the estimated fractal dimension images are not dependent neither on the sensor look angle nor on the local incidence angle, at least in hypothesis of validity of the theoretical model (i.e., on natural surfaces). Furthermore, in [11] we demonstrated that the images are not dependent on polarization, at least when co-polarized channels are considered.
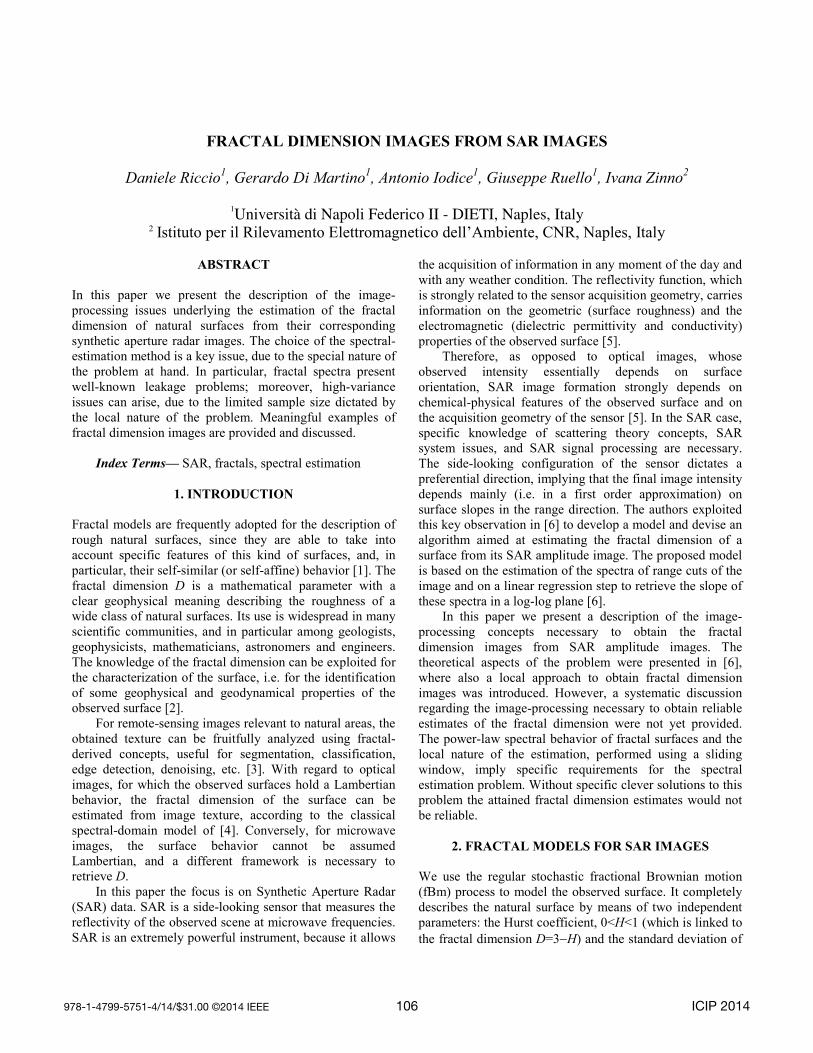
4. RESULTS In this section, we present two examples of fractal dimension images estimated from SAR images acquired by two different sensors. The first one is a C-band stripmap image acquired by the SIR-C sensor in 1994 over the area of Mt. Mammoth, CA, USA. In particular, in Fig. 1 the intensity image relevant to the HH polarization channel is shown, while in Fig. 2 the fractal dimension map obtained from this image is presented. The original pixel spacing of the data is 4.3 m in azimuth and 13.3 m in ground range, but a 1x3 spatial multilook has been applied in order to obtain an almost square pixel. Note that the fractal dimension image in Fig. 2 is an averaged version of the one estimated from the single look image. The mean value of the image is 2.29 with a standard deviation of 0.09. The estimated fractal dimension assumes values outside the range admissible for fractal surfaces (2<D<3) in presence of areas affected by relevant geometrical distortions (e.g. layover) [12]. They can be appreciated as dark spots over the fractal dimension image and are essentially located in correspondence of layover areas.
Fig. 1 SIR-C HH stripmap image of the area of Mt. Mammoth, CA, USA. Near range is on the left.
ICIP 2014108
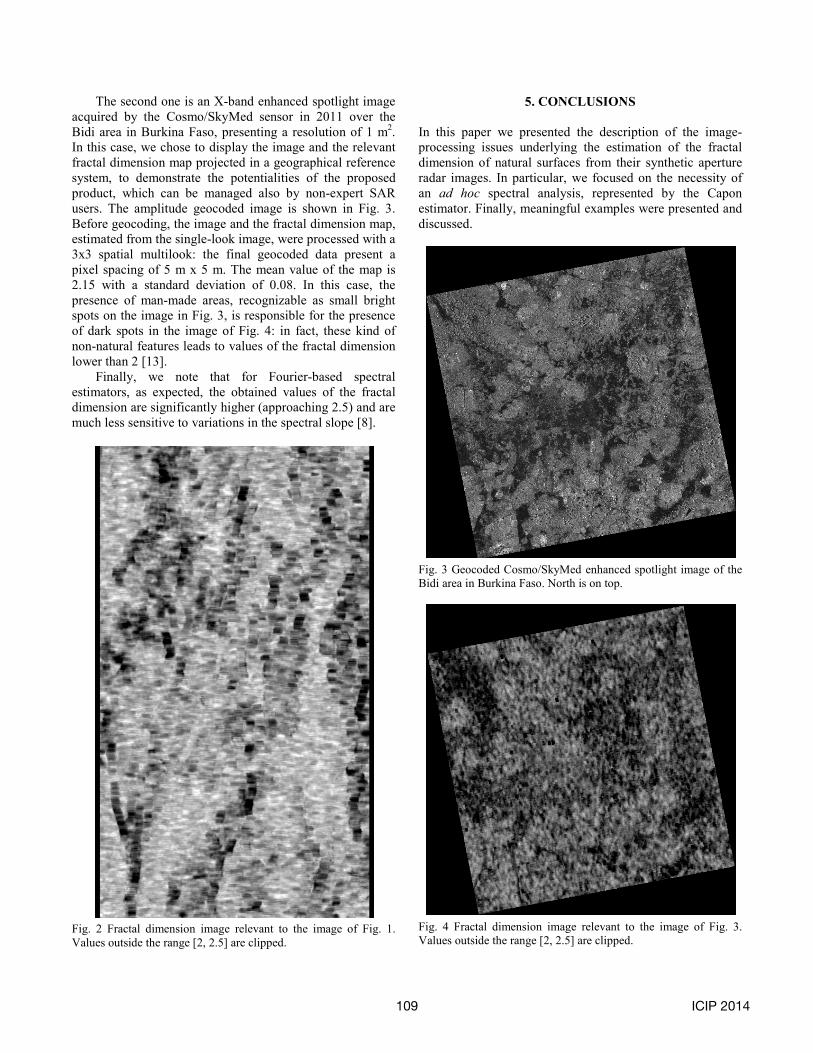
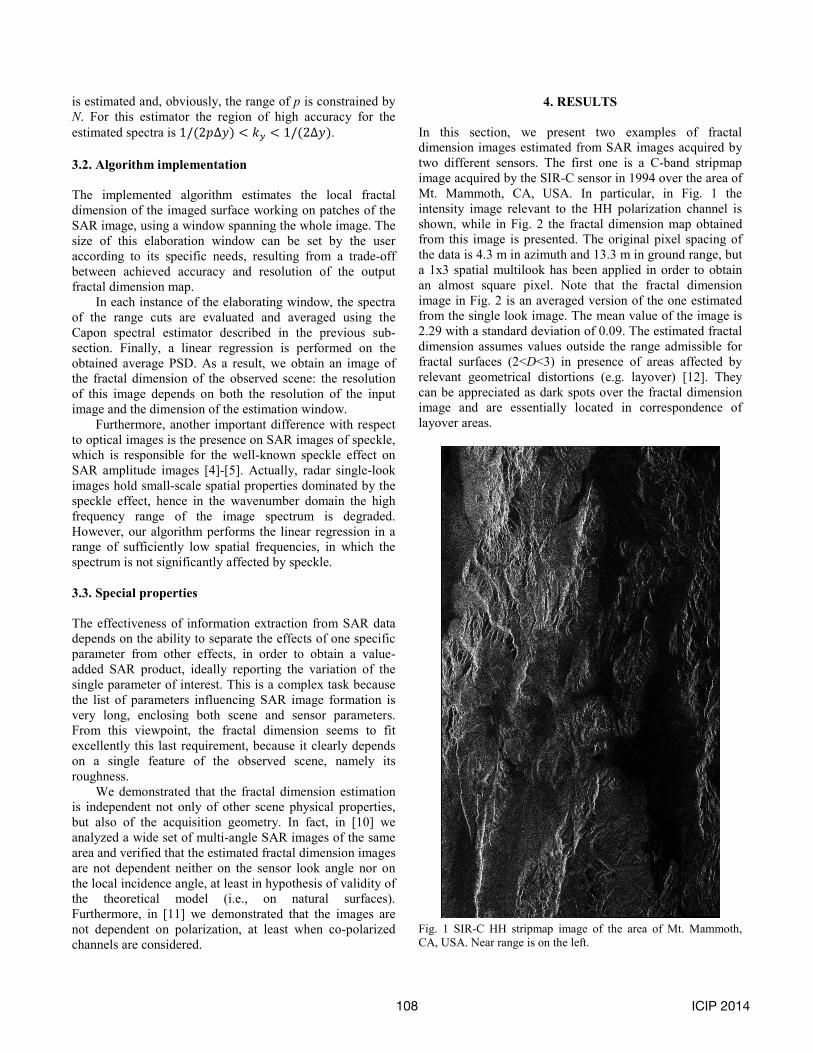
The second one is an X-band enhanced spotlight image acquired by the Cosmo/SkyMed sensor in 2011 over the Bidi area in Burkina Faso, presenting a resolution of 1 m2. In this case, we chose to display the image and the relevant fractal dimension map projected in a geographical reference system, to demonstrate the potentialities of the proposed product, which can be managed also by non-expert SAR users. The amplitude geocoded image is shown in Fig. 3. Before geocoding, the image and the fractal dimension map, estimated from the single-look image, were processed with a 3x3 spatial multilook: the final geocoded data present a pixel spacing of 5 m x 5 m. The mean value of the map is 2.15 with a standard deviation of 0.08. In this case, the presence of man-made areas, recognizable as small bright spots on the image in Fig. 3, is responsible for the presence of dark spots in the image of Fig. 4: in fact, these kind of non-natural features leads to values of the fractal dimension lower than 2 [13].
Finally, we note that for Fourier-based spectral estimators, as expected, the obtained values of the fractal dimension are significantly higher (approaching 2.5) and are much less sensitive to variations in the spectral slope [8].
Fig. 2 Fractal dimension image relevant to the image of Fig. 1. Values outside the range [2, 2.5] are clipped.
5. CONCLUSIONS In this paper we presented the description of the image-processing issues underlying the estimation of the fractal dimension of natural surfaces from their synthetic aperture radar images. In particular, we focused on the necessity of an ad hoc spectral analysis, represented by the Capon estimator. Finally, meaningful examples were presented and discussed.
Fig. 3 Geocoded Cosmo/SkyMed enhanced spotlight image of the Bidi area in Burkina Faso. North is on top.
Fig. 4 Fractal dimension image relevant to the image of Fig. 3. Values outside the range [2, 2.5] are clipped.
ICIP 2014109
6. REFERENCES [1] B. B. Mandelbrot, The Fractal Geometry of Nature. New York, NY, USA: Freeman, 1983. [2] Turcotte D. L., Fractals and Chaos in Geology and Geophysics. Cambridge University Press, 1997. [3] B. Pesquet-Popescu and J. L. Véhel, “Stochastic Fractal Models for Image Processing,” IEEE Signal Process. Mag., vol. 19, no. 5, pp. 48–62, Sep. 2002. [4] P. Kube and A. P. Pentland, “On the Imaging of Fractal Surfaces,” IEEE Trans. Pattern Anal. Mach. Intell., vol. 10, no. 5, pp. 704–707, Sep. 1988. [5] K. Tomiyasu, “Tutorial Review of Synthetic Aperture Radar (SAR) with Applications to Imaging of the Ocean Surface,” Proc. IEEE, vol. 66, no. 5, pp. 563–583, 1978. [6] G. Di Martino, D. Riccio, and I. Zinno, “SAR Imaging of Fractal Surfaces,” IEEE Trans. Geosci. Remote Sens., vol. 50, no. 2, pp. 630–644, Feb. 2012. [7] G. Franceschetti and D. Riccio, Scattering, Natural Surfaces and Fractals. Burlington, MA: Academic Press, 2007. [8] R. T. Austin, A. W. England, and G. H. Wakefield, “Special Problems in the Estimation of Power-Law Spectra as Applied to Topographical Modeling,” Geosci. Remote Sensing, IEEE Trans., vol. 32, no. 4, pp. 928–939, July 1994. [9] S. M. Kay, Modern Spectral Analysis. Englewood Cliffs, NJ: Patience Hall, 1999. [10] G. Di Martino, A. Iodice, D. Riccio, G. Ruello, and I. Zinno, “Angle Independence Properties of Fractal Dimension Maps Estimated From SAR Data,” IEEE J. Sel. Top. Appl. Earth Obs. Remote Sens., vol. 6, no. 3, pp. 1242–1253, June 2013. [11] G. Di Martino, A. Iodice, D. Riccio, G. Ruello, and I. Zinno, “The Effects of Polarization on Fractal Dimension Maps Estimated from SAR Data,” in Proceedings of PolInSAR 2013 (ESA SP-713), Aug. 2013. [12] G. Di Martino, A. Iodice, D. Riccio, G. Ruello, and I. Zinno, “On the fractal nature of volcano morphology detected via SAR image analysis: the case of Somma–Vesuvius Volcanic Complex,” Eur. J. Remote Sens., vol. 45, pp. 177–187, Mar. 2012. [13] G. Di Martino, A. Iodice, D. Riccio, G. Ruello, and I. Zinno, “Fractal Filtering Applied to SAR Images of Urban Areas,” in Proceedings of Joint Urban Remote Sensing Event 2011, 2011, pp. 261–264.
ICIP 2014110