Embed Size (px)
Citation preview

technical memorandum
North Carolina I-95 Economic Assessment
Task 8: Economic Analysis Technical Memo
prepared for
North Carolina Department of Transportation
prepared by
Cambridge Systematics, Inc. 730 Peachtree Street, NE, Suite 1000 Atlanta, GA 30308
date
June 2013

North Carolina I-95 Economic Assessment
Cambridge Systematics, Inc. i 8739-003
Table of Contents
1.0 The Economic Role of I-95 ................................................................................ 1-1
1.1 Regional Economic Profile ........................................................................ 1-1
1.2 The Linkage between Highway Conditions and Economic Development ............................................................................................. 1-11
1.3 Trends Impacting Future Traffic on I-95 in North Carolina ............... 1-12
2.0 Economic Assessment Methodology .............................................................. 2-1
2.1 Study Region Definition ............................................................................ 2-1
2.2 Scenarios Modeled ...................................................................................... 2-3
2.3 Methodology ............................................................................................... 2-4
3.0 Economic Assessments Results ........................................................................ 3-1
A. Appendix ............................................................................................................. A-1
A.1 Detailed REMI Model Description and Methodology ......................... A-2

North Carolina I-95 Economic Assessment
Cambridge Systematics, Inc. iii
List of Tables
Table 1.1 I-95 Corridor Population Growth 2001 to 2010 .................................... 1-2
Table 1.2 Population Projections for I-95 Counties .............................................. 1-2
Table 1.3 I-95 Corridor States Population Projections 2000 to 2030 ................... 1-3
Table 1.4 Employment by Industry 2011 ............................................................... 1-4
Table 1.5 I-95 Corridor Employment 2001 to 2010 Compound Annual Growth Rate (CAGR) ............................................................................... 1-5
Table 1.6 North Carolina Top Five Cash Receipts from Farming by Commodity 2010 ................................................................................. 1-7
Table 1.7 North Carolina Top 10 Counties in Farm Receipts ............................. 1-8
Table 1.8 Agricultural Establishments and Employment for Selected Counties along the I-95 Corridor 2011 .................................................. 1-9
Table 1.9 2011 Warehousing and Distribution, Wholesale Trade, and Trucking Establishments and Employment ............................... 1-10
Table 1.10 2011 Manufacturing Establishments and Employment .................... 1-10
Table 2.1 Definition of North Carolina I-95 Economic Assessment Study Regions ...................................................................................................... 2-3
Table 2.2 Variable Definition ................................................................................... 2-4
Table 2.3 Travel-Cost Variable, Values, and Sources ......................................... 2-10
Table 2.4 Estimation of Crash Delay .................................................................... 2-13
Table 3.1 Economic Impacts of Business as Usual Compared to the Baseline Economic Forecast 2014 to 2050 ............................................. 3-2
Table 3.2 Economic Impacts of Build, No Funding Specified Compared to Business as Usual 2014 to 2050 ........................................................... 3-3
Table 3.3 Economic Impact of Build with Tolls Compared to Business with Usual 2014 to 2050 ........................................................................... 3-4
Table 3.4 Economic Impact of Build with Mitigated Tolls Compared to Business as Usual 2014 to 2050 ............................................................... 3-5
Table 3.5 Comparison of Economic Impact of Toll Scenarios 2014 to 2050 ...... 3-6
Table 3.6 Economic Impacts of Investing in I-95 via Alternative Funding Options ...................................................................................... 3-7

North Carolina I-95 Economic Assessment
Cambridge Systematics, Inc. v
List of Figures
Figure 1.1 Business Establishments in North Carolina ......................................... 1-6
Figure 1.2 County Farm Cash Receipts 2011 .......................................................... 1-7
Figure 1.3 Linkage between Transportation and Economic Development ...... 1-11
Figure 1.4 Impact of Deteriorating Transportation Infrastructure .................... 1-12
Figure 1.5 Projected Population Growth 2010 to 2020 ......................................... 1-13
Figure 1.6 Projected Population Growth 2020 to 2030 ......................................... 1-13
Figure 1.7 Projected Population Growth 2030 to 2032 ......................................... 1-14
Figure 2.1 Process for Defining the North Carolina I-95 Economic Assessment Study Regions ..................................................................... 2-2
Figure 2.2 Map of the North Carolina I-95 Economic Assessment Study Regions ........................................................................................... 2-2
Figure 2.3 Impact Metrics for I-95 Funding Alternatives...................................... 2-6
Figure 2.4 General Analytical Framework .............................................................. 2-6
Figure 2.5 Modeling Changes in Transportation Costs ........................................ 2-8
Figure A.1 REMI Model Linkages ............................................................................ A-2

North Carolina I-95 Economic Assessment
Cambridge Systematics, Inc. 1-1
1.0 The Economic Role of I-95
1.1 REGIONAL ECONOMIC PROFILE The I-95 Corridor traverses through the eastern, more rural, region of the State by way of eight counties between Virginia and South Carolina. Private employment in eastern North Carolina is dominated by agricultural and manufacturing industry sectors. In Cumberland County, where Fort Bragg is located, the military and supporting industries comprise the most important economic sector. Given the concentration of agricultural, manufacturing, and military industries in this area, I-95 is the primary freight corridor in eastern North Carolina. Not only do intrastate freight movements depend on I-95, but regional trade utilizes I-95 to access markets in the northeast and Florida, while also providing access to major east coast ports. Regionally, the I-95 corridor serves as a significant route for commuters as it connects to highways leading to the Raleigh-Durham and Fayetteville metropolitan areas.
Population
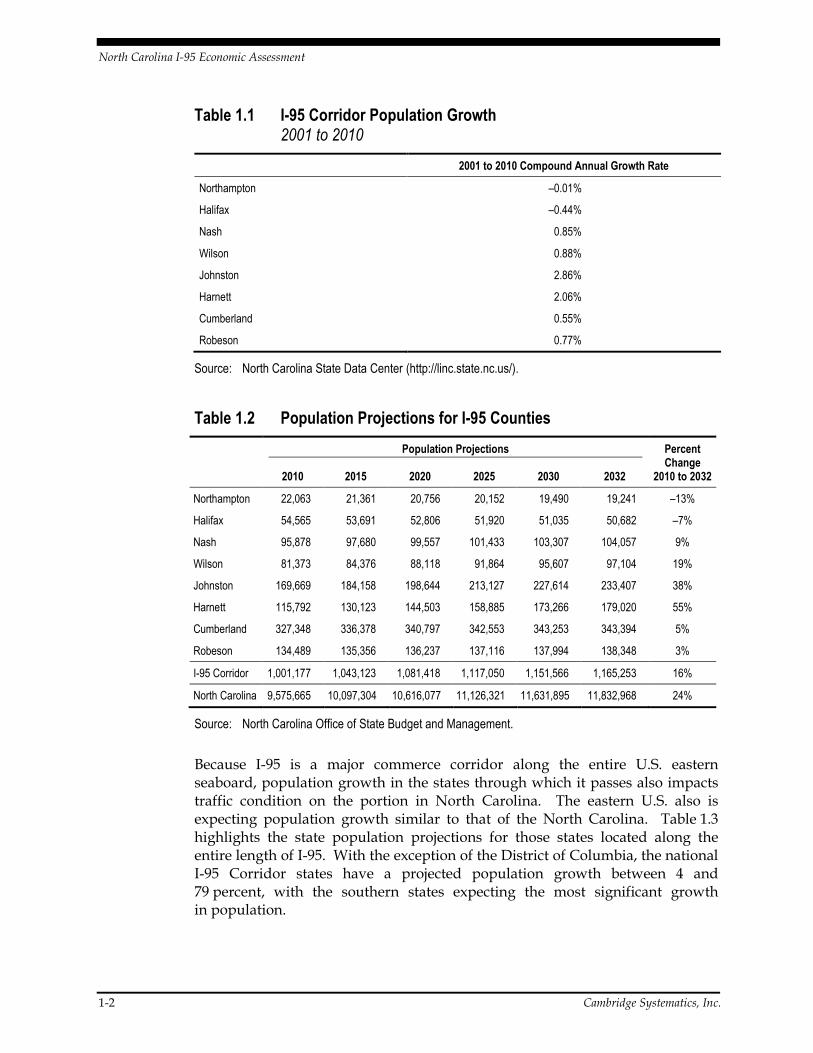
Population in the eight counties I-95 passes through was 1,007,2221 in July 2011, approximately 10 percent of total North Carolina state population. Between 2001 and 2010, Harnett and Johnston Counties exhibited significant change in population and density, with almost 3 percent annual growth and density in Johnston County alone (see Table 1.1).
Population in both the I-95 Corridor and the State of North Carolina is expected to undergo continued growth from 2010 to 2032 at rates of nearly 16 and 24 percent, respectively. However, as shown in Table 1.2, when examined individually, several counties are projected to see a decrease in population between 2010 and 2032. Northampton County is projected to experience the most notable decline, with a loss in population, approximately 13 percent between 2010 and 2030.
1 Certified 2011 County Population Estimates, North Carolina Office of State Budget and Management.
North Carolina I-95 Economic Assessment
1-2 Cambridge Systematics, Inc.
Table 1.1 I-95 Corridor Population Growth 2001 to 2010
2001 to 2010 Compound Annual Growth Rate
Northampton –0.01%
Halifax –0.44%
Nash 0.85%
Wilson 0.88%
Johnston 2.86%
Harnett 2.06%
Cumberland 0.55%
Robeson 0.77%
Source: North Carolina State Data Center (http://linc.state.nc.us/).
Table 1.2 Population Projections for I-95 Counties
Population Projections Percent Change
2010 to 2032 2010 2015 2020 2025 2030 2032
Northampton 22,063 21,361 20,756 20,152 19,490 19,241 –13%
Halifax 54,565 53,691 52,806 51,920 51,035 50,682 –7%
Nash 95,878 97,680 99,557 101,433 103,307 104,057 9%
Wilson 81,373 84,376 88,118 91,864 95,607 97,104 19%
Johnston 169,669 184,158 198,644 213,127 227,614 233,407 38%
Harnett 115,792 130,123 144,503 158,885 173,266 179,020 55%
Cumberland 327,348 336,378 340,797 342,553 343,253 343,394 5%
Robeson 134,489 135,356 136,237 137,116 137,994 138,348 3%
I-95 Corridor 1,001,177 1,043,123 1,081,418 1,117,050 1,151,566 1,165,253 16%
North Carolina 9,575,665 10,097,304 10,616,077 11,126,321 11,631,895 11,832,968 24%
Source: North Carolina Office of State Budget and Management.
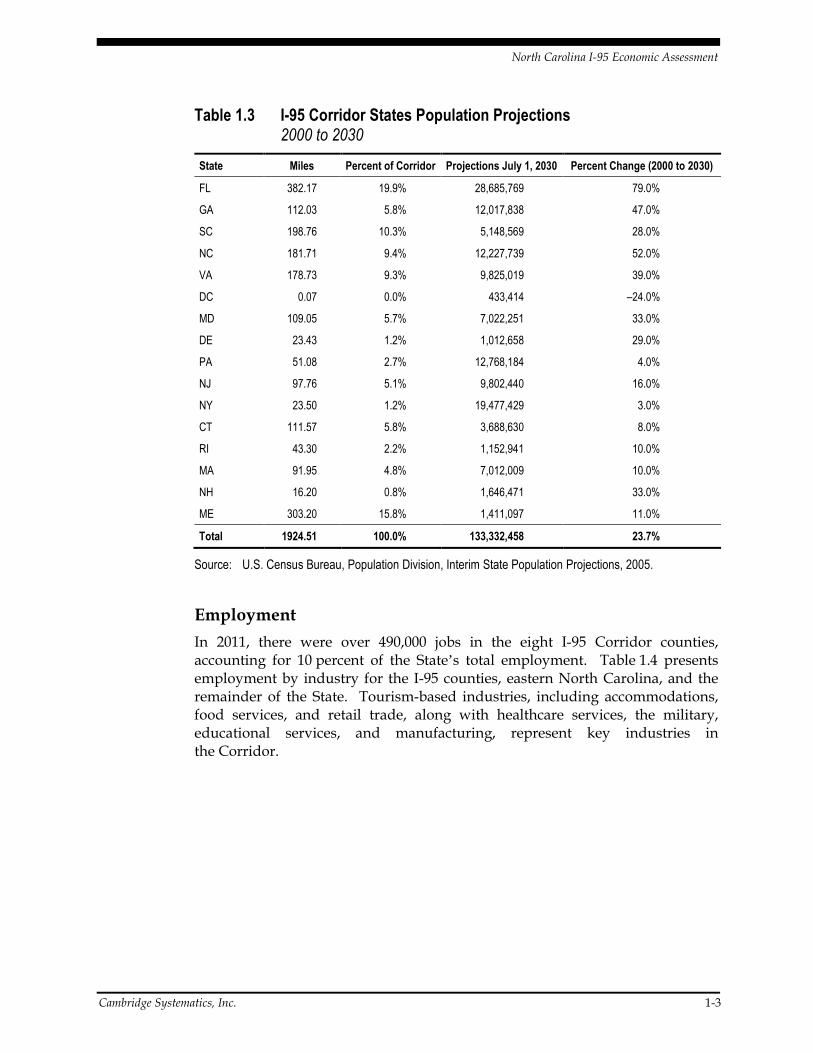
Because I-95 is a major commerce corridor along the entire U.S. eastern seaboard, population growth in the states through which it passes also impacts traffic condition on the portion in North Carolina. The eastern U.S. also is expecting population growth similar to that of the North Carolina. Table 1.3 highlights the state population projections for those states located along the entire length of I-95. With the exception of the District of Columbia, the national I-95 Corridor states have a projected population growth between 4 and 79 percent, with the southern states expecting the most significant growth in population.
North Carolina I-95 Economic Assessment
Cambridge Systematics, Inc. 1-3
Table 1.3 I-95 Corridor States Population Projections 2000 to 2030
State Miles Percent of Corridor Projections July 1, 2030 Percent Change (2000 to 2030)
FL 382.17 19.9% 28,685,769 79.0%
GA 112.03 5.8% 12,017,838 47.0%
SC 198.76 10.3% 5,148,569 28.0%
NC 181.71 9.4% 12,227,739 52.0%
VA 178.73 9.3% 9,825,019 39.0%
DC 0.07 0.0% 433,414 –24.0%
MD 109.05 5.7% 7,022,251 33.0%
DE 23.43 1.2% 1,012,658 29.0%
PA 51.08 2.7% 12,768,184 4.0%
NJ 97.76 5.1% 9,802,440 16.0%
NY 23.50 1.2% 19,477,429 3.0%
CT 111.57 5.8% 3,688,630 8.0%
RI 43.30 2.2% 1,152,941 10.0%
MA 91.95 4.8% 7,012,009 10.0%
NH 16.20 0.8% 1,646,471 33.0%
ME 303.20 15.8% 1,411,097 11.0%
Total 1924.51 100.0% 133,332,458 23.7%
Source: U.S. Census Bureau, Population Division, Interim State Population Projections, 2005.
Employment
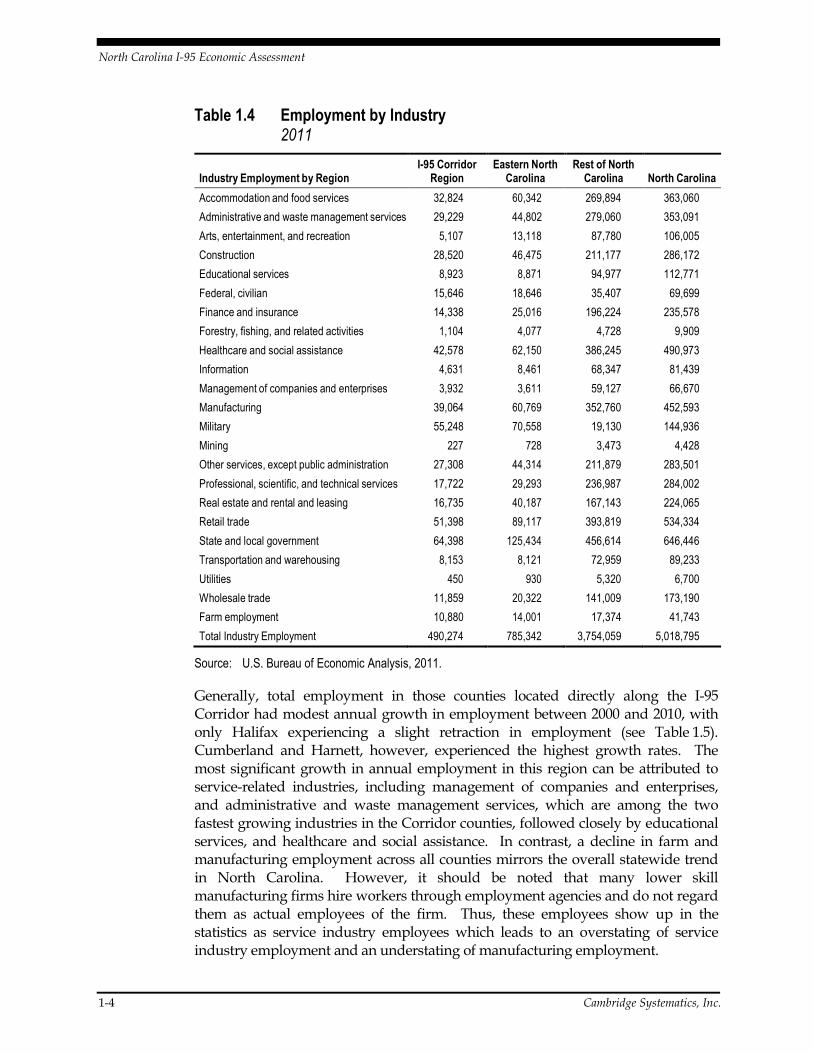
In 2011, there were over 490,000 jobs in the eight I-95 Corridor counties, accounting for 10 percent of the State’s total employment. Table 1.4 presents employment by industry for the I-95 counties, eastern North Carolina, and the remainder of the State. Tourism-based industries, including accommodations, food services, and retail trade, along with healthcare services, the military, educational services, and manufacturing, represent key industries in the Corridor.
North Carolina I-95 Economic Assessment
1-4 Cambridge Systematics, Inc.
Table 1.4 Employment by Industry 2011
Industry Employment by Region I-95 Corridor
Region Eastern North
Carolina Rest of North
Carolina North Carolina
Accommodation and food services 32,824 60,342 269,894 363,060
Administrative and waste management services 29,229 44,802 279,060 353,091
Arts, entertainment, and recreation 5,107 13,118 87,780 106,005
Construction 28,520 46,475 211,177 286,172
Educational services 8,923 8,871 94,977 112,771
Federal, civilian 15,646 18,646 35,407 69,699
Finance and insurance 14,338 25,016 196,224 235,578
Forestry, fishing, and related activities 1,104 4,077 4,728 9,909
Healthcare and social assistance 42,578 62,150 386,245 490,973
Information 4,631 8,461 68,347 81,439
Management of companies and enterprises 3,932 3,611 59,127 66,670
Manufacturing 39,064 60,769 352,760 452,593
Military 55,248 70,558 19,130 144,936
Mining 227 728 3,473 4,428
Other services, except public administration 27,308 44,314 211,879 283,501
Professional, scientific, and technical services 17,722 29,293 236,987 284,002
Real estate and rental and leasing 16,735 40,187 167,143 224,065
Retail trade 51,398 89,117 393,819 534,334
State and local government 64,398 125,434 456,614 646,446
Transportation and warehousing 8,153 8,121 72,959 89,233
Utilities 450 930 5,320 6,700
Wholesale trade 11,859 20,322 141,009 173,190
Farm employment 10,880 14,001 17,374 41,743
Total Industry Employment 490,274 785,342 3,754,059 5,018,795
Source: U.S. Bureau of Economic Analysis, 2011.
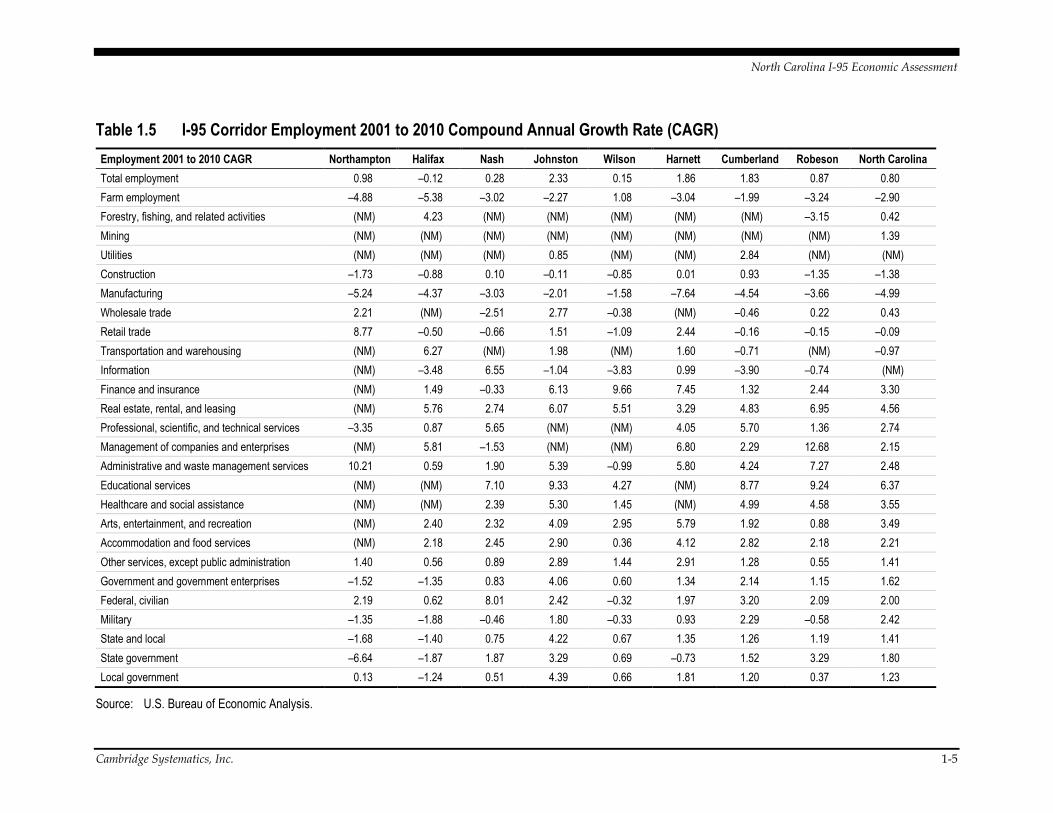
Generally, total employment in those counties located directly along the I-95 Corridor had modest annual growth in employment between 2000 and 2010, with only Halifax experiencing a slight retraction in employment (see Table 1.5). Cumberland and Harnett, however, experienced the highest growth rates. The most significant growth in annual employment in this region can be attributed to service-related industries, including management of companies and enterprises, and administrative and waste management services, which are among the two fastest growing industries in the Corridor counties, followed closely by educational services, and healthcare and social assistance. In contrast, a decline in farm and manufacturing employment across all counties mirrors the overall statewide trend in North Carolina. However, it should be noted that many lower skill manufacturing firms hire workers through employment agencies and do not regard them as actual employees of the firm. Thus, these employees show up in the statistics as service industry employees which leads to an overstating of service industry employment and an understating of manufacturing employment.
North Carolina I-95 Economic Assessment
Cambridge Systematics, Inc. 1-5
Table 1.5 I-95 Corridor Employment 2001 to 2010 Compound Annual Growth Rate (CAGR)
Employment 2001 to 2010 CAGR Northampton Halifax Nash Johnston Wilson Harnett Cumberland Robeson North Carolina
Total employment 0.98 –0.12 0.28 2.33 0.15 1.86 1.83 0.87 0.80
Farm employment –4.88 –5.38 –3.02 –2.27 1.08 –3.04 –1.99 –3.24 –2.90
Forestry, fishing, and related activities (NM) 4.23 (NM) (NM) (NM) (NM) (NM) –3.15 0.42
Mining (NM) (NM) (NM) (NM) (NM) (NM) (NM) (NM) 1.39
Utilities (NM) (NM) (NM) 0.85 (NM) (NM) 2.84 (NM) (NM)
Construction –1.73 –0.88 0.10 –0.11 –0.85 0.01 0.93 –1.35 –1.38
Manufacturing –5.24 –4.37 –3.03 –2.01 –1.58 –7.64 –4.54 –3.66 –4.99
Wholesale trade 2.21 (NM) –2.51 2.77 –0.38 (NM) –0.46 0.22 0.43
Retail trade 8.77 –0.50 –0.66 1.51 –1.09 2.44 –0.16 –0.15 –0.09
Transportation and warehousing (NM) 6.27 (NM) 1.98 (NM) 1.60 –0.71 (NM) –0.97
Information (NM) –3.48 6.55 –1.04 –3.83 0.99 –3.90 –0.74 (NM)
Finance and insurance (NM) 1.49 –0.33 6.13 9.66 7.45 1.32 2.44 3.30
Real estate, rental, and leasing (NM) 5.76 2.74 6.07 5.51 3.29 4.83 6.95 4.56
Professional, scientific, and technical services –3.35 0.87 5.65 (NM) (NM) 4.05 5.70 1.36 2.74
Management of companies and enterprises (NM) 5.81 –1.53 (NM) (NM) 6.80 2.29 12.68 2.15
Administrative and waste management services 10.21 0.59 1.90 5.39 –0.99 5.80 4.24 7.27 2.48
Educational services (NM) (NM) 7.10 9.33 4.27 (NM) 8.77 9.24 6.37
Healthcare and social assistance (NM) (NM) 2.39 5.30 1.45 (NM) 4.99 4.58 3.55
Arts, entertainment, and recreation (NM) 2.40 2.32 4.09 2.95 5.79 1.92 0.88 3.49
Accommodation and food services (NM) 2.18 2.45 2.90 0.36 4.12 2.82 2.18 2.21
Other services, except public administration 1.40 0.56 0.89 2.89 1.44 2.91 1.28 0.55 1.41
Government and government enterprises –1.52 –1.35 0.83 4.06 0.60 1.34 2.14 1.15 1.62
Federal, civilian 2.19 0.62 8.01 2.42 –0.32 1.97 3.20 2.09 2.00
Military –1.35 –1.88 –0.46 1.80 –0.33 0.93 2.29 –0.58 2.42
State and local –1.68 –1.40 0.75 4.22 0.67 1.35 1.26 1.19 1.41
State government –6.64 –1.87 1.87 3.29 0.69 –0.73 1.52 3.29 1.80
Local government 0.13 –1.24 0.51 4.39 0.66 1.81 1.20 0.37 1.23
Source: U.S. Bureau of Economic Analysis.
North Carolina I-95 Economic Assessment
1-6 Cambridge Systematics, Inc.
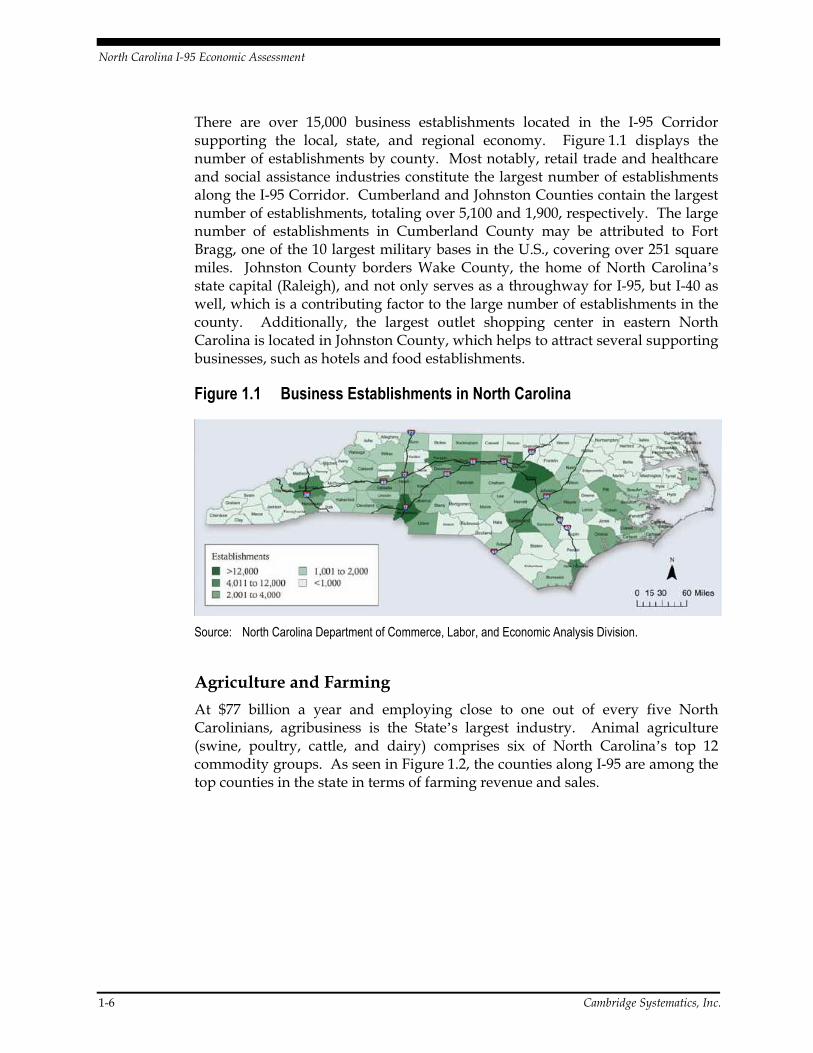
There are over 15,000 business establishments located in the I-95 Corridor supporting the local, state, and regional economy. Figure 1.1 displays the number of establishments by county. Most notably, retail trade and healthcare and social assistance industries constitute the largest number of establishments along the I-95 Corridor. Cumberland and Johnston Counties contain the largest number of establishments, totaling over 5,100 and 1,900, respectively. The large number of establishments in Cumberland County may be attributed to Fort Bragg, one of the 10 largest military bases in the U.S., covering over 251 square miles. Johnston County borders Wake County, the home of North Carolina’s state capital (Raleigh), and not only serves as a throughway for I-95, but I-40 as well, which is a contributing factor to the large number of establishments in the county. Additionally, the largest outlet shopping center in eastern North Carolina is located in Johnston County, which helps to attract several supporting businesses, such as hotels and food establishments.
Figure 1.1 Business Establishments in North Carolina
Source: North Carolina Department of Commerce, Labor, and Economic Analysis Division.
Agriculture and Farming
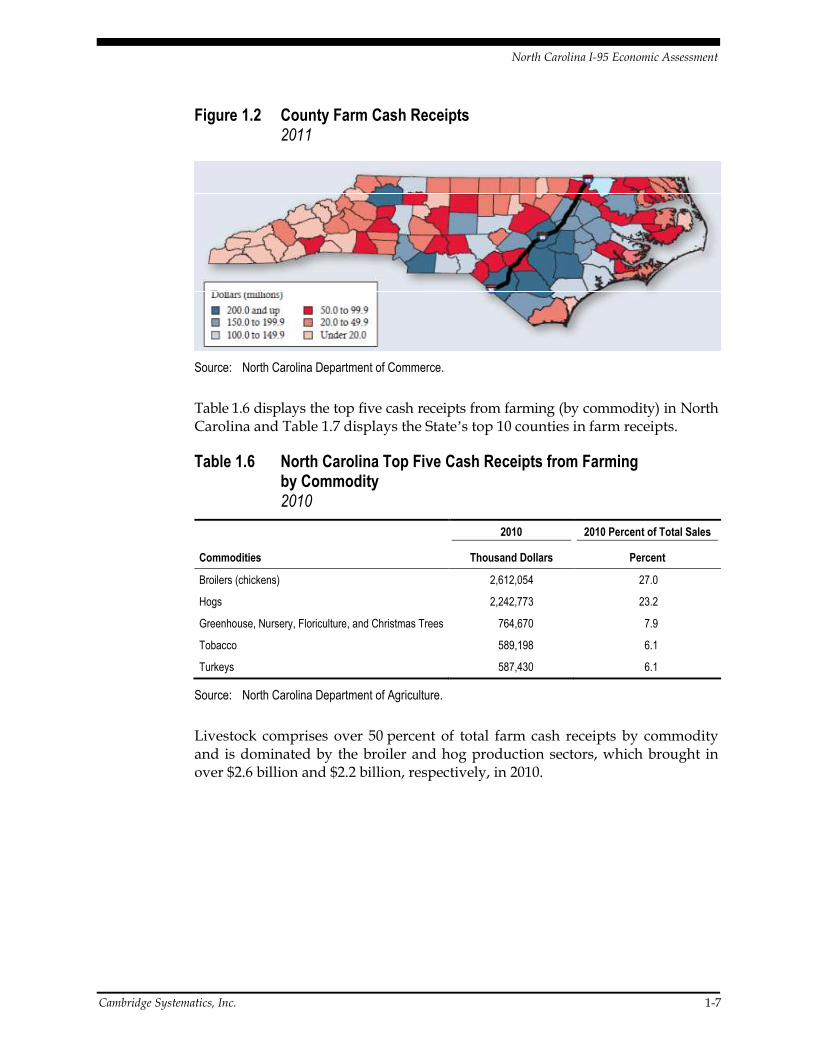
At $77 billion a year and employing close to one out of every five North Carolinians, agribusiness is the State’s largest industry. Animal agriculture (swine, poultry, cattle, and dairy) comprises six of North Carolina’s top 12 commodity groups. As seen in Figure 1.2, the counties along I-95 are among the top counties in the state in terms of farming revenue and sales.
North Carolina I-95 Economic Assessment
Cambridge Systematics, Inc. 1-7
Figure 1.2 County Farm Cash Receipts 2011
Source: North Carolina Department of Commerce.
Table 1.6 displays the top five cash receipts from farming (by commodity) in North Carolina and Table 1.7 displays the State’s top 10 counties in farm receipts.
Table 1.6 North Carolina Top Five Cash Receipts from Farming by Commodity 2010
Commodities
2010 2010 Percent of Total Sales
Thousand Dollars Percent
Broilers (chickens) 2,612,054 27.0
Hogs 2,242,773 23.2
Greenhouse, Nursery, Floriculture, and Christmas Trees 764,670 7.9
Tobacco 589,198 6.1
Turkeys 587,430 6.1
Source: North Carolina Department of Agriculture.
Livestock comprises over 50 percent of total farm cash receipts by commodity and is dominated by the broiler and hog production sectors, which brought in over $2.6 billion and $2.2 billion, respectively, in 2010.
North Carolina I-95 Economic Assessment
1-8 Cambridge Systematics, Inc.
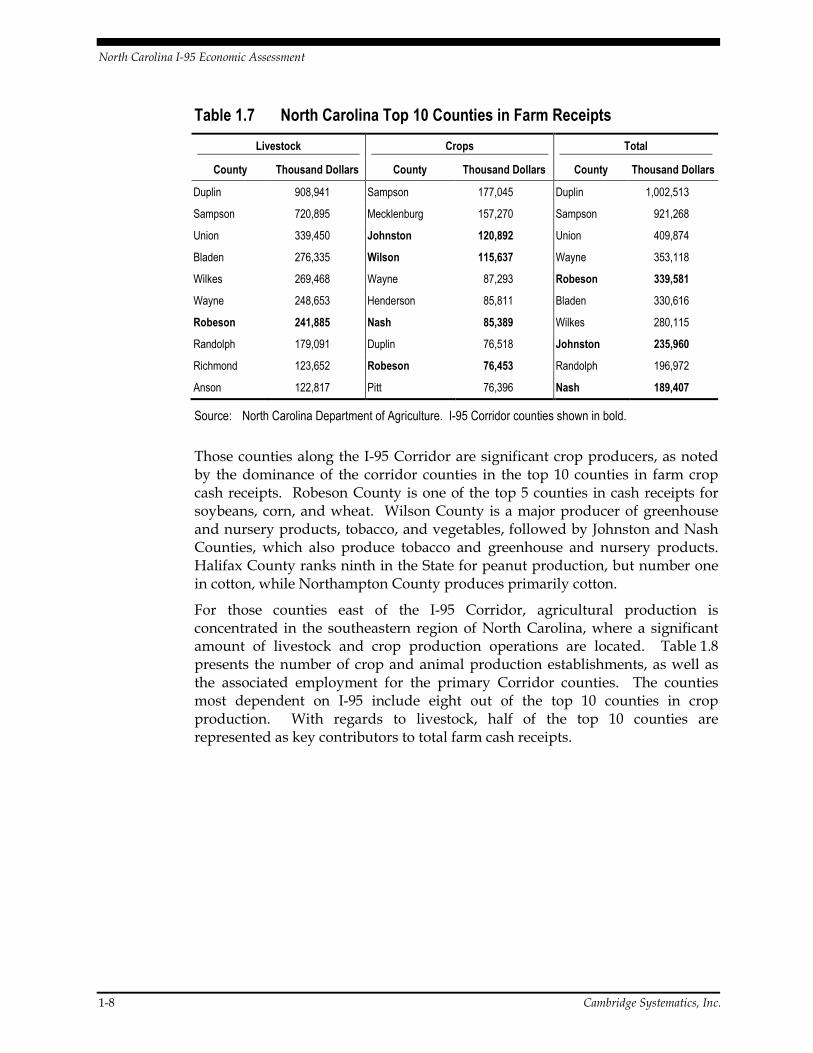
Table 1.7 North Carolina Top 10 Counties in Farm Receipts
Livestock Crops Total
County Thousand Dollars County Thousand Dollars County Thousand Dollars
Duplin 908,941 Sampson 177,045 Duplin 1,002,513
Sampson 720,895 Mecklenburg 157,270 Sampson 921,268
Union 339,450 Johnston 120,892 Union 409,874
Bladen 276,335 Wilson 115,637 Wayne 353,118
Wilkes 269,468 Wayne 87,293 Robeson 339,581
Wayne 248,653 Henderson 85,811 Bladen 330,616
Robeson 241,885 Nash 85,389 Wilkes 280,115
Randolph 179,091 Duplin 76,518 Johnston 235,960
Richmond 123,652 Robeson 76,453 Randolph 196,972
Anson 122,817 Pitt 76,396 Nash 189,407
Source: North Carolina Department of Agriculture. I-95 Corridor counties shown in bold.
Those counties along the I-95 Corridor are significant crop producers, as noted by the dominance of the corridor counties in the top 10 counties in farm crop cash receipts. Robeson County is one of the top 5 counties in cash receipts for soybeans, corn, and wheat. Wilson County is a major producer of greenhouse and nursery products, tobacco, and vegetables, followed by Johnston and Nash Counties, which also produce tobacco and greenhouse and nursery products. Halifax County ranks ninth in the State for peanut production, but number one in cotton, while Northampton County produces primarily cotton.
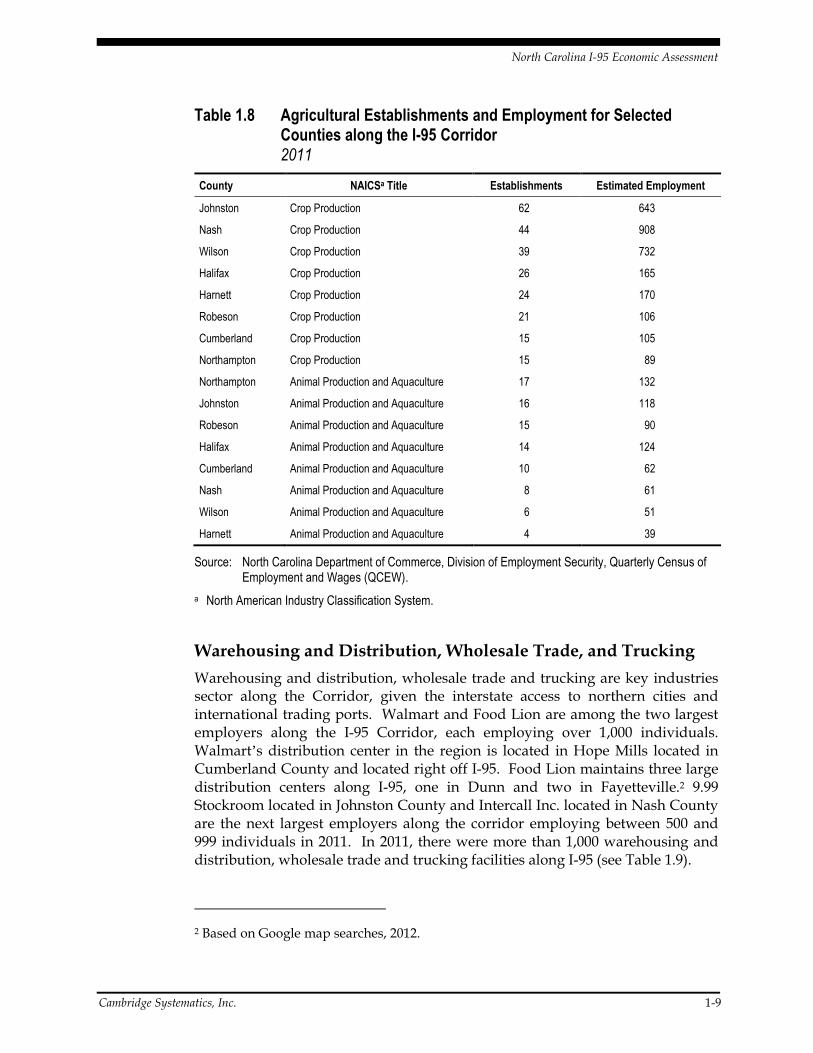
For those counties east of the I-95 Corridor, agricultural production is concentrated in the southeastern region of North Carolina, where a significant amount of livestock and crop production operations are located. Table 1.8 presents the number of crop and animal production establishments, as well as the associated employment for the primary Corridor counties. The counties most dependent on I-95 include eight out of the top 10 counties in crop production. With regards to livestock, half of the top 10 counties are represented as key contributors to total farm cash receipts.
North Carolina I-95 Economic Assessment
Cambridge Systematics, Inc. 1-9
Table 1.8 Agricultural Establishments and Employment for Selected Counties along the I-95 Corridor 2011
County NAICSa Title Establishments Estimated Employment
Johnston Crop Production 62 643
Nash Crop Production 44 908
Wilson Crop Production 39 732
Halifax Crop Production 26 165
Harnett Crop Production 24 170
Robeson Crop Production 21 106
Cumberland Crop Production 15 105
Northampton Crop Production 15 89
Northampton Animal Production and Aquaculture 17 132
Johnston Animal Production and Aquaculture 16 118
Robeson Animal Production and Aquaculture 15 90
Halifax Animal Production and Aquaculture 14 124
Cumberland Animal Production and Aquaculture 10 62
Nash Animal Production and Aquaculture 8 61
Wilson Animal Production and Aquaculture 6 51
Harnett Animal Production and Aquaculture 4 39
Source: North Carolina Department of Commerce, Division of Employment Security, Quarterly Census of Employment and Wages (QCEW).
a North American Industry Classification System.
Warehousing and Distribution, Wholesale Trade, and Trucking
Warehousing and distribution, wholesale trade and trucking are key industries sector along the Corridor, given the interstate access to northern cities and international trading ports. Walmart and Food Lion are among the two largest employers along the I-95 Corridor, each employing over 1,000 individuals. Walmart’s distribution center in the region is located in Hope Mills located in Cumberland County and located right off I-95. Food Lion maintains three large distribution centers along I-95, one in Dunn and two in Fayetteville.2 9.99 Stockroom located in Johnston County and Intercall Inc. located in Nash County are the next largest employers along the corridor employing between 500 and 999 individuals in 2011. In 2011, there were more than 1,000 warehousing and distribution, wholesale trade and trucking facilities along I-95 (see Table 1.9).
2 Based on Google map searches, 2012.
North Carolina I-95 Economic Assessment
1-10 Cambridge Systematics, Inc.
Table 1.9 2011 Warehousing and Distribution, Wholesale Trade, and Trucking Establishments and Employment
County Establishments Estimated Employment
Cumberland 283 7,563
Johnston 191 2,188
Nash 152 2,141
Robeson 125 1,364
Wilson 93 2,907
Harnett 90 1,591
Halifax 49 1,414
Northampton 29 814
Source: North Carolina Department of Commerce, Division of Employment Security, Quarterly Census of Employment and Wages (QCEW) and U.S. Bureau of Economic Analysis.
Manufacturing
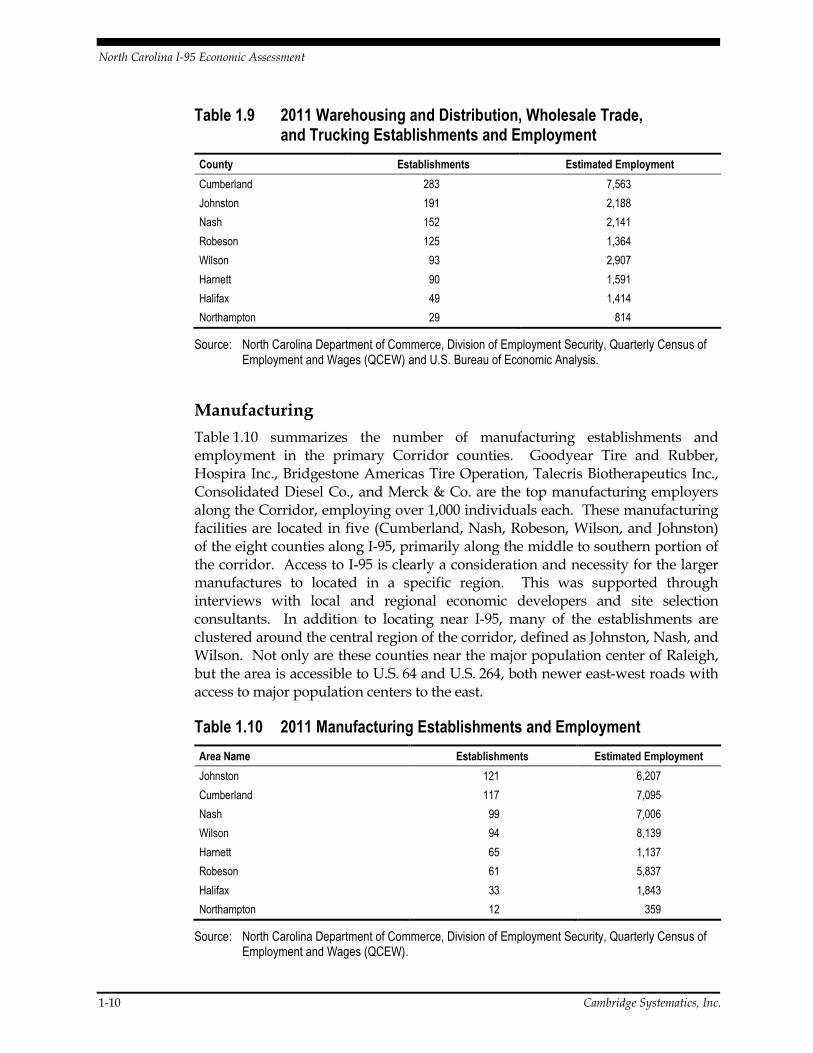
Table 1.10 summarizes the number of manufacturing establishments and employment in the primary Corridor counties. Goodyear Tire and Rubber, Hospira Inc., Bridgestone Americas Tire Operation, Talecris Biotherapeutics Inc., Consolidated Diesel Co., and Merck & Co. are the top manufacturing employers along the Corridor, employing over 1,000 individuals each. These manufacturing facilities are located in five (Cumberland, Nash, Robeson, Wilson, and Johnston) of the eight counties along I-95, primarily along the middle to southern portion of the corridor. Access to I-95 is clearly a consideration and necessity for the larger manufactures to located in a specific region. This was supported through interviews with local and regional economic developers and site selection consultants. In addition to locating near I-95, many of the establishments are clustered around the central region of the corridor, defined as Johnston, Nash, and Wilson. Not only are these counties near the major population center of Raleigh, but the area is accessible to U.S. 64 and U.S. 264, both newer east-west roads with access to major population centers to the east.
Table 1.10 2011 Manufacturing Establishments and Employment
Area Name Establishments Estimated Employment
Johnston 121 6,207
Cumberland 117 7,095
Nash 99 7,006
Wilson 94 8,139
Harnett 65 1,137
Robeson 61 5,837
Halifax 33 1,843
Northampton 12 359
Source: North Carolina Department of Commerce, Division of Employment Security, Quarterly Census of Employment and Wages (QCEW).
Cambridge Systematics, Inc.
1.2 THE LINKAGE BETWEEN
AND ECONOMIC
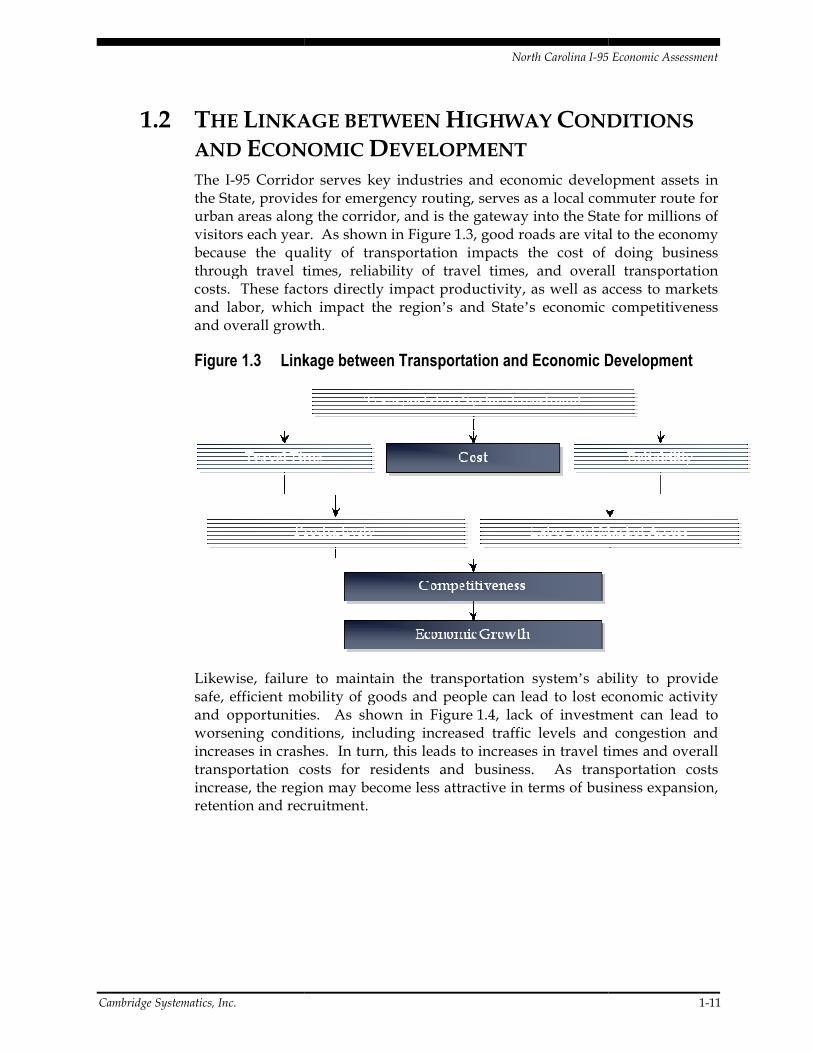
The I-95 Corridor serves key industries and economic development assets in the State, provides for emergency routing, serves as a local commuter route for urban areas along the corridor, and is the gateway into the visitors each year. As shown in because the quality of transportation impacts the cost of doing business through travel times, reliability of travel times, and overall transportation costs. These factors directly impact productivity, as well as access to markets and labor, which impact the regionand overall growth.
Figure 1.3 Linkage between Transportat
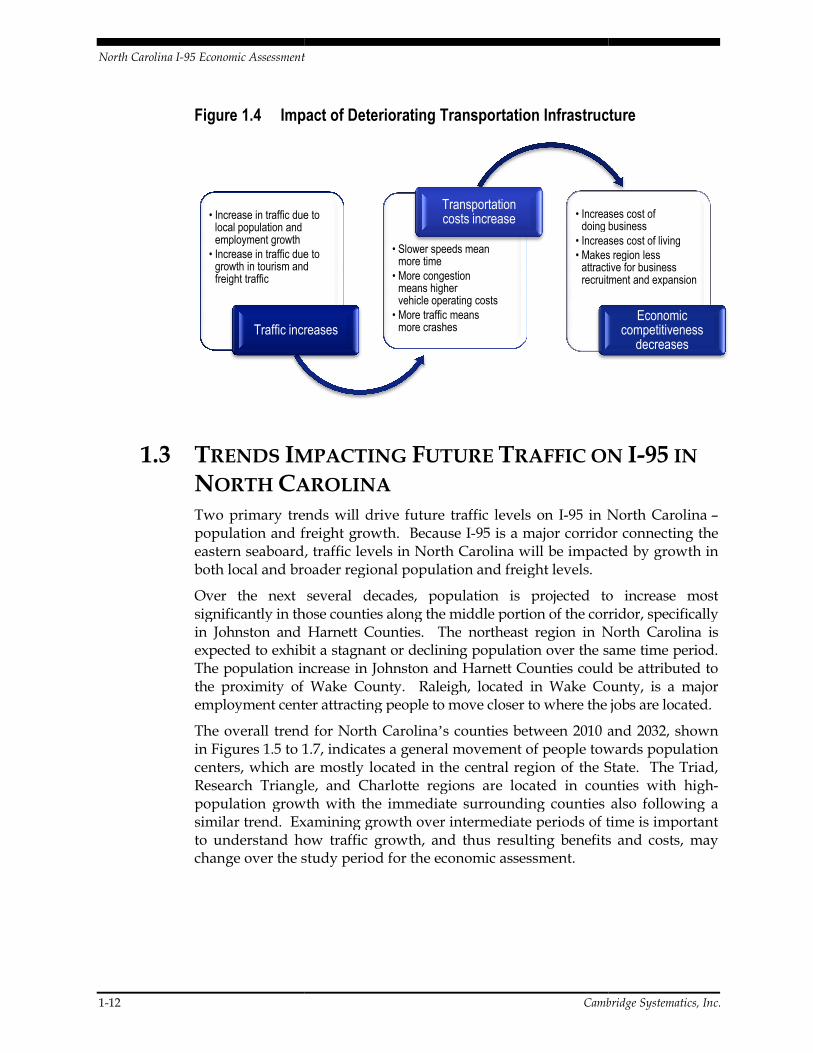
Likewise, failure to maintain the transportation systemsafe, efficient mobility of goods and people can lead to lost economic activity and opportunities. As shown in worsening conditions, including increased traffic levels and congestion and increases in crashes. In turn, this leads to increases in travel times and overall transportation costs for residents and business. As transportation costs increase, the region may become less attractive in terms of business expansion, retention and recruitment.
North Carolina I-95 Economic
INKAGE BETWEEN HIGHWAY CONDITIONS
CONOMIC DEVELOPMENT 95 Corridor serves key industries and economic development assets in tate, provides for emergency routing, serves as a local commuter route for
urban areas along the corridor, and is the gateway into the Statevisitors each year. As shown in Figure 1.3, good roads are vital to the economy because the quality of transportation impacts the cost of doing business through travel times, reliability of travel times, and overall transportation
These factors directly impact productivity, as well as access to markets and labor, which impact the region’s and State’s economic competitiveness and overall growth.
Linkage between Transportation and Economic Development
Likewise, failure to maintain the transportation system’s ability to provide safe, efficient mobility of goods and people can lead to lost economic activity and opportunities. As shown in Figure 1.4, lack of investment can lworsening conditions, including increased traffic levels and congestion and increases in crashes. In turn, this leads to increases in travel times and overall transportation costs for residents and business. As transportation costs
egion may become less attractive in terms of business expansion, retention and recruitment.
95 Economic Assessment
1-11
ONDITIONS
95 Corridor serves key industries and economic development assets in tate, provides for emergency routing, serves as a local commuter route for
tate for millions of 1.3, good roads are vital to the economy
because the quality of transportation impacts the cost of doing business through travel times, reliability of travel times, and overall transportation
These factors directly impact productivity, as well as access to markets s economic competitiveness
ion and Economic Development
s ability to provide safe, efficient mobility of goods and people can lead to lost economic activity
1.4, lack of investment can lead to worsening conditions, including increased traffic levels and congestion and increases in crashes. In turn, this leads to increases in travel times and overall transportation costs for residents and business. As transportation costs
egion may become less attractive in terms of business expansion,
North Carolina I-95 Economic Assessment
1-12
Figure 1.4 Impact of Deteriorating Transportation Infrastructure
1.3 TRENDS IMPACTING
NORTH CAROLINA
Two primary trends will drive future traffic levels on population and freight growth. Because eastern seaboard, traffic levels in North Carolina will be impacted by growth in both local and broader regional population and freight levels.
Over the next several decades, population is projected to increase most significantly in those counties along the middle portion of the corridor, specifically in Johnston and Harnett Counties. Theexpected to exhibit a stagnant or declining population over the same time period. The population increase in Johnston and Harnett Counties could be attributed to the proximity of Wake County. Raleigh, located in Wakemployment center attracting people to move closer to where the jobs are located.
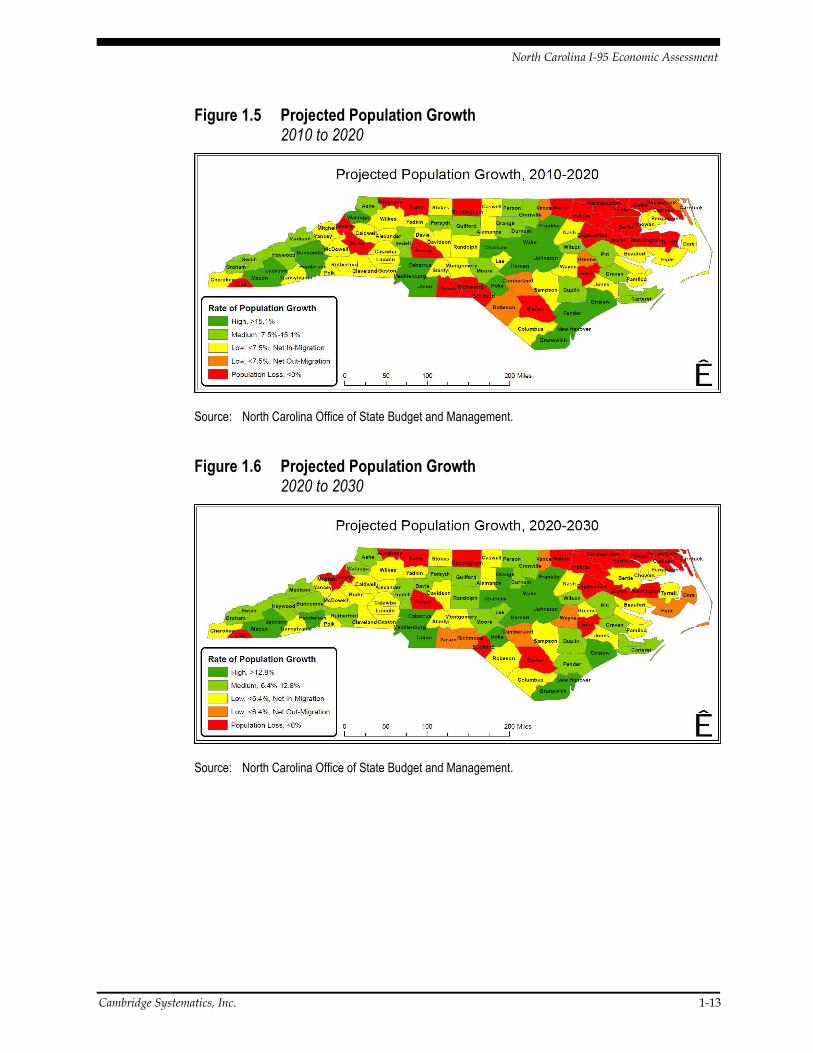
The overall trend for North Carolinain Figures 1.5 to 1.7, indicates a general movement of people towards popucenters, which are mostly located in the central region of the Research Triangle, and Charlotte regions arpopulation growth with the immediate surrounding counties also following a similar trend. Examining growth over intermediate periods of time is important to understand how traffic growth, and thus resulting benefits and costs, may change over the study period for the economic assessment.
• Increase in traffic due to local population and employment growth
• Increase in traffic due to growth in tourism and freight traffic
Traffic increases
95 Economic Assessment
Cambridge Systematics, Inc.
Impact of Deteriorating Transportation Infrastructure
MPACTING FUTURE TRAFFIC ON
AROLINA Two primary trends will drive future traffic levels on I-95 in North Carolinapopulation and freight growth. Because I-95 is a major corridor connecting the eastern seaboard, traffic levels in North Carolina will be impacted by growth in
ocal and broader regional population and freight levels.
Over the next several decades, population is projected to increase most significantly in those counties along the middle portion of the corridor, specifically in Johnston and Harnett Counties. The northeast region in North Carolina is expected to exhibit a stagnant or declining population over the same time period. The population increase in Johnston and Harnett Counties could be attributed to the proximity of Wake County. Raleigh, located in Wake County, is a major employment center attracting people to move closer to where the jobs are located.
The overall trend for North Carolina’s counties between 2010 and 2032, shown 1.5 to 1.7, indicates a general movement of people towards popu
centers, which are mostly located in the central region of the SResearch Triangle, and Charlotte regions are located in counties with highpopulation growth with the immediate surrounding counties also following a
xamining growth over intermediate periods of time is important to understand how traffic growth, and thus resulting benefits and costs, may change over the study period for the economic assessment.
Increase in traffic due to local population and
Increase in traffic due to growth in tourism and
Traffic increases
• Slower speeds mean more time
• More congestion means higher vehicle operating costs
• More traffic means more crashes
Transportation costs increase • Increases cost of
doing business• Increases cost of living• Makes region less attractive for business recruitment and expansion
Cambridge Systematics, Inc.
Impact of Deteriorating Transportation Infrastructure
RAFFIC ON I-95 IN
95 in North Carolina – 95 is a major corridor connecting the
eastern seaboard, traffic levels in North Carolina will be impacted by growth in
Over the next several decades, population is projected to increase most significantly in those counties along the middle portion of the corridor, specifically
northeast region in North Carolina is expected to exhibit a stagnant or declining population over the same time period. The population increase in Johnston and Harnett Counties could be attributed to
e County, is a major employment center attracting people to move closer to where the jobs are located.
s counties between 2010 and 2032, shown 1.5 to 1.7, indicates a general movement of people towards population
State. The Triad, e located in counties with high-
population growth with the immediate surrounding counties also following a xamining growth over intermediate periods of time is important
to understand how traffic growth, and thus resulting benefits and costs, may
Increases cost of doing businessIncreases cost of livingMakes region less attractive for business recruitment and expansion
Economic competitiveness
decreases
North Carolina I-95 Economic Assessment
Cambridge Systematics, Inc. 1-13
Figure 1.5 Projected Population Growth 2010 to 2020
Source: North Carolina Office of State Budget and Management.
Figure 1.6 Projected Population Growth 2020 to 2030
Source: North Carolina Office of State Budget and Management.
North Carolina I-95 Economic Assessment
1-14 Cambridge Systematics, Inc.
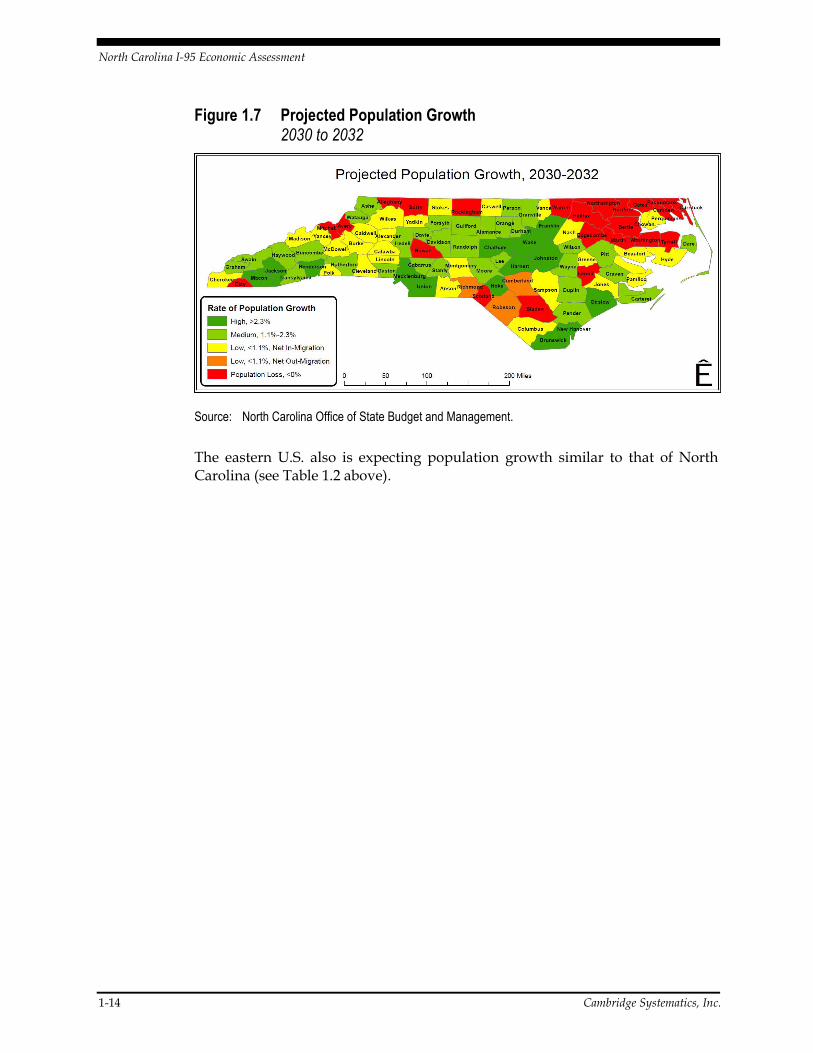
Figure 1.7 Projected Population Growth 2030 to 2032
Source: North Carolina Office of State Budget and Management.
The eastern U.S. also is expecting population growth similar to that of North Carolina (see Table 1.2 above).
North Carolina I-95 Economic Assessment
Cambridge Systematics, Inc. 2-1
2.0 Economic Assessment Methodology
The purpose of the North Carolina I-95 Economic Assessment study is to examine the economic tradeoffs of alternative approaches to improving and funding the proposed improvements to I-95, including making the proposed investment using alternative funding sources and only making those improvements that can be funded using existing revenue sources. The economic analysis framework and process was vetted with the Advisory Council and revised based on their input. Direct economic impacts were developed from the analysis of construction activity, existing and future traffic forecasts, funding options, and broader economic development data collected from various sources, including stakeholders along the Corridor. These direct impacts were used to estimate total impacts, comprised of direct, indirect, and induced impacts using a customized economic model developed by Regional Economic Models, Inc. (REMI). This methodological approach is designed to capture the economic impacts of I-95 transportation performance changes and reactions associated with the alternative investment and funding scenarios.
2.1 STUDY REGION DEFINITION Analysis regions define the level of geography for estimating and reporting the results of the economic assessment. A region can be comprised of a single county or a combination of counties. A single-region county means that the economic impact of I-95 will be estimated and reported specifically for that county. A five-county region means that the impacts will be estimated and reported for the five counties as a whole and not individually. In addition to region-level reporting, two or more regions can be combined to create new, larger regions.
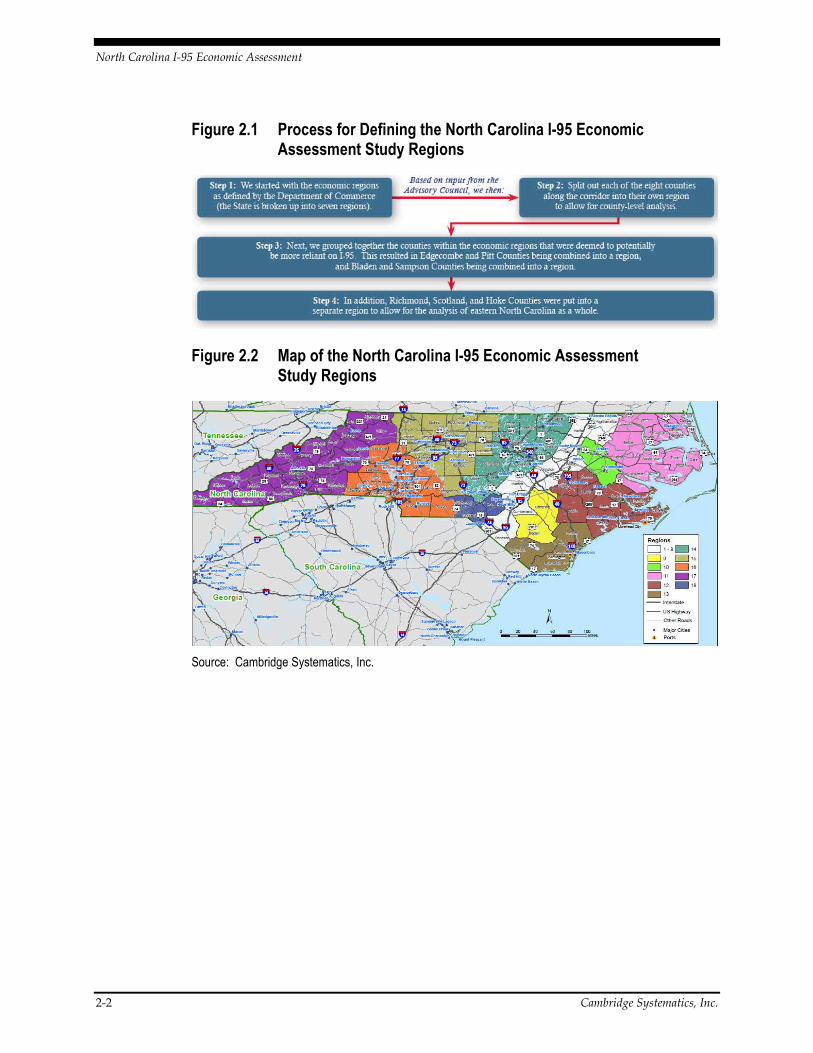
Figure 2.1 depicts the process used to determine the study regions. Through this process, the State was divided into 18 study regions with each of the eight counties along I-95 comprising their own region and the remaining counties being combined into groups of two or more counties. The resulting study groups are displayed in Figure 2.2 and summarized in Table 2.1.
North Carolina I-95 Economic Assessment
2-2 Cambridge Systematics, Inc.
Figure 2.1 Process for Defining the North Carolina I-95 Economic Assessment Study Regions
Figure 2.2 Map of the North Carolina I-95 Economic Assessment Study Regions
Source: Cambridge Systematics, Inc.
North Carolina I-95 Economic Assessment
Cambridge Systematics, Inc. 2-3
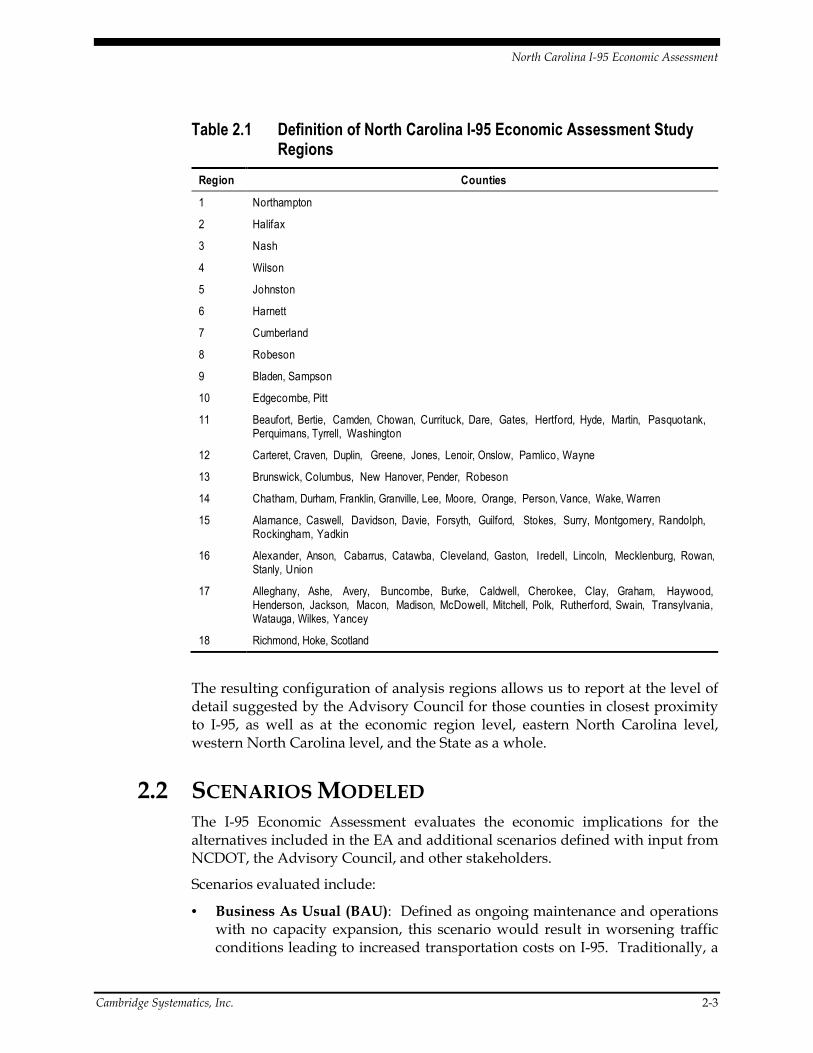
Table 2.1 Definition of North Carolina I-95 Economic Assessment Study Regions
Region Counties
1 Northampton
2 Halifax
3 Nash
4 Wilson
5 Johnston
6 Harnett
7 Cumberland
8 Robeson
9 Bladen, Sampson
10 Edgecombe, Pitt
11 Beaufort, Bertie, Camden, Chowan, Currituck, Dare, Gates, Hertford, Hyde, Martin, Pasquotank, Perquimans, Tyrrell, Washington
12 Carteret, Craven, Duplin, Greene, Jones, Lenoir, Onslow, Pamlico, Wayne
13 Brunswick, Columbus, New Hanover, Pender, Robeson
14 Chatham, Durham, Franklin, Granville, Lee, Moore, Orange, Person, Vance, Wake, Warren
15 Alamance, Caswell, Davidson, Davie, Forsyth, Guilford, Stokes, Surry, Montgomery, Randolph, Rockingham, Yadkin
16 Alexander, Anson, Cabarrus, Catawba, Cleveland, Gaston, Iredell, Lincoln, Mecklenburg, Rowan, Stanly, Union
17 Alleghany, Ashe, Avery, Buncombe, Burke, Caldwell, Cherokee, Clay, Graham, Haywood, Henderson, Jackson, Macon, Madison, McDowell, Mitchell, Polk, Rutherford, Swain, Transylvania, Watauga, Wilkes, Yancey
18 Richmond, Hoke, Scotland
The resulting configuration of analysis regions allows us to report at the level of detail suggested by the Advisory Council for those counties in closest proximity to I-95, as well as at the economic region level, eastern North Carolina level, western North Carolina level, and the State as a whole.
2.2 SCENARIOS MODELED The I-95 Economic Assessment evaluates the economic implications for the alternatives included in the EA and additional scenarios defined with input from NCDOT, the Advisory Council, and other stakeholders.
Scenarios evaluated include:
• Business As Usual (BAU): Defined as ongoing maintenance and operations with no capacity expansion, this scenario would result in worsening traffic conditions leading to increased transportation costs on I-95. Traditionally, a
North Carolina I-95 Economic Assessment
2-4 Cambridge Systematics, Inc.
base case scenario is compared to an improved network scenario, but in this study, an examination of how transportation costs are likely to change with limited improvements was needed. Thus, the team developed a BAU scenario to estimate the potential of foregone economic activity if improvements are not made to I-95.
• Build – No Specific Funding: Defined as the implementation of the proposed improvements based on the EA, including rebuilding and expanding the entire corridor, without assuming any increase in any state or local taxes or fees. This focuses on the positive impacts of improved traffic conditions and the influx of construction activity, while ignoring potential negative impacts associated with increasing taxes or fees to pay for the investment. While this scenario is unrealistic, it was necessary to be able to separate the impacts of the improvements from the impacts of funding options.
• Build – Fund via Tolls: This is the same improvements as in the Build – No Specific Funding scenario, but it also includes modeling the impacts of tolling.
• Build – Fund via Mitigated Tolls: This scenario modifies the previous scenario by including a 50 percent reduction in the toll rates for local residents and businesses.
• Build – Fund via Alternative Funding: This scenario includes improving, rebuild and expand entire corridor as outlined above, and raising various state and local taxes and fees to pay for it.
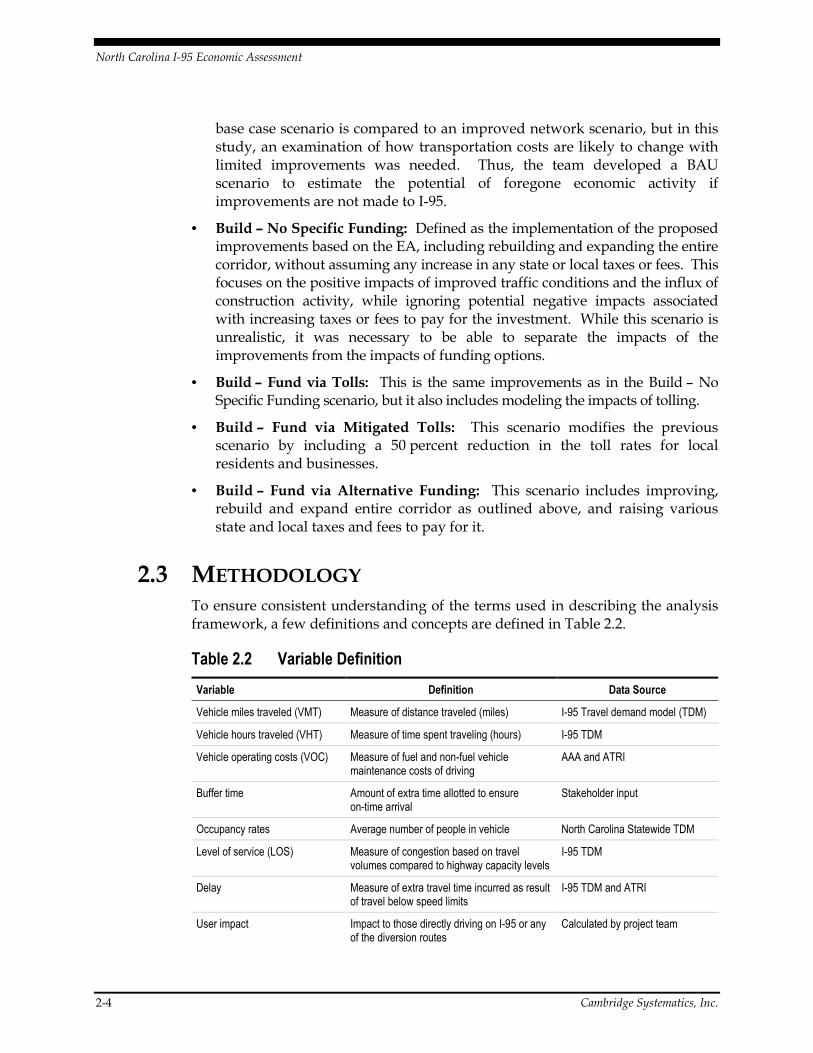
2.3 METHODOLOGY To ensure consistent understanding of the terms used in describing the analysis framework, a few definitions and concepts are defined in Table 2.2.
Table 2.2 Variable Definition
Variable Definition Data Source
Vehicle miles traveled (VMT) Measure of distance traveled (miles) I-95 Travel demand model (TDM)
Vehicle hours traveled (VHT) Measure of time spent traveling (hours) I-95 TDM
Vehicle operating costs (VOC) Measure of fuel and non-fuel vehicle maintenance costs of driving
AAA and ATRI
Buffer time Amount of extra time allotted to ensure on-time arrival
Stakeholder input
Occupancy rates Average number of people in vehicle North Carolina Statewide TDM
Level of service (LOS) Measure of congestion based on travel volumes compared to highway capacity levels
I-95 TDM
Delay Measure of extra travel time incurred as result of travel below speed limits
I-95 TDM and ATRI
User impact Impact to those directly driving on I-95 or any of the diversion routes
Calculated by project team
North Carolina I-95 Economic Assessment
Cambridge Systematics, Inc. 2-5
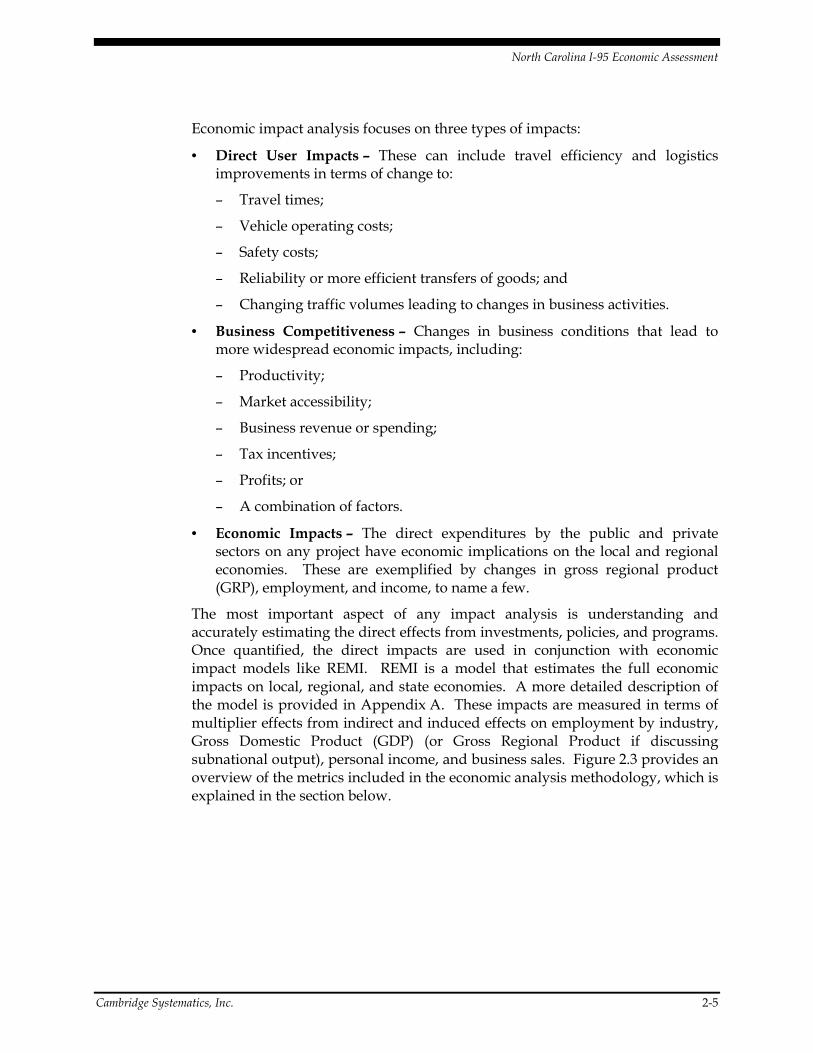
Economic impact analysis focuses on three types of impacts:
• Direct User Impacts – These can include travel efficiency and logistics improvements in terms of change to:
– Travel times;
– Vehicle operating costs;
– Safety costs;
– Reliability or more efficient transfers of goods; and
– Changing traffic volumes leading to changes in business activities.
• Business Competitiveness – Changes in business conditions that lead to more widespread economic impacts, including:
– Productivity;
– Market accessibility;
– Business revenue or spending;
– Tax incentives;
– Profits; or
– A combination of factors.
• Economic Impacts – The direct expenditures by the public and private sectors on any project have economic implications on the local and regional economies. These are exemplified by changes in gross regional product (GRP), employment, and income, to name a few.
The most important aspect of any impact analysis is understanding and accurately estimating the direct effects from investments, policies, and programs. Once quantified, the direct impacts are used in conjunction with economic impact models like REMI. REMI is a model that estimates the full economic impacts on local, regional, and state economies. A more detailed description of the model is provided in Appendix A. These impacts are measured in terms of multiplier effects from indirect and induced effects on employment by industry, Gross Domestic Product (GDP) (or Gross Regional Product if discussing subnational output), personal income, and business sales. Figure 2.3 provides an overview of the metrics included in the economic analysis methodology, which is explained in the section below.
North Carolina I-95 Economic Assessment
2-6
Figure 2.3 Impact Metrics for
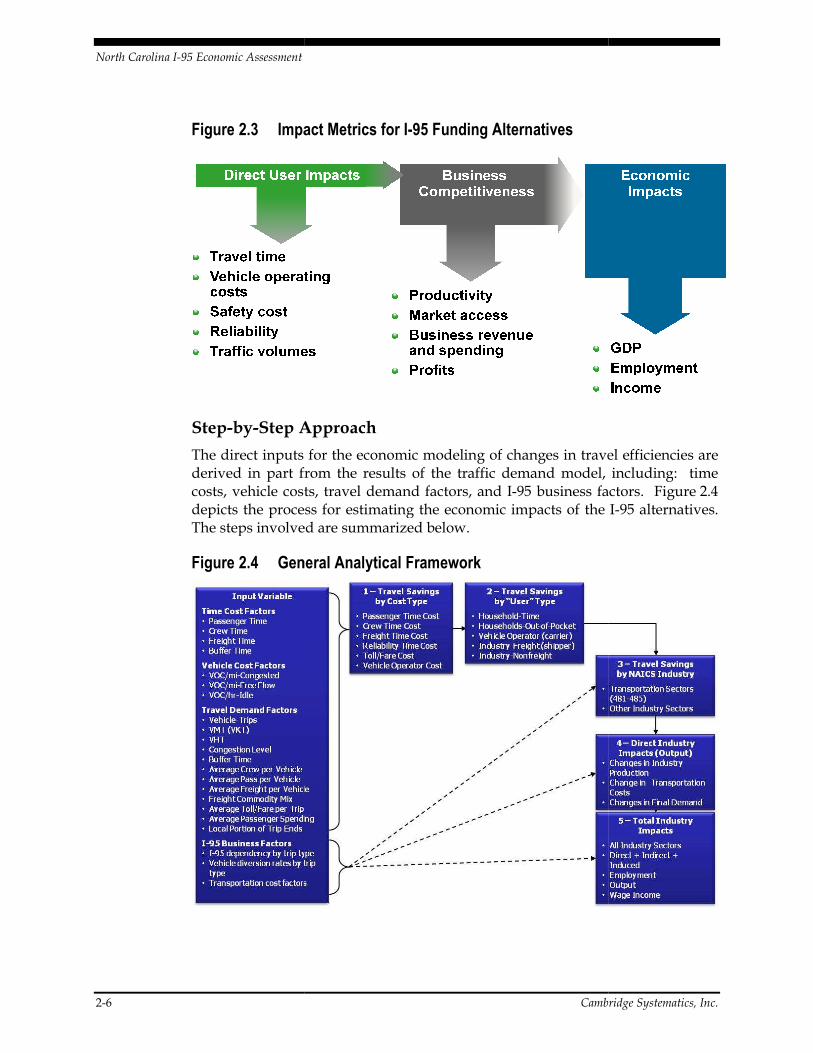
Step-by-Step A
The direct inputs for the economic modeling of changes in travel efficiencies are derived in part from the results of thecosts, vehicle costs, travel demand factors, and depicts the process for estimating the economic impacts of the The steps involved are summarized below.
Figure 2.4 General Analytical Framework
Cambridge Systematics, Inc.
Impact Metrics for I-95 Funding Alternatives
Approach
The direct inputs for the economic modeling of changes in travel efficiencies are derived in part from the results of the traffic demand model, includingcosts, vehicle costs, travel demand factors, and I-95 business factors. depicts the process for estimating the economic impacts of the The steps involved are summarized below.
General Analytical Framework
Cambridge Systematics, Inc.
The direct inputs for the economic modeling of changes in travel efficiencies are traffic demand model, including: time
95 business factors. Figure 2.4 depicts the process for estimating the economic impacts of the I-95 alternatives.
North Carolina I-95 Economic Assessment
Cambridge Systematics, Inc. 2-7
Step 1 – The travel savings are defined by category and then by stakeholder-cost type to include cost type and user type. Costs associated with travel savings include passenger or crew time, freight time, reliability, toll, and vehicle operating costs. These travel costs are influenced by changes in travel time and distance as well as I-95 business factors, which contribute to the magnitude of changes in transportation costs.
Step 2 – The monetized costs are then assigned to specific users incurring these costs, which include households, carriers, freight shippers, and nonfreight industries.
Household travel activity is divided into business and leisure travel to capture the different values of time associated with each activity, which impacts the economy differently. Business-related auto travel costs are borne by the employer, whereas nonbusiness travel costs, including commute time, are borne by the individual as a personal expense or foregone benefits. In the case of the freight and freight-related industries, vehicle operators (carriers), shippers, and other industries and businesses bear the burden of the cost (or reap the benefit).
Each user travel savings (or cost) is estimated and assigned to the appropriate industry, including private households. Stakeholder input is critical to the analysis in providing insights to understanding specific nuances in the local economy, such as carrier and freight shipper operating details. For example, the amount of buffer time applied to local trucking industries was provided by interviewees during the outreach activities.
Steps 3 and 4, depicted in Figure 2.3, drill down on the process of converting estimated transportation costs into inputs for the economic model and finally, total economic impacts.
North Carolina I-95 Economic Assessment
2-8 Cambridge Systematics, Inc.
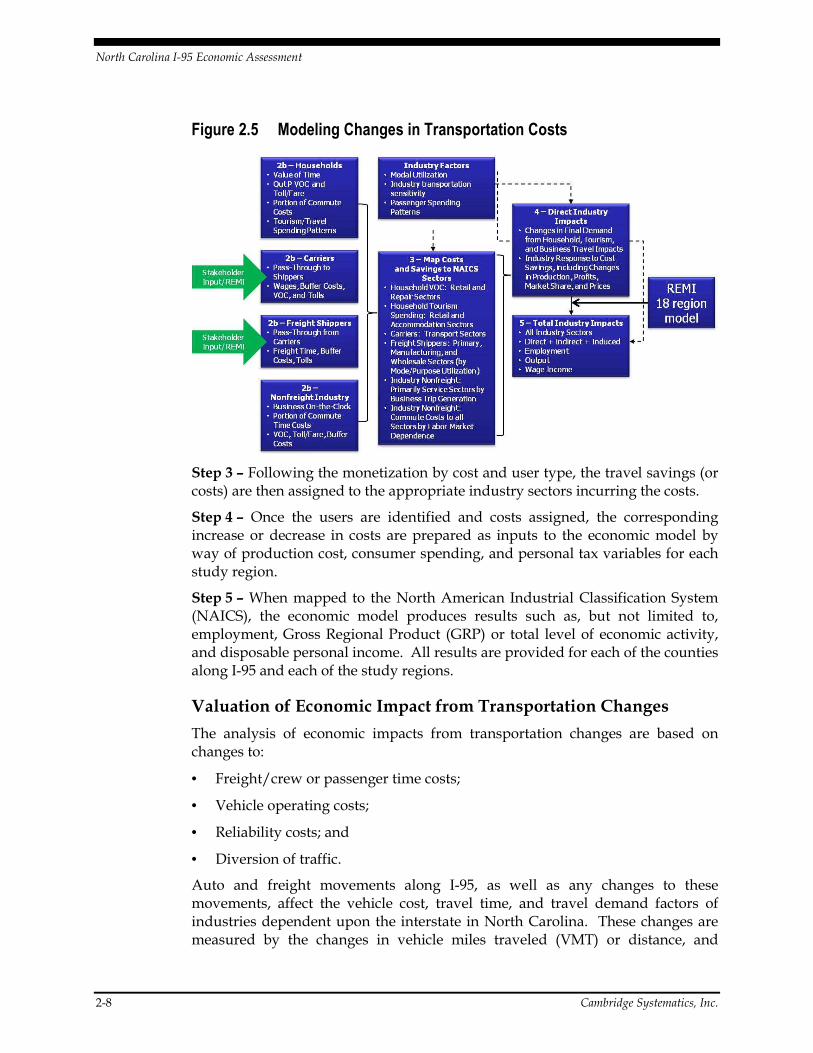
Figure 2.5 Modeling Changes in Transportation Costs
Step 3 – Following the monetization by cost and user type, the travel savings (or costs) are then assigned to the appropriate industry sectors incurring the costs.
Step 4 – Once the users are identified and costs assigned, the corresponding increase or decrease in costs are prepared as inputs to the economic model by way of production cost, consumer spending, and personal tax variables for each study region.
Step 5 – When mapped to the North American Industrial Classification System (NAICS), the economic model produces results such as, but not limited to, employment, Gross Regional Product (GRP) or total level of economic activity, and disposable personal income. All results are provided for each of the counties along I-95 and each of the study regions.
Valuation of Economic Impact from Transportation Changes
The analysis of economic impacts from transportation changes are based on changes to:
• Freight/crew or passenger time costs;
• Vehicle operating costs;
• Reliability costs; and
• Diversion of traffic.
Auto and freight movements along I-95, as well as any changes to these movements, affect the vehicle cost, travel time, and travel demand factors of industries dependent upon the interstate in North Carolina. These changes are measured by the changes in vehicle miles traveled (VMT) or distance, and
North Carolina I-95 Economic Assessment
Cambridge Systematics, Inc. 2-9
vehicle hours traveled (VHT) or total travel time. Both of these metrics are generated from the travel demand forecast discussed above.
Reliability costs are assumed to be insignificant for auto users in this study given the current and short-term congestion levels revealed in the travel demand model (TDM) outputs and stakeholder input. On the other hand, trucks are estimated to incur some reliability costs based on future congestion projections and concerns voiced by stakeholders during the outreach process. It was assumed that only local truck trip reliability is impacted if improvements are not made on I-95. Thus, the additional truck trip costs are included only in the BAU scenario.
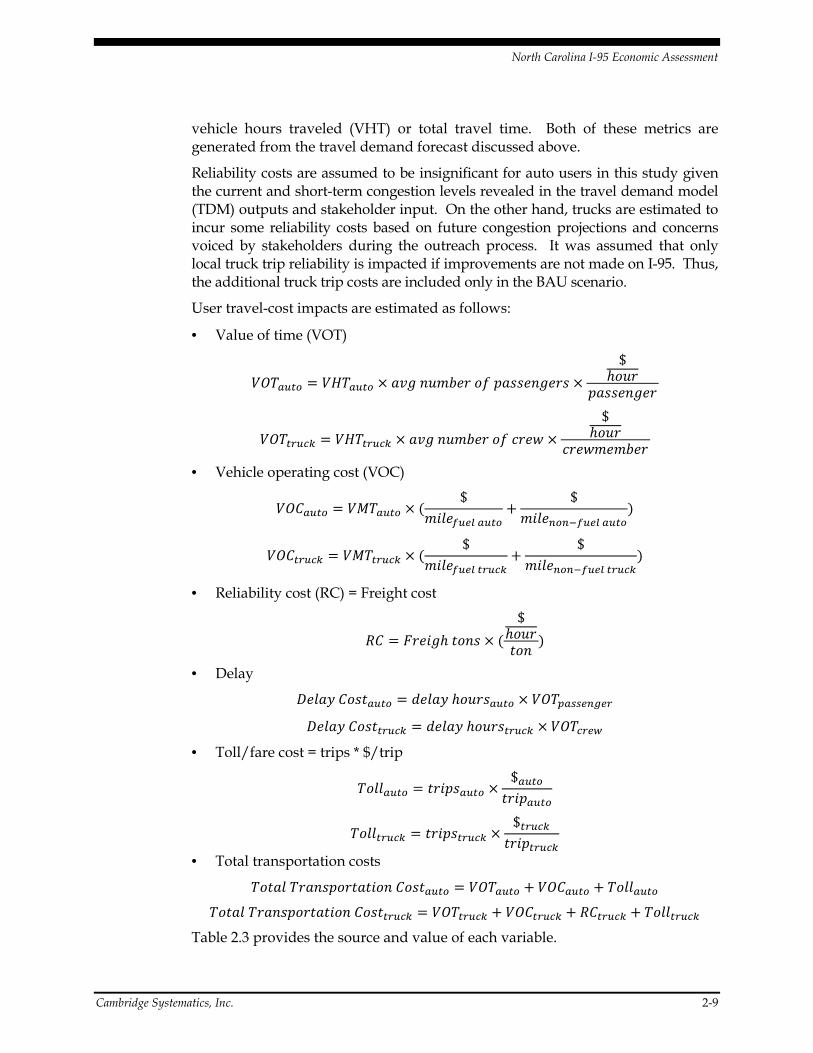
User travel-cost impacts are estimated as follows:
• Value of time (VOT)
������� � ������ �� ������ �� ������ ���
$����
������ ��
�������� � ������� �� ������ �� ����
$����
����������
• Vehicle operating cost (VOC)
�� ���� � �!����� "$
�#$�%�&' ����
($
�#$�)�)*%�&' ����
+
�� ����� � �!������ "$
�#$�%�&' �����
($
�#$�)�)*%�&' �����
+
• Reliability cost (RC) = Freight cost
, � -��# � .��� "
$����.��
+
• Delay
/�$�0 ��.���� � 1�$�0 ��������� ���2�33&)4&�
/�$�0 ��.����� � 1�$�0 ���������� �����&5
• Toll/fare cost = trips * $/trip
��$$���� � .�#������ $����
.�#�����
��$$����� � .�#������� $�����
.�#������
• Total transportation costs
��.�$ ��������.�.#�� ��.���� � ������� ( �� ���� ( ��$$����
��.�$ ��������.�.#�� ��.����� � �������� ( �� ����� ( , ����� ( ��$$�����
Table 2.3 provides the source and value of each variable.
North Carolina I-95 Economic Assessment
2-10 Cambridge Systematics, Inc.
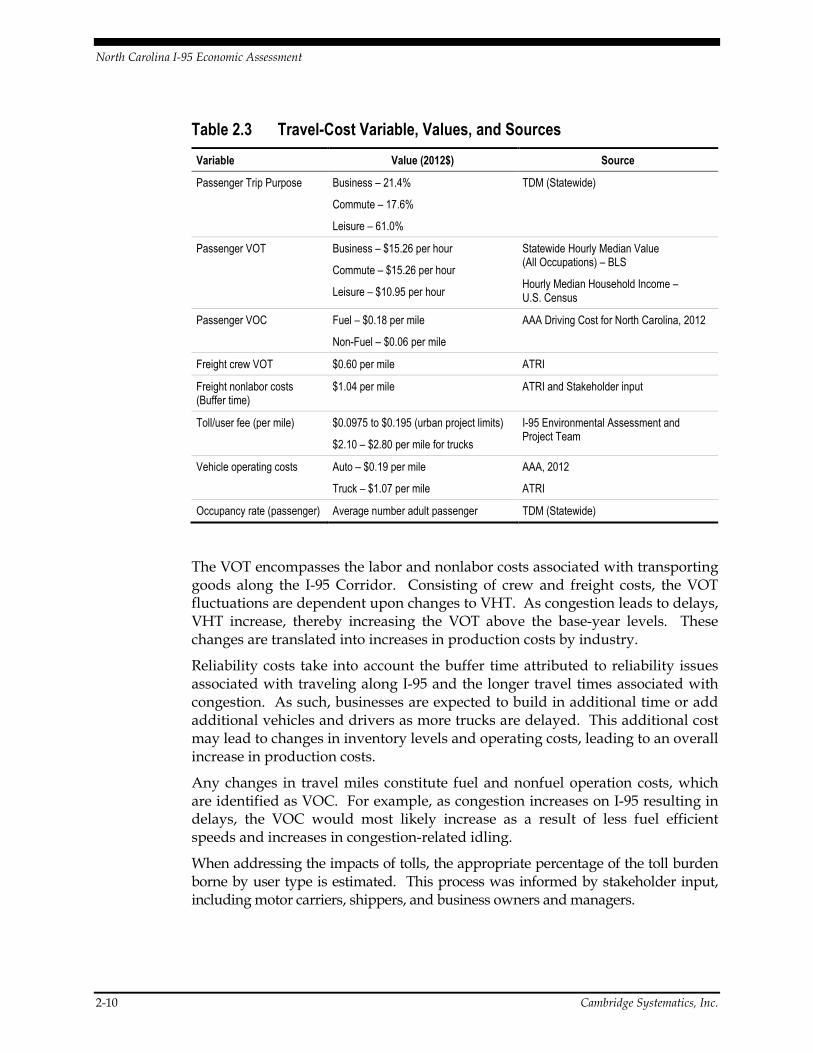
Table 2.3 Travel-Cost Variable, Values, and Sources
Variable Value (2012$) Source
Passenger Trip Purpose
Business – 21.4%
Commute – 17.6%
Leisure – 61.0%
TDM (Statewide)
Passenger VOT Business – $15.26 per hour
Commute – $15.26 per hour
Leisure – $10.95 per hour
Statewide Hourly Median Value (All Occupations) – BLS
Hourly Median Household Income – U.S. Census
Passenger VOC Fuel – $0.18 per mile
Non-Fuel – $0.06 per mile
AAA Driving Cost for North Carolina, 2012
Freight crew VOT $0.60 per mile ATRI
Freight nonlabor costs (Buffer time)
$1.04 per mile ATRI and Stakeholder input
Toll/user fee (per mile) $0.0975 to $0.195 (urban project limits)
$2.10 – $2.80 per mile for trucks
I-95 Environmental Assessment and Project Team
Vehicle operating costs Auto – $0.19 per mile
Truck – $1.07 per mile
AAA, 2012
ATRI
Occupancy rate (passenger) Average number adult passenger TDM (Statewide)
The VOT encompasses the labor and nonlabor costs associated with transporting goods along the I-95 Corridor. Consisting of crew and freight costs, the VOT fluctuations are dependent upon changes to VHT. As congestion leads to delays, VHT increase, thereby increasing the VOT above the base-year levels. These changes are translated into increases in production costs by industry.
Reliability costs take into account the buffer time attributed to reliability issues associated with traveling along I-95 and the longer travel times associated with congestion. As such, businesses are expected to build in additional time or add additional vehicles and drivers as more trucks are delayed. This additional cost may lead to changes in inventory levels and operating costs, leading to an overall increase in production costs.
Any changes in travel miles constitute fuel and nonfuel operation costs, which are identified as VOC. For example, as congestion increases on I-95 resulting in delays, the VOC would most likely increase as a result of less fuel efficient speeds and increases in congestion-related idling.
When addressing the impacts of tolls, the appropriate percentage of the toll burden borne by user type is estimated. This process was informed by stakeholder input, including motor carriers, shippers, and business owners and managers.
North Carolina I-95 Economic Assessment
Cambridge Systematics, Inc. 2-11
Key Assumptions
When conducting any economic analysis, assumptions regarding certain aspects of the analysis are required. A summary of the most important assumptions employed in the current study are as follows:
From the CTDM, it is assumed that businesses and households in the county of origin would bear the burden of the costs associated with each scenario modeled. To obtain this information, the trip table from the CTDM is used to determine the percentage of I-95 trips originating from each study region.
Key auto and truck assumptions and methodology are provided below.
• Buffer Time
– Auto – As discussed previously, auto buffer time is not modeled given the current and short-term congestion levels. Additionally, it is assumed that nonbusiness, leisure travel is less sensitive to changes in travel time as there is a lower sense of ‘urgency.’
– Trucks – Changes in costs are only estimated for the BAU scenario and did not include impacts until 2020, given the lack of congestion currently and in the nearer term. Based on data collected as part of the EA, it is estimated that 60 percent of all truck trips are local or short distance trips. These shorter trips are most likely to be impacted by reliability concerns. Most longer-haul trucks traveling through the State via I-95 are not expected to increase buffer time, as it is assumed the lost time will be made up on another portion of the trip. The shorter local truck trips averaging approximately 30 miles a day, however, are more susceptible to changes in reliability. Based on stakeholder interviews, many shippers and carriers attempt to get two or three trips per day per truck. They indicated that if there is, on average, 45 minutes of delay on the first trip or second trip, they would not be able to make their final trip. This is not the case for all short trips. Therefore, it is assumed that a conservative 5 percent increase in number of short truck trips beginning in 2020, rising to 20 percent by 2040 will be required to deliver the same amount of goods. The increased costs associated with these additional trips are applied to truck operating costs under the BAU scenario.
6����� �#�������3 �7����$ ��#�������3 60% 7�����1 ��#� ;������� 30 �#$�� "�� �����3 ( ��������3+
• Lost Sales Due to Diversion
– The potential diversion due to increases in time and/or mileage caused by congestion or a toll is estimated to manifest in the form of lost sales for local businesses along the corridor. In other words, it is assumed that increases in diversion would lead to a loss in “drop-in” business, which averages approximately 60 (percent based on stakeholder interview input) along the corridor. It is assumed that accommodation, eating, and
North Carolina I-95 Economic Assessment
2-12 Cambridge Systematics, Inc.
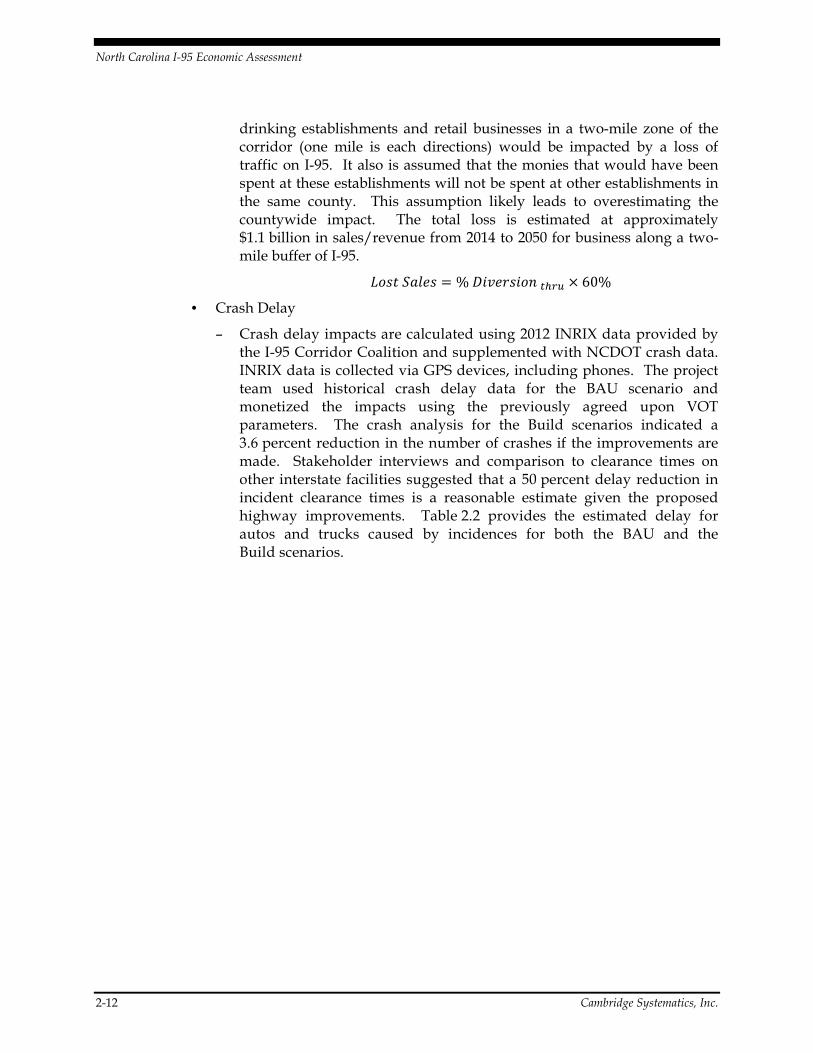
drinking establishments and retail businesses in a two-mile zone of the corridor (one mile is each directions) would be impacted by a loss of traffic on I-95. It also is assumed that the monies that would have been spent at these establishments will not be spent at other establishments in the same county. This assumption likely leads to overestimating the countywide impact. The total loss is estimated at approximately $1.1 billion in sales/revenue from 2014 to 2050 for business along a two-mile buffer of I-95.
=��. >�$�� � % /#����#�� �?�� 60%
• Crash Delay
– Crash delay impacts are calculated using 2012 INRIX data provided by the I-95 Corridor Coalition and supplemented with NCDOT crash data. INRIX data is collected via GPS devices, including phones. The project team used historical crash delay data for the BAU scenario and monetized the impacts using the previously agreed upon VOT parameters. The crash analysis for the Build scenarios indicated a 3.6 percent reduction in the number of crashes if the improvements are made. Stakeholder interviews and comparison to clearance times on other interstate facilities suggested that a 50 percent delay reduction in incident clearance times is a reasonable estimate given the proposed highway improvements. Table 2.2 provides the estimated delay for autos and trucks caused by incidences for both the BAU and the Build scenarios.
North Carolina I-95 Economic Assessment
Cambridge Systematics, Inc. 2-13
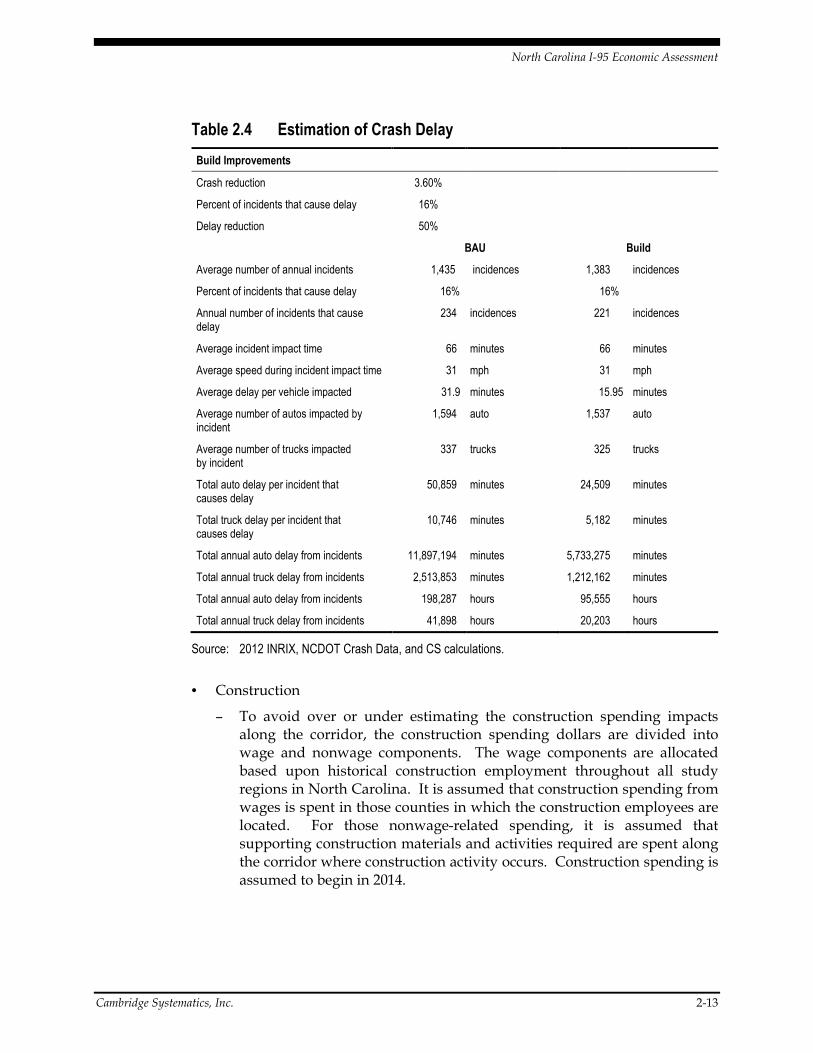
Table 2.4 Estimation of Crash Delay
Build Improvements
Crash reduction 3.60%
Percent of incidents that cause delay 16%
Delay reduction 50%
BAU Build
Average number of annual incidents 1,435 incidences 1,383 incidences
Percent of incidents that cause delay 16% 16%
Annual number of incidents that cause delay
234 incidences 221 incidences
Average incident impact time 66 minutes 66 minutes
Average speed during incident impact time 31 mph 31 mph
Average delay per vehicle impacted 31.9 minutes 15.95 minutes
Average number of autos impacted by incident
1,594 auto 1,537 auto
Average number of trucks impacted by incident
337 trucks 325 trucks
Total auto delay per incident that causes delay
50,859 minutes 24,509 minutes
Total truck delay per incident that causes delay
10,746 minutes 5,182 minutes
Total annual auto delay from incidents 11,897,194 minutes 5,733,275 minutes
Total annual truck delay from incidents 2,513,853 minutes 1,212,162 minutes
Total annual auto delay from incidents 198,287 hours 95,555 hours
Total annual truck delay from incidents 41,898 hours 20,203 hours
Source: 2012 INRIX, NCDOT Crash Data, and CS calculations.
• Construction
– To avoid over or under estimating the construction spending impacts along the corridor, the construction spending dollars are divided into wage and nonwage components. The wage components are allocated based upon historical construction employment throughout all study regions in North Carolina. It is assumed that construction spending from wages is spent in those counties in which the construction employees are located. For those nonwage-related spending, it is assumed that supporting construction materials and activities required are spent along the corridor where construction activity occurs. Construction spending is assumed to begin in 2014.

North Carolina I-95 Economic Assessment
Cambridge Systematics, Inc. 3-1
3.0 Economic Assessments Results
The following section presents results from the REMI economic model for each scenario. All results are for the study period 2014 to 2050, in constant 2012 dollars. For comparison purposes, three tiers of regional impact analysis are presented:
• Impacts to the I-95 corridor;
• Impacts to Eastern North Carolina (defined as east of I-95); and
• Impacts to the rest of the State of North Carolina.
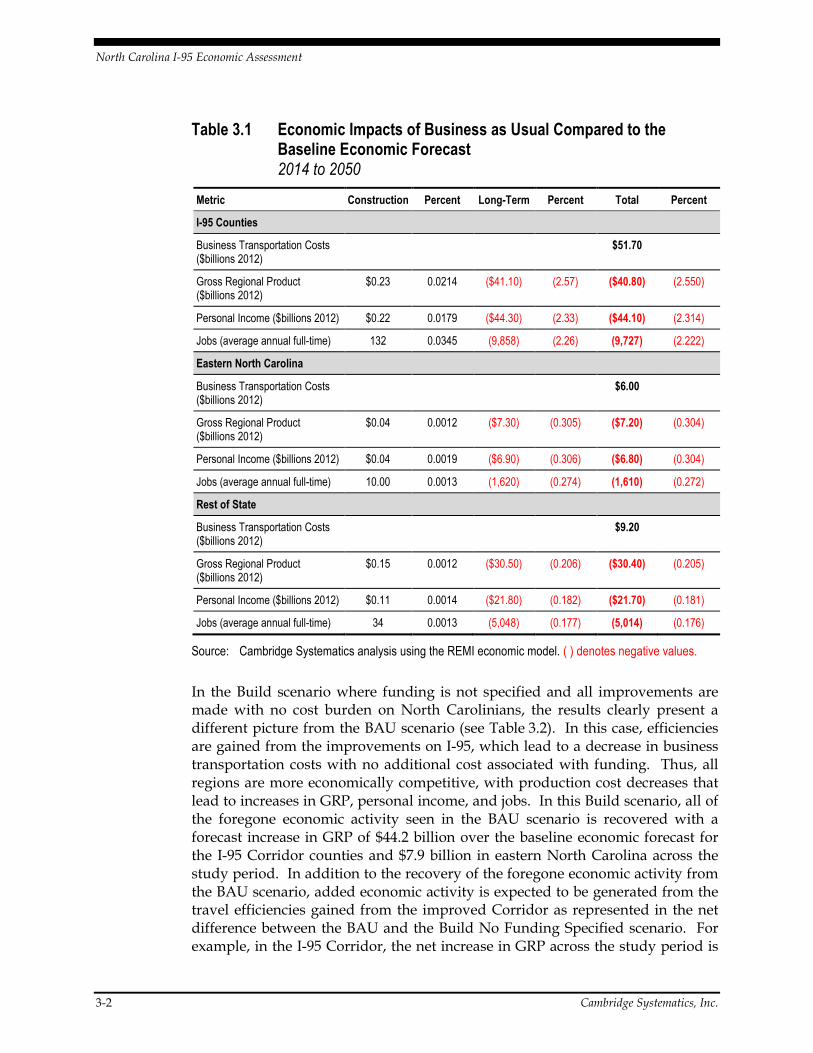
The BAU scenario assumes ongoing maintenance and operations without any of the proposed improvements stated in the EA. Table 3.1 summarizes the economic impacts of Business as Usual over the period 2014 to 2050. The forecasted increase in population and subsequent economic activity is expected to lead to worsening traffic conditions along I-95, which is expected to increase business transportation costs for all regions. These costs increase to as much as $6.0 billion in eastern North Carolina up to $51.7 billion in the I-95 Corridor, over what costs would be if the current level of travel efficiencies is maintained between 2015 and 2050. These increases in business transportation costs would be expected to lead to a weakening in economic activity as evidenced by decreases in GRP, personal income, and jobs over the study period for all regions.
The BAU scenario presents a significantly negative economic impact to North Carolina. It is important to note the decreases in the economic metrics are not negative levels of economic activity; rather, all results are presented in relation to an economic baseline forecast based on status quo activities. In other words, the economy is growing, but at a slower or reduced rate that is currently projected.
North Carolina I-95 Economic Assessment
3-2 Cambridge Systematics, Inc.
Table 3.1 Economic Impacts of Business as Usual Compared to the Baseline Economic Forecast 2014 to 2050
Metric Construction Percent Long-Term Percent Total Percent
I-95 Counties
Business Transportation Costs ($billions 2012)
$51.70
Gross Regional Product ($billions 2012)
$0.23 0.0214 ($41.10) (2.57) ($40.80) (2.550)
Personal Income ($billions 2012) $0.22 0.0179 ($44.30) (2.33) ($44.10) (2.314)
Jobs (average annual full-time) 132 0.0345 (9,858) (2.26) (9,727) (2.222)
Eastern North Carolina
Business Transportation Costs ($billions 2012)
$6.00
Gross Regional Product ($billions 2012)
$0.04 0.0012 ($7.30) (0.305) ($7.20) (0.304)
Personal Income ($billions 2012) $0.04 0.0019 ($6.90) (0.306) ($6.80) (0.304)
Jobs (average annual full-time) 10.00 0.0013 (1,620) (0.274) (1,610) (0.272)
Rest of State
Business Transportation Costs ($billions 2012)
$9.20
Gross Regional Product ($billions 2012)
$0.15 0.0012 ($30.50) (0.206) ($30.40) (0.205)
Personal Income ($billions 2012) $0.11 0.0014 ($21.80) (0.182) ($21.70) (0.181)
Jobs (average annual full-time) 34 0.0013 (5,048) (0.177) (5,014) (0.176)
Source: Cambridge Systematics analysis using the REMI economic model. ( ) denotes negative values.
In the Build scenario where funding is not specified and all improvements are made with no cost burden on North Carolinians, the results clearly present a different picture from the BAU scenario (see Table 3.2). In this case, efficiencies are gained from the improvements on I-95, which lead to a decrease in business transportation costs with no additional cost associated with funding. Thus, all regions are more economically competitive, with production cost decreases that lead to increases in GRP, personal income, and jobs. In this Build scenario, all of the foregone economic activity seen in the BAU scenario is recovered with a forecast increase in GRP of $44.2 billion over the baseline economic forecast for the I-95 Corridor counties and $7.9 billion in eastern North Carolina across the study period. In addition to the recovery of the foregone economic activity from the BAU scenario, added economic activity is expected to be generated from the travel efficiencies gained from the improved Corridor as represented in the net difference between the BAU and the Build No Funding Specified scenario. For example, in the I-95 Corridor, the net increase in GRP across the study period is
North Carolina I-95 Economic Assessment
Cambridge Systematics, Inc. 3-3
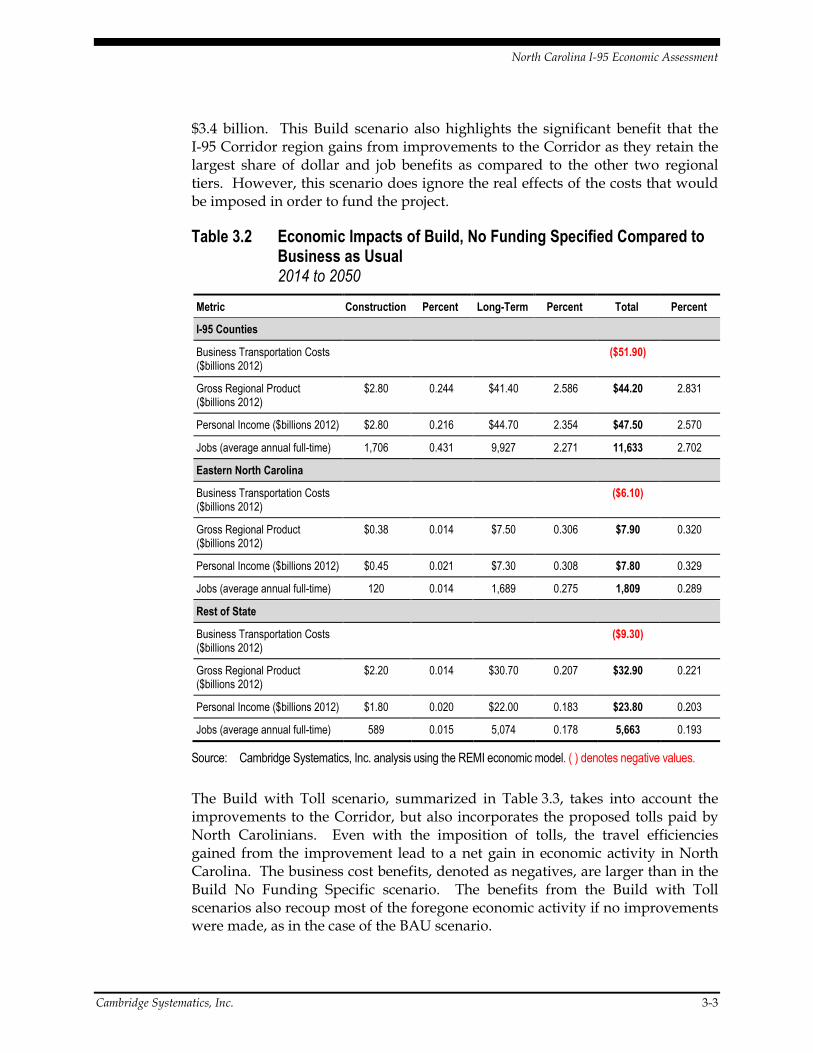
$3.4 billion. This Build scenario also highlights the significant benefit that the I-95 Corridor region gains from improvements to the Corridor as they retain the largest share of dollar and job benefits as compared to the other two regional tiers. However, this scenario does ignore the real effects of the costs that would be imposed in order to fund the project.
Table 3.2 Economic Impacts of Build, No Funding Specified Compared to Business as Usual 2014 to 2050
Metric Construction Percent Long-Term Percent Total Percent
I-95 Counties
Business Transportation Costs ($billions 2012)
($51.90)
Gross Regional Product ($billions 2012)
$2.80 0.244 $41.40 2.586 $44.20 2.831
Personal Income ($billions 2012) $2.80 0.216 $44.70 2.354 $47.50 2.570
Jobs (average annual full-time) 1,706 0.431 9,927 2.271 11,633 2.702
Eastern North Carolina
Business Transportation Costs ($billions 2012)
($6.10)
Gross Regional Product ($billions 2012)
$0.38 0.014 $7.50 0.306 $7.90 0.320
Personal Income ($billions 2012) $0.45 0.021 $7.30 0.308 $7.80 0.329
Jobs (average annual full-time) 120 0.014 1,689 0.275 1,809 0.289
Rest of State
Business Transportation Costs ($billions 2012)
($9.30)
Gross Regional Product ($billions 2012)
$2.20 0.014 $30.70 0.207 $32.90 0.221
Personal Income ($billions 2012) $1.80 0.020 $22.00 0.183 $23.80 0.203
Jobs (average annual full-time) 589 0.015 5,074 0.178 5,663 0.193
Source: Cambridge Systematics, Inc. analysis using the REMI economic model. ( ) denotes negative values.
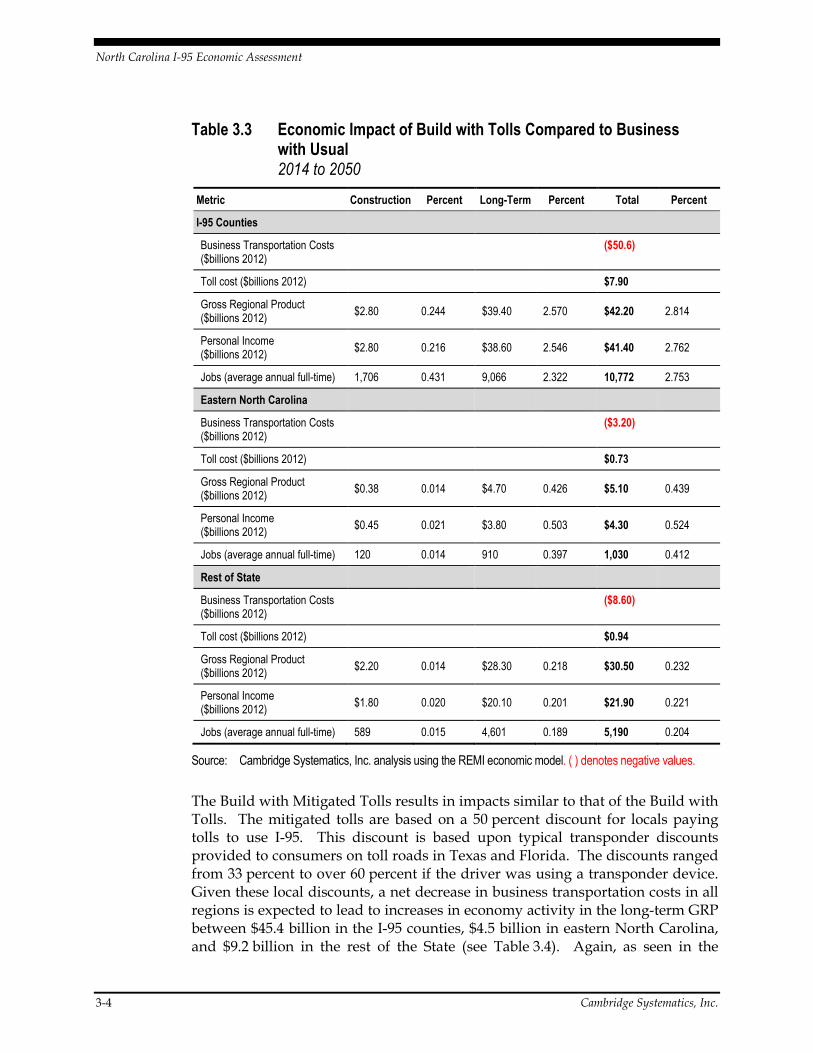
The Build with Toll scenario, summarized in Table 3.3, takes into account the improvements to the Corridor, but also incorporates the proposed tolls paid by North Carolinians. Even with the imposition of tolls, the travel efficiencies gained from the improvement lead to a net gain in economic activity in North Carolina. The business cost benefits, denoted as negatives, are larger than in the Build No Funding Specific scenario. The benefits from the Build with Toll scenarios also recoup most of the foregone economic activity if no improvements were made, as in the case of the BAU scenario.
North Carolina I-95 Economic Assessment
3-4 Cambridge Systematics, Inc.
Table 3.3 Economic Impact of Build with Tolls Compared to Business with Usual 2014 to 2050
Metric Construction Percent Long-Term Percent Total Percent
I-95 Counties
Business Transportation Costs ($billions 2012)
($50.6)
Toll cost ($billions 2012)
$7.90
Gross Regional Product ($billions 2012)
$2.80 0.244 $39.40 2.570 $42.20 2.814
Personal Income ($billions 2012)
$2.80 0.216 $38.60 2.546 $41.40 2.762
Jobs (average annual full-time) 1,706 0.431 9,066 2.322 10,772 2.753
Eastern North Carolina
Business Transportation Costs ($billions 2012)
($3.20)
Toll cost ($billions 2012)
$0.73
Gross Regional Product ($billions 2012)
$0.38 0.014 $4.70 0.426 $5.10 0.439
Personal Income ($billions 2012)
$0.45 0.021 $3.80 0.503 $4.30 0.524
Jobs (average annual full-time) 120 0.014 910 0.397 1,030 0.412
Rest of State
Business Transportation Costs ($billions 2012)
($8.60)
Toll cost ($billions 2012)
$0.94
Gross Regional Product ($billions 2012)
$2.20 0.014 $28.30 0.218 $30.50 0.232
Personal Income ($billions 2012)
$1.80 0.020 $20.10 0.201 $21.90 0.221
Jobs (average annual full-time) 589 0.015 4,601 0.189 5,190 0.204
Source: Cambridge Systematics, Inc. analysis using the REMI economic model. ( ) denotes negative values.
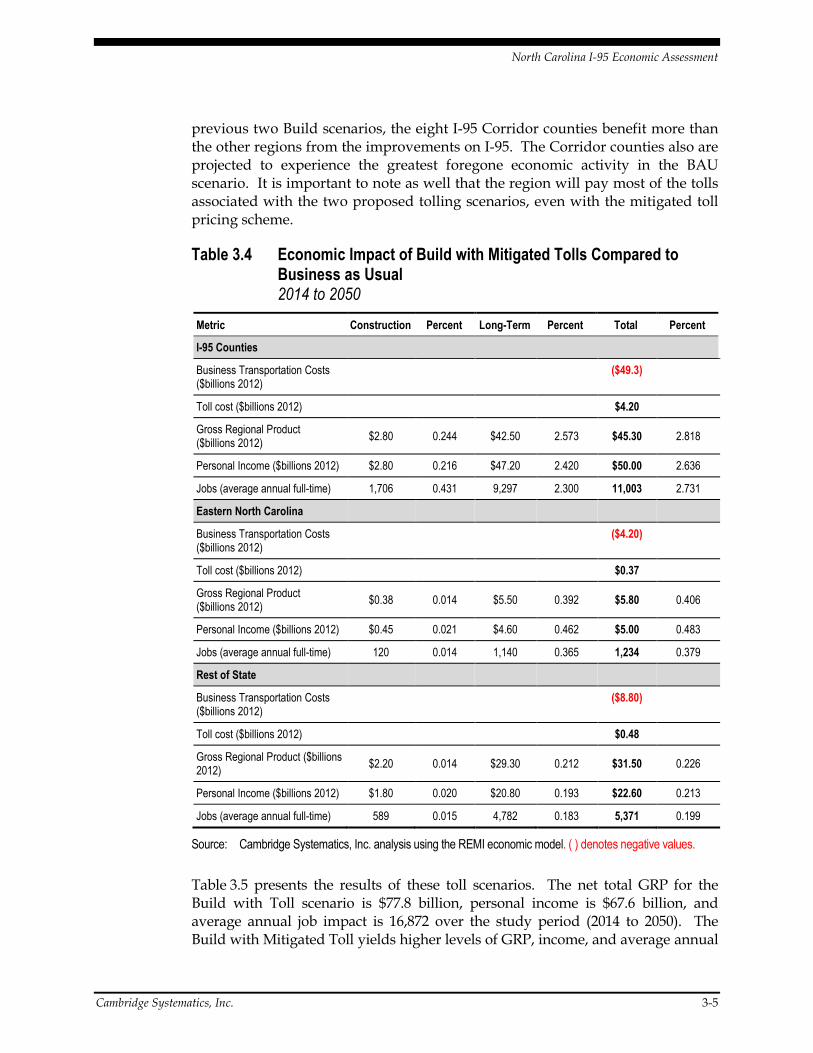
The Build with Mitigated Tolls results in impacts similar to that of the Build with Tolls. The mitigated tolls are based on a 50 percent discount for locals paying tolls to use I-95. This discount is based upon typical transponder discounts provided to consumers on toll roads in Texas and Florida. The discounts ranged from 33 percent to over 60 percent if the driver was using a transponder device. Given these local discounts, a net decrease in business transportation costs in all regions is expected to lead to increases in economy activity in the long-term GRP between $45.4 billion in the I-95 counties, $4.5 billion in eastern North Carolina, and $9.2 billion in the rest of the State (see Table 3.4). Again, as seen in the
North Carolina I-95 Economic Assessment
Cambridge Systematics, Inc. 3-5
previous two Build scenarios, the eight I-95 Corridor counties benefit more than the other regions from the improvements on I-95. The Corridor counties also are projected to experience the greatest foregone economic activity in the BAU scenario. It is important to note as well that the region will pay most of the tolls associated with the two proposed tolling scenarios, even with the mitigated toll pricing scheme.
Table 3.4 Economic Impact of Build with Mitigated Tolls Compared to Business as Usual 2014 to 2050
Metric Construction Percent Long-Term Percent Total Percent
I-95 Counties
Business Transportation Costs ($billions 2012)
($49.3)
Toll cost ($billions 2012)
$4.20
Gross Regional Product ($billions 2012)
$2.80 0.244 $42.50 2.573 $45.30 2.818
Personal Income ($billions 2012) $2.80 0.216 $47.20 2.420 $50.00 2.636
Jobs (average annual full-time) 1,706 0.431 9,297 2.300 11,003 2.731
Eastern North Carolina
Business Transportation Costs ($billions 2012)
($4.20)
Toll cost ($billions 2012)
$0.37
Gross Regional Product ($billions 2012)
$0.38 0.014 $5.50 0.392 $5.80 0.406
Personal Income ($billions 2012) $0.45 0.021 $4.60 0.462 $5.00 0.483
Jobs (average annual full-time) 120 0.014 1,140 0.365 1,234 0.379
Rest of State
Business Transportation Costs ($billions 2012)
($8.80)
Toll cost ($billions 2012)
$0.48
Gross Regional Product ($billions 2012)
$2.20 0.014 $29.30 0.212 $31.50 0.226
Personal Income ($billions 2012) $1.80 0.020 $20.80 0.193 $22.60 0.213
Jobs (average annual full-time) 589 0.015 4,782 0.183 5,371 0.199
Source: Cambridge Systematics, Inc. analysis using the REMI economic model. ( ) denotes negative values.
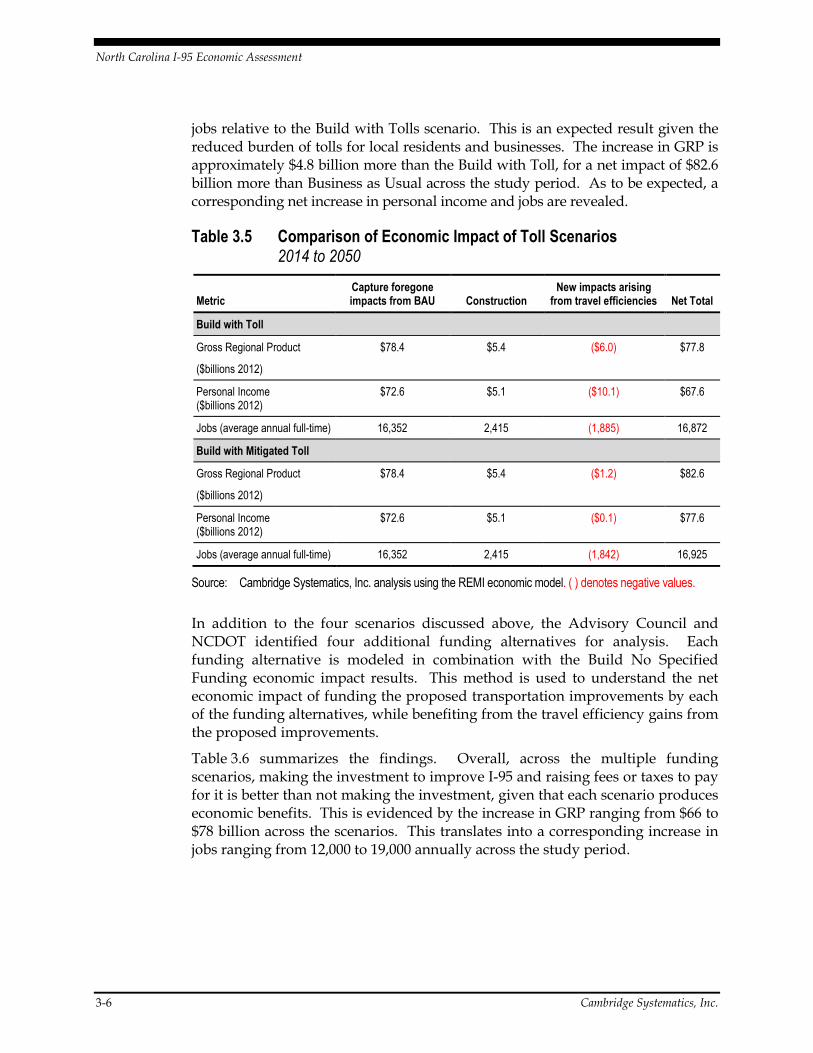
Table 3.5 presents the results of these toll scenarios. The net total GRP for the Build with Toll scenario is $77.8 billion, personal income is $67.6 billion, and average annual job impact is 16,872 over the study period (2014 to 2050). The Build with Mitigated Toll yields higher levels of GRP, income, and average annual
North Carolina I-95 Economic Assessment
3-6 Cambridge Systematics, Inc.
jobs relative to the Build with Tolls scenario. This is an expected result given the reduced burden of tolls for local residents and businesses. The increase in GRP is approximately $4.8 billion more than the Build with Toll, for a net impact of $82.6 billion more than Business as Usual across the study period. As to be expected, a corresponding net increase in personal income and jobs are revealed.
Table 3.5 Comparison of Economic Impact of Toll Scenarios 2014 to 2050
Metric Capture foregone impacts from BAU Construction
New impacts arising from travel efficiencies Net Total
Build with Toll
Gross Regional Product
($billions 2012)
$78.4 $5.4 ($6.0) $77.8
Personal Income ($billions 2012)
$72.6 $5.1 ($10.1) $67.6
Jobs (average annual full-time) 16,352 2,415 (1,885) 16,872
Build with Mitigated Toll
Gross Regional Product
($billions 2012)
$78.4 $5.4 ($1.2) $82.6
Personal Income ($billions 2012)
$72.6 $5.1 ($0.1) $77.6
Jobs (average annual full-time) 16,352 2,415 (1,842) 16,925
Source: Cambridge Systematics, Inc. analysis using the REMI economic model. ( ) denotes negative values.
In addition to the four scenarios discussed above, the Advisory Council and NCDOT identified four additional funding alternatives for analysis. Each funding alternative is modeled in combination with the Build No Specified Funding economic impact results. This method is used to understand the net economic impact of funding the proposed transportation improvements by each of the funding alternatives, while benefiting from the travel efficiency gains from the proposed improvements.
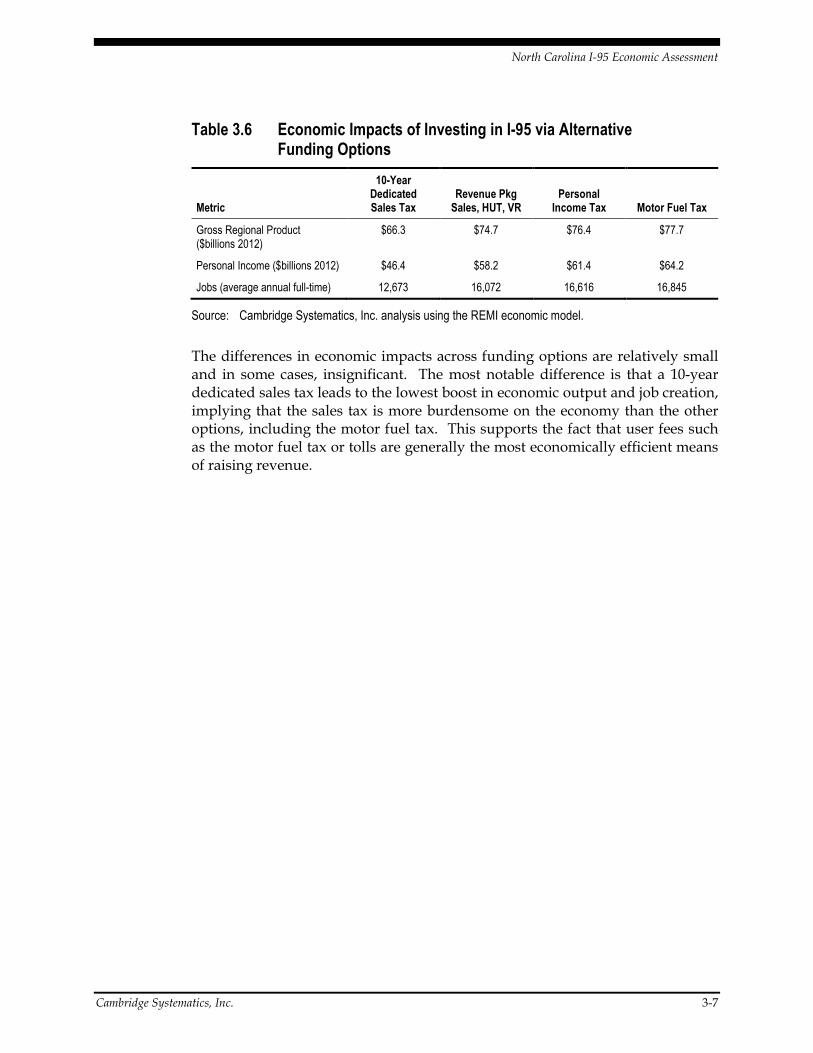
Table 3.6 summarizes the findings. Overall, across the multiple funding scenarios, making the investment to improve I-95 and raising fees or taxes to pay for it is better than not making the investment, given that each scenario produces economic benefits. This is evidenced by the increase in GRP ranging from $66 to $78 billion across the scenarios. This translates into a corresponding increase in jobs ranging from 12,000 to 19,000 annually across the study period.
North Carolina I-95 Economic Assessment
Cambridge Systematics, Inc. 3-7
Table 3.6 Economic Impacts of Investing in I-95 via Alternative Funding Options
Metric
10-Year Dedicated Sales Tax
Revenue Pkg Sales, HUT, VR
Personal Income Tax Motor Fuel Tax
Gross Regional Product ($billions 2012)
$66.3 $74.7 $76.4 $77.7
Personal Income ($billions 2012) $46.4 $58.2 $61.4 $64.2
Jobs (average annual full-time) 12,673 16,072 16,616 16,845
Source: Cambridge Systematics, Inc. analysis using the REMI economic model.
The differences in economic impacts across funding options are relatively small and in some cases, insignificant. The most notable difference is that a 10-year dedicated sales tax leads to the lowest boost in economic output and job creation, implying that the sales tax is more burdensome on the economy than the other options, including the motor fuel tax. This supports the fact that user fees such as the motor fuel tax or tolls are generally the most economically efficient means of raising revenue.

North Carolina I-95 Economic Assessment
Cambridge Systematics, Inc. A-1
A. Appendix
The REMI PI+ Model includes four different quantitative measures in its framework, and this allows them to highlight each other’s strengths and compliment their weaknesses. The four methodologies in the model include the following:
• Input/output tabulation – Sometimes referred to as I/O modeling, input/output looks for the transactions between industries and households in the economy. This includes the flow of goods from firm-to-firm through their supply chains, to final sales to households, and then wages paid and spent by individuals and families. The data for the table comes from the Bureau of Labor Statistics, and the theoretical foundation comes from work by Nobel laureate Wassily Leontief.
• Econometrics – The REMI model includes statistical parameters for behavioral patterns and responses inside of the economy. These includes elasticity to price and wealth, the response of households and businesses to changes in prices and wages, and the “rate of adjustment” from a shock to a new stability inside of the economy. Markets take time to “clear,” returning to relative stability of prices and quantity and a balance between supply and demand, after a shock, which we include in the model’s adjustments from year-to-year before an eventual result in the model’s structure.
• Computable General Equilibrium – Known as CGE models, REMI PI+ and Tax-PI are unique for including the characteristics of I/O and CGE models together. CGE modeling adds market-level concepts and the principles of equilibrium economics. These include markets for labor, as well as housing and consumer goods, composite inputs for firms, and market shares for local industry. For example, a coal plant in Arkansas produces electricity, but mines in the area are inadequate to supply its input (due to their lack of product and market share), so the model looks outward (probably to a state like Wyoming or West Virginia) to find the linkage necessary to bring the economy back to equilibrium.
• New Economic Geography – This includes concepts of agglomeration, labor pooling, and economies of scale to the model. Labor-intensive industries, such as healthcare or professional services, tend to cluster in urban centers with an educated labor force with specializations in their exact areas. The same is true on goods-producing industries, which tend to locate themselves near customers, input suppliers, transport.
North Carolina I-95 Economic Assessment
A-2
A.1 DETAILED REMIAND METHODOLOGY
PI+ is a structural economic forecasting and policy analysis model. It integrates input/output, computageography methodologies. The model is dynamic, with forecasts and simulations generated on an annual basis and behavioral responses to compensation, price, and other economic factors.
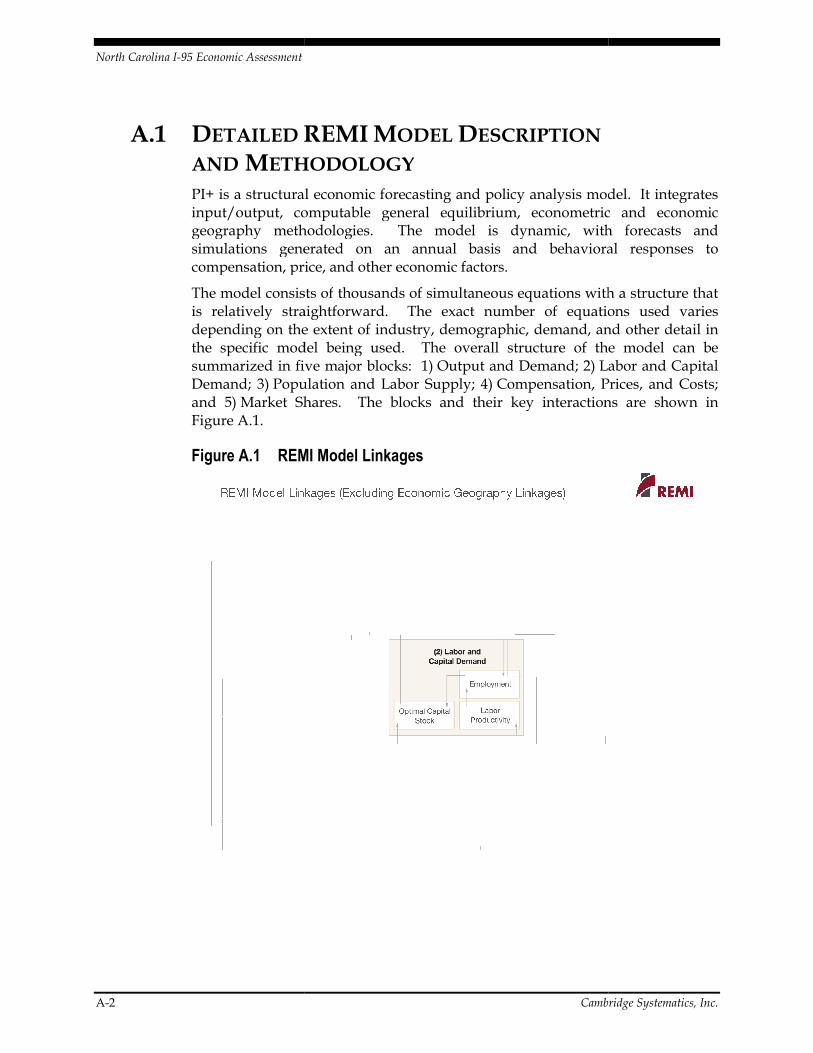
The model consists ofis relatively straightforward. The exact number of equations used varies depending on the extent of industry, demographic, demand, and other detail in the specific model being used. The overall ssummarized in five major blocksDemand; 3) Population and Labor Supplyand 5) Market Shares. Figure A.1.
Figure A.1 REMI Model Linkages
Cambridge Systematics, Inc.
REMI MODEL DESCRIPTION
ETHODOLOGY PI+ is a structural economic forecasting and policy analysis model. It integrates
output, computable general equilibrium, econometric and economic geography methodologies. The model is dynamic, with forecasts and simulations generated on an annual basis and behavioral responses to compensation, price, and other economic factors.
The model consists of thousands of simultaneous equations with a structure that is relatively straightforward. The exact number of equations used varies depending on the extent of industry, demographic, demand, and other detail in the specific model being used. The overall structure of the model can be summarized in five major blocks: 1) Output and Demand; 2) Labor and Capital
Population and Labor Supply; 4) Compensation, Prices, and CostsMarket Shares. The blocks and their key interaction
REMI Model Linkages
Cambridge Systematics, Inc.
PI+ is a structural economic forecasting and policy analysis model. It integrates ble general equilibrium, econometric and economic
geography methodologies. The model is dynamic, with forecasts and simulations generated on an annual basis and behavioral responses to
thousands of simultaneous equations with a structure that is relatively straightforward. The exact number of equations used varies depending on the extent of industry, demographic, demand, and other detail in
tructure of the model can be Labor and Capital
Compensation, Prices, and Costs; The blocks and their key interactions are shown in
North Carolina I-95 Economic Assessment
Cambridge Systematics, Inc. A-3
Block 1. Output and Demand
This block includes output, demand, consumption, investment, government spending, import, commodity access, and export concepts. Output for each industry in the home region is determined by industry demand in all regions in the nation, the home region’s share of each market, and international exports from the region.
For each industry, demand is determined by the amount of output, consumption, investment, and capital demand for that industry. Consumption depends on real disposable income per capita, relative prices, differential income elasticities, and population. Input productivity depends on access to inputs because a larger choice set of inputs means it is more likely that the input with the specific characteristics required for the job will be found. In the capital stock adjustment process, investment occurs to fill the difference between optimal and actual capital stock for residential, nonresidential, and equipment investment. Government spending changes are determined by changes in the population.
Block 2. Labor and Capital Demand
The Labor and Capital Demand block includes the determination of labor productivity, labor intensity, and the optimal capital stocks. Industry-specific labor productivity depends on the availability of workers with differentiated skills for the occupations used in each industry. The occupational labor supply and commuting costs determine firms’ access to a specialized labor force.
Labor intensity is determined by the cost of labor relative to the other factor inputs, capital, and fuel. Demand for capital is driven by the optimal capital stock equation for both nonresidential capital and equipment. Optimal capital stock for each industry depends on the relative cost of labor and capital, and the employment weighted by capital use for each industry. Employment in private industries is determined by the value added and employment per unit of value added in each industry.
Block 3. Population and Labor Supply
The Population and Labor Supply block includes detailed demographic information about the region. Population data is given for age, gender, and ethnic category, with birth and survival rates for each group. The size and labor force participation rate of each group determines the labor supply. These participation rates respond to changes in employment relative to the potential labor force and to changes in the real after-tax compensation rate. Migration includes retirement, military, international, and economic migration. Economic migration is determined by the relative real after-tax compensation rate, relative employment opportunity, and consumer access to variety.
North Carolina I-95 Economic Assessment
A-4 Cambridge Systematics, Inc.
Block 4. Compensation, Prices and Costs
This block includes delivered prices, production costs, equipment cost, the consumption deflator, consumer prices, the price of housing, and the compensation equation. Economic geography concepts account for the productivity and price effects of access to specialized labor, goods, and services.
These prices measure the price of the industry output, taking into account the access to production locations. This access is important due to the specialization of productions that takes place within each industry, and because transportation and transaction costs of distance are significant. Composite prices for each industry are then calculated based on the production costs of supplying regions, the effective distance to these regions, and the index of access to the variety of outputs in the industry relative to the access by other uses of the product.
The cost of production for each industry is determined by the cost of labor, capital, fuel, and intermediate inputs. Labor costs reflect a productivity adjustment to account for access to specialized labor, as well as underlying compensation rates. Capital costs include costs of nonresidential structures and equipment, while fuel costs incorporate electricity, natural gas, and residual fuels.
The consumption deflator converts industry prices to prices for consumption commodities. For potential migrants, the consumer price is additionally calculated to include housing prices. Housing prices change from their initial level depending on changes in income and population density.
Compensation changes are due to changes in labor demand and supply conditions and changes in the national compensation rate. Changes in employment opportunities relative to the labor force and occupational demand change determine compensation rates by industry.
Block 5. Market Shares
The market shares equations measure the proportion of local and export markets that are captured by each industry. These depend on relative production costs, the estimated price elasticity of demand, and the effective distance between the home region and each of the other regions. The change in share of a specific area in any region depends on changes in its delivered price and the quantity it produces compared with the same factors for competitors in that market. The share of local and external markets then drives the exports from and imports to the home economy.