Embed Size (px)
Citation preview
Board of Governors of the Federal Reserve System
middotOfcorfmiddotmiddot middot o
e
FR Y-6 OMB Number 7100-0297 Approval expires December 31 2015 Page 1 of2
r Annual Report of Holding Companies-FR Y-6 _
middot
Report at the close of business as of the end of fiscal year
This Report is required by law Section 5(c(1 (A of the Bank Holding Company Act (12 USC sect 1844 (c(1(A)) Section 8(a) of the International Banking Act (12 USC sect 3106(a)) Sections 11(a)(1) 25 and 25A of the Federal Reserve Act (12 USC sectsect 248(a)(1) 602 and 611a Section 21113(c) of Regulation K (12 CFR sect 21113(c)) and Section 2255(b of Regulation Y (12 CFR sect 2255(b)) and section 10(c)(2)(H) of the Home Owners Loan Act Return to the appropriate Federal Reserve Bank the original and the number of copies specified
NOTE The Annual Report of Holding Companies must be signed by one director of the top-tier holding company This individual should also be a senior official of the top-tier holding company In the event that the top-tier holding company does not have an individual who is a senior official and is also a director the chairshyman of the board must sign the report
1 Timothy J Heldt Name of the Holding Company Director and Official
President amp Director Title of the Holding Company Director and Official
attest that the Annual Report of Holding Companies (including the supporting attachments for this report date has been preshypared in conformance with the instructions issued by the Federal Reserve System and are true and correct to the best of my knowledge and belief
With respect to information regarding individuals contained in this report the Reporter certifies that it has the authority to provide this information to the Federal Reserve The Reporter also certifies that it has the authority on behalf of each individual to consent or object to public release of information regarding that individual The Federal Reserve may assume in the absence of a request for confidential treatment submitted in accordance with the Boards Rules Regarding Availability of Informationbull 12 CFR Part 261 that the Reporter and individual consent to public release of all details in the report concerning that individual
Date of Signature
For holding companies f1Q1 registered with the SEC-
Indicate status of Annual Report to Shareholders
181 is included with the FR Y-6 report
0 will be sent under separate cover
D is not prepared
For Federal Reserve Bank Use Only
RSSDID oil amp ltamp 3 z CI
This report form is to be filed by all top-tier bank holding compashynies and top-tier savings and loan holding companies organized under US law and by any foreign banking organization that does not meet the requirements of and is not treated as a qualifyshying foreign banking organization under Section 21123 of Regulation K (12 C F R sect 21123) (See page one of the general instructions for more detail of who must file The Federal Reserve may not conduct or sponsor and an organization (or a person is not required to respond to an information collection unless it displays a currently valid OMB control number
Date of Report (top-tier holding companys fiscal year-end)
December 31 2014 Month I Day I Year
NIA Reporters Legal Entity Identifier (LEI) (20-Character LEI Code)
Reporters Name Street and Mailing Address
Johnston Growth Corporation Legal Title of Holding Company
5526 NW 86th Street (Mailing Address of the Holding Company) Street I PO Box
Johnston IA City State
Physical Location (if different from mailing address)
50131 Zip Code
Person to whom questions about this report should be directed
Timothy J Heldt _P _re_s _id_e_n _t ___ ___ _ Name
515-331-2265 Area Code I Phone Number I Extension
515-331-3311 Area Code I FAX Number
timcharterbankercom E-mail Address
NA
Tiiie
Address (URL) for the Holding Companys web page
Does the reporter request confidential treatment for any portion of this
submission
0 Yes Please identify the report items to which this request applies
No
O In accordance with the instructions on pages GEN-2 and 3 a letter justifying the request is being provided
O The information for which confidential treatment is sought is being submitted separately labeled Confidential
Public reporting burden for this information collection Is estimated lo vary from 13 to 101 hours per response with an average of 525 hours per response Including time to gather and maintain data in the required form and to review instructions and complete the information collection Send comments regarding this burden estimate or any other aspect of this collection of information including suggestions for reducing this burden lo Secretary Board of Governors of the Federal Reserve System 20th and C Streets NW Washington DC 20551 and to the Office of Management and Budget PapetWor1lt Reduction Project (7100-0297) Washington DC 20503 102014
ANNUAL REPORT
2014
JOHNSTON GROWTH
CORPORATION
CHARTER BANK
JOHNSTON GROvVTH CORPORATION
CHARTER BANK
2014 ANNUAL REPORT
OVERVIEvV
Charter Bank had a flat year in 2014 -with earnings down 9 from last year and 14 below projected income We showed limited growth with average assets up 16 and year-end assets dead even Average deposits were up 8 and year-end deposits were down 12 We had a second excellent year in loans with average loans increasing by 67 and year-end loans increasing by 80 With yield opportunities becoming limited in the bond market we made the choice to slow down growth until loans could catch up We marginally lowered our relative deposit pricing in the market and allowed some non-core deposits to run off
The Banks interest spread increased modestly due to portfolio mix changes and in spite of the rate environment stabilizing at very low levels As a result assets continued to re-price lower but liabilities are as low as they can go The average asset spread widened 02 for the year and the average earning asset spread narrowed 03 The increase in loans as a percentage of assets positively impacted the spread in spite of the average loan margin decreasing by 20 and average bond spread dropping 21 Loan fee income was solid but the secondary market residential real estate fee income decreased by 54 as secondary market rates increased and that market just died
While our market continues to be very competitive the level of competition has stabilized The biggest competitive issue has been the two large credit unions located near our Johnston location These credit unions use their ta-x exemption as a pricing advantage and particularly Veridian Credit Union has been buying market share across the state As a result Charter Bank has had to pay rates on deposits that at times are higher than normal to protect our market share This inequity is not likely to change in the near future
Moving our audit and review process to McGladrey new network and other technology implementation along with excessive regulatory requirements from the Dodd-Frank bill is taking tremendous staff time and significant additional regulatory cost This is expected to continue for at least another two years
Managing credit and interest-rate risk while trying to maintain yields is our biggest challenge Charter Bank showed a 106 return on assets and 1027 return on equity for the year Johnston Growth Corporation showed a 1048 return on equity for the year The Bank has successfully reacted to the rapidly changing economic and regulatory environment and has been careful in our credit underwriting and operations management
1
OFFICERS AND STAFF
The total number of employees is 20 with 18 full-time equivalents Ten of these full-time equivalents are located in Johnston four are in Grimes and four are in Waukee
In Johnston Tim Heldt continues as President and CEO Sharm Sisler continues as Vice President-Cashier Matt Morris is Vice President-Lending and Compliance Officer JP Pearson is Vice President-Lending Corey Dutchuk is Assistant Cashier and Deb Heldt is the Marketing Director
Rhonda Westercamp is the personal bankeradministrative assistant and Joshua Snyder is the loan administratorpersonal banker Katie Ogle is the lead teller Tara Reed is a teller Mary Ann Whiton is a teller half-time in Johnston and half-time in Grimes and Kylie Poulson is part-time teller
Tim Gootee is the A VP-Branch Manager of Grimes Heidi Hyde is the personal bankerloan assistant in Grimes Mindy Tingley is a teller and Mary Ann Whiton is a teller half-time in Grimes and the other half in Johnston
Greg Grote is the A VP-Branch Manager of Waukee Ross Wittry is a loan officer based in Grimes and Waukee spending two days a week in Grimes two days in Waukee and one day in Johnston Jane Inskeep is the personal bankerloan assistant in Waukee Jeannene Marean is a full-time teller and Polly Brandt is a part-time teller
BANK COMMUNITY RELATIONS AND MARKETING ACITIVITIES
Throughout the year the Bank conducted an extensive marketing and public relations campaign The marketing included direct sales and personal networking by bank staff with assistance from the Board It also included an advertising program which featured newspaper advertising online ads radio and TV advertising direct mail internet and other local events
There were extensive promotional activities by bank staff and we aggressively pursued local news coverage through press releases and personal contacts In 2014 the Bank or its employees were featured or mentioned in 187 articles in the Johnston and Waukee Register Johnston Grimes amp Waukee Living Des Moines Register community newsletters and other events This follows 164 articles or mentions in 2013
In addition the Banks officers and staff are involved in virtually every business or community organization in our communities often in leadership roles Bank officers and staff attended in excess of 250 meetings and events representing the Bank over the course of the year
We are involved with Johnston Grimes and Waukee Chambers Johnston Economic Development Corporation Grimes Economic Development Corporation Waukee Economic Development Corporation Johnston Lions Club Grimes Kiwanis Grimes Lions and the
2
Greater Des Moines Home Builders Association We are also involved in several area churches Johnston High School Vocal Parents Association and Band Parents Association Johnston High School Sports Teams Johnston Little League Johnston Soccer Club Johnston Dollars for Scholars Johnston Schools Purple Party Johnston High School Business Booster and Grimes High School Business Booster In addition we are involved with Johnston Green Days Johnston Library Foundation Waukee Library Foundation Waukee Triangle Business Association and many other volunteer roles in Johnston Grimes and Waukee
FINANCIAL RESULTS
The Bank has been successful as a result of our marketing efforts our excellent facilities and locations our local identity our quality products and competitive pricing and the serviceshyoriented focus of our staff Also the support and business of our Board and investors has contributed to the success of the Bank We appreciate this help
Charter Bank ended the year with $1352 million in total assets as compared to 2013 yearshyend assets of $1352 million for a flat yar Deposits ended the year at $1197 million as compared to year-end 2013 deposits of $1212 million for a $15 million decrease or 12 drop Loans ended the year at $729 million as compared to 2013 year-end loans of $675 million for a $54 million increase or 80 growth
Charter Bank had average assets of $1375 million for the year as compared to 2013 average assets of $1353 million for a $22 million increase for the year or 16 growth Deposits averaged $1222 million as compared to average 2013 deposits of $1213 million for a $10 million increase or 8 growth Loans averaged $693 million as compared to 2013 average loans of $649 million for a $44 million increase or 67 growth
Net income before tax for the year was $1991783 as compared to $1994126 in 2013 for a decrease of $2343 for a l drop Net income after tax was $1452262 as compared to 2013 net income of$1466142 or a decrease of $13880 for a 9 drop The 2014 net income was $20433 below the projected $14 72695 income or 14 below budget The Johnston location showed net earnings of $1216267 the Grimes location showed net earnings of $34063 and Waukee showed net earnings of$201932
Net interest spread for the year was $71233 above 2013 due to loan growth which improved the earning assets mix and in spite of continued narrowing margins The Banks net interest margin improved for the year by 01 We had a stable rate environment all year which is at historically low levels Assets continue to reprice although at a more limited basis while liabilities are about as low as they can go Our net earning assets margin increased 01 and our net loan spread decreased 20
The Johnston Growth Corporation financial statement shows two assets Charter Bank and a checking account Charter Bank paid a $325000 dividend to Johnston Growth Corporation on January 3 2014 of which $301700 was used to pay a $1000 per share dividend to the shareholders On December 19 2014 a second dividend of $470000 was paid from Charter
3
Bank to Johnston Grmvth Corporation This dividend along with existing Johnston Growth Corporation funds were used to pay off the capital note of $500000 plus $995562 accrued interest This will eliminate most of the holding companys ongoing expenses
The Johnston Growth Corporation earnings for the year were $ 1436595 as compared to 20 13 net income of $145 1456 or a decrease of $1486 1 for a 10 drop The Johnston Growth Corporation net worth is $14954202 as of year-end as compared to $13443730 for 20 13 or a $15 10472 increase This results in a book value of$49566 per share vs $44560 last year for a $5006 increase or 112 The Johnston Growth Corporation showed a return on average equity for the year of 1008 vs 1107 last year for a 99 decrease
It should be noted that $53303 6 of the net worth is due to the market value adjustment (JYIV A) of the Charter Bank bond portfolio which is considerably higher than last years value of $157459 If this NIV A is netted out the Johnston Growth Corporation net worth is $ 1442 1 166 as of year-end as compared to $ 1328627 1 for 20 13 or a $ 1 134895 increase This results in a book value of $47800 per share vs $44038 last year for a $3762 increase or 85 Then a return on average equity is shown for the year of 1048 vs 1 165 last year for a 117 decrease
Following is a Charter Bank balance sheet and income statement analysis comparing 2014 results to 2013 and 2012 a ratio analysis and a branch analysis Also please the see complete year-end financials on the Johnston Growth Corporation and Charter Bank at the end of this report
4
BALANCE SHEET COMPARISON - YEAR-END
31-Dec-12 31-Dec-13 31-Dec-14 2014 vs 2013
$ $ $ $
CASHampEQUI 4688666 35 1162315 09 1850419 14 688104 592
FBJFUNDS 11674000 88 9397000 69 3440000 25 (5957000) (634)
FHLB INVESTMEJIT 150800 01 159200 01 162400 01 3200 20
BONDS amp SECURITIES
US TRS 0 00 0 00 0 00 0
AG8JCIES 18107387 136 20986530 155 22729623 168 1743093 83
MUNICIPAL 20654266 156 19702962 146 18889274 140 (813688) (41)
OTHER 15358933 116 13417382 99 12211387 90 (1205995) (90)
TOTAL BONDSSEC 54120586 408 54106874 400 53830284 398 (276590) (05)
LOANS
CONSUMER LOANS 2648810 20 2872873 21 2870340 21 (2533) (01)
HOME EQUITY LOANS 4652028 35 3830995 28 4421332 33 590337 154
COMMERCIAL LOANS 9688838 73 7349183 54 7166051 53 (183132) (25)
CONSTRUCTION LOANS 3214271 24 5974542 44 8295846 61 2321304 389
TAX EXEMPT LOANS 2151347 16 1950595 14 2084609 15 134014 69
RES108JTIAL R E 14823287 112 19888326 147 20 112092 149 223766 11
COMMERCIAL R E 21856283 165 25611886 189 27940192 207 2328306 91
TOTAL LOANS 59034864 445 67478400 499 72890462 539 5412062 80
LOAN RESERVE 461889 03 414524 03 409217 03 (5307) (13)
NET LOANS 58572975 442 67063876 496 72481245 536 5417369 81
TOTAL INVESTMENT ASSETS 129207 027 974 131889265 975 131764348 975 (130224) (01)
LAND 980000 07 980000 07 980000 07 0
BUILDINGS 2319679 17 2319679 17 2330629 17 10950 05
EQUIPMEJIT 483325 04 510018 04 461081 03 (48937) (96)
FURNITURE 128718 01 128718 01 128718 01 0
LSB-JOLD IMFROVEWENTS 00 00 00 0
TOTAL FIXBJ ASSETS 3911722 29 3938415 29 3900428 29 (37987) (10)
LESS DEFRECIA TlON (1319903) (10) ( 1341822) (10) (1344889) (10) 3067 02
NET FIXBJ ASSETS 2591819 20 2596593 19 2555539 19 (41054) (16)
INTEREST RECEI ABLE 509770 04 552978 04 525699 04 (27279) (49)
OTHER ASSETS 354198 03 206607 02 312291 02 105684 512
TOTAL NON-INVEST ASSETS 3455787 26 3356178 25 3393529 25 37351 11
TOT AL ASSETS 132662814 1000 135245443 1000 135157877 1000 (87566) (01)
CHECKING ACCOUNTS 8710745 66 9068619 67 10212955 76 1144336 126
BUSINESS ACCOUNTS 11518955 87 13179783 97 14788736 109 1608953 122
REGULAR SAVINGS 4280871 32 4416457 33 4522574 33 106117 24
INTEREST CHECKING 6103196 46 6501007 48 6248679 46 (252328) (39)
MgtNEY rAARKET ACCOUNT 14498581 109 15502223 115 16 181498 120 679275 44
CAPITAL ACCOUNT 25204578 190 27315749 202 25539387 189 (1776362) (65)
CERTlFICA TES OF DEPOSrT 47931671 361 44910444 332 42023213 311 (2887231) (64)
OTHER DEMAND DEPOSrTS 286965 02 317061 02 199300 01 (117761) (371)
TOT AL DEPOSITS 118535562 894 121211343 896 119716342 886 (1495001) (12)
INTEREST PAY ABLE 94714 01 78657 01 66169 00 (12488) (159)
FBJFUNDS 00 00 00 0
OTHER LIA BILmES 40478 00 31857 00 108517 01 76660 2406
ACCRUBJ TAXES PAY ABLE 648783 05 16350 00 326774 02 310424
TOTAL NON-DEPOSIT LIAB 783975 06 126864 01 501460 04 374596 2953
TOTAL LIABILITIES 119319537 899 121338207 897 120217802 889 (1 12 0405) (09)
CAPITAL 4300000 32 4445663 33 4445663 33 0
UNREALIZBJ GAINLOSS SEC 1205305 09 157459 01 533036 04 375577 2385
REfAINBJ RNINGS 7837972 59 9304114 69 9961376 74 657262 71
NET WORTH 13343277 101 13907236 103 14940075 111 1032839 74
TOTAL LIAS amp NET WORTH I 132662814 1 10001 135245443 1000 135157877 1000 1 (87566)1 (01)j
5
BALANCE SHEET COMPARISON-AVERAGE
2012 2013 2014 2014 vs 2013
$ $ $ I $ I I CASH amp EQUIV 1681955 13 1443726 11 1685679 12 241953 168 FED FUNDS 10058041 79 11148236 82 7924507 58 (3223729) (29) FHLB llWESTMENT 145666 01 156599 01 161620 01 5021 32
BONDS amp SECURmES
US TREAS 0 00 0 00 0 00 0 AGENCIES 16225927 127 19438680 144 22730242 165 3291562 169 MUNICIPAL 20489186 161 20282106 150 19525023 142 (757083) (37) OTHER 14456879 14761392 13028996 (1732396)
TOTAL BONDSSEC 51171992 402 54482178 403 55284261 402 802083 15
LOANS
OONSUMER LOANS 2549122 20 2718028 20 2869481 21 151453 56 HOME EQUITY LOANS 4888032 38 4171555 31 3864562 28 (306993) (74) COMMERCIAL LOANS 10335759 81 9035645 67 7059043 51 (1976602) (219) OONSTRUCTION LOANS 4831823 38 5072242 37 7707280 56 2635038 520 TAX EXEMPT LOANS 2261481 18 2075413 15 2015152 15 (60261) (29) RESIDENTIAL RE 13159249 103 18461305 136 20396501 148 1935196 105 COMMERCIAL R E 23011527 181 23404442 173 25395531 185 1991089 85
TOTAL LOANS 61036993 479 64938630 480 69307550 504 4368920 67 LOAN RESERVE 472471 04 444303 03 411499 03 (32804) (74)
NEf LOANS 60564522 476 64494327 477 68896051 501 4401724 68
TOTAL INVESTMENT ASSETS 123622 176 971 131725066 973 133952 118 974 2194248 17
LAND 980000 08 980000 07 980000 07 0 BUILDINGS 2319679 18 2319679 17 2322388 17 2709 01 EQUIFMENT 472726 04 570188 04 556091 04 (14097) (25) FURNITURE 128718 01 128718 01 128718 01 0 LEASB-IOLD IMFROVEMENTS 00 00 00 0
TOTAL FIXED ASSEfS 3901123 31 3998585 30 3987197 29 (11388) (03) LESS DEFRECIA llON (1263839) (10) ( 1375473) (10) (1401326) (10) 25853 19
NEf FIXED ASSEfS 2637284 21 2623112 19 2585871 19 (37241) (14)
INTEREST RECEIVABLE 681165 05 681159 05 647735 05 (33424) (49) OTHER ASSEfS 407843 03 291008 02 286472 02 (4536) (16)
TOTAL NON-INVEST ASSETS 3726292 29 3595279 27 3520078 26 (75201) (21) TOTAL ASSETS 127348468 1000 135320345 1000 137472196 1000 2151851 16
CHECKING ACOOUNTS 7125444 56 8583319 63 9358794 68 775475 90 BUSINESS ACOOUNTS 10871810 85 12393816 92 14767330 107 2373514 192 REGULAR SAVINGS 3776189 30 4176643 31 4590521 33 413878 99 INTEREST CHECKING 5672933 45 5809014 43 5890929 43 81915 14 MONEY MARKEf ACCOUNT 14361695 113 16448833 121 16568910 121 120077 07 CAPITAL ACCOUNT 25106712 197 26583827 196 26934099 196 350272 13 CERllFICA 11ES OF DffOSrT 46505911 365 46953284 347 43768812 318 (3184472) (68) OTHER DEMAND DEFDSrTS 336588 03 345292 03 368255 03 22963 67
TOTAL DEPOSITS 113757282 893 121294028 896 122247650 889 953622 08
INTEREST PAY ABLE 101295 01 86532 01 71263 01 (15269) (176) FED FUNDS 0 00 0 00 0 00 0 OTHER LIABILmES 110544 01 111450 01 156004 01 44554 400 ACCRUED TAXES PAY ABLE 711653 06 356581 03 321899 02 (34682) (97)
TOTAL NON-DEPOSIT LIAB 923492 07 554563 04 549166 04 (5397) (10) TOTAL LIABILITIES 114680774 900 121848591 900 122796816 893 948225 08
CAPITAL 4300000 34 4321949 32 4445663 32 123714 29 UNREALIZED GAINLOSS SEC 1171372 09 683162 05 541586 04 (141576) (207) REfAINED EARNINGS 7247855 57 8574983 63 9691053 70 1116070 130
NET WORTH 12719227 100 13580094 100 14678302 107 1098208 81
TOT AL LIAB amp NET WORTH I 127400001 1 1000 11 135428685 1 1000 11 137475118 1 1000 11 2046433 I 15 j
6
INCOME STATEMENT COMPARISON
31-Dec-12 31-Dec-13 31-Dec-14 2014 vs 2013
$ $ s $
FED FUND INCOME 19861 04 22115 05 15717 03 (6398) (29) BOND INCOME 1595359 328 1555648 331 1508826 325 (46822) (30) CONSUMER LOAN INTEREST 158073 32 141350 30 132713 29 (8637) (61)
HOME EQUITY LOANS 260654 54 210487 45 185422 40 (25065) (119) COMMERCIAL LOAN INTEREST 592104 122 476132 101 348022 75 (128110) (269) CONSTRUCTION LOANS 207544 43 218784 47 333359 72 114575 524 TAX EXEMPT LOANS 95221 20 81436 17 75416 16 (6020) (74)
RESIDENTIAL RE INTEREST 648235 133 786957 167 821372 177 34415 44
COMMERCIAL RE INTEREST 1287991 265 1208221 257 1218167 263 9946 08
TOTAL INTEREST INCOME 4865042 1000 4701130 1000 4639014 1000 (62116) (13)
INT ON DEMAND DEFDSfT 5740 01 4750 01 4781 01 31 07
INT PAID ON SAVINGS 2987 01 2085 00 2291 00 206 99
INT PAID ON MONEY MARKET 32599 07 30496 06 30731 07 235 08
INT PAID CAPITAL ACCOUNT 132533 27 93368 20 87904 19 (5464) (59)
INTEREST PAID ON CDs 780974 161 668332 142 539975 116 (128357) (192)
FED FUND INTEREST PAID 0 00 0 00 0 00 0
TOTAL INTEREST EXPENSE 954833 196 799031 170 665682 143 (133349) (167)
NET INTEREST MARGIN 3910209 804 3902099 830 3973332 857 71233 18
SERVICE CHARGE INCOME 214016 37 194098 36 203383 38 9285 48
LOAN FEE INCOME 125901 22 126496 23 115548 22 (10948) (87)
SECONDARY MARKET INC 268958 47 180535 33 82423 15 (98 112) (543)
011-IER INCOME 244674 43 250526 46 308224 58 57698 230
TOTAL NON-INT INCOME 853549 149 751655 138 709578 133 (42077) (56)
SALARIES AND WAGES 1262068 259 1263734 269 1257837 271 (5897) (05)
ENIPLOYEETAX amp BENEFITS 269864 55 294672 63 280515 60 (14 157) (48)
OCCUPANCY EXPENSE 94692 19 93077 20 93104 20 27 00
RE TAXES 132000 27 126000 27 126000 27 0
BUILDING DEFRECIA llON 61 167 13 61167 13 61257 13 90 01
TENANT RENTAL INCOME (45944) (09) (45444) (10) (45444) (10) 0
EQUIPfvlENT EXPENSE 44694 09 51512 11 62791 14 11279 219
EQUIPFURN DEFRECIA llON 46685 10 58525 12 60249 13 1724 29
PROVISION FOR LOAN LOSS 36836 08 0 00 0 00 0
MARKETlNG EXPENSES 109508 23 104809 22 100435 22 (4374) (42)
DATA PROCESSING 296060 61 321602 68 363535 78 41933 130
INSURANCE 9839 02 10352 02 11374 02 1022 99
FDIC amp FICO INSURANCE 84609 15 54167 10 68837 13 14670 271
CORRESRJNDENT BANK EXP 21512 04 21511 04 23017 04 1506 70
COURIER ARMORED CAR 5725 01 1446 00 1440 00 (6) (04)
OFFICE SUFPLIES amp FORMS 48472 08 48681 09 39770 07 (8911) (183)
FQSTAGEamp FHONE 38919 07 39638 07 41871 08 2233 56
AUDIT amp EXAM FEES 72630 13 56105 10 59726 11 3621 65
011-IER EXPENSES 78690 14 98074 18 84813 16 (13261) (135)
TOTAL NONINTEREST EXP 2668026 467 2659628 488 2691127 503 31499 12
NET INCOME BEFORE TAXES 2095732 366 1994126 366 1991783 372 (2343) (01)
FEDERAL INCOME TAXES 448546 78 428257 79 440947 82 12690 30
STATEINCOMETAXES 104865 18 99727 18 98574 18 (1153) (12)
TOTAL TAXES 553411 97 527984 97 539521 101 11537 22
NET INCOME 1542321 270 1466142 269 1452262 272 (13880) (09)
7
RATIO ANALYSIS
31-Dec-12 31-Dec-13 31-Dec-14 2014 vs 2013 CAPITAL RATIOS
TIER I OF1TAL TO ASSETS 915 1017 1066 049 TOTAL OF1TAL TO ASSE TS 1041 1059 1136 077 AVERAGETIER 1 OF1TAL TO AVE ASSETS 907 953 1028 075
LIQUIDITY RATIOS
LOANS TO DEFDSI TS 4980 5567 6089 522 LOANS TO ASSETS 4450 4989 5393 404 DEPOSITS TO ASSETS 8935 8962 8858 -105 INVES1MENT INC TO TOTAL INTEREST INC 3320 3356 3286 -070 LOAN INTEREST TO TOTAL INTEREST INCOME 6680 6644 6714 070
EARNING R AT IOS
YIELD ON AVERAGE ASSETS 382 347 337 -010 COST ON AVERAGEASSETS 075 059 048 -011 NET INTEREST MARGIN 307 288 289 001 OTHER INCOME TO AVERAGE ASSETS 067 056 052 -004 OTHER EXPENSES TO AVERAGEASSETS 210 197 196 -001 RETURN ON ASSETS 121 108 106 -003 RETURN ON EQUITY 1336 1137 1027 -110
OTHER RATIOS
YIELD ON AVERAGE LOANS 532 481 449 -032 YIELD TO AVERAGE EARNING ASSET 399 361 351 -010 COST ON AVERAGE DEPOSITS 084 066 054 -011 TOTAL COST OF FUNDS 084 066 054 -011 A VERA GE LOAN MARGIN 448 415 395 -020 A VERA GE EARNING ASSE T tv11RGIN 315 295 296 001
CAPITAL SCHEDULE COMPARISON
31-Dec-12 31-Dec-13 31-Dec-14 2014 VS 2013 TIER 1 OF1TAL 12137972 13749777 14407039 657262 TOTAL OF1TAL 13805 166 14321760 15349292 1027532 TOTAL ASSETS 132662814 135245443 135 157877 (87566) RISK-BASED ASSETS - 0 13960517 11137297 5452569 (5684728) RISK-BASED ASSETS - 20 43329809 41653227 40925 143 (728084) RISK-BASED ASSETS - 50 28651602 35267198 36192137 924939 RISK-BASED ASSE TS - 100 46720886 47 187721 52588028 5400307 TOTAL RISK WBGHTED ASSETS 69712649 73151965 78869125 5717 160 TIER 1 OF1TAL TO RISKWBGHTEDASSETS 1741 1880 1827 -053 RISK BASED OF1TAL RA TIO 1980 1958 1946 -012
8
2014 Year-to-Date Branch Data Bran ch Office Johnston Grimes Waukee Charter Bank
121312013 121312014 121312013 121312014 121312013 121312014 121312013 121312014
Cash amp Due 948868 1648695 124727 I 137483 88720 64242 1162315 1850420
Fed Funds 9397000 3440000 9397ooo I 3440000
lmestments 54266074 j 53992684 54266074 53992684
Loans 46916011 I 46549367 7684728 8068473 12877661 18272622 67478400 72890462
Loan Resefeuro 245304 I 238998 76705 77449 92515 92770 414524 I 409217
Net Loans 46670707 46310369 7608023 7991024 12785 146 18179852 67063876 72481245
Fixed Assets 1583007 1551012 745325 736911 268261 267616 2596593 2555539
Other Assets 683929 I 773860 43658 22873 31998 41256 759585 I 837989
Total Assets 113549585 107716620 8521733 8888291 13174125 18552966 135245443 135 157877
Total Deposits 80326554 I 78325025 16584248 17 159796 24300541 24231521 121211343 119716342
Fed Funds - -
Other Liab 92903 470442 11050 10017 22911 21000 126864 501459
Tota[ Liabilities 80419457 78795467 16595298 1 17169813 24323452 24252521 121338207 120217801
Capital I 13907236 I 14940075
Capital Ratio 1028dego 1105
Leveraged Capital Ratio I I 1059 1136
Asset GroVih (5832965) I 366558 5378841 I (87566)
Asset Growth Percent -514 I 430 4083 I -006
Deposit Growth (2001529) 575548 (69020) I (1495001)
Deposit GrONth Percent -249 347 -028 I -123
Loan Growth I (366644) 383745 5394961 I 5412062
Loan GrOWth Percent -D78 499 4189 802
Loan to Deposit Ratio 5943 4702 7541 I 6089
Bank Interest I 15717 I 15717
Investment Interest 1508826 I 1508826
Loan Interest I 2 144562 354323 615586 I 3114471
Total Interest Income 3669105 354323 615586 I 4639014
Interest-Expense I 723733 (39033) (19017) 665683
Net Interest Margin 2945372 I 393356 634603 I 3973331
Ser1ce amp Fee Income 109001 I 45985 48398 203384
Other Loan Income 129641 35408 32921 197970
Other Income 209944 58482 39798 308224
Total Non-Interest Inc 448586 I 139875 121117 709578
Salaries amp Benefits 1096 175 I 223982 218195 1538352
Occupancy I 114509 74015 46392 234916
Eouipment I 66701 28505 27834 123040
Loan Resere I -
Marketing I 59457 20032 20946 100435
Service Fee Expense 53714 15835 17 198 86747
Loan Expense 5021 3642 5540 14203
Data Processing I 216972 74686 71876 I 363534
Other Expenses I 142 189 39469 48241 229899
Total Non-Interest Exp I 1754738 480166 456= 2691 126
Net Income Before Tax 1639220 I 53065 299498 1991783
Net Income After Tax 1216267 I 34063 201932 1452262 I I I I I I I I I
Net Income Last Year I 1266555 38681 I 160906 1466 142
Current Year vs Last Year (50288) (4618) 41026 (13880)
Same Period Change -397 -1194 2550 -095
Budgeted Net Income 1256704 45783 170208 1472695
Actual YS Projected (40437) (11720) 31724 (20433)
Percent of Budget I -322 I -2560 1864 -139
9
ACCOUNTS COlYIP ARIS ON
The Banks success has been achieved through developing ongoing business and consumer relationships The Bank is not using any of its borrowing capacity at the Federal Home Loan Bank or UNIB Bank
The Bank ended the year with 3130 checking accounts an increase of 17 accounts 62 1 money market accounts a decrease of 1 account 178 capital accounts an increase of 1 account 1256 savings accounts an increase of7 accounts and 1100 CDs a decrease of91 accounts The Bank ended with 925 loans an increase of24 loans In total the Bank ended with 7210 total accounts or loans a decrease of 43 from 2013
The lack of growth in number of accounts is primarily a result of the current economic climate and very low rate environment Also with our significant liquidity position we did not price for deposit growth for most of the year And when a local credit union got aggressive with CD rates we let some non-core deposits roll off Plus with the improvement in the stock market we have seen some movement back to the stock market particularly with CDs
Loan demand was better this year as compared to the past few years Loan demand is still below years prior to the economic slowdown Construction in-house residential and commercial real estate have showed improvement Commercial home equity loans and consumer loans have shown limited improvement
JOHNSTON BRANCH OFFICE
The Johnston branch ended the year with $783 million in deposits for $20 million or 25 decrease and $465 million in loans for $4 million or 8 drop For 2014 the Johnston branch averaged $798 million in deposits for $3 million or 4 decrease and $468 million in loans for $2l million or 47 growth Johnston showed net earnings of $1216267 for the year vs $1266555 for 20 13 for a $50288 decrease or 40 drop
GRilYIES BRALCH OFFICE
The Grimes branch ended the year with $ 172 million in deposits for $6 million or 35 growth and $8 l million in loans for $4 million or 5 increase For 2014 the Grimes branch averaged $167 million in deposits for $2 million or 12 increase and $80 million in loans for no change The Grimes branch showed net earnings of $34063 for the year vs $38681 for 2013 for a $4618 decrease or 119 drop
WAUKEE BRANCH OFFICE
The Waukee branch ended the year with $242 million in deposits for $ 1 million or 3 decrease and $183 million in loans for $54 million or 4 19 increase For 2014 the Waukee branch averaged $258 million in deposits for $12 million or 47 growth and 145
10
million in loans for $22 million or 179 increase It showed net earnings of $201932 for the year vs $160906 for 2013 for a $41026 increase or 255 increase
INTERNET BANKING - CHARTERBAlKERCOJVI
Charterbankercom is led by Matt Morris The Charterbankercom website hosting is at Jack Henry Design in a hardened site in Cedar Falls Iowa The website is feature-rich with nice graphics and pictures It has easy navigation account and loan applications automated internet banking applications links to check ordering and ATM locators financial calculators and various other features The website has dynamic content so the Bank can change much of the content put current ads on it etc Plus the online banking and bill payer log-ins are on the home page so our customers see the home page offers and information
The internet banking package is through our data processor Fiserv This enables us to have a real-time connection and Fiserv maintains the security The Bank currently has 1535 Internet customers This represents 49 0 of our checking accounts Vhen multiple checking account households are combined we estimate 60 of our checking customers are on internet banking
Charter Bank rolled out a new interface for the internet banking and bill-payer system in 2013 This upgrade offers a modem look and feel with various widgets and other improved user options The integration improved middotwith the main data processing system and between the internet banking and bill-payer systems
Charter Bank added electronic statement availability four years ago Customers have switched 1177 checking money market and capital accounts 251 savings accounts 64 CDs and 189 loans to electronic statements and notices for a total of 1681 electronic statement accounts which is up 43 over last year This results in 376 of our DDA accounts receiving electronic statements and notices This adds a service customers wanted while saving the Bank considerable costs of supplies labor printing and postage
Charter Bill-payer is with Fiserv which gives us the added capabilities of having the billshypayer system with our primary data processor Features like real time account balances easier payment set-up online emollment person-to-person payments and more precise payment dates are some of the advantages Fiserv provides complete support through a dedicated Charter Bank 888 number online help and real-time internet chat help
The Bank had 500 Charter Bill Payer customers as compared to 423 customers last year for an increase of77 accounts or 182 Customers on Charter Bill Payer represent 160 of checking account customers and 326 of our internet banking customers
In December 2013 we added mobile banking services through a Fiserv product called Mobiliti This product makes all internet banking and bill paying functions available on mobile devices Charter Bank Mobiliti is easy to use and has person-to-person payment functionality In the first 13 months of availability we already have 479 users
11
2014 PROJECTION
Our 2015 projection shows total assets at $142 million on December 31 2015 and a net profit of $1441457 This projection assumes an increasing interest rate spread of 06 on average assets an increasing spread of 10 on average earning assets a decreasing taxable equivalent spread of 21 on average bonds and a decreasing spread of 15 on average loans We are assuming a flat interest rate environment in 2015
Most of the improvement in average assets spread is due to our plan to grow loans to $ 8 0 million by year-end This changing mix from lower yielding fed funds and bonds counteracts the slowed but still continuing spread compression in bonds and loans This will be a challenge but approximately equals 2014 results when including the larger than normal loan pipeline carried into 2015
The net projected loan growth of $7 million plus the approximately $5 million of principal paid each year results ill the need for $12 million in new loans We were able to achieve net loan growth of $14 million over the past two years with a strong effort by the lenders and a little luck We will need similar efforts and good fortune to achieve $7 million this year
Charter Bank needs your help to achieve the above results We are paying good rates our checking and business accounts are among the best in the market and our loans are competitively priced Please recommend Charter Bank to your friends and acquaintances and we would appreciate the opportunity to further serve you if you personally have additional depository or borrowing needs
FINAf COMMENT
Charter Bank management and staff are looking forward to another good year in 2015 While we expect it to be a challenging year we are also excited about the potential opportunities Charter Bank has benefited from our reputation for safety and soundness and we expect that to continue throughout the year Improvement in the economy is expected to continue locally and the interest rate levels to say flat at the current low levels
With the national economy continuing to struggle there is volatility in our business The business environment can change rapidly with the Federal Government trying to stimulate the economy and deal with the large federal deficits Also the federal government will continue with the excessive regulatory oversight
middotwhile all of the above has the potential to reduce earnings Charter Bank is efficient we have sound asset and liability standards and we should be able to effectively compete in this environment And we have passed the milestone of 10 Tier One Capital with no corporate debt which increases our ability to withstand unexpected adversity Overall our goal for 2015 is to maintain our current balance sheet and income levels protect our markets and manage the challenges and opportunities of 2015
12
Johnston Growth Corporation Balance Sheet
December 31 2014
Current Assets
CB Checking Account
Accounts Receivable
Total Current Assets
Other Assets
Charter Bank
Total Other Assets
Total Assets
ASSETS
$ $
$
LlABILITIES AND CAPITAL
Current Liabilities
Accrued Interest Payable
Total Current Liabilities
Notes Payable-Noncurrent
Total Long-Term Liabilities
Total Liabilities
Capital
Common Stock
Paid-in Capital
Retained Earnings
Umealized GainLoss CB Sec
Dividends Paid
Net Income
Total Capital
Total Liabilities amp Capital
Ccimoared to 2013
Earnings
Year-end Equity A verag Equlty Average Equity net oflvIV A Securities
Book Value
Book Value net of NIV A Securities
ROE
ROE net of MV A Securities
$ 1436595
$ 14954202
$ 14247820
$ 13706234
$ 49566
$ 47800
13
1008
1048
$
$ $
$ $
$
$
$ $ $
$
$
6056
8071
14940075
3017000
184612
9782959
533036
0
1436595
(14861)
1510472
1139613
1281189
5006
3762
(099)
(117)
$ 14127
$ 14940075
$ 14954202
$ 0
$ 0
$ 0
$ 14954202
$ 14954202
-10
112
87
103
112
85
Johnston Growth Corporation
Income Statement
For the Twelve Months Ending December 3 1 2014
Revenues
Investment Interest Income
Loan Interest Income
Other Interest Income
Charter Bank Net Earnings
Other Income
Non-taxable GainsLosses
Fee Discounts
Total Revenues
Expenses
Advertisingtvfarketing Expense
Bank Charges
Charitable Contributions Exp
Depreciation Expynse
Dues and Subscriptions Exp
Income Tax Expense
Insurance Expense
Interest Expense
Legal and Professional Expense
OTS Assessment Expense
Meals and Entertainment Exp
Office Expense
Postage Expense
Rent or Lease Expense
Repairs Expense
Supplies Expense
Telephone Expense
Travel Expense
Utilities Expense
Director Expense
Other Expense
GainLoss on Sale of Assets
Total Expenses
Net Income
1 4
$ 0
$ 0
$ 0
$ 1452262
$ 0
$ 0
$ 0
$ 1 452262
$ 0
$ 35 $ 0
$ 0
$ 0
($ 8071)
$ 0
$ 20493
$ 2610
$ 0
$ 0
$ 0
$ 0
$ 0
$ 0
$ 0
$ 0
$ 0
$ 0 $ 600
$ 0
$ 0
$ 15667
$ 1436595
lUKl lMi l LL-Vl l lJ u 1 YSTEM 0 1 1 4 2015 2 3 20
ASSETS
CASH AND DUE FROM BANKS
FED FUNDS SOLD TOTAL FED FUNDS SOLD
FHLB STOCK
US GOVERNMENT BONDS US AGENCY BONDS MUNICIPAL BONDS TAX MUNICIPAL BONDS CORPORATE BONDS TOTAL INVESTMENTS
12010199 COMMERCIAL LOANS 12010299 COMMERCIAL TERM LOANS 12010599 CONSTRUCTION LOANS 12020299 COMMERCIAL REAL ESTATE LOANS 12020399 RESIDENTIAL REAL ESTATE LOANS 12040199 CONSUMER LOANS 12040299 INSTALLMENT LOANS 12040399 HOME EQUITY LOANS 120 4 0 4 9 9 HOME EQUITY LINE OF CREDIT 12040599 TAX EXEMPT LOANS 12070199 SECONDARY MRKT REAL EST LOANS 12090199 CHARTER GUARD 12090299 AR BUSINESS MANAGER 12100199 OVERDRAFTS
OTHER LOANS TOTAL LOANS
29910199 ALLOW FOR LN LOSS-BEGINNING 29920199 CHARGE OFF 2 9 930199 RECOVERY 29951099 PROVISION TRANSFER
ALLOWANCE FOR LOAN LOSSES
NET LOANS
13010099 LAND 13020099 BANK BUILDING 13021099 ACCUM DEPR - BANK BUILDING 13030099 FURNITURE amp FIXTURES 13031099 ACCUM DEPR - FURNITUREFIXTURE 13040099 BANK EQUIPMENT 13041099 ACCUM DEPR - BANK EQUIPMENT
FIXED ASSETS
OTHER REAL ESTATE
ACCRUED INT RECEIVABLE-INVESTMENTS ACCRUED INT RECEIVABLE-LOANS
llNANllAL MANAGEMENT SYSTEM DAILY STMT OF CONDITION SUMMARY-CONSOLIDATED
CURRENT BALANCE
2 850 4 1 9 4 0
3 4 4 0 000 00 3 4 4 0 000 00
1 62 4 0 0 0 0
00 22 7 2 9 622 57 18 8 8 9 27 4 15 11 211 3 8 7 3 0
00 52 992 68 4 02
l 7 1 6 692 55 5 4 4 9 3 58 0 9 8 295 8 4 6 3 1
27 94 0 192 4 5 20 112 091 9 4
4 3 6 4 7 3 77 2 3 8 3 4 65 4 3 3 099 694 01 1 321 637 5 6 2 0 8 4 608 63
0 0 22 4 1 0 2 8
0 0 24 4 62 8 8
3 527 7 8 72 8 9 0 4 6 1 68
4 1 4 523 62 6 305 80-
9 9 9 0 6 00
4 0 9 2 1 6 8 8
72 4 8 1 2 4 4 8 0
9 8 0 000 00 2 3 3 0 628 61
915 660 2 4-128 7 1 8 32 128 7 18 32-4 61 0 8 1 32 3 00 510 65-
2 555 53 9 0 4
00
2 8 6 3 9 0 13 23 9 3 0 8 5 9
PREVIOUS BALANCE
3 3 3 6 4 5 1 9 8
7 55 6 000 0 0 7 55 6 000 0 0
1 62 400 00
0 0 22 8 63 4 3 4 7 6 1 8 9 60 079 15 11 4 0 9 953 10
0 0 5 3 3 9 5 8 6 7 01
1 50 0 6 4 7 99 5 3 4 3 226 5 4 9 27 0 810 23
2 6 4 8 4 871 27 2 0 257 2 8 1 24
59 8 2 8 6 7 1 2 3 3 1 3 9 6 1 4 2 77 6 203 5 4 1 4 4 0 8 8 1 5 8 2 15 1 573 7 9
0 0 22 9 4 7 67
0 0 1 6 475 92
9 97 7 2 1 9 4 612 5 9
4 1 4 523 62 6 305 8 0-
897 4 6 0 0
4 0 9 115 28
7 1 7 8 5 4 9 7 3 1
9 8 0 0 0 0 0 0 2 33 0 628 61
9 10 472 69-128 7 1 8 32 128 7 1 8 32-5 7 9 5 1 9 94 4 1 3 153 7 4 -
2 5 6 6 522 12
0 0
626 9 8 2 7 8 2 8 2 7 0 9 8 8
AVG BAL DEC l 4
2 326 015 55
7 17 9 58 0 64 7 17 9 5 8 0 64
1 62 400 00
00 22 8 3 9 3 4 8 93 1 8 953 227 0 4 1 1 3 5 4 608 0 l
0 0 5 3 3 0 9 5 8 3 98
l 532 0 6 4 5 1 5 4 93 72 9 5 7 8 8 3 6 7 7 0 0 1
27 0 4 8 0 60 02 20 103 8 1 6 15
4 4 7 7 29 5 6 2 3 7 9 55 9 3 0 2 8 8 1 2 8 7 9 6 1 4 3 8 4 1 8 95 2 105 03 8 94
2 5 120 77 23 2 60 1 4
00 1 5 5 8 4 11 4 2 7 0 8 42-
7 2 2 87 731 57
4 1 4 523 62 6 305 8 0-
9 6 9 5 6 00
4 0 9 187 3 8
7 1 8 7 8 5 4 4 19
9 8 0 000 00 2 3 3 0 628 61
913 7 64 0 9-12 8 7 1 8 32 128 718 32-575 699 3 1 4 1 2 554 11-
2 5 6 0 009 7 2
0 0
4 8 7 631 3 4 21 8 517 4 4
AVG BAL NOV l 4
3 0 1 6 9 6 6 7 0
7 7 31 5 6 6 6 6 7 7 31 5 6 6 6 6
1 62 4 0 0 00
0 0 22 685 0 8 0 51 1 9 0 1 8 233 3 0 l l 4 4 7 I 971 85
00 53 3 13 685 6 6
1 517 3 83 12 5 4 1 5 9 4 0 93 8 5 9 4 114 29
2 6 119 237 43 2 0 4 8 6 734 61
605 25 4 02 2 3 08 829 8 0 2 7 4 1 5 5 6 7 1 1 4 37 8 6 8 4 4 2 15 1 985 67
13 6 14 6 66 23 17 9 3 0
0 0 3 2 9 5 6 4 6
5 420 83-7 1 5 6 5 7 6 6 61
4 1 4 523 62 6 305 80-
77 8 92 00
4 0 8 9 9 6 7 4
7 1 1 5 6 7 6 9 8 7
9 8 0 000 00 2 327 737 93
9 0 6 5 6 4 8 1-1 2 8 718 3 2 128 7 18 32-577 073 52 4 1 2 15 6 23-
2 5 6 6 090 4 1
0 0
5 6 6 615 77 2 4 5 15 0 75
RUN DAT E 123120 PROCESSED THRO 123120
AVG BAL JAN-DEC 2014
2 68 5 67 9 50
7 924 50 6 8 4 7 924 5 0 6 8 4
1 6 1 619 73
0 0 22 7 3 0 24 1 7 3 1 9 525 023 37 1 2 028 99 6 11
00 5 4 4 4 5 8 8 0 94
1 85 9 924 69 5 19 9 118 0 1 7 7 07 27 9 67
25 3 95 531 3 3 2 0 317 523 9 4
5 8 5 057 03 2 20 9 67 0 8 6 2 582 04 5 05 1 282 51 6 93 2 015 151 97
7 8 97 6 8 3 2 0 6 4 1 4 6
0 0 57 350 0 8
3 237 93-69 307 5 4 9 92
4 1 4 501 5 9 3 403 4 0-
4 00 93 00
4 1 1 4 9 9 12
68 8 9 6 050 8 0
980 000 00 2 32 2 3 8 7 54
8 83 9 65 60-128 7 1 8 32 128 7 18 32-556 0 9 1 01 3 8 8 6 4 1 91-
2 5 8 5 8 7 1 04
5 109 23
431 82 6 5 8 215 908 3 6
EPORT FMS 3211-Ul- l u - FINANCIAL MANAGEMENT SYSTEM RUN DATE 123120 lYSTEM 01142015 23 20 DAILY STMT OF CONDITION SUMMARY-CONSOLIDATED PROCESSED THRU 123120
CURRENT PREVIOUS AVG BAL AVG BAL AVG BAL BALANCE BALANCE DEC 1 4 NOV l4 JAN-DEC 2014
OTHER ASSETS 312 290 7 4 312 7 66 95 315 701 9 6 3 1 9 699 43 2 8 1 3 62 4 4 TOTAL ACCRUED INT amp OTHER ASSETS 8 37 9 8 9 4 6 1 222 4 5 9 61 1 021 850 7 4 1 13 1 4 65 95 929 097 3 8
TOTAL ASSETS 135 157 876 72 139 8 62 7 9 8 03 138 275 5 8 4 B2 138 916 5 4 5 25 137 472 195 7 3
LIABILITIES
20010599 CHARTER CHECKING 5 273 4 22 4 2 5 010 4 9 1 35 4 8 0 9 68 4 8 6 5 04 3 8 6 6 51 5 02 9 582 3 8 20011099 CHARTER IMAGE CHECKING 4 032 9 6 6 27 3 691 167 9 9 3 697 612 19 3 5 97 180 1 9 3 502 558 23 20011599 SR CHARTER CHECKING 9 0 6 5 65 98 7 97 7 4 9 3 9 8 9 5 247 7 4 7 9 3 994 69 826 653 3 7 20012099 CHARTER SMALL BUSINESS ACCTS 9 1 67 3 4 8 77 9 511 420 64 9 9 7 5 553 93 9 0 9 5 4 0 1 3 8 8 8 39 938 5 5 20012599 CHARTER BUSINESS ACCOUNTS 5 621 3 8 7 23 7 119 67 1 7 1 6 25 8 153 0 9 6 7 7 3 7 1 1 03 5 927 391 52 OTHER DEMAND DEPOSITS 1 9 8 121 42 25 8 14 97 4 33 58 1 8 8 4 8 8 2 4 6 53 3 67 57 6 8 6 DEMAND DEPOSITS 25 19 9 812 0 9 2 6 15 6 3 1 6 05 2 6 0 6 9 833 6 9 2 5 7 9 2 4 0 0 33 2 4 4 93 7 00 9 1
20512099 CHARTER INTEREST CHECKING 4 617 4 1 8 8 8 4 201 25 8 68 5 05 3 3 3 3 66 4 215 3 0 8 5 6 3 9 85 752 4 1 20512199 CHARTER COMPLETE CHECKING 821 77 8 7 4 8 0 0 517 3 8 8 3 0 4 62 4 1 8 4 8 4 9 9 5 0 1 0 6 1 8 0 0 11 20512599 CHARTER BUSINESS INT CHECKING 8 0 9 4 8 1 37 1 18 5 824 14 1 027 218 55 9 4 6 722 8 9 8 4 3 37 6 4 3 INTEREST BEARING DEMAND DEPOSITS 6 2 4 8 67 8 99 6 187 600 20 6 911 014 62 6 010 530 95 5 8 9 0 928 95
21000199 CHARTER SAVINGS ACCOUNTS 4 02 1 8 9 4 61 3 982 63 8 39 3 9 7 9 187 25 4 006 2 5 6 11 4 1 0 4 023 95 21001099 JUNIOR CHARTER SAVINGS 50 0 5 4 7 57 4 9 2 629 00 4 9 5 1 8 1 4 2 4 8 8 195 66 4 8 5 8 82 19 21200199 CHARTER MONEY MARKET ACCTS 1 6 1 8 1 4 98 04 1 6 478 4 3 1 51 1 6 3 9 9 60 6 19 1 6 13 4 5 7 4 2 6 1 6 5 6 8 909 9 4 21201199 CHARTER CAPITAL 2 5 53 9 3 8 6 7 4 27 677 427 97 2 6 1 3 9 537 99 2 7 4 63 507 3 8 2 6 93 4 09 9 4 5 OTHER SAVINGS DEPOSITS 133 17 27 00 3 3 6 5 1 3 4 9 1 4 8 615 12 SAVINGS DEPOSITS 4 6 2 4 3 4 60 13 4 8 63 1 153 8 7 4 7 013 8 4 9 3 6 4 8 0 9 6 024 8 9 4 8 0 93 53 0 65
TIME CERTIFICATES 3 5 647 124 77 3 5 9 5 6 377 4 6 3 5 7 9 8 97 6 5 8 3 6 0 3 6 3 8 4 8 8 3 6 8 8 3 117 3 8 IRA TIME CERTIFICATES 6 3 7 6 087 75 6 721 312 52 6 5 3 5 4 0 6 67 6 77 6 4 1 9 4 9 6 8 8 9 7 3 1 60 OTHER TIME CERTIFICATES 00 0 0 9 64 8 8 3- 1 9 6 8 5 6- 4 03 7 31-TOTAL TIME CERTIFICATES 4 2 023 212 52 4 2 677 6 8 9 98 4 2 324 73 4 4 2 4 2 8 1 0 835 81 4 3 7 6 8 8 1 1 67
TOTAL DEPOSITS 119 7 15 163 7 3 123 652 7 6 0 10 122 319 432 0 9 122 7 0 9 7 91 9 8 122 2 4 6 972 18
FED FUNDS PURCHASED oo 00 00 00 0 0 OTHER BORROWED MONEY oo 00 00 00 00 ACCRUED INT PAYABLE 6 6 1 68 64 6 8 920 5 0 6 6 3 0 6 7 7 7 0 550 62 7 1 263 4 6 ACCRUED TAXES PAYABLE 326 773 80 4 7 5 7 8 3 15 3 9 6 4 69 4 1 4 65 1 0 6 60 3 21 8 9 8 81 OTHER LIABILITIES 108 51 6 8 4 2 8 7 977 3 8 2 7 0 169 2 6 2 4 9 319 15 156 003 4 8
TOTAL LIABILITIES 120 21 6 623 01 124 4 8 5 4 4 1 13 123 052 377 53 123 4 9 4 7 68 3 5 122 7 9 6 137 93
30010099 CAPITAL 4 150 000 0 0 4 150 000 00 4 15 0 00 0 00 4 150 000 00 4 150 0 00 0 0 30020099 SURPLUS 2 9 5 663 0 0 295 663 0 0 2 9 5 663 0 0 295 663 00 295 663 0 0 30030099 UNDIVIDED PROFITS 9 3 0 4 114 20 9 3 0 4 114 20 9 3 0 4 114 2 0 9 3 04 11 4 2 0 9 3 0 4 114 2 0 30032099 UNREALI ZED GAINLOSS AFS SEC 533 03 6 1 4 62 8 3 01 9 6 619 082 68 695 5 8 8 9 0 5 4 1 5 8 5 68 30033099 DIVIDENDS PAID YEAR TO DATE 7 95 0 00 00- 325 0 0 0 00- 522 09 6 77- 325 0 0 0 00- 33 9 958 90-
NET INCOME YEAR TO DATE 1 4 52 2 62 13 1 32 3 3 4 8 7 4 1 37 3 7 05 28 1 2 9 9 6 61 07 7 2 6 8 9 8 05
TOTAL CAPITAL 1 4 9 4 0 075 47 15 3 7 6 427 90 15 220 4 68 3 9 1 5 4 2 0 027 17 1 4 67 8 302 03
TOTAL LIABILITIES amp CAPITAL 1 3 5 156 698 4 8 1 3 9 8 61 8 69 03 13 8 272 8 4 5 92 13 8 9 14 7 9 5 52 137 47 4 4 3 9 9 6
EPORT FMS3211-018 19 02 7 FINANCIAL MANAGEMENT SYSTEM RUN DATE 123120 YSTEM 0114 2015 23 20 DAILY STMT OF OPERATION SUMMARY-CONSOLIDATED PROCESSED THRO 123120
POSTED POSTED POSTED POSTED POSTED DEC l4 NOV l4 DEC l3 JAN-DEC 2014 JAN-DEC 2013
i- INCOME
INTEREST FROM BANKS 2 8 4 9 9 1 2 5 9 9 7 4 3 7 53 99 3 3 0 9 9 55 3 9 4 9 0 3 4
FHLB STOCK INCOME 204 66 00 00 1 3 8 6 3 4 1 8 9 52
GOV T BOND INCOME oo 0 0 0 0 00 0 0
AGENCY BOND INCOME 3 5 972 4 2 35 7 8 3 7 8 3 4 457 14 4 5 0 8 3 3 5 1 3 5 8 6 8 1 6 9
MUNICIPAL BOND INCOME 42 53 6 10 4 1 7 64 4 1 4 4 958 32 521 60 6 6 6 5 6 4 8 5 4 7 4
TAX MUNICI PAL BOND INCOME 37 37 1 2 6 3 8 102 15 43 3 4 3 8 6 4 8 7 21 6 4 6 573 63 9 42
CORPORATE BOND INCOME o o 0 0 0 0 0 0 o o
TOTAL INVESTMENT INCOME 116 0 8 4 4 4 115 650 34 122 75 9 32 1 4 61 042 97 1 4 9 7 3 65 3 7
42010199 INT INC-COMMERCIAL LOANS 5 950 5 4 5 8 12 3 6 6 53 9 8 4 8 6 805 73 115 2 4 4 67 42010299 INT INC-COMMERCIAL TERM LOANS 22 673 8 4 21 935 5 4 2 6 5 4 5 04 2 61 2 1 6 62 3 60 8 87 50 42010599 INT INC-CONSTRUCTION LOANS 3 1 3 7 9 4 7 31 909 85 22 034 51 3 33 3 5 9 35 218 7 8 3 64 42020299 INT INC-COMM REAL ESTATE LOANS 105 97 0 8 5 9 9 3 10 23 104 150 4 6 1 218 1 66 61 1 20 8 221 1 6 42020399 INT INC-RES REAL ESTATE LOANS 67 7 95 23 6 9 093 4 0 6 8 4 3 6 66 8 1 8 111 82 7 8 0 015 63 4 2040199 INT INC-CONSUMER LOANS 1 754 53 2 18 9 93 2 620 69 24 573 61 22 3 4 1 5 8 4 2040299 INT INC-INSTALLMENT LOANS 8 9 4 5 3 8 8 513 97 8 5 9 1 0 4 1 0 4 294 2 4 115 4 1 0 07 4 2040399 INT INC-HOME EQUITY LOANS 11 972 2 4 11 1 4 0 05 1 2 074 7 9 132 697 4 6 157 923 37 42040499 INT INC-HOME EQUITY LOC 5 02 6 91 4 8 60 82 4 2 9 0 27 52 724 8 0 5 2 5 63 01 42040599 INT INC-TAX EXEMPT LOANS 6 358 72 6 4 02 1 6 6 3 18 9 4 7 5 4 15 97 8 1 435 4 7 42070199 INT INC-SECONDARY R E MARKET 7 4 4 0 475 7 5 805 7 8 3 2 6 0 2 3 6 9 4 1 4 8 42075299 INT INC-CHARTER LINE 3 3 4 37 370 51 3 4 1 81 3 8 4 9 4 8 3 8 9 0 3 8
42075399 INT INC-CONTRACTS RECV oo 00 0 0 0 0 oo 42101099 DEALER INTEREST EXPENSE 4 5 6- 0 0 00 4 5 6- 291 55-
LOAN INTEREST INCOME 2 6 8 2 3 1 92 2 62 014 57 2 62 7 4 9 8 3 3 114 471 3 6 3 123 3 6 6 41
TOTAL INTEREST INCOME 3 87 1 6 6 27 3 8 0 2 6 4 65 3 8 9 2 63 1 4 4 608 613 8 8 4 6 6 0 222 12
43010099 DOA SERVICE CHARGES 6 8 29 98 7 017 4 6 6 2 1 6 0 6 8 8 630 77 8 6 518 13 43020099 SAVINGS ACCTS SERVICE CHARGES 4 8 1 0 3 3 3 9 8 8 4 6 6 11 5 1 64 4 3 5 7 11 01 43030099 RETURN amp OVERDRAFT CHARGES 6 9 9 0 22 7 09 8 00 7 77 4 0 0 9 1 645 87 8 4 371 68 43040099 RETURNED DEPOSITED ITEM CHRGS 1 4 0 00 8 0 00 1 4 0 00 1 15 0 0 0 1 27 0 0 0 43090099 MISCELLANEOUS SERVICE CHARGES 653 0 0 4 4 3 0 0 422 0 0 6 752 0 0 5 3 93 71
SERVICE CHARGES 15 09 4 23 1 4 97 8 3 4 15 018 17 193 3 4 3 07 183 264 53
FEE INCOME 8 0 3 0 4 7 9 6 oomiddot 1 115 00 10 04 0 53 10 83 3 4 3
45001099 LOAN E INCOME 900 00 200 0 0 6 3 0 0 00 3 4 9 3 8 12 22 7 9 1 8 9 45002099 CONSTRUCTION LOAN FEES 4 59 8 00 middotmiddotl 500 00 2 500 00 3 7 4 8 8 00 61 5 4 4 60 45015099 DEdegINQUENT LQAN FEES 5 031 72 1 4 5 8 3 8 5 4 2 4 1 1 9 663 50 9 854 25 45019 099 OTHER LOAN INCOME 9 8 8 55 1 4 19 92 2 3 1 4 13 1 8 -741 23 28 45 8 7 9 45025099 CREDIT CARD INCOME oo 8 4 7 63 1 73 0 52 4 7 1 6 9 9 3 8 4 6 03 45045099 INSURANCE INCOME oo 00 0 0 00 0 0 45075099 SECONDARY MARKET INCOME 5 2 0 6 5 8 7 9 6 0 3 1 1 5 513 92 82 422 7 1 18 0 535 35
OTHER LOAN INCOME 1 6 724 85 13 3 8 6 2 4 2 8 900 98 1 97 970 55 3 07 03 0 9 1
NST EPORT YSTEM
9S U 13K UVU FMS 3211-018 1 9 0 2 7 0114 2015 23 2 0
4 6001099 DEBIT CARD INCOME 4 6002099 ATM SURCHARGE INCOME 4 6003099 MERCHANT CARD INCOME 4 6004099 ACH ORIGINATION INCOME 4 6020099 CHECK PRINTING INCOME 4 6040099 SAFE DEPOSIT BOX RENT INCOME
OTHER INCOME TOTAL OTHER INCOME
TOTAL NON-INTEREST INCOME
TOTAL INCOME
DAILY
CHARTER BANK FINANCIAL MANAGEMENT SYSTEM
SMT OF OPERATION SUMMARY-CONSOLIDATED
POSTED POSTED DEC l 4 NOV l4
21 695 5 8 17 5 4 2 4 9 2 37 9 7 8 2 459 90
1 9 32- 85 64 24 3 95 258 7 0
1 1 68 4 0 2 1 4 1 22 2 13 2 0b 2 07 6 00 9 23 3 68 105 35-
3 6 8 3 4 07 2 4 4 58 60
6 9 4 5 6 19 5 3 619 18
456 622 4 6 4 3 3 8 8 3 8 3
PAGE RUN DATE 123120
PROCESSED THRU 123120
POSTED POSTED POSTED DEC 13 JAN-DEC 2014 JAN-DEC 2013
1 3 208 23 219 225 91 14 5 903 8 0 3 408 18 4 0 005 12 62 1 9 6 8 6
15 81- 6 6 7 3 L 7 o)deg 215 20 2 4 7 8 15 2 27 0 57 834 4 5 11 9 4 6 4 5 12 2 04 0 4
2 28 1 4 0 24 127 8 5 2 6 3 60 20 4 2 15 1 0 373 65 1 58 8 4 5
1 9 973 8 0 3 0 8 223 8 6 250 525 67
65 007 95 7 0 9 5 7 8 01 751 65 4 5 4
4 5 4 271 0 9 5 3 1 8 191 8 9 5 411 87 6 6 6
LNgtT ltEPORT SYSTEM
)U tHt UUU1 FMS 3211-018 1 9 02 7 0114 2015 23 20
k EXPENSE
50001099 INT EXP-INTEREST CHECKING ACCT 50001199 INT EXP-CHARTER COMPLETE CKING 50001299 INT EXP-CHARTER BUS middot INT CKING 50003099 INT EXP-SAVINGS ACCOUNTS 50004099 INT EXP-MONEY MARKET ACCOUNTS 50004199 INT EXP-CHARTER CAPITAL
INT EXPENSE DEPOSIT ACCOUNTS
TIME CD lt $ 1 0 0 000 INTEREST EXP IRA TIME CD INTEREST EXP BROKERED amp OTHER TIME CD INT EXP
TOTAL INT EXPENSE TIME CD ACCOUNTS
OTHER INTEREST EXPENSE
TOTAL INTEREST EXPENSE
SALARIES AND BENEFITS
51001099 JANITORIAL SERVICE 51002099 BUILDING REPAIR amp MAINT 51003099 UTILITIES 51004099 PROPERTY INSURANCE 51005099 REAL ESTATE TAXES 51006099 OTHER OCCUPANCY EXPENSE 51007099 DEPRECIATION - BUILDING 51008099 LEASE EXPENSE 51009999 RENTAL INCOME
TOTAL OCCUPANCY
51512099 EQUIPMENT SERVICE CONTRACTS 51522099 EQUIPMENT REPAIRS amp MAINT 51532099 NETWORK EXPENSE 51550099 DEPR - FURNITURE amp FIXTURES 515520 9 9 DEPR - BANK EQUIPMENT 51599099 LOSS ON SALE OF FIXED ASSETS
TOTAL EQUIPMENT EXPENSE
TOTAL LOAN PROVISION EXPENSE
TOTAL MARKETING EXPENSE
TOTAL SERVICE FEE EXPENSE
TOTAL LOAN EXPENSE
55001099 DATA PROCESSING-FISERV 55002099 DATA PROCESSING-SHAZAM 55003099 DATA PROCESSING-EFT SWITCH FEE 55004099 DATA PROCESSING-OTHER
TOTAL DATA PROCESSING EXPENSE
CHARTER BANK FINANCIAL MANAGEMENT SYSTEM
DAILY STMT OF OPERATION SUMMARY-CONSOLIDATED
POSTED DEC l4
214 61 101 8 8 130 0 0 1 8 8 14
2 5 9 6 52 7 4 80 4 3
1 0 711 5 8
3 6 659 6 6 6 818 17
3 7 0 07-4 3 107 7 6
oo
53 8 1 9 3 4
13 9 015 4 8
1 8 8 9 8 0 2 7 0 6 15 1 823 69 1 128 3 3
1 0 500 0 0 0 0
5 18 7 55 00
3 7 8 7 00-1 9 4 4 8 52
1 921 25 518 90
3 093 30 00
4 8 6 0 03 935 50
1 1 3 2 8 98
00
5 0 68 33
8 20 6 7 8
2 292 5 6
1 9 629 4 0 1 831 20 7 020 18 2 4 3 8 8 6
3 0 91 9 64
POSTED NOV l4
173 13 100 09 115 50 1 8 4 4 6
2 4 63 4 7 7 62 6 95
1 0 663 60
3 6 129 72 6 8 7 2 2 4
3 5 6 08-4 2 645 8 8
0 0
53 3 0 9 4 8
119 079 9 1
3 4 4 5 0 797 4 4
2 0 4 2 82 1 47 8 33
1 0 500 00 00
5 097 21 00
3 7 87 00-1 6 473 30
2 289 4 7 4 3 45
3 093 3 0 0 0
1 619 67 00
7 045 8 9
00
6 27 0 01
6 55 6 7 8
5 3 6-
3 7 119 63 2 625 2 9 9 011 12
525 77-4 8 230 27
POSTED DEC l3
201 4 4 107 83 101 82 17 8 54
2 4 7 6 9 6 7 95 4 07
1 1 020 6 6
42 97 9 08 7 978 23
8 22-50 9 4 9 09
00
61 9 6 9 7 5
1 4 4 7 1 9 33
1 181 9 0 2 4 62 5 6 2 355 3 5
9 9 1 25 1 0 500 00
00 5 097 2 6
0 0 3 7 8 7 0 0-
1 8 801 32
1 9 4 4 3 2 2 4 4 5 99
00 4 4 9
4 9 67 08 oo
9 3 61 8 8
oo
5 552 93
10 628 4 9
8 4 4 7 0
2 0 624 3 4 4 50 4 18
00 2 25middot3 3 1
27 3 8 1 8 3
-middot I POSTED
JAN-DEC 2014
1 990 53 1 53 6 97 1 252 9 0 2 2 9 1 3 9
3 0 731 37 8 7 9 0 4 67
125 7 07 83
4 5 7 7 8 1 01 8 7 4 12 3 8
5 218 5 4 -5 3 9 97 4 85
00
665 682 68
1 53 8 3 52 0 6
14 39 6 90 3 6 652 3 7 2 8 9 7 8 4 5 13 0 7 6 23
126 000 00 oo
61 25 6 8 6 00
4 5 4 4 4 00-234 9 1 6 81
2 1 087 51 22 690 6 6 1 9 012 9 8
00 5 9 313 90
935 50 123 04 0 55
oo
1 0 0 4 3 4 62
8 6 7 4 6 61
1 4 20 2 2 6
2 4 6 609 0 4 3 8 7 4 9 7 8 53 4 55 5 9 2 4 7 20 61
3 63 535 02
PAGE RUN DATE
PROCESSED THRO 123120 123120
POSTED JAN-DEC 2013
1 9 3 1 72 1 135 55 1 682 45 2 0 8 4 61
3 0 4 9 6 4 0 93 3 68 52
13 0 699 25
5 63middot 530 67
108 33 0 3 8 3 528 9 4 -
6 68 332 11
0 0
7 9 9 03 1 3 6
1 55 8 4 0 6 4 2
15 4 82 8 8 3 4 919 10 3 0 924 60 11 750 5 0
126 00 0 0 0 oo
61 1 6 6 57 00
4 5 4 4 4 00-23 4 7 9 9 65
23 7 6 6 2 8 27 7 4 6 15
00 53 8 8
5 8 4 7 0 83 00
110 037 14
oo
104 808 68
7 9 7 8 8 5 1
2 6 220 91
250 53 6 01 5 1 282 35
00 1 9 7 83 3 1
321 601 67
V V V J J 1nttll poundJ l Of-UU PAGE EPORT FMS 3 2 1 1 - 0 1 8 1 9 02 7 FINANCIAL MANAGEMENT SYSTEM RUN DATE 1 2 3 1 2 0 YSTEM 0 1 1 4 2 0 1 5 2 3 2 0 DAILY STMT OF OPERATION SUMMARY-CONSOLIDATED PROCESSED THRU 1 2 3 1 2 0
POSTED POSTED POSTED POSTED POSTED DEC l 4 NOV 1 4 DEC 1 3 JAN-DEC 2 0 1 4 JAN-DEC 2 0 1 3
5 6 0 0 1 0 9 9 FDIC INSURANCE 5 1 0 0 0 0 5 1 0 0 0 0 3 5 0 0 0 0 6 8 8 3 7 2 9 5 4 1 67 17 5 6 0 0 2 0 9 9 BOND INSURANCE 7 7 6 2 2 7 7 6 22 6 5 4 8 1 8 2 2 7 68 7 4 2 3 7 2 5 6 0 0 3 0 9 9 OTHER INSURANCE 2 5 3 1 4 2 5 3 1 4 2 7 1 2 5 3 1 4 6 3 4 2 92 8 3 5 5 6 0 1 5 0 9 9 CORRESPONDENT BANK EXPENSE 1 8 8 1 8 3 1 8 1 9 1 8 1 7 3 7 2 6 2 3 0 1 7 2 9 2 1 5 1 1 4 8 5 6 0 1 60 9 9 COURIERARMORED CAR EXPENSE 1 1 8 93 1 1 8 9 3 1 2 0 1 0 1 4 4 0 02 1 4 4 5 8 4 5 6 0 3 1 0 99 MEMBERSHIPS amp SUBSCRIPTIONS 1 0 6 5 7 2 4 7 5 0 0 8 6 7 2 3 3 67 8 8 1 5 92 7 1 6 5 6 0 3 2 0 9 9 BOOKS amp PUBLICATIONS oo 0 0 00 1 2 1 3 0 5 2 3 3 0 5 60 3 3 0 9 9 MEALS amp ENTERTAINMENT 9 9 5 8 2 1 4 4 5 1 1 9 8 1 3 32 4 8 7 3 98 0 1 9 5 6 0 3 5 0 9 9 DONATIONS amp CONTRIBUTIONS 1 0 0 0 0 0 0 7 0 5 00 8 6 8 7 7 7 7 4 63 1 6 5 6 0 5 1 0 9 9 OFFICE SUPPLIES 9 7 4 7 4 1 8 7 6 7 3 2 7 8 6 05 2 0 8 5 5 3 5 2 9 4 5 4 8 3 5 60 5 2 0 9 9 BUSINESS FORMS 1 4 2 9 62 1 4 2 9 62 1 37 8 7 0 1 8 9 1 4 4 9 1 9 2 2 5 9 0 5 60 5 5 0 9 9 POSTAGE 3 5 8 7 1 1 2 0 6 8 5 1 2 1 5 6 7 6 3 1 6 9 1 7 5 2 8 1 5 6 0 9 5 6 0 5 7 0 9 9 TELEPHONE amp FAX 7 3 9 1 4 7 3 8 7 0 1 0 67 4 9 1 0 1 7 9 53 1 1 4 8 1 92 5 6 0 7 5 0 9 9 TRAINING EXPENSE 2 1 0 5 0 0 3 0 0 0 0 1 0 0 0 0 9 4 03 1 8 1 0 02 0 9 0 5 60 7 7 0 9 9 TRAVEL EXPENSE 8 5 1 3 4 62 1 5 0 1 2 3 1 0 5 7 6 9 5 2 7 8 8 0 0 2 2 5 60 9 5 0 9 9 SALES TAX EXPENSE 2 1 9 0 0 00 0 0 3 6 9 1 5 2 1 3 9 4 5 60 9 9 0 9 9 OTHER OPERATING EXPENSE 1 3 1 3 4 1 8 9 0 7 2 7 5 2 4 2 8 9 1 9 5 1 1 3 7 0
TOTAL OTHER OPERATING EXPENSE 1 9 4 3 2 7 1 1 5 8 1 0 8 8 1 7 4 2 3 03 2 2 3 8 7 9 2 8 2 1 7 8 3 7 8 7
TOTAL MI SCELLANEOUS EXPENSE 7 4 3 3 1 2 90 5 3 1 4 3 3 2 - 6 0 1 9 3 5 6 12 6 4 0
TOTAL NON-INTEREST EXPENSE 2 3 5 7 8 7 3 3 2 2 0 7 5 2 2 1 2 3 4 5 7 0 1 9 2 69 1 1 2 6 5 6 2 6 5 9 6 2 7 2 5
TOTAL EXPENSE 2 8 9 60 6 67 2 7 4 0 6 1 69 2 9 6 5 3 9 9 4 3 3 5 6 8 0 9 2 4 3 4 5 8 6 5 8 61
NET OPER INC BEFORE TAX amp SEC GAINLOSS 1 67 0 1 5 7 9 1 5 9 8 2 2 1 4 1 57 7 3 1 1 5 1 9 6 1 3 8 2 65 1 9 5 3 2 1 8 0 5
6 0 0 6 0 0 9 9 FEDERAL INCOME TAX PROV I S ION 3 0 8 4 9 1 5 3 5 8 3 7 0 0 2 8 4 65 5 4 4 3 1 1 2 8 1 5 4 1 5 0 4 3 5 4 6 0 0 9 0 0 9 9 STATE FRANCHISE TAX PROV I S I ON 7 2 5 3 2 5 7 9 9 7 0 0 7 8 1 0 7 3 97 05 3 2 5 9 7 6 8 1 7 3
NET INC BEFORE SECURITY GAINLOSS 1 2 8 9 1 3 3 9 1 1 5 9 8 8 1 4 1 2 1 4 5 4 8 8 1 4 3 3 2 0 1 2 5 1 4 4 0 4 9 2 7 8
6 0 3 3 0 0 9 9 SECURITY ( GAIN ) LOSS 0 0 0 0 0 0 3 0 3 9 9 8 8 - 4 0 9 0 7 7 0 -6 0 3 6 0 0 9 9 00 0 0 0 0 0 0 o o 6 0 3 7 0 0 9 9 FED TAX O N SEC GAINLOSS 00 0 0 0 0 9 8 1 9 0 0 1 3 2 1 3 0 0 6 0 3 9 0 0 9 9 STATE TAX ON SEC GAINLOSS 00 0 0 o o 1 52 0 0 0 2 04 5 0 0
NET EARNINGS AFTER TAX SECURITY GAINLOSS 1 2 8 9 1 3 3 9 1 1 5 9 8 8 1 4 12 1 4 5 4 8 8 1 4 52 2 62 1 3 1 4 66 1 4 2 4 8
Report Item
F o rm FR Y-6
J o h nsto n G rowth Corporatio n
J o h nston I owa 50 1 3 1 F isca l Year E n d i n g Dece m b e r 3 1 20 1 4
1 The bank holding company prepares an annual report for its securities holders and is not registered with the SEC As specified by the appropriate Reserve B ank three copies are enclosed
2a Organizational Chart
2bDomestic branch listing provided to the Federal Reserve Bank
Results A list of branches for your depository Institution CHARTER BANK (IO_RSSO 2705112) This depository lnstution Is held by JOHNSTON GROWTH CORPORATION (2646037) of JOHNSTON IA
The data are as of 12312014 Data reflects Information that was received and processed through 01072015
ReconcillatJon and Verification Steos
l In the Data Adlon column of each branch row enter one or more of the actions specified below 2 If required enter the date In the Effective Date column
OK If the branch Information is correct enter OK in the Data Action column Change If the branch Information is Incorrect or Incomplete revise the data enter Change In the Data Action column and the date when this information first became valrd in the Effective Date column Close If a branch listed was sold or closed enter Close In the Data Action column and the sale or closure date In the Effective Date column Delete If a branch llsted was never owned by this depository lnstJtution enter Delete in the Data Action column Add If a reportable branch Is missing Insert a row add the branch data and enter Add in the Data Action column and the opening or acquisition date in the Effective Date column
If printing this list you may need to adjust your page setup In MS Excel Try using landscape orientation page scaling andor legal sized paper
Submission Procedure
When you are finished send a saved copy to your FRB contact See the detailed Instructions on this site for more Information If you are e-malllng this to your FRB contact put your institution name city and state in the subject lfne of the e-mail
Note To satisfy the FR Y-10 reportinamp requirements you must also submit FR Y-10 DOmestic Branch Schedules for each branch with a Data Action of Change Close Delete or Add The FR Y-10 report may be submitted in a hardcopy format or via the FR Y-10 Online application - httpsylOonllnefederalreservegov
bull FDIC UNINUM Office Number and ID_RSSD columns are for reference only Verification of these values Is not required
Data Attlon Effective Date Branch Service Type Branch ID RSsobull Pooular Name Street Address City State Zip Code County Country FDIC UNINUMbull
OK Full Service Head Office) 270Sll2 CHARTER BANK SS26 NORTHWEST 86TH STREET JOHNSTON IA 50131 POLK UNITED STATES 61198 OK Full Service 415548S GRIMES BRANCH lSO GATEWAY DRIVE GRIMES IA SOll POLK UNITED STATES 43697S
OK Full Service 4415246 WAUKEE BRANCH 4SS 6TH STREET WAUKEE IA 50263 DAUAS UNITED STATES 436976
Office Numberbull Head Office Head Office ID RSSDbull Comments
0 CHARTER BANK 270Sll2 1 CHARTER BANK 270Sll2 2 CHARTER BANK 270Sll2
FR Y-6
Johnston G rowth Corporation Joh nston Iowa
Fiscal Year Ending December 3 1 2014
Re ort Item 3 Securities Holders
Cu rrent Securities Holders with ownership control or holdings of 5 or more
with power to vote as of fiscal year ending 1 2-31 -2014
(1 )(a)
Name amp Address (City State Country)
Frampton Family Trust Sioux Falls SD George H Frampton - Special Trustee for Johnston Growth Corporation Stock
George H Frampton - additional shares held individually - Clive Iowa
Timothy J Heldt - Johnston Iowa
( 1 )(b)
Country of Citizenship or Incorporation
USA
USA
USA
(1 ) (c)
Number and Percentage of
Each Class of Voting Securities
22000 7292
800 265
3 300 1 094
Securities Holders not listed in 3(1 )(a) through (3)(1 )(c
that had ownership control or holdings of 5 or more with power to vote during the fiscal yea r ending 1 2-31 -
2014
(2)(a ) (2)( b) (2)(c)
Number and Country of Percentage of
Name amp Address Citizenship or Each C lass of
(City State Country) Incorporation Voting Securities
NIA NIA NIA
Report Item 4 Insiders (1)(a)(b)(c) and (2)(a)(b (c)
(1) (2)
Principal Occupation if other than Names amp Address (City Stale Country) with Bank Holding Company
Timothy J Heldt Johnston Iowa USA President amp CEO - Charter Bank George H Frampton Clive Iowa USA Retired Attorney
Calherine E Schulze Centennial CO USA Homemaker Steven Scott Johnston Iowa USA Commercial RE Broker - NAI Optimum
Douglas Kunert Johnston Iowa USA Senior Portfolio Mgr- Agri Credit Acceptance
George A Frampton Johnston Iowa USA Manager Pioneer Hi-Bred International
Robert Bridges Des Moines Iowa USA Retired Attorney Ronald Stallman Clive Iowa USA Accountant- Short amp Company CPA
PLC
Brett Osborn Grimes Iowa USA Attorney - Welsch Abbott amp Osborn PLC
Frampton Family Trust Sioux Falls SD Family Trust USA
FR Ymiddot6
Johnston Growth Corporation Johnston Iowa
Fiscal Year Ending December 31 1 2014
(3(a)
Tille amp Position with Bank Holding Company
President Secretary Treasurer Director Chairman
Director NIA
NA
NA
NA NIA
NA
NA
(3(b)
Title amp Position with
(3)(c)
Subsidiaries Title amp Position with Other Businesses Charter Bank (include names of other businesses)
President amp
CEO Director Secretary OwnerManager- Saylorville Fanns LLC Chairman CEO - Frampton Farms Inc
OwnerManager - Longview Golf Dome LLC OwnerManager- Frampton Management LC
Director Director Frampton Farm Inc Director OwnerManager- LSJT LLC
Director NA
Director Director Frampton Farm Inc
Director Owner- Getty Farm LTD Director PartnerOwner Short amp Company CPA PLC
Owner- Jet Holdings LLC Director Partner- Welsch Abbott amp Osborn PLC
NIA NA
(4(a
Percentage of Voting Securities in Bank Holding Company
1 094 265
166 000
033dego
166
056 083
033
7292
(4)(b) (4)(c)
Percentage of Voting List names of other companies Securities in (includes partnerships) if 25 or Subsidiaries more of voting securities are held (include (List names of companies and names of percentage of voting securities subsidiaries) held)
NA Saylorville Farms LLC - 100 NA Frampton Farms Inc - 25
Longview Golf Dome LLC- 100 Frampton Management LC - 100
NIA Frampton Farms Inc - 25 LSJT LLC - 1 00
NA
NA NA Frampton Farms Inc - 25
NIA NIA Getty Farms LTD - 100
Short amp Company CPA PLC - 50 NA
Owner - Jet Holdings LLC - 100 Welsch Abbott amp Osborn PLC -
NIA 47 NIA
NIA
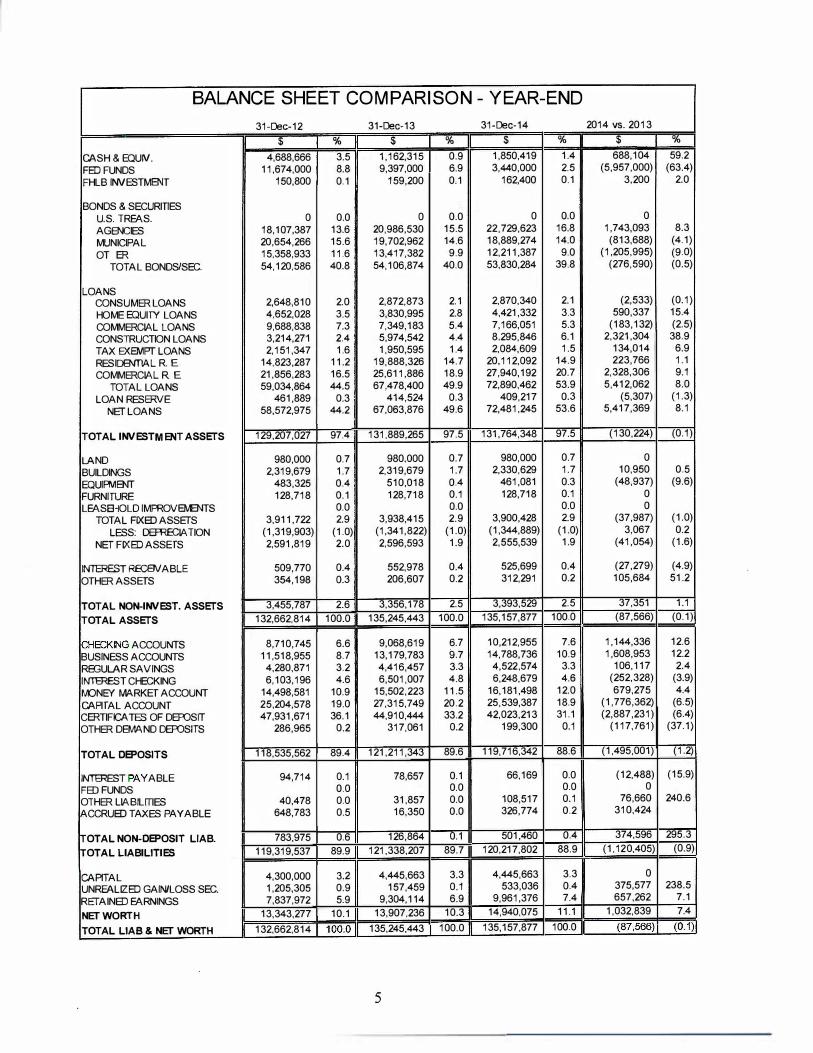
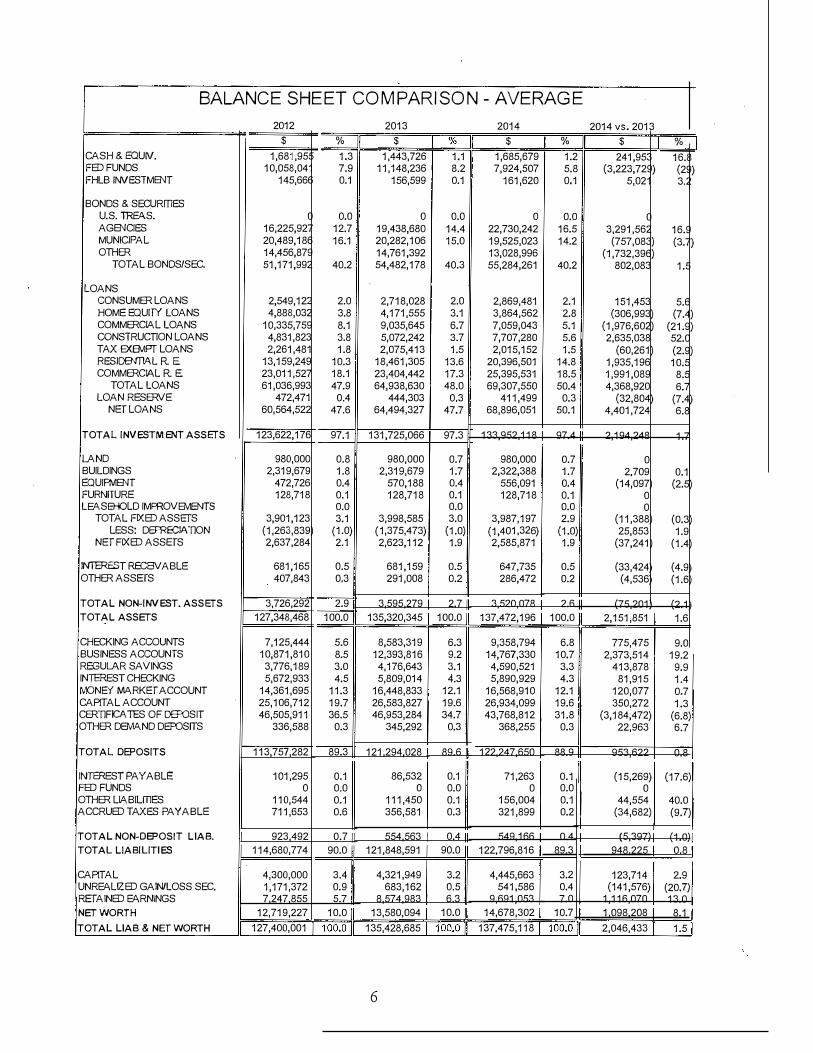
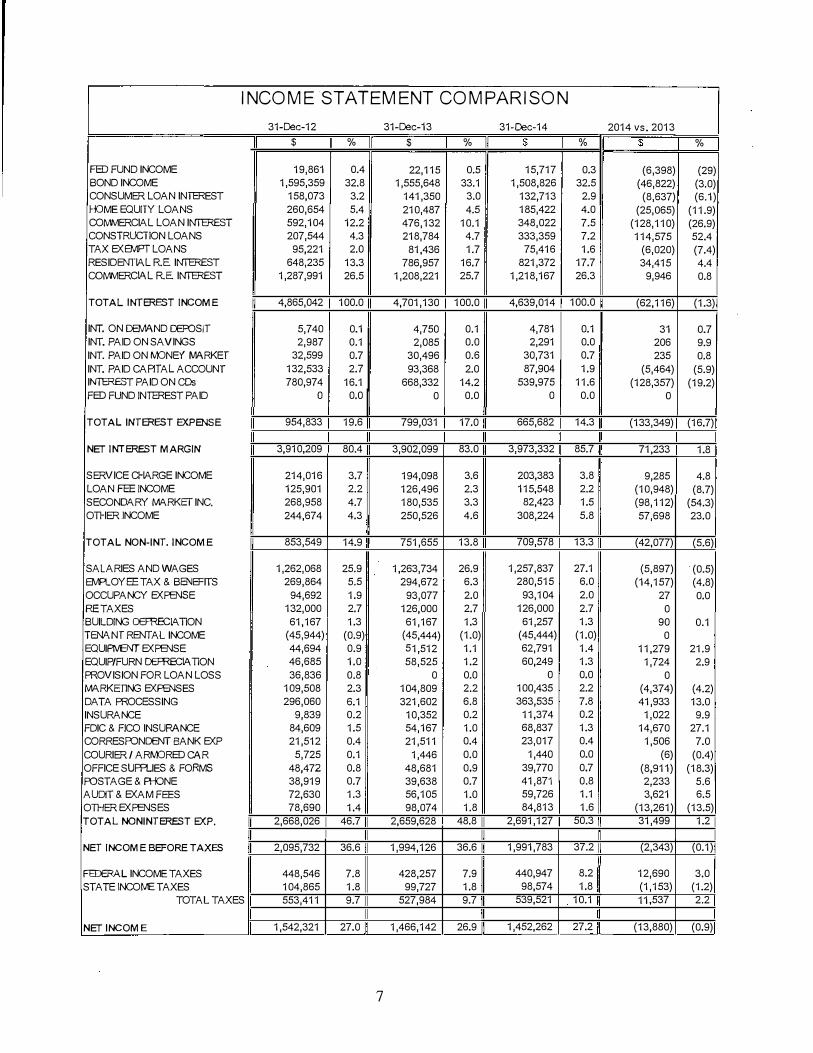
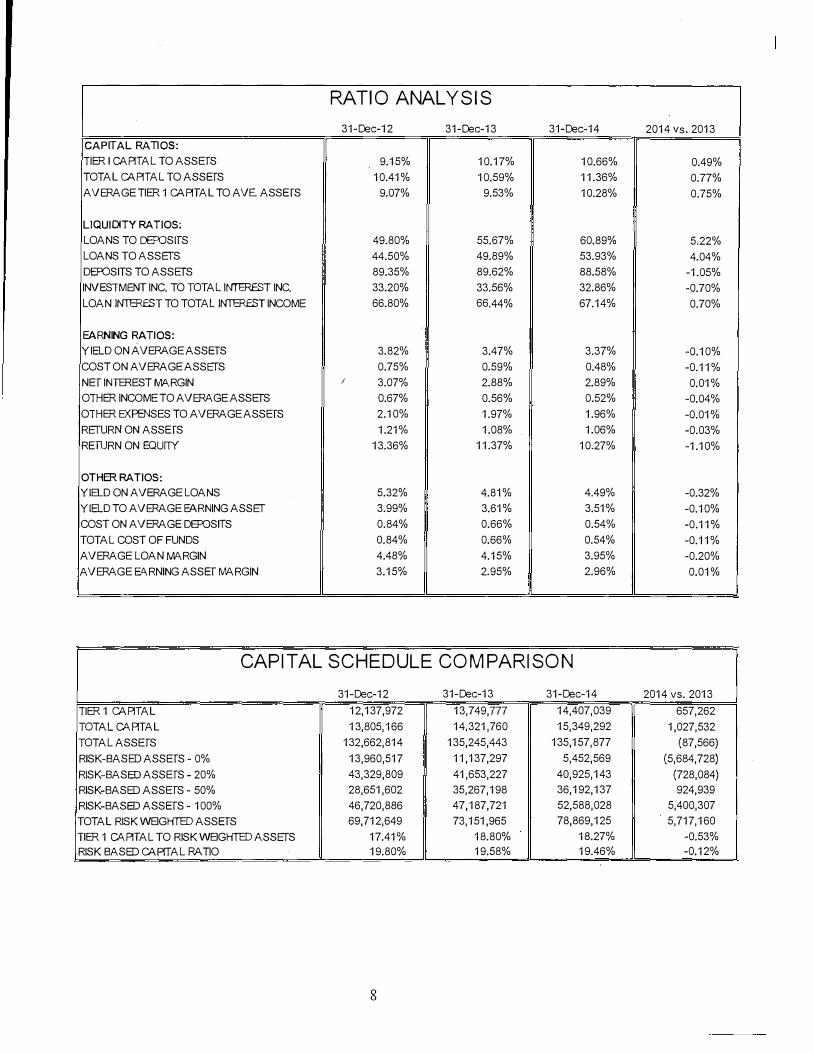
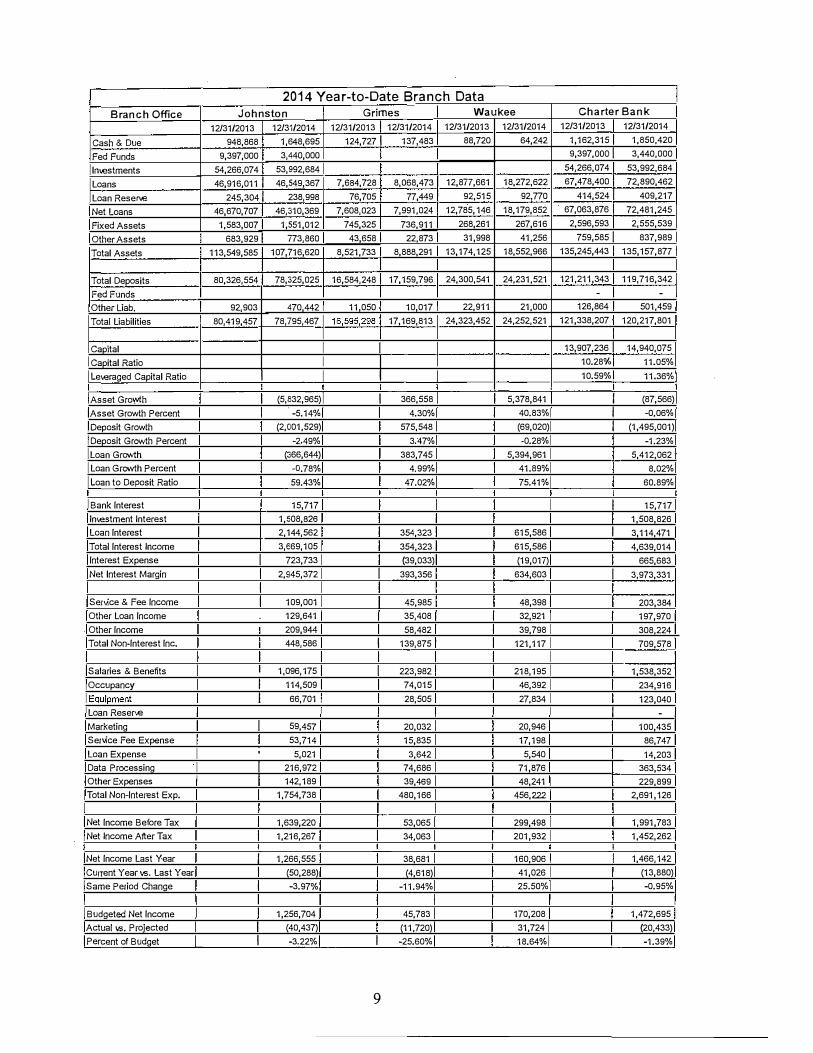
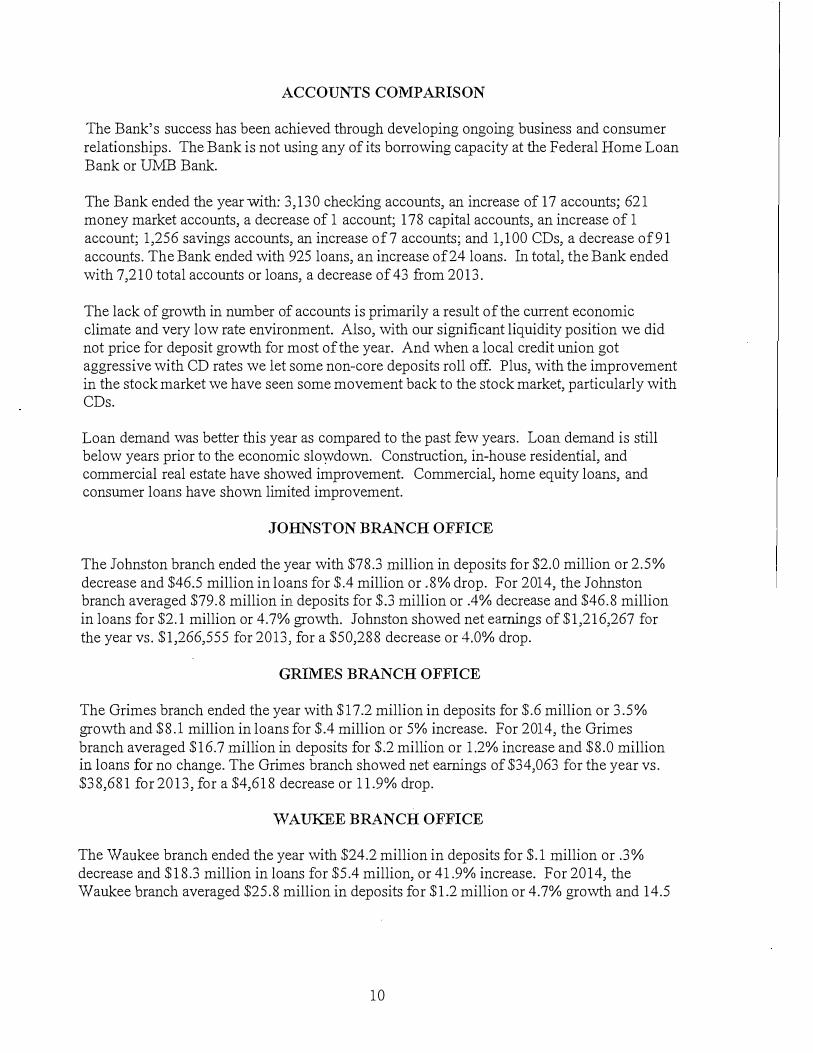
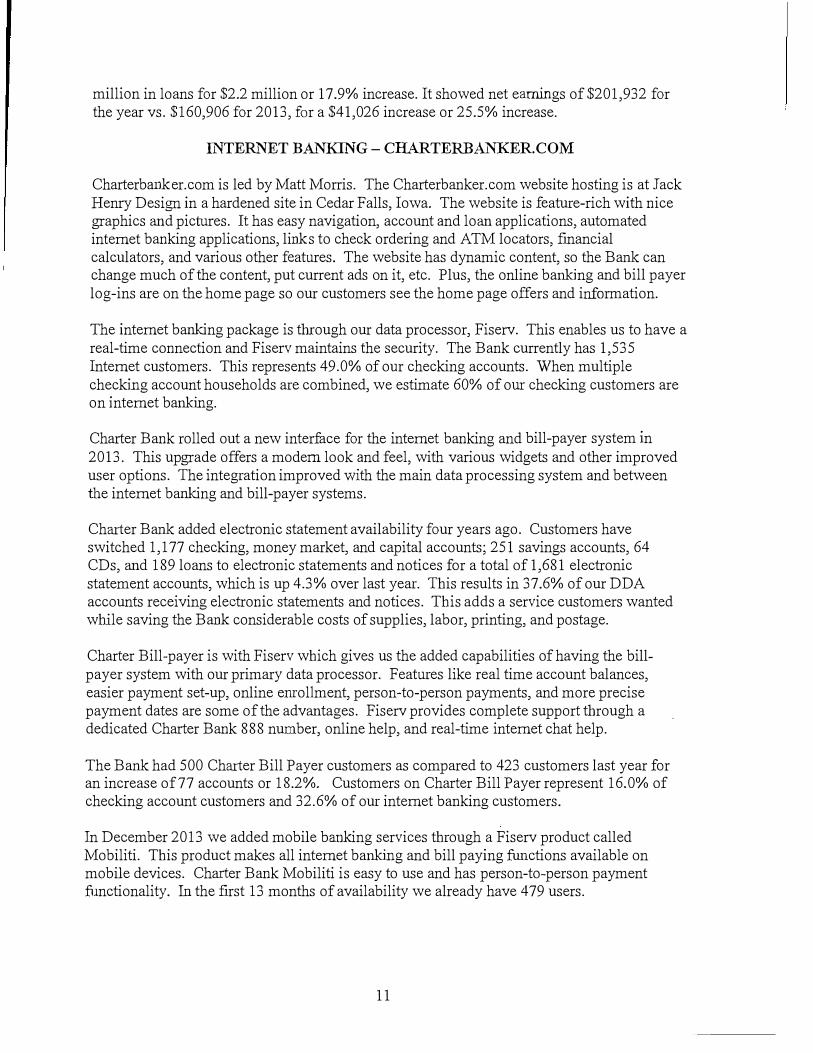
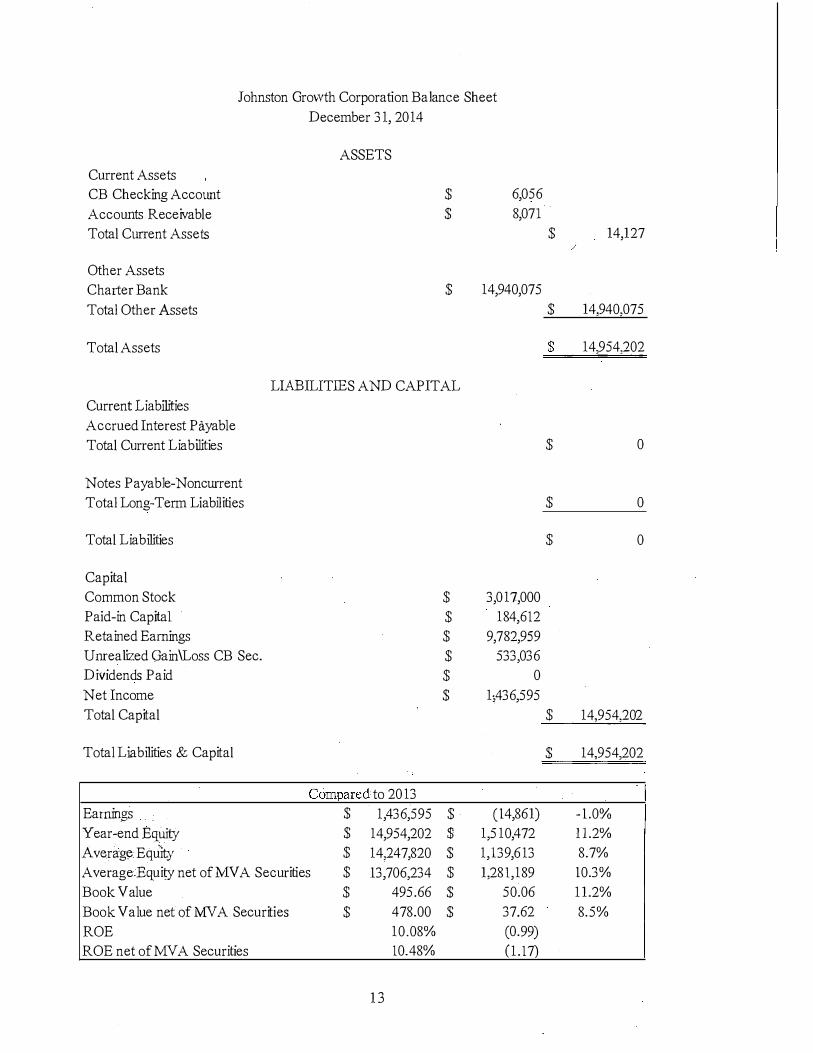
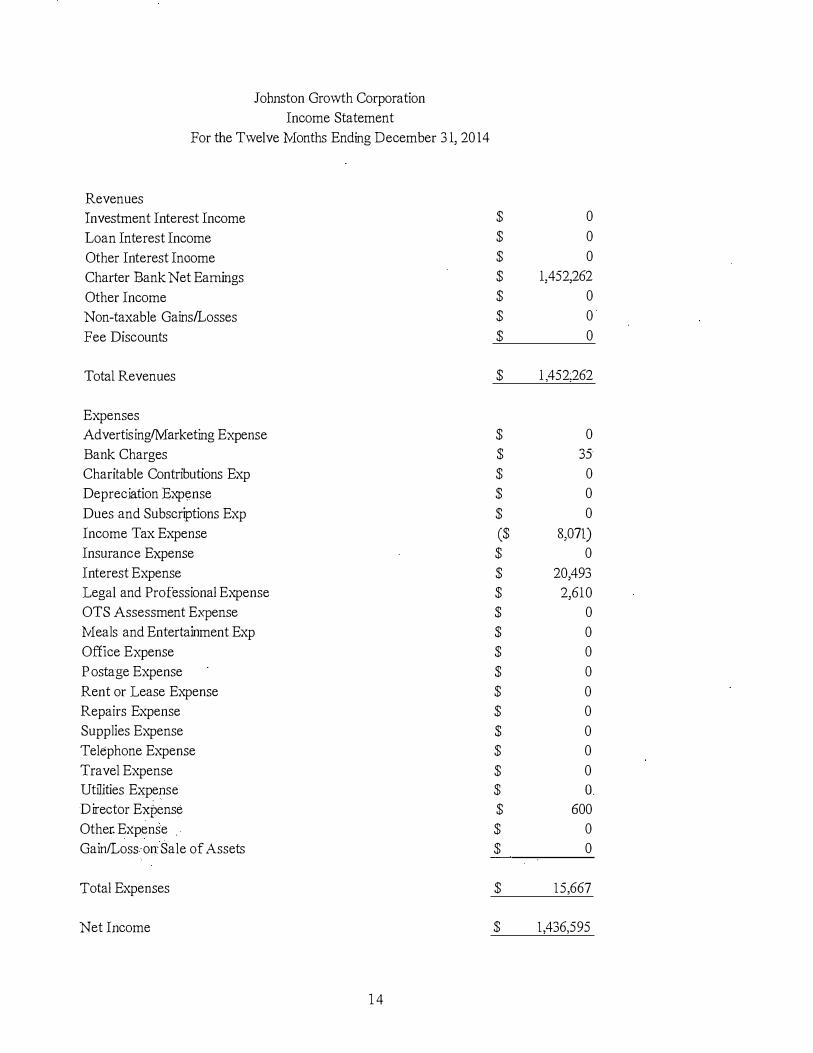
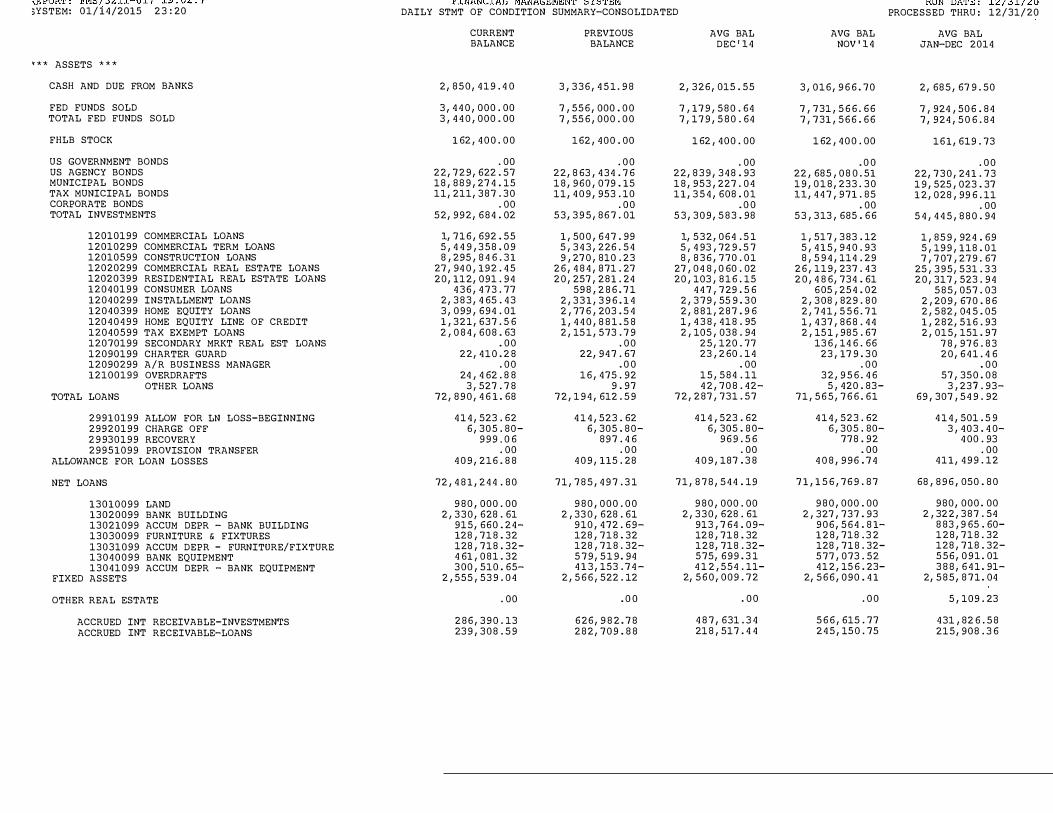
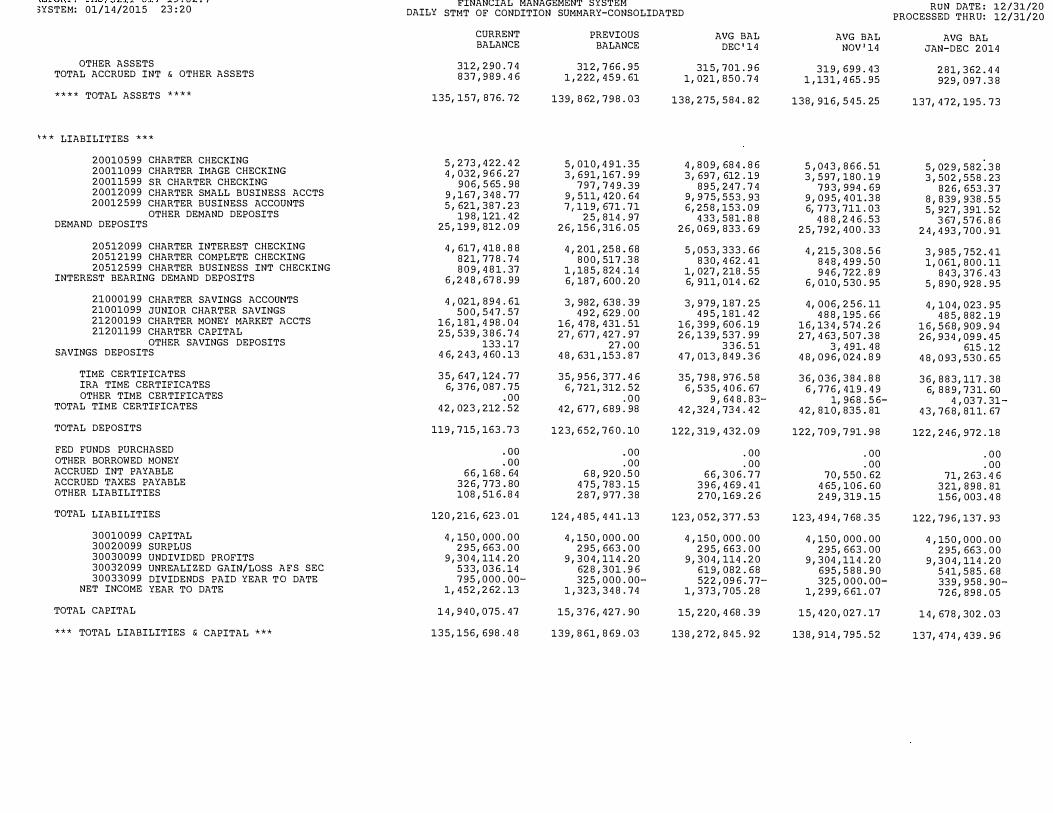
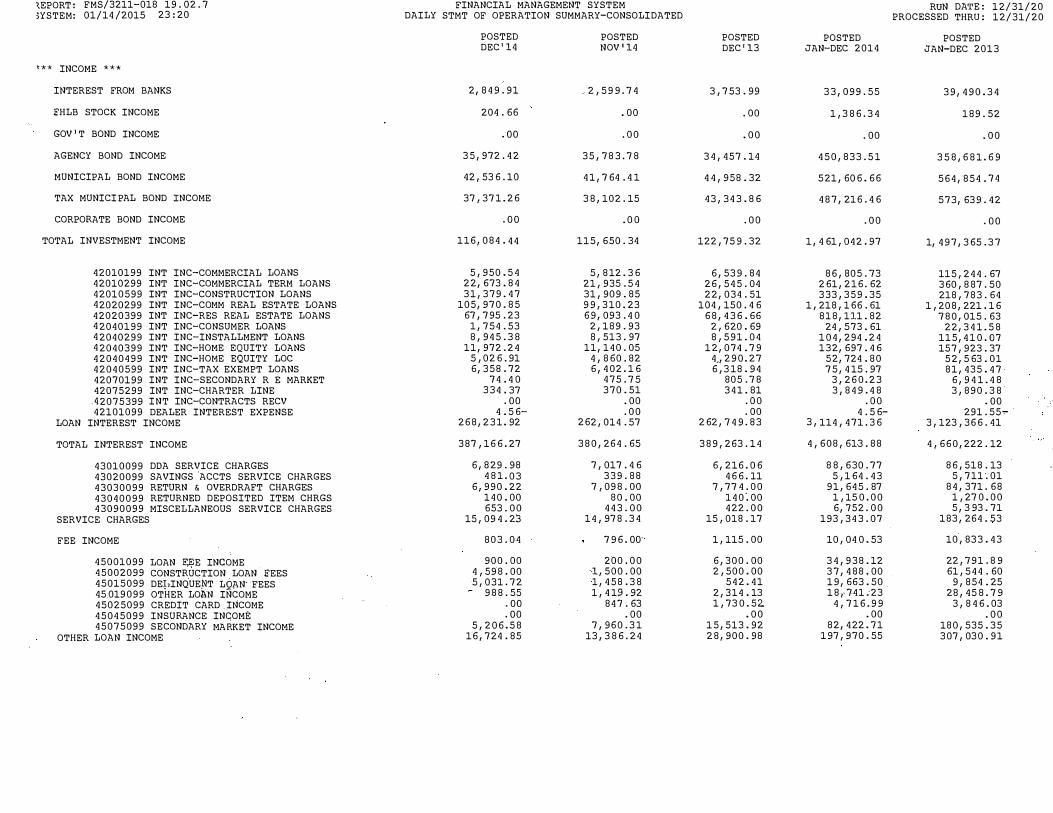
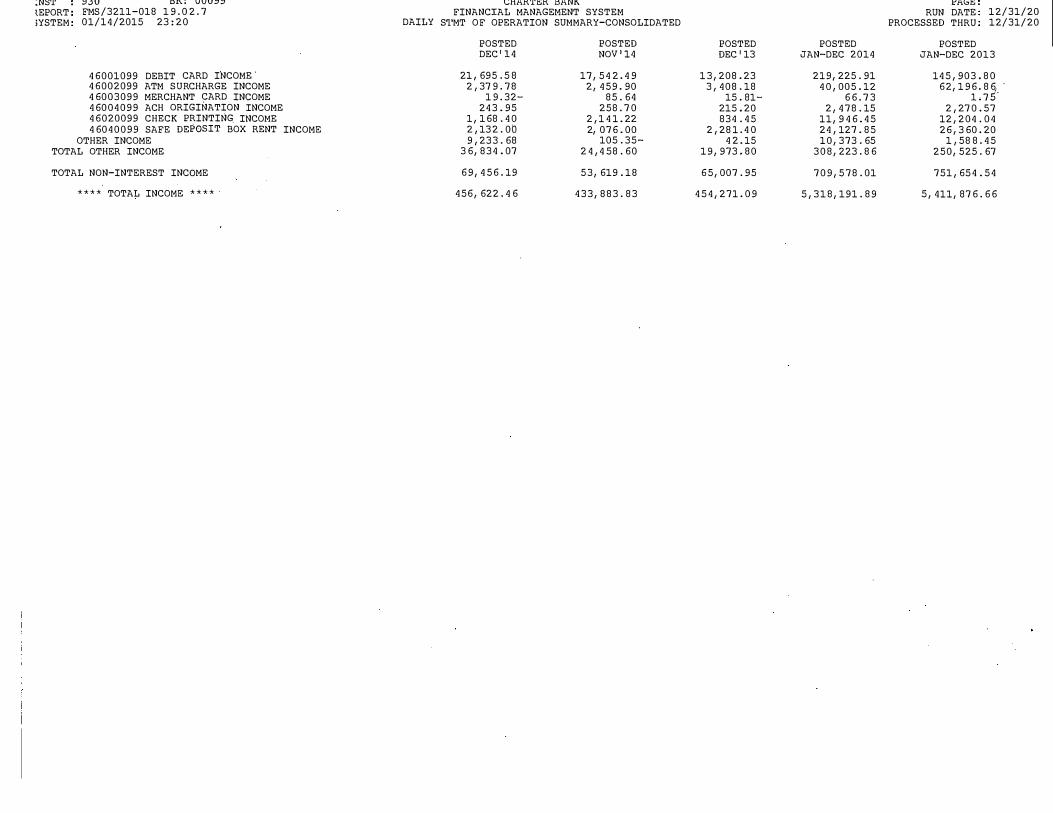
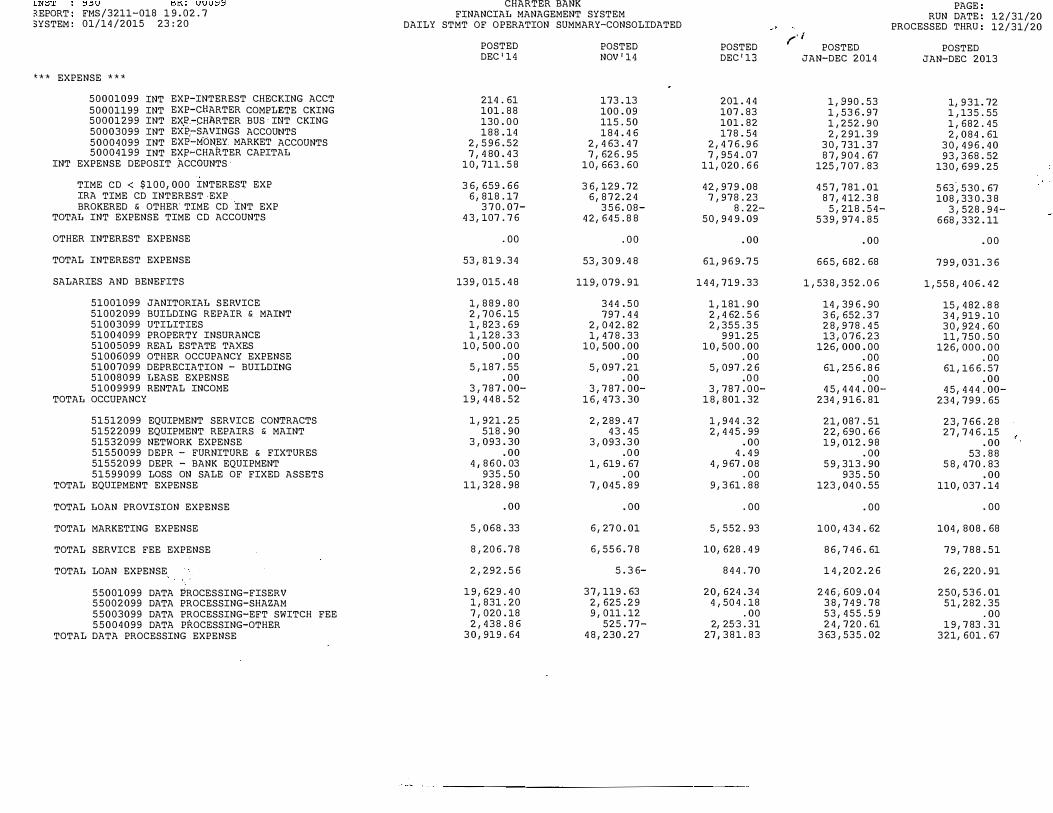
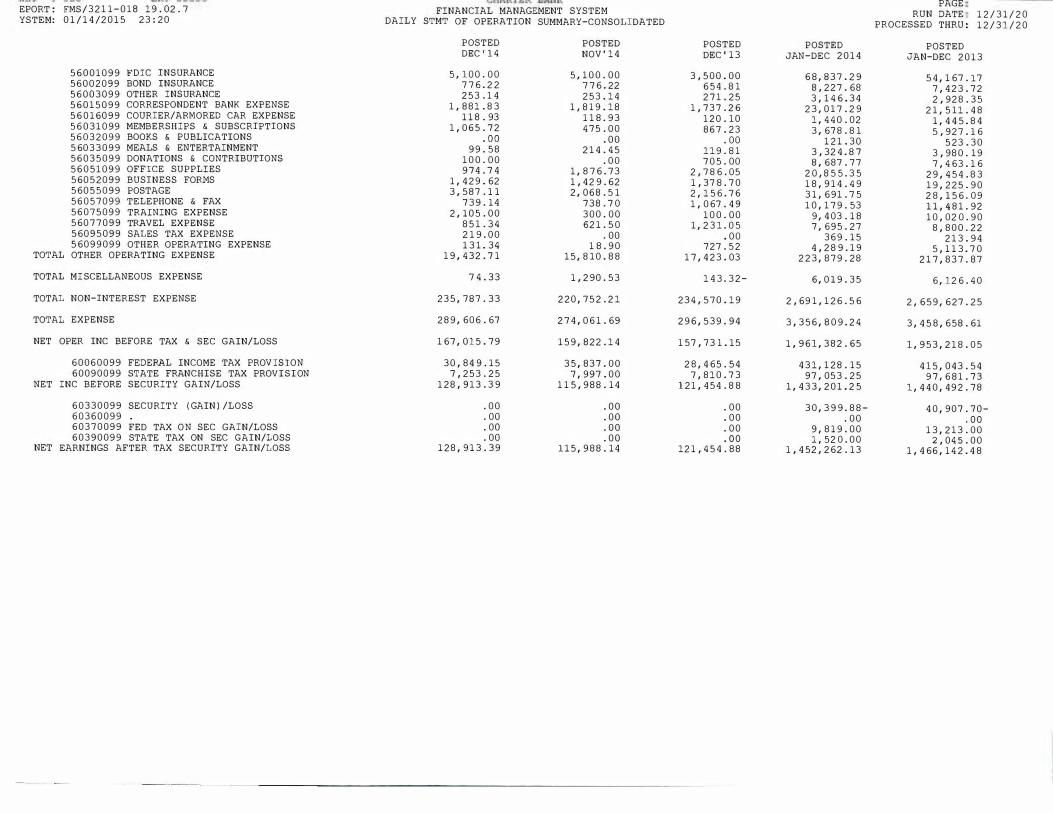
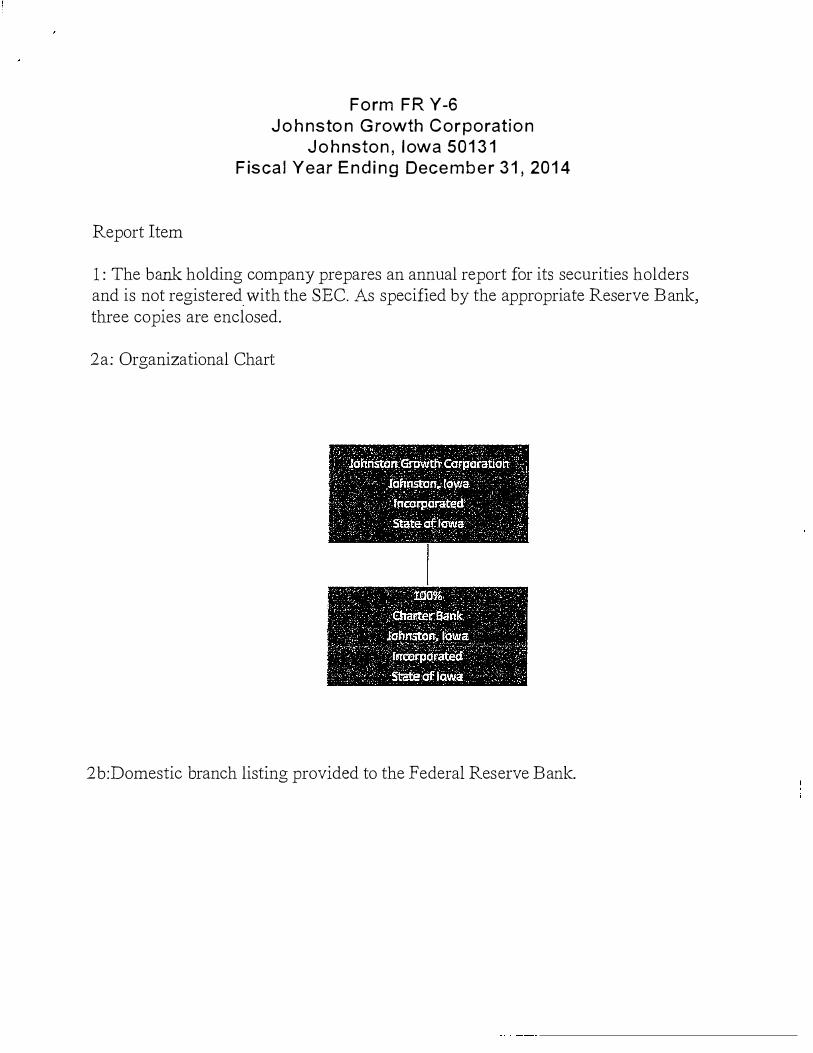
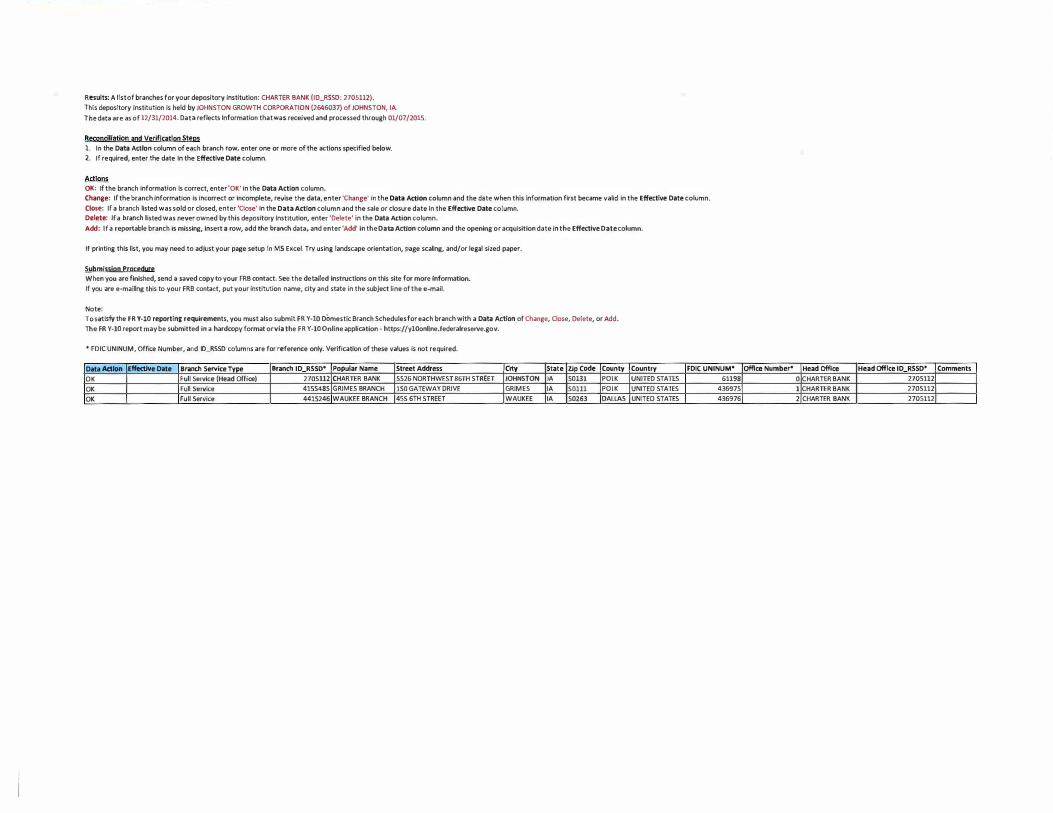
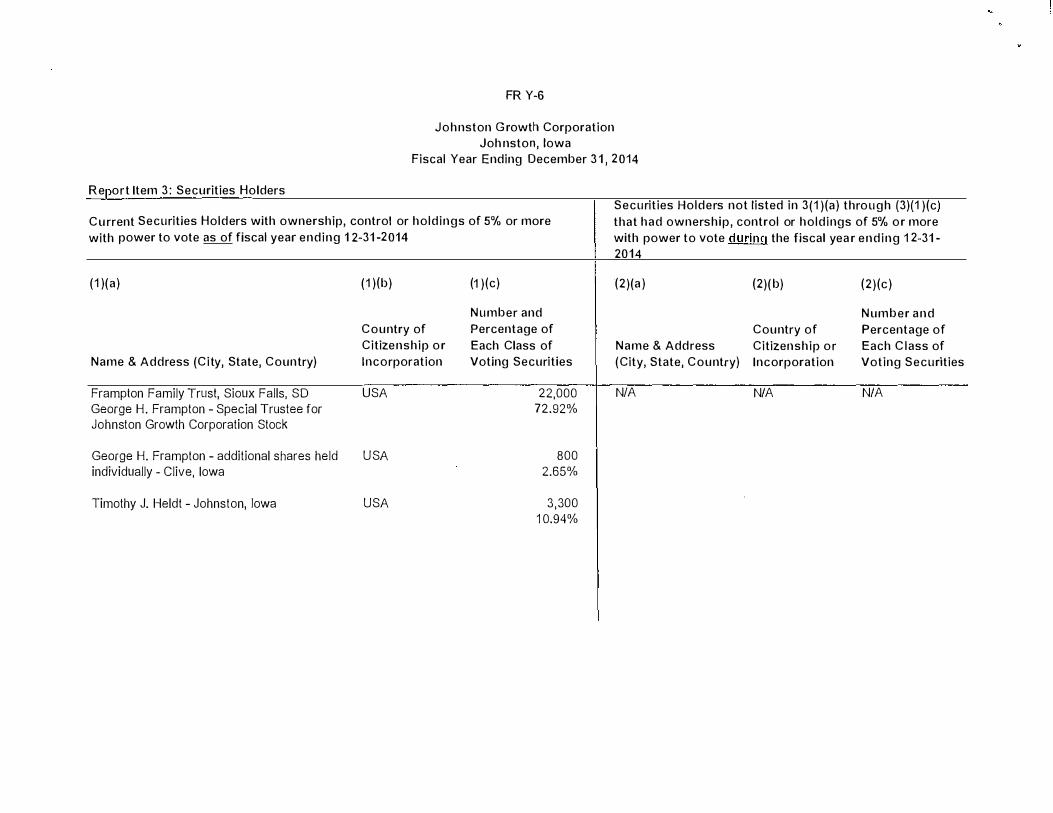
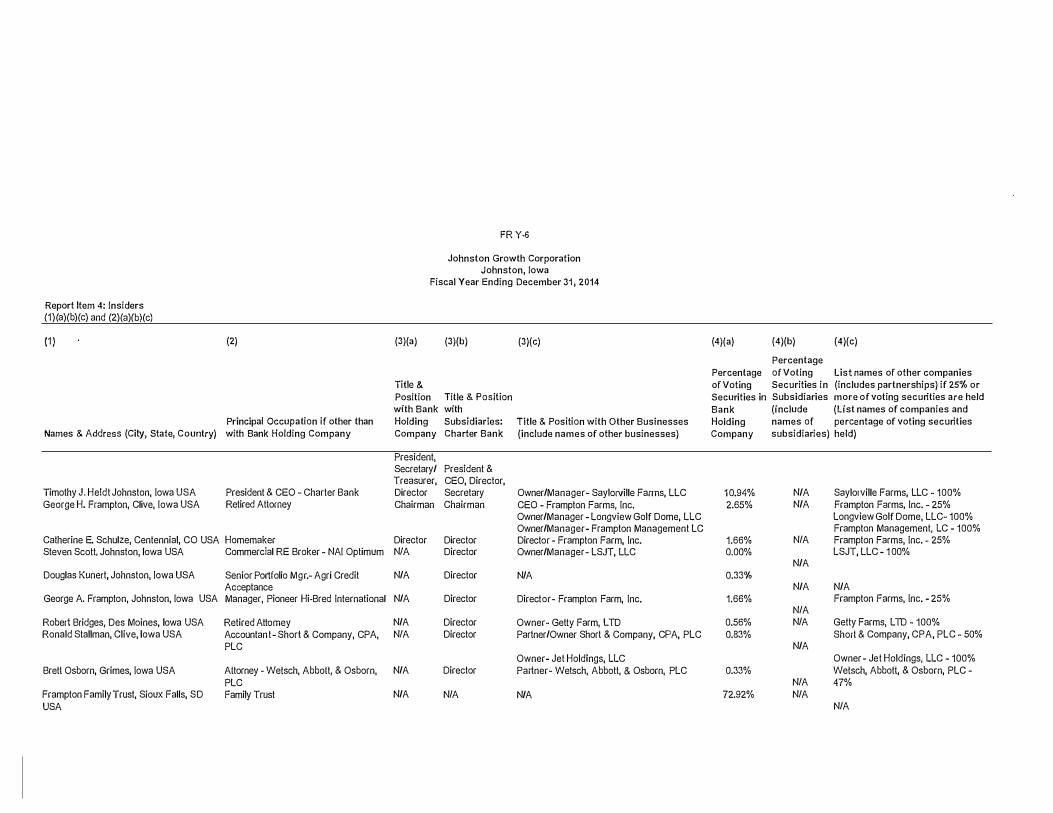