Embed Size (px)
Citation preview
1/16
The 5th Biennale Conference on Marine Technology, MARTEC 2006: Intensifying Technology Study for Empowering Maritime Industries Towards the Prosperity of Archipelagic Countries,
Makassar, Indonesia, September 2006
OPERABILITY ANALYSIS OF AN FPSO ON THE BASIS OF ITS
SLAMMING AND GREEN WATER PERFORMANCES
By
Eko B. Djatmiko1), Murdjito2) and Ika Prasetyawan3) 1) Department of Ocean Engineering – ITS, Gedung WA Kampus ITS – Sukolilo,
Surabaya 60111 – INDONESIA; e-mail; [email protected]
2) Department of Ocean Engineering – ITS, Surabaya - INDONESIA
3) Indonesian Hydrodynamic Laboratory, Surabaya - INDONESIA
Abstract
This paper discusses a study carried out to investigate the operability level of an FPSO on the basis of
its slamming and green water performances. Slamming and green water in the first hand were
analyzed by considering the relative bow motion of the vessel in regular waves by employing a
dedicated ship motion numerical model. A stochastic solver was then applied to process the relative
bow motion data to derive the probability of slamming and green water occurrences with the aids of
the spectral analysis to account for random waves. The stochastic solver correlates the random
relative bow motion to the local draught at the point of interest and simultaneously a typical threshold
velocity to identify the slamming characteristics. Whereas the green water characteristics are
identified by relating the random relative bow motion to the local freeboard at the point of interest.
Operation onboard of the FPSO should be cancelled whenever slamming and green water take place,
in other words the FPSO experiences a loss in production. The aforementioned methodology has been
applied on a case study of an FPSO operated in the Gulf of Mexico at four distinct environmental
conditions, namely good weather, gust, cold fronts and tropical depressions. When the initial design of
the FPSO is considered the vessel would be expected to suffer as much as three (3) days of loss in
production. Nonetheless, the loss in production could be brought down to only two (2) days if a slight
modification is implemented to the initial design. With respect to the structural design, the study also
yields the slamming and green water pressure load data, that is in the order of 85 kN/m2 and 15.81 ,
respectively. Both values are satisfactory in the facet of class (DNV) criteria.
Keywords: FPSO, slamming, green water, operability
INTRODUCTION
Floating Production Storage and Offloading (FPSO) may be acknowledged as the most
attractive concept of offshore platform to be operated in oil and gas industry. Since its first
operation in 1986 to support the oil and gas production in Natuna Sea, Indonesia, the growth
of FPSO worldwide is notable, and currently it is recorded around 100 FPSOs are in operation
[1]. By the end of 2005 it is revealed some 12 FPSOs are being built or converted, 3 under-
going modification and repair, 4 FPSO hulls available to be completed with topside facilities,
and 27 being bidded, to be bidded and has come to the final design stage. The existing FPSOs
FPSO Slamming & Green Water 2/16
have the production capacity ranging from as low as 10 up to as much as 250 MBPOD, with
the storage capacity ranging from 53 up to 2,200 MBBLs. Kizomba A and Kizomba B are
two FPSOs currently hold the record as the world largest platform, operated by ExxonMobil
at offshore of Angola, having 250 MBPOD production capacity and 2,200 MBBLs storage
capacity, sized some 285 m x 63 m x 32 m (L x B x D). All these aforementioned figures has
put FPSO into the most dominant type of offshore oil and gas platform in comparison to the
others, both in term of the size and population.
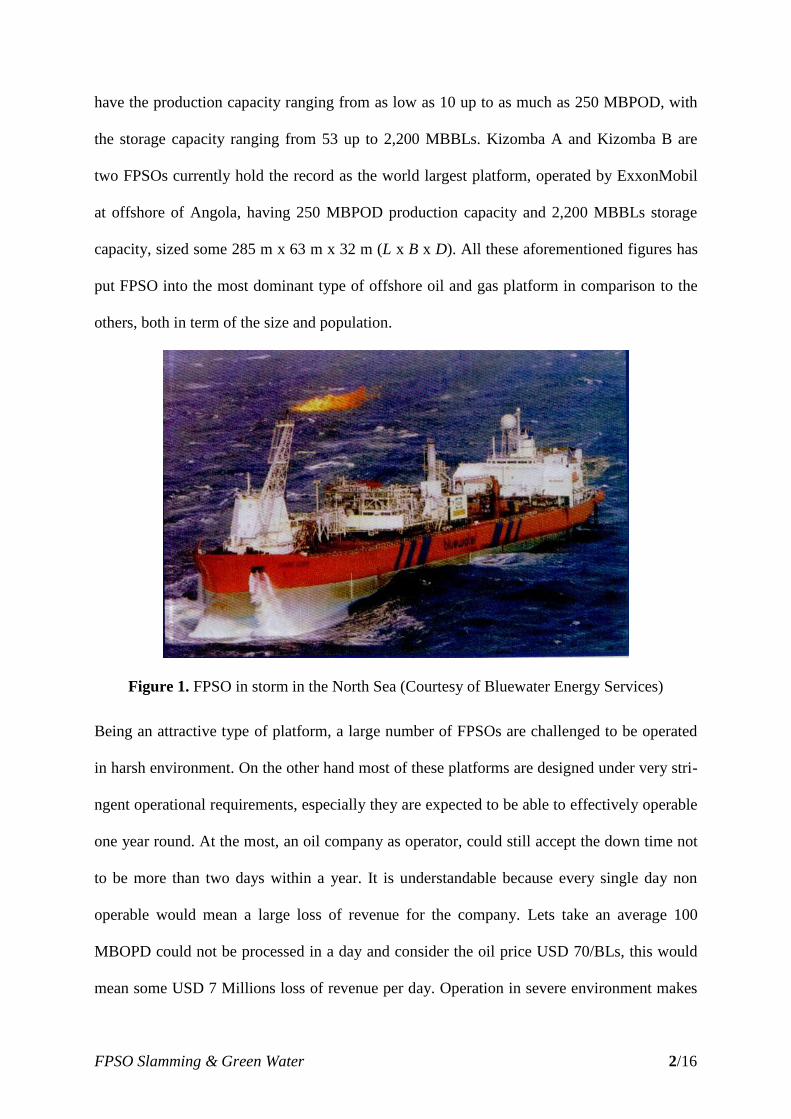
Figure 1. FPSO in storm in the North Sea (Courtesy of Bluewater Energy Services)
Being an attractive type of platform, a large number of FPSOs are challenged to be operated
in harsh environment. On the other hand most of these platforms are designed under very stri-
ngent operational requirements, especially they are expected to be able to effectively operable
one year round. At the most, an oil company as operator, could still accept the down time not
to be more than two days within a year. It is understandable because every single day non
operable would mean a large loss of revenue for the company. Lets take an average 100
MBOPD could not be processed in a day and consider the oil price USD 70/BLs, this would
mean some USD 7 Millions loss of revenue per day. Operation in severe environment makes
FPSO Slamming & Green Water 3/16
an FPSO vulnerable to experience the down time, in particular due to the occurrence of green
water and to a certain extent due to slamming when the motion persists [2,3].
An engineering analysis of an FPSO for operation in the Gulf of Mexico has been performed
by researchers at the Laboratory of Operational Research and Design (LORD), Department of
Ocean Engineering (DOE), Sepuluh Nopember Institute of Technology (ITS), in Surabaya.
Currently this engineering analysis is nearing its completion stage. In this particular stage an
evaluation on the structural integrity of the vessel due to various probable load effects ought
to be thoroughly performed. Among those are the load effects due to slamming and green
water phenomena. From previous experiences, operation in the Gulf of Mexico on a number
of offshore floating structures of similar size and configuration has shown the damaging
effects of slamming and green-water occurrences. This has further brought a consequence on
the cancellation of functional operation schedule which led to the loss in production. On this
basis a thorough investigation has been carried out as reported herein.
The purpose of such an investigation is to carry out a preliminary analysis aimed at predicting
the probability of loss in production which may take place due to extreme load effects related
to the persistence of slamming and green water occurrences. In conjunction to this an analysis
will be performed as an attempt in deriving the structural loads due to slamming and green
water, which could be further referred to enhancing the structural design and the safety of the
system.
DESIGN AND ANALYSIS SPECIFICATIONS
The slamming, green water and consequence analyses are performed in accordance with the
codes, selected design criteria and general design practice. The selected environments are
particularly severe combinations of wind and waves derived from good weather wind
condition, gust, cold front and tropical depression. The environmental data and the probability
FPSO Slamming & Green Water 4/16
of occurrence were recommended by Zebec Marine Consultants and Services. The
information and data pertinent to the evaluation undertaken for the FPSO Barge are
highlighted in the following sub-sections along with additional design parameters utilized in
the analysis.
Vessel Details
The FPSO under the current investigation is of monohull ship type characterized by the
principal dimensions as given in Table 1.
Table 1. Principal dimension of the FPSO
Length Overall (LOA) 117.00 m
Length between perpendicular (LPP) 109.00 m
Breadth at midship (Bmid) 20.00 m
Depth at midship (Dmid) 11.70 m
Draft Design (Tdes) 8.05 m
Draft Scantling (Tsct) 8.40 m
Environmental Condition
The location by where the FPSO should be operated is exposed to environmental conditions,
with varying direction of wind, wave and current. The environmental condition adopted in
this analysis is based on the data at Gulf of Mexico made available by Zebec..
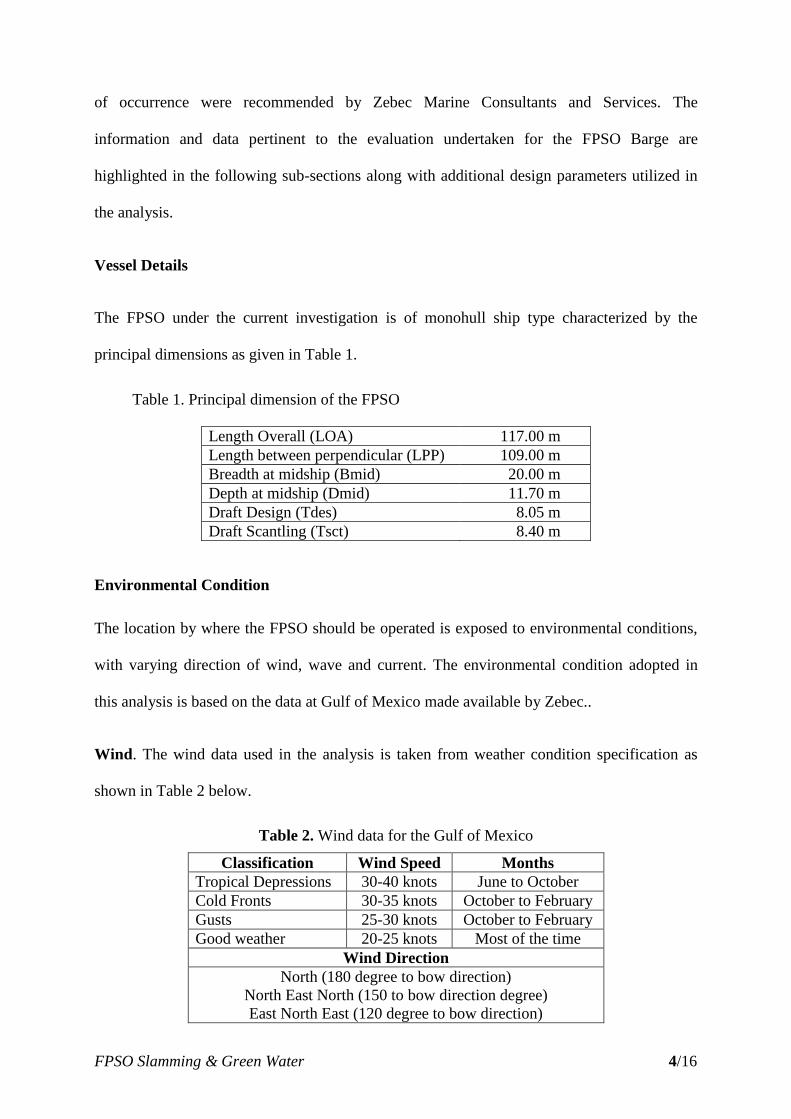
Wind. The wind data used in the analysis is taken from weather condition specification as
shown in Table 2 below.
Table 2. Wind data for the Gulf of Mexico
Classification Wind Speed Months
Tropical Depressions 30-40 knots June to October
Cold Fronts 30-35 knots October to February
Gusts 25-30 knots October to February
Good weather 20-25 knots Most of the time
Wind Direction
North (180 degree to bow direction)
North East North (150 to bow direction degree)
East North East (120 degree to bow direction)
FPSO Slamming & Green Water 5/16
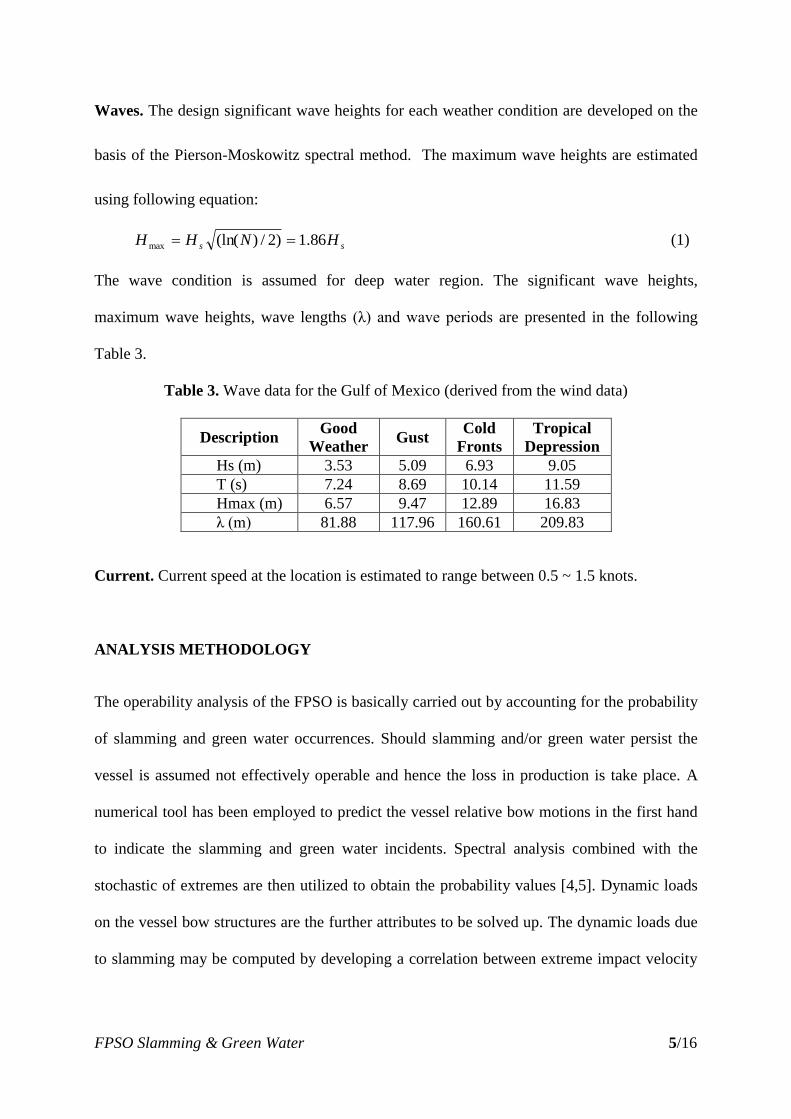
Waves. The design significant wave heights for each weather condition are developed on the
basis of the Pierson-Moskowitz spectral method. The maximum wave heights are estimated
using following equation:
ss HNHH 86.1)2/)(ln(max (1)
The wave condition is assumed for deep water region. The significant wave heights,
maximum wave heights, wave lengths (λ) and wave periods are presented in the following
Table 3.
Table 3. Wave data for the Gulf of Mexico (derived from the wind data)
Description Good
Weather Gust
Cold
Fronts
Tropical
Depression
Hs (m) 3.53 5.09 6.93 9.05
T (s) 7.24 8.69 10.14 11.59
Hmax (m) 6.57 9.47 12.89 16.83
λ (m) 81.88 117.96 160.61 209.83
Current. Current speed at the location is estimated to range between 0.5 ~ 1.5 knots.
ANALYSIS METHODOLOGY
The operability analysis of the FPSO is basically carried out by accounting for the probability
of slamming and green water occurrences. Should slamming and/or green water persist the
vessel is assumed not effectively operable and hence the loss in production is take place. A
numerical tool has been employed to predict the vessel relative bow motions in the first hand
to indicate the slamming and green water incidents. Spectral analysis combined with the
stochastic of extremes are then utilized to obtain the probability values [4,5]. Dynamic loads
on the vessel bow structures are the further attributes to be solved up. The dynamic loads due
to slamming may be computed by developing a correlation between extreme impact velocity
FPSO Slamming & Green Water 6/16
and an appropriate slamming coefficient [6-8], whilst a quasi-static approach accounting for a
proportion of wave profile on deck is used to yield the green water load effects [9-11].
Slamming Prediction
The basic prediction and further analysis related to the probability and dynamic loads of
slamming on FPSO hulls can be described in the following manner.
The probability of slamming occurrence is computed by considering the joint
probability of bow emergence and the threshold velocity exceedance, as follows:
v
Th
d
B
rE
V
E
TimpactslamP
22exp
22
(2)
where TB is vessel draft at the point of interest at the bow, VTh is the threshold velocity
[9], Ed is the variance of relative vertical motion and Ev is the variance of relative
velocity.
Ed and Ev are computed by employing a mathematical model for ship motion in
frequency-domain combined with the spectral analysis. The frequency-domain ship
motion model yields the transfer function (a graph which correlate between the response
amplitude operator RAO and the wave frequency variation) of relative motion and
velocity in regular waves. When these results are processed further using spectral
procedure eventually they give:
dSZ
Ew
R
d
0
2
(3)
dSV
Ew
R
v
0
2
(4)
FPSO Slamming & Green Water 7/16
ZR is the relative vertical motion, VR the relative vertical velocity, w regular wave
amplitude, S(ω) wave spectral density and ω is regular wave frequency. ZR /ζw and VR
/ζw are, respectively, the RAO of relative vertical motion and velocity. Therefore, Ed
and Ev are the area under the response spectral curve of relative motion and velocity,
respectively, which could be denoted by m0ZR and m0VR.
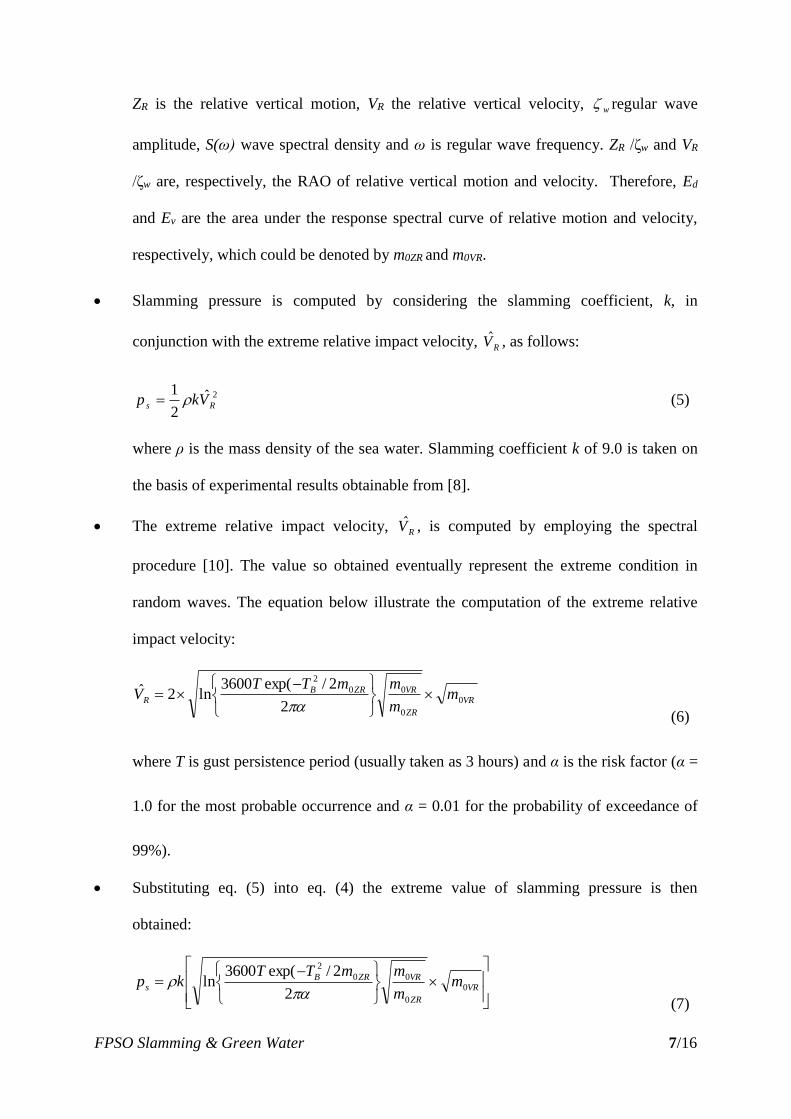
Slamming pressure is computed by considering the slamming coefficient, k, in
conjunction with the extreme relative impact velocity, RV̂ , as follows:
2ˆ
2
1Rs Vkp (5)
where ρ is the mass density of the sea water. Slamming coefficient k of 9.0 is taken on
the basis of experimental results obtainable from [8].
The extreme relative impact velocity, RV̂ , is computed by employing the spectral
procedure [10]. The value so obtained eventually represent the extreme condition in
random waves. The equation below illustrate the computation of the extreme relative
impact velocity:
VR
ZR
VRZRBR m
m
mmTTV 0
0
00
2
2
2/exp(3600ln2ˆ
(6)
where T is gust persistence period (usually taken as 3 hours) and α is the risk factor (α =
1.0 for the most probable occurrence and α = 0.01 for the probability of exceedance of
99%).
Substituting eq. (5) into eq. (4) the extreme value of slamming pressure is then
obtained:
VR
ZR
VRZRBs m
m
mmTTkp 0
0
00
2
2
2/exp(3600ln
(7)
FPSO Slamming & Green Water 8/16
Green Water Prediction
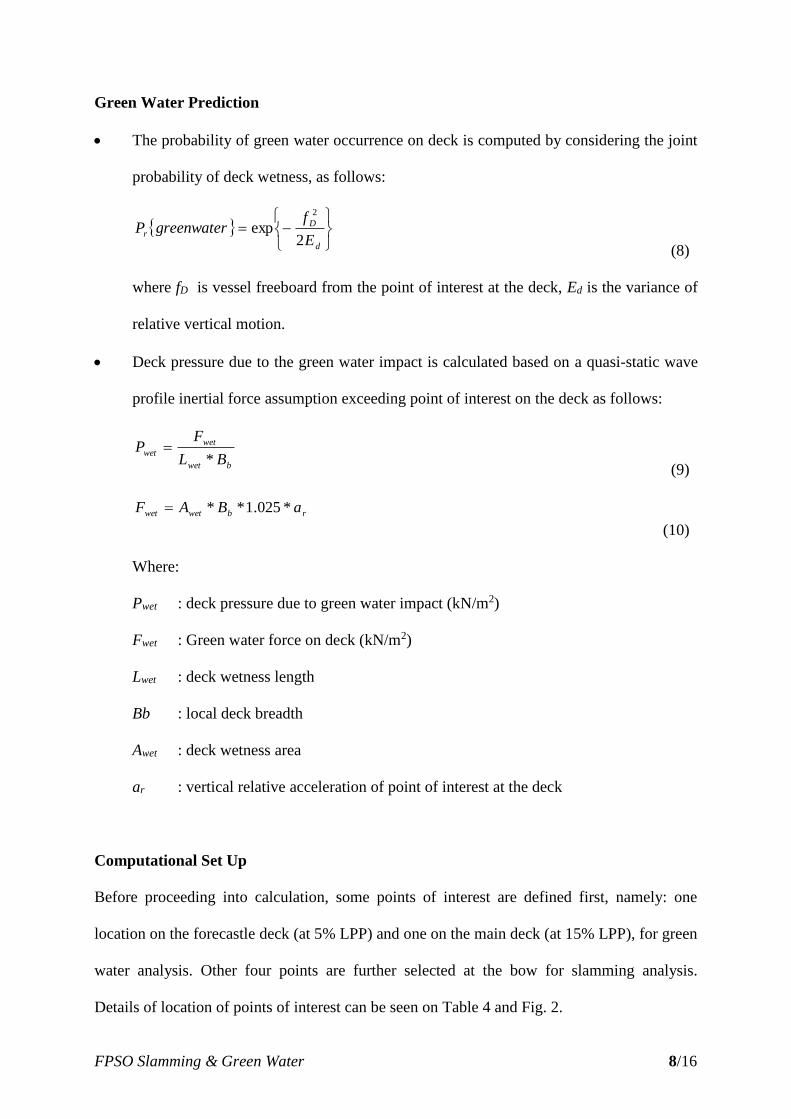
The probability of green water occurrence on deck is computed by considering the joint
probability of deck wetness, as follows:
d
D
rE
fgreenwaterP
2exp
2
(8)
where fD is vessel freeboard from the point of interest at the deck, Ed is the variance of
relative vertical motion.
Deck pressure due to the green water impact is calculated based on a quasi-static wave
profile inertial force assumption exceeding point of interest on the deck as follows:
bwet
wet
wetBL
FP
*
(9)
rbwetwet aBAF *025.1**
(10)
Where:
Pwet : deck pressure due to green water impact (kN/m2)
Fwet : Green water force on deck (kN/m2)
Lwet : deck wetness length
Bb : local deck breadth
Awet : deck wetness area
ar : vertical relative acceleration of point of interest at the deck
Computational Set Up
Before proceeding into calculation, some points of interest are defined first, namely: one
location on the forecastle deck (at 5% LPP) and one on the main deck (at 15% LPP), for green
water analysis. Other four points are further selected at the bow for slamming analysis.
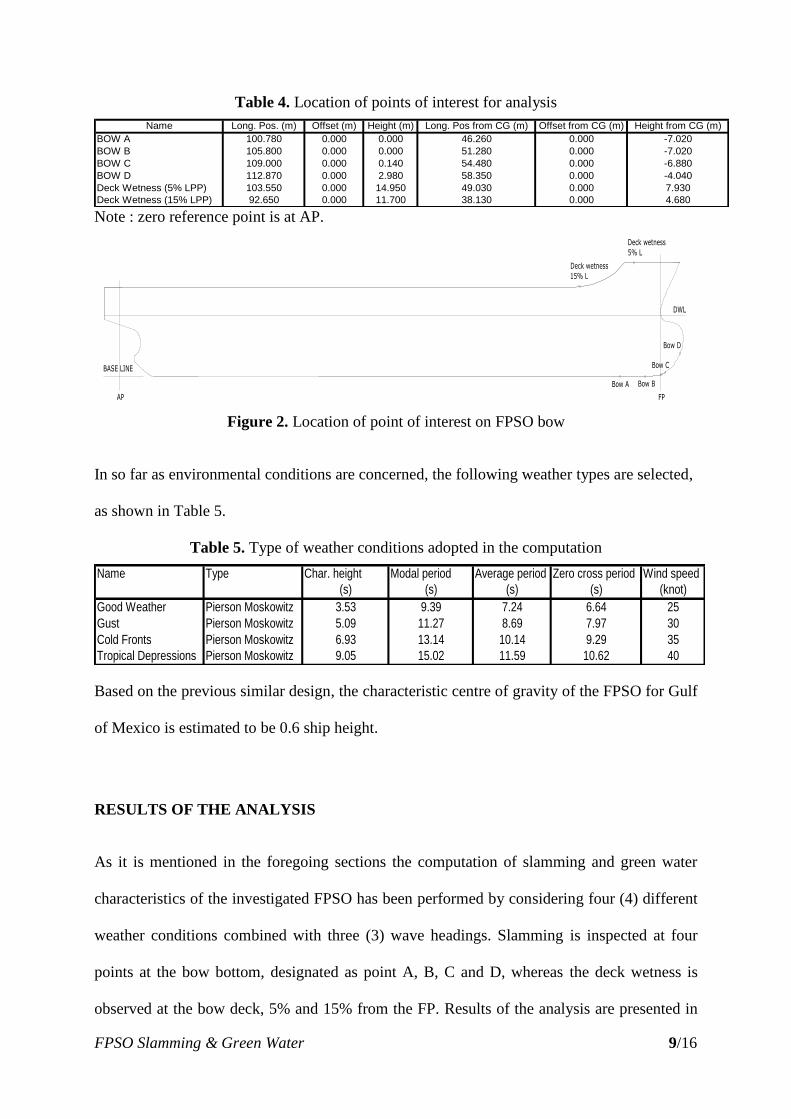
Details of location of points of interest can be seen on Table 4 and Fig. 2.
FPSO Slamming & Green Water 9/16
Table 4. Location of points of interest for analysis
Name Long. Pos. (m) Offset (m) Height (m) Long. Pos from CG (m) Offset from CG (m) Height from CG (m)
BOW A 100.780 0.000 0.000 46.260 0.000 -7.020
BOW B 105.800 0.000 0.000 51.280 0.000 -7.020
BOW C 109.000 0.000 0.140 54.480 0.000 -6.880
BOW D 112.870 0.000 2.980 58.350 0.000 -4.040
Deck Wetness (5% LPP) 103.550 0.000 14.950 49.030 0.000 7.930
Deck Wetness (15% LPP) 92.650 0.000 11.700 38.130 0.000 4.680 Note : zero reference point is at AP.
Bow A Bow B
Bow C
Bow D
Deck wetness
15% L
Deck wetness
5% L
DWL
FPAP
BASE LINE
Figure 2. Location of point of interest on FPSO bow
In so far as environmental conditions are concerned, the following weather types are selected,
as shown in Table 5.
Table 5. Type of weather conditions adopted in the computation
Name Type Char. height Modal period Average period Zero cross period Wind speed
(s) (s) (s) (s) (knot)
Good Weather Pierson Moskowitz 3.53 9.39 7.24 6.64 25
Gust Pierson Moskowitz 5.09 11.27 8.69 7.97 30
Cold Fronts Pierson Moskowitz 6.93 13.14 10.14 9.29 35
Tropical Depressions Pierson Moskowitz 9.05 15.02 11.59 10.62 40
Based on the previous similar design, the characteristic centre of gravity of the FPSO for Gulf
of Mexico is estimated to be 0.6 ship height.
RESULTS OF THE ANALYSIS
As it is mentioned in the foregoing sections the computation of slamming and green water
characteristics of the investigated FPSO has been performed by considering four (4) different
weather conditions combined with three (3) wave headings. Slamming is inspected at four
points at the bow bottom, designated as point A, B, C and D, whereas the deck wetness is
observed at the bow deck, 5% and 15% from the FP. Results of the analysis are presented in
FPSO Slamming & Green Water 10/16
the form of tables and graph as appropriate. Only results of largest intensities are given herein,
as these would govern the design strength of the bow structures.
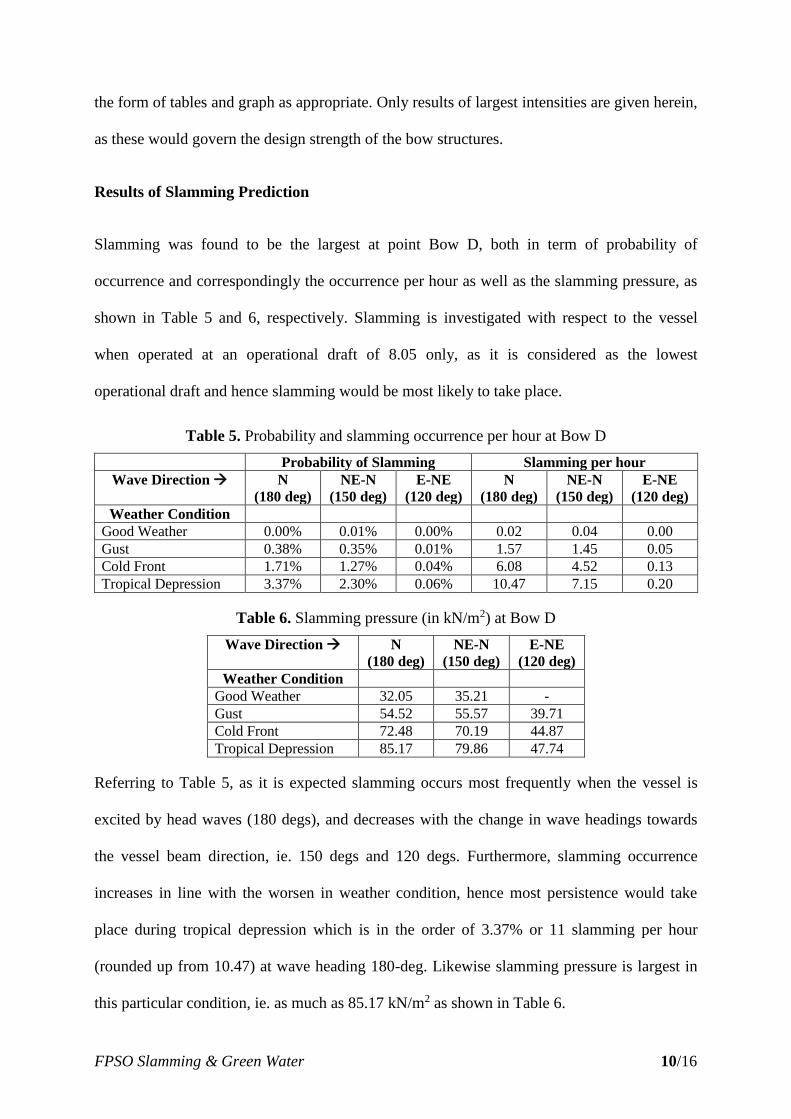
Results of Slamming Prediction
Slamming was found to be the largest at point Bow D, both in term of probability of
occurrence and correspondingly the occurrence per hour as well as the slamming pressure, as
shown in Table 5 and 6, respectively. Slamming is investigated with respect to the vessel
when operated at an operational draft of 8.05 only, as it is considered as the lowest
operational draft and hence slamming would be most likely to take place.
Table 5. Probability and slamming occurrence per hour at Bow D
Probability of Slamming Slamming per hour
Wave Direction N
(180 deg)
NE-N
(150 deg)
E-NE
(120 deg)
N
(180 deg)
NE-N
(150 deg)
E-NE
(120 deg)
Weather Condition
Good Weather 0.00% 0.01% 0.00% 0.02 0.04 0.00
Gust 0.38% 0.35% 0.01% 1.57 1.45 0.05
Cold Front 1.71% 1.27% 0.04% 6.08 4.52 0.13
Tropical Depression 3.37% 2.30% 0.06% 10.47 7.15 0.20
Table 6. Slamming pressure (in kN/m2) at Bow D
Wave Direction N
(180 deg)
NE-N
(150 deg)
E-NE
(120 deg)
Weather Condition
Good Weather 32.05 35.21 -
Gust 54.52 55.57 39.71
Cold Front 72.48 70.19 44.87
Tropical Depression 85.17 79.86 47.74
Referring to Table 5, as it is expected slamming occurs most frequently when the vessel is
excited by head waves (180 degs), and decreases with the change in wave headings towards
the vessel beam direction, ie. 150 degs and 120 degs. Furthermore, slamming occurrence
increases in line with the worsen in weather condition, hence most persistence would take
place during tropical depression which is in the order of 3.37% or 11 slamming per hour
(rounded up from 10.47) at wave heading 180-deg. Likewise slamming pressure is largest in
this particular condition, ie. as much as 85.17 kN/m2 as shown in Table 6.
FPSO Slamming & Green Water 11/16
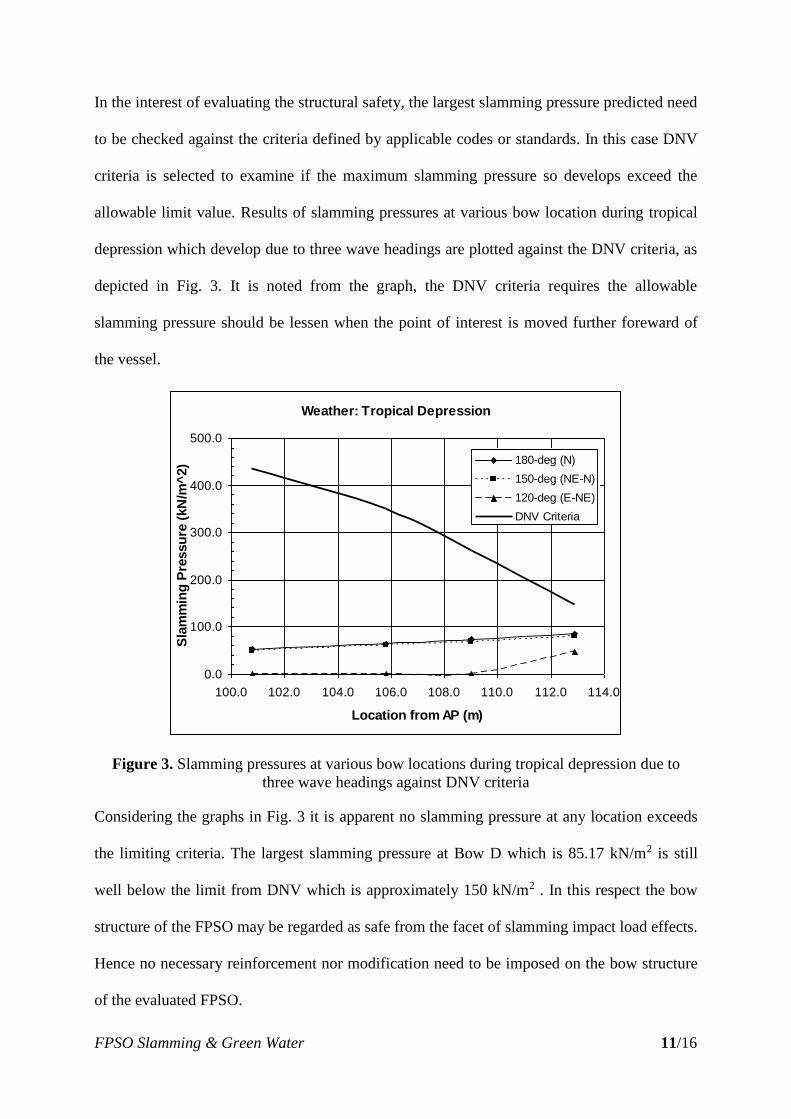
In the interest of evaluating the structural safety, the largest slamming pressure predicted need
to be checked against the criteria defined by applicable codes or standards. In this case DNV
criteria is selected to examine if the maximum slamming pressure so develops exceed the
allowable limit value. Results of slamming pressures at various bow location during tropical
depression which develop due to three wave headings are plotted against the DNV criteria, as
depicted in Fig. 3. It is noted from the graph, the DNV criteria requires the allowable
slamming pressure should be lessen when the point of interest is moved further foreward of
the vessel.
Weather: Tropical Depression
0.0
100.0
200.0
300.0
400.0
500.0
100.0 102.0 104.0 106.0 108.0 110.0 112.0 114.0
Location from AP (m)
Sla
mm
ing
Pre
ssu
re (
kN
/m^
2) 180-deg (N)
150-deg (NE-N)
120-deg (E-NE)
DNV Criteria
Figure 3. Slamming pressures at various bow locations during tropical depression due to
three wave headings against DNV criteria
Considering the graphs in Fig. 3 it is apparent no slamming pressure at any location exceeds
the limiting criteria. The largest slamming pressure at Bow D which is 85.17 kN/m2 is still
well below the limit from DNV which is approximately 150 kN/m2 . In this respect the bow
structure of the FPSO may be regarded as safe from the facet of slamming impact load effects.
Hence no necessary reinforcement nor modification need to be imposed on the bow structure
of the evaluated FPSO.
FPSO Slamming & Green Water 12/16
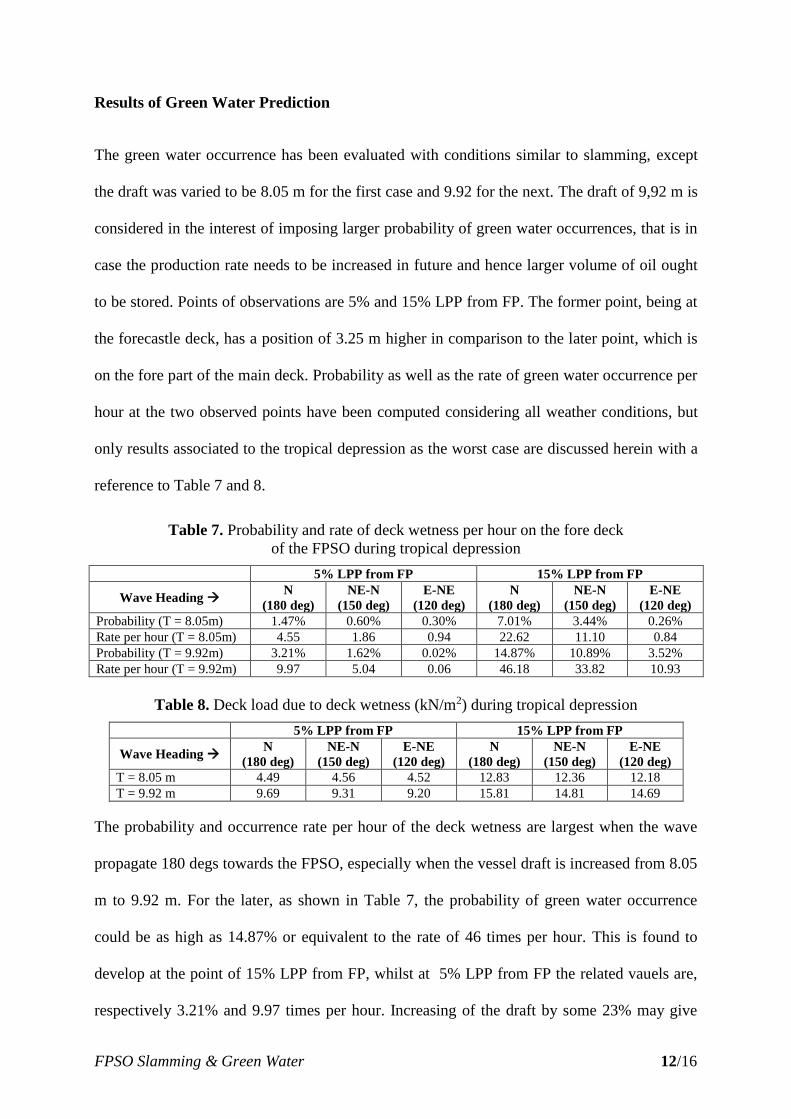
Results of Green Water Prediction
The green water occurrence has been evaluated with conditions similar to slamming, except
the draft was varied to be 8.05 m for the first case and 9.92 for the next. The draft of 9,92 m is
considered in the interest of imposing larger probability of green water occurrences, that is in
case the production rate needs to be increased in future and hence larger volume of oil ought
to be stored. Points of observations are 5% and 15% LPP from FP. The former point, being at
the forecastle deck, has a position of 3.25 m higher in comparison to the later point, which is
on the fore part of the main deck. Probability as well as the rate of green water occurrence per
hour at the two observed points have been computed considering all weather conditions, but
only results associated to the tropical depression as the worst case are discussed herein with a
reference to Table 7 and 8.
Table 7. Probability and rate of deck wetness per hour on the fore deck
of the FPSO during tropical depression
5% LPP from FP 15% LPP from FP
Wave Heading N
(180 deg)
NE-N
(150 deg)
E-NE
(120 deg)
N
(180 deg)
NE-N
(150 deg)
E-NE
(120 deg)
Probability (T = 8.05m) 1.47% 0.60% 0.30% 7.01% 3.44% 0.26%
Rate per hour (T = 8.05m) 4.55 1.86 0.94 22.62 11.10 0.84
Probability (T = 9.92m) 3.21% 1.62% 0.02% 14.87% 10.89% 3.52%
Rate per hour (T = 9.92m) 9.97 5.04 0.06 46.18 33.82 10.93
Table 8. Deck load due to deck wetness (kN/m2) during tropical depression
5% LPP from FP 15% LPP from FP
Wave Heading N
(180 deg)
NE-N
(150 deg)
E-NE
(120 deg)
N
(180 deg)
NE-N
(150 deg)
E-NE
(120 deg)
T = 8.05 m 4.49 4.56 4.52 12.83 12.36 12.18
T = 9.92 m 9.69 9.31 9.20 15.81 14.81 14.69
The probability and occurrence rate per hour of the deck wetness are largest when the wave
propagate 180 degs towards the FPSO, especially when the vessel draft is increased from 8.05
m to 9.92 m. For the later, as shown in Table 7, the probability of green water occurrence
could be as high as 14.87% or equivalent to the rate of 46 times per hour. This is found to
develop at the point of 15% LPP from FP, whilst at 5% LPP from FP the related vauels are,
respectively 3.21% and 9.97 times per hour. Increasing of the draft by some 23% may give
FPSO Slamming & Green Water 13/16
rise to the probability of green water occurrence by as much as 7.86%. Considering the deck
load in Table 8, for the case of 9.92 m draft at point 15% LPP from FP a value of 15.81
kN/m2 is found to be the largest of all. This deck load due to green water could still be
considered acceptable as it is in the order of lower than the DNV limit, which is 17.95 kN/m2.
Operability Characteristics
The operability of the FPSO or reversely defined as the consequence of loss in production is
evaluated on the basis of the occurrence of wave heights that exceed the limiting value where
incident, ie. slamming and/or green water, would take place. Results of analysis as presented
in the previous sub-section show the green water at 15% of LPP from FP represent the most
persistent incident which might be experienced by the FPSO. At that position of the fore deck
green water has a probability to occur in all four weather conditions, ie. good weather, gust,
cold front as well as in tropical depression, at average values of 0.71%, 3.77%, 7.17% and
9.67%, respectively. The corresponding wave heights to these weather conditions as shown in
Table 2 are 3.53m, 5.09m, 6.93m and 9.05m. The occurrence of wave heights required to
perform the consequence analysis should be obtained from a wave scatter diagram. In the
absence of wave scatter diagram specific for the operating area in the Gulf of Mexico,
reference has been made by adopting the one which is applicable for North Atlantic region as
shown in Table 9.
Table 9. Reference wave scatter diagram
Wave Height
Hs (m)
Probability of
Occurence (%)
Wave Height
Hs (m)
Probability of
Occurence (%)
0 – 1 25.4262 6 – 7 0.8380
1 – 2 41.2120 7 – 8 0.4187
2 – 3 19.4275 8 – 9 0.2409
3 – 4 7.9164 9 – 10 0.2203
4 – 5 3.4665 10 – 11 0.0039
5 – 6 0.8266 11+ 0.0034
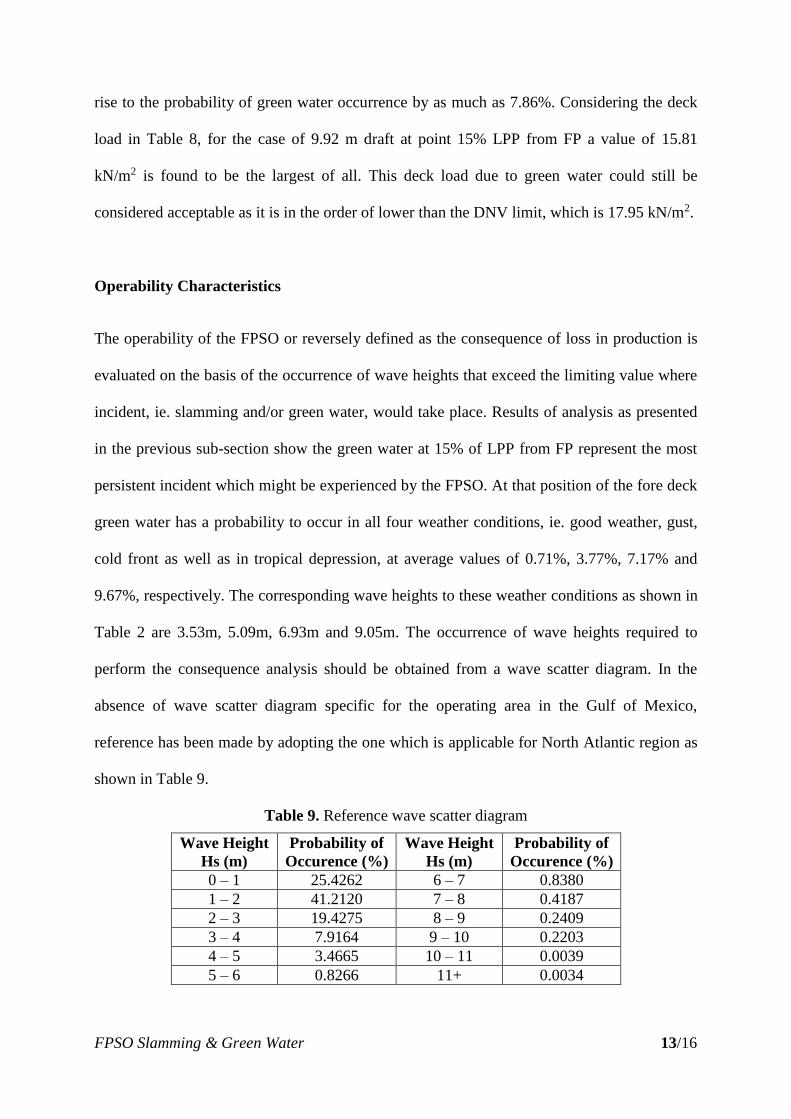
FPSO Slamming & Green Water 14/16
Referring to Table 9, the occurrence of wave heights that exceed 3.53m, 5.09m, 6.93m and
9.05m are, respectively, 13.9347%, 10.4682%, 1.6914%, and 0.4347%. When these values
are factored by the green water occurrence at the four weather conditions a total of 0.6554%
incident during a period of operation is yielded. This means in one year operation the FPSO
could be expected to experience a loss in production as much as 2.39 days (ie. 0.6554% x 365
days), or it can be rounded to be 3 days in total. In the interest of preventing the loss in
production not to be more than 2 days, the side build up of some 0.50m should be made on the
fore deck structure.
In case the draft is increased from 8.05m to 9.92m the overall total probability of green water
occurrence within a year of operation is 6.0964% or equivalent to 23 days (rounded from
22.15 days, ie. 6.0964% x 365 days) of loss in production. In this specific draft the loss in
production could be suppressed down to only 2 days if the side build up of 2.50m could be
preserved [12].
CONCLUSIONS
An evaluation has been performed to identify the severity of slamming and green water
effects which may occur during the operation of FPSO in the Gulf of Mexico. In conjunction
to this conclusions can be drawn with reference to the results of the corresponding
approximate analyses, as follows:
The largest slamming occurrence is expected to take place at fore part of the bulbous
bow (designated as bow D) during the tropical depression with a probability of some
5.73% for all wave direction. In this condition the bow area of FPSO could be exposed
to a maximum slamming pressure of 85 kN/m2. Such a value is quite large, but it still
is well below the limit as specified by Class Rule (DNV), which is 150 kN/m2. It
FPSO Slamming & Green Water 15/16
should be noted that the value from the class is derived for much lower vessel fore
draught (in the order of 4.5 m) in comparison to the actual value, ie. to represent heavy
weather ballast draught condition.
The most persistence of green water is expected to take place on the fore upper deck at
15% of LPP from FP during the tropical depression with a probability of occurrence as
much as 29.28% for all wave direction. In this condition the fore deck area of FPSO
could be exposed to a maximum green water pressure of 12.83 kN/m2 for draught of
8.05 m and 15.81 kN/m2 for draught of 9.92 m. These values are fairly lower than the
limit which is 17.95 kN/m2.
From the structural integrity point of view the maximum loads due to slamming or
green water to some extent may not be large enough too impose any severe damage at
the bow structure. This finding indicates that the side build up of the bow structure
may not be necessary at this stage. Nonetheless, a detailed evaluation by applying a
more sophisticated technique is recommended to come to a more firm conclusion with
regards to the slamming and green water effects.
On the basis of green water persistence, an operability analysis has been carried out
and resulting in an information of the possibility of loss in production as much as three
(3) days within a year operation. In the interest of preventing the loss in production not
to be more than two (2) days, the side build up of some 0.50 m should be made on the
fore deck structure.
In case the draft is increased from 8.05 m to 9.92 m the overall total probability of
green water occurrence within a year of operation is 6.0964% or equivalent to 23 days
of loss in production. In this particular draft the loss in production could be suppressed
down to only two (2) days if the side build up of at least 2.50 m could be preserved.
FPSO Slamming & Green Water 16/16
REFERENCES
[1] Nutter, T. and Albaugh, K., “2005 Survey of Floating Production, Storage and
Offloading (FPSO) Units”, Offshore Magazine, Vol. 65, No. 8, August 2005
[2] Buchner, B., “Floaters Challanged by Waves”, Offshore Magazine, Vol. 63, No. 6, June
2003
[3] Jensen, J.J. and Mansour, A.E., “Estimation of Impulsive Wave Induced Loads on a
FPSO”, Proceedings of ICOSSAR 2005, Safety and Reliability of Engineering System
and Structures, Rome, Italy, 2005
[4] Djatmiko, E.B. dan Murdijanto, “Seakeeping : Perilaku Bangunan Apung di Atas
Gelombang”, Materi Kursus Singkat Seakeeping & Hidromekanika, FT. Kelautan –
ITS, Surabaya, Juli 1993
[5] Ochi, M.K., “On Prediction of Exueme Value” .Journal of Ship Research, SNAME,
vol.17, No. 1, pp. 29-37, 1973
[6] Ochi, M.K., and Motter, L.E, “Prediction of Slamming Charateristics and Hull
Responses for Ship Design”, Trans. SNAME, vol. 81, pp. 144-176, 1973
[7] Hermundstad, O.E., Stansberg, C.T. and Hellan, Y., “Numerical and Experimental
Analysis of Extreme Slamming Loads on FPSO Bows”, Proceedings of 21st
International Conference on Offshore Mechanics and Arctic Engineering, Paper
OMAE2002-28565, Oslo, Norway, June 2002
[8] Djatmiko, E.B. “Simple Approaches in the Prediction of SWATH Ship Slamming at Early
Design Stage”, Proc. of 3rd Regional Conf. on Marine Technology, The System
Operational Success in the Marine Environment, MARTEC2002, Surabaya, July 2002
[9] Bhattacharyya, R., Dynamics of Marine Vehicles, John Wiley & Sons, New York, USA,
1980
[10] Llloyd, A.R.J.M., Seakeeping: Ship Behaviour in Rough Weather, Ellis Horwood Ltd.,
Chichester, UK, 1989
[11] Faltinsen, O.M., Greco, M. and Landrini, M., “Greenwater Loading on a FPSO”,
Journal of Offshore Mechanics and Arctic Engineering, Vol. 124, Issue 2, May 2002
[12] Chang, K-A. et al., “Mitigating Green Water Damage Through Design”, Project Final
Report, OTRC, 2005