Embed Size (px)
Citation preview
FPB – Business ethics survey
METHODOLOGY NOTE
ComRes interviewed 2,020 GB adults online between 28th and 29th January 2015. Data were weighted to be representative of all
adults in Great Britain aged 18+. ComRes is a member of the British Polling Council and abides by its rules.
All press releases or other publications must be checked with ComRes before use. ComRes requires 48 hours to check a press
release unless otherwise agreed.
To register for Pollwatch, a monthly newsletter update on the polls, please email: [email protected]
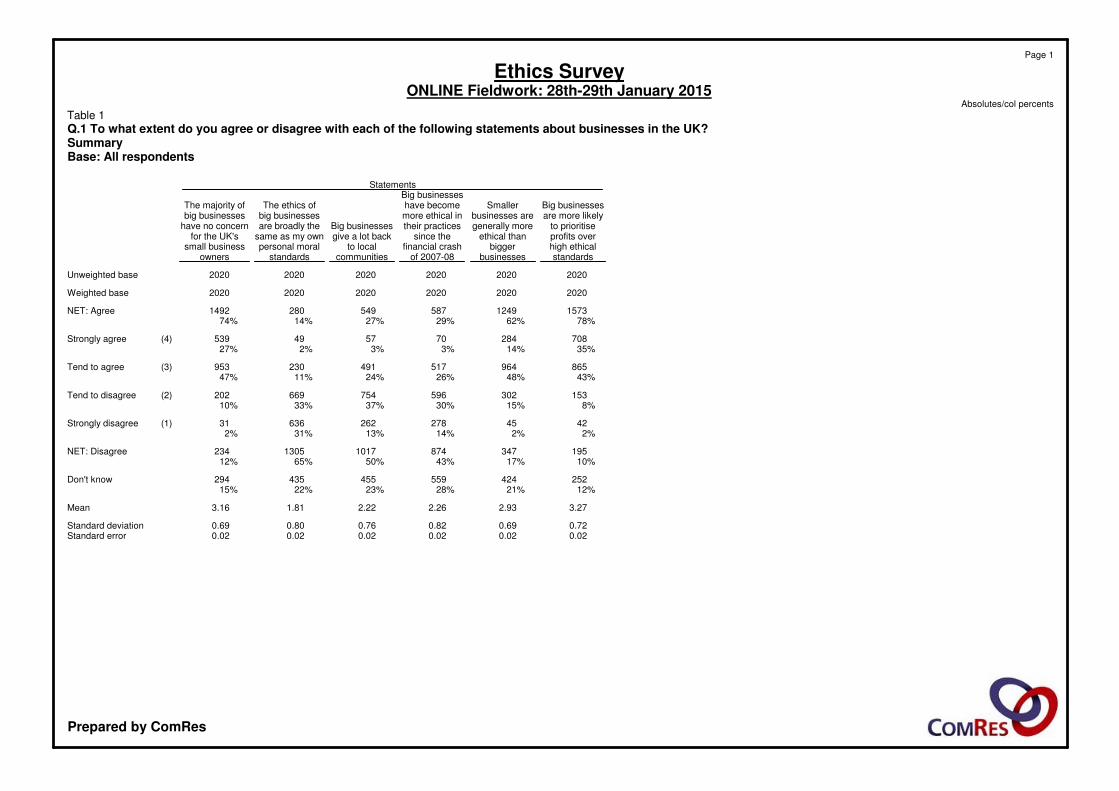
StatementsBig businesses
Big businessesSmallerhave becomeThe ethics ofThe majority ofare more likelybusinesses aremore ethical inbig businessesbig businesses
to prioritisegenerally moretheir practicesBig businessesare broadly thehave no concernprofits overethical thansince thegive a lot backsame as my ownfor the UK'shigh ethicalbiggerfinancial crashto localpersonal moralsmall businessstandardsbusinessesof 2007-08communitiesstandardsowners
202020202020202020202020Unweighted base
202020202020202020202020Weighted base
157312495875492801492NET: Agree78%62%29%27%14%74%
708284705749539Strongly agree (4)35%14%3%3%2%27%
865964517491230953Tend to agree (3)43%48%26%24%11%47%
153302596754669202Tend to disagree (2)8%15%30%37%33%10%
424527826263631Strongly disagree (1)2%2%14%13%31%2%
19534787410171305234NET: Disagree10%17%43%50%65%12%
252424559455435294Don't know12%21%28%23%22%15%
3.272.932.262.221.813.16Mean
0.720.690.820.760.800.69Standard deviation0.020.020.020.020.020.02Standard error
Page 1
Ethics SurveyONLINE Fieldwork: 28th-29th January 2015
Absolutes/col percents
Table 1
Q.1 To what extent do you agree or disagree with each of the following statements about businesses in the UK?SummaryBase: All respondents
Prepared by ComRes
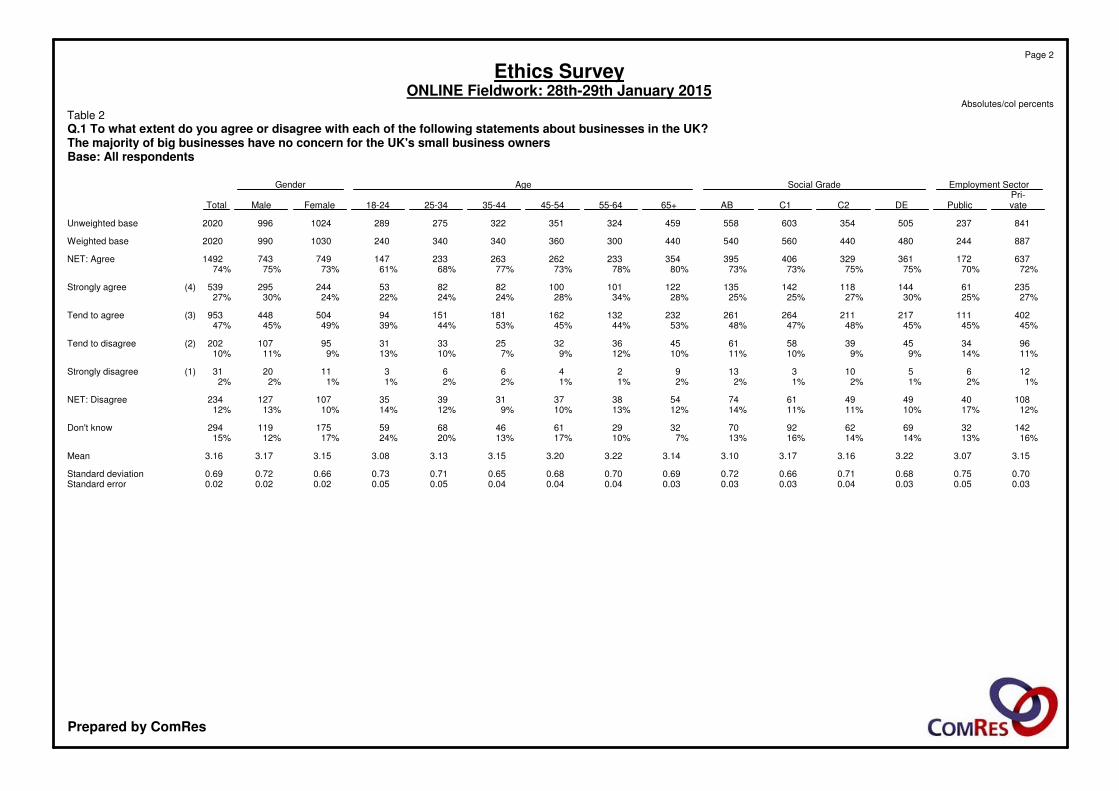
Employment SectorSocial GradeAgeGenderPri-vatePublicDEC2C1AB65+55-6445-5435-4425-3418-24FemaleMaleTotal
84123750535460355845932435132227528910249962020Unweighted base
88724448044056054044030036034034024010309902020Weighted base
6371723613294063953542332622632331477497431492NET: Agree72%70%75%75%73%73%80%78%73%77%68%61%73%75%74%
23561144118142135122101100828253244295539Strongly agree (4)27%25%30%27%25%25%28%34%28%24%24%22%24%30%27%
40211121721126426123213216218115194504448953Tend to agree (3)45%45%45%48%47%48%53%44%45%53%44%39%49%45%47%
96344539586145363225333195107202Tend to disagree (2)11%14%9%9%10%11%10%12%9%7%10%13%9%11%10%
126510313924663112031Strongly disagree (1)1%2%1%2%1%2%2%1%1%2%2%1%1%2%2%
1084049496174543837313935107127234NET: Disagree12%17%10%11%11%14%12%13%10%9%12%14%10%13%12%
1423269629270322961466859175119294Don't know16%13%14%14%16%13%7%10%17%13%20%24%17%12%15%
3.153.073.223.163.173.103.143.223.203.153.133.083.153.173.16Mean
0.700.750.680.710.660.720.690.700.680.650.710.730.660.720.69Standard deviation0.030.050.030.040.030.030.030.040.040.040.050.050.020.020.02Standard error
Page 2
Ethics SurveyONLINE Fieldwork: 28th-29th January 2015
Absolutes/col percents
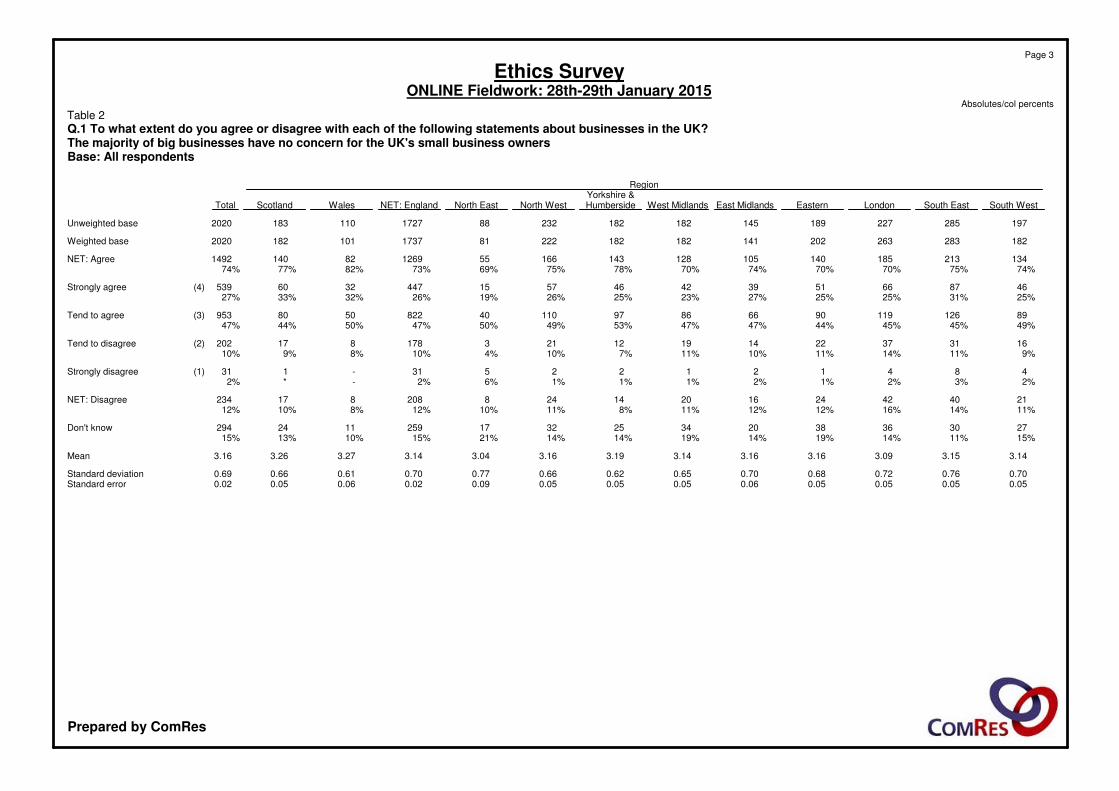
Table 2
Q.1 To what extent do you agree or disagree with each of the following statements about businesses in the UK?The majority of big businesses have no concern for the UK's small business ownersBase: All respondents
Prepared by ComRes
RegionYorkshire &
South WestSouth EastLondonEasternEast MidlandsWest MidlandsHumbersideNorth WestNorth EastNET: EnglandWalesScotlandTotal
1972852271891451821822328817271101832020Unweighted base
1822832632021411821822228117371011822020Weighted base
134213185140105128143166551269821401492NET: Agree74%75%70%70%74%70%78%75%69%73%82%77%74%
4687665139424657154473260539Strongly agree (4)25%31%25%25%27%23%25%26%19%26%32%33%27%
8912611990668697110408225080953Tend to agree (3)49%45%45%44%47%47%53%49%50%47%50%44%47%
16313722141912213178817202Tend to disagree (2)9%11%14%11%10%11%7%10%4%10%8%9%10%
48412122531-131Strongly disagree (1)2%3%2%1%2%1%1%1%6%2%-*2%
21404224162014248208817234NET: Disagree11%14%16%12%12%11%8%11%10%12%8%10%12%
2730363820342532172591124294Don't know15%11%14%19%14%19%14%14%21%15%10%13%15%
3.143.153.093.163.163.143.193.163.043.143.273.263.16Mean
0.700.760.720.680.700.650.620.660.770.700.610.660.69Standard deviation0.050.050.050.050.060.050.050.050.090.020.060.050.02Standard error
Page 3
Ethics SurveyONLINE Fieldwork: 28th-29th January 2015
Absolutes/col percents
Table 2
Q.1 To what extent do you agree or disagree with each of the following statements about businesses in the UK?The majority of big businesses have no concern for the UK's small business ownersBase: All respondents
Prepared by ComRes
Employment SectorSocial GradeAgeGenderPri-vatePublicDEC2C1AB65+55-6445-5435-4425-3418-24FemaleMaleTotal
84123750535460355845932435132227528910249962020Unweighted base
88724448044056054044030036034034024010309902020Weighted base
1444467587282402142578039119161280NET: Agree16%18%14%13%13%15%9%7%12%17%24%16%12%16%14%
22814161193-615168212949Strongly agree (4)2%3%3%4%2%2%1%-2%4%5%3%2%3%2%
122355343627337213542643099132230Tend to agree (3)14%14%11%10%11%14%8%7%10%12%19%13%10%13%11%
26581155141188185188106115979569347322669Tend to disagree (2)30%33%32%32%34%34%43%35%32%28%28%29%34%33%33%
275741461501611791411191151128960290346636Strongly disagree (1)31%30%30%34%29%33%32%40%32%33%26%25%28%35%31%
5401553012913493643292252292081841296366691305NET: Disagree61%63%63%66%62%67%75%75%64%61%54%54%62%68%65%
203461129013994705488747673275160435Don't know23%19%23%21%25%17%16%18%25%22%22%30%27%16%22%
1.841.891.821.781.821.801.741.601.751.852.031.921.801.811.81Mean
0.830.840.820.830.770.780.670.640.770.890.910.860.760.820.80Standard deviation0.030.060.040.050.040.040.030.040.050.060.060.060.030.030.02Standard error
Page 4
Ethics SurveyONLINE Fieldwork: 28th-29th January 2015
Absolutes/col percents
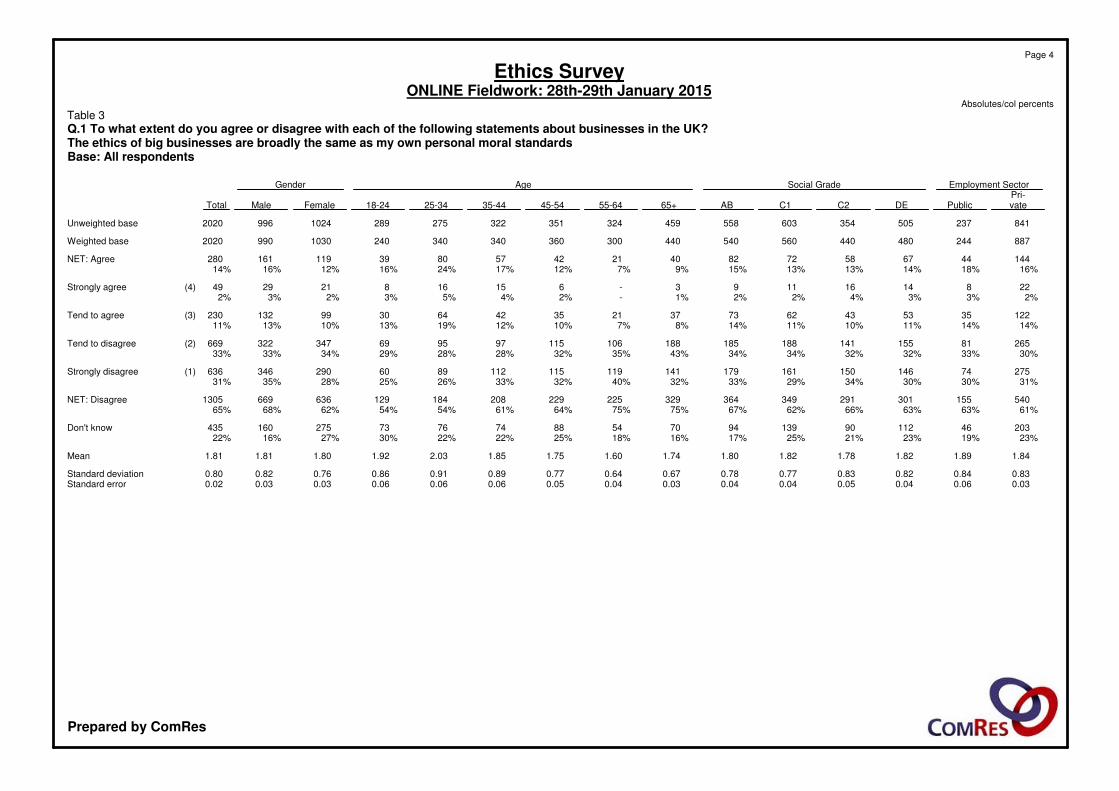
Table 3
Q.1 To what extent do you agree or disagree with each of the following statements about businesses in the UK?The ethics of big businesses are broadly the same as my own personal moral standardsBase: All respondents
Prepared by ComRes
RegionYorkshire &
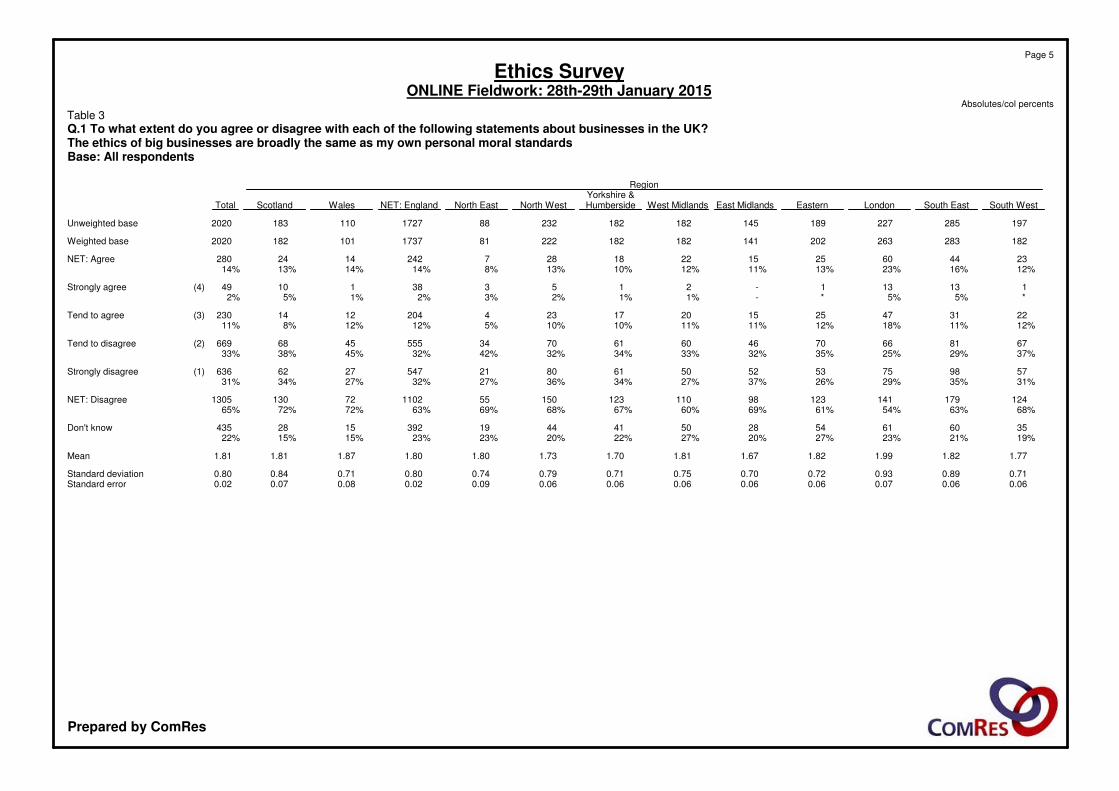
South WestSouth EastLondonEasternEast MidlandsWest MidlandsHumbersideNorth WestNorth EastNET: EnglandWalesScotlandTotal
1972852271891451821822328817271101832020Unweighted base
1822832632021411821822228117371011822020Weighted base
234460251522182872421424280NET: Agree12%16%23%13%11%12%10%13%8%14%14%13%14%
113131-21533811049Strongly agree (4)*5%5%*-1%1%2%3%2%1%5%2%
223147251520172342041214230Tend to agree (3)12%11%18%12%11%11%10%10%5%12%12%8%11%
6781667046606170345554568669Tend to disagree (2)37%29%25%35%32%33%34%32%42%32%45%38%33%
5798755352506180215472762636Strongly disagree (1)31%35%29%26%37%27%34%36%27%32%27%34%31%
12417914112398110123150551102721301305NET: Disagree68%63%54%61%69%60%67%68%69%63%72%72%65%
3560615428504144193921528435Don't know19%21%23%27%20%27%22%20%23%23%15%15%22%
1.771.821.991.821.671.811.701.731.801.801.871.811.81Mean
0.710.890.930.720.700.750.710.790.740.800.710.840.80Standard deviation0.060.060.070.060.060.060.060.060.090.020.080.070.02Standard error
Page 5
Ethics SurveyONLINE Fieldwork: 28th-29th January 2015
Absolutes/col percents
Table 3
Q.1 To what extent do you agree or disagree with each of the following statements about businesses in the UK?The ethics of big businesses are broadly the same as my own personal moral standardsBase: All respondents
Prepared by ComRes
Employment SectorSocial GradeAgeGenderPri-vatePublicDEC2C1AB65+55-6445-5435-4425-3418-24FemaleMaleTotal
84123750535460355845932435132227528910249962020Unweighted base
88724448044056054044030036034034024010309902020Weighted base
23969117112148171131698210610259292256549NET: Agree27%28%24%25%26%32%30%23%23%31%30%24%28%26%27%
2581218111764518177233457Strongly agree (4)3%3%2%4%2%3%1%1%1%5%5%3%2%3%3%
21361106941371541246577888652269222491Tend to agree (3)24%25%22%21%25%29%28%22%21%26%25%21%26%22%24%
319931821812021891771271601158887363391754Tend to disagree (2)36%38%38%41%36%35%40%42%45%34%26%36%35%40%37%
119306463657044493939603292170262Strongly disagree (1)13%12%13%14%12%13%10%16%11%11%18%13%9%17%13%
4381232462442672592221761991541481194565611017NET: Disagree49%50%51%56%48%48%50%59%55%45%43%49%44%57%50%
2105311784145109885579809063282173455Don't know24%22%24%19%26%20%20%19%22%24%26%26%27%17%23%
2.212.242.182.192.232.272.262.102.172.332.242.192.302.152.22Mean
0.770.760.750.780.740.780.690.720.680.810.890.770.720.790.76Standard deviation0.030.060.040.050.030.040.040.040.040.050.060.050.030.030.02Standard error
Page 6
Ethics SurveyONLINE Fieldwork: 28th-29th January 2015
Absolutes/col percents
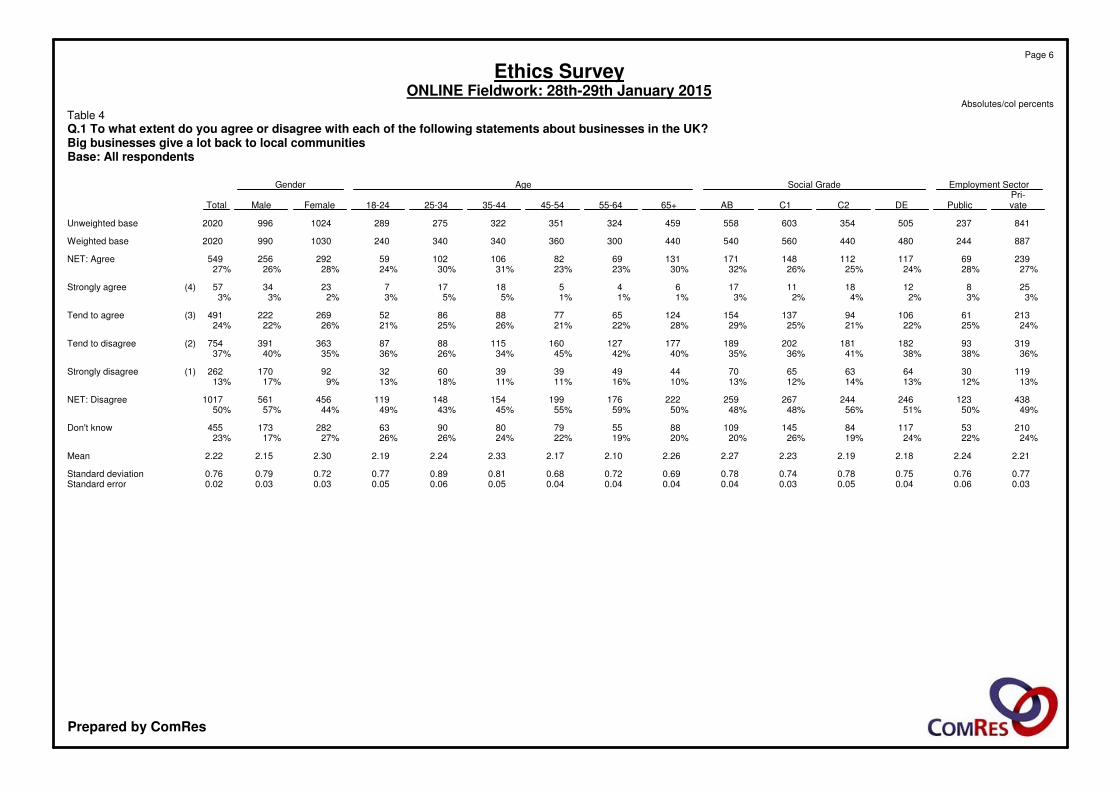
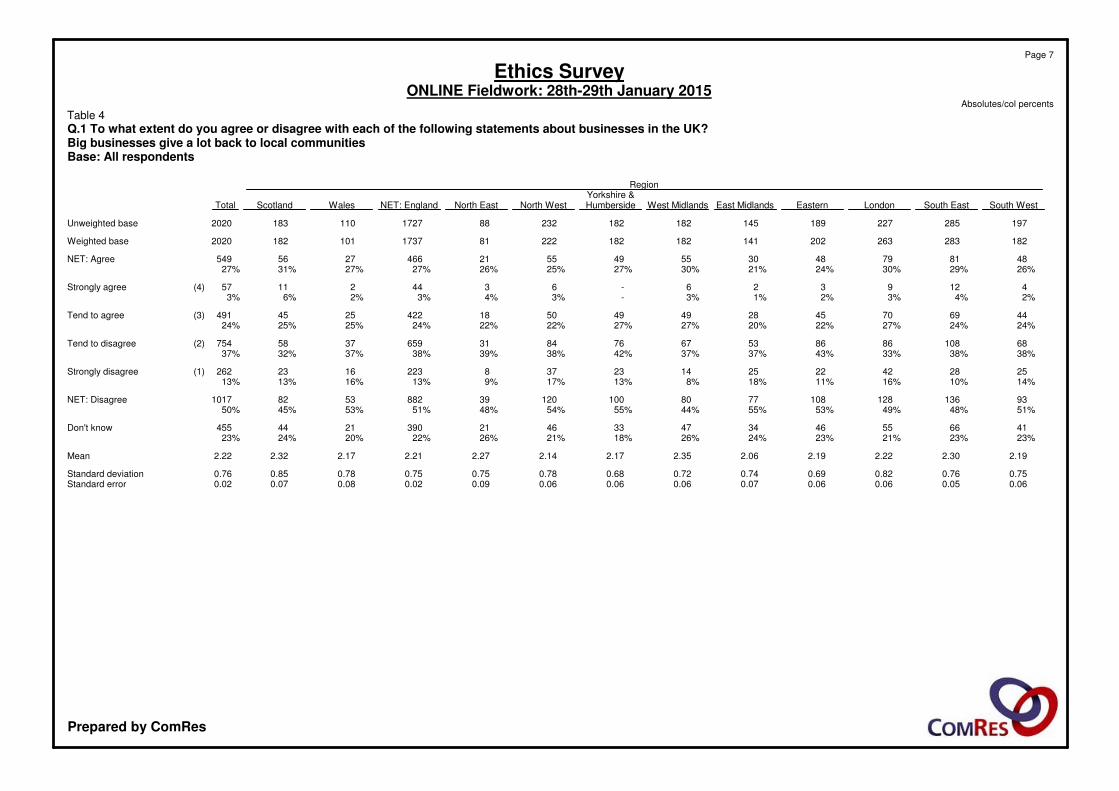
Table 4
Q.1 To what extent do you agree or disagree with each of the following statements about businesses in the UK?Big businesses give a lot back to local communitiesBase: All respondents
Prepared by ComRes
RegionYorkshire &
South WestSouth EastLondonEasternEast MidlandsWest MidlandsHumbersideNorth WestNorth EastNET: EnglandWalesScotlandTotal
1972852271891451821822328817271101832020Unweighted base
1822832632021411821822228117371011822020Weighted base
4881794830554955214662756549NET: Agree26%29%30%24%21%30%27%25%26%27%27%31%27%
4129326-634421157Strongly agree (4)2%4%3%2%1%3%-3%4%3%2%6%3%
4469704528494950184222545491Tend to agree (3)24%24%27%22%20%27%27%22%22%24%25%25%24%
68108868653677684316593758754Tend to disagree (2)38%38%33%43%37%37%42%38%39%38%37%32%37%
252842222514233782231623262Strongly disagree (1)14%10%16%11%18%8%13%17%9%13%16%13%13%
9313612810877801001203988253821017NET: Disagree51%48%49%53%55%44%55%54%48%51%53%45%50%
4166554634473346213902144455Don't know23%23%21%23%24%26%18%21%26%22%20%24%23%
2.192.302.222.192.062.352.172.142.272.212.172.322.22Mean
0.750.760.820.690.740.720.680.780.750.750.780.850.76Standard deviation0.060.050.060.060.070.060.060.060.090.020.080.070.02Standard error
Page 7
Ethics SurveyONLINE Fieldwork: 28th-29th January 2015
Absolutes/col percents
Table 4
Q.1 To what extent do you agree or disagree with each of the following statements about businesses in the UK?Big businesses give a lot back to local communitiesBase: All respondents
Prepared by ComRes

Employment SectorSocial GradeAgeGenderPri-vatePublicDEC2C1AB65+55-6445-5435-4425-3418-24FemaleMaleTotal
84123750535460355845932435132227528910249962020Unweighted base
88724448044056054044030036034034024010309902020Weighted base
28065121136154177123689711211275291297587NET: Agree32%27%25%31%27%33%28%23%27%33%33%31%28%30%29%
3392119723759191910373370Strongly agree (4)4%3%4%4%1%4%2%2%3%6%6%4%4%3%3%
247561001171471541166387939365254263517Tend to agree (3)28%23%21%27%26%28%26%21%24%27%27%27%25%27%26%
24775140133176147146111119877559293303596Tend to disagree (2)28%31%29%30%31%27%33%37%33%25%22%25%28%31%30%
131386165737959514445552395183278Strongly disagree (1)15%15%13%15%13%15%13%17%12%13%16%10%9%18%14%
37811320119824922620516216313213082388486874NET: Disagree43%46%42%45%44%42%47%54%45%39%38%34%38%49%43%
2296715810615713711270100969883352207559Don't know26%27%33%24%28%25%26%23%28%28%29%35%34%21%28%
2.282.202.252.272.222.302.222.102.242.352.312.392.342.192.26Mean
0.840.830.840.840.750.850.760.760.770.870.910.820.780.840.82Standard deviation0.030.060.050.050.040.040.040.050.050.060.070.060.030.030.02Standard error
Page 8
Ethics SurveyONLINE Fieldwork: 28th-29th January 2015
Absolutes/col percents
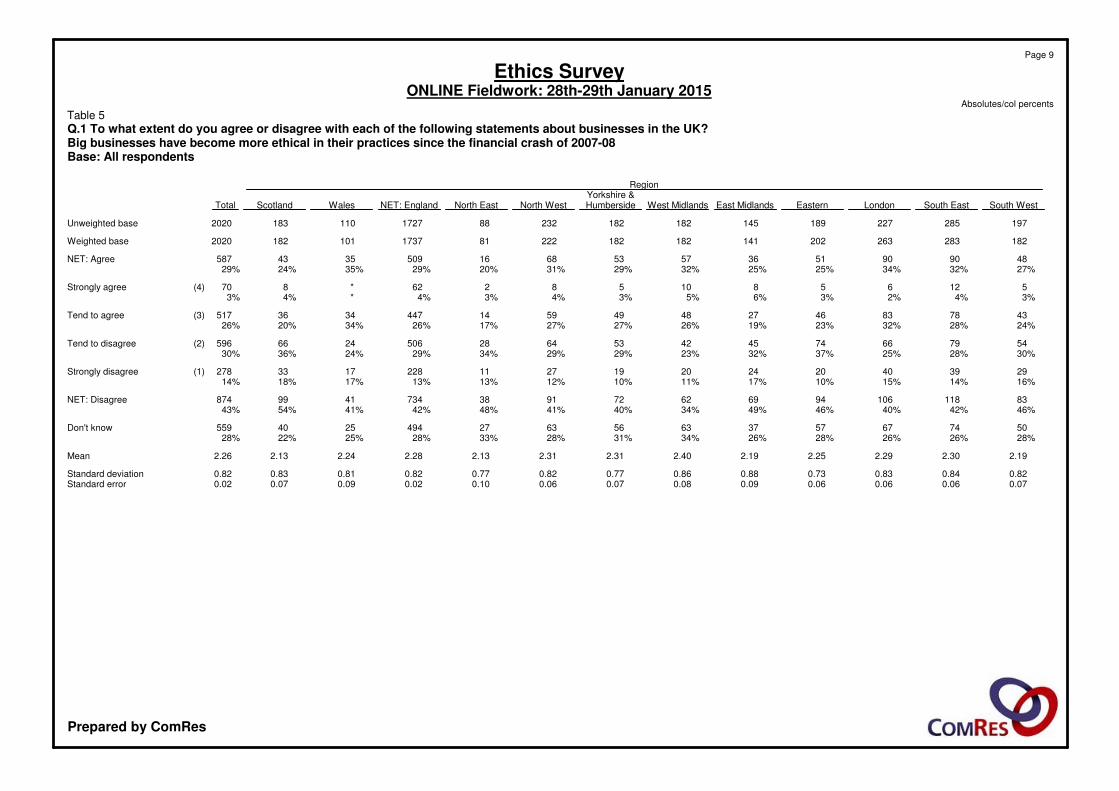
Table 5
Q.1 To what extent do you agree or disagree with each of the following statements about businesses in the UK?Big businesses have become more ethical in their practices since the financial crash of 2007-08Base: All respondents
Prepared by ComRes
RegionYorkshire &
South WestSouth EastLondonEasternEast MidlandsWest MidlandsHumbersideNorth WestNorth EastNET: EnglandWalesScotlandTotal
1972852271891451821822328817271101832020Unweighted base
1822832632021411821822228117371011822020Weighted base
4890905136575368165093543587NET: Agree27%32%34%25%25%32%29%31%20%29%35%24%29%
5126581058262*870Strongly agree (4)3%4%2%3%6%5%3%4%3%4%*4%3%
4378834627484959144473436517Tend to agree (3)24%28%32%23%19%26%27%27%17%26%34%20%26%
5479667445425364285062466596Tend to disagree (2)30%28%25%37%32%23%29%29%34%29%24%36%30%
2939402024201927112281733278Strongly disagree (1)16%14%15%10%17%11%10%12%13%13%17%18%14%
831181069469627291387344199874NET: Disagree46%42%40%46%49%34%40%41%48%42%41%54%43%
5074675737635663274942540559Don't know28%26%26%28%26%34%31%28%33%28%25%22%28%
2.192.302.292.252.192.402.312.312.132.282.242.132.26Mean
0.820.840.830.730.880.860.770.820.770.820.810.830.82Standard deviation0.070.060.060.060.090.080.070.060.100.020.090.070.02Standard error
Page 9
Ethics SurveyONLINE Fieldwork: 28th-29th January 2015
Absolutes/col percents
Table 5
Q.1 To what extent do you agree or disagree with each of the following statements about businesses in the UK?Big businesses have become more ethical in their practices since the financial crash of 2007-08Base: All respondents
Prepared by ComRes
Employment SectorSocial GradeAgeGenderPri-vatePublicDEC2C1AB65+55-6445-5435-4425-3418-24FemaleMaleTotal
84123750535460355845932435132227528910249962020Unweighted base
88724448044056054044030036034034024010309902020Weighted base
5521433072913293222731842092312121396396101249NET: Agree62%59%64%66%59%60%62%61%58%68%62%58%62%62%62%
1173778806859513245616729146139284Strongly agree (4)13%15%16%18%12%11%12%11%12%18%20%12%14%14%14%
434106229211261264222153164170145110493471964Tend to agree (3)49%44%48%48%47%49%50%51%46%50%43%46%48%48%48%
13242694387102794660434431130172302Tend to disagree (2)15%17%14%10%16%19%18%15%17%13%13%13%13%17%15%
201061216111187649212445Strongly disagree (1)2%4%1%3%3%2%3%3%2%2%1%4%2%2%2%
152517556103114905467484840152195347NET: Disagree17%21%16%13%18%21%20%18%19%14%14%17%15%20%17%
183509893128104776283608062240184424Don't know21%20%20%21%23%19%17%21%23%18%24%26%23%19%21%
2.922.882.993.042.882.852.862.872.893.033.062.892.962.902.93Mean
0.680.770.670.700.700.670.680.670.690.670.690.730.680.700.69Standard deviation0.030.060.030.040.030.030.030.040.040.040.050.050.020.020.02Standard error
Page 10
Ethics SurveyONLINE Fieldwork: 28th-29th January 2015
Absolutes/col percents
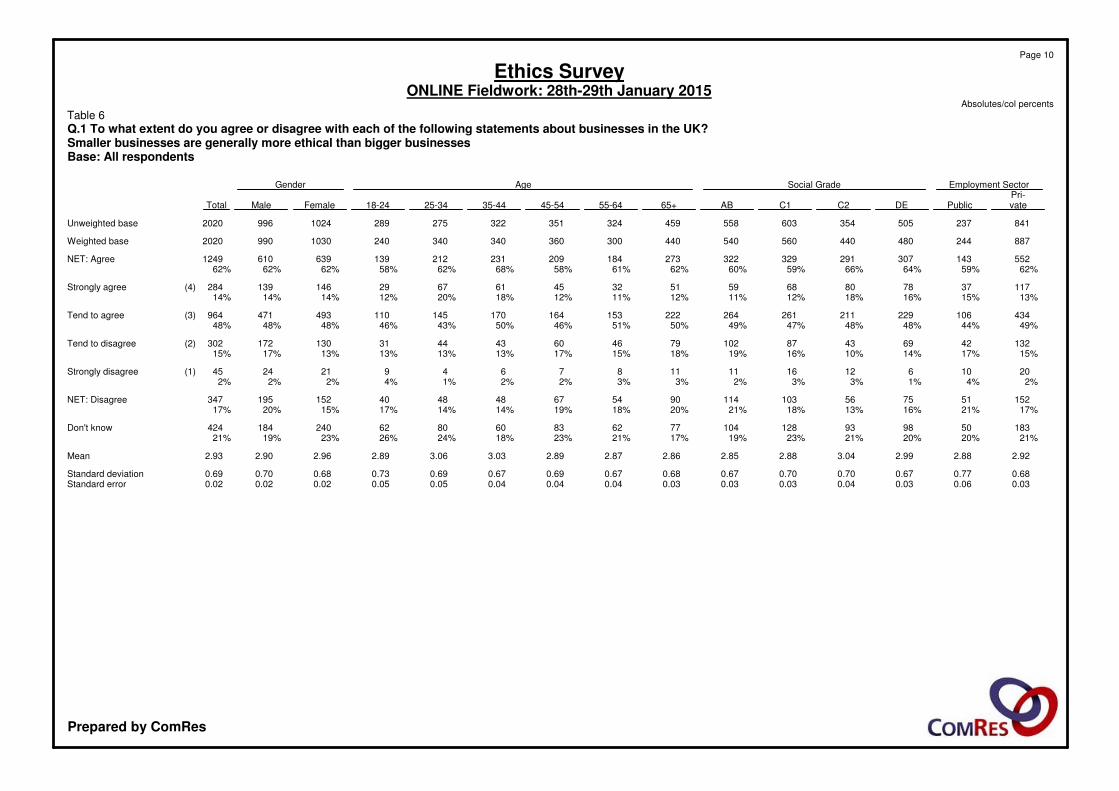
Table 6
Q.1 To what extent do you agree or disagree with each of the following statements about businesses in the UK?Smaller businesses are generally more ethical than bigger businessesBase: All respondents
Prepared by ComRes
RegionYorkshire &
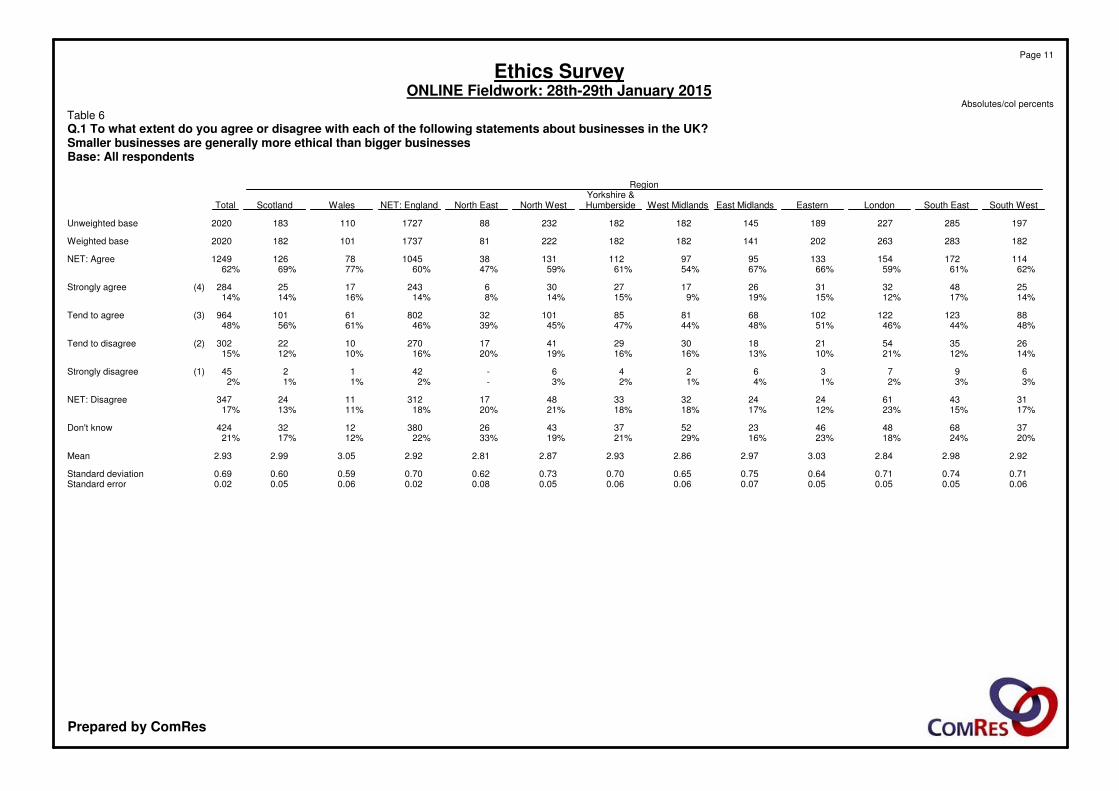
South WestSouth EastLondonEasternEast MidlandsWest MidlandsHumbersideNorth WestNorth EastNET: EnglandWalesScotlandTotal
1972852271891451821822328817271101832020Unweighted base
1822832632021411821822228117371011822020Weighted base
1141721541339597112131381045781261249NET: Agree62%61%59%66%67%54%61%59%47%60%77%69%62%
254832312617273062431725284Strongly agree (4)14%17%12%15%19%9%15%14%8%14%16%14%14%
881231221026881851013280261101964Tend to agree (3)48%44%46%51%48%44%47%45%39%46%61%56%48%
2635542118302941172701022302Tend to disagree (2)14%12%21%10%13%16%16%19%20%16%10%12%15%
69736246-421245Strongly disagree (1)3%3%2%1%4%1%2%3%-2%1%1%2%
3143612424323348173121124347NET: Disagree17%15%23%12%17%18%18%21%20%18%11%13%17%
3768484623523743263801232424Don't know20%24%18%23%16%29%21%19%33%22%12%17%21%
2.922.982.843.032.972.862.932.872.812.923.052.992.93Mean
0.710.740.710.640.750.650.700.730.620.700.590.600.69Standard deviation0.060.050.050.050.070.060.060.050.080.020.060.050.02Standard error
Page 11
Ethics SurveyONLINE Fieldwork: 28th-29th January 2015
Absolutes/col percents
Table 6
Q.1 To what extent do you agree or disagree with each of the following statements about businesses in the UK?Smaller businesses are generally more ethical than bigger businessesBase: All respondents
Prepared by ComRes
Employment SectorSocial GradeAgeGenderPri-vatePublicDEC2C1AB65+55-6445-5435-4425-3418-24FemaleMaleTotal
84123750535460355845932435132227528910249962020Unweighted base
88724448044056054044030036034034024010309902020Weighted base
6731893643524304273672512782762281737698041573NET: Agree76%78%76%80%77%79%83%84%77%81%67%72%75%81%78%
3039618116618118114511613212711376330377708Strongly agree (4)34%39%38%38%32%33%33%39%37%37%33%31%32%38%35%
3709318418624924622213514614911697439426865Tend to agree (3)42%38%38%42%44%46%51%45%41%44%34%40%43%43%43%
7916363935433723242332138272153Tend to disagree (2)9%7%7%9%6%8%8%8%7%7%9%6%8%7%8%
241045211253113147182442Strongly disagree (1)3%4%1%1%4%2%1%1%3%1%4%3%2%2%2%
103263944575542263625462010096195NET: Disagree12%11%8%10%10%10%10%9%10%7%13%9%10%10%10%
111297744735830234639664716190252Don't know12%12%16%10%13%11%7%8%13%11%19%20%16%9%12%
3.233.283.343.293.213.243.243.323.273.333.193.253.243.293.27Mean
0.750.790.680.700.760.710.660.660.750.650.830.740.710.730.72Standard deviation0.030.060.030.040.030.030.030.040.040.040.060.050.020.020.02Standard error
Page 12
Ethics SurveyONLINE Fieldwork: 28th-29th January 2015
Absolutes/col percents
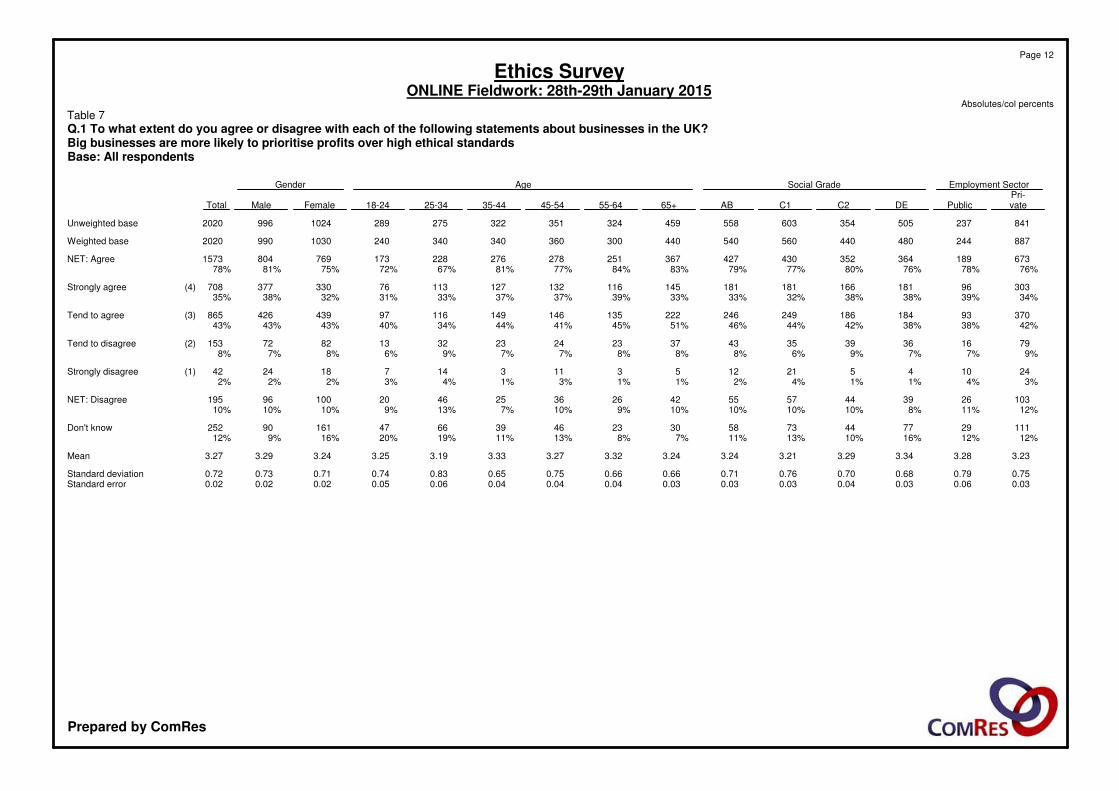
Table 7
Q.1 To what extent do you agree or disagree with each of the following statements about businesses in the UK?Big businesses are more likely to prioritise profits over high ethical standardsBase: All respondents
Prepared by ComRes

RegionYorkshire &
South WestSouth EastLondonEasternEast MidlandsWest MidlandsHumbersideNorth WestNorth EastNET: EnglandWalesScotlandTotal
1972852271891451821822328817271101832020Unweighted base
1822832632021411821822228117371011822020Weighted base
152221205150114121148177551345741551573NET: Agree84%78%78%74%81%67%82%80%69%77%73%85%78%
54105867054555879255873684708Strongly agree (4)30%37%33%34%38%30%32%36%32%34%36%46%35%
981161208160669098307583770865Tend to agree (3)54%41%46%40%42%36%49%44%37%44%37%39%43%
922231971681551241812153Tend to disagree (2)5%8%9%10%5%9%4%7%6%7%17%6%8%
34634639442-142Strongly disagree (1)1%1%2%2%3%3%2%4%5%2%-*2%
112629231122112491661812195NET: Disagree6%9%11%11%8%12%6%11%11%10%17%7%10%
1837282916392321172271015252Don't know10%13%11%14%11%21%13%9%21%13%10%8%12%
3.253.313.223.253.313.193.283.233.203.253.213.433.27Mean
0.630.700.730.730.720.790.640.770.830.720.750.640.72Standard deviation0.050.040.050.060.060.070.050.050.100.020.080.050.02Standard error
Page 13
Ethics SurveyONLINE Fieldwork: 28th-29th January 2015
Absolutes/col percents
Table 7
Q.1 To what extent do you agree or disagree with each of the following statements about businesses in the UK?Big businesses are more likely to prioritise profits over high ethical standardsBase: All respondents
Prepared by ComRes
StatementsThe next
Big businessesIf bigGovernmentThe nextSmallare more likelyIt is not thebusinesses doshould penaliseGovernment
businesses needto have theirGovernment'snot want tobig businessesshould make itmore help tovoices heard inplace to makecomply withwho acta priority to
get theirParliament thansure that bigregulation theyunfairlypromote ethicalvoices heard insmallbusinesses actcan usually gettowards smallpractices among
Parliamentbusinessesethicallyaround itbusinessesbig businesses
202020202020202020202020Unweighted base
202020202020202020202020Weighted base
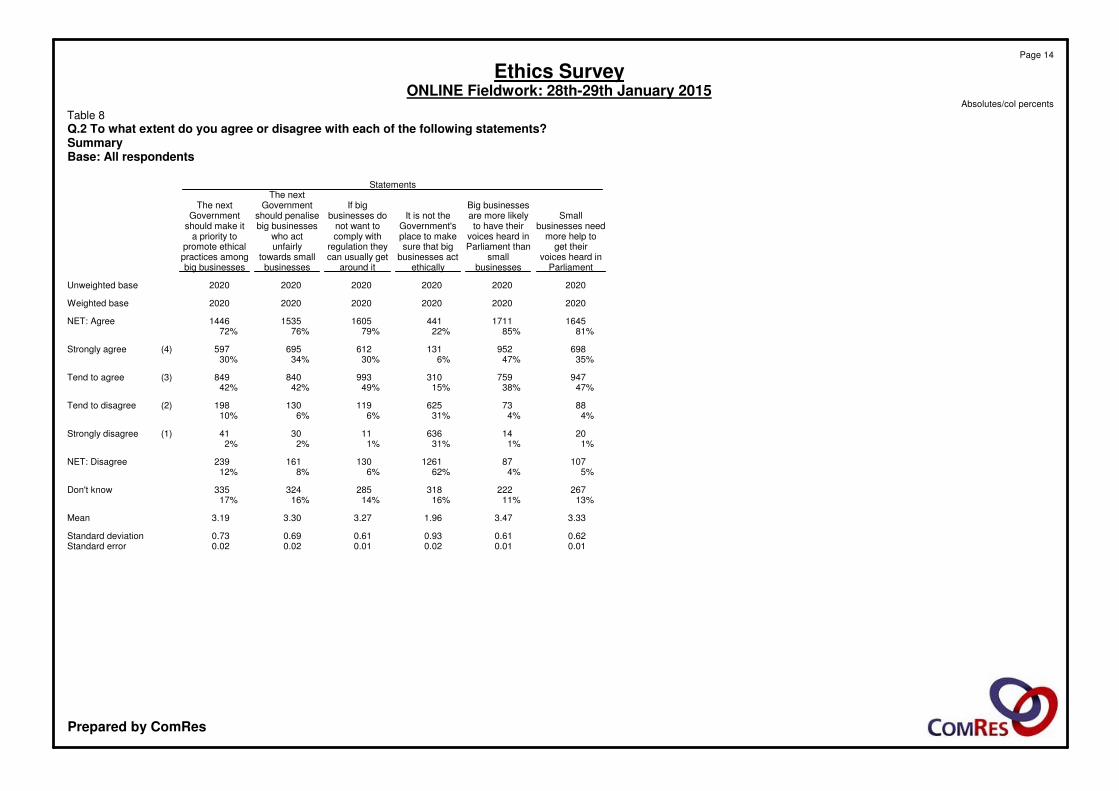
16451711441160515351446NET: Agree81%85%22%79%76%72%
698952131612695597Strongly agree (4)35%47%6%30%34%30%
947759310993840849Tend to agree (3)47%38%15%49%42%42%
8873625119130198Tend to disagree (2)4%4%31%6%6%10%
2014636113041Strongly disagree (1)1%1%31%1%2%2%
107871261130161239NET: Disagree5%4%62%6%8%12%
267222318285324335Don't know13%11%16%14%16%17%
3.333.471.963.273.303.19Mean
0.620.610.930.610.690.73Standard deviation0.010.010.020.010.020.02Standard error
Page 14
Ethics SurveyONLINE Fieldwork: 28th-29th January 2015
Absolutes/col percents
Table 8
Q.2 To what extent do you agree or disagree with each of the following statements?SummaryBase: All respondents
Prepared by ComRes
Employment SectorSocial GradeAgeGenderPri-vatePublicDEC2C1AB65+55-6445-5435-4425-3418-24FemaleMaleTotal
84123750535460355845932435132227528910249962020Unweighted base
88724448044056054044030036034034024010309902020Weighted base
6181733443203784043442232442442351567167301446NET: Agree70%71%72%73%68%75%78%74%68%72%69%65%69%74%72%
2406417011915814914692951079265285312597Strongly agree (4)27%26%35%27%28%28%33%31%26%31%27%27%28%32%30%
37810917420122025519813114913714391431418849Tend to agree (3)43%45%36%46%39%47%45%44%41%40%42%38%42%42%42%
89274037626043323830332293105198Tend to disagree (2)10%11%8%8%11%11%10%11%10%9%10%9%9%11%10%
1510981596611577172441Strongly disagree (1)2%4%2%2%3%2%1%2%3%2%2%3%2%2%2%
1043748457769493848354029110129239NET: Disagree12%15%10%10%14%13%11%13%13%10%12%12%11%13%12%
16534887510567473967616656205131335Don't know19%14%18%17%19%12%11%13%19%18%19%23%20%13%17%
3.173.083.293.183.153.153.233.193.123.243.173.163.193.193.19Mean
0.710.790.740.700.770.710.700.730.770.710.730.770.710.750.73Standard deviation0.030.060.040.040.030.030.030.040.050.040.050.050.020.030.02Standard error
Page 15
Ethics SurveyONLINE Fieldwork: 28th-29th January 2015
Absolutes/col percents
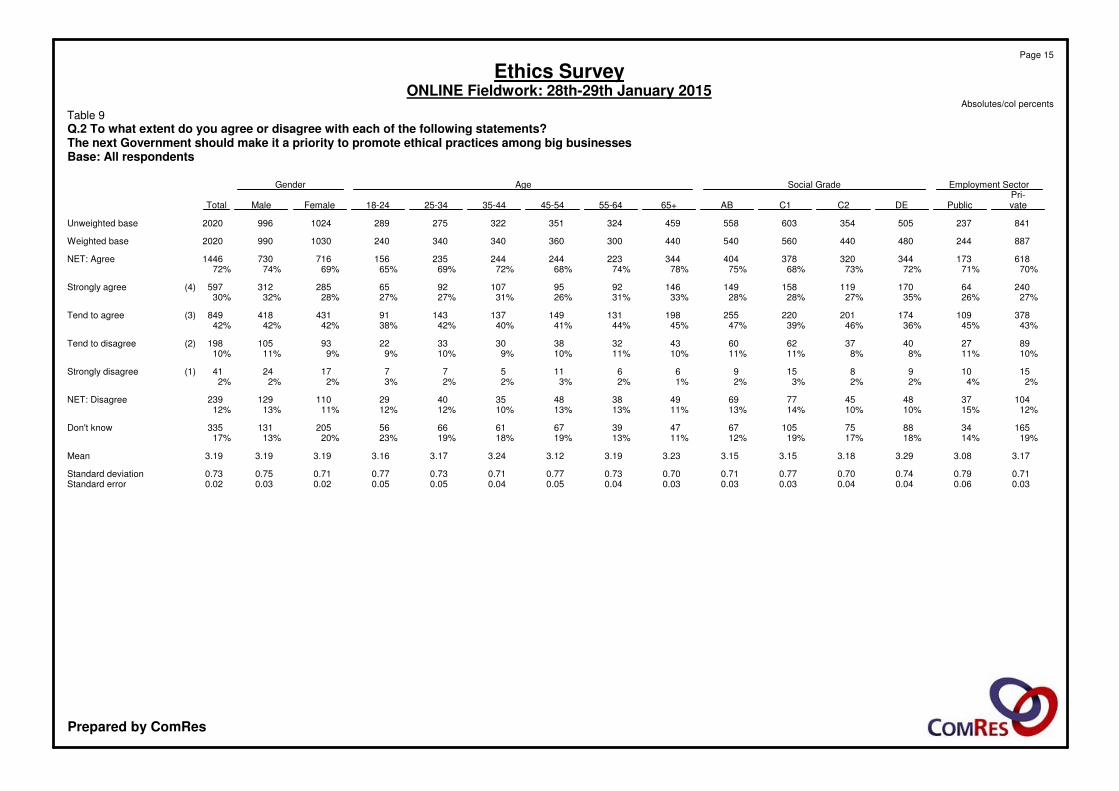
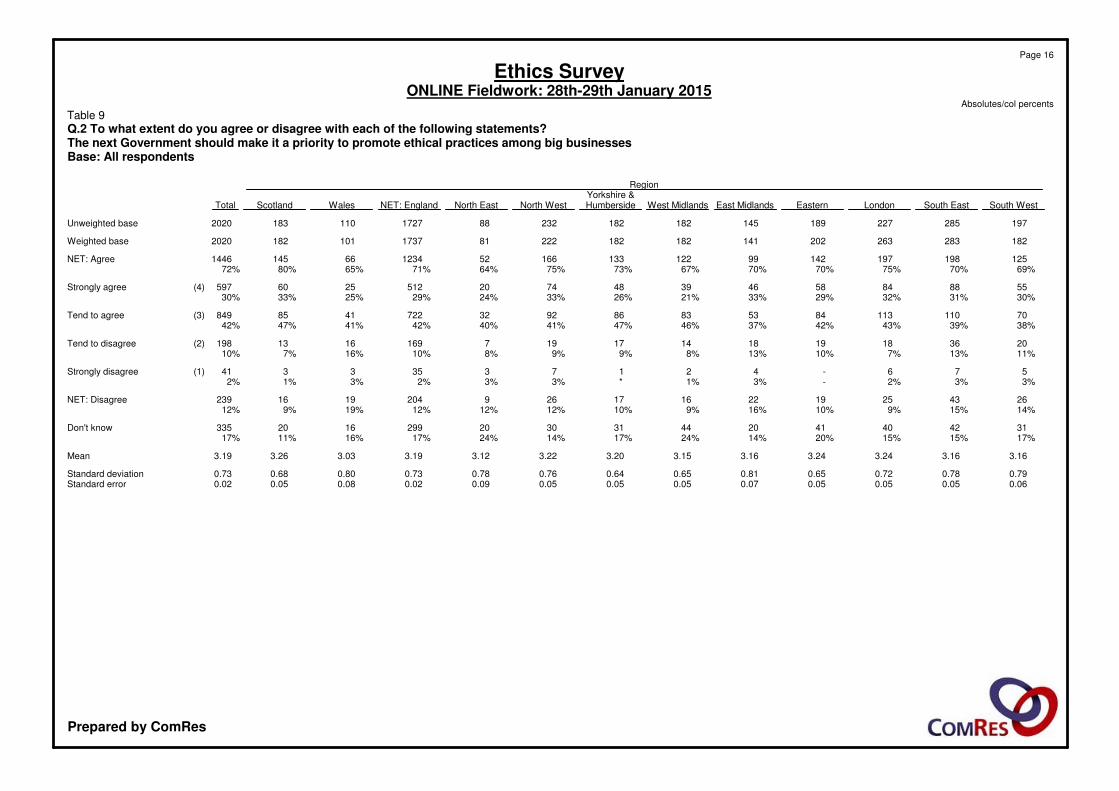
Table 9
Q.2 To what extent do you agree or disagree with each of the following statements?The next Government should make it a priority to promote ethical practices among big businessesBase: All respondents
Prepared by ComRes
RegionYorkshire &
South WestSouth EastLondonEasternEast MidlandsWest MidlandsHumbersideNorth WestNorth EastNET: EnglandWalesScotlandTotal
1972852271891451821822328817271101832020Unweighted base
1822832632021411821822228117371011822020Weighted base
12519819714299122133166521234661451446NET: Agree69%70%75%70%70%67%73%75%64%71%65%80%72%
5588845846394874205122560597Strongly agree (4)30%31%32%29%33%21%26%33%24%29%25%33%30%
701101138453838692327224185849Tend to agree (3)38%39%43%42%37%46%47%41%40%42%41%47%42%
203618191814171971691613198Tend to disagree (2)11%13%7%10%13%8%9%9%8%10%16%7%10%
576-42173353341Strongly disagree (1)3%3%2%-3%1%*3%3%2%3%1%2%
264325192216172692041916239NET: Disagree14%15%9%10%16%9%10%12%12%12%19%9%12%
3142404120443130202991620335Don't know17%15%15%20%14%24%17%14%24%17%16%11%17%
3.163.163.243.243.163.153.203.223.123.193.033.263.19Mean
0.790.780.720.650.810.650.640.760.780.730.800.680.73Standard deviation0.060.050.050.050.070.050.050.050.090.020.080.050.02Standard error
Page 16
Ethics SurveyONLINE Fieldwork: 28th-29th January 2015
Absolutes/col percents
Table 9
Q.2 To what extent do you agree or disagree with each of the following statements?The next Government should make it a priority to promote ethical practices among big businessesBase: All respondents
Prepared by ComRes
Employment SectorSocial GradeAgeGenderPri-vatePublicDEC2C1AB65+55-6445-5435-4425-3418-24FemaleMaleTotal
84123750535460355845932435132227528910249962020Unweighted base
88724448044056054044030036034034024010309902020Weighted base
6771773673454084153662462712582451497517841535NET: Agree76%73%76%78%73%77%83%82%75%76%72%62%73%79%76%
3136818417316217718310214311710248320376695Strongly agree (4)35%28%38%39%29%33%42%34%40%35%30%20%31%38%34%
364109183173246238183144128140144100431408840Tend to agree (3)41%45%38%39%44%44%42%48%36%41%42%42%42%41%42%
5424252438432614241623266466130Tend to disagree (2)6%10%5%6%7%8%6%5%7%5%7%11%6%7%6%
11457910863365131830Strongly disagree (1)1%2%1%2%2%2%2%2%1%1%2%2%1%2%2%
6428303247523420271929317784161NET: Disagree7%11%6%7%8%10%8%7%7%6%8%13%7%8%8%
14639836310573393362636660203122324Don't know16%16%17%14%19%14%9%11%17%18%19%25%20%12%16%
3.323.183.383.353.233.253.353.293.383.343.253.073.283.323.30Mean
0.670.700.660.690.680.700.690.670.670.640.690.730.670.700.69Standard deviation0.030.050.030.040.030.030.030.040.040.040.050.050.020.020.02Standard error
Page 17
Ethics SurveyONLINE Fieldwork: 28th-29th January 2015
Absolutes/col percents
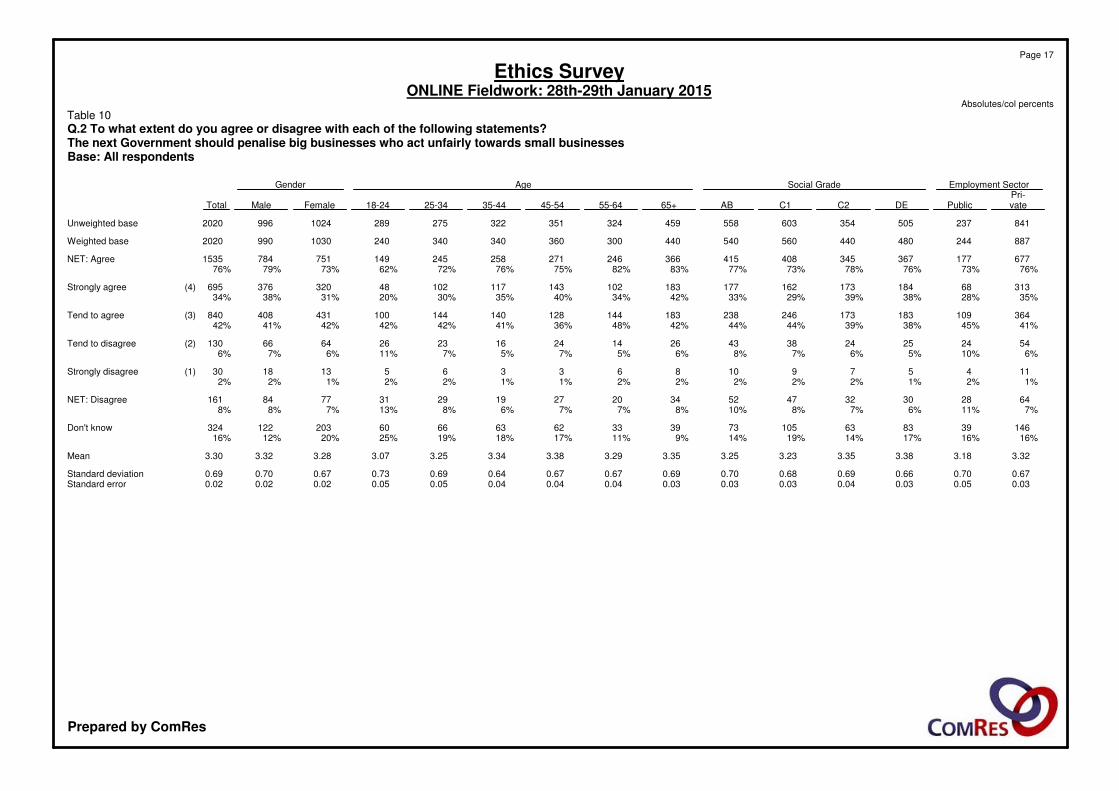
Table 10
Q.2 To what extent do you agree or disagree with each of the following statements?The next Government should penalise big businesses who act unfairly towards small businessesBase: All respondents
Prepared by ComRes
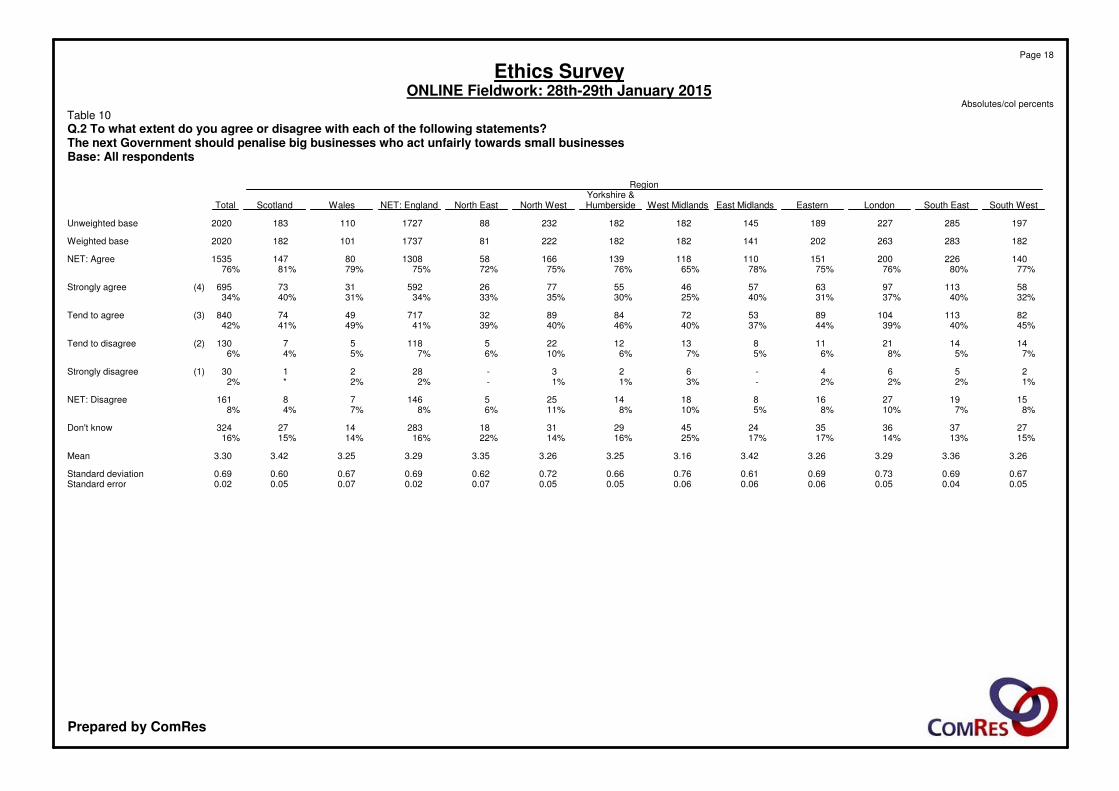
RegionYorkshire &
South WestSouth EastLondonEasternEast MidlandsWest MidlandsHumbersideNorth WestNorth EastNET: EnglandWalesScotlandTotal
1972852271891451821822328817271101832020Unweighted base
1822832632021411821822228117371011822020Weighted base
140226200151110118139166581308801471535NET: Agree77%80%76%75%78%65%76%75%72%75%79%81%76%
58113976357465577265923173695Strongly agree (4)32%40%37%31%40%25%30%35%33%34%31%40%34%
821131048953728489327174974840Tend to agree (3)45%40%39%44%37%40%46%40%39%41%49%41%42%
141421118131222511857130Tend to disagree (2)7%5%8%6%5%7%6%10%6%7%5%4%6%
2564-623-282130Strongly disagree (1)1%2%2%2%-3%1%1%-2%2%*2%
151927168181425514678161NET: Disagree8%7%10%8%5%10%8%11%6%8%7%4%8%
2737363524452931182831427324Don't know15%13%14%17%17%25%16%14%22%16%14%15%16%
3.263.363.293.263.423.163.253.263.353.293.253.423.30Mean
0.670.690.730.690.610.760.660.720.620.690.670.600.69Standard deviation0.050.040.050.060.060.060.050.050.070.020.070.050.02Standard error
Page 18
Ethics SurveyONLINE Fieldwork: 28th-29th January 2015
Absolutes/col percents
Table 10
Q.2 To what extent do you agree or disagree with each of the following statements?The next Government should penalise big businesses who act unfairly towards small businessesBase: All respondents
Prepared by ComRes
Employment SectorSocial GradeAgeGenderPri-vatePublicDEC2C1AB65+55-6445-5435-4425-3418-24FemaleMaleTotal
84123750535460355845932435132227528910249962020Unweighted base
88724448044056054044030036034034024010309902020Weighted base
6911893663584384433952562842692521507748311605NET: Agree78%77%76%81%78%82%90%85%79%79%74%62%75%84%79%
269801481461581601481001161019454284329612Strongly agree (4)30%33%31%33%28%30%34%33%32%30%28%22%28%33%30%
42310921821228128324715616816815896490502993Tend to agree (3)48%45%45%48%50%52%56%52%47%49%46%40%48%51%49%
6318282331361715231520286455119Tend to disagree (2)7%7%6%5%6%7%4%5%6%4%6%12%6%6%6%
81-182-312237411Strongly disagree (1)1%1%-*1%*-1%**1%1%1%*1%
7119282440381718241722317159130NET: Disagree8%8%6%6%7%7%4%6%7%5%7%13%7%6%6%
1243686588259282651556660186100285Don't know14%15%18%13%15%11%6%9%14%16%20%25%18%10%14%
3.253.283.313.323.233.253.323.293.293.293.253.113.243.303.27Mean
0.650.650.600.600.640.600.550.620.620.590.620.710.620.600.61Standard deviation0.020.050.030.030.030.030.030.040.040.040.040.050.020.020.01Standard error
Page 19
Ethics SurveyONLINE Fieldwork: 28th-29th January 2015
Absolutes/col percents
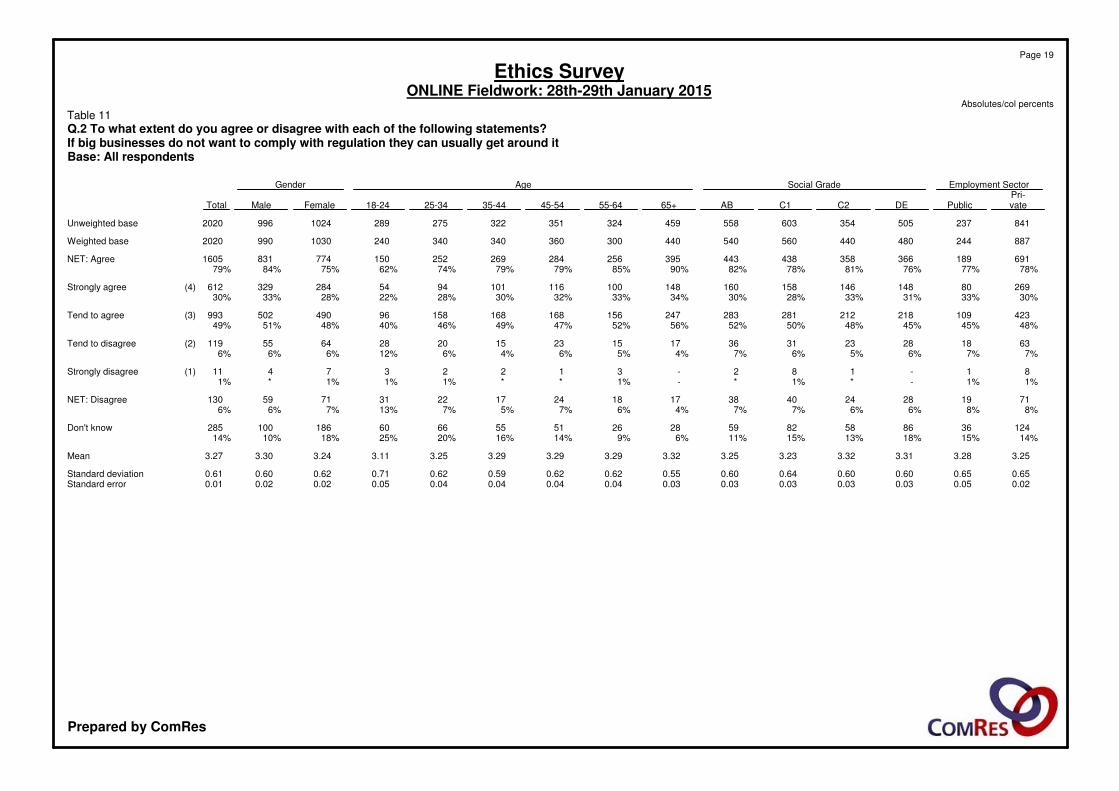
Table 11
Q.2 To what extent do you agree or disagree with each of the following statements?If big businesses do not want to comply with regulation they can usually get around itBase: All respondents
Prepared by ComRes
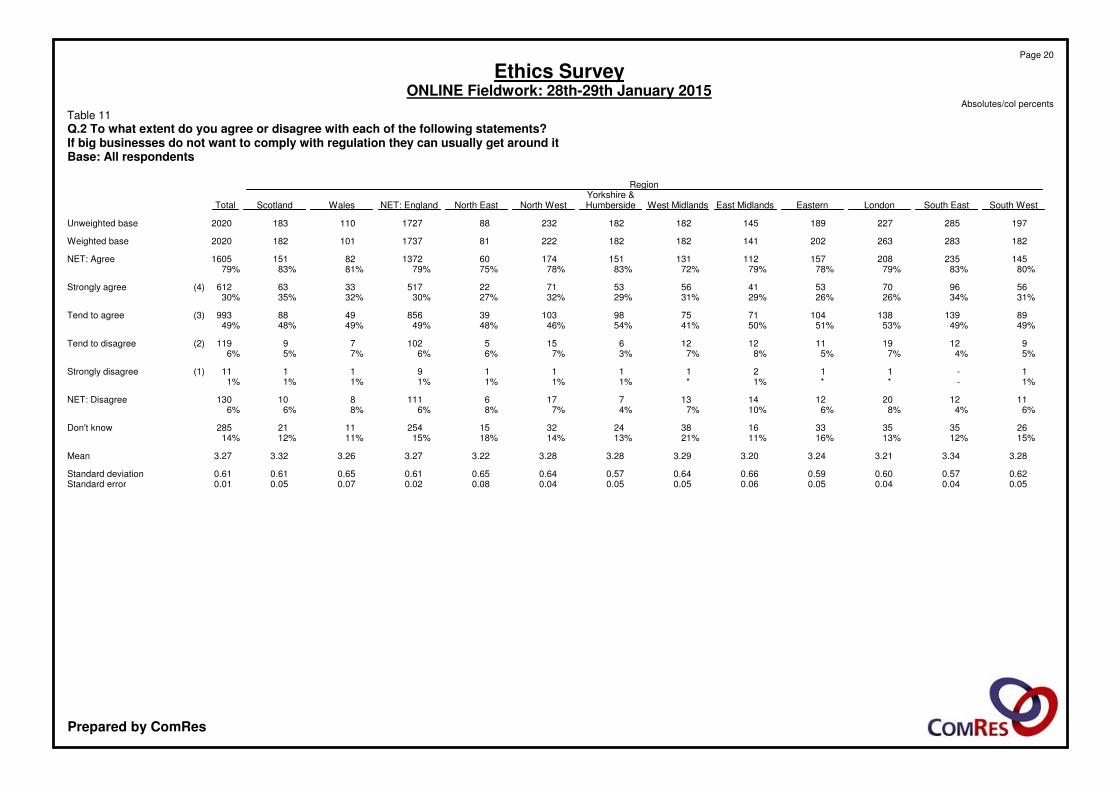
RegionYorkshire &
South WestSouth EastLondonEasternEast MidlandsWest MidlandsHumbersideNorth WestNorth EastNET: EnglandWalesScotlandTotal
1972852271891451821822328817271101832020Unweighted base
1822832632021411821822228117371011822020Weighted base
145235208157112131151174601372821511605NET: Agree80%83%79%78%79%72%83%78%75%79%81%83%79%
5696705341565371225173363612Strongly agree (4)31%34%26%26%29%31%29%32%27%30%32%35%30%
89139138104717598103398564988993Tend to agree (3)49%49%53%51%50%41%54%46%48%49%49%48%49%
91219111212615510279119Tend to disagree (2)5%4%7%5%8%7%3%7%6%6%7%5%6%
1-112111191111Strongly disagree (1)1%-**1%*1%1%1%1%1%1%1%
1112201214137176111810130NET: Disagree6%4%8%6%10%7%4%7%8%6%8%6%6%
2635353316382432152541121285Don't know15%12%13%16%11%21%13%14%18%15%11%12%14%
3.283.343.213.243.203.293.283.283.223.273.263.323.27Mean
0.620.570.600.590.660.640.570.640.650.610.650.610.61Standard deviation0.050.040.040.050.060.050.050.040.080.020.070.050.01Standard error
Page 20
Ethics SurveyONLINE Fieldwork: 28th-29th January 2015
Absolutes/col percents
Table 11
Q.2 To what extent do you agree or disagree with each of the following statements?If big businesses do not want to comply with regulation they can usually get around itBase: All respondents
Prepared by ComRes
Employment SectorSocial GradeAgeGenderPri-vatePublicDEC2C1AB65+55-6445-5435-4425-3418-24FemaleMaleTotal
84123750535460355845932435132227528910249962020Unweighted base
88724448044056054044030036034034024010309902020Weighted base
21950991061141238455638210453200242441NET: Agree25%20%21%24%20%23%19%18%18%24%31%22%19%24%22%
5914253237382016182535166368131Strongly agree (4)7%6%5%7%7%7%5%5%5%7%10%7%6%7%6%
1593574747785633945576937137173310Tend to agree (3)18%14%15%17%14%16%14%13%13%17%20%15%13%18%15%
24681139132182173154104128997269341285625Tend to disagree (2)28%33%29%30%33%32%35%35%36%29%21%29%33%29%31%
27781156133173173157107116989761294342636Strongly disagree (1)31%33%32%30%31%32%36%36%32%29%29%25%29%35%31%
5231622942653563463112112441971691296356261261NET: Disagree59%66%61%60%64%64%71%70%68%58%50%54%62%63%62%
1463387699071453453616758196122318Don't know16%14%18%16%16%13%10%11%15%18%20%24%19%12%16%
2.001.921.922.011.951.971.861.871.892.042.152.051.961.961.96Mean
0.950.900.910.950.920.940.860.880.870.961.050.950.900.950.93Standard deviation0.040.060.040.060.040.040.040.050.050.060.070.060.030.030.02Standard error
Page 21
Ethics SurveyONLINE Fieldwork: 28th-29th January 2015
Absolutes/col percents
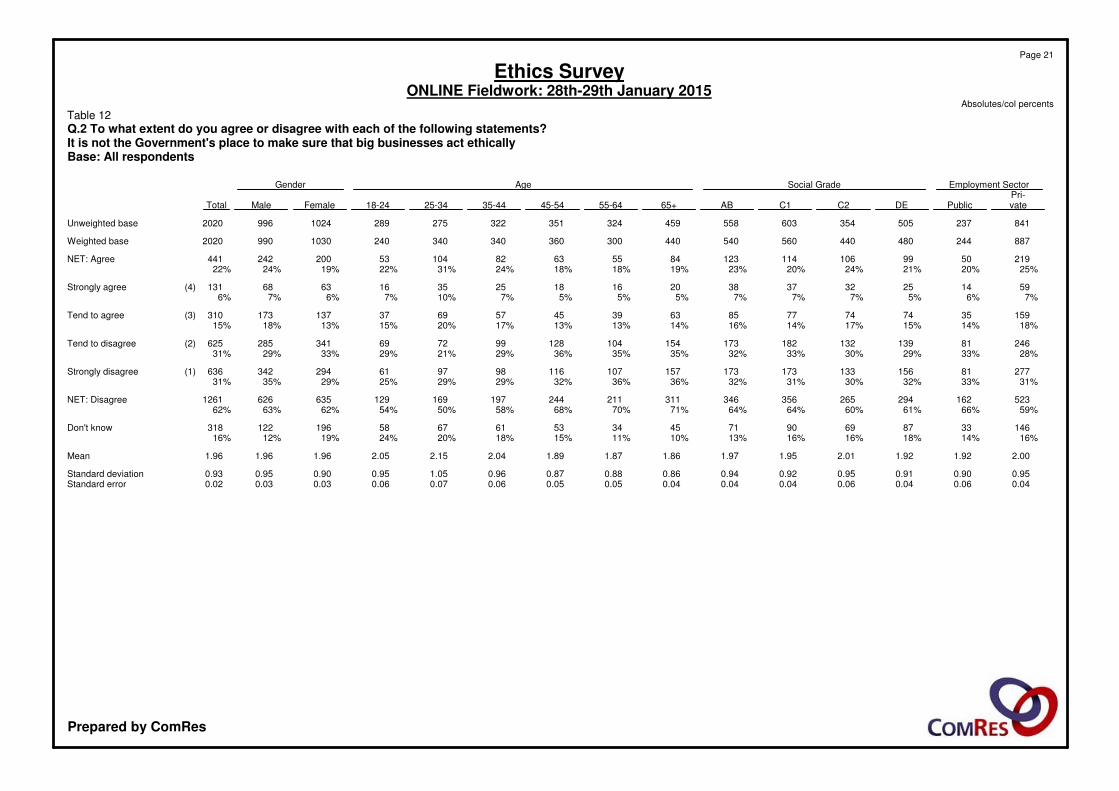
Table 12
Q.2 To what extent do you agree or disagree with each of the following statements?It is not the Government's place to make sure that big businesses act ethicallyBase: All respondents
Prepared by ComRes
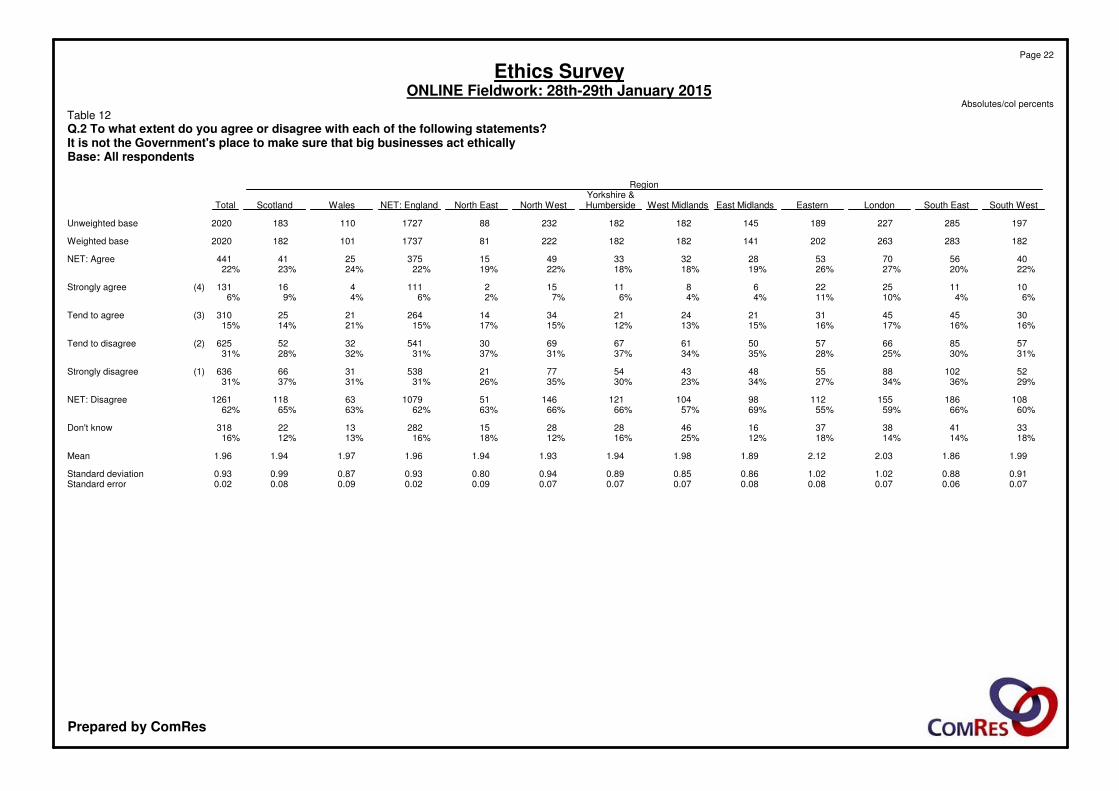
RegionYorkshire &
South WestSouth EastLondonEasternEast MidlandsWest MidlandsHumbersideNorth WestNorth EastNET: EnglandWalesScotlandTotal
1972852271891451821822328817271101832020Unweighted base
1822832632021411821822228117371011822020Weighted base
4056705328323349153752541441NET: Agree22%20%27%26%19%18%18%22%19%22%24%23%22%
101125226811152111416131Strongly agree (4)6%4%10%11%4%4%6%7%2%6%4%9%6%
3045453121242134142642125310Tend to agree (3)16%16%17%16%15%13%12%15%17%15%21%14%15%
5785665750616769305413252625Tend to disagree (2)31%30%25%28%35%34%37%31%37%31%32%28%31%
52102885548435477215383166636Strongly disagree (1)29%36%34%27%34%23%30%35%26%31%31%37%31%
10818615511298104121146511079631181261NET: Disagree60%66%59%55%69%57%66%66%63%62%63%65%62%
3341383716462828152821322318Don't know18%14%14%18%12%25%16%12%18%16%13%12%16%
1.991.862.032.121.891.981.941.931.941.961.971.941.96Mean
0.910.881.021.020.860.850.890.940.800.930.870.990.93Standard deviation0.070.060.070.080.080.070.070.070.090.020.090.080.02Standard error
Page 22
Ethics SurveyONLINE Fieldwork: 28th-29th January 2015
Absolutes/col percents
Table 12
Q.2 To what extent do you agree or disagree with each of the following statements?It is not the Government's place to make sure that big businesses act ethicallyBase: All respondents
Prepared by ComRes
Employment SectorSocial GradeAgeGenderPri-vatePublicDEC2C1AB65+55-6445-5435-4425-3418-24FemaleMaleTotal
84123750535460355845932435132227528910249962020Unweighted base
88724448044056054044030036034034024010309902020Weighted base
7242054083694614724172773032922561668498621711NET: Agree82%84%85%84%82%87%95%92%84%86%75%69%82%87%85%
40312022122924325923815317214714696432519952Strongly agree (4)45%49%46%52%43%48%54%51%48%43%43%40%42%52%47%
3218518814021821317912513114510970417343759Tend to agree (3)36%35%39%32%39%40%41%42%36%43%32%29%40%35%38%
501112262411372042415334073Tend to disagree (2)6%4%2%6%4%2%1%2%6%1%7%6%3%4%4%
75*2651-21566914Strongly disagree (1)1%2%*1%1%1%*-**1%2%1%1%1%
561612283116472252920384987NET: Disagree6%6%3%6%5%3%1%2%6%2%9%8%4%5%4%
107246043685119153542565414379222Don't know12%10%12%10%12%9%4%5%10%12%16%23%14%8%11%
3.443.453.493.503.423.493.553.513.463.473.393.383.443.513.47Mean
0.650.690.560.640.650.600.520.550.640.550.720.760.600.630.61Standard deviation0.020.050.030.040.030.030.020.030.040.030.050.050.020.020.01Standard error
Page 23
Ethics SurveyONLINE Fieldwork: 28th-29th January 2015
Absolutes/col percents
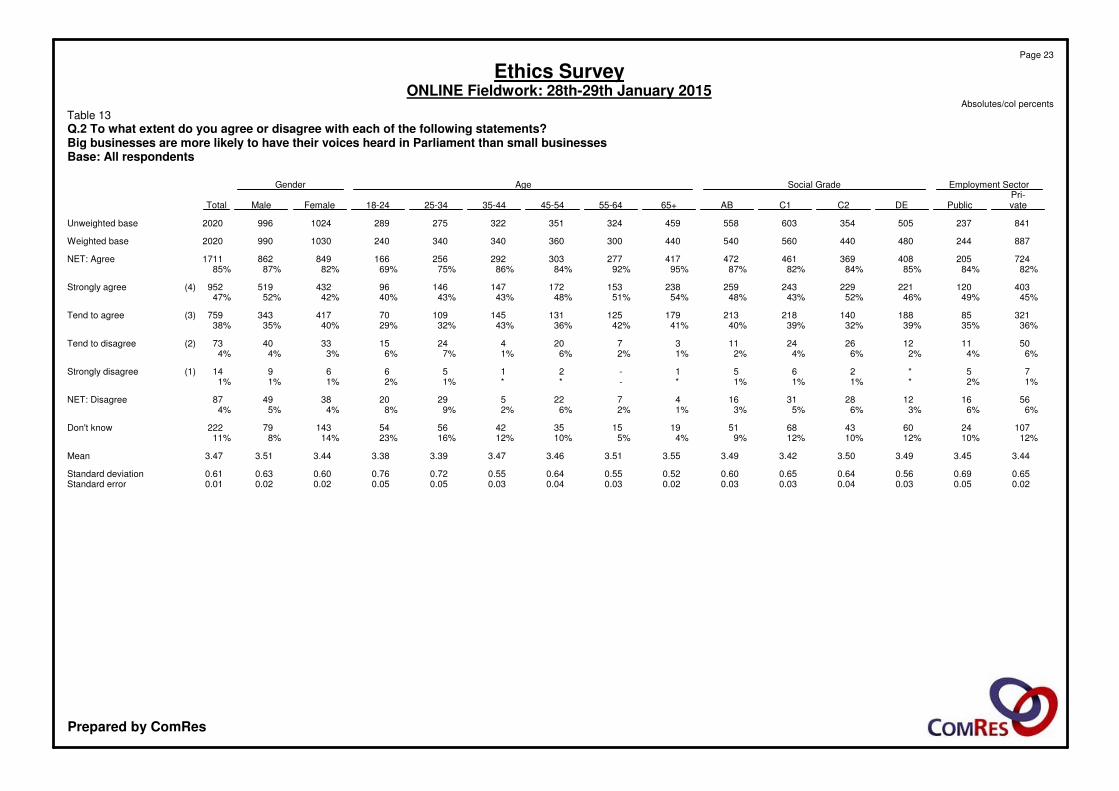
Table 13
Q.2 To what extent do you agree or disagree with each of the following statements?Big businesses are more likely to have their voices heard in Parliament than small businessesBase: All respondents
Prepared by ComRes

RegionYorkshire &
South WestSouth EastLondonEasternEast MidlandsWest MidlandsHumbersideNorth WestNorth EastNET: EnglandWalesScotlandTotal
1972852271891451821822328817271101832020Unweighted base
1822832632021411821822228117371011822020Weighted base
159238224163122147158188641462851641711NET: Agree87%84%85%81%86%81%87%85%79%84%84%90%85%
7914413186627679119298045296952Strongly agree (4)43%51%50%42%44%42%43%53%36%46%51%53%47%
8093947859717969356593368759Tend to agree (3)44%33%36%38%42%39%44%31%43%38%32%37%38%
3127116451036010373Tend to disagree (2)2%4%3%6%4%2%3%4%4%3%10%2%4%
2-4-22-4-14-114Strongly disagree (1)1%-1%-2%1%-2%-1%-*1%
51211118551437410387NET: Disagree3%4%4%6%6%3%3%6%4%4%10%2%4%
193328271230182013201615222Don't know10%12%11%14%8%17%10%9%17%12%6%8%11%
3.443.533.493.433.403.453.453.503.383.473.443.553.47Mean
0.590.590.640.610.660.600.560.680.580.620.680.550.61Standard deviation0.040.040.040.050.060.050.040.050.070.020.070.040.01Standard error
Page 24
Ethics SurveyONLINE Fieldwork: 28th-29th January 2015
Absolutes/col percents
Table 13
Q.2 To what extent do you agree or disagree with each of the following statements?Big businesses are more likely to have their voices heard in Parliament than small businessesBase: All respondents
Prepared by ComRes

Employment SectorSocial GradeAgeGenderPri-vatePublicDEC2C1AB65+55-6445-5435-4425-3418-24FemaleMaleTotal
84123750535460355845932435132227528910249962020Unweighted base
88724448044056054044030036034034024010309902020Weighted base
7021843923564494484102662902752461588328131645NET: Agree79%75%82%81%80%83%93%89%80%81%72%66%81%82%81%
3098219316417716416410013011912858357341698Strongly agree (4)35%34%40%37%32%30%37%33%36%35%38%24%35%34%35%
393102198193272284246166160157118100475472947Tend to agree (3)44%42%41%44%49%53%56%55%44%46%35%42%46%48%47%
42181724212691216102417384988Tend to disagree (2)5%7%3%5%4%5%2%4%4%3%7%7%4%5%4%
124545621525551520Strongly disagree (1)1%1%1%1%1%1%**1%1%2%2%1%1%1%
5422222726321112211229224464107NET: Disagree6%9%5%6%5%6%2%4%6%4%9%9%4%6%5%
1313866568560192250526460154113267Don't know15%16%14%13%15%11%4%7%14%15%19%25%15%11%13%
3.323.283.403.353.313.263.363.313.343.363.343.173.353.303.33Mean
0.650.690.630.640.600.610.550.560.650.590.720.710.590.650.62Standard deviation0.020.050.030.040.030.030.030.030.040.040.050.050.020.020.01Standard error
Page 25
Ethics SurveyONLINE Fieldwork: 28th-29th January 2015
Absolutes/col percents
Table 14
Q.2 To what extent do you agree or disagree with each of the following statements?Small businesses need more help to get their voices heard in ParliamentBase: All respondents
Prepared by ComRes
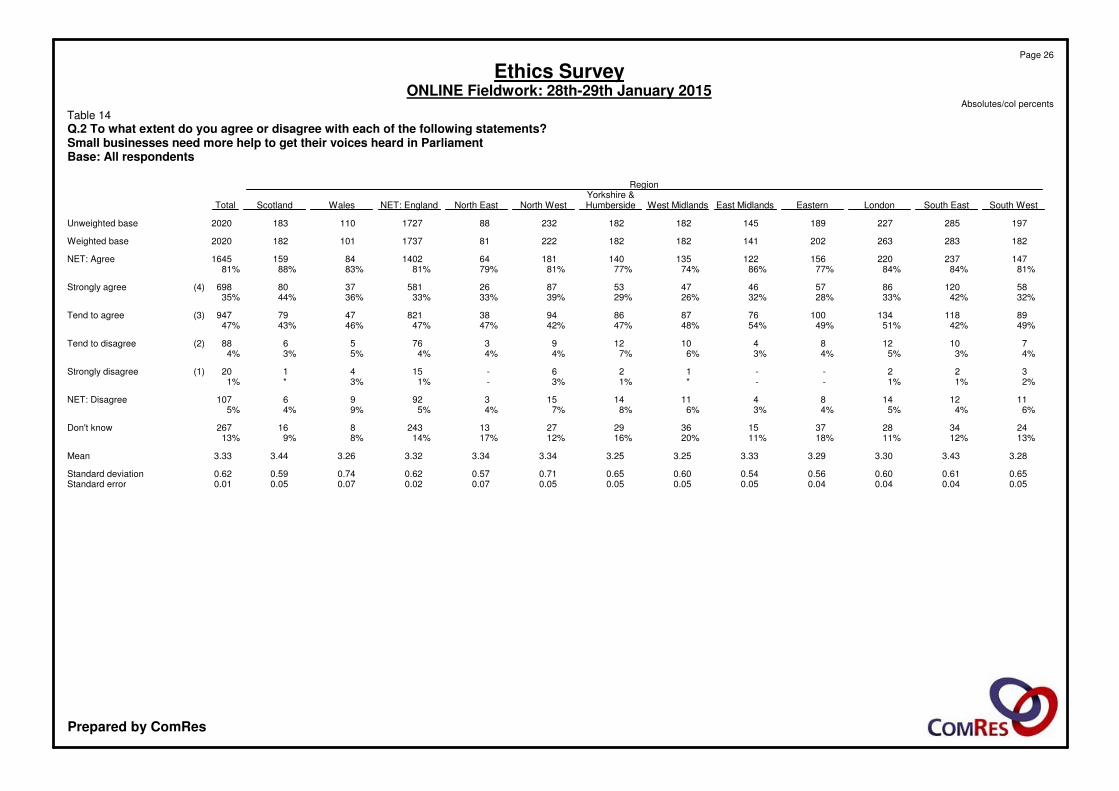
RegionYorkshire &
South WestSouth EastLondonEasternEast MidlandsWest MidlandsHumbersideNorth WestNorth EastNET: EnglandWalesScotlandTotal
1972852271891451821822328817271101832020Unweighted base
1822832632021411821822228117371011822020Weighted base
147237220156122135140181641402841591645NET: Agree81%84%84%77%86%74%77%81%79%81%83%88%81%
58120865746475387265813780698Strongly agree (4)32%42%33%28%32%26%29%39%33%33%36%44%35%
8911813410076878694388214779947Tend to agree (3)49%42%51%49%54%48%47%42%47%47%46%43%47%
7101284101293765688Tend to disagree (2)4%3%5%4%3%6%7%4%4%4%5%3%4%
322--126-154120Strongly disagree (1)2%1%1%--*1%3%-1%3%*1%
1112148411141539296107NET: Disagree6%4%5%4%3%6%8%7%4%5%9%4%5%
243428371536292713243816267Don't know13%12%11%18%11%20%16%12%17%14%8%9%13%
3.283.433.303.293.333.253.253.343.343.323.263.443.33Mean
0.650.610.600.560.540.600.650.710.570.620.740.590.62Standard deviation0.050.040.040.040.050.050.050.050.070.020.070.050.01Standard error
Page 26
Ethics SurveyONLINE Fieldwork: 28th-29th January 2015
Absolutes/col percents
Table 14
Q.2 To what extent do you agree or disagree with each of the following statements?Small businesses need more help to get their voices heard in ParliamentBase: All respondents
Prepared by ComRes