Embed Size (px)
Citation preview

Grant agreement no.: 218575 Deliverable report – WS G _ D 3.1
INESS_WS G_Deliverable 3.1_WS_Finalised_Report_Ver2009-03-16
Revision: 5 Security: Confidential – Consortium Only Page 1/24
FP7 Project 2007- Grant agreement n°: 218575
Project Acronym: INESS
Project Title: INtegrated European Signalling System
Instrument: Large-scale integrating project Thematic Priority: Transport
Document Title: INESS_WS G_Deliverable 3.1_Draft_Report_Ver2009-03-16
Due date of deliverable 2009-04-31 Actual submission date 2009-03-20
Deliverable ID: D.G.3.1 Deliverable Title: Process Description analysis report WP related: Methods and Tools for Safety Case Responsible partner: TUBS Task/Deliverable leader Name: Jörg R. Müller Contributors: Jörg R. Müller, Holger Kaumann Start date of the project: 01-10-2008 Duration: 36 Months Project coordinator: Paolo De Cicco Project coordinator organisation: UIC Revision: Dissemination Level1: CO
DISCLAIMER
The information in this document is provided “as is”, and no guarantee or warranty is given that the information is fit for any particular purpose. The user thereof uses the information at its sole risk and liability.
PROPRIETARY RIGHTS STATEMENT
This document contains information, which is proprietary to the INESS Consortium. Neither this document nor the information contained herein shall be used, duplicated or communicated by any means to any third party, in whole
or in parts, except with prior written consent of the INESS consortium.
1 PU: Public, PP: Restricted to other programme participants (including the Commission Services), RE: Restricted to a group specified by
the consortium (including the Commission Services), CO: Confidential, only for members of the consortium (including the Commission
Services).

Grant agreement no.: 218575 Deliverable report – WS G _ D 3.1
INESS_WS G_Deliverable 3.1_WS_Finalised_Report_Ver2009-03-16
Revision: 5 Security: Confidential – Consortium Only Page 2/24
Document Information
Document type: Deliverable Document Name: INESS_WS G_Deliverable 3.1_WS_Finalised_Report_Ver2009-03-16 Revision: 5 Revision Date: 2009-03-16 Author: Jörg R. Müller / TUBS Dissemination level: CO
Approvals
Name Company Date Visa
WP leader Jörg R. Müller TUBS
WS Leader Jörg R. Müller TUBS
Project Manager Emmanuel Buseyne UIC
Steering Board
Document history
Revision Date Modification Author
1 2009-01-
18 Overview over Desc. Means + Evaluation
Jörg R. Müller et. al.
2 2009-02-
08 Rewritten and Layout
Jörg R. Müller et. al.
3 2009-03-
10 Structure according to PMQP
Jörg R. Müller et. al.
4 2009-03-
15 Revised the whole document Jörg R. Müller
5 2009-03-
16 Reviewed document Holger Kaumann
TABLE OF CONTENTS
Chapter 1 – Executive Summary ............................................................................................................................. 5
1.1 The context of workstream G ........................................................................................................................ 5
1.2 The aim of work package G.3.1 ..................................................................................................................... 5
Chapter 2 – Introduction .......................................................................................................................................... 6
Chapter 3 – Process Description Analysis ............................................................................................................... 7
3.1 Preliminaries .................................................................................................................................................. 7

Grant agreement no.: 218575 Deliverable report – WS G _ D 3.1
INESS_WS G_Deliverable 3.1_WS_Finalised_Report_Ver2009-03-16
Revision: 5 Security: Confidential – Consortium Only Page 3/24
3.2 Requirement Indentification .......................................................................................................................... 7
3.3 Overview of potential and applicable means of description .......................................................................... 8
3.4 Result of the process description analysis ................................................................................................... 21
Chapter 4 – CONCLUSIONS ................................................................................................................................ 23
Chapter 5 – BIBLIOGRAPHY .............................................................................................................................. 24
Grant agreement no.: 218575 Deliverable report – WS G _ D 3.1
INESS_WS G_Deliverable 3.1_WS_Finalised_Report_Ver2009-03-16
Revision: 5 Security: Confidential – Consortium Only Page 4/24
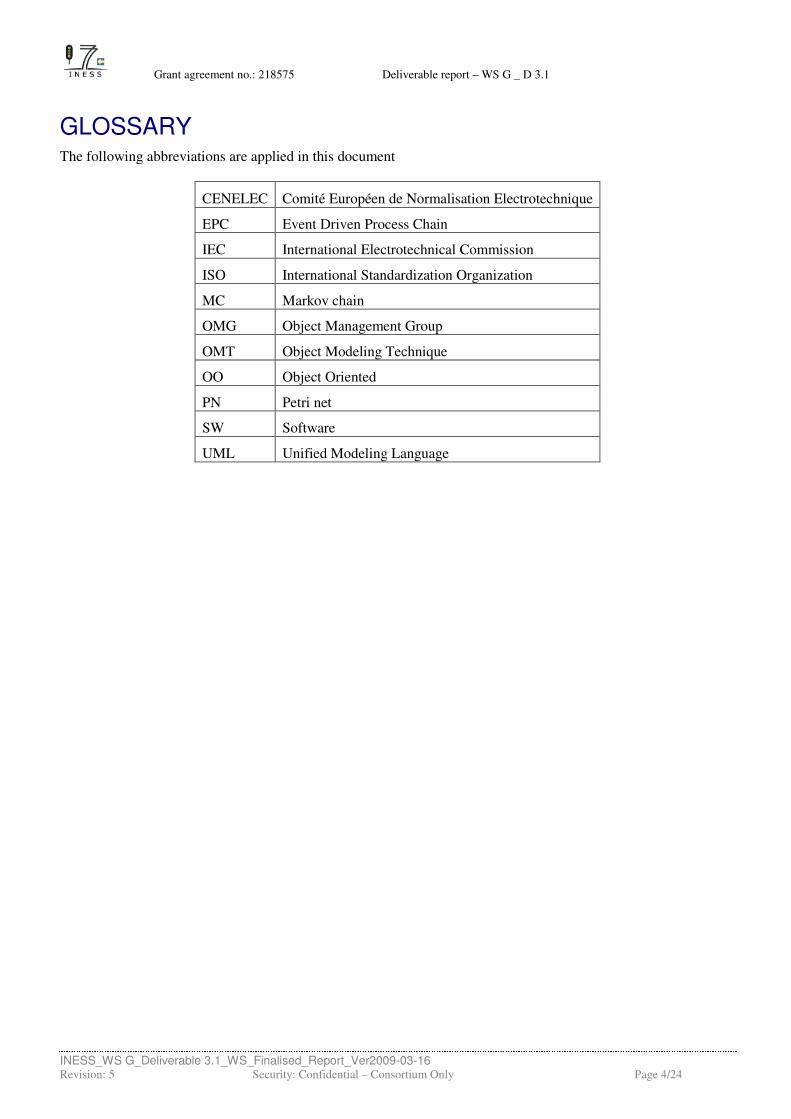
GLOSSARY The following abbreviations are applied in this document
CENELEC Comité Européen de Normalisation Electrotechnique
EPC Event Driven Process Chain
IEC International Electrotechnical Commission
ISO International Standardization Organization
MC Markov chain
OMG Object Management Group
OMT Object Modeling Technique
OO Object Oriented
PN Petri net
SW Software
UML Unified Modeling Language

Grant agreement no.: 218575 Deliverable report – WS G _ D 3.1
INESS_WS G_Deliverable 3.1_WS_Finalised_Report_Ver2009-03-16
Revision: 5 Security: Confidential – Consortium Only Page 5/24
Chapter 1 – Executive Summary
1.1 The context of workstream G
The aim of workstream G is to reduce time and money for the Safety Case in industry, i.e. operators as well as
suppliers, by avoiding unnecessary or redundant procedures. To achieve this aim one can identify four phases in
workstream G (see figure 1).
Workstream G:
Safety Case Process
Identify
Problems
Develop
Strategy
Implement
ToolValidate
Tool
Figure 1: One can specify four phases to achieve the aim of Workstream G
The first phase “identify problems” subsumes the following three tasks:
• G.3.1 Definition of Process Description Technologie
• G.1.1 Generic Safety Case process Model according to the CENELEC norms
• G.1.2 Collecting Users Experiences
After having identified (or defined) the technology to describe the Safety Case Process (task G.3.1), the Safety
Case Process Model according to the CENELEC norms is to be developed in a generic and formal way (task
G.1.1). On the basis of this model, the experiences as well as the interpretations of the norms are to be collected
(task G.1.2).
1.2 The aim of work package G.3.1
The aim of this work package is to identify a description technique that makes it possible to develop the normative
model of the Safety Case Process in a formal way (task G.1.1). In order to reach this objective, various commonly
used description technologies to describe processes were examined and evaluated against this specific application
background. In the end, Event Driven Process Chains (EPCs) were discovered to be the appropriate description
technique to reach this aim.
The forgone specified demands also hold for the description technology to model the improved Safety Case. Thus,
our evaluation against this background led to EPCs, too.

Grant agreement no.: 218575 Deliverable report – WS G _ D 3.1
INESS_WS G_Deliverable 3.1_WS_Finalised_Report_Ver2009-03-16
Revision: 5 Security: Confidential – Consortium Only Page 6/24
Chapter 2 – Introduction
The description of the processes, tasks and conditions in the CENELEC RAMS norms (EN 50126, EN 50128 and
EN 50129) has been done in natural language. In order to be able to develop a formal model of the Safety Case
Process, (see D.G.1.1) one has to identify
1. a formal language that is suitable for this specific scope,
2. a modelling-method that guides the transformation from the description given in natural language to a
description given as a formal model,
3. a SW-Tool that allows the use of the formal language given in 1 and supports the developed modelling-
method.
The methodological approach to formalise processes is characterised by the coordinated interaction of the formal
modelling language, the modelling method and the supporting tool.
Here we will focus on the evaluation of the formal language, considering the necessity of the availability of an
appropriate SW-tool. The respecitve modelling method is described in D.G.1.1.
The modelling language that is to be used to model the Safety Case Process in a formal way shall
• allow the unambiguous description of processes,
• support sequential as well as parallel processes,
• support the parallelisation as well as the synchronisation of processes,
• have appropriate tool support,
• be easy to understand by practitioners.
In order to reach this objective, various commonly used description technologies to describe processes were
examined and evaluated against these specific requirements.
After the definition of a means of description in section 3.1, the requirements are identified in 3.2. Section 3.3
gives an introduction and evaluation of various means of description, including natural language as well as various
UML-diagramms. In 3.4 the results of the evaluation are summarised.

Grant agreement no.: 218575 Deliverable report – WS G _ D 3.1
INESS_WS G_Deliverable 3.1_WS_Finalised_Report_Ver2009-03-16
Revision: 5 Security: Confidential – Consortium Only Page 7/24
Chapter 3 – Process Description Analysis
3.1 Preliminaries
Definition of means of description
A means of description describes determined facts (approaches, task specification, solutions etc.) in a graphical
form for visual perception and storage. Means of description are made up of symbols (e.g. alphanumeric characters
or other representative elements), as well as conventions concerning their combination (syntax). The individual
representative elements, their combinations and their categorisation are classified in a technical, more or less
explicitly and formally specified context according to certain conditions or concepts (semantics) (see [3], [10]).
According to this definition such differing languages as the (non-formal) natural language and the (formal)
language of Linear Algebra are equal.
Definition of formal means of description
In addition to general means of description, the formal means of description have a defined and complete syntax.
That means, all the possiblilities to combine the language’s symbols are determined in a set of rules. Therefore,
with “syntax checks” one can identify faulty structures of such models.
3.2 Requirement Identification
The analysation of descprition means is done against certain characteristics. These characteristics have to be
chosen against the requirements of the application area in focus. For example, one uses different languages to
describe a system in a way that permits the quantitative calculation of RAMS-values in a complex system and to
describe the static relations within this system (see [10]).
Therefore, a selection of the designated, qualitative characteristics and requirements for prioritisation are to be
consulted. The description means that is to be chosen shall make it possible to illustrate the following concepts:
Structure
The ability of the description means to model the structure of the process is one of the essential requiremts. In this
respect, the composition of a process made up of sub-processes that are related to each other and to the process’
environment are to be demonstrated. Graphical structures and illustrations seem to be appropriate to fulfil this
requirement.
Causality
Concerning causality, later states of the process can only be dependent on preceding states of the process. In
addition, the influence of earlier states is often described in a (stochastically) determined way.
Parallel processes
In parallel processes, events are causally independent.
Sequential processes
In sequential processes, events are causally dependent.

Grant agreement no.: 218575 Deliverable report – WS G _ D 3.1
INESS_WS G_Deliverable 3.1_WS_Finalised_Report_Ver2009-03-16
Revision: 5 Security: Confidential – Consortium Only Page 8/24
Consistency
The description means should be applicable to as many development phases as possible in order to avoid
information losses due to the changing of the means of description.
Analyzability
The structural accuracy and correctness of the illustrated process shall be verifyable.
Tool Support
Tools are to be available for the development of a model using the selected description means.
Interdisciplinary understanding
The means of description shall be easy to learn, and its representation easy to understand for practitioners from
different application areas (e.g. operators as well as suppliers).
Unambiguousness through clear symbolism
The meaning of the used symbols shall be unambiguous.
3.3 Overview of potential and applicable means of description
Stochastic processes, automata and Markov chains
If the states in a process that, starting by a specific initial state, can be reached with different probabilities, one
speaks about stochastic processes. The depiction of the individual states and follower states can be done in various
ways, e.g. in a graphical way by stochastic automata or with state-transition matrices. The stochastic state
transitions are specified by the respective individual state transition characteristics, like state transition
probabilities or rates.
Presuming that in the process to be modelled the respective follower state only depends on the current state and the
current state-transition probability, the state-transition distributions between states are negative-exponentially
distributed. That means the description of the present state fully captures all the information that could influence
the future evolution of the process in question. Stochastic automata that fulfil this property (also called the
“Markov property”) are called “Markov chains” (see Figure 1a). Markov chains (MCs) are named after Andrey
Andrejewitsch Markov (1856 - 1922), who was a Russian mathematician.
Figure 1a: A Markov Chain
Markov chains use a state-oriented language which is suitable only for the modelling of global conditions.
Primary area of Application
MCs are used primaryly in two areas of application: In the field of performance analysis, e.g. manufacturing,
communication and transportation systems or processes. Here, stochastic parameters like throughput, dwell time
etc. are described.

Grant agreement no.: 218575 Deliverable report – WS G _ D 3.1
INESS_WS G_Deliverable 3.1_WS_Finalised_Report_Ver2009-03-16
Revision: 5 Security: Confidential – Consortium Only Page 9/24
The purpose of using Markov models for (technical) reliability analysis is to determine e.g. the availability, the
probability of system failures or its lifetime [1]. For this, the system behaviour is specified based on state machines
using Markov models, whereas the individual states are assigned probability distributions. The probability for the
entry into a desired system state is calculated from this model.
Symbolism
States are represented by circles or with oval shapes and transitions are represented by arrows (see figure 1b).
Figure 1b: A global state (left) and a state connecting edge (right)
Normative Basis
The application and symbolism of the Markov chains is standardised in IEC 61165 – Application of Markov
techniques.
General Advantages and Disadvantages
Disregarding any specific fields of application, the following advantages and disadvantages can be identified (see
e.g. [1], [4] and [8]):
Advantages:
• Markov models use clear symbolism.
• The representation of sequential processes is possible.
• Markov models are well suited for understanding operating processes.
• There are commercial software tools available, which support the user with the modelling and computation
of probabilities.
Disadvantages:
• Markov models are not intuitively understandable.
• The use of Markov analyses for industrial sized models is critical, since state machines are often no longer
manageable when using a large number of state variables due to their complexity (state space explosion).
• Changes to the model require modifications of the state space representation. The fact that states in
Markov models always represent global states prevents the user from only changing local conditions, even
if these were isolated. As a result, minor changes in the system or process lead to major changes in the
respecitve model and thus to an increase in the probability for modelling errors.
• It is not possible to model the parallelisation nor synchronisation of processes.
Applicability of Markov chains in the field of Safety Case Process modelling
Markov chains are prevalently used within the scope of performance and reliability considerations. At this
juncture, the advantages of Markov chains, e.g. analysing of failure behaviour in an easy way (because of
exponential contribution of state transitions), have great effect. Modeling the Safety Case Process by using Markov
chains could also been taken into consideration particularly with regard to its explicit symbolism. But the problem
of the so called state space explosion, resulting from the inability to model local states and local state transitions in
favour of global states and global state transitions, seems to give a crucial reason not to use Markov chains for
modeling the considered Safety Case Process. In addition, the possibility to model the parallelisation and
synchronisation of processes seemed to be an essential requirement that can not be fulfilled with Markov chains.

Grant agreement no.: 218575 Deliverable report – WS G _ D 3.1
INESS_WS G_Deliverable 3.1_WS_Finalised_Report_Ver2009-03-16
Revision: 5 Security: Confidential – Consortium Only Page 10/24
Petri-nets
Petri nets (PNs) were defined in 1962 by Carl Adam Petri in his thesis „Kommunikation mit Automaten“. Petri
nets are a description means for the graphic modeling and analysis of discrete processes and systems (see e.g. [3]).
They can be used for the representation of all dynamic structures, e.g. material or information flows (see e.g. [11]).
There are two essential differences between Markov chains and Petri nets: The first is that the Petri nets allow to
diffenrentiate between local and global states and state transitions. Global states are defined by a number of local
states, which in turn allow to model local state transitions. This diffenrentiation implies some majour advantages:
The state-space explosion problem does not arise here and the paralellisation as well as the sychronisation of
processes can easily be modelled. In addition, local changes of parameters (of the process) can be taken into
account locally, too. For these reasons, PNs are sometimes called “living construction plans”.
The second is that the probabilities of the (local) state transitions may be arbitrarily defined, i.e. Petri nets do in
general not fulfil the Markov property. Presuming that all state transitions are defined with negative-exponentially
distributions, one can show that PNs are isomorph to MCs.
Primary Area of Application
Petri nets can be used to model the behaviour of almost all kinds of systems. They have proved particularly useful
to model processes of communication systems, production systems, transportation systems and for system
reliability in general (see e.g. [3]). The aim for applying Petri nets to the above described technical areas is the
determination of dynamic behavior properties for sometimes very complex systems.
Symbolism
Local states and state-transitions are represented by places (circles) and transitions (bars, rectangulars). Connecting
directed arcs (arrows) between places and transitions model the logical-dynamic link between state combinations
for the operation of state transitions and the resulting subsequent state (see figure 2). The behaviour of the system
can be illustrated through a so called “tokengame” based on the transition firing rule (see e.g. [11]). This “game”
allows to reveal modelling errors in early stages of the model.
Figure 2: An unmarked local state, a marked local state, a local transition and a relation between a state and a transition (from left to right)
Normative Basis
Petri-nets are internationally standardised in IEC 15909 - Software and System Engineering - High level Petri nets.
In addition, a guide to use PNs in dependability modelling is currently being developed (CD 1 of IEC 62551 –
Analysis techniques for dependability – Peri net modelling).
General Advantages and Disadvantages
Disregarding any specific fields of application, the following advantages and disadvantages can be identified (see
e.g. [11]):
Advantages:
• The dynamics of systems can be modelled and visualised through the tokengame.
• PNs are applicable for the analysis of (complex) industrial sized systems.

Grant agreement no.: 218575 Deliverable report – WS G _ D 3.1
INESS_WS G_Deliverable 3.1_WS_Finalised_Report_Ver2009-03-16
Revision: 5 Security: Confidential – Consortium Only Page 11/24
• They allow to differentiate between local and global system states and therefore the representation of
sequential as well as parallel processes, and for the same reason the parallelisation and the synchronisation
of processes.
• The mathematical Petri-net theory is thoroughly elaborated; a broad range of analysation methods are
available.
• Various net types allow the integration of time and value concepts (deterministic, stochastic, continuous,
fuzzy).
• PNs allow the development of modular and hierarchical models.
Disadvantages:
• Petri nets are not intuitive for “newcomers”. In general, training courses are necessary to familarize the
staff members with PNs.
• There is no matured tool available.
Applicability of Petri nets in the field of Safety Case Process modelling
Petri nets are often found in similar fields of application like Markov chains; however Petri-nets are also suitable to
depict concurrent processes. Another advantage of Petri nets evolves from the fact that they are not restricted to
exponential distributed firing times of transitions. Due to these advantages and its well defined symbolism, the
Safety Case process modelled by the use of Petri nets. However, Petri nets are still quite unknown in the railway
sector. To make matters worse, there is no major tool support that would allow the handling of complex processes.
Natural language
The natural language is the most essential means of thinking and communication. As the linguistics deals with the
knowledge representation by natural language, strategies have been developed to analyse and describe the objects
of the linguistical examination. The linguistic description of technical circumstances with the help of fuzzy sets
and logic is a well-known example.
Primary Area of Application
In early phases of a project, natural speech is the most important communication medium. In this phase, it serves to
generate a common understanding of the project’s goals, restrictions etc.
Symbolism
The characteristic symbols for natural speech are given by the alphabet – audible as well as visible. There are
different representations which depend on the countries, e.g. Russia, China and Germany use very different
symbols for representing their natural language.
Normative Basis
For natural languages, a semi standard is given in the national grammar found in dictionaries.
General Advantages and Disadvantages
Disregarding any specific fields of application, the following advantages and disadvantages can be identified (see
e.g. [11]):
Advantages:
• It has a high degree of freedom.
• It is the most used language in the world.

Grant agreement no.: 218575 Deliverable report – WS G _ D 3.1
INESS_WS G_Deliverable 3.1_WS_Finalised_Report_Ver2009-03-16
Revision: 5 Security: Confidential – Consortium Only Page 12/24
• Major tool support is available.
Disadvantages:
• The content behind terms and definitions is often interpretable, i.e. ambiguous.
• There is no well defined symbolism, e.g. there are synonyms (same word, but different meaning),
homonyms (same sound of word, but different meaning).
• Therefore, it is prone to errors, misunderstandings and inconsistencies.
Applicability of natural language in the field of Safety Case Process modelling
The Safety Case Processes are described in natural language in the CENELEC standards EN 50126, EN 50128 and
EN 50129. An additional specification of this process in natural language would not lead to any improvement, but
rather lead to an enlargement of impreciseness in the process description. For this reason, the application of natural
language does not fulfil the requirements.
UML Diagrams in General
The abbreviation UML stands for “Unified Modeling Language”. This denotation is misleading in a way, because
UML defines a set of 13 official diagram types, each of which can be regarded as a language on its own. In the
time before UML had been invented, there existed over 50 different graphic notations for object oriented-
applications (oo-applications). In October 1994, Jim Rumbaugh, the inventor of the Object Modeling Technique
(OMT), and Grady Booch, inventor of the Booch method, started to harmonise their approaches. One year later
Ivar Jacobson joined the two and brought in his Objectory Method. These three protagonists tried to arrange the
clarification of the world of the object-oriented development, which, roughly spoken led to a unification of the
diagrams invented by them. Under the lead of the Object Management Group (OMG Group), which is a
consortium of over 800 companies, an agreement for a collection of notations could be reached in November 1997.
Since then, the UML Revision Task Force from OMG has worked on revising the UML. In 2003 the current
version of UML (UML 2.0) could be finalized (see [2]).
The diagrams of UML are graphical languages, just as Markov chains or Petri nets. The diversity of diagram-types
allows to model the static relations of systems, the information flow within a system or the interaction of the
system with its environment (e.g. the user of the system).
Primary Area of Application
The origin of UML lies in the specification of software requirements, its architectures and behaviour. Due to its
versatility, UML can be applicated in all phases of software development. Nowadays, some of the diagram types
are used in many fields, not only in software requirement specification.
Figure 3 shows a class diagram specifying the various diagram types and their relations to each other. The dark-
grey shaded diagram types will be explained in detail in the following chapters.

Grant agreement no.: 218575 Deliverable report – WS G _ D 3.1
INESS_WS G_Deliverable 3.1_WS_Finalised_Report_Ver2009-03-16
Revision: 5 Security: Confidential – Consortium Only Page 13/24
Diagram
Structur
Diagramm Behaviour-
Diagram
Package
Diagramm
Object
Diagramm
Deployment
Diagramm
Class
Diagramm
Composite
Structure
Diagram
Component
Diagram
Activity Diagram
Interactions
Diagram
Use-Case-
Diagramm
Protokoll-
Zustands-
Diagramm
State Machine
Diagram
Interaction
Overview
Diagram
Sequence
DiagramTiming Diagram
Communications
Diagram
Figure 3: UML class diagram depicting the relations between the 13 UML-diagram types
Class Diagrams
A class in the context of SW engineering specifies a set of variables and methods (functions) that belong in some
way to each other. In any other than a SW engineering context, classes specify types of general objects (e.g. the
class “car” in contrast to a specific car).
Primary Area of Application
Class diagrams rank among the most important UML diagrams. They are often used in order to get an overview of
a system or to better depict the relations and dependencies with other diagram types, such as Use Cases (see
below). They show the static structure and relations of classes within a system. One gets a good overview of who
(which class or classes) is related to whom (which class) and what (the whole operations) they can do. The
relations may be associations, aggregations or generalisations.
Symbolism
Class Diagrams mainly use rectangular boxes to model classes and (directed) arcs to model the various relations
(associations, aggregations or generalisations) between them. These arcs can be annotated with further
explanations, for example with specific roles or cardinalities (see figure 4a-4g).
Figure 4a: A class consists of attributes (parameters) and operations (functions)

Grant agreement no.: 218575 Deliverable report – WS G _ D 3.1
INESS_WS G_Deliverable 3.1_WS_Finalised_Report_Ver2009-03-16
Revision: 5 Security: Confidential – Consortium Only Page 14/24
Figure 4b: Arcs between classes indicate associations
Figure 4c: Directed arcs indicate the direction of the relation
Klassenname Klassenname
0..* 1..*
Client CrashDummyrents
Figure 4d: Cardinalities indicate the respective number of classes that are related
Figure 4e: Roles indicate the class’ context
Figure 4f: Inheritances allow the compact description classes with commonalities
Figure 4g: Aggregations (left) and compositions (right) allow the clearly arranged depiction of complex systems
General Advantages and Disadvantages
Disregarding any specific fields of application, the following advantages and disadvantages can be identified:
Advantages:
• Class diagrams give a good overview of the static relations of a system.
• They often serve as a basis to represent the connections of different diagram types.
• Shows associations between classes
Grant agreement no.: 218575 Deliverable report – WS G _ D 3.1
INESS_WS G_Deliverable 3.1_WS_Finalised_Report_Ver2009-03-16
Revision: 5 Security: Confidential – Consortium Only Page 15/24
Disadvantages:
• The system’s evolution and its processes cannot be modelled.
• Cardinalities may be time dependent.
As the language to be identified has to make it possible to model the Safety Case Process, class diagrams are not
the appropriate description means.
Use Cases
Primary Area of Application
Use-Cases and the associated diagrams are used in UML as aids to develop user-specific requirements, to represent
user goals and wishes and to specify the required system behaviour [2]. This way, the interaction of the system
with its environment is specified. This type of representation allows a conscious decoupling of the design and
behaviour of a system, and gives an overview concerning the way the actors initiate the Use Case and who is
involved in the Use Case. This diagram type is suitable for the modelling of business processes according to [9].
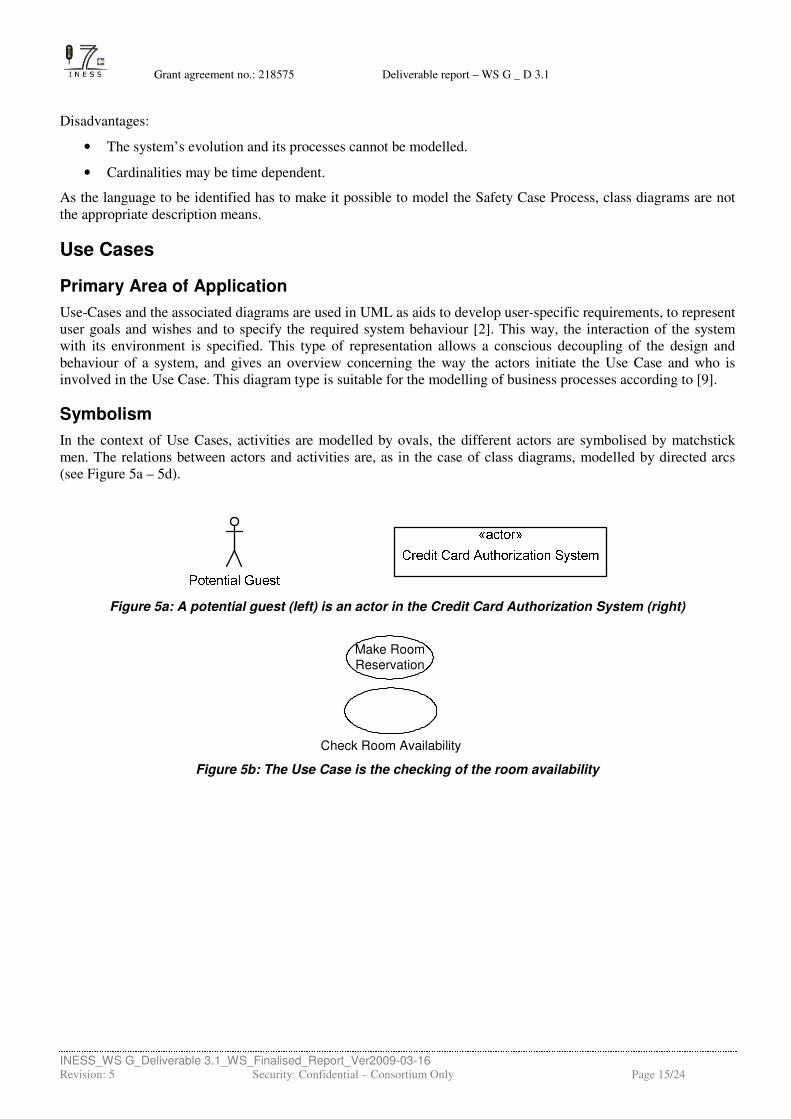
Symbolism
In the context of Use Cases, activities are modelled by ovals, the different actors are symbolised by matchstick
men. The relations between actors and activities are, as in the case of class diagrams, modelled by directed arcs
(see Figure 5a – 5d).
Figure 5a: A potential guest (left) is an actor in the Credit Card Authorization System (right)
Figure 5b: The Use Case is the checking of the room availability
Make RoomReservation
Check Room Availability

Grant agreement no.: 218575 Deliverable report – WS G _ D 3.1
INESS_WS G_Deliverable 3.1_WS_Finalised_Report_Ver2009-03-16
Revision: 5 Security: Confidential – Consortium Only Page 16/24
Potential Guest
«actor»
Credit Card Authorization System
<<system>>
Hotel Reservation
Make Room
Reservation
Check Room Availability
Cancel Room Reservation
1
1
1
1
1
0..1
0..1
0..1
0..*
0..*
Figure 5c: Cardinalities can be used the same way as in class diagrams
Figure 5d: Generalisations of actors (left) and Use Cases (right) allow a compact representation – just as in class diagrams
General Advantages and Disadvantages
Disregarding any specific fields of application, the following advantages and disadvantages can be identified:
Advantages:
• The user-specific requirements and wishes can be illustrated.
• The design and the behaviour of the system are decoupled.
• Adequate to specify the fundamental systems requirements.
Disadvantages:
• There is no real structure in the illustration.
• The parallelisation or synchronisation is not depictable.
As it has been indicated, that the ability to model parallelisations and synchronisations are of great importance,
Use Cases do not fulfil the required possibilites.
Applicability of Use-Cases in the field of Safety Case Process modelling

Grant agreement no.: 218575 Deliverable report – WS G _ D 3.1
INESS_WS G_Deliverable 3.1_WS_Finalised_Report_Ver2009-03-16
Revision: 5 Security: Confidential – Consortium Only Page 17/24
The advantage of Use Cases is their support of interdisciplinary understanding. But unfortunately, one has to state
that the structure of a system is not adequately depictable.
Sequential Diagram
Primary Area of Application
Sequence diagrams allow the user to describe how the various objects within a system or process interact in order
to reach a goal. In their simplest form, sequence diagrams represent the life line of the participating objects,
showing how messages are exchanged between them in a given scenario. Above all, the life line represents the
influences on the life of an object, where important influential events are visualised. These diagrams are used to
visualise the flow in Use Cases, and also to clarify the flow of messages between objects.
Likewise, this task can be fulfilled by communication diagrams, activity diagrams and timing diagrams, which will
not be further explained here.
Symbolism
Sequential diagrams symbolise the flow of messages between objects by directed arcs with various arrow heads.
These heads specify different characteristics like synchronous / asynchronous message passing. In these diagrams,
the time (i.e. the life-line) proceeds from the top of a diagram to the bottom (see figure 6a – 6c).
Figure 6a: An object with its life-line; the time runs from top to bottom
Figure 6b: Depiction of a synchronous (left) and an asynchronous call of operation (right)
Figure 6c: An interruption of an object (left) and a return call (right)
General Advantages and Disadvantages
Disregarding any specific fields of application, the following advantages and disadvantages can be identified:
Advantages:
• Sequential diagrams are easy to draw.

Grant agreement no.: 218575 Deliverable report – WS G _ D 3.1
INESS_WS G_Deliverable 3.1_WS_Finalised_Report_Ver2009-03-16
Revision: 5 Security: Confidential – Consortium Only Page 18/24
• They are easy to understand and therefore able to support the (interdisciplinary) communication.
• The understanding of the interaction between objects due to the exchange of messages can be improved.
Disadvantages:
• Sequential diagrams can get complex very quickly.
Sequential diagrams lack a consistent syntax, the freedom of developing such a diagram on the one hand may lead
on the other hand to ambiguouties and inconsitencies.
Applicability of Sequential Diagrams in the field of Safety Case Process modelling
With respect to modelling the Safety Case Process, sequential diagrams allow the depiction of various processes as
well as causality. They are not adeqate to illustrate the structure of the system. In addition, in interdisciplinary
teams, the understanding could be a problem
Activity Diagrams
Activity diagrams are similar to Petri nets. Contrary to PNs, however, they differ between the control and the
object flow, but lack a mathematical basis.
Primary Area of Application
Activity diagrams can be used when the order of processes needs to be clarified. They are used to model object
flows, data flows or supervising routines between different classes. Apart from modelling flows and processes,
activity diagrams are suitable to model business processes. Using this diagram type, one can see which activities
are being carried out, which decisions must be made and which document is being generated by a given business
process. Just as sequence diagrams clarify Use Cases, activity diagrams clarify the complex behaviour of Use
Cases for concurrently running processes. This concurrency is easily monitored using activity diagrams.
Symbolism
Some of the symbols used in activity diagrams are similar to those of Petri-nets.
Figure 7a: An activity with its name (left) and a state (right)
Figure 7b: The control flow only considers the activities of a process
Figure 7c: The object flow considers the states that are reached through executing the activities

Grant agreement no.: 218575 Deliverable report – WS G _ D 3.1
INESS_WS G_Deliverable 3.1_WS_Finalised_Report_Ver2009-03-16
Revision: 5 Security: Confidential – Consortium Only Page 19/24
Figure 7d: The control nodes: initial node, final activity node, final-follow node and decision/merge node (from left)
Figure 7e: Parallelisations (left) and synchronisations (right) can be visualised
General Advantages and Disadvantages
Disregarding any specific fields of application, the following advantages and disadvantages can be identified:
Advantages:
• The depiction of object and data flow is possible.
• Parallelisations and synchronisations can be modelled.
Disadvantages:
• The symbolism is more complicated than in other languages.
The differentiation between an object and a data flow is advantageous when a differentiation between these flows
is actually needed; otherwise it only leads to difficulties in understanding among practitioners.
Applicability of Activity Diagrams in the field of Safety Case Process modelling
Activity Diagrams support the modelling of the Safety Case Process in many ways. Only the symbolism and in
turn the (interdisciplinary) understanding could bear problems.
General Advantages and Disadvantages of UML Diagramms
At this point, pros and cons are shown which refer to the entire UML, i.e. the various diagram types in general (see
e.g. [2], [5] and [6]).
Advantages:
• As UML-diagrams are widely used, it is easy to exchange models.
• The various diagram types constitute an efficient means of communication.
• It is possible to integrate the different diagram types.
Disadvantages:
• The UML is criticised regarding semantic inconsistencies, ambiguities and inadequate notations.
• The high complexity of the language (for example the language specification covers more than 1200
pages) causes difficulties in its application and understanding (especially for practitioners).
• So far no tools are available which fully support the language standard.
• The staff will need extensive training.
• The integration of diagrams can lead to confusion.

Grant agreement no.: 218575 Deliverable report – WS G _ D 3.1
INESS_WS G_Deliverable 3.1_WS_Finalised_Report_Ver2009-03-16
Revision: 5 Security: Confidential – Consortium Only Page 20/24
Normative Basis
The International Standardization Organization (ISO) has not yet standardised version 2.0 of UML.
Applicability of the UML diagrams in the field of Safety Case Process modelling
The UML provides different diagram types which in combination allow the representation of the Safety Case
Process in a very detailed way. However, the plurality of diagram types and the possibilities to combine them
demands comprehensive skill and practice in every diagram type. As a matter of fact, one single means of
description of the UML does not suffice to represent the Safety Case Process in an adequate manner. Therefore,
the UML is not applicable for the application being considered.
Event-driven Process Chains
The event-driven process chain (EPC) is a widely used description means for the representation of business
processes. It was developed in 1992 by a work group under the leadership of August Wilhelm Scheer at the
“Universität des Saarland in Saarbrücken” in Germany. EPCs are the youngest description means that are
presented here.
Primary Area of Application
EPC is applied primarily in the following areas (see [12]):
• Safety-oriented modelling of business processes
• Depiction of activities through user training
• Analysis and optimisation of business processes simulation of workflows
• Process documentation according to ISO 900X
Primarily, EPCc are used for the safety-oriented modelling of business processes.
Symbolism
In event-driven process chains one differs in general between “activities” (i.e. functions, events and process paths)
and logical operators. The relation between the elements modelled with these nodes is described by directed arcs
(see figure 8).
Figure 8a: The essential nodes are functions (left) and events (right)
V
XOR
Figure 8b: The logical connectors: AND (left), OR (middle) and XOR (right)
Normative basis
EPCs are not standardised yet.
General Advantages and Disadvantages
Disregarding any specific fields of application, the following advantages and disadvantages can be identified:
Advantages:
• EPCs are very intuitive to develop and understand, even interdisciplinary ones.
• Their symbolism is unambiguous.
Grant agreement no.: 218575 Deliverable report – WS G _ D 3.1
INESS_WS G_Deliverable 3.1_WS_Finalised_Report_Ver2009-03-16
Revision: 5 Security: Confidential – Consortium Only Page 21/24
• The depiction of sequential as well as parallel processes is possible.
• There exists a very comprehensive tool support: I.e. open source tools as well as major commercial tools
(bflow and Microsoft Visio, respectively).
Disadvantages:
• There is no normative basis yet.
Applicability of EPCs in the field of Safety Case Process modelling
EPCs are characterised by a limited set of distinct symbols. This limitation supports the interdisciplinary
understanding of such diagrams. In addition, this limitation does not derogate the modelling possibilities needed to
develop the Safety Case Process model. The parallelisation as well as the synchronisation of processes can easily
be described.
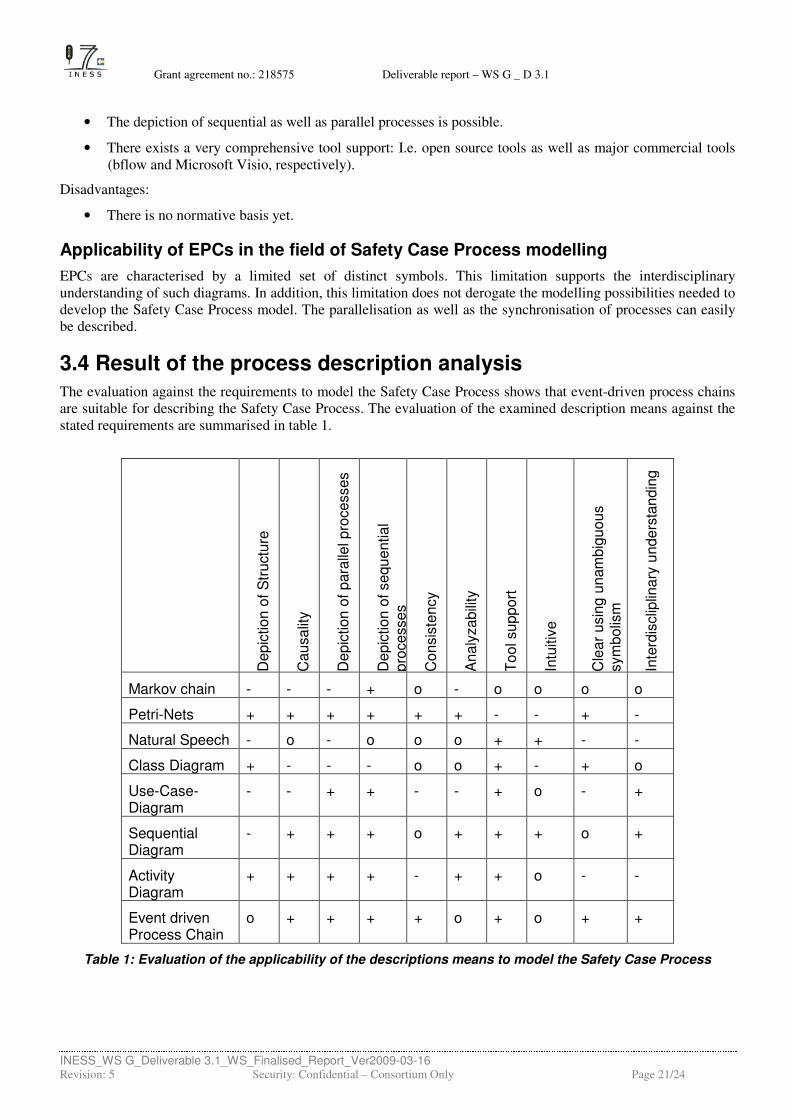
3.4 Result of the process description analysis
The evaluation against the requirements to model the Safety Case Process shows that event-driven process chains
are suitable for describing the Safety Case Process. The evaluation of the examined description means against the
stated requirements are summarised in table 1.
Depic
tion o
f S
tructu
re
Causalit
y
Depic
tion o
f para
llel pro
cesses
Depic
tion o
f sequential
pro
cesses
Consis
tency
Analy
zabili
ty
Tool support
Intu
itiv
e
Cle
ar
usin
g u
nam
big
uous
sym
bolis
m
Inte
rdis
clip
linary
unders
tandin
g
Markov chain - - - + o - o o o o
Petri-Nets + + + + + + - - + -
Natural Speech - o - o o o + + - -
Class Diagram + - - - o o + - + o
Use-Case-Diagram
- - + + - - + o - +
Sequential Diagram
- + + + o + + + o +
Activity Diagram
+ + + + - + + o - -
Event driven Process Chain
o + + + + o + o + +
Table 1: Evaluation of the applicability of the descriptions means to model the Safety Case Process

Grant agreement no.: 218575 Deliverable report – WS G _ D 3.1
INESS_WS G_Deliverable 3.1_WS_Finalised_Report_Ver2009-03-16
Revision: 5 Security: Confidential – Consortium Only Page 22/24
EPC should be selected since this project group is an interdisciplinary work group and EPCs are very widely used
in the area of business processes which does seem to be related to the Safety Case Process.

Grant agreement no.: 218575 Deliverable report – WS G _ D 3.1
INESS_WS G_Deliverable 3.1_WS_Finalised_Report_Ver2009-03-16
Revision: 5 Security: Confidential – Consortium Only Page 23/24
Chapter 4 – CONCLUSIONS
In this document, at first an introduction to the topic of the means of description was given. After that, the
requirements for a description means adequate to model the Safety Case Process were identified. In the following,
various description means were introduced and have been evaluated in general as well as against the specific
requirements.
This way, EPCs were identified as the description means that suit the requirements to model the Safety-Case
Process best. The advantage of EPC compared to the other presented description means is their prevalence, their
awareness level and that well-known, reliable tools for the users to develop an EPC with exist (e.g. MS Visio).
In the following, EPCs will be used to model the Safety-Case Process in (quite) a formal and user-friendly way
(task 1.1).

Grant agreement no.: 218575 Deliverable report – WS G _ D 3.1
INESS_WS G_Deliverable 3.1_WS_Finalised_Report_Ver2009-03-16
Revision: 5 Security: Confidential – Consortium Only Page 24/24
Chapter 5 – BIBLIOGRAPHY
[1] Bertsche, B.; Lechner, G.: Zuverlässigkeit im Fahrzeug- und Maschinenbau, Springer-Verlag, 2004
[2] Chonoles M.J., Schardt, J. A.; UML 2 für Dummies, Wiley-VCH, 2003
[3] Chouikha, M.: Entwurf diskret-kontinuierlicher Steuerungssysteme - Modellbildung, Analyse und Synthese mit
hybriden Petrinetzen; Dissertation, Braunschweig, VDI-Verlag, 1999
[4] Ericson, C.A.: Hazard Analysis Techniques for System Safety, Wiley&Sons, 2005
[5] Fettke, Peter (2005): Unified Modeling Language. In: Mehdi Khosrow-Pour (Hrsg.): Encyclopedia of
Information Science and Technology, Volume I-V. Idea: Hershey, PA, USA, et al., 2005, S. 2921-2928.
[6] Fettke, Peter: Enzyklopädie der Wirtschaftsinformatik Online-Lexikon, UML-basierte Modellierung
http://www.oldenbourg.de:8080/wi-enzyklopaedie/lexikon/is-management/Systementwicklung/Hauptaktivitaten-
der-Systementwicklung/Problemanalyse-/Objektorientierte-Modellierung/UML-basierte-Modellierung (Last call:
03.01.2009)
[7] Kaiser, B., Gramlich, C., Förster, M.: State-Event Fault Trees – A Safety Analysis Model for Software
Controlled Systems
[8] Mahmoud, R.: Sicherheits- und Verfügbarkeitsanalyse komplexer Kfz-Systeme, Dissertation, Siegen, 2000
[9] http://www.sigs-datacom.de/sd/publications/os/1998/02/OBJEKTspektrum_UM_kompakt.htm, Last call:
01/2009
[10] Schnieder, Eckehard: Methoden der Automatisierungstechnik; Vieweg Verlag
[11] N.A. Wikipedia – The Free Encyclopedia, Last call: 01/2009