Embed Size (px)
Citation preview
Semi-Annual ReportNovember 30, 2018
AI Powered Internati onal Equity ETFTicker: AIIQ
Beginning on January 1, 2021, as permitted by regulations adopted by the U.S. Securities and Exchange Commission, paper copies of the Fund’s shareholder reports will no longer be sent by mail, unless you specifically request paper copies of the Fund’s reports from your financial intermediary, such as a broker-dealer or bank. Instead, the reports will be made available on a website, and you will be notified by mail each time a report is posted and provided with a website link to access the report.
If you already elected to receive shareholder reports electronically, you will not be affected by this change and you need not take any action. Please contact your financial intermediary to elect to receive shareholder reports and other Fund communications electronically.
You may elect to receive all future reports in paper free of charge. Please contact your financial intermediary to inform them that you wish to continue receiving paper copies of shareholder reports and for details about whether your election to receive reports in paper will apply to all funds held with your financial intermediary.
AI Powered International Equity ETF
TABLE OF CONTENTS
Page
Letter to Shareholders ....................................................................................... 1
Performance Summary ...................................................................................... 3
Portfolio Allocation ............................................................................................ 4
Schedule of Investments ................................................................................... 5
Statement of Assets and Liabilities ................................................................... 11
Statement of Operations ................................................................................... 12
Statement of Changes in Net Assets ................................................................. 13
Financial Highlights ........................................................................................... 14
Notes to Financial Statements .......................................................................... 15
Expense Example ............................................................................................... 22
Approval of Advisory Agreements & Board Considerations ............................. 23
Information About Portfolio Holdings ............................................................... 27
Information About Proxy Voting ....................................................................... 27
Frequency Distribution of Premiums and Discounts ......................................... 28
Information About the Trustees ........................................................................ 28
1
AI Powered International Equity ETF
To Our AIIQ Shareholders,
We faced historically challenging market conditions to close out the year in Q4. Headwinds from ongoing China trade war discussions negatively impacted global technology and telecom related positions. Uncertainty revolving around Brexit and US Healthcare policy heavily detracted from financial and pharmaceutical exposures relative to benchmark indices.
From a market capitalization perspective AIIQ’s underweight to large cap stocks also diminished performance returns as broad market fears punished smaller companies during the December selloff.
The good news in the portfolio came early in the quarter from well-timed trades in the oil and pharmaceutical industries from names like Ensco PLC and Amarin Corporation. Unfortunately, these gains were subsequently offset to reduce risk from mining and industrial positions like Goldcorp Inc. and Ryanair Holdings later in the quarter.
The EquBot AI platform still predicts additional market volatility in 2019 off the back of the ongoing US Government partial shutdown and reduced demand for global goods from China. The volatility tends to drive higher average cash balances in the portfolio and continued exposure to gold related and consumer staple names like Kirkland Lake Gold and Nestle while strategically investing in new positions at cheaper levels.
More volatility can lead to more data and more data can lead to better AI predictions. Although there are still a lot of uncertainties in 2019 we can say with the highest conviction that there will be more data this year and that AI is an important tool that can appropriately handle the data load. As a result, we designed our AI powered portfolio vehicle to help ride out these turbulent markets. The engine behind AIIQ continues to evolve through machine learning and we are encouraged to see the increases in volume of data processed. We believe the ability to learn and consume more market data and produce a portfolio in an unbiased manner can serve as a competitive advantage to uncover opportunities in 2019.
Past performance does not guarantee future results.
Must be preceded or accompanied by a prospectus.
For a complete list of Fund holdings please see the schedule of investments in this report. Fund holdings and sector allocations are subject to change and should not be considered a recommendation to buy or sell any security.
Investing involves risk, including the possible loss of principal. Shares of an ETF are bought and sold at market price (not NAV), may trade at a discount or premium to NAV and are not individually redeemed from the Fund. Brokerage commissions will reduce returns. Narrowly focused investments typically exhibit higher volatility. The equity securities held in the Fund’s portfolio may experience sudden, unpredictable drops in value or long periods of decline in value. This may occur because of factors that affect securities markets generally or factors affecting specific issuers, industries, or sectors in which the Fund invests such as political, market and economic developments, as well as events that impact specific issuers. The Fund is actively-managed and may not meet its investment objective based on the success or failure of the

2
AI Powered International Equity ETF
Equbot Model to identify investment opportunities. The portfolio managers may actively and frequently trade securities or other instruments in the Fund’s portfolio to carry out its investment strategies. A high portfolio turnover rate increases transaction costs, which may increase the Fund’s expenses. Some of the models used by the Adviser for the Fund are predictive in nature. The use of predictive models has inherent risks. When Models and Data prove to be incorrect or incomplete, any decisions made in reliance thereon expose the Fund to potential risks. For example, by relying on Models and Data, the Adviser may be induced to buy certain investments at prices that are too high, to sell certain other investments at prices that are too low, or to miss favorable opportunities altogether. Similarly, any hedging based on faulty Models and Data may prove to be unsuccessful.
The AI Powered International Equity ETF is distributed by Quasar Distributors LLC, which is not affiliated with EquBot.

3
AI Powered International Equity ETF
PERFORMANCE SUMMARYAs of November 30, 2018 (Unaudited)
Cumulative Returns (For the Period Ended November 30, 2018)
One Month Three Months Since Inception(1)
AI Powered International Equity ETF - NAV ........ 1.08% -3.93% -6.15%AI Powered International Equity ETF - Market .... 0.98% -4.24% -6.21%FTSE Developed All Cap ex USA Index(2)(3) ........... 0.02% -7.91% -9.63%
The Performance data quoted is historical. Past performance is no guarantee of future results. Current performance may be higher or lower than the performance data quoted. The principal value and investment return of an investment will fluctuate so that your shares, when redeemed, may be worth more or less than their original cost. The returns shown do not reflect the deduction of taxes that a shareholder would pay on Fund distributions or on the redemptions of Fund shares. The total operating expenses as stated in the fee table to the Fund’s prospectus dated June 4, 2018, is 0.7 9%. For performance information current to the most recent month-end, please call 1-800-617-0004. (1) Inception date is June 5, 2018.(2) Indexes are unmanaged statistical composites and their returns do not include fees an investor would pay
to purchase the securities they represent. Such costs would lower performance. It is not possible to invest directly in an index.
(3) The FTSE Developed All Cap ex USA Index is a market-capitalization weighted index that represents the performance of large, mid and small cap companies in developed markets, excluding the USA.
4
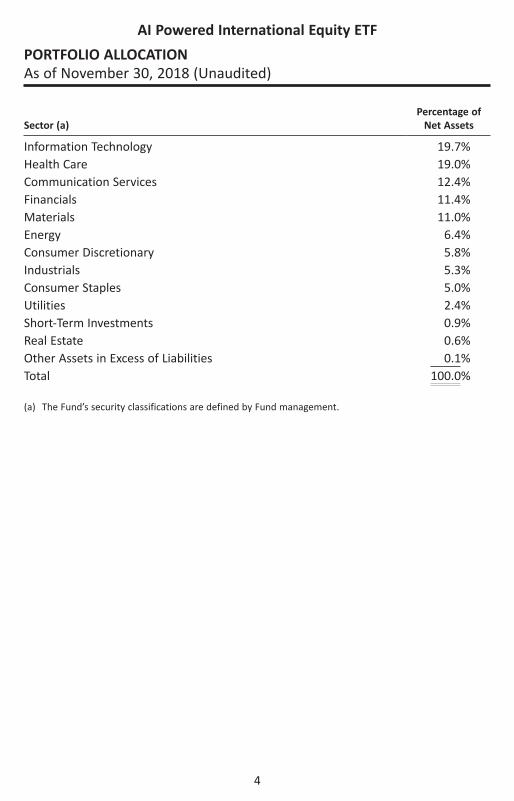
Sector (a)Percentage of
Net Assets
Information Technology 19.7%Health Care 19.0%Communication Services 12.4%Financials 11.4%Materials 11.0%Energy 6.4%Consumer Discretionary 5.8%Industrials 5.3%Consumer Staples 5.0%Utilities 2.4%Short-Term Investments 0.9%Real Estate 0.6%Other Assets in Excess of Liabilities 0.1%Total 100.0%
(a) The Fund’s security classifications are defined by Fund management.
AI Powered International Equity ETF
PORTFOLIO ALLOCATIONAs of November 30, 2018 (Unaudited)

5
The accompanying notes are an integral part of these financial statements.
Shares Security Description Value
COMMON STOCKS — 99.0%
Argentina — 0.4%258 Globant SA (b) ............................................................................ $ 15,132
Australia — 2.6%2,333 Australia & New Zealand Banking Group Ltd. - ADR .................. 46,0651,615 Mesoblast Ltd. - ADR (b) ............................................................ 7,8494,059 National Australia Bank Ltd. - ADR ............................................. 36,876
90,790Belgium — 0.8%
275 Galapagos NV - ADR (b) .............................................................. 27,698
Canada — 28.7%2,317 Alamos Gold, Inc. ....................................................................... 7,4611,095 Aphria, Inc. (b) ............................................................................ 8,6511,721 Aurora Cannabis, Inc. (b) ............................................................ 9,8447,085 Auryn Resources, Inc. (b) ........................................................... 6,5713,147 B2Gold Corp. (b) ......................................................................... 7,7101,533 Bank of Montreal ....................................................................... 114,2091,328 BCE, Inc. ...................................................................................... 56,9452,479 Brookfield Asset Management, Inc. - Class A ............................. 108,7794,145 Cronos Group, Inc. (b) ................................................................ 37,927
746 Descartes Systems Group, Inc. (b) .............................................. 21,94710,975 Eldorado Gold Corp. (b) ............................................................. 6,228
3,219 Encana Corp. .............................................................................. 21,632871 Fortis, Inc. ................................................................................... 30,241
1,369 Goldcorp, Inc. ............................................................................. 12,7041,065 Hydrogenics Corp. (b) ................................................................. 5,4533,113 IAMGOLD Corp. (b) ..................................................................... 9,4952,903 Kirkland Lake Gold Ltd. ............................................................... 60,3255,528 MAG Silver Corp. (b) ................................................................... 37,3691,483 MFC Bancorp Ltd. (b) .................................................................. 7,5633,869 Mountain Province Diamonds, Inc. ............................................ 4,8365,025 New Gold, Inc. (b) ...................................................................... 3,8241,129 Nutrien Ltd. ................................................................................ 58,211
10,521 Obsidian Energy Ltd. (b) ............................................................. 5,155641 Open Text Corp. .......................................................................... 21,992
AI Powered International Equity ETF
SCHEDULE OF INVESTMENTS November 30, 2018 (Unaudited)
6
The accompanying notes are an integral part of these financial statements.
Shares Security Description Value
COMMON STOCKS — 99.0% (Continued)
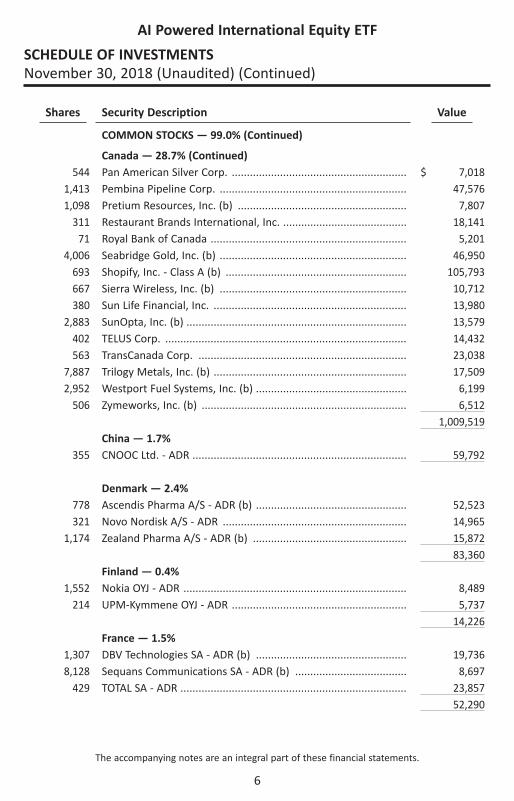
Canada — 28.7% (Continued)544 Pan American Silver Corp. .......................................................... $ 7,018
1,413 Pembina Pipeline Corp. .............................................................. 47,5761,098 Pretium Resources, Inc. (b) ........................................................ 7,807
311 Restaurant Brands International, Inc. ......................................... 18,14171 Royal Bank of Canada ................................................................. 5,201
4,006 Seabridge Gold, Inc. (b) .............................................................. 46,950693 Shopify, Inc. - Class A (b) ............................................................ 105,793667 Sierra Wireless, Inc. (b) .............................................................. 10,712380 Sun Life Financial, Inc. ................................................................ 13,980
2,883 SunOpta, Inc. (b) ......................................................................... 13,579402 TELUS Corp. ................................................................................ 14,432563 TransCanada Corp. ..................................................................... 23,038
7,887 Trilogy Metals, Inc. (b) ................................................................ 17,5092,952 Westport Fuel Systems, Inc. (b) .................................................. 6,199
506 Zymeworks, Inc. (b) .................................................................... 6,5121,009,519
China — 1.7%355 CNOOC Ltd. - ADR ....................................................................... 59,792
Denmark — 2.4%778 Ascendis Pharma A/S - ADR (b) .................................................. 52,523321 Novo Nordisk A/S - ADR ............................................................. 14,965
1,174 Zealand Pharma A/S - ADR (b) ................................................... 15,87283,360
Finland — 0.4%1,552 Nokia OYJ - ADR .......................................................................... 8,489
214 UPM-Kymmene OYJ - ADR .......................................................... 5,73714,226
France — 1.5%1,307 DBV Technologies SA - ADR (b) .................................................. 19,7368,128 Sequans Communications SA - ADR (b) ..................................... 8,697
429 TOTAL SA - ADR ........................................................................... 23,85752,290
AI Powered International Equity ETF
SCHEDULE OF INVESTMENTS November 30, 2018 (Unaudited) (Continued)

7
The accompanying notes are an integral part of these financial statements.
Shares Security Description Value
COMMON STOCKS — 99.0% (Continued)
Germany — 4.9%959 Bayer AG - ADR ........................................................................... $ 17,671638 Continental AG - ADR ................................................................. 9,647
2,069 E.ON SE - ADR ............................................................................. 21,104528 Infineon Technologies AG - ADR ................................................. 11,194848 SAP SE - ADR ............................................................................... 87,921422 Siemens AG - ADR ...................................................................... 24,493
172,030Ireland — 2.7%
365 Jazz Pharmaceuticals PLC (b) ...................................................... 55,189143 Medtronic PLC ............................................................................ 13,947306 Ryanair Holdings PLC - ADR (b) .................................................. 25,193
94,329Israel — 10.2%
2,330 AudioCodes Ltd. ......................................................................... 25,1174,986 Cellcom Israel Ltd. (b) ................................................................. 35,4504,953 Check Cap Ltd. (b) ...................................................................... 16,8402,591 Gazit-Globe Ltd. .......................................................................... 20,7283,927 Intec Pharma Ltd. (b) .................................................................. 27,1751,074 Mellanox Technologies Ltd. (b) ................................................... 99,700
629 Nova Measuring Instruments Ltd. (b) ........................................ 15,580416 Orbotech Ltd. (b) ........................................................................ 24,136
1,612 Partner Communications Co. Ltd. - ADR (b) ............................... 8,5761,840 Radware Ltd. (b) ......................................................................... 41,970
304 Tower Semiconductor Ltd. (b) .................................................... 4,791452 UroGen Pharma Ltd. (b) ............................................................. 22,166170 Wix.com Ltd. (b) ......................................................................... 16,011
358,240Italy — 1.3%
804 Eni SpA - ADR ............................................................................. 25,929211 Luxottica Group SpA - ADR ......................................................... 12,238
1,365 Telecom Italia SpA - ADR (b) ....................................................... 8,94147,108
AI Powered International Equity ETF
SCHEDULE OF INVESTMENTS November 30, 2018 (Unaudited) (Continued)
8
The accompanying notes are an integral part of these financial statements.
Shares Security Description Value
COMMON STOCKS — 99.0% (Continued)
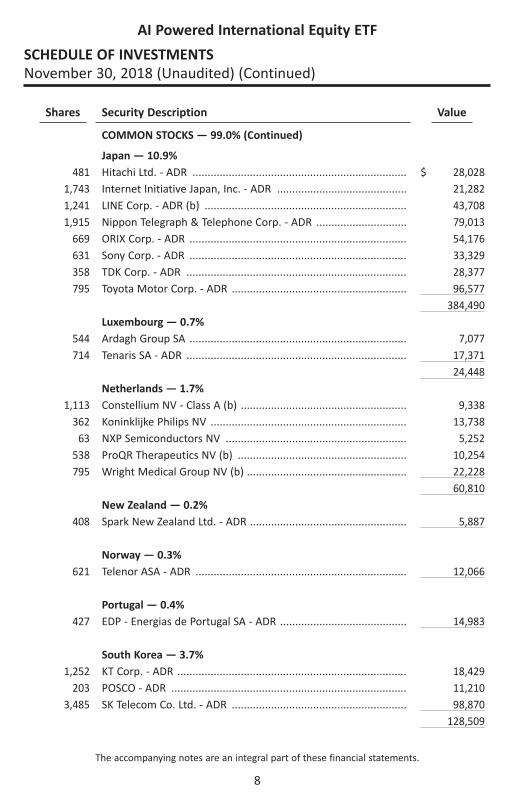
Japan — 10.9%481 Hitachi Ltd. - ADR ....................................................................... $ 28,028
1,743 Internet Initiative Japan, Inc. - ADR ........................................... 21,2821,241 LINE Corp. - ADR (b) ................................................................... 43,7081,915 Nippon Telegraph & Telephone Corp. - ADR .............................. 79,013
669 ORIX Corp. - ADR ........................................................................ 54,176631 Sony Corp. - ADR ........................................................................ 33,329358 TDK Corp. - ADR ......................................................................... 28,377795 Toyota Motor Corp. - ADR .......................................................... 96,577
384,490Luxembourg — 0.7%
544 Ardagh Group SA ........................................................................ 7,077714 Tenaris SA - ADR ......................................................................... 17,371
24,448Netherlands — 1.7%
1,113 Constellium NV - Class A (b) ....................................................... 9,338362 Koninklijke Philips NV ................................................................. 13,738
63 NXP Semiconductors NV ............................................................ 5,252538 ProQR Therapeutics NV (b) ........................................................ 10,254795 Wright Medical Group NV (b) ..................................................... 22,228
60,810New Zealand — 0.2%
408 Spark New Zealand Ltd. - ADR .................................................... 5,887
Norway — 0.3%621 Telenor ASA - ADR ...................................................................... 12,066
Portugal — 0.4%427 EDP - Energias de Portugal SA - ADR .......................................... 14,983
South Korea — 3.7%1,252 KT Corp. - ADR ............................................................................ 18,429
203 POSCO - ADR .............................................................................. 11,2103,485 SK Telecom Co. Ltd. - ADR .......................................................... 98,870
128,509
AI Powered International Equity ETF
SCHEDULE OF INVESTMENTS November 30, 2018 (Unaudited) (Continued)
9
The accompanying notes are an integral part of these financial statements.
Shares Security Description Value
COMMON STOCKS — 99.0% (Continued)
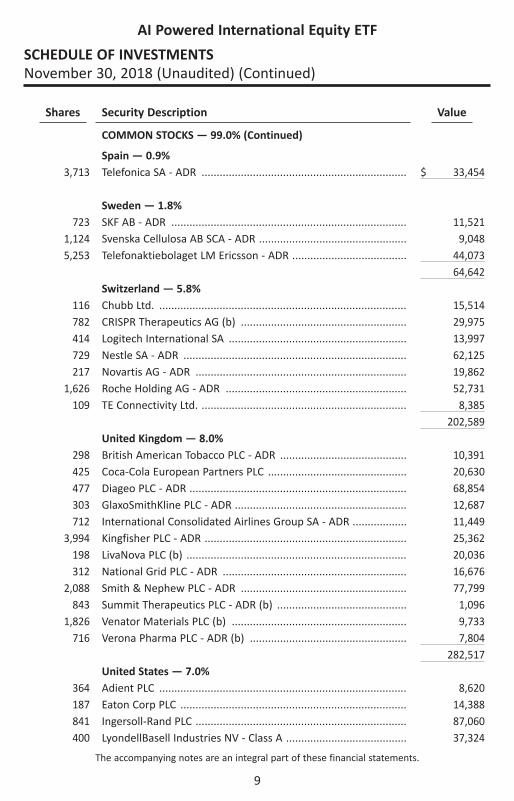
Spain — 0.9%3,713 Telefonica SA - ADR .................................................................... $ 33,454
Sweden — 1.8%723 SKF AB - ADR .............................................................................. 11,521
1,124 Svenska Cellulosa AB SCA - ADR ................................................. 9,0485,253 Telefonaktiebolaget LM Ericsson - ADR ...................................... 44,073
64,642Switzerland — 5.8%
116 Chubb Ltd. .................................................................................. 15,514782 CRISPR Therapeutics AG (b) ....................................................... 29,975414 Logitech International SA ........................................................... 13,997729 Nestle SA - ADR .......................................................................... 62,125217 Novartis AG - ADR ...................................................................... 19,862
1,626 Roche Holding AG - ADR ............................................................ 52,731109 TE Connectivity Ltd. .................................................................... 8,385
202,589United Kingdom — 8.0%
298 British American Tobacco PLC - ADR .......................................... 10,391425 Coca-Cola European Partners PLC .............................................. 20,630477 Diageo PLC - ADR ........................................................................ 68,854303 GlaxoSmithKline PLC - ADR ......................................................... 12,687712 International Consolidated Airlines Group SA - ADR .................. 11,449
3,994 Kingfisher PLC - ADR ................................................................... 25,362198 LivaNova PLC (b) ......................................................................... 20,036312 National Grid PLC - ADR ............................................................. 16,676
2,088 Smith & Nephew PLC - ADR ....................................................... 77,799843 Summit Therapeutics PLC - ADR (b) ........................................... 1,096
1,826 Venator Materials PLC (b) .......................................................... 9,733716 Verona Pharma PLC - ADR (b) .................................................... 7,804
282,517United States — 7.0%
364 Adient PLC .................................................................................. 8,620187 Eaton Corp PLC ........................................................................... 14,388841 Ingersoll-Rand PLC ...................................................................... 87,060400 LyondellBasell Industries NV - Class A ........................................ 37,324
AI Powered International Equity ETF
SCHEDULE OF INVESTMENTS November 30, 2018 (Unaudited) (Continued)
10
The accompanying notes are an integral part of these financial statements.
Shares Security Description Value
COMMON STOCKS — 99.0% (Continued)
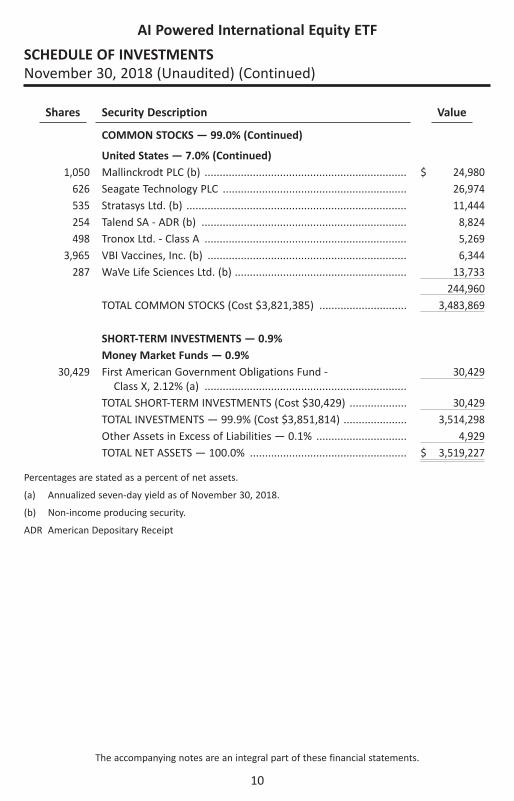
United States — 7.0% (Continued)1,050 Mallinckrodt PLC (b) ................................................................... $ 24,980
626 Seagate Technology PLC ............................................................. 26,974535 Stratasys Ltd. (b) ......................................................................... 11,444254 Talend SA - ADR (b) .................................................................... 8,824498 Tronox Ltd. - Class A ................................................................... 5,269
3,965 VBI Vaccines, Inc. (b) .................................................................. 6,344287 WaVe Life Sciences Ltd. (b) ......................................................... 13,733
244,960TOTAL COMMON STOCKS (Cost $3,821,385) ............................. 3,483,869
SHORT-TERM INVESTMENTS — 0.9%Money Market Funds — 0.9%
30,429 First American Government Obligations Fund - Class X, 2.12% (a) ...................................................................
30,429
TOTAL SHORT-TERM INVESTMENTS (Cost $30,429) ................... 30,429TOTAL INVESTMENTS — 99.9% (Cost $3,851,814) ..................... 3,514,298Other Assets in Excess of Liabilities — 0.1% .............................. 4,929TOTAL NET ASSETS — 100.0% .................................................... $ 3,519,227
Percentages are stated as a percent of net assets.
(a) Annualized seven-day yield as of November 30, 2018.
(b) Non-income producing security.
ADR American Depositary Receipt
AI Powered International Equity ETF
SCHEDULE OF INVESTMENTS November 30, 2018 (Unaudited) (Continued)
11
The accompanying notes are an integral part of these financial statements.
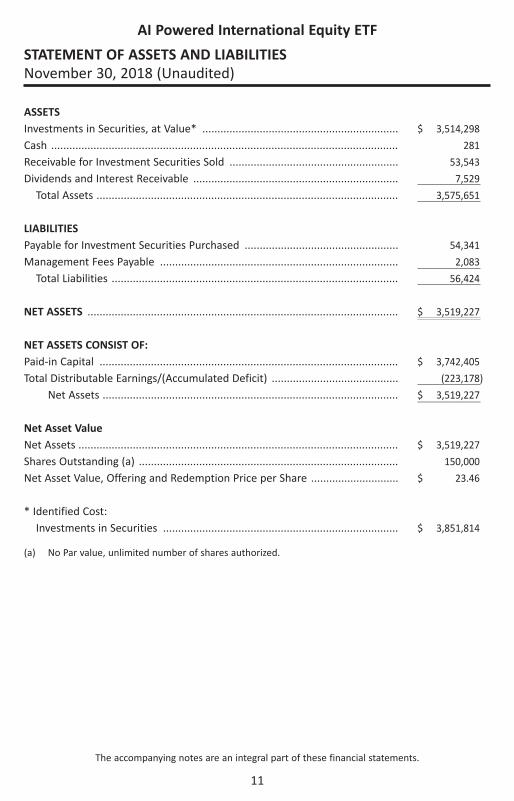
ASSETSInvestments in Securities, at Value* ................................................................. $ 3,514,29 8
Cash ................................................................................................................... 281
Receivable for Investment Securities Sold ........................................................ 53,543
Dividends and Interest Receivable .................................................................... 7,5 29
Total Assets .................................................................................................... 3,575,651
LIABILITIESPayable for Investment Securities Purchased ................................................... 54,341
Management Fees Payable ............................................................................... 2,083
Total Liabilities ............................................................................................... 56,424
NET ASSETS ....................................................................................................... $ 3,519,227
NET ASSETS CONSIST OF:Paid-in Capital ................................................................................................... $ 3,742,405
Total Distributable Earnings/(Accumulated Deficit) .......................................... (223,178)
Net Assets .................................................................................................. $ 3,519,227
Net Asset Value Net Assets .......................................................................................................... $ 3,519,227
Shares Outstanding (a) ...................................................................................... 150,000
Net Asset Value, Offering and Redemption Price per Share ............................. $ 23.46
* Identified Cost:Investments in Securities .............................................................................. $ 3,851,814
(a) No Par value, unlimited number of shares authorized.
AI Powered International Equity ETF
STATEMENT OF ASSETS AND LIABILITIES November 30, 2018 (Unaudited)

12
The accompanying notes are an integral part of these financial statements.
INVESTMENT INCOMEDividends* ......................................................................................................... $ 23,711
Interest .............................................................................................................. 164
Total Investment Income ............................................................................... 23,875
EXPENSESManagement Fees ............................................................................................. 13,498
Total Expenses ............................................................................................... 13,498
Net Investment Income/(Loss) ..................................................................... 10,377
REALIZED AND UNREALIZED GAIN /(LOSS) ON INVESTMENTSNet Realized Gain/(Loss) on:
Investments in Securities .............................................................................. 103,962
Net Change in Unrealized Appreciation/(Depreciation) of:Investments in Securities .............................................................................. (337,517)
Net Realized and Unrealized Gain /(Loss) on Investments .......................... (233,555)
NET INCREASE/(DECREASE) IN NET ASSETS RESULTING FROM OPERATIONS ............................................................................................. $ (223,178)
* Net of foreign withholding tax of ................................................................... $ 3,135
(a) Fund inception date of June 5, 2018. The information presented is for the period from June 5, 2018 to November 30, 2018.
AI Powered International Equity ETF
STATEMENT OF OPERATIONS Period Ended November 30, 2018 (a) (Unaudited)

13
The accompanying notes are an integral part of these financial statements.
Period Ended November 30,
2018 (Unaudited)(a)
OPERATIONSNet Investment Income/(Loss) ...................................................................... $ 10,377
Net Realized Gain/(Loss) on Investments ...................................................... 103,962
Change in Unrealized Appreciation/(Depreciation) of Investments ............. (337,517)
Net Increase/(Decrease) in Net Assets Resulting from Operations ............ (223,178)
CAPITAL SHARE TRANSACTIONSProceeds from Shares Sold ............................................................................ 3,742,405
Net Increase/(Decrease) in Net Assets Derived from Capital Share Transactions (b) ......................................................... 3,742,405
Net Increase/(Decrease) in Net Assets ............................................................ 3,519,227
NET ASSETSBeginning of period ....................................................................................... $ —
End of Period ................................................................................................. $ 3,519,227
(a) Fund inception date of June 5, 2018. The information presented is for the period from June 5, 2018 to November 30, 2018.
(b) Summary of capital share transactions is as follows:
Shares
Shares Sold 150,000
Net Increase 150,000
AI Powered International Equity ETF
STATEMENT OF CHANGES IN NET ASSETS

14
The accompanying notes are an integral part of these financial statements.
Period Ended November 30,
2018 (Unaudited)(a)
Net Asset Value, Beginning of Period .................................................................................. $ 25.00
INCOME GAIN/ LOSS FROM INVESTMENT OPERATIONS:Net Investment Income/(Loss) (b) ........................................................................................ 0.07Net Realized and Unrealized Gain/(Loss) on Investments ................................................. (1.61)Total from Investment Operations ...................................................................................... (1.54)
Net Asset Value, End of Period ............................................................................................ $ 23.46
Total Return .......................................................................................................................... (6.15)%(c)
SUPPLEMENTAL DATA:Net Assets at End of Period (000's) ..................................................................................... $ 3,519
RATIOS TO AVERAGE NET ASSETS:Expenses to Average Net Assets .......................................................................................... 0.79%(d)
Net Investment Income/(Loss) to Average Net Assets ....................................................... 0.61%(d)
Portfolio Turnover Rate (e) .................................................................................................... 83%(c)
(a) Inception date of June 5, 2018.(b) Calculated based on average shares outstanding during the period.(c) Not annualized.(d) Annualized.(e) Excludes impact of in-kind transactions.
AI Powered International Equity ETF
FINANCIAL HIGHLIGHTS For a capital share outstanding throughout the period
15
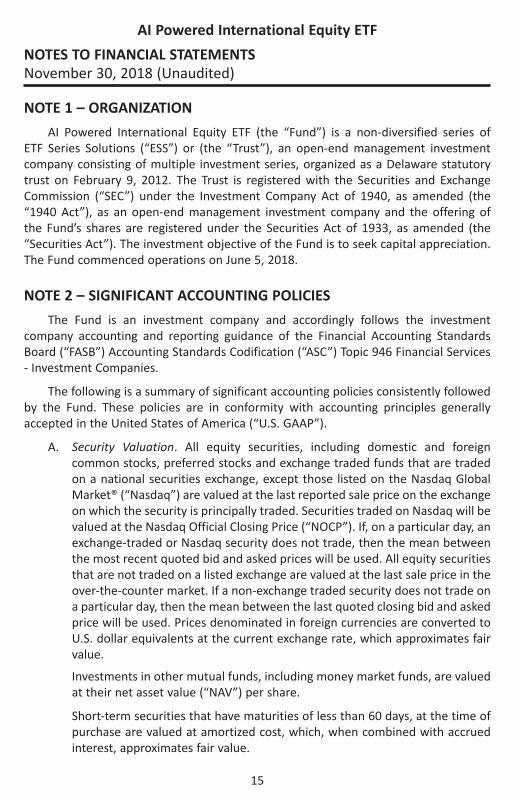
NOTE 1 – ORGANIZATION
AI Powered International Equity ETF (the “Fund”) is a non-diversified series of ETF Series Solutions (“ESS”) or (the “Trust”), an open-end management investment company consisting of multiple investment series, organized as a Delaware statutory trust on February 9, 2012. The Trust is registered with the Securities and Exchange Commission (“SEC”) under the Investment Company Act of 1940, as amended (the “1940 Act”), as an open-end management investment company and the offering of the Fund’s shares are registered under the Securities Act of 1933, as amended (the “Securities Act”). The investment objective of the Fund is to seek capital appreciation. The Fund commenced operations on June 5, 2018.
NOTE 2 – SIGNIFICANT ACCOUNTING POLICIES
The Fund is an investment company and accordingly follows the investment company accounting and reporting guidance of the Financial Accounting Standards Board (“FASB”) Accounting Standards Codification (“ASC”) Topic 946 Financial Services - Investment Companies.
The following is a summary of significant accounting policies consistently followed by the Fund. These policies are in conformity with accounting principles generally accepted in the United States of America (“U.S. GAAP”).
A. Security Valuation. All equity securities, including domestic and foreign common stocks, preferred stocks and exchange traded funds that are traded on a national securities exchange, except those listed on the Nasdaq Global Market® (“Nasdaq”) are valued at the last reported sale price on the exchange on which the security is principally traded. Securities traded on Nasdaq will be valued at the Nasdaq Official Closing Price (“NOCP”). If, on a particular day, an exchange-traded or Nasdaq security does not trade, then the mean between the most recent quoted bid and asked prices will be used. All equity securities that are not traded on a listed exchange are valued at the last sale price in the over-the-counter market. If a non-exchange traded security does not trade on a particular day, then the mean between the last quoted closing bid and asked price will be used. Prices denominated in foreign currencies are converted to U.S. dollar equivalents at the current exchange rate, which approximates fair value.
Investments in other mutual funds, including money market funds, are valued at their net asset value (“NAV”) per share.
Short-term securities that have maturities of less than 60 days, at the time of purchase are valued at amortized cost, which, when combined with accrued interest, approximates fair value.
AI Powered International Equity ETF
NOTES TO FINANCIAL STATEMENTS November 30, 2018 (Unaudited)

16
AI Powered International Equity ETF
NOTES TO FINANCIAL STATEMENTS November 30, 2018 (Unaudited) (Continued)
Securities for which quotations are not readily available are valued at their respective fair values in accordance with pricing procedures adopted by the Fund’s Board of Trustees (the “Board”). When a security is “fair valued,” consideration is given to the facts and circumstances relevant to the particular situation, including a review of various factors set forth in the pricing procedures adopted by the Board. The use of fair value pricing by the Fund may cause the NAV of its shares to differ significantly from the NAV that would be calculated without regard to such considerations.
As described above, the Fund utilizes various methods to measure the fair value of its investments on a recurring basis. U.S. GAAP establishes a hierarchy that prioritizes inputs to valuations methods. The three levels of inputs are:
Level 1 – Unadjusted quoted prices in active markets for identical assets or liabilities that the Fund has the ability to access.
Level 2 – Observable inputs other than quoted prices included in Level 1 that are observable for the asset or liability, either directly or indirectly. These inputs may include quoted prices for the identical instrument on an inactive market, prices for similar instruments, interest rates, prepayment speeds, credit risk, yield curves, default rates and similar data.
Level 3 – Unobservable inputs for the asset or liability, to the extent relevant observable inputs are not available; representing the Fund’s own assumptions about the assumptions a market participant would use in valuing the asset or liability, and would be based on the best information available.
The availability of observable inputs can vary from security to security and is affected by a wide variety of factors, including, for example, the type of security, whether the security is new and not yet established in the marketplace, the liquidity of markets, and other characteristics particular to the security. To the extent that valuation is based on models or inputs that are less observable or unobservable in the market, the determination of fair value requires more judgment. Accordingly, the degree of judgment exercised in determining fair value is greatest for instruments categorized in Level 3.
The inputs used to measure fair value may fall into different levels of the fair value hierarchy. In such cases, for disclosure purposes, the level in the fair value hierarchy within which the fair value measurement falls in its entirety, is determined based on the lowest level input that is significant to the fair value measurement in its entirety.
17
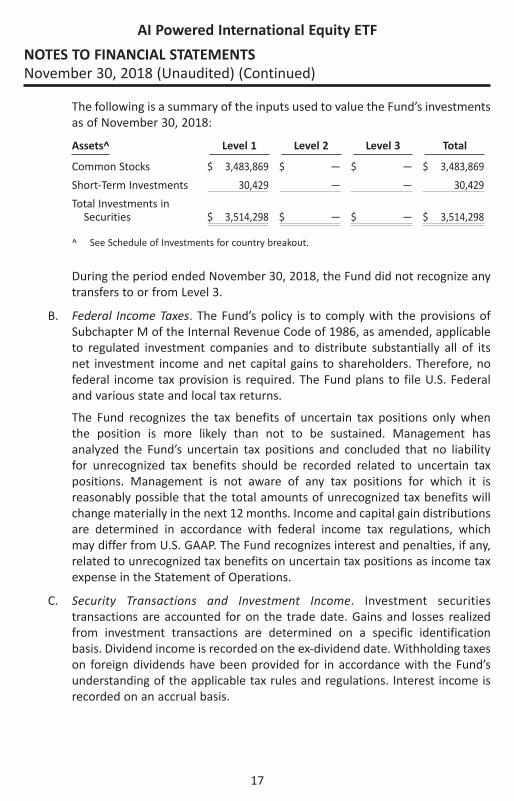
The following is a summary of the inputs used to value the Fund’s investments as of November 30, 2018:
Assets^ Level 1 Level 2 Level 3 Total
Common Stocks $ 3,483,869 $ — $ — $ 3,483,869
Short-Term Investments 30,429 — — 30,429
Total Investments in Securities $ 3,514,298 $ — $ — $ 3,514,298
^ See Schedule of Investments for country breakout.
During the period ended November 30, 2018, the Fund did not recognize any transfers to or from Level 3.
B. Federal Income Taxes. The Fund’s policy is to comply with the provisions of Subchapter M of the Internal Revenue Code of 1986, as amended, applicable to regulated investment companies and to distribute substantially all of its net investment income and net capital gains to shareholders. Therefore, no federal income tax provision is required. The Fund plans to file U.S. Federal and various state and local tax returns.
The Fund recognizes the tax benefits of uncertain tax positions only when the position is more likely than not to be sustained. Management has analyzed the Fund’s uncertain tax positions and concluded that no liability for unrecognized tax benefits should be recorded related to uncertain tax positions. Management is not aware of any tax positions for which it is reasonably possible that the total amounts of unrecognized tax benefits will change materially in the next 12 months. Income and capital gain distributions are determined in accordance with federal income tax regulations, which may differ from U.S. GAAP. The Fund recognizes interest and penalties, if any, related to unrecognized tax benefits on uncertain tax positions as income tax expense in the Statement of Operations.
C. Security Transactions and Investment Income. Investment securities transactions are accounted for on the trade date. Gains and losses realized from investment transactions are determined on a specific identification basis. Dividend income is recorded on the ex-dividend date. Withholding taxes on foreign dividends have been provided for in accordance with the Fund’s understanding of the applicable tax rules and regulations. Interest income is recorded on an accrual basis.
AI Powered International Equity ETF
NOTES TO FINANCIAL STATEMENTS November 30, 2018 (Unaudited) (Continued)
18
Distributions received from a Fund’s investments in REITs may be characterized as ordinary income, net capital gain, or a return of capital. The proper characterization of REIT distributions is generally not known until after the end of each calendar year. As such, the Fund must use estimates in reporting the character of their income and distributions for financial statement purposes. The actual character of distributions to the Fund’s shareholders will be reflected on the Form 1099 received by shareholders after the end of the calendar year. Due to the nature of REIT investments, a portion of the distributions received by a Fund’s shareholders may represent a return of capital.
D. Foreign Currency. Investment securities and other assets and liabilities denominated in foreign currencies are translated into U.S. dollar amounts at the date of valuation. Purchases and sales of investment securities and income and expense items denominated in foreign currencies are translated into U.S. dollar amounts on the respective dates of such transactions.
The Fund does not isolate that portion of the results of operations resulting from changes in foreign exchange rates on investments and currency gains or losses realized between the trade and settlement dates on securities transactions from the fluctuations arising from changes in market prices of securities held. Such fluctuations are included with the net realized and unrealized gain or loss from investments.
E. Distributions to Shareholders. Distributions to shareholders from net investment income and net realized gains on securities are declared and paid at least annually. Distributions are recorded on the ex-dividend date.
F. Use of Estimates. The preparation of financial statements in conformity with U.S. GAAP requires management to make estimates and assumptions that affect the reported amounts of assets and liabilities and disclosure of contingent assets and liabilities at the date of the financial statements, as well as the reported amounts of revenues and expenses during the period. Actual results could differ from those estimates.
G. Share Valuation. The NAV per share of the Fund is calculated by dividing the sum of the value of the securities held by the Fund, plus cash and other assets, minus all liabilities (including estimated accrued expenses) by the total number of shares outstanding of the Fund. The Fund’s shares will not be priced on the days on which the NYSE is closed for trading. The offering and redemption price per share of the Fund is equal to the Fund’s NAV per share.
AI Powered International Equity ETF
NOTES TO FINANCIAL STATEMENTS November 30, 2018 (Unaudited) (Continued)
19
H. Guarantees and Indemnifications. In the normal course of business, the Fund enters into contracts with service providers that contain general indemnification clauses. The Fund’s maximum exposure under these arrangements is unknown as this would involve future claims that may be against the Fund that have not yet occurred. However, based on experience, the Fund expects the risk of loss to be remote.
I. Subsequent Events. In preparing these financial statements, Management has evaluated events and transactions for potential recognition or disclosure through the date the financial statements were available to be issued. There were no events or transactions that occurred during the period subsequent to November 30, 2018, that materially impacted the amounts or disclosures in the Fund’s financial statements.
J. New Accounting Pronouncements. In August 2018, FASB issued Accounting Standards Update (“ASU”) 2018-13, Fair Value Measurement (Topic 820): Disclosure Framework—Changes to the Disclosure Requirements for Fair Value Measurement (“ASU 2018-13”). The primary focus of ASU 2018-13 is to improve the effectiveness of the disclosure requirements for fair value measurements. The changes affect all companies that are required to include fair value measurement disclosures. In general, the amendments in ASU 2018-13 are effective for all entities for fiscal years and interim periods within those fiscal years, beginning after December 15, 2019. An entity is permitted to early adopt the removed or modified disclosures upon the issuance of ASU 2018-13 and may delay adoption of the additional disclosures, which are required for public companies only, until their effective date. Management has evaluated ASU 2018-13 and has adopted the disclosure framework.
NOTE 3 – COMMITMENTS AND OTHER RELATED PARTY TRANSACTIONS
Equbot, Inc. (“the Adviser”), serves as the investment adviser to the Fund. Pursuant to an Investment Advisory Agreement (“Advisory Agreement”) between the Trust, on behalf of the Fund, and the Adviser, the Adviser provides investment advice to the Fund and oversees the day-to-day operations of the Fund, subject to the direction and control of the Board and the officers of the Trust. Under the Advisory Agreement, the Adviser is also responsible for arranging, in consultation with Vident Investment Advisory, LLC (the “Sub-Adviser”) transfer agency, custody, fund administration, accounting, distribution and other related services necessary for the Fund to operate. Under the Advisory Agreement, the Adviser has agreed to pay all expenses of the Fund, except for: the fee paid to the Adviser pursuant to the Advisory Agreement, interest charges on any borrowings, dividends and other expenses on securities sold short, taxes, brokerage commissions and other expenses incurred in placing orders for the
AI Powered International Equity ETF
NOTES TO FINANCIAL STATEMENTS November 30, 2018 (Unaudited) (Continued)
20
purchase and sale of securities and other investment instruments, acquired fund fees and expenses, accrued deferred tax liability, extraordinary expenses, and distribution (12b-1) fees and expenses. For services provided to the Fund, the Fund pays the Adviser 0.79% at an annual rate based on the Fund’s average daily net assets.
U.S. Bancorp Fund Services, LLC (“Fund Services” or “Administrator”), doing business as U.S. Bank Global Fund Services, acts as the Fund’s Administrator and, in that capacity, performs various administrative and accounting services for the Fund. The Administrator prepares various federal and state regulatory filings, reports and returns for the Fund, including regulatory compliance monitoring and financial reporting; prepares reports and materials to be supplied to the Board; monitors the activities of the Fund’s Custodian, transfer agent and fund accountant. Fund Services also serves as the transfer agent and fund accountant to the Fund. U.S. Bank N.A. (the “Custodian”), an affiliate of Fund Services, serves as the Fund’s Custodian.
Quasar Distributors, LLC, (the “Distributor”) acts as the Fund’s principal underwriter in a continuous public offering of the Fund’s shares. The Distributor is an affiliate of the Administrator.
A Trustee and all officers of the Trust are affiliated with the Administrator, Distributor, and Custodian.
NOTE 4 – PURCHASES AND SALES OF SECURITIES
During the period ended November 30, 2018, purchases and sales of securities by the Fund, excluding short-term securities and in-kind transactions, were $2,989,596 and $3,028,558 respectively.
During the period ended November 30, 2018, there were no purchases or sales of U.S. Government securities.
During the period ended November 30, 2018, in-kind transactions associated with creations and redemptions were $3,756,484 and $0, respectively.
NOTE 5 – SHARE TRANSACTIONS
Shares of the Fund are listed and traded on the NYSE Arca, Inc. Market prices for the shares may be different from their NAV. The Fund issues and redeems shares on a continuous basis at NAV generally in blocks of 50,000 shares, called “Creation Units.” Creation Units are issued and redeemed principally in-kind for securities included in a specified universe. Once created, shares generally trade in the secondary market at market prices that change throughout the day. Except when aggregated in Creation Units, shares are not redeemable securities of the Fund. Shares of the Fund may only be purchased or redeemed by certain financial institutions (“Authorized Participants”).
AI Powered International Equity ETF
NOTES TO FINANCIAL STATEMENTS November 30, 2018 (Unaudited) (Continued)
21
An Authorized Participant is either (i) a broker-dealer or other participant in the clearing process through the Continuous Net Settlement System of the National Securities Clearing Corporation or (ii) a Depository Trust Company participant and, in each case, must have executed a Participant Agreement with the Distributor. Most retail investors do not qualify as Authorized Participants nor have the resources to buy and sell whole Creation Units. Therefore, they are unable to purchase or redeem shares directly from the Fund. Rather, most retail investors may purchase shares in the secondary market with the assistance of a broker and are subject to customary brokerage commissions or fees.
The Fund currently offers one class of shares, which has no front end sales load, no deferred sales charge, and no redemption fee. A fixed transaction fee is imposed for the transfer and other transaction costs associated with the purchase or sale of Creation Units. The standard fixed transaction fee for the Fund is $500, payable to the Custodian. The fixed creation fee may be waived on certain orders if the Fund’s custodian has determined to waive some or all of the Creation order costs associated with the order or another party, such as the Adviser, has agreed to pay such fee. In addition, a variable fee may be charged on all cash transactions or substitutes for Creation Units of up to a maximum of 2% as a percentage of the value of the Creation Units subject to the transaction. There were no variable fees received during the period. The Fund may issue an unlimited number of shares of beneficial interest, with no par value. All shares of the Fund have equal rights and privileges.
NOTE 6 – BENEFICIAL OWNERSHIP
The beneficial ownership, either directly or indirectly, of 25% or more of the voting securities of a fund creates a presumption of control of a fund, under section 2(a)(9) of the 1940 Act. At November 30, 2018, the Fund is not aware of any shareholders owning greater than 25% of the outstanding shares of the Fund.
AI Powered International Equity ETF
NOTES TO FINANCIAL STATEMENTS November 30, 2018 (Unaudited) (Continued)
22
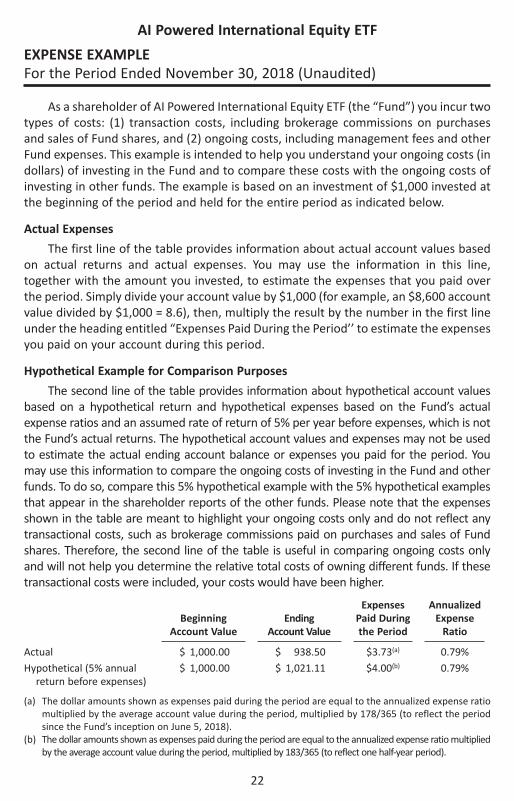
As a shareholder of AI Powered International Equity ETF (the “Fund”) you incur two types of costs: (1) transaction costs, including brokerage commissions on purchases and sales of Fund shares, and (2) ongoing costs, including management fees and other Fund expenses. This example is intended to help you understand your ongoing costs (in dollars) of investing in the Fund and to compare these costs with the ongoing costs of investing in other funds. The example is based on an investment of $1,000 invested at the beginning of the period and held for the entire period as indicated below.
Actual Expenses
The first line of the table provides information about actual account values based on actual returns and actual expenses. You may use the information in this line, together with the amount you invested, to estimate the expenses that you paid over the period. Simply divide your account value by $1,000 (for example, an $8,600 account value divided by $1,000 = 8.6), then, multiply the result by the number in the first line under the heading entitled “Expenses Paid During the Period’’ to estimate the expenses you paid on your account during this period.
Hypothetical Example for Comparison Purposes
The second line of the table provides information about hypothetical account values based on a hypothetical return and hypothetical expenses based on the Fund’s actual expense ratios and an assumed rate of return of 5% per year before expenses, which is not the Fund’s actual returns. The hypothetical account values and expenses may not be used to estimate the actual ending account balance or expenses you paid for the period. You may use this information to compare the ongoing costs of investing in the Fund and other funds. To do so, compare this 5% hypothetical example with the 5% hypothetical examples that appear in the shareholder reports of the other funds. Please note that the expenses shown in the table are meant to highlight your ongoing costs only and do not reflect any transactional costs, such as brokerage commissions paid on purchases and sales of Fund shares. Therefore, the second line of the table is useful in comparing ongoing costs only and will not help you determine the relative total costs of owning different funds. If these transactional costs were included, your costs would have been higher.
Beginning Account Value
Ending Account Value
Expenses Paid During the Period
Annualized Expense
Ratio
Actual $ 1,000.00 $ 938.50 $3.73( a) 0.79%Hypothetical (5% annual
return before expenses) $ 1,000.00 $ 1,021.11 $4.00( b) 0.79%
( a) The dollar amounts shown as expenses paid during the period are equal to the annualized expense ratio multiplied by the average account value during the period, multiplied by 178/365 (to reflect the period since the Fund’s inception on June 5, 2018).
( b) The dollar amounts shown as expenses paid during the period are equal to the annualized expense ratio multiplied by the average account value during the period, multiplied by 183/365 (to reflect one half-year period).
AI Powered International Equity ETF
EXPENSE EXAMPLE For the Period Ended November 30, 2018 (Unaudited)
23
Pursuant to Section 15(c) of the Investment Company Act of 1940 (the “1940 Act”), at a meeting held on April 12, 2018 (the “Meeting”), the Board of Trustees (the “Board”) of ETF Series Solutions (the “Trust”) considered the approval of the following agreements (collectively, the “Agreements”):
• the Advisory Agreement (the “Advisory Agreement”) between EquBot Inc. (the “Adviser”) and the Trust, on behalf of the AI Powered International Equity ETF (the “Fund”); and
• the Sub-Advisory Agreement (the “Sub-Advisory Agreement”) between the Adviser, the Trust, on behalf of the Fund, and Vident Investment Advisory, LLC (the “Sub-Adviser”).
Prior to the Meeting, the Board, including the Trustees who are not parties to the Agreements or “interested persons” of any party thereto, as defined in the 1940 Act (the “Independent Trustees”), reviewed written materials from the Adviser and Sub-Adviser (the “Materials”) regarding, among other things: (i) the nature, extent, and quality of the services to be provided by the Adviser and Sub-Adviser; (ii) the estimated cost of the services to be provided and the profits to be realized by the Adviser and Sub-Adviser from services rendered to the Fund; (iii) comparative fee and expense data for the Fund and other investment companies with similar investment objectives; (iv) the extent to which economies of scale are expected to be realized as the Fund grows and whether the advisory fee for the Fund reflects these economies of scale for the benefit of the Fund; and (v) any other financial benefits to the Adviser, the Sub-Adviser, and their affiliates resulting from services to be rendered to the Fund.
Prior to the Meeting, representatives from the Adviser, along with other service providers of the Fund, presented additional oral and written information to help the Board evaluate the Adviser’s and Sub-Adviser’s fees and other aspects of the Agreements. Among other things, representatives from the Adviser provided an overview of their advisory business, including key personnel and their compliance program. The Board then discussed the written materials and oral presentations that it had received and any other information that the Board received at the Meeting, and deliberated on the approval of the Agreements in light of this information. In its deliberations, the Board did not identify any single piece of information discussed below that was all-important or controlling.
Approval of the Advisory Agreement with the Adviser
Nature, Extent, and Quality of Services to be Provided. The Trustees considered the scope of services to be provided under the Advisory Agreement, noting that the Adviser will be providing investment management services to the Fund. In considering the nature, extent, and quality of the services to be provided by the Adviser, the Board considered the quality of the Adviser’s compliance program and the report
AI Powered International Equity ETF
APPROVAL OF ADVISORY AGREEMENTS & BOARD CONSIDERATIONS (Unaudited)
24
AI Powered International Equity ETF
APPROVAL OF ADVISORY AGREEMENTS & BOARD CONSIDERATIONS (Unaudited) (Continued)
from the Trust’s Chief Compliance Officer (“CCO”) regarding his review of the Adviser’s compliance program. The Board considered that it had discussed with the Adviser the various resources expected to be used to implement the firm’s investment strategy. The Board noted that it had received a copy of the Adviser’s registration form (“Form ADV”), as well as the response of the Adviser to a detailed series of questions that included, among other things, information about the background and experience of the firm’s key personnel and the ownership structure of the firm.
The Board also considered other services to be provided to the Fund, such as making investment decisions for the Fund, monitoring adherence to the Fund’s investment restrictions, oversight of the Sub-Adviser, monitoring compliance with various Fund policies and procedures and with applicable securities regulations, and monitoring the extent to which the Fund achieved its investment objectives as an actively-managed fund. The Board noted that the Adviser would be responsible for selecting investments for the Fund, while the Sub-Adviser would be responsible for implementing such decisions.
Historical Performance. The Board noted that the Fund had not yet commenced operations and concluded that the performance of the Fund, thus, was not a relevant factor in their deliberations.
Cost of Services to be Provided and Economies of Scale. The Board reviewed the estimated expense ratio for the Fund and compared it to the universe of foreign ETFs (the “Category Peer Group”) and the most direct competitors for the Fund, as identified by management (the “Selected Peer Group”). The Board noted that the Category Peer Group was predominantly composed of index-based ETFs, whereas the Selected Peer Group was predominantly composed of actively-managed ETFs. The Board noted the expense ratio for the Fund was below the median of the Selected Peer Group, but significantly above the median for the Category Peer Group.
The Board took into consideration that the advisory fee for the Fund was a “unified fee,” meaning the Fund would pay no expenses other than the advisory fee and certain other costs such as interest, brokerage, acquired fund fees and expenses, extraordinary expenses and, to the extent it is implemented, fees pursuant to a Distribution and/or Shareholder Servicing (12b-1) Plan. The Board noted the Adviser would be responsible for compensating the Trust’s other service providers and paying the Fund’s other expenses out of its own fee and resources. The Board also evaluated the compensation and benefits expected to be received by the Adviser from its relationship with the Fund, taking into account an analysis of the Adviser’s estimated profitability with respect the Fund and the financial resources the Adviser had committed and proposed to commit to its business. The Board determined that such analyses were not a significant factor given that the Fund had not yet commenced operations and consequently, the
25
AI Powered International Equity ETF
APPROVAL OF ADVISORY AGREEMENTS & BOARD CONSIDERATIONS (Unaudited) (Continued)
future size of the Fund was generally unpredictable. The Board noted that it intends to monitor fees as the Fund grows in size and assess whether fee breakpoints may be warranted.
Conclusion. No single factor was determinative of the Board’s decision to approve the Advisory Agreement; rather, the Board based its determination on the total mix of information available to it. Based on a consideration of all the factors in their totality, the Board, including a majority of the Independent Trustees, determined that the Advisory Agreement, including the compensation payable under the agreement, was fair and reasonable to the Fund. The Board, including a majority of the Independent Trustees, therefore determined that the approval of the Advisory Agreement was in the best interests of the Fund and its shareholders.
Approval of the Sub-Advisory Agreement with the Sub-Adviser
Nature, Extent, and Quality of Services to be Provided. The Board considered the scope of services to be provided to the Fund under the Sub-Advisory Agreement, noting that the Sub-Adviser would provide investment management services to the Fund, as well as other ETFs, including certain series of the Trust. The Board noted the responsibilities the Sub-Adviser would have as the Fund’s investment sub-adviser, including: responsibility for the implementation of investment decisions made by the Adviser; determining the daily baskets of deposit securities and cash components; executing portfolio security trades for purchases and redemptions of the Fund’s shares conducted on a cash-in-lieu basis; oversight of general portfolio compliance with relevant law; responsibility for quarterly reporting to the Board; and implementation of Board directives as they relate to the Fund.
In considering the nature, extent, and quality of the services to be provided by the Sub-Adviser, the Board considered reports of the Trust’s CCO with respect to the Sub-Adviser’s compliance program and its experience providing investment management services to other ETFs, including other series of the Trust. The Sub-Adviser’s registration form (“Form ADV”) was provided to the Board, as was the response of the Sub-Adviser to a detailed series of questions which included, among other things, information about the background and experience of the Sub-Adviser’s CCO. The Board also considered the Sub-Adviser’s resources and capacity with respect to portfolio management, compliance, and operations given the number of new funds for which it would be sub-advising.
Historical Performance. The Board noted that the Fund had not yet commenced operations. Consequently, the Board determined performance was not a relevant consideration with respect to the Fund. The Board also considered that, because the Sub-Adviser would primarily be responsible for executing the investment decisions

26
AI Powered International Equity ETF
APPROVAL OF ADVISORY AGREEMENTS & BOARD CONSIDERATIONS (Unaudited) (Continued)
made by the Adviser, the Board in the future would focus on the results of the Sub-Adviser’s services to the Fund, including seeking to obtain best execution of the Fund’s portfolio transactions.
Costs of Services Provided and Economies of Scale. The Board reviewed the advisory fees to be paid by the Adviser to the Sub-Adviser for its services to the Fund. The Board considered the fees to be paid to the Sub-Adviser would be paid by the Adviser from the fee the Adviser received from the Fund or the Adviser’s own resources and noted the fee reflected an arm’s-length negotiation between the Adviser and Sub-Adviser based on the nature and expected size of the Fund. The Board further determined that the fee reflected an appropriate allocation of the advisory fee paid to each adviser given the work performed by each firm and noted that the fees were generally in line with those charged by the Sub-Adviser in connection with other similar series of the Trust and other funds managed by the Sub-Adviser. The Board also evaluated the compensation and benefits expected to be received by the Sub-Adviser from its relationship with the Fund, taking into account an analysis of the Sub-Adviser’s estimated profitability with respect to the Fund.
Conclusion. No single factor was determinative of the Board’s decision to approve the Sub-Advisory Agreement at the Meeting; rather, the Board based its determinations on the total mix of information available to it. Based on a consideration of all the factors in their totality, the Board, including a majority of the Independent Trustees, determined that the Sub-Advisory Agreement, including the compensation payable under the agreement, was fair and reasonable to the Fund. The Board, including a majority of the Independent Trustees, therefore determined that the approval of the Sub-Advisory Agreement was in the best interests of the Fund and its shareholders.
27
The Fund files its complete schedule of portfolio holdings for its first and third fiscal quarters with the Securities and Exchange Commission (“SEC”) on Form N-Q. The Fund’s Form N-Q is available without charge, upon request, by calling toll-free at (800) 617-0004. Furthermore, you may obtain the Form N-Q on the SEC’s website at www.sec.gov. The Fund’s portfolio holdings are posted on its website at www.aiiqetf.com daily.
INFORMATION ABOUT PROXY VOTING(Unaudited)
A description of the policies and procedures the Fund uses to determine how to vote proxies relating to portfolio securities is provided in the Statement of Additional Information (“SAI”). The SAI is available without charge upon request by calling toll-free at (800) 617-0004, by accessing the SEC’s website at www.sec.gov, or by accessing the Fund’s website at www.aiiqetf.com.
When available, information regarding how the Fund voted proxies relating to portfolio securities during the twelve months ending June 30 will be (1) available by calling toll-free at (800) 617-0004 and (2) the SEC’s website at www.sec.gov.
AI Powered International Equity ETF
INFORMATION ABOUT PORTFOLIO HOLDINGS(Unaudited)
28
AI Powered International Equity ETF
FREQUENCY DISTRIBUTION OF PREMIUMS AND DISCOUNTS (Unaudited)
Information regarding how often shares of the Fund trade on the exchange at a price above (i.e., at a premium) or below (i.e., at a discount) its daily net asset value (NAV) is available, without charge, on the Fund’s website at www.aiiqetf.com.
INFORMATION ABOUT THE TRUSTEES(Unaudited)
The Statement of Additional Information (“SAI”) includes additional information about the Trustees and is available without charge, upon request, by calling (800) 617-0004 or by accessing the SEC’s website at www.sec.gov or by accessing the Fund’s website at www.aiiqetf.com.

(This Page Intentionally Left Blank.)
AdviserEquBot Inc.
450 Townsend Street San Francisco, California 94107
Sub-AdviserVident Investment Advisory, LLC
300 Colonial Center Parkway, Suite 330 Roswell, Georgia 30076
DistributorQuasar Distributors, LLC
777 East Wisconsin Avenue, 6th FloorMilwaukee, Wisconsin 53202
CustodianU.S. Bank National Association
Custody Operations1555 North Rivercenter Drive, Suite 302
Milwaukee, Wisconsin 53212
Transfer AgentU.S. Bancorp Fund Services, LLC
615 East Michigan StreetMilwaukee, Wisconsin 53202
Independent Registered Public Accounting FirmCohen & Company, Ltd.
342 North Water Street, Suite 830Milwaukee, Wisconsin 53202
Legal CounselMorgan, Lewis & Bockius LLP
1111 Pennsylvania Avenue, NWWashington, DC 20004-2541
AI Powered International Equity ETFSymbol – AIIQ
CUSIP – 26922A461