Embed Size (px)
Citation preview

Illinois State Water SurveyWatershed Science SectionChampaign, Illinois
A Division of the Illinois Department of Natural Resources
Contract Report 2004-06
Fox River Watershed Investigation –Stratton Dam to the Illinois River:
Water Quality Issues and Data Reportto the Fox River Study Group, Inc.
by
Sally McConkey, Alena Bartosova, Lian-Shin Lin, Karla Andrew,Michael Machesky, and Chris Jennings
Prepared for theFox River Study Group, Inc. and
Illinois Environmental Protection Agency
March 2004

Fox River Watershed Investigation – Stratton Dam to the Illinois River:
Water Quality Issues and Data Report to the Fox River Study Group, Inc.
Sally McConkey, Alena Bartosova, Lian-Shin Lin, Karla Andrew, Michael Machesky, and Chris Jennings
Prepared by: Illinois State Water Survey Watershed Science Section
2204 Griffith Drive Champaign, Illinois 61820-7495
Prepared for the: Fox River Study Group, Inc.
Cindy Skrukrud, Steering Committee Chair and
Illinois Environmental Protection Agency 1021 North Grand Avenue East
P.O. Box 19276 Springfield, Illinois 62794-9276
March 2004

This report was printed on recycled and recyclable papers.

Fox River Watershed Investigation – Stratton Dam to the Illinois River:
Water Quality Issues and Data Report to the Fox River Study Group, Inc.
Executive Summary
Sally McConkey, Alena Bartosova, Lian-Shin Lin, Karla Andrew,
Michael Machesky, and Chris Jennings
Study Background
The Illinois Environmental Protection Agency (IEPA) in their Illinois Water Quality Report 2000 (IEPA, 2000) listed parts of the Fox River in McHenry and Kane Counties and part of Little Indian Creek as impaired. In the 2002 IEPA report (IEPA, 2002), the entire length of the Fox River in Illinois is listed as impaired, as well as Nippersink, Poplar, Blackberry, and Somonauk Creeks, and part of Little Indian Creek. The IEPA has included the Fox River and these tributaries on their list of impaired waters commonly called the 303(d) list (IEPA, 2003). The IEPA uses a detailed, stepwise method to develop this list, 303(d) and their rational and methodology are described in Illinois 2002 Section 303(d) List (IEPA, 2003).
Concerns about the surface water quality in the watershed led to the formation of the Fox
River Study Group, Inc. (FRSG) in 2001. Initially the FRSG developed a plan to collect additional water chemistry data to augment the ambient monitoring by the IEPA and used in IEPA’s use assessment of water quality. With encouragement from the IEPA, the FRSG expanded its initiative to a watershed plan that centers on development of models of the watershed to help investigate water quality issues and develop feasible watershed management plans. Models provide linkages between observed constituents in the water and their sources. Well-calibrated models can be used to evaluate potential management scenarios to assess their probable impact, thus serving as tools to evaluate alternative actions. At the request of the FRSG, the Illinois State Water Survey (ISWS) proposed a multiphase plan of study with the ultimate objective of developing watershed computer models and a long-term monitoring and modeling plan. Phase I of the project, reported herein, was to assemble and evaluate available data in preparation for model development. Phase II will focus on customizing models of watershed to address identified water quality issues. Subsequent phases will involve intensive data collection for model calibration and validation, and implementation of long-term monitoring and model updates. The current study is limited to the Fox River watershed below Stratton Dam to the confluence with the Illinois River. Ultimately the study area must be expanded to include the upper portion of the watershed, including Wisconsin, in a collaborative watershed plan between agencies in both Illinois and Wisconsin. Fundamental to all phases of the project is information dissemination and communication with stakeholders.
This report presents the results of phase I of the project, which was funded by the IEPA.
The report is only one of the products of phase I. The Fox River Watershed Investigation Web
iii

site (http://ilrdss.sws.uiuc.edu/fox), accessed through the Illinois Rivers Decision Support System Web site, was developed and serves as a portal to other products, including a database of publications reporting water quality data for the Fox River watershed; a project bibliography; geographically referenced geographic information system (GIS) datasets and metadata with online mapping tools; a water chemistry database, FoxDB, with an interface for viewing and loading data; and an electronic version of the full report.
The Watershed
The Fox River drains 938 square miles in Wisconsin and 1720 square miles in Illinois. The river and the land in the watershed are used for agriculture, industry, recreation, residences, and urban development. The river currently supports multiple water uses, including aquatic life, fish consumption, swimming, recreation, and public water supply. In addition, the river and its tributaries receive and assimilate various pollution sources such as storm water, and permitted discharges from municipal and industrial facilities.
The Fox River watershed, one of the most populous watersheds in Illinois, is home to
about 11 percent of the state’s population. The Illinois part of the watershed had an average population density of 588 persons per square mile in 2000. Lake, Kane, and McHenry Counties all rank among the top ten Illinois counties in population. The population in the watershed is expected to increase dramatically by year 2020, ~30 percent over the 2000 totals, with much of the growth in McHenry and Kane Counties. Along with population increases in past years, land use in the watershed has changed. Between about 1992 and 2000, urban areas increased to cover an additional 3 percent of the total watershed while agricultural use declined. This change is concentrated in certain high-growth areas. Population growth and increases in urban land cover are occurring along the Fox River corridor and several tributaries between southern McHenry County and northern Kendall County. Poplar Creek and Waubansee Creek watersheds experienced the largest percent conversion to urban land cover between 1992 and 2000.
Consequences of this population growth are greater demand on the Fox River for public
water supply, and stormwater and effluent assimilation. A 1997 study of streams in northeastern Illinois (Dreher, 1997) showed that nearly all streams in urban/suburban watersheds (population density > 300 persons/square mile) exhibited signs of considerable impairment of fish communities. Without proper planning, water quality and biological integrity may decline in the Fox River and its tributaries.
Review of Previous Water Quality Studies
Numerous studies of water quality in the Fox River watershed have been conducted over the years. Studies vary in terms of constituents considered, geographic area, and time span, although most have focused on the mainstem of the Fox River. Nutrient concentrations (nitrogen and phosphorus) have been evaluated in several studies. Nitrate nitrogen levels typically have not exceeded the public water and food-processing standard of 10 milligrams per liter (mg/L), but total N has been at levels that suggest high nutrient enrichment. There are no in-stream standards for P, but levels generally have been above recommended levels for total phosphorus. Dissolved
iv

oxygen is one of the most fundamental indicators of the health of aquatic ecosystems. Past and recent studies of the diurnal variation in dissolved oxygen have shown violations of the Illinois Pollution Control Board (IPCB) standard with wide variations attributed to high algal growth. Low dissolved oxygen consistently has been identified as a problem in the Fox River, typically during low-flow conditions in the summer and fall. High pH levels are another consequence of high algal biomass. Siltation and high suspended solids concentrations have been investigated because of habitat degradation associated with deposition of materials in the river channel. The largest sediment deposits are in impounded areas upstream of dams, but free-flowing areas of the main channel of the Fox River remain relatively free from sediment accumulation. There have been occasional violations of IPCB criteria for various major and trace elements. Fecal coliform counts vary widely, with several orders of magnitude difference suggesting pathogen-related parameters are greatly affected by a variety of sources and conditions. Pesticides and synthetic organic compounds have been detected in water, sediment, and fish tissue.
The latest IEPA assessment of the Fox River watershed (IEPA, 2003) lists leading
sources of impairment identified by the IEPA as organic enrichments and low dissolved oxygen, followed by pH. These factors may be related to the biological productivity, fueled by nutrient loading. Siltation, suspended solids and nutrients, also are listed as possible impairment issues, along with flow alteration (documented site-specific knowledge of unnatural flow alterations, such as dams and water withdrawals) and habitat alteration (other than flow, such as documented channel alteration). Pathogens are listed as the source of impairment for tributaries (Nippersink, Poplar, Blackberry, and Somonauk Creeks); however, no confidence level is given for these assessments, possibly due to the inadequacy of data for evaluating compliance with standards. Habitat alteration is listed as the source of impairment for Little Indian Creek. Polychlorinated biphenyls (PCBs) found in fish tissue are listed as a source of impairment along the mainstem of the Fox River. PCBs accumulate in the food chain and are an indicator of past, not current activities, and are not linked to present inputs to the system.
Phase I Evaluation of Water Chemistry Data, 1998-2002
In order to take advantage of all water chemistry data collected in the watershed and, in particular, data collected by the FRSG, water chemistry data were compiled in a single database. The database created, FoxDB, includes water chemistry, sediment chemistry, and flow data collected at 190 different sites in the Fox River watershed, 88 sites located on the Fox River, and 102 sites on tributaries. Only 60 sites were sampled at least once during the last five years: 38 sites on the Fox River and 22 sites on tributaries. The primary sources of data for this time period are IEPA, United States Geological Survey (USGS), FRSG, Fox River Water Reclamation District (FRWRD), Fox Metro Water Reclamation District (FMWRD), and the Max McGraw Wildlife Foundation (Santucci and Gephard, 2003).
These data generally support the IEPA’s findings of low dissolved oxygen levels, high
pH on the mainstem of the Fox River and the potential for fecal coliform levels exceeding standards, high nutrient levels, and siltation. However, assessment of impairments is not the intent of the analyses, rather the data were examined primarily from the viewpoint of model selection, specifically investigating seasonal effects, flow regime effects, longitudinal variations
v

along the river, as well as to identify monitoring gaps. The following observations are made on the basis of the available data for the Fox River mainstem.
• Most measurements (94% of all data) exceed the U.S. Environmental Protection Agency
(USEPA) recommended criterion of 2.18 mg/L as N for total nitrogen (USEPA, 2000). Total nitrogen levels tend to remain constant with spring concentrations slightly higher, but the form (ammonia, nitrate, or organic) varies seasonally. Nitrate nitrogen forms tend to be highest in the winter and spring, while organic and Kjeldahl nitrogen are higher in the summer. Ammonia nitrogen levels may exceed standards near Algonquin in McHenry County and in Ottawa, typically in the summer during low flows. Reported measurements of nitrate nitrogen are below the public water supply standard of 10 mg/L.
• Phosphorus concentrations at most stations exceed the USEPA recommended criterion
for streams of 0.076 mg/L for total phosphorus. The highest concentrations are associated with summer low-flow conditions, although total loading during high flows is greater. Total phosphorus increases steadily from the Wisconsin border to Yorkville, where the trend reverses and total phosphorus levels decline toward Ottawa.
• Dissolved oxygen levels less than the standard occur from Johnsburg to Oswego,
typically in impounded areas upstream of dams during summer low-flow conditions.
• Measurements of pH have exceeded the IEPA standard of 9 from Algonquin to South Elgin and from Montgomery to Ottawa. Levels of pH do not follow strong trends except that they tend to decrease with increasing flow.
• Suspended solids levels tend to be highest between April and August. Both
concentrations and loads increase with flow, although the trend has a seasonal component. There are no water quality standards for suspended solids.
• Fecal coliform counts exhibited at almost all stations downstream of Johnsburg indicate a
high likelihood of noncompliance with the water quality standards.
• Data are insufficient to detect trends in algae mass with respect to seasons or flow regime, but measurements at stations monitored since 2001 by the FRSG show concentrations far exceeding USEPA guidance for eutrophic conditions.
Data Gaps in Water Chemistry Monitoring
The adequacy of sampling data can only be judged in terms of the goals of the study or the questions to be answered. Data collection programs conducted by the IEPA and USEPA and have been designed primarily to generate long-term datasets that document ambient conditions. Samples collected several times per year give a snapshot of the water chemistry, but when collected systematically over a long period of time, sample results can document general trends. Data collected by the FRSG also provide a snapshot of the water chemistry, and have the added enhancement that they are collected on the same day at points along the Fox River and are
vi

collected more frequently, providing a more complete spatial and seasonal dataset. In contrast, data for the Max McGraw Wildlife Foundation study were collected over a short period of time and do not provide insight to seasonal or flow regime effects, but capture diurnal variations in concentration levels.
Data requirements for modeling depend upon the requirements and expectations of the
models, such as the level of detail needed to assist resource managers with decision-making for developing feasible watershed management plans. In general, insufficient data are available to customize model rate coefficients for the Fox River watershed, and intensive data collections will be needed for model calibration and verification once models are selected and output specifications are determined.
There are some basic water chemistry data gaps. While models are being developed,
some additional monitoring could be conducted that would provide data useful for definition of background conditions, regardless of model specifications. In terms of providing background information on ambient water quality conditions, there are some clear water chemistry data gaps.
• The central part of the watershed, primarily in Kane County, has been monitored extensively,
but the presence of dams and the associated impoundments introduce discontinuities and limit the ability to interpret water quality conditions much above or below the monitoring site.
• Between Yorkville and Ottawa, there are no active monitoring sites. • The sampling of tributaries (Poplar and Somonauk Creeks) is, for the most part, limited to
locations near their confluence with the Fox River. This provides some information on loading from the watershed, but no detail of conditions upstream.
• The lack of any systematic water quality monitoring of most tributaries is a significant data
gap. • Current regular monitoring programs are not conducted with a frequency desirable for
evaluating compliance with IEPA water quality standards for ammonia nitrogen, fecal coliforms, and priority pollutants (e.g., trace metals).
• Sampling for trace metals is inadequate due to current collection and analysis methods. Trace
metals, such as copper, zinc, nickel, and cadmium, are present, but the lack of accurate values for trace metals is a serious limitation to assessment.
• Data showing diurnal variations that are critical to assessment of dissolved oxygen are not
routinely collected. • Current sampling programs do not address loading related to urban and agricultural runoff or
combined sewer overflows. Water quality can change rapidly during runoff events, and a single sample is not representative of the mean concentration during an event.
vii

• There is increasing awareness that a host of unmonitored chemicals used in households, industry, and agriculture enter streams and rivers. The impacts of these constituents, such as pharmaceuticals and hormones, are not yet defined. While not identified as problematic in the Fox River watershed, stakeholders should be cognizant of the potential for problems, and this may be an area for consideration in the future. The lack of monitoring data for these constituents is a data gap.
Recommendations for Interim Water Chemistry Monitoring
The following recommendations are, for the most part, made in consideration of the scope of monitoring that may be accomplished through the volunteer FRSG program.
• Conduct monitoring of the Fox River downstream of Yorkville, similar to that of the FRSG
program, at former IEPA station (DT41) located on Country Road three miles south of Plano and five miles West of Yorkville (T37N R06E SW34).
• Conduct routine sampling at tributaries in order of priority: Crystal, Tyler, Ferson,
Waubansee, Flint, Little Rock, Big Rock, Little Indian / Indian, and Buck Creeks following protocols similar to those of the FRSG program. Flow measurements should be made at the time of sampling for any ungaged streams.
Recommendations to Close Data Gaps in Climate and Regional Geospatial Datasets
In addition to the water chemistry data and associated rate coefficients, standard data inputs are necessary to model water quality in a watershed. These include: elevation data, stream locations, soil types and properties, land cover, stream channel geometry, flow data and climate data (precipitation and temperature). Available data are presented in Chapter 2 of this report. Below is a summary of recommendations for additional data acquisition.
• It is strongly recommended that the South Elgin gage (05551000) be reinstated as a
continuous recording gage. The lack of flow data for many tributaries also will limit model capabilities, and establishing continuous recording gages is encouraged, particularly for those ungaged tributaries recommended for additional water chemistry sampling above.
• The National Hydrography Dataset (NHD) high-resolution data are nearly completed for the
lower Fox River watershed, but only low-resolution data are available for the upper Fox River watershed. Cost sharing with the USGS is a viable option to finalize the high-resolution data for the entire watershed in a timely manner.
• The State Soil Geographic Database SSURGO high-resolution soils information is available
for only selected counties in the Fox River watershed: Kane, McHenry, DuPage, DeKalb, and Will Counties. Other counties in the watershed should be encouraged to work with the U.S. Department of Agriculture, Natural Resources Conservation Service to develop SSURGO data.
viii

• Precipitation data should be collected for every gaged watershed, with at least daily totals
and preferably hourly data collected. Precipitation data are lacking in the lower part of the watershed.
Modeling Considerations and Recommendations for Observed Water Quality Issues
There are two aspects of water quality modeling, watershed loading and in-stream
transport. Watershed loading models simulate the washoff and delivery of constituents from the land surface to the receiving stream, this process is driven by precipitation events. Receiving stream models simulate chemical interactions, mixing, and transport along the river system. These models may simulate steady low-flow conditions or changing flow conditions related to precipitation events. Results of watershed loading simulations serve as inputs to the in-stream modeling routines. Models and model resolutions chosen to represent the Fox River watershed should be selected to address issues and concerns of stakeholders, with adequate resolution and accuracy.
The temporal and spatial resolution of the model(s) must be set to appropriately simulate
the conditions related to the water quality issues. Loading of selected constituents can be aggregated for a large area (e.g., an entire tributary) or distinct smaller areas (sub-watersheds). A model can be customized to provide information that represents conditions averaged over several hundred feet or several miles of the river (spatial resolution). Models can simulate conditions averaged over a year, a month, a day, or an hour (temporal resolution). Models can be calibrated for a wide range of changing flows (unsteady flow) or for a limited range such as specified low-flow conditions (steady flow). The type of calibration data needed to customize a model or models depends on the spatial and temporal resolution desired of the results. Parameters from models calibrated using data from one system can be applied to a similar system to simulate various conditions, thus extending the utility of the data collected.
Low dissolved oxygen levels, organic enrichment, pH, and algae blooms constitute water
quality issues in the Fox River that are related to steady, low-flow conditions. Although the flow may be relatively stable, concentrations of these parameters change during the day and a model must be capable of simulating hourly changes. Furthermore, dissolved oxygen changes dramatically in the Fox River throughout the sequence of free-flowing areas and pooled areas, and this must be taken into consideration.
Siltation, high fecal coliform levels, and nutrient loading from the Fox River watershed
are best represented by unsteady flow conditions. Models are needed to simulate the delivery of these constituents from various land uses in the watershed under a variety of flow conditions.
It is recommended that a flexible, modular framework be established for the Fox River
watershed model. The model or models used should be in the public domain, well tested, and generally accepted for their reliability. The framework initially should consist of watershed loading models for major tributaries to the Fox River and a receiving stream model for the
ix

mainstem of the Fox River. The modular framework should be such that various components, e.g., the tributary watershed models, can be refined as data become available. The USEPA’s BASINS model system provides tools for integration of GIS datasets and industry standard models such as HSPF, SWAT, and QUAL2E. It is recommended that the BASINS modeling framework be selected for the Fox River watershed, in particular, the HSPF model for watershed loading from tributaries to the Fox River. A QUAL2E (or similar) model may be used to address steady, low-flow conditions and diurnal dissolved oxygen variations on the mainstem of the Fox River. An unsteady flow model, such as HSPF, for the mainstem of the Fox River could be developed to address unsteady flow issues.
Data assembled in the FoxDB and the various GIS datasets for the Fox River watershed
provide a basis for setting up the model framework. It is suggested that the model framework be developed and the models calibrated to the extent possible using these data. Customized models then may be used to evaluate additional data needs and design an intensive monitoring program for model calibration. Datasets should be collected to validate the models, and an uncertainty analysis should be performed for parameters of major significance.
Information Dissemination and Stakeholder Involvement
As part of this collaborative effort to understand the watershed and protect its water resources, information dissemination and public education are important tasks. The ISWS will provide open access to all information developed by the ISWS. The Illinois Rivers Decision Support System Web site hosts the Fox River Watershed Investigation Web site. The Internet provides broad public assess to publications (publication database), data (FoxDB, which contains water chemistry and sediment chemistry sample data); and GIS mapping products for illustration of watershed features, as well as the full text of research reports. In the future, models customized for the Fox River watershed by the ISWS will be available through this portal, as will any educational or informational products developed. In addition to Internet accessibility, outreach should include meetings with stakeholders and collaboration with area water quality and engineering professionals. Future Considerations
It is the ISWS vision that products developed through the Fox River Watershed Investigation will be a living resource for the public, researchers, engineers, planners, and policy makers. The database of water chemistry sample information should be updated routinely as monitoring continues. Models of the watershed should be in the public domain, available for use by other researchers and engineers. The monitoring program should continue, and a program of updating the FoxDB and model(s) should be established, with model results periodically compared with new data and refined. Ultimately, the study area should expand to include the entire Fox River watershed. The ISWS hopes to collaborate with the FRSG to provide sound science for watershed management and policy formation that will protect this valuable resource well into the future.
x

References Dreher, D.W. 1997. Watershed Urbanization Impacts on Stream Quality Indicators in
Northeastern Illinois. National Symposium of Assessing the Cumulative Impacts of Watershed Development on Aquatic Ecosystems and Water Quality, U.S. Environmental Protection Agency, March 19-21, 1996, Chicago, IL.
Illinois Environmental Protection Agency. 2003. Illinois 2002 Section 303(d) List. IEPA,
IEPA/BOW/03-016, Springfield, IL (http://www.epa.state.il.us/water/watershed/reports/ 303d-report/2002-report/303d-report-2002.pdf, accessed November 6, 2003).
Illinois Environmental Protection Agency. 2002. Illinois Water Quality Report 2002. IEPA,
IEPA/BOW/02-006, Springfield, IL (http://www.epa.state.il.us/water/water-quality/report-2002/305b-2002.pdf, accessed August 22, 2003).
Illinois Environmental Protection Agency. 2000. Illinois Water Quality Report 2000, IEPA,
IEPA/BOW/00-005, Springfield, IL. Santucci Jr., V.J., and S.R. Gephard. 2003. Fox River Fish Passage Feasibility Study. Max
McGraw Wildlife Foundation, Dundee, IL. U.S. Environmental Protection Agency, 2000. Nutrient Criteria Technical Guidance Manual:
Rivers and Streams. USEPA, EPA-822-B-00-002, Washington, D.C.
xi


Contents Page
Chapter 1. Introduction and Background......................................................................................1 1.1. Overview.......................................................................................................................1 1.2. Objectives and Products................................................................................................2 1.3. Report Organization......................................................................................................3 1.4. Acknowledgments.........................................................................................................3 1.5. Measures of Water Quality ...........................................................................................4 1.6. Monitoring and Modeling...........................................................................................10 Chapter 2. Study Area.................................................................................................................11 2.1. Watershed Description................................................................................................11 2.2. Climate and Hydrology...............................................................................................16 2.3. Geology, Soils, and Topography ................................................................................24 2.4. Land Use/Land Cover .................................................................................................27 2.5. Population ...................................................................................................................32 2.6. Summary .....................................................................................................................36 Chapter 3. Review of Water Quality Studies of the Fox River Watershed ................................39 3.1. Pollution Sources ........................................................................................................39 3.2. Use Impairment...........................................................................................................40 3.3. Water Quality..............................................................................................................43 3.3.1. Nutrients..........................................................................................................43 3.3.2. Dissolved Oxygen and pH ..............................................................................46 3.3.3. Sedimentation/Siltation...................................................................................49 3.3.4. Major Elements and Trace Elements ..............................................................50 3.3.5. Pathogens ........................................................................................................52 3.3.6. Pesticides/Synthetic Organic Compounds ......................................................53 3.3.7. Emerging Water Quality Issues ......................................................................56 3.4. Summary .....................................................................................................................56 Chapter 4. The Fox River Watershed Water Quality Database ..................................................59 4.1. Purpose and Goals.......................................................................................................59 4.2. Data Description .........................................................................................................59 4.2.1. Data Sources ...................................................................................................60 4.2.2. Streamflow Data Sources................................................................................62 4.3. Database Design..........................................................................................................63 4.3.1. Conceptual Design ..........................................................................................63 4.3.2. Relational Database ........................................................................................64 4.3.3. Data Model Description..................................................................................65 4.4. Implementation and Navigation..................................................................................67 4.4.1. Example Queries.............................................................................................68 4.4.2. Importing Data and Future Updates................................................................70
xiii

Page 4.4.3. Special Considerations....................................................................................70 4.4.4. Data Quality ....................................................................................................72 Chapter 5. Water Quality Analyses ............................................................................................79 5.1. Water Uses and Water Quality Standards...................................................................79 5.2. Analyses of FoxDB Water Quality Data ....................................................................80 5.2.1. Methodology...................................................................................................80 5.2.2. Nitrogen ..........................................................................................................81 5.2.3. Phosphorus......................................................................................................87 5.2.4. Dissolved Oxygen...........................................................................................91 5.2.5. pH....................................................................................................................96 5.2.6. Suspended Solids ............................................................................................97 5.2.7. Fecal Coliform ..............................................................................................101 5.2.8. Algae and Biomass – Chlorophyll a .............................................................103 5.2.9. Priority Pollutants .........................................................................................104 5.3. Data Gaps..................................................................................................................108 5.3.1. Geographic Coverage and Period of Record ................................................108 5.3.2. Chemical Data Gaps .....................................................................................118 5.3.3. Limitations Imposed by Frequency and Type of Monitoring.......................119 5.4. Summary ...................................................................................................................120 Chapter 6. Sediment Chemistry Analyses ................................................................................123 6.1. Introduction...............................................................................................................123 6.2. Data Sources .............................................................................................................123 6.3. Sediment Quality Analyses.......................................................................................124 6.3.1. Total Phosphorus and Total Kjeldahl Nitrogen ............................................124 6.3.2. Total Mercury and Copper ...........................................................................127 6.3.3. Organic Pollutants.........................................................................................132 6.4. Limitations and Data Gaps........................................................................................133 6.5. Summary ...................................................................................................................134 Chapter 7. Modeling Issues.......................................................................................................135 7.1. Water Quality Modeling Background.......................................................................135 7.2. Previous Water Quality Modeling Studies for the Fox River Watershed.................137 7.3. Considerations in Model Selection ...........................................................................139 7.3.1. Constituents and Sources ..............................................................................139 7.3.2. Spatial and Temporal Features......................................................................139 7.3.3. Model Complexity ........................................................................................141 7.3.4. Types of Model Uncertainty .........................................................................141 7.3.5. Data Needs and Model Experience...............................................................142 7.4. Model Recommendations for the Fox River Watershed...........................................143 7.4.1. Watershed Loading Modeling.......................................................................144 7.4.2. Receiving Water Quality Modeling ..............................................................145
xiv

Page Chapter 8. Fox River Watershed Investigation Web Site .........................................................147 8.1. Current Features........................................................................................................147 8.2. Publications Database ...............................................................................................147 8.3. Publications Bibliography.........................................................................................148 8.4.Web Mapping Application.........................................................................................148 8.5. Geographic Information System Datasets ................................................................149 8.6. Downloads ................................................................................................................149 Chapter 9. Summary .................................................................................................................151 9.1. Review of Water Quality Studies .............................................................................151 9.2. Water Quality Database ............................................................................................152 9.3. Water Quality Data Analysis ....................................................................................153 9.4. Sediment Chemistry..................................................................................................154 9.5. Modeling Issues ........................................................................................................155 References .................................................................................................................................157 Appendix 1. Fox River Study Group Outreach Statement .......................................................171 Appendix 2. FoxDB data dictionary ........................................................................................175 Appendix 3. Importing Data to FoxDB from USGS and EPA Databases................................183 Appendix 4. FoxDB Data Loader & Viewer Program .............................................................189 Appendix 5. Fox River Study Group Interim Monitoring Evaluation......................................197 Appendix 6. Summary Statistics for Selected Constituents......................................................205 Appendix 7. Descriptions of Water Quality Models ................................................................225 Appendix 8. FoxDB Diagram...................................................................................................235
xv


Chapter 1. Introduction and Background
General information about the Fox River watershed, the Fox River Study Group, Inc. (FRSG), this project, and the report organization are provided in this chapter. A general discussion of surface water quality criteria and standards in Illinois and the role of water quality monitoring and modeling is provided as background for material presented later in this report.
1.1. Overview
The Fox River flows from Wisconsin through northeastern Illinois and joins the Illinois River at Ottawa. The Fox River drains 938 square miles in Wisconsin and 1720 square miles in Illinois. The river and the land in the watershed are used for agriculture, industry, recreation, residences, and urban development. Within the Chicago metropolitan area, there is increasing population growth and pressure from development. The mainstem of the Fox River and the Chain of Lakes region are used for recreation, the Fox River is a source of potable water for public water supply, and the Fox River and its tributaries carry stormwater and receive permitted discharges from wastewater treatment plants, combined sewers, and industry. In Illinois, the population of Fox River watershed by 2020 is expected to increase dramatically (~30 percent) from the 2000 totals, with much of the growth in McHenry and Kane Counties. Consequences of this population growth will be greater demand on the Fox River for public water supply, and stormwater and effluent assimilation. Without proper planning, water quality may decline in the Fox River and its tributaries. Human activities have altered the Fox River watershed both physically and chemically. Water quality of the Fox River and some of its tributaries does not meet all current regulatory goals.
The Illinois Environmental Protection Agency (IEPA) in their Illinois Water Quality Report 2000 (IEPA, 2000) listed parts of the Fox River in McHenry and Kane Counties and part of Little Indian Creek as impaired. In the 2002 IEPA report (IEPA, 2002), the entire length of the Fox River in Illinois is listed as impaired, as well as Nippersink, Poplar, Blackberry, and Somonauk Creeks, and part of Little Indian Creek. The IEPA has included the Fox River and these tributaries on their list of impaired waters commonly called the 303(d) list (IEPA, 2003). The IEPA uses a detailed, stepwise method to develop this list, 303(d) and their rational and methodology are described in Illinois 2002 Section 303(d) List (IEPA, 2003).
Concerns about current and future water quality of the Fox River and its tributaries led to the formation of the FRSG, a diverse coalition of stakeholders working together to assess water quality in the Fox River watershed. Participants include Friends of the Fox, Fox River Ecosystem Partnership (FREP), Sierra Club, Fox River Water Reclamation District (Elgin), Fox Metro Water Reclamation District (Aurora), Illinois Environmental Protection Agency (IEPA), Northeastern Illinois Planning Commission (NIPC), as well as representative from Aurora, Batavia, Crystal Lake, Elgin, Geneva, Island Lake, Kane County, Lake in the Hills, St. Charles, and Yorkville. The FRSG began meeting in summer 2001 and incorporated as a nonprofit organization in 2002. The FRSG has developed a sound, professional working relationship voicing and addressing the variety of watershed concerns and issues. The FRSG initiated a program of routine water quality monitoring to augment ambient monitoring in the watershed.
1

The FRSG is working to foster sustainable growth throughout the watershed. The FRSG outreach statement is contained in Appendix 1.
As part of the FRSG watershed initiative, a plan for scientific study has been developed for the lower portion of the watershed from Stratton Dam, which serves as a control point for the Fox Chain of Lakes, to the river’s confluence with the Illinois River at Ottawa. The study has several phases, and information developed in each phase will be used to refine the work plan in subsequent phases. This report presents the findings of phase I of the study, which includes an extensive collection of available data and provides a description of watershed issues, the status of water quality in the watershed, a qualitative understanding of the various mechanisms contributing to the current conditions of the Fox River watershed between Stratton Dam and Ottawa, and recommendations for the next phase of study.
Future phases will include development of watershed scale computer models and in-stream models, monitoring, and evaluation. The purpose of developing a hydrologic and water quality model of the Fox River watershed is to create a tool to assist with watershed decision-making for attaining water quality standards and developing sustainable management measures. The model can provide insight to sources and impacts of nonpoint and point sources of pollution, simulate water quality conditions of alternative scenarios for future land-use practices and effluent loading to the system, and help in designing and assessing alternate management practices to reduce such impacts.
Activities in the watershed upstream of Stratton Dam have and will continue to have impacts downstream. A comprehensive study of the Fox River watershed ultimately must consider the watershed as a whole and involve interest groups from the Chain of Lakes region and Wisconsin. The proposed plan of study of the watershed below Stratton Dam is a starting point for looking at the issues specific to this part of the watershed for later incorporation into a full watershed plan. In a larger context, the Fox River watershed is part of the Illinois River basin. The Illinois Rivers Decision Support System (ILRDSS), under development at the Illinois State Water Survey (ISWS), is a technology and communication framework to provide scientific support and access to high-quality information for restoration of the Illinois River and its watershed. Data and information compiled for the Fox River watershed are available on the ILRDSS Web site (http://ilrdsssws.uiuc.edu).
1.2. Objectives and Products
The purpose of the multi-phase project proposed by the ISWS is to assist the FRSG to meet their goal of sustainable growth throughout the watershed by assembling and disseminating data and providing technical tools and support. Education and information dissemination are an important aspect of developing stakeholder support for the decisions and planning made using the data and technical tools. The focus of phase I of the project, reported herein, is to compile all available data; objectively analyze the data; develop recommendations and a plan for development of tools, such as models; and to provide wide access to the information via the Internet. The study focuses on examining the water chemistry, algae, and fecal coliform bacteria constituents and development of models to simulate the watershed processes of transport and in-stream dynamics of those constituents. This report is only one of the products of the study. The
2

Fox River Watershed Investigation Web site, (http://ilrdss.sws.uiuc.edu/fox), accessed through the ILRDSS Web site, is a portal to other products:
• a database of publications reporting water-quality data for the Fox River watershed • a project bibliography • geographically referenced datasets and metadata with online mapping tools • a water quality database, FoxDB, with an interface for viewing and loading data • an electronic version of this report
1.3. Report Organization
This report contains an executive summary, nine chapters, references, and seven appendices. Each chapter was written to stand alone; however, discussions in prior chapters provide background information for understanding and interpreting information. Chapter 1 provides an overview of the project and background information on measures of water quality. Chapter 2 describes physical features of the watershed and introduces many of the Geographic Information System (GIS) datasets that can be viewed and accessed via the Fox River Watershed Investigation Web site. Chapter 3 reviews various water quality publications covering the Fox River watershed and includes a discussion of various water quality constituents commonly used to evaluate the health of a water body. Chapter 4 describes the project database containing water quality sample data and the data quality system developed. Chapter 5 presents the analysis of the water quality data, trends, and data gaps. Chapter 6 covers sediment chemistry issues. Chapter 7 reviews water quality models and recommendations for model applications in the Fox River watershed. Chapter 8 presents information about the Web site created for the project and describes various electronic datasets that may be accessed from the site. Chapter 9 presents a summary of the report. The appendices include a statement by the FRSG, a data dictionary for the water quality database, a description of how data from other sources was translated to the database, an overview of the interface used to view and enter database data, an interim report prepared in May 2003 regarding the FRSG monitoring, and descriptions of various water quality models.
1.4. Acknowledgments
The interest, dedication, leadership, hard work, collaboration, and helpful input from the members of the Fox River Study Group, Inc. (FRSG), provided the core inspiration for the project. Fundamental to formulation of the project was the participation and encouragement of the Illinois Environmental Protection Agency (IEPA), which funded this first phase. Tim Kluge, IEPA, serves as liaison. Members of the FRSG provided oversight throughout the project. Vern Knapp, senior hydrologist, Illinois State Water Survey (ISWS), provided technical guidance and support throughout the project and also report review. Jaswinder Singh, an experienced ISWS modeler, provided valuable guidance and assistance in developing model recommendations. Kathy Brown, ISWS GIS specialist, prepared datasets and many of the maps. Bill Saylor, ISWS information specialist, assisted in acquiring data. Sangjun Kang, a graduate student at the University of Illinois at Urbana-Champaign (UIUC) assisted with research and database development. Ashfaque R. Riad, UIUC student, entered data. Becky Howard and Patti Hill
3

prepared the camera-ready copy of the report. Eva Kingston edited the report. Linda Hascall provided graphic and illustration guidance. Mike Demissie, head of the ISWS Watershed Science Section (WSS), provided technical comments, guidance, and general support that were very helpful in defining the project and forming the ISWS/WSS Fox project team.
Any opinions, findings, conclusions, or recommendations expressed in this publication
are those of the authors and do not necessarily reflect the views of the sponsor or the Illinois State Water Survey.
1.5. Measures of Water Quality
Natural systems are highly variable, and no single, simple set of standards can be used to evaluate environmental quality. The health or quality of a river system may be evaluated on the basis of whether or not it is usable for designated purposes. In the Clean Water Act the resource quality of water is defined in terms of the degree to which predefined beneficial uses (i.e., designated uses) of those waters are attained (i.e., supported). This is referred to as “use attainment.” Use categories adopted by the IEPA are: Overall, Aquatic Life, Fish Consumption, Primary Contact (Swimming), Secondary Contact (Recreation), Indigenous Aquatic Life, and Public Water Supply. Five categories are used to rank the degree to which a water body supports its designated use(s): full, threatened, partial support, nonsupport, and not assessed. The IEPA prepares a biennial report subtitled the Clean Water Act, Section 305(b) Report, which lists Illinois water bodies and their use support. In addition to this report, the IEPA prepares a list, pursuant to Section 303(d) of the Clean Water Act of “waters for which any designated use is identified as partial or nonsupport based on chemical, biological and/or physical data supporting the Section 305(b) Report” (IEPA, 2003, p.4). The IEPA uses a combination of biological and chemical criteria to assess the use attainment of Illinois’ waters. The criteria are briefly described in the following paragraphs.
Biological measures, such as the Index of Biotic Integrity (IBI), have been formulated,
and can be used as indicators of the health of the aquatic ecosystem. The purpose of such indices is to define an objective method of compiling information on the abundance and diversity of aquatic organisms from which a numerical score can be computed and used for stream-to-stream comparisons, or temporal or spatial comparisons within a stream network. Observations of the biological and aesthetic aspects of rivers and streams demonstrate the viability or “health” of a water body. Systematic monitoring of these aspects of the water resource will provide historical datasets for comparison and point to changes in the system.
There are several indices that may be used to calculate a numerical value that represents
the biological viability of a water body. Fish and macroinvertebrates are the most commonly used groups in rivers and streams, while benthic algae and macroinvertebrates are commonly used in assessments of lakes. The IEPA interprets fish data using the Index of Biotic Integrity or IBI (Karr et al., 1986; Bertrand et al., 1996). The IBI is a family of indices first developed by Dr. James Karr for use in small streams in Illinois and Indiana (Karr et al., 1986). The Macroinvertebrate Biotic Index or MBI (IEPA, 1994) is used to assess insects, crustaceans, and benthic populations. The MBI rates stream health using a taxa tolerance to pollution and sample density. The choice of scoring criteria is best developed on a regional basis for water bodies of
4

similar ecological characteristics. The IEPA uses the following criteria to classify aquatic life use support for streams (IEPA, 2002a, p.28):
IBI ≥ 41 and MBI ≤ 5.9 Full Support IBI ≥ 20 but < 41 and 5.9 < MBI ≤ 8.9 Partial Support IBI ≤ 20 or MBI > 8.9 Nonsupport
A lack of species abundance, diversity, or both suggests a poor aquatic environment. When data are not available to compute an IBI or MBI for a water body, chemical data
and criteria are used to evaluate use attainment. Physical water quality parameters such as dissolved oxygen (DO) concentration, temperature, and acidity (pH) have been linked to the viability of the aquatic habitat and serve as specific, readily measurable indicators of water quality. Chemical analyses of water and stream sediments provide information on nutrients, metals, pathogens, and other constituents that interact within the aquatic system and may point to sources of pollutants that degrade the viability of the riverine environment.
In Illinois, the Illinois Pollution Control Board (IPCB) has established four primary sets
of water quality standards for each of four identified beneficial uses. Within the Fox River watershed, only General Use Standards and Public and Food Processing Water Supply Standards apply. Numerical standards have been established for DO and pH and for a number of elements from arsenic to zinc. The standard for ammonia nitrogen is a function of temperature and pH. Acute and chronic standards have been set for un-ionized ammonia, arsenic, and several other toxic substances. Notable is that a standard has not been established for phosphorus in streams and rivers.
Generally, a standard (or a criterion) for a harmful substance should have three
components: 1) magnitude: how much of a pollutant (or pollutant parameter, such as toxicity), expressed as concentration is allowable; 2) duration: the period of time (averaging period) over which the in-stream concentration is averaged for a comparison with criteria concentrations (this specification limits the duration of a concentration above the criteria.); and 3) frequency: how often the criteria can be exceeded. Many states, including Illinois, simplified the frequency/duration component by substituting the rule that a numeric standard for certain parameters must be maintained (not to be exceeded) at all times. Such a limitation is a statistical impossibility because there is always a chance, albeit a very remote one, that a constituent may reach a high but statistically possible value that exceeds an established standard.
Tables 1.1 and 1.2 are reproductions of Tables 3.1 and 3.2, respectively, from the IEPA
Illinois Water Quality Report, 2002 (IEPA, 2002a). A more specific discussion and presentation of Illinois water quality standards approved by the IPCB are published in Title 35 of the Illinois Administrative Code Part 302 (IAC, 2002).
Nutrient guidelines for rivers and streams have been proposed (USEPA, 2000a). These
guidelines were developed on the basis of assessments of background concentrations (reference conditions) of various parameters by ecoregions. The Fox River watershed lies within Ecoregion VI, subecoregion 54, called the Central Corn Belt Plain. Ecoregional nutrient criteria are intended to address “cultural eutrophication,” the effects of excess nutrient inputs (USEPA,
5

Table1.1. Illinois Water Quality Standards(1) (IEPA, 2002a)
Parameter Units General use
Public and food processing
water supply
Secondary contact and indigenous
aquatic life
pH SU 6.5 minimum 9.0 maximum
6.5 minimum 9.0 maximum
6.0 minimum 9.0 maximum
Dissolved Oxygen mg/L 5.0 minimum 5.0 minimum 4.0 minimum (2)
Arsenic µg/L (3) 50 1000 Barium µg/L 5000 1000 5000 Boron µg/L 1000 1000 ---(4)
Cadmium µg/L (3) 10 150 Chloride mg/L 500 250 --- Chromium (Total) µg/L --- 50 --- Chromium (Trivalent) µg/L (3) (3) 1000 Chromium (Hexavalent) µg/L (3) (3) 300 Copper µg/L (3) (3) 1000 Cyanide mg/L (3) (3) 0.1 Fluoride mg/L 1.4 1.4 15 Iron (Total) µg/L --- --- 2000 Iron (Dissolved) µg/L 1000 300 500 Lead µg/L (3) 50 100 Manganese µg/L 1000 150 1000 Mercury µg/L (3) (3) 0.5 Nickel µg/L 1000 1000 1000 Phenols µg/L 100 1.0 300 Selenium µg/L 1000 10 1000 Silver µg/L 5.0 5.0 100 Sulfate mg/L 500 250 --- Total Dissolved Solids mg/L 1000 500 1500 Total Residual Chlorine µg/L (3) (3) --- Zinc µg/L 1000 1000 1000 Fecal Coliform Bacteria May-Oct. #/100ml 200 (5) 2000 --- Nov.-April #/100ml --- 2000 --- Ammonia Nitrogen (total)(total) mg/L 15 (6) 15 (6) --- Un-ionized Ammonia mg/L (3) (3) 0.1 Nitrate Nitrogen mg/L --- 10.0 --- Oil and Grease mg/L --- 0.1 15.0 Total Phosphorus mg/L 0.05 (7) 0.05 (7) ---
6

Table 1.1. Concluded
Parameter Units General use
Public and food processing
water supply
Secondary contact and indigenous
aquatic life Aldrin µg/L --- 1.0 --- Dieldrin µg/L --- 1.0 --- Endrin µg/L --- 0.2 --- Total DDT µg/L --- 50.0 --- Total Chlordane µg/L --- 3.0 --- Methoxychlor µg/L --- 100.0 --- Toxaphene µg/L --- 5.0 --- Heptachlor µg/L --- 0.1 --- Heptachlor epoxide µg/L --- 0.1 --- Lindane µg/L --- 4.0 --- Parathion µg/L --- 100.0 --- 2,4-D µg/L --- 100.0 --- Silvex µg/L --- 10.0 --- Notes: mg/L = milligrams per liter µg/L = micrograms per liter (1) 35 IL. Adm. Code Part 302 (1999). (2) Excluding the Calumet-Sag Channel, which shall not be less than 3.0 mg/L at any time. (3) Acute and Chronic Standards (see Table 1.2). (4) (---) means no numeric standard specified; narrative standard applies. (5) Water body reaches physically unsuited for primary contact uses and not found in urban areas or parks
may be designated as unprotected (6) The allowable concentration varies in accordance with water temperature and pH values. 15 mg/L is
the maximum total ammonia nitrogen value allowed. In general, as both temperature and pH decrease, the allowable value of total ammonia nitrogen increases as calculated from the un-ionized ammonia nitrogen standards.
(7) Standard applies to certain lakes and reservoirs and at the point of entry of any stream to these lakes and reservoirs.
7
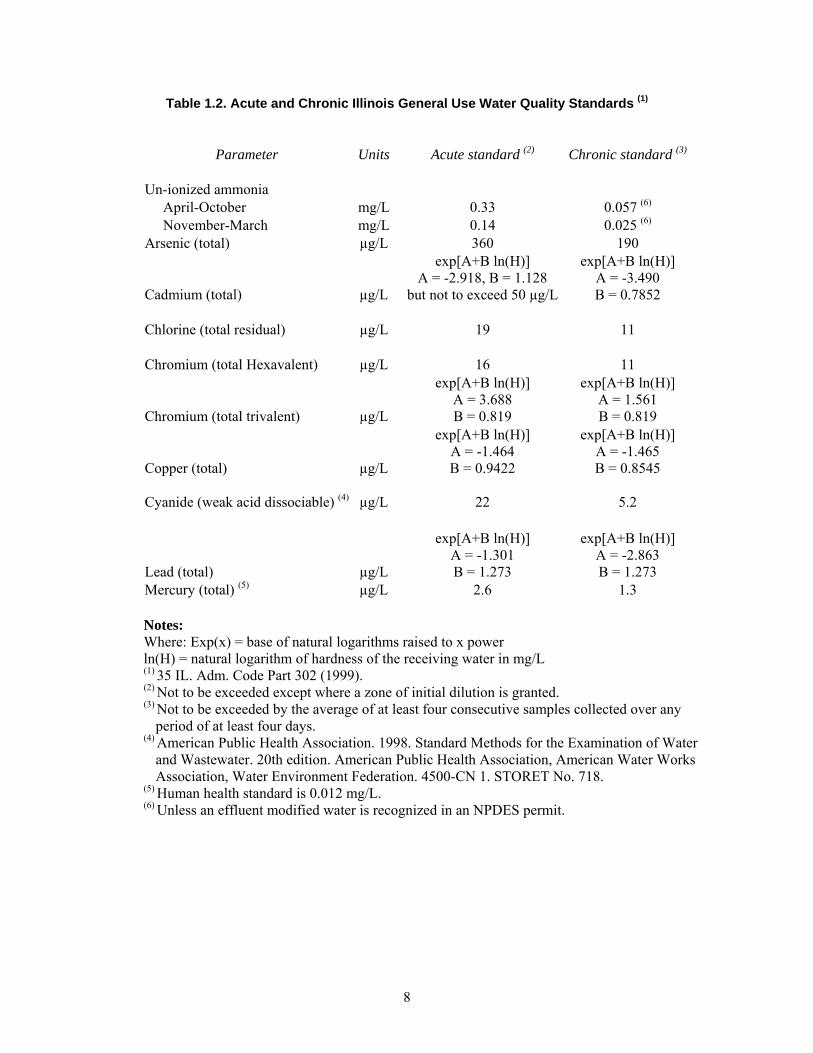
Table 1.2. Acute and Chronic Illinois General Use Water Quality Standards (1)
Parameter Units Acute standard (2) Chronic standard (3)
Un-ionized ammonia April-October mg/L 0.33 0.057 (6)
November-March mg/L 0.14 0.025 (6)
Arsenic (total) µg/L 360 190
Cadmium (total) µg/L
exp[A+B ln(H)] A = -2.918, B = 1.128
but not to exceed 50 µg/L
exp[A+B ln(H)] A = -3.490 B = 0.7852
Chlorine (total residual) µg/L 19 11
Chromium (total Hexavalent) µg/L 16 11
Chromium (total trivalent) µg/L
exp[A+B ln(H)] A = 3.688 B = 0.819
exp[A+B ln(H)] A = 1.561 B = 0.819
Copper (total) µg/L
exp[A+B ln(H)] A = -1.464 B = 0.9422
exp[A+B ln(H)] A = -1.465 B = 0.8545
Cyanide (weak acid dissociable) (4) µg/L 22 5.2
Lead (total) µg/L
exp[A+B ln(H)] A = -1.301 B = 1.273
exp[A+B ln(H)] A = -2.863 B = 1.273
Mercury (total) (5) µg/L 2.6 1.3 Notes: Where: Exp(x) = base of natural logarithms raised to x power ln(H) = natural logarithm of hardness of the receiving water in mg/L (1) 35 IL. Adm. Code Part 302 (1999). (2) Not to be exceeded except where a zone of initial dilution is granted. (3) Not to be exceeded by the average of at least four consecutive samples collected over any
period of at least four days. (4) American Public Health Association. 1998. Standard Methods for the Examination of Water
and Wastewater. 20th edition. American Public Health Association, American Water Works Association, Water Environment Federation. 4500-CN 1. STORET No. 718.
(5) Human health standard is 0.012 mg/L. (6) Unless an effluent modified water is recognized in an NPDES permit.
8

2000b). They are derived from a prescribed statistical analysis (USEPA, 2000a) of water quality data for the region. They are a starting point for the development more refined criteria. There are two recommended ways of establishing a reference (background) condition. The preferred method is to choose the 75th percentile (upper 25th percentile) of a reference population of streams. For example, for a given constituent where low concentrations are desirable, 75 percent of the streams have a value above the “reference” concentration and 25 percent have concentrations below that value. The upper 25th percentile was chosen by USEPA because it is likely associated with minimally impacted conditions, will be protective of designated uses, and provides management flexibility. When reference streams are not identified, the second method is to determine the lower 25th percentile of the population of all streams within a region. The 25th percentile of the entire population was chosen by USEPA to represent a surrogate for an actual reference population. Data analyses to date indicate that the lower 25th percentile from an entire population roughly approximates the 75th percentile for a reference population (USEPA, 2000b). The reference conditions for subecoregion 54, based on the 25th percentile are given in Table 1.3.
Standards have not been established for many parameters, including some pathogens, and
parent and degraded synthetic organic compounds. The lack of a standard does not imply that a substance cannot reach a critical or harmful concentration, only that a consensus to establish a limit has not been reached, and meeting all required standards does not guarantee a healthy riverine environment.
The interactions of the various physical, chemical, and biological components are
complex, and many combinations may provide a successful environment. Like a flexible rubber membrane, the environment can stretch to take many forms, but there are limits to the squeezing and stretching that can be endured before negative impacts are registered. Computer models have been developed to simulate the various processes and complex interactions within a watershed and its water bodies. These models serve as tools to assess combinations of constraints on and inputs to the watershed system that can sustain a healthy riverine environment.
Table 1.3. Reference Conditions for Level III Ecoregion 54 (after USEPA, 2000b)
Parameter
25th percentiles based on all seasons’ data for the decade
Nitrogen, Total Kjeldahl (TKN) (mg/L) 0.663 Nitrite and Nitrate, (NO2+NO3) (mg/L) 1.798 Nitrogen Total (TN) (mg/L) - calculated 2.461 Nitrogen, Total (TN) (mg/L) - reported 2.95 Phosphorus, Total (TP) (µg/L) 72.5 Turbidity (NTU) 14 Turbidity (FTU) 6.04 Turbidity (JCU) 31.6 Chlorophyll a, Fluorometric, Corrected (µg/L) 2 Chlorophyll a, Phytoplankton, Spectrophotometric Acid (µg/L) 7.01 Chlorophyll a, Trichromatic, Uncorrected (µg/L) 3.18
9

1.6. Monitoring and Modeling
Long-term datasets derived from water quality monitoring provide a basis for identifying trends in water quality, indicating declining or improving conditions. Monitoring is essential for providing oversight and stewardship of the resource. Routine monitoring is conducted by the IEPA, the U.S. Geological Survey (USGS) and since 2001 the FRSG in the Fox River watershed. Analysis of monitoring data and comparison of results to standards or guidelines provide an objective measure of the health of the riverine environment. Natural systems are inherently highly variable, no two watersheds develop exactly the same. This variability impedes establishing universal, comprehensive in-stream water quality standards. Standards have not been set for many constituents that nevertheless contribute to the environmental health. Because watershed characteristics are in many aspects unique to an individual watershed, monitoring data are necessary to evaluate attainable guidelines for a particular watershed.
Monitoring alone does not provide a link between sources and observed effects. Complex
processes within the watershed link pollutant source to the riverine environment. Precipitation and subsequent runoff from the land surface carry materials to rivers and streams. Mechanical, chemical, and biological processes transform constituents as they are transported within the stream network. Water quality models are mathematical models of the physical and chemical or biochemical processes embodied in computer code. They represent the current level of understanding of the physical and chemical processes with different levels of detail. Using well calibrated models, links between sources of pollution and impacts can be identified and watershed management options evaluated before implementation.
10

Chapter 2. Study Area
A general description of the Fox River watershed study area is provided in this chapter as well as an introduction to Geographic Information System (GIS) datasets that provide geospacially referenced data for the watershed as input or to generate input for watershed models. Datasets have been customized for the Fox River watershed and may be viewed at the Illinois Rivers Decision Support System, Fox River Watershed Investigation Web site (http://ilrdss.sws.uiuc.edu/fox). More information about the various datasets is available at referenced Web sites.
2.1. Watershed Description
The headwaters of the Fox River watershed are in Waukesha County, Wisconsin. The Fox River drains 938 square miles in Wisconsin and 1720 square miles in Illinois. The watershed in Illinois includes parts of McHenry, Lake, Kane, Cook, DuPage, DeKalb, Kendall, and LaSalle Counties, with minor drainage from Will, Grundy, and Lee Counties. Within Illinois, the Fox River watershed has distinctive natural segments. The uplands are relatively flat, with marshes and lakes. The Fox River flows through the Fox Chain of Lakes, and Stratton Dam near McHenry is operated to maintain minimum lake levels. As the Fox River flows through Kane County, the watershed narrows. The land becomes hilly with bluffs encroaching on the floodplain, and the watershed narrows to a minimum width of 10 miles near Geneva. South of Geneva, the watershed widens again, and the land is relatively flat. The Fox Chain of Lakes is a unique area defined at its downstream point by Stratton Dam. The proposed study area includes the urbanized and relatively flat region with numerous lakes and marshes downstream of Stratton Dam to Algonquin (McHenry and Lake Counties), the narrow, relatively hilly, urbanized and urbanizing area between Algonquin and Montgomery (Kane, Cook, and DuPage Counties) and the flatter, broader, still predominantly rural watershed between Montgomery and the mouth of the Fox River at Ottawa (DeKalb, Kendall, and LaSalle Counties). The Fox Chain of Lakes presents a complex system that initially will be treated as an upstream boundary condition. Thus, it will be possible to first focus efforts on the sources and processes in the study area. Once the water quality dynamics in the study area are understood, it will be important to address the impact of upstream activities.
In Illinois, the Fox River is unique in that the slope in upstream reaches is more gradual
than in downstream reaches. The total length of the river is about 187 miles, with a total fall of about 460 feet and an average slope of 2.5 feet per mile. However, the slope is about 2 feet per mile from Algonquin to South Elgin, steepest between South Elgin and Yorkville (about 4.5 feet per mile), and becomes less steep (about 2.7 feet per mile) below Yorkville to Dayton (McConkey, et. al., 1992).
Between Stratton Dam and the confluence with the Illinois River, the Fox River is 97.8
miles long and drains 1399 square miles. There are 27 named tributaries to the Fox River below Stratton Dam (Table 2.1), and 25 of these tributaries drain 10 or more square miles. The three largest tributaries, Indian Creek, Big Rock Creek, and Somonauk Creek, as well as Buck, Brumbach, Hollenback, Mission, Morgan, Rob Roy, and Roods Creeks, are located in the
11
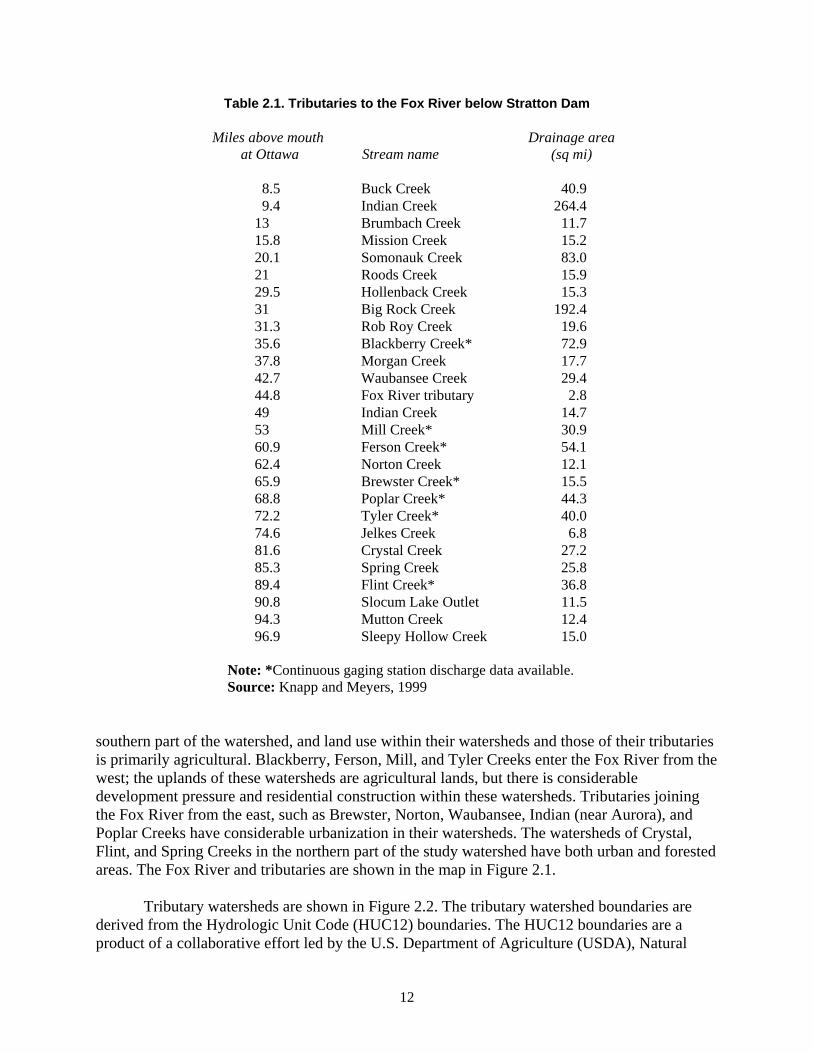
Table 2.1. Tributaries to the Fox River below Stratton Dam
Miles above mouth at Ottawa Stream name
Drainage area (sq mi)
8.5 Buck Creek 40.9 9.4 Indian Creek 264.4
13 Brumbach Creek 11.7 15.8 Mission Creek 15.2 20.1 Somonauk Creek 83.0 21 Roods Creek 15.9 29.5 Hollenback Creek 15.3 31 Big Rock Creek 192.4 31.3 Rob Roy Creek 19.6 35.6 Blackberry Creek* 72.9 37.8 Morgan Creek 17.7 42.7 Waubansee Creek 29.4 44.8 Fox River tributary 2.8 49 Indian Creek 14.7 53 Mill Creek* 30.9 60.9 Ferson Creek* 54.1 62.4 Norton Creek 12.1 65.9 Brewster Creek* 15.5 68.8 Poplar Creek* 44.3 72.2 Tyler Creek* 40.0 74.6 Jelkes Creek 6.8 81.6 Crystal Creek 27.2 85.3 Spring Creek 25.8 89.4 Flint Creek* 36.8 90.8 Slocum Lake Outlet 11.5 94.3 Mutton Creek 12.4 96.9 Sleepy Hollow Creek 15.0
Note: *Continuous gaging station discharge data available. Source: Knapp and Meyers, 1999
southern part of the watershed, and land use within their watersheds and those of their tributaries is primarily agricultural. Blackberry, Ferson, Mill, and Tyler Creeks enter the Fox River from the west; the uplands of these watersheds are agricultural lands, but there is considerable development pressure and residential construction within these watersheds. Tributaries joining the Fox River from the east, such as Brewster, Norton, Waubansee, Indian (near Aurora), and Poplar Creeks have considerable urbanization in their watersheds. The watersheds of Crystal, Flint, and Spring Creeks in the northern part of the study watershed have both urban and forested areas. The Fox River and tributaries are shown in the map in Figure 2.1.
Tributary watersheds are shown in Figure 2.2. The tributary watershed boundaries are
derived from the Hydrologic Unit Code (HUC12) boundaries. The HUC12 boundaries are a product of a collaborative effort led by the U.S. Department of Agriculture (USDA), Natural
12

±
0 5 102.5 Miles
1:600,000
") Dams+U USGS Gages
LakesRivers and Streams
")
")
")
")
")
")
")
")
")
")
")")")
")
")
")+U
+U
+U
+U
+U
+U
+U
+U
+U
+U
+U
+U
+U
+U
+U+U
+U
+U
+U
MCHENRY
LAKE
COOK
DUPAGE
WILL
KENDALL
KANE
DEKALB
LEE
LASALLE
Nippersink C re ek Squaw Creek
Tyler Creek
Mill Creek
Blackbe rry Creek
Fox
Riv
er
Big Rock Creek
Little Rock Creek
Little Indian Creek
Indian Creek
Buck C reek
WISCONSIN
ILLINOIS
Fox River
GRUNDY
5549000
5549850
5548500
5551000
5551030
5551330
5550500
5551675
5551700
5548280
5550000
5552500
5548105
55481105547350
5547755
5550300
5551200
5551540
Figure 2.1. Fox River watershed, rivers, streams, USGS gages, and mainstem dams
13

±
0 5 102.5 Miles
1:600,000
MCHENRY
LAKE
COOK
DUPAGE
WILL
KENDALL
KANE
DEKALB
LEE
LASALLE
WISCONSIN
ILLINOIS
GRUNDY
Fox
Rive
r
Fox
Rive
r
Fox Chainof Lakes
Little
Indian
Creek
RockCreek
Buck
SomonaukCreek
CreekBlackberry
Creek
PoplarCreek
Creek
MillCreek
Indian Creek
TylerCreek
FersonCreek
WaubonsieCreek
Nippersink Creek
BooneCreek
Little
FlintCreek
SquawCreek
Big
Rock
Subwatersheds
Tributary WatershedsName
Lakes
Figure 2.2. Fox River tributaries and watersheds
14

Resources Conservation Service (NRCS, 2003a). The dataset was developed by delineating the boundary lines on 1:24,000 base maps and digitizing the delineated lines. Digital Elevation Model (DEM) data may have been used in part of the process to establish preliminary boundaries. The tributary and sub-watershed boundary GIS coverages for the Fox River watershed are available at the Fox River Watershed Investigation Web site.
Currently, there are 15 dams on the mainstem of the Fox River and numerous smaller dams on its tributaries. Many of these dams originally were built in the 1800s to provide mechanical power for grist and lumber mills and have since been rebuilt to maintain the pools upstream of the dams (Santucci and Gephard, 2003). Dams on the mainstem of the Fox River are shown in Figure 2.1. A georeferenced database was created for this project with information about the dams compiled from several sources (Santucci and Gephard, 2003; Chicago Area Paddling/Fishing Guide, 2003). The locations of the dams were determined from digital orthoquadrangles at a 1:12,000 scale. Some of the attribute data in the database are listed in Table 2.2. East and West Stolp Island Dams are commonly referred to as a single dam.
Between 1997 and 2000, the Illinois Department of Natural Resources (IDNR), Office of Scientific Research and Analysis published five reports describing the Fox River Assessment Area (watershed), including geology (IDNR, 1998a), water resources (IDNR, 1998b), living resources (IDNR, 1998c), socio-economic profile, environmental quality, and archaeological resources (IDNR, 1997a), and an early account of the ecology of the Fox River area (IDNR, 2000). Those volumes provide a detailed discussion of watershed climate, geology, and soils, and the following sections contain excerpts and summaries from these publications. A summary of the natural resources is provided in The Fox River Basin, An Inventory of the Regions’ Resources (IDNR, 1997b).
Table 2.2. Dams on the Mainstem of the Fox River
Name River mile Length (feet) Height (feet) Crest elevation
(feet, NGVD 1929) Gates Stratton Lock and Dam 98.90 275 7.0 736.8 Yes Algonquin Dam 82.60 308 10.5 730.3 Yes Carpentersville Dam 78.20 378 9.0 720.7 No Elgin Dam 71.90 325 13.0 708.4 No South Elgin Dam 68.20 357 8.3 700.0 No St. Charles Dam 60.60 294 10.3 684.6 No Geneva Dam 58.70 441 13.0 675.4 No North Batavia Dam 56.30 244 12.0 665.1 No South Batavia Dam (east) 54.90 143 6.0 653.9 No South Batavia Dam (west) 54.90 203 5.0 654.2 No North Aurora Dam 52.60 375 9.0 646.0 No East Stolp Island Dam 48.90 177 11.0 628.4 No West Stolp Island Dam 48.90 170 15.0 628.4 No Hurd's Island Dam 48.40 365 2.8 619.0 No Montgomery Dam 46.80 325 8.0 614.0 No Yorkville Dam 36.50 530 7.0 575.0 No Dayton Dam 5.70 600 29.6 498.8 Yes
15

2.2. Climate and Hydrology
The climate of the Fox River watershed is typically continental, due to its changeable weather and the wide range of temperature extremes. Summer maximum temperatures are generally in the 80s or low 90s with lows in the 50s to 60s, while daily high temperatures in winter are generally in the 20s or 30s, with lows in the teens or 20s (oF). Mean annual precipitation is 36.88 inches, with more rainfall in the spring and summer than in fall and winter (IDNR, 1998b). Locations within the Fox River watershed in Illinois where precipitation is recorded are listed in Table 2.3. The listed stations are operated by the USGS (USGS, 2003a) or are part of the cooperators network reporting to the National Weather Service (Angel, 2003). Most of these stations are located in the northern part of the study watershed. In the southern half of the watershed, only daily total precipitation is recorded at Newark and Paw Paw. The Illinois Climate Network station located at St. Charles records a full spectrum of climate data.
The mean annual streamflow is an estimated 1818 cubic feet per second (cfs), on the
basis of streamflow records for the Fox River at Dayton, Water Years 1915-2002 (USGS, 2003a). The highest mean monthly streamflow of all streams and rivers generally occurs during March and April, and the lowest mean monthly flows are in August, September, and October. The stream network for the Fox River watershed is illustrated (Figure 2.1). The rivers and streams shown are from the National Hydrography Dataset prepared by the U.S. Geological Survey (USGS) and retrieved from their Web site (USGS, 2003b). Data for the Fox River
Table 2.3. Precipitation Stations in the Fox River Watershed in Illinois
Station location
Period of record
Antioch* 1901 - present Aurora* 1887 - present Barrington* 1962 - present Blackberry Creek near Montgomery October 1999 - present Crystal Lake* 1991 - present DuPage County Airport near St. Charles February 1986 - present Elburn* 1999 - present Elgin Water Treatment Facility at Elgin March 1989 - September 1995
and March 1997 - present Elgin* 1898 - present Ferson Creek near St. Charles August 2000 - present McHenry Lock and Dam 1948 - present Mill Creek near Batavia October 1999 - present Newark* 1999 - present Nippersink Creek near Spring Grove October 1999 - present Paw Paw* 1913 - present Rain Gage at well number 4 at Elburn September 2000 - present St. Charles* - Illinois Climate Network 1990 - present Tyler Creek at Elgin October 1998 - present
Note: * = hourly readings.
16

watershed are, at the time of this writing, available at a 1:100,000 scale. The USGS currently is processing a high-resolution dataset, 1:24,000 scale. Also shown in Figure 2.1 are USGS gaging stations in the Fox River watershed in Illinois, where continuous discharge data have been collected. Information about theses stations is given in Table 2.4.
In the study area (watershed downstream of Stratton Dam) ten continuous monitoring gaging stations were active during all or part of 1998 through 2002. Three stations are located on the mainstem of the Fox River at Algonquin, Montgomery, and Dayton. The others are located on tributaries. These continuous monitoring stations are operated by the USGS. Stage is recorded at 15-minute intervals and converted to discharge values using rating tables maintained by the USGS.
Stage information is recorded at Stratton Dam, which has a lock, five movable gages, and
a free-flowing spillway. The Illinois Department of Natural Resources (IDNR) owns and operates the dam. Vern Knapp and Karla Andrew of the Illinois State Water Survey (ISWS), in collaboration with operations staff and staff from the IDNR Office of Water Resources, have developed a database to provide real-time information for the gate settings for water level
Table 2.4. USGS Continuous Discharge Gaging Stations in the Fox River Watershed in Illinois
USGS station Name
Drainage area
(sq mi) Period of record
(Water Year)
Active stations 5552500 Fox River at Dayton 2642.2 1915 - present 5551540 Fox River at Montgomery 1732.0 2002 - present 5550000 Fox River at Algonquin 1403.0 1916 - present 5548280 Nippersink Creek near Spring Grove 192.0 1966 - present 5551700 Blackberry Creek near Yorkville 70.2 1961 - present 5551675 Blackberry Creek near Montgomery 55.0 1998 - present 5551200 Ferson Creek near St. Charles 51.7 1961 - present 5550300 Tyler Creek at Elgin 38.9 1998 - present 5550500 Poplar Creek at Elgin 35.2 1951 - present 5551330 Mill Creek near Batavia 27.6 1998 - present 5547755 Squaw Creek at Round Lake 17.2 1990 - present 5551030 Brewster Creek at Valley View 14.0 2002 - present
Discontinued stations 5551000 Fox River at South Elgin 1556.0 1990 - 1998 5548500 Fox River at Johnsburg 1205.0 1998 5547350 Grass Lake Outlet at Lotus Woods 919.0 1998 5548110 Nippersink Creek below Wonder Lake 97.3 1995 - 1997 5548105 Nippersink Creek above Wonder Lake 84.5 1995 - 2001 5549850 Flint Creek near Fox River Grove 37.0 1990 - 1995 5549000 Boone Creek near McHenry 15.5 1949 -1981
Note: Water Year = October 1−September 30.
17

regulation. The database presently is maintained at the ISWS. Relationships have been developed to estimate the flow through the gages and the flow over the spillway as a function of the water level (stage). Stage readings are made twice a day by the dam lockmaster. The daily average flow at Stratton Dam was estimated from this information for the period 1998-2002.
A continuous recording gage was operated at South Elgin from 1990 to 1998. Due to funding reductions, the gage was converted to a stage-only gage. While stages continue to be recorded, routine discharge measurements and observations of flow conditions have been discontinued. The rating curve used to convert a stage reading to a discharge has not been updated since 1998; thus, estimates of discharge cannot be made with the same accuracy or reliability of other USGS gages. Any estimate of discharge using the measured stages and the outdated rating curve is subject to error and can only serve as a general guide to the flow conditions.
Average monthly discharges for the period 1998-2002 are shown (Figures 2.3–2.12) for
the Fox River at Stratton Dam, Algonquin, South Elgin, Montgomery, and Dayton, and for Blackberry, Ferson, Poplar, Mill, and Tyler Creeks. Also shown in each plot are lines showing the flows corresponding to the 10-, 50-, and 90-percent chance of exceedence for each month. These flows were computed using the Illinois Stream Flow Assessment Model or ILSAM (Knapp and Myers, 1999). Information recorded at the stations on the mainstem of the Fox River was used to estimate daily flow values at water quality sampling sites when flow was not measured. Flow relationships used in the ILSAM model were used to interpolate flow values for sampling sites.
Average 1998-2002 monthly flows in the Fox River were often at or above the 50 percent
exceedence level, i.e., the median flow for each month for the period record at the station. Flows exceeding the 10 percent exceedence flow occurred in February and June of 1999 between Stratton Dam and South Elgin. In June 2000 and February 2001, the average monthly flows were high from Stratton Dam to Dayton. Average monthly flows for July, November, and December 2002 were below the median flow at most station on the Fox River. However, in any month, at any station, daily flows or instantaneous flows may be higher or lower than typical flows. The daily and/or instantaneous flow coincident with water quality sampling was considered in the water quality data analysis in this study.
Average monthly flows recorded at stations on tributaries show a wide range of flow
conditions occurred between 1998 and 2002. Average monthly flows ranged from above the 10 percent chance of exceedence to below the 90 percent chance of exceedence for most months.
Precipitation and measured flows provide information on the quantity of water passing
through the watershed and its river network; however, the characteristics of the stream channels influence the velocity, width, and depth of flow, which are important factors for water quality modeling. The rate of transport (velocity) through the river system is significant for computation of time-dependent chemical transformations, the depth of flow influences the mixing with the substrate and light penetration, and the width of flow defines the surface area exposed to the air, thus influencing aeration and other physical processes with impacts on water chemistry. Channel geometry varies from river to river, tributary to tributary, and reach to reach. Detailed information on stream channel geometry is available from hydraulic models developed for flood
18

0
500
1000
1500
2000
2500
3000
3500
Jan Feb Mar Apr May Jun Jul Aug Sep Oct Nov Dec
Flow
(cfs
)
Q10Q50Q9019981999200020012002
Figure 2.3. Average monthly flows, Fox River at Stratton Dam
0
500
1000
1500
2000
2500
3000
3500
4000
Jan Feb Mar Apr May Jun Jul Aug Sep Oct Nov Dec
Flow
(cfs
)
Q10Q50Q9019981999200020012002
Figure 2.4. Average monthly flows, Fox River, USGS Station 05550000 at Algonquin
19

0
500
1000
1500
2000
2500
3000
3500
4000
4500
Jan Feb Mar Apr May Jun Jul Aug Sep Cot Nov Dec
Flow
(cfs
)
Q10Q50Q9019981999200020012002
Figure 2.5. Average monthly flows, Fox River at South Elgin
0500
100015002000250030003500400045005000
Jan Feb Mar Apr May Jun Jul Aug Sep Oct Nov Dec
Flow
(cfs
)
Q10Q50Q9019981999200020012002
Figure 2.6. Average monthly flows, Fox River, USGS Station 05551540 at Montgomery
20

0
1000
2000
3000
4000
5000
6000
7000
8000
Jan Feb Mar Apr May Jun Jul Aug Sep Cot Nov Dec
Flow
(cfs
)
Q10Q50Q9019981999200020012002
Figure 2.7. Average monthly flows, Fox River, USGS Station 05552500 at Dayton
0
20
40
60
80
100
120
140
160
180
200
Jan Feb Mar Apr May Jun Jul Aug Sep Oct Nov Dec
Flow
(cfs
)
Q10Q50Q9019981999200020012002
Figure 2.8. Average monthly flows, Blackberry Creek, USGS Station 05551700 near Yorkville
21

0
20
40
60
80
100
120
140
160
Jan Feb Mar Apr May Jun Jul Aug Sep Oct Nov Dec
Flow
(cfs
)
Q10Q50Q9019981999200020012002
Figure 2.9. Average monthly flows, Ferson Creek, USGS Station 05551200 near St. Charles
0
10
20
30
40
50
60
70
8090
100
Jan Feb Mar Apr May Jun Jul Aug Sep Oct Nov Dec
Flow
(cfs
)
Q10Q50Q9019981999200020012002
Figure 2.10. Average monthly flows, Mill Creek, USGS Station 05551330 near Batavia
22
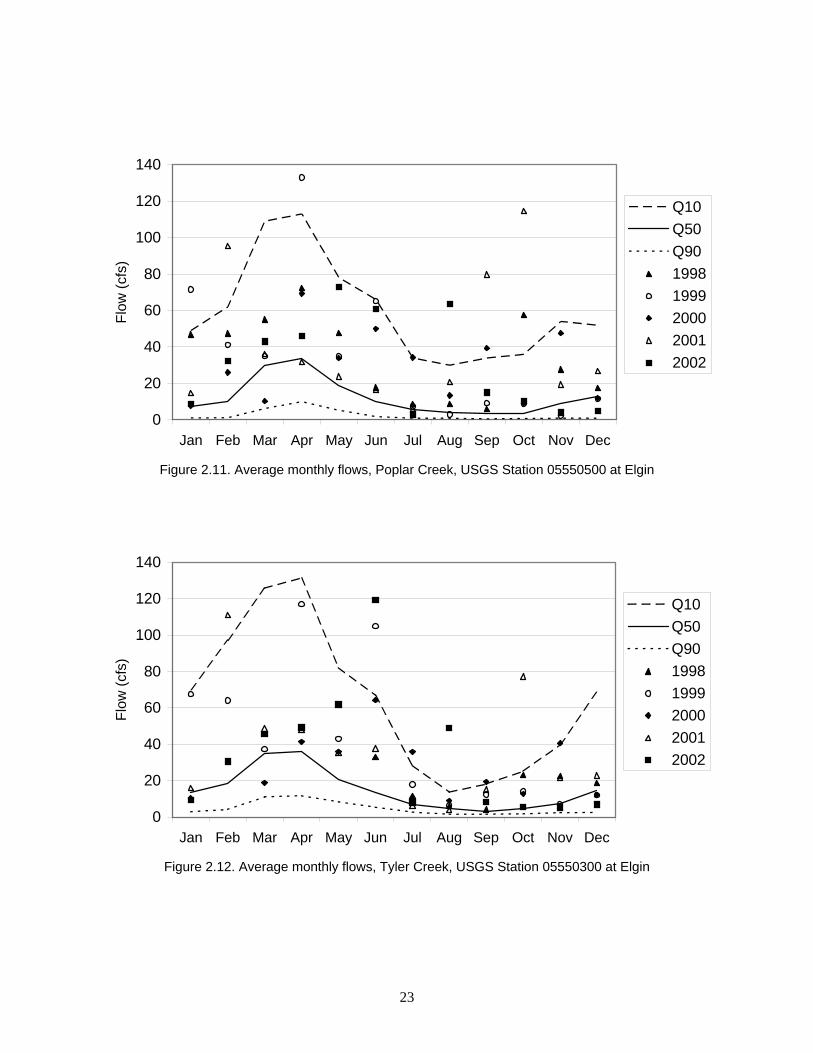
0
20
40
60
80
100
120
140
Jan Feb Mar Apr May Jun Jul Aug Sep Oct Nov Dec
Flow
(cfs
)
Q10Q50Q9019981999200020012002
Figure 2.11. Average monthly flows, Poplar Creek, USGS Station 05550500 at Elgin
0
20
40
60
80
100
120
140
Jan Feb Mar Apr May Jun Jul Aug Sep Oct Nov Dec
Flow
(cfs
)
Q10Q50Q9019981999200020012002
Figure 2.12. Average monthly flows, Tyler Creek, USGS Station 05550300 at Elgin
23

insurance studies throughout much of the watershed. These hydraulic models are customized with cross-section data from surveys of the stream or river. The ISWS serves as the State Repository for Floodplain Information and holdings include a vast collection of the hydraulic models used for flood insurance studies. Federal Emergency Management, Flood Insurance Studies for counties and communities within the Fox River watershed were reviewed to determine where hydraulic models have been prepared. An inventory of models for the Fox River and its tributaries was conducted for this project, and the map in Figure 2.13 shows where hydraulic models previously have been prepared for streams and rivers in the Fox River watershed. The oldest models date back to the early 1980s, the newest to 2002. Stream cross-section data can be used to develop flow relationships for water quality models.
2.3. Geology, Soils, and Topography
The top of the bedrock surface in the Fox River area is a complex surface containing buried valleys, lowlands, and uplands. Several large buried valleys in the bedrock surface traverse the watershed area. The Fox River is eroding into bedrock in a few areas, primarily south of Elgin. Sediments left by the earliest glaciers to enter Illinois have been almost entirely eroded away in the Fox River watershed. Glacial drift overlying bedrock consists of a complex interfingering of beds and lenses of outwash with layers of tills. Deposits of glacial origin range from less than 100 feet to more than 400 feet thick (IDNR, 1998a).
Loess, till, outwash, and lacustrine materials are the dominant parent materials of the
soils on the watershed uplands. Silty materials and some sandy deposits dominate major drainageways and floodplains. These materials differ significantly in their permeability, erodibility, and physical and chemical characteristics. By affecting water table elevation, erosion, sedimentation, and water chemistry, these differences create localized habitats (IDNR, 1998a).
Soil texture and composition affect the chemistry and infiltration rate of water and are an
important feature of the watershed used in modeling. The USDA, NRCS has constructed soils maps for the United States, and these are available in digital format (NRCS, 2003b, 2003c). The State Soil Geographic Database STATSGO is available for the entire Fox River watershed and has a scale of 1:250,000. A sample of the soil permeability information from this database for the Fox River watershed is illustrated in Figure 2.14. The State Soil Geographic Database SSURGO, has a higher resolution, with mapping scales from 1:12,000 to 1:63,360. However, the SSURGO data are available for only selected counties in the Fox River watershed: Kane, McHenry, DuPage, DeKalb, and Will Counties. The SSURGO database is linked to a Map Unit Interpretations Record (MUIR) attribute database, which gives the proportionate extent of the component soils and their properties for each map unit. The SSURGO map units consist of one to three components each. The MUIR database includes more than 25 physical and chemical soil properties. Examples of information that can be queried from the database are: available water capacity, soil reaction, salinity, flooding, water table, and bedrock; building site development and engineering uses; cropland, woodland, rangeland, pastureland, and wildlife; and recreational development (NRCS, 2003c).
Watershed boundaries, land slope, and stream slope are topographic features that
significantly influence watershed processes. Traditionally, topographic maps such as those
24

")
")
")
")
")
")
")
")
")
")
")")")
")
")
")
MCHENRY
LAKE
COOK
DUPAGE
WILL
KENDALL
KANE
DEKALB
LEE
LASALLE
Nippersink C re ek Squaw Creek
Tyler Creek
Mill Creek
Blac
k be rry Creek
Fox
Riv
er
Big Rock Creek
Little Rock Creek
Little Indian Creek
Indian Creek
Buck C reek
WISCONSIN
ILLINOIS
Fox River
GRUNDY
±
0 5 102.5 Miles
1:600,000
") Dams
Lakes
Hydraulic Models
Rivers and Streams
Figure 2.13. Fox River and stream reaches for which hydraulic models were developed
for flood insurance studies
25
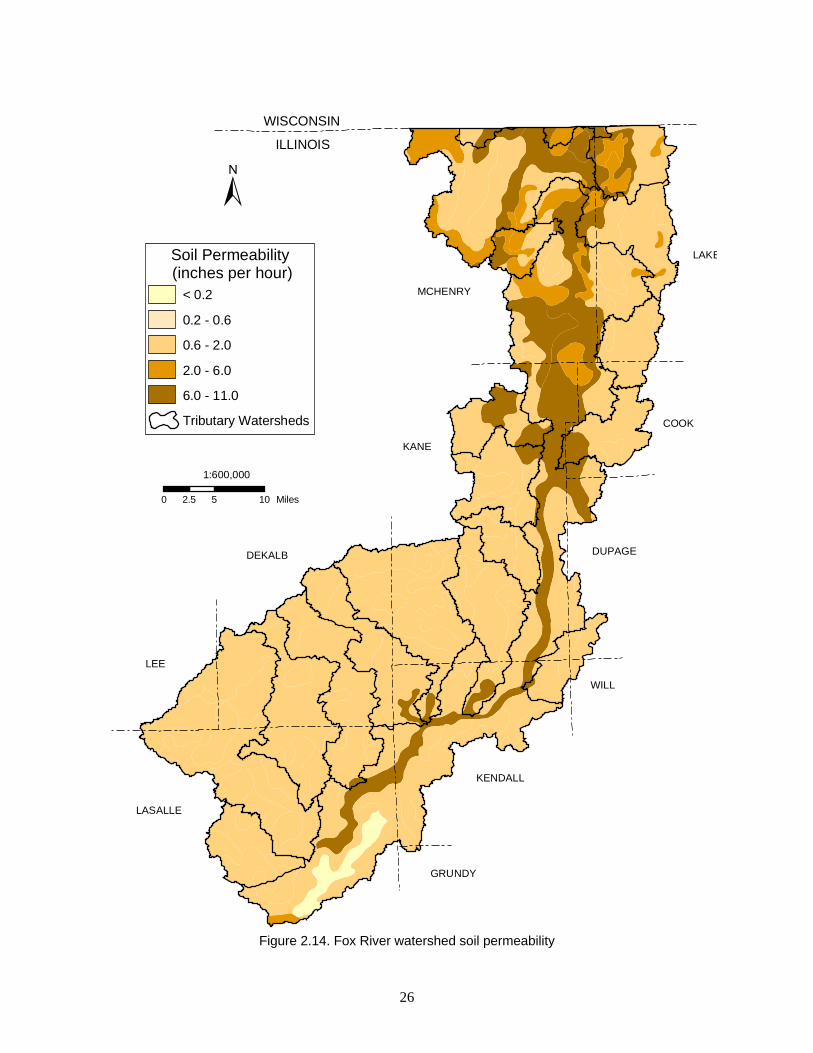
MCHENRY
LAKE
COOK
DUPAGE
WILL
KENDALL
KANE
DEKALB
LEE
LASALLE
WISCONSIN
ILLINOIS
GRUNDY
±
0 5 102.5 Miles
1:600,000
Soil Permeability (inches per hour)
Tributary Watersheds
< 0.2
0.2 - 0.6
0.6 - 2.0
2.0 - 6.0
6.0 - 11.0
Figure 2.14. Fox River watershed soil permeability
26

published by the USGS have provided the basis for delineation of watershed boundaries and calculation of land slopes. The DEMs now are commonly used to delineate topography in applications using georeferenced data as Geographic Information Systems (GIS) datasets. The USGS produces DEMs and distributes them through the Internet (USGS, 2000). In Illinois, the Illinois State Geological Survey shared costs with the USGS to update a number of the DEMs from Level 1 (low quality) elevation data to Level 2 (best quality) to make this the highest resolution, statewide DEM coverage currently available (Luman et al., 2002). The DEMs were derived from USGS 30-meter DEMs. The DEM displayed in Figure 2.15 shows the surface topographical relief of the Fox River watershed in Illinois, with the highest elevation (1183 feet) and the lowest elevation (411 feet, NGVD 1929).
2.4. Land Use/Land Cover
In recent decades, urbanization has increased westward from the City of Chicago, a pattern that pressures the development of the Fox River watershed. The wide range of land use in the Fox River watershed covers parts of 11 counties: McHenry, Lake, DeKalb, Kane, DuPage, Cook, LaSalle, Kendall, Lee, Grundy, and Will. A very small part of the watershed lies in Lee, Grundy, and Will Counties. The Illinois Interagency Landscape Classification Project (IILCP) has prepared an inventory of land cover for Illinois from satellite imagery acquired from three dates during the spring, summer, and fall seasons of 1999 and 2000. Through this effort, various data products are available including a GIS dataset, Land Cover of Illinois 1999-2000 Classification, and tabular data available in electronic format, Land Cover of Illinois 1999-2000 On-Line Statistical Summary (IDOA, 2003). Six land cover categories from the 1999-2000 Classification are shown (Figure 2.16). Agricultural Land, Forested Land, Urban Land, and Wetland are major categories; Surface Water and Barren Land are subcategories of the major category Other. There are 23 different subcategories used in the 1999-2000 classification, and statistical summaries listing values as a percentage of county area are presented in Table 2.5 for the eight counties that have significant land area in the Fox River watershed. The statistics show that LaSalle and Kendall Counties have primarily agricultural land cover, followed by McHenry and Kane Counties. Urban and Built-Up areas dominate in Cook and DuPage Counties, followed by Lake and Kane Counties. There are no areas classified as swamps in any of these counties. The IDOA (2003) reports that watershed statistics have been calculated using watershed boundaries of the 12 digit Hydrologic Unit Coverage (HUC); however, at the time of this writing, they are not posted at their Web site. Other useful products planned by the IDOA are comparison of 1991-1995 and 1999-2000 land use/cover inventories.
An inventory of land cover in Illinois was prepared by IDNR from satellite imagery
acquired during the 1991-1995 spring and fall seasons and distributed on compact disk (IDNR, 1996). The majority of the source imagery was acquired during 1992. Using this data, land cover statistics by tributary watershed were computed for the Fox River watershed as part of the IDNR Critical Trends Assessment Project (IDNR, 1998a). Land cover statistics by watershed have also been prepared using the 1999-2000 land cover data and the HUC-12 boundaries (IDOA, 2003). The techniques in satellite imagery collection and interpretation and the watershed boundaries differ between these two datasets, resulting in slight differences in area and land cover assignment. However, a comparison of the land cover type as a percentage of land area does indicate general changes in land cover between 1992 and 2000. The major land cover categories,
27

MCHENRY
WILL
KENDALL
KANE
DEKALB
LEE
LASALLE
WISCONSIN
ILLINOIS
GRUNDY
LAKE
COOK
DUPAGE
±
0 5 102.5 Miles
1:600,000
Elevation(feet)High : 1183
Low : 441
Figure 2.15. Fox River watershed elevations
28

MCHENRY
LAKE
COOK
DUPAGE
WILL
KENDALL
KANE
DEKALB
LEE
LASALLE
WISCONSIN
ILLINOIS
GRUNDY
±
0 5 102.5 Miles
1:600,000
Land Cover CategoriesAgricultureForestedUrban Land
WetlandsSurface Water
Tributary Watersheds
Barren LandCounty Boundaries
Figure 2.16. Fox River watershed land cover
29

Table 2.5. Land Cover as a Percentage of Total County and State Area
Land cover category McHenry Lake DeKalb Kane DuPage Cook LaSalle Kendall State Agricultural land 66.4 19.3 92.1 64.9 7.2 3.8 86.3 86.8 76.4 Corn 22.5 5.6 45.8 25.4 1.4 1.1 38.8 39.6 31.6 Soybeans 20.2 3.8 37 22.2 1.8 1.1 37.1 33.6 29.1 Winter Wheat <0.1 <0.1 0.1 <0.1 <0.1 <0.1 <0.1 0.2 1 Other small grains and hay 2.1 0.8 0.9 1.1 0.1 <0.1 0.8 1 0.9 Winter Wheat/soybeans, double cropped - - - - - - - - 1.7 Other agriculture <0.1 - 0.1 0.1 - <0.1 0.1 0.6 0.4 Rural grassland 21.5 9.1 8.3 16 3.9 1.5 9.4 11.8 11.6 Forested land 12.4 22.9 1.7 8.2 14.1 12.8 5.4 4.9 11.5 Upland 7.9 14.5 1.3 5.7 10.3 8.9 4 3.2 9.6 Partial forest/savanna upland 4.5 8.4 0.4 2.5 3.6 3.8 1.4 1.7 1.7 Coniferous 0.1 <0.1 <0.1 <0.1 0.2 <0.1 <0.1 - 0.2 Urban and built-up land 16.9 47.4 4.8 24.6 75 79.6 4.3 6 6.4 High density 1.2 4.7 0.5 2.9 10.9 19.7 0.8 0.7 1.7 Low/medium density 6.4 21.2 2.5 11.8 38.1 42.9 2.4 3 2.8 Urban open space 9.3 21.4 1.7 9.9 26.1 17 1.1 2.3 1.8 Wetland 2.1 4.3 0.9 1 2 1.4 2.2 1.4 3.9 Shallow marsh 1.3 2.1 0.1 0.6 1.1 0.8 0.1 0.1 0.3 Deep marsh 0.2 1.9 <0.1 0.1 0.2 0.2 <0.1 <0.1 0.1 Seasonally/temporarily flooded - - <0.1 <0.1 - - 0.4 0.2 0.3 Floodplain forest 0.6 0.4 0.7 0.3 0.6 0.3 1.7 1.1 3.1 Swamp - - - - - - - - 0.1 Shallow water <0.1 <0.1 <0.1 <0.1 <0.1 0.1 <0.1 <0.1 0.1 Other 2.2 6.1 0.5 1.2 1.7 2.4 1.9 0.9 1.8 Surface water 1.7 5.8 0.3 1 1.6 2.1 1.5 0.7 1.7 Barren and exposed land 0.6 0.3 0.2 0.2 0.1 0.3 0.4 0.2 0.1 Clouds - - - - - - - - <0.1 Cloud shadows - - - - - - - - <0.1
Source: Illinois IDOA (2003).
and the percent area in the Illinois portion of the Fox River watershed for each category are listed in Table 2.6 for 1991-1995 and 1999-2000. The values for land cover categories Wetland and Other Land are combined in Table 2.6 as there seem to be differences in how these categories were interpreted for the two datasets. The percent change between the two time periods also is listed in the table. Land in agricultural use is still dominant in the Illinois part of the watershed although it has decreased, while urban areas, the second largest land cover identified in the watershed, increased.
30

Table 2.6. Land Cover as a Percentage of Total Fox River Watershed Area in Illinois
Time period Agriculture Forest Urban
and built-up Wetland
and other
1991-1995 66.2 9.2 17.7 6.9 1999-2000 63.8 10.4 20.8 5.0
Percent change -2.4 1.2 3.1 -1.9
These same datasets were used to compare land cover changes in the watersheds of major tributaries to the Fox River below Stratton Dam. The tributaries and statistics for land cover categories for 1999-2000 data and the percent change as compared to the 1991-1995 data are listed in Table 2.7, if data were available. A positive value for the percentage change indicates an increase in the land cover type since the 1991-1995 time period, a negative value indicates a decrease in the given land cover. A less than one percent change is shown in the table when the change was less than plus or minus one percent. Poplar Creek and` Wabaunsee Creek watersheds have experienced the greatest increase in urban land cover. The data for Ferson Creek watershed is suspect as it shows a significant decrease in urban land cover (6.5 square miles about 0.4 percent of the Illinois portion of the Fox River watershed). This appears to be a consequence of a difference in the assignment of open space, grassed areas, classified as “urban” in the summary of 1991-1995 data and “rural” in the 1999-2000 data. The Mill Creek watershed data likewise shows a decrease in urban area. Anomalies such as these are expected, given the difference in the satellite imagery data, interpretation of those data, and slight differences between the watershed boundaries used to develop two sets of statistics. Wetland and other areas are a small percentage of the total land area; thus the small percentage changes listed may likewise be a consequence of the data resolution and imagery interpretation. This comparison provides guidance for interpretation of trends in water quality data collected between 1991 and 2000.
Table 2.7. 1999-2000 Land Cover as a Percentage of Tributary Watershed Area
and Percent Change between 1991-1995 Imagery and 1999-2000 Imagery
Tributary watershed Agriculture Change Forest Change
Urban and
built-up Change Wetland
and other Change Big Rock Creek 89.5 -1 4.3 1 4.6 <1 1.6 <1 Blackberry Creek 72.6 -1 7.8 2 17.3 2 2.3 -3 Buck Creek 97.7 <1 0.9 <1 0.5 <1 0.9 <1 Ferson Creek 69.4 14 13.1 2 16.2 -12 1.4 -4 Flint Creek 6.6 -4 30.2 1 53.8 6 9.4 -4 Indian Creek 93.4 <1 3.3 <1 1.4 <1 1.9 <1 Little Indian Creek 96.9 <1 1.7 <1 1.0 <1 0.4 <1 Little Rock Creek 90.8 <1 3.2 1 5.0 <1 1.0 <1 Mill Creek 62.6 1 8.1 2 27.8 -2 1.6 -2 Poplar Creek 6.2 -20 13.6 2 74.5 21 5.8 -3 Somonauk Creek 89.5 <1 4.4 1 3.5 <1 2.6 <1 Tyler Creek 68.0 <1 9.2 2 21.0 3 1.8 -4 Wabaunsee Creek 42.6 -15 3.4 1 52.1 16 2.0 -3
31

2.5. Population The Fox River watershed is one of the most populous watersheds in the state and is home
to about 11 percent of the state’s population. Lake, Kane, and McHenry Counties all rank among the top ten counties in population. According to the 1990 U.S. Census, the population within the Illinois portion of the Fox River watershed was 767,552 persons, and the 2000 census shows 1,010,106 persons in the Illinois portion of the watershed (588 persons per square mile), an increase of 242,554 persons, or 32 percent. The 2000 Census shows that the Wisconsin part of the watershed has 330,287 persons (353 persons per square mile), an increase of 11 percent (32,388 persons) from the 1990 population of 297,899. Between 1990 and 2000, the population of the six-county region of Northeastern Illinois (Lake, McHenry, Cook, DuPage, Kane, and Will Counties) grew to 8,091.720, an increase of 11.4 percent (NIPC, 2001). The Northeastern Illinois Planning Commission (NIPC) has developed population projections for 2020 for the six-county region, which includes McHenry, Lake, Kane, DuPage and Cook counties within the Fox River watershed. NIPC has developed population projections for two different scenarios for the location of a regional airport (NIPC, 2000). One scenario is based upon expansion of existing airports, the other is based upon the construction of a new airport south of Chicago. NIPC’s projections for the six-county region are listed in Table 2.8.
Population density of each subwatershed (HUC-12) within Illinois was computed using
the U.S. Census data for 1990 and 2000 (IDNR, 1991; U.S. Census Bureau, 2000). The population density of each subwatershed was computed as an area-weighted average using the area of each census block intersecting the subwatershed and the population density of the census block for the given year. The population density by subwatershed in 1990 and in 2000 is shown in Figures 2.17 and 2.18, respectively. In 1990 a population density of 3001 or more persons per square mile existed along the much of the mainstem of the Fox River in Kane County, Poplar Creek watershed, primarily in Cook County, Crystal Creek watershed in McHenry and Kane Counties, and Squaw Creek watershed in Lake County. By 2000, the entire corridor along the mainstem of the Fox River in Kane County had reached 3001 or more persons per square mile. The 2000 population density in the Waubansee Creek and Tyler Creek watersheds now ranks among those subwatersheds having the highest population density. The subwatershed containing Aurora had the highest density population in both 1990 and 2000.
Table 2.8. NIPC Population Projections for Six-County Region of Northeastern Illinois
County 1990 Census 2000 Census 2020 ORD 2020 SSA Cook 5,105,067 5,376,741 5,615,278 5,565,154 DuPage 781,666 904,161 985,704 985,812 Kane 317,471 404,119 552,034 548,965 Lake 516,418 644,356 806,779 782,544 McHenry 183,241 260,077 347,159 339,782 Will 357,313 502,266 738,046 822,743 Total 7,261,176 8,091,720 9,045,000 9,045,000
Notes: ORD = existing, improved airports alternative; SSA = south suburban airport alternative. Source: NIPC (2000).
32

MCHENRY
LAKE
COOK
DUPAGE
WILL
KENDALL
KANE
DEKALB
LEE
LASALLE
WISCONSIN ILLINOIS
GRUNDY
0 5 10 2.5 Miles
1:600,000
±
101 - 300 301 - 700 701 - 1000 1001 - 3000 3001 - 8000
Tributary WatershedsSubwatersheds
Population Density 1990 (people per square mile)
0 - 100
8001 - 15630
Figure 2.17. Fox River watershed population density 1990
33

MCHENRY
LAKE
COOK
DUPAGE
WILL
KENDALL
KANE
DEKALB
LEE
LASALLE
WISCONSIN
ILLINOIS
GRUNDY
0 5 102.5 Miles
1:600,000
±
101 - 300
301 - 700
701 - 1000
1001 - 3000
3001 - 8000
8001 - 21023
Tributary WatershedsSubwatersheds
Population Density 2000(people per square mile)
0 - 100
Figure 2.18. Fox River watershed population density, 2000
34
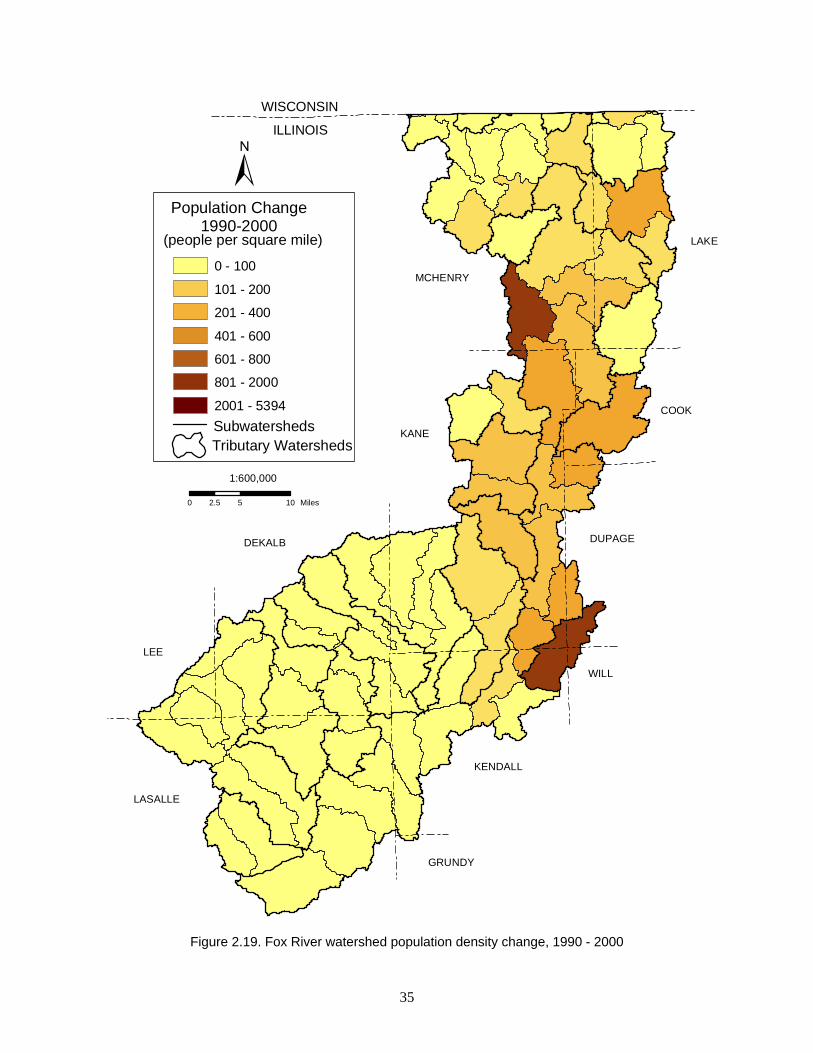
MCHENRY
LAKE
COOK
DUPAGE
WILL
KENDALL
KANE
DEKALB
LEE
LASALLE
WISCONSIN
ILLINOIS
GRUNDY
0 5 102.5 Miles
1:600,000
±Population Change
1990-2000(people per square mile)
Subwatersheds
101 - 200
201 - 400
401 - 600
601 - 800
801 - 2000
2001 - 5394
0 - 100
Tributary Watersheds
Figure 2.19. Fox River watershed population density change, 1990 - 2000
35

The change in population density between 1990 and 2000 is illustrated in Figure 2.19. Crystal Creek and Waubansee Creek watersheds experienced the greatest population growth in terms of increasing population density. Inspection of Figure 2.19 shows little population change in the southwest part of the watershed that lies in western Kane and Kendall Counties, and DeKalb, Lee, LaSalle and Grundy Counties. The greatest increase in population density in Illinois is along the mainstem of the Fox River from southern McHenry County to northern Kendall County.
The increase in population density implies increased development and attendant increases in impervious areas and urban pollution. Considering the population projects for 2020 for Kane, McHenry, and Lake Counties, population density will continue to increase over time. Using population growth as a predictor of increased pollution, this would imply increased loading of pollutants in the Fox River watershed. When there are significant changes, then pollutant loading may change, and contemporary water quality sampling is needed. Where population and land use have not changed dramatically, water quality data collected in prior years still may be reasonably representative for the watershed.
2.6. Summary
Standard data inputs needed to model water quality in a watershed include: elevation data, stream locations, soil types and properties, land cover, stream channel geometry, and flow data and climate data (precipitation and temperature). A summary of available data and recommendations for additional data acquisition follow. Given the costs and time to develop large spatial datasets, the following georeferenced data generally are considered appropriate for watershed modeling. Gaps in these regional datasets are noted in italics.
• Elevation data in the form of 30-meter resolution DEMs are available for the entire study
area and should be adequate for the watershed scale models, but data needs may change, depending on the resolution desired for individual tributaries.
• The National Hydrography Dataset (NHD) is state-of-the-art georeferenced river/stream data. The 1:24,000 scale high-resolution data (which should be adequate for modeling) is nearly completed for the lower Fox River watershed, but only low-resolution data are available for the upper Fox River watershed. Cost sharing with the USGS is a viable option to finalize the high-resolution data for the entire watershed in a timely manner.
• The SSURGO database has high-resolution soils information, but only for selected counties in the Fox River watershed: Kane, McHenry, DuPage, DeKalb, and Will Counties. The STATSGO database is available for the entire Fox River watershed at a scale of 1:250,000 but, in most cases, does not provide sufficient detail at the tributary level for detailed modeling. Counties are encouraged to work with the U.S. Department of Agriculture, Natural Resources Conservation Service to develop the SSURGO data.
• Land cover data have been compiled using aerial photography from 1999-2000. This will be adequate for initial modeling efforts but, should be updated frequently, given the population projections for the region.
36

• Stream channel geometry and information on dams along the Fox River are adequate for initial modeling needs. Information on tributary impoundments may be needed, depending on the resolution of tributary modeling.
• Flow monitoring on the Fox River recently has been enhanced by improvement of reporting at Montgomery, but compromised by loss of information at South Elgin due to the downgrading of the station from a continuous recording to a stage-only gage. Recent modifications to the dam at Algonquin have changed flow relationships. It is strongly recommended that the South Elgin gage (05551000) be reinstated as a continuous recording gage. The lack of flow data for many tributaries also will limit model capabilities, and establishing continuous recording gages is encouraged, particularly for those ungaged tributaries recommended for additional water quality sampling above.
• Precipitation data requirements depend on the model resolution (extent of aggregated land area and whether yearly, daily, or hourly simulations are desired). At a minimum, precipitation data should be collected for every gaged watershed with at least daily totals, and preferably hourly data should be collected. Precipitation data are lacking in the lower part of the watershed. Hourly data will provide the best resolution, but daily data are needed at a minimum.
37


Chapter 3. Review of Water Quality Studies of the Fox River Watershed
This chapter provides a review of various publications and studies concerning water quality issues in the Fox River watershed. A discussion of pollution sources and categories provides background information on typical pollution issues and a discussion of emerging issues identified in other watersheds provides additional background on urban watershed concerns.
3.1. Pollution Sources
Pollution sources to surface waters are typically divided into two major categories — point source (PS) and nonpoint source (NPS). A PS can be attributed to a specific physical location and has an identifiable, end-of-pipe point. The vast majority of PS discharges are from municipal and industrial wastewater treatment facilities. These pollution sources have relatively steady flows and chemical composition. The PS flows may constitute a significant portion of the river’s base flow and control in-stream water quality at low-flow conditions. These sources are regulated under the National Pollution Discharge Elimination System (NPDES) program, which establishes permissible limits of pollutants to be discharged into surface waters. The NPDES facilities located in the Fox River watershed and violations of permitted limits since 1998 are posted by the U.S. Environmental Protection Agency (USEPA) on the EnviroFacts Web site (USEPA, 2003c, 2003e).
An NPS, in contrast, is a diffuse source that cannot be attributed to a clearly identifiable
point of discharge. Examples are surface runoff from various land uses, such as agriculture and forests. Surface runoff carries pollutants from the land surface and discharges them into receiving waters. The magnitude and impacts of NPS are greatly governed by climatic conditions. The NPS tend to contribute dominant pollutant loads over PS during and shortly after large storm events. Factors such as land uses and management practices can have a great influence on NPS magnitude and duration. For example, the change from agricultural to urban land could result in higher total storm runoff and NPS loading from urban areas (Brun and Band, 2000; Miller et al., 2002). Quantities of fertilizers and pesticides applied to croplands and time of the application were found to affect loading of the pollutants and their distributions in receiving waters (Fallon et al., 2002).
Urban stormwater has a physical point of discharge and is regulated by NPDES permit.
However, stormwater pollution is a function of land use and precipitation, and is diffuse in nature. Stormwater permitting is currently more focused on registration of dischargers and follows a land-use/best management practice approach with self-monitoring for regulation. Groundwater seepage, septic tanks, and atmospheric deposition are also NPS contributors to surface water. Groundwater discharge into surface streams may represent a potential source of pollutants to some streams. Nutrients and naturally occurring elements commonly found in aquifers often contribute to pollution in surface waters. Septic tank systems are generally a problem only if they become clogged or water-bound. Failure of septic systems often contributes to nutrient problems in surface waters (Kothandaraman et al., 1977).
39

Atmospheric deposition of pollutants occurs in both dry and wet forms. Dry deposition accounts for exchange of particulate and gaseous materials between the atmosphere and global surface (including surface waters). Wet deposition refers to washout of all forms of pollutants by rainwater. The National Atmospheric Deposition Program (NADP), a cooperative research support program, collects data on the chemistry of precipitation for monitoring geographical and temporal long-term trends. Figure 3.1 illustrates trends of annual precipitation-weighted mean concentrations and total annual wet deposition of inorganic nitrogen at Argonne, Illinois, DuPage County (NADP, 2003). Annual precipitation-weighted mean concentrations were calculated using concentrations of weekly samples. The total annual wet deposition data were calculated by multiplying precipitation-weighted mean concentrations by total rainfall in the corresponding year.
Kothandaraman et al. (1977) analyzed rainwater nutrient concentrations in the Fox River
watershed at three locations in the Fox Chain of Lakes area during 1974–1975 (Table 3.1). The information allows for estimation of nutrient loads on the basis of concentrations in rainwater and assessment of the significance of atmospheric nutrients relative to surface and subsurface sources.
3.2. Use Impairment
In a biennial summary, the USEPA reported that of the 19 percent of the streams assessed by U.S. states, territories, and tribes, 39 percent of the assessed stream miles were impaired for one or more designated water uses (USEPA, 2002). Leading causes for stream impairment are pathogens (35%), siltation (31%), and habitat alteration (22%). Other causes include oxygen-depleting substances, nutrients, thermal modifications, metals, and flow alteration. The Illinois Environmental Protection Agency (IEPA) assessed 18.3 percent of the total stream miles in the
Table 3.1. Rainwater Quality Characteristics in the Fox Chain of Lakes Area during 1974–1975 (Kothandaraman et al., 1977)
Location
No. of samples
Range (mg/L)
Mean (mg/L)
Antioch Nitrate N 11 0.26 – 2.90 0.77 Kjeldahl N 9 0.65 – 5.01 2.88 Ammonia N 11 0.38 – 4.78 2.22 Total Phosphorus 11 0.12 – 0.64 0.27 State Park Nitrate N 8 0.32 – 1.58 0.81 Kjeldahl N 3 1.81 – 11.1 5.45 Ammonia N 8 0.32 – 5.67 1.97 Total Phosphorus 8 0.00 – 0.70 0.32 Lake Villa Nitrate N 16 0.37 – 2.43 1.11 Kjeldahl N 9 0.85 – 6.03 2.53 Ammonia N 14 0.40 – 4.82 1.90 Total Phosphorus 14 0.03 – 2.09 0.56
40

0.0
2.0
4.0
6.0
8.0
10.0
1982 1987 1992 1997 2002
Year
Ann
ual D
epos
ition
(kg/
ha)
NH4‐N
NO3‐N
Inorg. N
(a) Total annual wet deposition
0.0
0.2
0.4
0.6
0.8
1.0
1982 1987 1992 1997 2002Year
Mea
n C
once
ntra
tion
(mg/
L)
NH4‐N
NO3‐N
Inorg. N
(b) Annual precipitation-weighted mean concentrations
of nitrogen forms
Figure 3.1. Total annual wet deposition and annual precipitation-weighted mean concentrations of nitrogen forms, DuPage County, Argonne, IL, 1982-2001 (NADP, 2003)
41

state based on the most recent five-year monitoring data (e.g., 1996−2000 for the 2002 report). Nutrients, organic enrichment/low dissolved oxygen (DO), siltation, suspended solids, habitat alteration, pathogens, metals, and polychlorinated biphenyls (PCBs) were found to be potential causes for impaired streams and rivers in Illinois (IEPA, 2002a). Table 3.2 summarizes these statistics for the United States and Illinois.
Within the Fox River basin, leading causes for impairment to designated uses are similar to those found statewide except that flow alteration occurs more frequently in the Fox River basin than statewide (IEPA, 2002a). This is attributable to the many dam structures on the mainstem of the Fox River. These causes have led to degradation of ecological health and water quality in the Fox River basin. Biotic indices such as Index of Biotic Integrity (IBI) or Macroinvertebrate Biotic Index (MBI) are used to assess the level of aquatic life support (IEPA, 2002a).
Dreher (1997) conducted a regression analysis that showed a negative correlation
between population density and the IBI in northeastern Illinois streams. Based on the assessment of more than 40 streams and rivers (including those in the Fox River watershed), nearly all streams in urban/suburban watersheds (population density > 300 persons/square mile) exhibited signs of considerable impairment of fish communities. Ecosystem monitoring for the Critical Trends Assessment Project found that the Fox and Des Plaines River watersheds (assessed as
Table 3.2. Leading Potential Causes of Use Impairment and Impaired Mileage of Streams and Rivers in the United States and Illinois in Year 2000 (USEPA, 2002; IEPA, 2002a, 2003)
U.S.a Illinoisa Fox River watershedb
Cause
Impaired
miles
Percent of total
assessed
Impaired
miles
Percent of total
assessed
Impaired
milesc
Flow alterations 25,355 9.4 509 3.2 72.62 Habitat alteration 37,654 14 2,732 17.2 80.96 Metals 41,400 15.4 2,228 14 Nutrients 3,234 19.6 3,082 19.3 42.52 Organic enrichment/low DO 55,398 20.6 2,962 18.6 56.4 Pathogens (fecal coliform) 93,431 34.7 2,318 14.6 92.04 PCBs 2,435 15.3 136.48 pH 20,193 7.5 685 4.3 28.43 Priority organics 743 4.7 34.37 Salinity/TDS/Chlorides 14,620 5.4 643 4 Siltation 84,503 31.4 1,978 12.4 58.08 Suspended solids 14,077 5.2 1,728 10.9 54.49 Thermal modifications 44,962 16.7 9 0.06 Excessive algal growth 3.59 Notes: aYear 2002 listing. bYear 2003 listing. cTotal number of miles, therefore percent of total miles assessed not available at this time.
42

watershed units) generally scored below the statewide average for most biological indicators, indicating below average health of ecosystems in both watersheds (IDNR, 2001).
The Max McGraw Wildlife Foundation recently conducted an intensive study to
determine the effects of dams on fish and macroinvertebrate populations, aquatic habitat, and water quality in the Fox River during 2000–2001 (Santucci and Gephard, 2003). The study of approximately 100 miles of rivers and 15 mainstem dams between McHenry and Dayton provided a good assessment of the ecological communities in the river basin. Results showed higher quality fish communities in free-flowing portions of the river than impounded areas above dams based on IBI scores. The adverse effects of impoundment on nongame and sport fish communities extended well upstream of the dams. Similarly, free-flowing reaches supported more abundant and richer macroinvertebrate communities than impounded areas. In free-flowing reaches, there were a variety of water depths, current velocities, substrate types, and abundant cover for fish and invertebrates; good quality riffles and runs contributed to better habitat quality for fish and macroinvertebrates.
3.3. Water Quality
Pollutants were divided into seven categories to review water quality conditions in the Fox River basin. These categories include: nutrients, DO and pH, sediment and siltation, major and trace elements, pathogens, pesticides and synthetic organic compounds, and emerging water quality issues.
3.3.1. Nutrients
In an environmental context, nutrients typically refer to nitrogen (N) and phosphorus (P). The N exists in either dissolved or particulate forms, and in either inorganic or organic forms. These forms of nitrogen exhibit substantial differences in chemical properties. For example, NH4
+ cations are strongly sorbed unto some mineral surfaces while anionic species such as NO3-
are readily transported in water. Nitrite and organic N are unstable in aerated water and are considered to be an indication of pollution from sewage or organic waste at certain levels of concentration. These N forms are transformed via processes such as ammonification, nitrification, assimilation, and fixation. Environmental factors, such as nutrient concentration, DO concentration, solar energy, temperature, and flow, control the processes’ kinetics and magnitudes to a great extent. Detailed information about the N cycle is available on the Illinois State Water Survey (ISWS) Web site (http://www.sws.site.uiuc.edu/nitro/).
The P concentrations in surface waters are generally much lower than N concentration.
Phosphates are the most common forms of P found in natural waters and are not mobile in soil water because of their high affinity for soil particles. Attached P transported to water bodies by runoff poses a threat to the quality of receiving waters when released. Dissolved inorganic P is commonly known as orthophosphate or soluble reactive phosphorus, depending on methods used in chemical analyses.
43

Ammonia, nitrate, and phosphate are the main inorganic forms of dissolved nutrients present in surface water. They are biologically available and essential nutrients for algal growth. Excessive algal growth due to nutrient enrichment can degrade water quality in various ways: taste/odor of water supply, clogging of waterways, and low DO levels. Nutrient ratios such as total nitrogen to total phosphorus have been used to assess limiting nutrients for algal growth.
The ISWS has conducted water quality surveys in Illinois streams and rivers since the
late 19th Century, which has helped portray water quality conditions in early years. Table 3.3 lists statistics of the monitoring results for several Fox River locations from comprehensive surveys throughout Illinois streams and rivers (Harmeson and Larson, 1969; Harmeson et al., 1973). There was an apparent decrease in nitrate concentrations at the Algonquin station from 1956–1961 to 1966–1971, based on the concentration distributions during the two time periods. Nitrate concentrations at the Dayton station were in general higher than at the Algonquin station during 1956–1961. Both nitrate and phosphate concentrations were higher at the Batavia station than at the Algonquin station during 1966–1971.
The Northeastern Illinois Planning Commission (NIPC) conducted a study to assess
water quality conditions in the Fox River basin using the IEPA’s 1958−1975 monitoring data (Elmore et al., 1977). The study covered 12 stations on the mainstem of the Fox River and 10 stations on its tributaries. The data showed that total P concentrations at all stations were constantly above the P standard of 0.05 milligrams per liter (mg/L) for lakes and reservoirs (no P standard for rivers and streams). The nitrate + nitrite N concentration was mainly in a range below 1 mg/L to 5 mg/L.
Table 3.3. Statistics of Nutrient Concentrations in the Fox River, 1956–1971 (Harmeson and Larson, 1969; Harmeson et al., 1973)
Concentration (mg/L) not exceeded for indicated percentile
10 50 90 Nitrate Algonquin 1956–1961 3.2 6.0 12.0 1966–1971 1.1 4.1 10.1 Batavia 1966−1971 1.9 5.5 10.3 Dayton 1956−1961 3.4 7.6 13.5
Phosphate (filtered)
Algonquin 1960–1961 0.11 0.45 1.09 1966–1971 0.40 0.90 2.30 Batavia 1966–1971 0.80 1.85 2.90 Dayton 1960–1961 0.40 0.90 2.30
44

Adams et al. (1989) monitored two tributaries of the Fox River from March 1987 to November 1988 twice a month, and Table 3.4 summarizes the results. The mean concentration of P in both Blackberry Creek and Ferson Creek showed that dissolved P was 50 percent or less of total P. Nitrate was the dominant chemical form of nitrogen at the monitoring sites.
Singh et al. (1995) analyzed IEPA’s 1972−1992 monitoring data to study long-term trends and seasonal variation of water quality. In order to detect any improvement or worsening of a water quality parameter with respect to time, the data were divided into four time periods: 1972–1976, 1977–1981, 1982–1985, and 1987–1992. Data were segmented into four quarters to study seasonal variation: January–March, April–June, July–September, and October–December. Five stations along the mainstem of the Fox River with long records of monitoring data were selected for analysis: near Channel Lake, Algonquin, South Elgin, Montgomery, and Dayton. Nutrient conditions at these locations are summarized as below:
• Nitrate + nitrite nitrogen (NO3
- + NO2-): Overall conditions (1972–1992) were better at
Algonquin, followed in order by South Elgin, near Channel Lake, Montgomery, and Dayton. With the exception of Channel Lake, nitrate levels increased in the downstream direction. There were only isolated cases where the concentration exceeds the IEPA water supply standard of 10 mg/L. Trend analysis indicated practically no change at those stations. Seasonal variations showed lowest concentrations in July−September and highest concentrations in January−March.
• Ammonia + ammonium nitrogen (NH3 + NH4+): Overall conditions were better near
Channel Lake and Dayton, followed by Algonquin, Montgomery, and South Elgin. Trend analysis showed some decrease at all stations. Seasonal variations showed best conditions in April–June and July–September and worst conditions in January–March.
Table 3.4. Statistics of Nutrient Concentrations in Two Fox River Tributaries, 1987–1988 (Adams et al., 1989)
Mean
(mg/L) Max
(mg/L) Min
(mg/L) Standard deviation
Blackberry Creek Total P 0.12 0.48 0.03 0.10 Total dissolved P 0.05 0.20 0.01 0.03 Kjeldahl N 0.86 1.87 0.24 0.36 Ammonia N 0.16 0.40 0.01 0.10 Nitrate N 3.10 7.25 0.93 1.54 Ferson Creek Total P 0.10 0.30 0.03 0.06 Total dissolved P 0.05 0.16 0.01 0.03 Kjeldahl N 0.90 2.82 0.24 0.43 Ammonia N 0.18 1.09 0.01 0.17 Nitrate N 2.85 5.57 0.65 1.26
45

• Phosphorus (total): Overall, concentrations were from the lowest to highest in the following order: near Channel Lake, Algonquin, South Elgin, Montgomery, and Dayton. There was a steady, significant improvement at all stations except Montgomery. Concentrations were lowest in January−March or October−December and highest in July – September. On a regional scale, spatial distribution of nutrient concentrations was closely related to
land cover in northeastern Illinois. Sullivan (2000) reported the following observations based on IEPA and USGS 1978−1997 monitoring data:
• Relatively large ratios of N to P and nitrate to ammonia are characteristics of agricultural
drainage.
• Urban tributaries are characterized by smaller ratios of N to P and nitrate to ammonia. Total ammonium concentrations in the Fox River basin are generally lower than those in
urban areas of the Des Plaines River basin, and higher than those in the Kankakee River basin. Nitrate + nitrite N concentrations overall are lower in the Fox River basin than in the agriculturally dominated Kankakee and relatively urbanized Des Plaines River basins. Both dissolved and particulate forms of P are present, with municipal and industrial waste discharges being the major sources of dissolved P and agricultural land contributing mostly particulate P. In general, both total and dissolved P concentrations in the Fox River basin are comparable with respective P forms in the Kankakee River basin and lower than those in Des Plaines River basin (Sullivan, 2000).
Santucci and Gephard (2003) compared nutrient concentrations in the Fox River with the
recommended nutrient guidelines for Midwestern rivers and streams (Robertson et al., 2001). These nutrient guidelines were derived based on the observed occurrence of concentration levels, ranked as exceedence percentiles within a selected ecoregion. In general, the Fox River is nutrient enriched and supports high algal biomass. Total P was near the recommended 0.11 mg/L guideline for P in Zone 4 Midwestern streams at Stratton Dam (Robertson et al., 2001), increased to the 90th percentile between Stratton and South Elgin (0.54 mg/L), and remained elevated at all downstream stations. There was a modest decrease in P from Yorkville to Dayton Dam, a river reach with more than 26 uninterrupted miles of free-flowing habitat. Total N followed a pattern similar to total P except that peak N concentrations were near the 50th percentile for N in Zone 2 Midwestern streams (4.0 mg/L), and the decrease in N at the southernmost stations was more substantial. Nutrient concentrations in impounded sediments were considered to range from low to moderate levels.
3.3.2. Dissolved Oxygen and pH
Dissolved oxygen (DO) is one of the most fundamental parameters indicative of aquatic ecosystem health. It is essential to support healthy aquatic biological communities. Although most anthropogenic water uses do not require high DO concentrations, the usefulness of water may be limited by low DO concentrations.
46

Major sources of DO in surface waters are gaseous oxygen in the atmosphere via dissolution and production from photosynthetic activities of aquatic organisms. Solubility of oxygen is governed by environmental factors such as barometric pressure, temperature, and chemical constituents in the water. It normally decreases with decreasing atmospheric pressure and with increasing temperature. The oxygen reaeration rate, which is governed largely by stream turbulence, increases with stream velocity (Bowie et al., 1985). Photosynthetic production of oxygen is typically highest during the daylight hours when sunlight is available and often results in supersaturation of DO in the water.
The DO is consumed from aquatic systems by biological respiration, decomposition of
organic materials, and oxidation of inorganic waste. As a result, enrichment of organic and inorganic wastes [e.g., high biochemical oxygen demand (BOD) and ammonia levels] may lead to low DO concentrations in waters. Bacteria and plant respiration that reduce oxygen concentrations at night can cause temporary low DO levels. This diurnal variation can be dramatic with high algal biomass as a result of nutrition enrichment and sluggish hydraulic conditions. Butts and Evans (1978a) found significant DO swings in the impoundment area above the dams in northeastern Illinois streams. The dams aerate or deaerate water flowing over the structures depending on the upstream DO concentration.
Benthic organisms also consume DO from degrading organic compounds in underlying
sediments. This sediment oxygen demand (SOD) could be significant in backwater lakes or in-stream pools where flow velocity and turbulence are greatly reduced. Butts and Evans (1978b) measured SOD in selected northeastern Illinois streams, and their results showed that rate of SOD ranged from 1.54 to 9.37 grams per square meter per day or g/m2/day (temperature-corrected at 25 oC). In the Fox River waters, the high SODs were found in Aurora and Elgin areas on the Fox River.
A side effect of high algal biomass is increased pH value due to consumption of carbon
dioxide or bicarbonate by algae for production of cellular material. The magnitude of pH swing depends on water buffering capacity. The fluctuation of pH can change the balance between different forms of chemical elements (e.g., NH3 and NH4
+) and their fate in the environment. Brick and Moore (1996) showed diurnal variation of trace metal concentrations due to DO and pH effects on the solubility of the trace metals stored in streambeds and floodplains in the upper Clark Fork River, Montana. The results imply that daytime sampling may underestimate flux of the metals in the river.
Numerous studies and reports have summarized DO concentrations in the Fox River
watershed based on regular and focused data monitoring over the years. During 1958–1975, DO concentrations in the Fox River basin (Elmore et al., 1977) occasionally fell below the water quality standards 6 mg/L (should not be less than 6 mg/L during at least 16 hours of any 24-hour period) and 5 mg/L (at no time). Values of pH sporadically exceeded IEPA’s standard (6.5 < pH < 9) along the mainstem of the river.
Due to diurnal variation in DO, results are dependent on the monitoring methodology.
The standard practice for ambient water quality monitoring by the IEPA is to sample during daylight hours, typically between 8 a.m. and 4 p.m. These data, representative of daylight DO
47

conditions, do not represent the full spectrum of DO values. Specialized studies that provide continuous monitoring tend to show lower values of DO during night hours in streams with high algal biomass. Singh et al. (1995) summarized the IEPA’s ambient water quality monitoring DO data from 1972–1992 at five stations on the mainstem of the Fox River. Overall concentrations did not vary significantly from station to station. Trend analysis revealed that DO had decreased slightly during the time period at the stations. Seasonal variations indicated October – December or January – March had the best DO conditions and July – September had the worst (lowest).
Terrio (1995) summarized monthly sampling data at eight fixed stations in the upper
Illinois River basin (two in the Fox River basin) and from several synoptic surveys during 1987–1990. Results showed that median DO concentrations (measured during daylight hours) in the upper Illinois River basin were in the 3.4 – 12.2 mg/L range. During a low-flow synoptic sampling (measurements made prior to sunrise), all DO concentrations in the Fox River basin equaled or exceeded 5.0 mg/L. In comparison, median DO concentrations in the Fox River basin were substantially higher than those in Des Plaines and Kankakee River basins. Diurnal variation in DO concentration in the Fox River basin was the most significant of the three river basins. Adams et al. (1989) reported monitoring results for two tributaries of the Fox River during 1987–1988, which showed less variability in DO concentrations in the tributaries than in the mainstem of the Fox River reported by Terrio (1995). Table 3.5 presents a statistical summary of DO concentrations from both studies.
Singh et al. (1995) conducted continuous measurements of DO and pH in St. Charles
Pool of the Fox River during 1993−1994 and reported violations of IEPA water quality standards for DO and pH as a result of the diurnal variations. Results also showed that mean DO concentrations and variability decreased as water depth increased. The time period of low DO (<5 mg/L) was longer at the bottom of the stream than near the surface. The SOD rate in the deep pool area near the dam was higher and became increasingly lower upstream near the free-flowing reach.
Table 3.5. Statistical Summary of Dissolved Oxygen Concentrations in Surface Water Samples Collected in the Fox River Basin, 1987–1990 (Terrio, 1995; Adams et al., 1989)
Station name Concentration (mg/L) not exceeded for indicated percentile 10 25 50 75 90 Fox River Algonquin1 5.0 6.3 8.7 11.3 14.8 Dayton1 8.5 10.3 12.2 14.2 16.0 Blackberry Creek2 6.6 7.6 8.9 11.1 12.5 Ferson Creek2 6.7 7.8 9.0 11.0 12.5
Notes: 1USGS, April 1986−August 1990. 2ISWS, March 1987−November 1988.
48

Santucci and Gephard (2003) reported that the DO concentration fluctuated widely on a daily basis in impounded areas (2.5 mg/L − >20 mg/L), but not in free-flowing areas (5 mg/L − 10 mg/L). These wide fluctuations resulted in violations of the IEPA standards at nine of the 11impounded areas, but only two of the 11 free-flowing stations. Maximum pH values were at or above the upper IEPA standard at eight of the 11 impounded areas and four of the 11 free-flowing stations. Impounded areas were more susceptible to prolonged hours of low DO and high pH than free-flowing areas. Locations with significant prolonged duration, during a 24-hour period, of substandard DO level (<5 mg/L) included Algonquin (15 hours), Carpentersville (9.25 hours), Elgin (15.5 hours), North Batavia (8.25 hours), North Aurora (12.75 hours), and Stolp Island (13.5 hrs), based on continuous monitoring August 6−August 17, 2001.
3.3.3. Sedimentation/Siltation
Sedimentation embodies the processes of erosion, entrainment, transportation, deposition, and compaction of sediment (Gottschalk, 1977). Siltation is regarded as a simple change from large to small particles, or visually as a covering of original gravel and cobble substrates with silt and sand (Waters, 1995). The impact on aquatic ecosystems is turbidity, loss of benthic productivity, and loss of habitat. Anthropogenic sediments rarely act alone in their effects on the biological communities in streams. Other factors, such as loss of fish habitat, nutrient over-enrichment, and toxins, frequently accompany sedimentation and siltation. Common sources of sediment are streambank erosion, agriculture, forestry, mining, and urban development, among others. Any construction activity produces some of the greatest quantities of sediment (Waters, 1995).
In the Fox River watershed, sedimentation is a concern in the Fox Chain of Lakes and
downstream reaches of the river (Bhownik and Demissie, 2002). Sullivan (2000) summarized IEPA and U.S. Geological Survey (USGS) 1978−1979 monitoring data for suspended solids (SS) for streams and rivers in the upper Illinois River basin. Monitoring sites in the Fox River watershed showed the largest variability in terms of median SS concentrations, which ranged from <10 mg/L (Poplar Creek) to >50 mg/L (Dayton) — the highest in the upper Illinois River basin. Most median SS concentrations in the Fox River fell in the 20−40 mg/L range. Seasonal variation indicated highest SS concentrations in the summer and lowest concentrations in the winter. The SS increase during the summer corresponded to higher streamflow due to increased runoff and transport of particles. Under low-flow conditions, increased phytoplankton growth in the summer months also contributes to higher SS concentrations.
Bhowmik et al. (1986) used weekly instantaneous data collected by the ISWS in 1981
and estimated sediment loads as 49,425 tons/year and 182,005 tons/year at Algonquin and Dayton, respectively. Another ISWS study estimated 5,400 tons/year in Ferson Creek near St. Charles using 1987−1988 sampling data (Adams et al., 1989). Sullivan (2000) estimated SS loads of 50,500, 46,400, and 331,000 tons/year carried by the Fox River at Algonquin, South Elgin, and Dayton, respectively. A recent USGS study estimated 29,400 tons/year of SS carried by the Fox River at Johnsburg (Schrader and Holmes, 2000). Table 3.6 lists stations and estimated sediment loads from these studies. A net deposit of sediment has been observed in the Fox River from Johnsburg to Dayton. Net deposition is deposition less scour. Santucci and
49

Table 3.6. Estimated Sediment loads in the Fox River watershed Station
Program/study
Data period (source)
SS load (tons/yr)
Fox River Johnsburg USGS (Schrader and Holmes, 2000) 1997 – 1999 (USGS) 29,400 Algonquin NAWQA (Sullivan, 2000) 1979 – 1996 (IEPA) 50,500 ISWS (Bhowmik et al., 1986) 1981 (ISWS) 49,425 S. Elgin NAWQA (Sullivan, 2000) 1989 – 1996 (IEPA) 46,400 Dayton NAWQA (Sullivan, 2000) 1978 – 1996 (IEPA) 331,000 ISWS (Bhowmik et al., 1986) 1981 (ISWS) 182,005 Ferson Creek St. Charles ISWS (Adams et al., 1989) 1987 – 1988 (ISWS) 5,400 Gephard (2003) recorded sediment depths at 544 probe locations in impounded habitat upstream of 12 Fox River dams and concluded that largest sediment deposits tended to occur downstream of islands and along impoundment margins above the dams. The main channel of several impoundments remained relatively free from sediment accumulation.
3.3.4. Major Elements and Trace Elements
Major elements are those normally present in water at concentrations greater than 1 mg/L (Hem, 1985). Some examples of major elements are aluminum, iron, and manganese. Elements normally present at concentrations less than 1 mg/L are considered as minor or trace elements. Most trace elements commonly found in surface waters are metals, such as copper, mercury, cadmium, chromium, and lead. However, these trace metals also may be present at concentrations greater than 1 mg/L as a result of various sources.
Sources of major and trace elements can be categorized as background and anthropogenic
sources (Fitzpatrick et al., 1995). Background sources include runoff carrying eroded rocks and natural soils or groundwater from shallow aquifers. Extensive aquifers in the Ordovician and Silurian bedrock are known to contribute to the base flow of the Fox River in Kane County (Fitzpatrick et al., 1992). Anthropogenic sources may include PS discharges, atmospheric deposition, and surface runoff. Point discharges that originate from groundwater may contain elevated levels of some trace elements existing in bedrock and soil. In the Fox River watershed, some NPDES discharge facilities were found in violation of trace elements such as barium (USEPA, 2003c).
Toxicological effects on biota may occur due to uptake of the elements from water and
sediment, or from consuming other organisms. Speciation and partitioning of the elements exert a great control on uptake processes. The elements, once in biota, can accumulate in certain tissues (bioaccumulation) and cause various toxic effects. In addition, trace elements in water
50
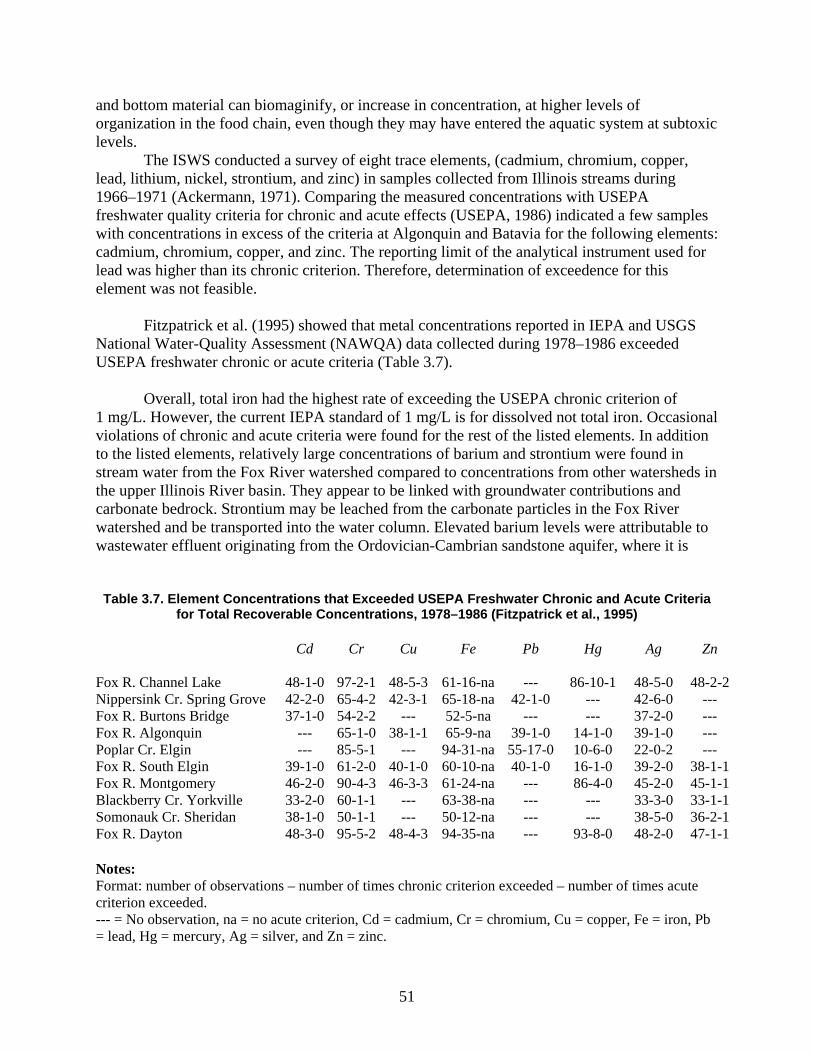
and bottom material can biomaginify, or increase in concentration, at higher levels of organization in the food chain, even though they may have entered the aquatic system at subtoxic levels.
The ISWS conducted a survey of eight trace elements, (cadmium, chromium, copper, lead, lithium, nickel, strontium, and zinc) in samples collected from Illinois streams during 1966–1971 (Ackermann, 1971). Comparing the measured concentrations with USEPA freshwater quality criteria for chronic and acute effects (USEPA, 1986) indicated a few samples with concentrations in excess of the criteria at Algonquin and Batavia for the following elements: cadmium, chromium, copper, and zinc. The reporting limit of the analytical instrument used for lead was higher than its chronic criterion. Therefore, determination of exceedence for this element was not feasible.
Fitzpatrick et al. (1995) showed that metal concentrations reported in IEPA and USGS
National Water-Quality Assessment (NAWQA) data collected during 1978–1986 exceeded USEPA freshwater chronic or acute criteria (Table 3.7).
Overall, total iron had the highest rate of exceeding the USEPA chronic criterion of
1 mg/L. However, the current IEPA standard of 1 mg/L is for dissolved not total iron. Occasional violations of chronic and acute criteria were found for the rest of the listed elements. In addition to the listed elements, relatively large concentrations of barium and strontium were found in stream water from the Fox River watershed compared to concentrations from other watersheds in the upper Illinois River basin. They appear to be linked with groundwater contributions and carbonate bedrock. Strontium may be leached from the carbonate particles in the Fox River watershed and be transported into the water column. Elevated barium levels were attributable to wastewater effluent originating from the Ordovician-Cambrian sandstone aquifer, where it is
Table 3.7. Element Concentrations that Exceeded USEPA Freshwater Chronic and Acute Criteria for Total Recoverable Concentrations, 1978–1986 (Fitzpatrick et al., 1995)
Cd Cr Cu Fe Pb Hg Ag Zn Fox R. Channel Lake 48-1-0 97-2-1 48-5-3 61-16-na --- 86-10-1 48-5-0 48-2-2 Nippersink Cr. Spring Grove 42-2-0 65-4-2 42-3-1 65-18-na 42-1-0 --- 42-6-0 --- Fox R. Burtons Bridge 37-1-0 54-2-2 --- 52-5-na --- --- 37-2-0 --- Fox R. Algonquin --- 65-1-0 38-1-1 65-9-na 39-1-0 14-1-0 39-1-0 --- Poplar Cr. Elgin --- 85-5-1 --- 94-31-na 55-17-0 10-6-0 22-0-2 --- Fox R. South Elgin 39-1-0 61-2-0 40-1-0 60-10-na 40-1-0 16-1-0 39-2-0 38-1-1 Fox R. Montgomery 46-2-0 90-4-3 46-3-3 61-24-na --- 86-4-0 45-2-0 45-1-1 Blackberry Cr. Yorkville 33-2-0 60-1-1 --- 63-38-na --- --- 33-3-0 33-1-1 Somonauk Cr. Sheridan 38-1-0 50-1-1 --- 50-12-na --- --- 38-5-0 36-2-1 Fox R. Dayton 48-3-0 95-5-2 48-4-3 94-35-na --- 93-8-0 48-2-0 47-1-1 Notes: Format: number of observations – number of times chronic criterion exceeded – number of times acute criterion exceeded. --- = No observation, na = no acute criterion, Cd = cadmium, Cr = chromium, Cu = copper, Fe = iron, Pb = lead, Hg = mercury, Ag = silver, and Zn = zinc.
51

present in a dissolved phase (Gilkeson et al., 1983). There were violations of the limit of barium concentration in NPDES discharges reported (USEPA, 2003c). However, these two elements were still within background concentrations found in rocks, soils, and surficial deposits (Fitzpartick et al., 1995).
Assessing concentrations found in tissues is difficult due to lack of complete screening criteria for tissue concentrations that cause adverse effects. However, contamination can be assessed by comparing the concentration in biota with those at other stations in the same region. During 1989–1990, the largest barium concentrations observed in biota in the upper Illinois River basin were 129 micrograms per gram (µg/g) in crayfish from Indian Creek in the Fox River watershed. Concentrations of cadmium in carp livers from the Fox River at Dayton and Big Rock Creek were elevated with respect to concentrations at other sites in the upper Illinois River basin. The largest concentration of copper in carp livers was observed in Big Rock Creek. Mercury concentrations in livers of common carp and white suckers indicated enrichment at Fox River tributaries (Blackberry Creek and Big Rock Creek), along with West and East Branches of the DuPage River and Iroquois River. Big Rock Creek was also one of the eight sites in the region with elevated selenium concentrations in carp livers. The Fox River at Dayton and Big Rock Creek had the highest zinc concentrations in carp livers. Blackberry Creek was one of the sites with elevated zinc concentrations in white suckers (Fitzpatrick et al., 1995).
Santucci and Gephard (2003) analyzed for heavy metal concentrations in sediment
samples collected from impounded areas above 12 Fox River dams between Algonquin and Dayton. In general, sediment contaminant conditions were similar between core (bulk) and ponar (surface) sediment samples from impounded areas, and between impounded and free-flowing surface sediments. Core samples above Yorkville Dam had concentrations of heavy metals, particularly cadmium, mercury, and lead, that were more than double the probable effect concentration guidelines (MacDonald et al., 2000). However, the measured contaminants in ponar samples from the Yorkville impoundment were low.
3.3.5. Pathogens
Most microorganisms are beneficial and an essential part of the ecosystem. For example, microorganisms can facilitate decomposition of natural and synthetic organic compounds, serve as a food source, and play an essential role in cycling of chemical elements. However, a small subset of microorganisms is known to cause sickness or even death of animals and humans. As a group, these disease-causing microorganisms are known as pathogens. The most commonly known pathogens to cause waterborne diseases can be grouped into three general categories: bacteria, protozoans, and viruses (USEPA, 2001c). These pathogenic organisms are present in polluted waters with a wide variety of characteristics and types, and they are difficult to isolate and identify. As a result, scientists and public health officials have chosen some nonpathogenic bacteria as indicator organisms for assessing water quality. Indicator groups are normally associated with pathogens transmitted by fecal contamination and used to indicate the presence and abundance of pathogenic organisms. Large numbers of fecal coliform present in water presumably indicate a greater likelihood that pathogens are present (McMurray et al., 1998).
52

Types of fecal-indicator bacteria used for monitoring and regulatory purposes include several members of the coliform group: total coliforms, fecal coliform, Escherichia coli (E. coli), and streptococcal groups. Specific sources of these bacteria are wastewater treatment plant effluents; runoff from feedlots, rendering plants, and food processing facilities; and septic drainage and animal wastes. During and immediately after storms events, runoff carrying pathogens from lands can seriously deteriorate water quality in the receiving water. This has been a concern because the current water quality standards for fecal coliform were set at a constant level without addressing wet weather conditions (WEFTEC, 2002).
The IEPA’s standard for fecal coliform for general-use waters is that the geometric mean
of at least five samples within a 30-day period shall not exceed 200 colonies/100 milliliters (mL) during May−October, nor shall more than 10 percent of the samples during any 30-day period exceed 400 colonies/100 mL. For water supply use, the geometric mean of a minimum of five samples within a 30-day period shall not exceed 2000 colonies/100 mL. It is usually not feasible to determine compliance with the standards because most monitoring programs do not meet the requirement of at least five samples in 30 days. However, it is informative to compare results of individual samples with the standards.
Analysis of 1958–1971 IEPA data at 22 locations in the Fox River watershed showed
fecal coliform counts varied widely with several orders of magnitude differences (Elmore et al., 1977), suggesting pathogen-related parameters were greatly affected by irregular sources such as surface runoff related to rain events. Singh et al. (1995) computed cumulative percent values for 1972−1992 fecal coliform data at five stations, and their results indicated better conditions (lower coliform levels) at Algonquin, near Channel Lake, Dayton, South Elgin, and Montgomery. Fecal coliform counts in individual samples at all five locations were occasionally above the IEPA’s water supply standard and frequently above the general-use standards, with the exception of samples at Algonquin. Trend analysis showed almost no change near Channel Lake, some reduction at Algonquin and Dayton, and a steady reduction at South Elgin and Montgomery. Trend variations indicated higher fecal coliform counts in April–June and July–September. However, there was no consistent seasonal trend.
On a regional scale, Terrio (1995) reported funding bacteria densities larger than federal
criteria and state standards in a higher percentage of samples collected at fixed stations in urban areas than those collected in agricultural areas. During 1987–1990, three of 54 samples collected at Algonquin exceeded the 200 colonies/100 mL standard and 10 of 52 samples collected at Dayton exceeded the standard. A 24-hour sampling took place in the Fox River at South Elgin downstream from a wastewater treatment plant discharge. The results showed variable E. coli densities in the streams, but the variability could not be related to either waste water treatment plant discharge or streamflow at the site. Significant downward trends in fecal coliform densities were found at Algonquin and Dayton during 1978–1990.
3.3.6. Pesticides/Synthetic Organic Compounds
Pesticides have provided important benefits by increasing food production and protecting humans from disease. These mostly synthetic organic compounds (SOCs) are used to control various target organisms. How a pesticide acts varies and is often highly complex, but toxicity
53

usually takes effect by interfering with the biochemical processes of pest or target organisms (Baird, 1995). Other SOCs (e.g., PCBs) are used mainly in manufacturing. Their number approaches 60,000, with even more degradation products (Shackelford and Cline, 1986). Uses of these SOCs have become a major concern because of their potential hazard to the environment and human health.
Depending on their physicochemical properties, parent and degraded SOCs often exhibit
varying toxicity and may be present in different environmental media. The impacts are greatly governed by fate and transport of the chemicals in the environment. Hazardous impacts include kill of aquatic species and wildlife, and human poisoning via pollution of surface and groundwater or air (Merrington et al., 2003).
Sources of pesticides and other SOCs fall into several general categories: point discharge
of municipal and industrial wastewater, accidental spills, NPS runoff, groundwater discharges, and atmospheric deposition (Sullivan et al., 1998). As a result, distribution of SOCs in surface waters is governed by characteristics of their sources and chemical properties of the compound. Monitoring and analysis of the parent and degraded compounds can help to identify the sources and assess their impacts to the environment.
There are no existing standards for SOCs, but some national criteria have been developed
as shown in Table 3.8. Table 3.8. National Criteria for Selected Synthetic Organic Compounds in Water and Aquatic Biota
Compound For protection
of human health For protection of fish-
eating birds and mammals (based on whole-fish samples)
For protection of human health (based on edible portions of fish)
aUSEPA primary drinking water standard:
MCL (µg/L)
bNAS recommended maximum tissue
concentration (mg/kg)
cUSFDA action level
(mg/kg)
dUSEPA fish tissue concentration
(mg/kg) Alachlor 2 Atrazine 3 Chlordane 0.1 0.3 0.0083 p,p’-DDT 1.0 5.0 0.0316 Dieldrin 0.1 0.3 0.00067 PCBs 5.0 Notes: aUSEPA (1992a). bNAS (1972). cU.S. FDA (1990, 1991a, 1991b, 1991c). dUSEPA (1992b).
54

As a pilot study of the NAWQA Program, Sullivan et al. (1998) investigated the distribution of pesticides and other SOCs in water, sediment, and biota in the upper Illinois River basin using data collected by various agencies during 1975–1990. Most of the compounds analyzed were in concentrations lower than detection limits of the analytical instruments used. Table 3.9 lists stations in the Fox River for which more than nine samples analyzed for SOCs had noticeable levels.
Sullivan et al. (1998) also reported that unsieved sediment samples collected from the
Fox River watershed (1978 – 1988) had dieldrin levels primarily less than 1 microgram per kilogram (µg/kg) with two sites in the 1−2.4 µg/kg range. Most dichlorodiphenyltrichloroethane (DDT) concentrations fell in the 10−12.5 µg/kg range, with some in the 12.5−85.5 µg/kg range. The PCB concentrations were in the 10–30 µg/kg range, with some in the 30–205 µg/kg range. The clay/silt fraction had PCB concentrations primarily below 10 µg/kg, with one sample in the 10−11 µg/kg range. Concentrations of PCBs, DDT, and dieldrin in unsieved streambed sediments collected from Fox River basin were lower than those collected from the Chicago and Des Plaines River watersheds.
Total chlordane, total DDT, and total PCBs in fish tissues usually were detected at higher
concentrations in the urban and more highly populated areas, and dieldrin usually was detected at higher concentrations away from the urban areas. The station at Burtons Bridge in the Fox River had among the highest of chlordane concentrations in whole carp fish (1978–1988). Elevated concentrations of PCBs in whole carp were found in the Fox River at Burtons Bridge and Montgomery (1978–1988). Dieldrin concentrations in whole carp were among the highest in the
Table 3.9. Statistics of Selected SOC Concentrations in Water Samples Collected from the Fox River Watershed, 1975–1990 (Sullivan et al., 1998)
Concentration µg/L at indicated percentile
Station Time
period No. of
samples 10 25 50 75 90 North Channel Lake
PCPa 1979–1988 18 < 0.01 < 0.01 0.015 PCP 1987–1990 10 < 0.01 < 0.01 < 0.01
T.P.C.b 1987–1990 32 2.1 2.8 3.7 5.0 6.7 Algonquin
T.P.C. 1987–1990 43 2.1 2.6 3.4 4.4 5.0 Montgomery
PCP 1979–1988 21 0.012 0.019 0.04 PCP 1987–1990 8 < 0.01 < 0.01 0.012
T.P.C. 1987–1990 32 2.4 3.0 3.6 4.5 5.0 Dayton
PCP 1979–1988 17 0.011 0.023 0.034 T.P.C. 1987–1990 48 1.7 2.3 3.2 4.4 5.0
Notes: aPCP: Pentachlorophenol bT.P.C.: Total Phenolic Compounds
55

upper Illinois River basin (1978−1988). Big Rock Creek had relatively high chlordane concentrations in whole fish samples based on 1989–1990 data. Dayton had relatively high PCB concentrations in whole fish samples.
Short and Henebry (2001) summarized results of stream surface water samples collected
by IEPA between October 1985 and December 1998 and analyzed these for currently used pesticides. Atrazine, the most commonly detected herbicide, was present in 71.4 percent of the samples, followed by metolachlor (54.8%), cyanazine (49.5%), alachlor (44.4%), metribuzin (12.6%) and trifluralin (6.7%). Pesticide concentrations were generally low in the Fox River. Median concentrations of atrazine and alachlor at Algonquin were 0.05 and 0.02 µg/L, respectively, well below their corresponding drinking water standard, 3 and 2 µg/L, respectively.
Pesticides, polycyclic aromatic hydrocarbons (PAHs), and alkylphenols (endocrine
disruptors) had low levels in sediment samples collected during 2000–2001 (Santucci and Gephard, 2003). All samples had undetectable levels of PCBs, which suggests low levels in sediments.
3.3.7. Emerging Water Quality Issues A mounting pressure on the quality of water resources is continued population growth. There is a suite of chemicals used in households, pharmaceuticals, and other consumables, as well as biogenic hormones, released directly to the environment via wastewater treatment processes, overflow or leakage from storage structures, or land application (Halling-Sorensen et al., 1998). These chemicals are of concern because they were developed to have biological effects. Potential concerns include increased toxic effects, development of more harmful bacteria, and endocrine disturbances of human and animals (Jorgensen and Halling-Sorensen, 2000). The USGS conducted a nationwide study of pharmaceuticals, hormones, and other organic wastewater contaminants in 139 streams during 1999 and 2000 (Barnes et al., 2002). Nippersink Creek was the only Fox River watershed stream the study. The 30 most frequently detected compounds represent a wide variety of uses and origins, including residential, industrial, and agricultural sources. Only 5 percent of the concentrations for these compounds exceeded 1 µg/L. More than 60 percent of these higher concentrations were derived from cholesterol and three detergent metabolites (Kolpin et al., 2002).
3.4. Summary
Pollution sources in the Fox River watershed include those regulated under the NPDES program and (surface runoff, groundwater seepage, and atmospheric deposition). Municipal and industrial wastewater treatment discharges may constitute a significant portion of the river’s base flow and dominate in-stream water quality at low-flow conditions. The NPS impacts are largely governed by rainfall, land uses, and land management practices. Designated uses of the Fox River are impaired due to various causes, including nutrients, organic enrichment/low DO, pathogens, SS, flow alteration, and habitat alteration. Ecosystem monitoring found that the Fox and Des Plaines River watersheds (assessed as a unit) generally scored below the statewide
56

average for most biological indicators. Deteriorated biological integrity was found to correlate with urbanization and in-stream dam structures.
Water quality constituents were divided into seven categories to review previous studies
of water quality conditions: nutrients, DO and pH, sedimentation/siltation, major and trace elements, pathogens, pesticides/synthetic organic compounds, and emerging water quality issues.
A trend analysis of 1972–1992 nutrient data at five locations on the mainstem of the Fox
River indicated that nitrate/nitrite underwent no significant changes during the time period, with lowest concentrations in the warm season (July–September) and highest concentrations in the cold season (January–March). Ammonia nitrogen exhibited lowest levels during April–June and highest levels during January–March. Total phosphorus showed steady significant improvement (except at Montgomery) with lowest levels during January–March or October–December and highest levels during July–September.
On a regional scale, chemical forms and spatial distribution of nutrients are governed by
land uses in the watershed. Agricultural drainage had relatively large N to P and nitrate to ammonia ratios. Urban tributaries had smaller ratios of N to P and nitrate to ammonia. The Fox River watershed has a lower ammonia level than the Des Plaines River watershed and lower nitrate concentrations than the Kankakee River watershed. Levels of P are comparable with those in the Kankakee River’s watershed and lower than those in the Des Plaines River watershed. Most recent studies indicated nutrient-enriched high algal biomass in the Fox River during summer and fall seasons.
There was a decreasing DO trend during 1972–1992 based on IEPA’s ambient
monitoring program. Lowest DO levels were found during July–September. Tributaries of the Fox River exhibited less DO variability than the mainstem. Continuous monitoring showed a longer period of low DO in pool reaches than in free-flowing reaches, and near the river bottom rather than at the water surface. Similar diurnal variation was found in pH measurements, with high pH value corresponding to high DO concentration.
The Fox River watershed exhibited the largest variability in SS concentrations compared
to neighboring watersheds in the upper Illinois River basin, within which Dayton had the highest concentration. In general, summer SS concentrations are highest in summer and lowest in winter. High concentrations in summer corresponded to runoff and algal biomass. The sediment load in the Fox River shows an increasing trend from upstream to downstream. Largest sediment deposition tended to occur downstream of islands and along impoundment margins above dams. The main channel of several impoundments remained relatively free of sediment accumulation.
Elements that exceeded USEPA freshwater chronic and acute criteria based on 1978–
1986 sampling include: cadmium, chromium, copper, iron, lead, mercury, silver, and zinc. Overall, iron had the highest rate of exceeding its chronic criterion. Assessing concentrations found in biological tissues is difficult due to incomplete screening criteria for causing adverse effects. Contamination of metals was assessed by comparing concentrations in biota with those at other stations in the same region. Sediment contamination conditions due to metals were similar between core and ponar samples. Core samples above Yorkville Dam had concentrations of
57

heavy metals, particularly cadmium, mercury, and lead, that were more than double probable effect concentration guidelines.
Fecal coliform counts varied widely with several orders of magnitude differences,
suggesting pathogen-related parameters were greatly affected by irregular sources such as surface runoff related to rain events. On a regional scale, bacteria densities larger than the federal and state standards were found in higher percentages of samples collected in urban areas than agricultural lands. Continuous, 24-hour sampling at South Elgin downstream from a wastewater treatment plant discharge showed variable E. coli densities in streams, but the variability could not be related to either wastewater treatment plant discharge or streamflow at the site.
Concentrations of pesticides and SOCs in the Fox River watershed were lower than those
in Chicago and Des Plaines River watersheds. Noticeable concentrations of PCPs and T.P.C.s were found in water samples based on 1975 – 1990 data. Total chlordane, total DDT, and total PCBs in fish tissues usually were detected at higher concentrations in the urban and more highly populated areas, and dieldrin usually was detected at higher concentrations away from the urban areas. Among the pesticides identified in sediment samples, atrazine was the most commonly detected herbicide, followed by metolachlor, cyanazine, alachlor, metribuzin, and trifluralin.
Emerging water quality issues are related to chemicals commonly used in households,
pharmaceuticals, and other consumables, as well as biogenic hormones. Those chemicals are of concern because they were developed to have biological effects. Potential concerns include increased toxic effects, development of more harmful bacteria, and endocrine disturbances in humans and animals.
58
Chapter 4. The Fox River Watershed Water Quality Database
Water chemistry data from various sampling activities in the Fox River watershed were compiled into a single database for analysis. The FoxDB is a relational database that contains information on sample sites, parameters measured, and the results of laboratory analysis of the samples, as well as the sampling agency or group. A data quality rating scheme was developed to assign a numerical grade to the data rating reliability and the comparability of the sampling and analysis methods to contemporary standards. This chapter describes data sources, database design, and the grading system. A data dictionary for the database is provided (Appendix 2) in addition to a description of the conversion of major datasets to the FoxDB (Appendix 3) and an interface program for data loading and viewing (Appendix 4).
4.1. Purpose and Goals
The objective of developing a water quality database for the Fox River Watershed Investigation was to compile information on specific parameters that define the nature of the stream and river environment: water chemistry data, sediment chemistry data, and the physical parameters such as temperature, DO, and pH. Streamflow data are included as an integral part to interpretation of constituents reported in units of concentration. Data related to biotic measures were not compiled; however, the database could be expanded to include those parameters in the future.
A variety of monitoring activities have been pursued in the Fox River watershed over the
years. Some monitoring efforts were designed to collect long-term datasets to monitor ambient water quality conditions, others for short-term projects, compliance or permit monitoring, or collection by volunteer citizen groups. The database serves as a central repository for the data, stored in a consistent format for retrieval and comparison. The structure and attributes of the original datasets were reviewed and translated to a common format in the Fox River database, FoxDB. The “quality” of the data, collection protocol and laboratory analyses were reviewed to assign a “grade” to the datasets for comparability and reliability in consistent manner.
4.2. Data Description
The FoxDB is populated with data from several sources. Regular monitoring programs of the U.S. Environmental Protection Agency (USEPA), Illinois Environmental Protection Agency (IEPA), and U.S. Geological Survey (USGS) represent a major portion of data available for the watershed. These data were acquired from the USEPA Legacy Data Center (formerly STORET), the USGS National Water Information System (NWIS), and the USGS National Ambient Water Quality Assessment (NAWQA) databases (all available online). The IEPA data collected after 1998 were not available from the new STORET system and were acquired directly from the agency. Some local governments and facilities carry out regular monitoring in their area of interest. There also have been a few special studies investigating water quality-related issues in the Fox River watershed; however, the scope and scale of these studies vary significantly. This section describes individual data sources, their original structure, attributes, and any special considerations.
59

4.2.1. Data Sources
USEPA. The STORET (short for STOrage and RETrieval) is a repository for water quality, biological, and physical data. The system is used by state environmental agencies, USEPA and other federal agencies, universities, private citizens, and many others. The USEPA maintains two data management systems containing water quality information for the nation's waters: the Legacy Data Center (LDC), and the new STORET. These data may be accessed through the Internet from the STORET home page (USEPA, 2003f, 2003g).
The LDC contains historical water quality data dating back from the early part of the 20th
Century to the end of 1998. The STORET system contains data collected beginning in 1999, along with older data that have been properly documented and migrated from the LDC. Both systems contain raw biological, chemical, and physical data on surface water and groundwater collected by federal, state, and local agencies, Indian Tribes, volunteer groups, academics, and others. All 50 states, territories, and U.S. jurisdictions, along with portions of Canada and Mexico, are represented.
USGS. Water quality data from the USGS are available through the NWIS. The NWIS
is a distributed database in which data can be processed over a network of workstations and fileservers at USGS offices throughout the United States. The system has four components: the Ground-Water Site-Inventory System, the Water-Quality System, the Automated Data-Processing System, and the Water-Use Data System.
The Water-Quality System contains results of more than 3.5 million analyses of water
samples that describe the chemical, physical, biological, and radiochemical characteristics of both surface water and groundwater. The Web site provides current and historical data (USGS, 2003c).
Data from NAWQA are stored in a separate database (USGS, 2003e). The USGS began
its NAWQA program in 1991, systematically collecting chemical, biological, and physical water quality data from study units (basins) across the nation. The data warehouse currently contains and links the following data through September 30, 2001: chemical concentrations in water, bed sediments, and aquatic organism tissues; site, basin, well, and network characteristics; daily streamflow information for fixed sampling sites; and groundwater levels for sampled wells. The database overlaps to a certain extent with the NWIS database. However, each of the two databases contains unique data that the other database does not have.
The Urban Land Use Gradient Study was conducted by the USGS as part of the upper
Illinois River basin study of the NAWQA program. Physical, chemical, and biological data were collected at 46 sites in the Fox and Des Plaines River basins in July 2000 for habitat, geomorphic characteristics, water discharge, water chemistry (nutrients, major ions, wastewater indicators, pH, and specific conductance), and aquatic communities (algae, invertebrates, and fish). Water temperatures were collected at most sites continuously from approximately May 2000 to June 2001. Stream cross sections were surveyed from November 2000 to May 2001. Fish were collected in August 2000 or July 2001 at sites not previously sampled by other agencies (Adolphson et al., 2002).
60

IEPA. The IEPA conducts a wide variety of water quality monitoring programs. Stations are sampled for biological, chemical and/or in-stream habitat data, as well as streamflow. Water quality monitoring programs consist of a combination of fixed station networks and intensive or facility-related stream surveys in specific watersheds. The IEPA operates an Ambient Water Quality Monitoring Network (AWQMN) of fixed stations to support surface water chemistry data needs. Integrated water column samples are collected on a 6-week sampling frequency and analyzed for a minimum of 55 universal parameters, including field pH, temperature, specific conductance, dissolved oxygen (DO), suspended solids, nutrients, fecal coliform bacteria, and total and dissolved heavy metals (IEPA, 2002b).
Intensive river basin surveys are conducted on a five-year rotational basis in cooperation
with the Illinois Department of Natural Resources (IDNR). These intensive surveys are a major source of information for annual 305(b) assessments. Water chemistry and biological data (fish and macroinvertebrates) and qualitative and quantitative in-stream habitat information, including stream discharge, are collected to characterize stream segments within the basin, identify water quality conditions, and evaluate aquatic life use impairment. Fish tissue contaminant and sediment chemistry sampling also are conducted to screen for the accumulation of toxic substances (IEPA, 2002b).
Fox River Study Group. The Fox River Study Group (FRSG) initiated its monitoring in
April 2002. Seven stations on the Fox River mainstem are sampled bi-weekly. Samples are analyzed for nutrient-related parameters such as DO, temperature, chlorophyll a, nitrogen, and phosphorus. The FRSG sample collection and analysis program operates under the guidance established in the Quality Assurance Project Plan (QAPP) approved by the IEPA in March 2002. Samples are collected at seven sampling locations along the Fox River from the Johnsburg Bridge north of McHenry to the Route 47 Bridge at Yorkville. The sample sites are approximately ten miles apart and located on bridges crossing the river at locations both above and below the dams. Volunteers from the wastewater treatment facilities and representatives from local environmental groups are responsible for collection of the samples and performing the required field testing. The sample teams were trained to handle samples in an identical fashion, following the guidelines in the QAPP to ensure reproducibility of techniques. The samples are collected every other Tuesday at approximately 10 a.m. and transported to the Fox River Water Reclamation District (FRWRD) in Elgin for distribution to the analytical laboratories at the City of Elgin, Fox Metro Reclamation District (FMRD) and FRWRD.
The sampling program is closely aligned with the techniques used by the IEPA. The samples sites and the transect composite samples are similar to the sites and procedures used by IEPA. This program was designed to augment the IEPA sampling program. Sample collection, and analytical and quality assurance procedures in this program ensure that all data generated are fully comparable with data collected and analyzed by IEPA.
Huff & Huff, Inc. A Huff & Huff, Inc. study evaluated ammonia levels in a 40-mile stretch of the Fox River from Yorkville to Carpentersville (Huff and LaDieu, 1995). Grab samples were taken weekly at 27 monitoring sites for 12 months beginning in September 1994. The Fox River was sampled at 19 locations and its tributaries at 8 stations. Samples were analyzed for DO, temperature, pH, total ammonia, and carbonaceous biological oxygen demand (CBOD5).
61

Max McGraw Wildlife Foundation. A two-year study conducted by Max McGraw Wildlife Foundation (MMGWF) investigated the environmental effects of dams on fisheries, macroinvertebrates, physical habitat, and water quality in a 100-mile stretch of the Fox River between the Fox Chain of Lakes and Dayton, Illinois (Santucci and Gephard, 2003). Summer low-flow conditions were sampled at 40 sites located in a free-flowing river directly below dams, impounded river directly above dams, and free-flowing or impounded mid-segment areas between dams. Samples included sediment, ambient water, fish, biological communities, and information on land use. Continuous measurement of selected parameters was carried out over 16-, 40-, and 96-hour periods (15-minute intervals).
Illinois State Water Survey. The Illinois State Water Survey (ISWS) conducted a study
of oxygen regime in St. Charles Pool in 1993-1994. Short-term intensive water quality data were collected during two separate time periods, three days in August 1993, and six days in June 1994 (Singh et al., 1995). Data for DO, temperature, conductivity, and pH were collected at five stations at 15-minute intervals. Grab samples collected at the beginning of each event were analyzed for basic physical, chemical, and biological parameters. Sediment oxygen demand was measured at five sites where sediment samples also were collected. Biological sampling consisted of macroinvertebrates and algae.
Local Monitoring. Limited monitoring was conducted by local government or water
treatment facilities. The McHenry County Health Department surveyed 14 stations from 1981 to 1997 with varying frequency and for different parameters. The FRWRD provided their data from January 1991 to February 2002. A total of eight stations were sampled: six stations on the Fox River and two stations on tributaries (Poplar Creek and Tyler Creek). Stations typically were sampled weekly to bi-weekly and analyzed for up to 20 parameters. The FMWRD samples three stations in its vicinity weekly for DO, temperature, pH, and total ammonia. In addition, samples from two of these stations are analyzed quarterly for a variety of parameters, including trace metals. Other facilities carry out limited water quality monitoring. The USEPA’s Permit Compliance System Database was searched via the Envirofact Data Warehouse Web portal (USEPA, 2003c), to identify entities with National Pollution Discharge Elimination System (NPDES) permits within the study area. The list was reviewed and the 25 largest permitted discharges were identified. A letter was sent to each of these permit holders requesting ambient (in-stream) monitoring data. Ten responses, both written and by phone, were received. For the most part, ambient monitoring is not required and most responses did not reveal existence of additional water quality data.
4.2.2. Streamflow Data Sources
Streamflow (discharge) is sometimes measured and recorded as a parameter result when a water quality sample is taken. However, streamflow information was not included with a majority of water quality data sources. Streamflow thus was estimated from data collected by the USGS at their regular gaging stations network. Daily discharge data from continuous stations and stage data were used to estimate daily flow data for sample sites along the Fox River’s mainstem downstream of Stratton Dam. Calculated and measured streamflow data were maintained in separate tables rather than added to the sample parameter results in the FoxDB.
62

4.3. Database Design 4.3.1. Conceptual Design
Monitoring and testing results do not stand alone: the location, time, methodology, and other information also must be documented. The purpose of a database is to store information in a useful way. The USEPA and the USGS maintain the most comprehensive national water quality databases. Formerly, the USEPA database STORET and the USGS database WATSTORE contained essentially the same data that was collected under a joint agreement. These databases were the standard until recent years. The USEPA has developed a new STORET database that stores data collected since 1999 in a new format. Data collected prior to 1999 are warehoused in the old STORET format or LDC. The structure of the new STORET system differs dramatically from the former system, making it difficult, if not impossible, to import LDC data (sometimes referred to as Legacy STORET) into the current STORET system. The IEPA has been migrating data collected since 1999 to the new STORET system. The USGS has developed the NWIS portal to a variety of surface and groundwater data, and water quality data. Other data sources described above were typically in the form of spreadsheets, with text documentation or hard copy only.
The STORET system is designed so that a registered user can install the software on a
personal computer (or a network system), input data, and then upload data to the national warehouse. A user also can download data. The STORET structure provides many avenues for complete and detailed data documentation, a strength that is also problematic for historical data that tend to have an insufficient level of detail to populate the database. The single greatest difference between STORET, LDC, and NWIS is the use of parameter codes. The LDC and NWIS systems use a five-digit code to identify a parameter that also embeds information on the units, medium, and procedures. Table 4.1 provides an example of parameter codes from the NWIS Web site. Parameter codes used in the LDC and NWIS are essentially identical, although the USGS has added a few specialty codes for their purposes, which STORET does not use. Rather during data entry, various fields are coded as to medium, units, and collection method to incorporate the information. To date, the USEPA has not provided a translator between parameter codes and STORET attributes.
The FoxDB mimics the conceptual structure of STORET and, where possible, the same codes and field names were used. Because the majority of data in the database was retrieved from the LDC and NWIS, the FoxDB retains the use of the LDC/NWIS five-digit parameter
Table 4.1. Example of USEPA/USGS Five-Digit Parameter Codes (USGS, 2003c)
Parameter code Parameter definition
00910 Total calcium, in milligrams per liter as calcium carbonate (unfiltered-water sample) 00915 Dissolved calcium, in milligrams per liter as calcium (filtered-water sample) 00916 Total calcium, in milligrams per liter as calcium (unfiltered-water sample) 91051 Total calcium, in micrograms per liter as calcium (unfiltered-water sample)
63

codes. Data from other sources were reviewed, and appropriate five-digit parameter codes were assigned. The IEPA data collected since 1998 retained enough linkage with the LDC to determine assignment of parameter codes. Documentation accompanying other data sources was reviewed to assign parameter codes. 4.3.2. Relational Database
The FoxDB is a relational database. The following sections describe basic principles of relational databases, introduce the FoxDB data model, and present an implementation of the model in Microsoft Access/SQL Server.
A relational database is a collection of formally described tables that can be edited or
expanded in many different ways without having to reorganize the database tables. A new table can be added to the database without modifying all existing tables. Data are entered into tables based on subject and related by a key that makes the records within any given table unique. The columns of a table are called fields; the rows are called records.
Information about each station (sample site) is recorded in the table TBLStation. Each
record (row) contains information about one station. Fields include station name, a unique identification number, location description, latitude, longitude, etc. The table TBLSample contains information about samples collected and has a record for each sample; the fields include a unique sample number, date, time, method, and unique station number. These unique numbers or keys provide the link from one table to the next. Information about the station is linked to each sample taken at that station without repeating the station information for each sample.
In the same way, each sample is related to the results table TBLResults by a sample
number that is uniquely assigned when the sample and results records are added. Five-digit parameter codes are used to identify individual constituents analyzed in the sample. The parameter table TBLParameter_Codes then may be combined with the results table to view the full name for the parameter using the parameter code.
The process of removing redundant data from a relational database by separating
information into smaller tables is called normalization. A normalized database generally improves performance, lowers storage requirements, and makes it easier to change the application to add new features.
A data model is a conceptual representation of data structures required by a database.
Data structures include data objects, associations between data objects, and rules that govern operations on the objects. The data model focuses on required data and how it should be organized rather than on what operations will be performed. A data model is independent of hardware or software constraints. Rather than try to represent the data as a database would see it, the data model focuses on representing the data as the user sees it in the real world. It serves as a bridge between the concepts that make up real-world events and processes, and the physical representation of those concepts in a database.
64

4.3.3. Data Model Description
The FoxDB data model describes water quality monitoring and data as a complex but related process. Figure 4.1 shows the conceptual representation of the data model implemented in the FoxDB. Monitoring stations are located along rivers, streams, and lakes. Selected stations are sampled as part of a specific monitoring project. Individual samples are collected and shipped to a laboratory for analysis of specified parameters. The results of the analysis are the numerical values of each parameter analyzed. Results also include the values of field-measured parameters, such as temperature and streamflow.
Each arrow in the diagram designates a separate table in the FoxDB. Individual tables are related through unique identifiers. As described above, a sample is identified by a sample number, and attributes include information about the monitoring station and monitoring project in addition to sample descriptors such as sampling date, sampling depth, medium, etc. The sample number is included in a table of laboratory and field data results linking the values to a particular sample.
A discussion of the main features of the FoxDB follows to give the reader an overview of
the FoxDB and its structure. Appendix 2 provides the fields, definitions, and formatting details for each table. All tables, fields, and links to illustrate the database configuration are shown in Appendix 8.
The diagram in Appendix 8 includes tables organized in five major groups corresponding
to the entities shown in Figure 4.1: station, sample, project, results, and parameters. Rivers as spatial features are part of a geographical coverage, and the link to stations is established by spatial location. Laboratories are not included at this stage because the information is often unknown and not readily available from original data sources. The table TBLIDLocations is part of the database, but it is not included in any of these categories. It describes the source from which data were acquired for this project. The information also is used for the database maintenance and batch data import. For discussion purposes, actual table names in the FoxDB are italicized and actual field names are within quotation marks.
A station is described in the table TblStation_Information. Station locations may be
displayed in a Geographical Information System (GIS) environment using latitude and longitude, which were determined for each station from the original data source or from the station description and 1:100,000 scale topographic maps. In addition, the station location in the stream network is established by river name and both National Hydrography Dataset (NHD) and Reach File Version 3 (RF3) codes from USGS and USEPA river geographical coverages, respectively. Other attributes include various station codes: “Station_ID” represents a unique identifier within the FoxDB, USGS and USEPA codes are included for stations where available, as are special station codes used by any other agency or sampling program. Other fields describe the station’s attributes. For example, “Station_Type” identifies by a code whether the station is located on a river, lake, wetland, canal, etc. The description of the code used in “Station_Type” is given in a lookup table, TBLSTation_Type, which provides the station’s “Primary_type” and “Secondary_type.” The lookup table also indicates whether the station is located on a natural or an artificial water body. Primary and secondary station codes are identical to those used in the USEPA’s new STORET database (http://www.epa.gov/storet/).
65

SamplingSampling
AnalyzingAnalyzing
River
Monitoring Station
Samples
Results: parameters analyzed
Monitoring project
Laboratory
Figure 4.1. Schematic representation of water quality data model used in development of the FoxDB
A sample is described in the table TBLSample by the station where it was taken, sampling
date and time, sampling depth and a monitoring project under which it was collected. Sample “Medium” indicates what was sampled: water, sediment, biota, physical characteristics (including habitat), etc. “Sample_Type” further describes sampling methods (composite, grab, fish tissue, etc.). “Composite_statistic_code,” a field preserved from the USEPA’s Legacy STORET database (http://www.epa.gov/storpubl/legacy/ref_tables.htm), indicates whether a summary value was stored rather than an individual value, for example, an average of several samples. The code has not been completed for all data coming from other sources. Lookup tables explain the codes used in each field to describe medium, sample type, and composite statistic codes. A comment field is used for any comments relevant to the sample, for example, existence of replicate samples, quality assurance concerns, etc.
Parameter codes are defined in the table TBLParameter_Codes, which includes a verbal
description, both full and abbreviated, and reporting units. Additional related tables associate parameters with a parameter group. The database includes two schemes for grouping parameters: the original USEPA parameter groups (used in the Legacy STORET database) and the Quality Assurance Project Plan (QAPP) groups developed specifically for this project. The QAPP groups were created to facilitate evaluating the quality of imported data. The QAPP scheme groups parameters on two levels: first, by medium sampled, and second, by constituent analyzed. The first number of the QAPP code indicates the medium; the second number indicates
66
the main parameter group (basic inorganic, nutrients, metals, organics, etc.); and the third number indicates the constituent subgroup (for example, nitrogen in the nutrients group, or pesticides in the organics group).
A result is defined by a sample code (linking it to the sample analyzed) and a parameter
code (the constituent measured). Original five-digit parameter codes from Legacy were associated with most data, and the FoxDB uses these Legacy codes. A result value is accompanied by a remark code explaining mostly quality assurance issues. For example, a value reported may be below a detection limit, calculated from other parameters, estimated, etc. An optional grade can be used to flag any questionable data identified during analyses. Numerical and non-numerical results are stored in tables TBLResults and TBLResults_Vol_NonNumeric, respectively, to ensure integrity of the value field. All replicate results are kept in a third table, TBLReplicates. Some of the datasets imported did not differentiate clearly when results were from replicate samples.
A project is described in the table TBLProjects_Programs, which includes a project name
or title for which monitoring was performed, a code for the monitoring organization, project study area, project purpose, beginning and ending dates, and contact information. The organization is described by its full and abbreviated names, and category (federal, state, facility, or other). The address, contact person and phone number, and the organization Web site are given, if available. A project can be assigned a quality assurance (QAPP) grade and a comparability-usability (CU) grade for any QAPP parameter group. 4.4. Implementation and Navigation
The FoxDB was developed and tested using a Microsoft SQL Server. The database was converted to Microsoft Access format for distribution. Both Microsoft Access and the SQL Server support relational databases. The complete Microsoft Access database is available for download from the ILRDSS Fox River Watershed Investigation Web site (http://ilrdss.sws.uiuc.edu/fox/).
The Microsoft Access database includes both core and lookup tables with all established
links. Data can be imported to many applications using an Open Database Connectivity (ODBC) interface. This interface enables accessing data among various software applications regardless of vendors. For example, data can be imported to Excel or Statgraphics (statistical software) for analyses.
Two queries have been designed and included with the FoxDB. These queries are recommended for casual users with some experience with relational databases and Microsoft Access and may be used as examples for construction of additional queries. Advanced users are encouraged to build custom queries.
67

4.4.1. Example Queries Query name: CountPhosphorusResult
Figure 4.2 illustrates a query that generates a list of stations for which there are result values for any form of phosphorus, the medium (water or sediment) and the number of samples at the station. The FoxDB tables involved are:
TBLStation_Information TBLSample TBLResults TBLParameter_Codes TBLQAPPGroups TBLQAPP_Group_Codes
The selection is performed by specifying: TBLQappGroups_Codes, Parameter Group = 10 (lists all results for any form of Phosphorus) The expression in the first column: CountofResults: Count(*), counts the number of results for each parameter.
Figure 4.2. FoxDB query name: QRYCountPhosphorusResult
68

Query name: Phosphorus Results by Station
Figure 4.3 illustrates a query that generates a list of all the phosphorus result values for samples collected at all stations. The tables from FoxDB involved are:
TBLStation_Information TBLSample TBLResults TBLResults_Remarks TBLParameter_Codes TBLQAPPGroups TBLQAPP_Group_Codes TBLParameter_Group
The selection is performed by specifying: TBLQappGroups_Codes, Parameter Group = 10
Figure 4.3. FoxDB query name: QRYPhosphorusResult
69
4.4.2. Importing Data and Future Updates
A program has been developed for loading and viewing data in the FoxDB. This program provides a user-friendly interface to explore the database content and to enter new data. The interface is designed for entering data one parameter result value at a time, as would be necessary when creating an electronic copy of data from laboratory sheets. An experienced database manager can import large electronic datasets to the database. The interface setup program may be downloaded from the Fox River Watershed Investigation Web page (http://ilrdss.sws.uiuc.edu/fox/). Appendix 4 describes program navigation. The Data Loader & Viewer program can be installed, with the full Microsoft Access database on multiple, independent personal computers. However, a “primary” or “master” database copy needs to be maintained.
Database maintenance is essential to extending the useful life of a dataset. Protocols must
be established for data entry and maintenance of a “master copy” of the database. One option is to identify a single location where the master database is maintained, and all data entry is at that point. Alternatively, where there are multiple data entry sites, such as the various water reclamation districts, the location (personal computer or server) where the master copy of the database is maintained should be designated as well as the primary data manager. Data may be entered at remote locations, files sent to the primary data manager, and loaded upon review and acceptance. 4.4.3. Special Considerations
Station Location. In the FoxDB, locations of monitoring sites are identified by latitude and longitude coordinates as well as a detailed description. Latitude and longitude included with the original data were used to display the stations in ArcMap GIS software. The location based on latitude/longitude was checked individually against the description for every station. Additional geographical layers, such as river network, roads, or topographical maps, were used to verify the location. Geographical information and description for 427 stations (85%) matched. Of the remaining stations, locations of 30 stations (6%) identified by the IEPA station code were determined from a geographical coverage of IEPA stations provided by that agency. Locations of the remaining stations were determined from the description and 1:100,000 scale topographic maps. Latitude and longitude then were identified in the ArcMap environment.
First, the Legacy and USGS stations were displayed. Each location was verified and
corrected when necessary. All stations from other sources were first checked against the existing stations to avoid duplicate locations. In such cases, descriptions were combined to include all keywords from both sources. Source of latitude/longitude is reflected in the “Latitude_Longitude_Accuracy” field of the table TblStation_Information. A two-letter code indicates the use of original or corrected data, and the accuracy level of locational data, respectively, when known. The location was verified only for Illinois stations. All Wisconsin stations have retained their original latitude and longitude.
70

Parameters. Parameters are uniquely identified by a five-digit USEPA Legacy code. Data from USEPA, IEPA, and USGS already included the proper code. Other data sources described the parameters analyzed within their respective projects verbally. These descriptions were compared against STORET descriptions, and codes for the appropriate parameter were selected. The organization providing the data was contacted to clarify descriptions, methods, or units when several STORET codes matched the provided description. For the few cases where the organization did not respond, professional judgment was used to assign a code with the best matching description. If a code could not be determined, data were not imported into the FoxDB. Only a limited set of data was not imported (e.g., metals and organic data from McHenry County Health Department).
Translation of Attributes/Codes. The FoxDB structure is, in essence, a fusion of
STORET and Legacy plus some elements from USGS datasets. Each original dataset came with a specific set of attributes. Thus, a translation key was developed for converting original attributes and codes into FoxDB attributes (see Appendix 3). Attributes of a sample were retained when present in the original datasets.
Removing Duplicates. All imported data were checked for duplicate entries: samples
taken at the same place and time analyzed for the same parameter. Such duplicates were identified between different data sources, as well as within the same data source. Duplicate entries were moved to a separate table TblReplicates structured after the results table TblResults. Replicate values include both the original sample code and that of the corresponding result. In addition, a comment identifies the existence of a replicate for respective sample.
Most duplicate entries showed the same numerical result for a parameter in question.
Entries with different results were examined individually. Most of these cases were caused by a different rounding process; only a limited number showed distinctively different numbers. When a different number was reported, the record indicating worse water quality condition was retained in the results table; the other record was considered a replicate. This procedure was necessary because original data do not contain detailed information on duplicate sampling or analyses. The comment by the sample flags these data so that the user can check the replicate value and rerun analyses, if desired.
Most apparent duplicate results originated from an overlap between various databases.
For example, the USGS maintains two water quality databases: NWIS and NAWQA. The data overlap to a certain extent, but distinct data exist in each database. Data in the NWIS database represent rounded values of data in the NAWQA database. Similarly, duplicates exist between the Legacy data and the USGS data (both NWIS and NAWQA). In this case, Legacy data were recorded with higher precision than NWIS data. Although it was reported that all USGS data were removed from Legacy database, the data from joint projects between the USEPA and the USGS remained in the Legacy database. Data recorded with higher precision were retained in the FoxDB.
Other duplicates were found when several samples were collected at the same time but
for different projects (USGS data). This was usually the case for basic physical parameters
71

(temperature, pH, flow, etc.) measured separately when ambient water, sediment, and biological samples were collected simultaneously. 4.4.4. Data Quality
Water quality data imported into the FoxDB were collected by a variety of agencies and research organizations over the years. Procedures for data collection and analysis have changed. Different laboratory techniques have different levels of precision and detection limits. While it is desirable to take advantage of the wealth of information available, it is essential that reliability, accuracy, precision, and comparability of data be documented. Data not meeting contemporary standards for collection and analyses may yield valuable information about trends but should not be included in an actual result value comparison. Previous studies that are not fully documented but performed by reputable organizations may not be appropriate for some uses, but may close data gaps, and should not be excluded from consideration.
The following rating criteria were devised to provide documentation of the grade or the
confidence in the quality of the various datasets. Assignment of grades to the data provides a simple mechanism to perform queries on the composite data with screening levels appropriate to the analysis. Full documentation of the data collection procedures, as available, are provided in the original reports.
The data rating criteria developed uses a two-tiered approach to determine the quality of
the data received for the FoxDB. The first tier is to determine QAPP availability and acceptability. Sampling design, analytical protocols, and comparability of a dataset with others also are evaluated in this tier. This level of evaluation determines if datasets are documented adequately to provide some assurance as to the accuracy and precision of the information. The second tier is performed by using statistical analyses on the datasets to determine data consistency and reliability.
This procedure was applied to all samples taken on or after January 1, 1998 (last five
years). Historical data may be used to evaluate trends or to supplement analysis when present data are not sufficient for evaluation. Changes in analytical methods and their detection limit, as well as changes in sampling protocol, are of major concern when evaluating long-term data, regardless of the reputation of an agency.
First Tier. The QAPP integrates all technical and quality aspects of a project, including planning, implementation, and assessment. The USEPA requires a QAPP to include certain elements (USEPA, 2001d). These elements are arranged into the following categories (see Tables 4.2 – 4.5 for a listing of individual elements):
A. Project Management: The elements in this group address the basic area of project
management, including the project history and objectives, roles and responsibilities of the participants, etc. These elements ensure that the project has a defined goal, that the participants understand the goal and the approach to be used, and that the planning outputs have been documented.
72

Table 4.2. Project Management Elements
ID Element name Evaluating A1 Title and Approval Sheet Presence A2 Table of Contents Presence A3 Distribution List Presence A4 Project/Task Organization Presence A5 Problem Definition/Background Presence A6 Project/Task Description Presence A7 Quality Objectives and Criteria Presence A8 Special Training/Certification Presence A9 Documents and Records Presence
Table 4.3. Data Generation and Acquisition Elements
ID Element name Evaluating B1 Sampling Process Design (Experimental Design) Presence B2 Sampling Methods Acceptability B3 Sample Handling and Custody Acceptability B4 Analytical Methods Acceptability B5 Quality Control Acceptability B6 Instrument/Equipment Testing, Inspection, and Maintenance Acceptability B7 Instrument/Equipment Calibration and Frequency Acceptability B8 Inspection/Acceptance of Supplies and Consumables Presence B9 Non-direct Measurements Presence B10 Data Management Presence
Table 4.4. Assessment and Oversight Elements
ID Element name Evaluating C1 Assessments and Response Actions Presence C2 Reports to Management Presence
Table 4.5. Data Validation and Usability Elements
ID Element name Evaluating D1 Data Review, Verification, and Validation Acceptability D2 Verification and Validation Methods Presence D3 Reconciliation with User Requirements Presence
73

B. Data Generation and Acquisition: The elements in this group address all aspects of project design and implementation. Implementation of these elements ensures that appropriate methods for sampling, measurement, and analysis, data collection or generation, data handling, and quality control (QC) activities are employed and are properly documented.
C. Assessment and Oversight: The elements in this group address the activities for assessing the effectiveness of the implementation of the project and associated quality assurance (QA) and QC activities. The purpose of this assessment is to ensure that the QA Project Plan is implemented as prescribed.
D. Data Validation and Usability: The elements in this group address the QA activities that occur after the data collection or generation phase of the project is completed. Implementation of these elements ensures that the data conform to the specific criteria, thus achieving the project objectives.
First, a score is assigned based on a level of compliance with the USEPA document
(Tables 4.2 – 4.5). When available, the QAPP is searched for all required elements. Elements are evaluated either based on their acceptability or based on their mere presence, depending on the importance of the particular element. For example, the description of Problem Definition/Background is sufficient to satisfy the requirement, and it would receive a score for presence. On the other hand, Sampling Method needs to be up-to-date to receive the high score. The basis for evaluating a QAPP element is included in Tables 4.2 – 4.5. The QAPP element receives the highest score if it corresponds in quality to the IEPA requirements (IEPA, 1994; see also Schumacher and Conkling, 1991).
If a QAPP document is not available, sampling procedures and analytical methods used
in the monitoring program are investigated. A score is assigned to each of the selected QAPP elements listed in Table 4.6. A maximum score of 40 can be assigned based on the QAPP elements (QAPP score).
As acceptability of some rating factors varies for different parameters, a project may be evaluated several times if necessary. For example, if sample handling methods are up-to-date for basic inorganic analysis but unacceptable for dissolved trace metals, the relevant QAPP elements will be evaluated twice as they pertain to specified parameter groups. This prevents mislabeling acceptable data and warns about quality of specific parameters measured within a project.
An additional score assigned for selected elements evaluates the comparability with
present methods. Several factors describing the data usability and its comparability between different sources are included in addition to the QAPP elements. Table 4.7 shows the various elements inclusive in the rating. A maximum score of 16 can be assigned based on data comparability and usability (C/U score).
The QAPP and C/U scores are rated individually (Table 4.8). The final grade assigned to
a project and a parameter group reflects the acceptability of data as compared to present expectations set by the IEPA. A grade of zero represents data of acceptable quality.
74

Table 4.6. Tier 1 Rating Factors: Evaluating a QAPP
QAPP Rating factors Possible values Score
Present Not present
1 0
Presence/acceptability of individual components
(Tables 1-4) Up-to-date (IEPA, 1994) More lenient but acceptable Unspecified & unacceptable
3 2 0
Available
Approval IEPA Approved Internal documents Nonexistent & unknown
2 1 0
Training and certification Trained sampling crew Certified laboratory
6 or 0 6 or 0
Documents and records Required and available Required but not available Not required & unknown
4 2 0
Sampling methods Up-to-date (IEPA, 1994) More lenient but acceptable Unspecified & unacceptable
6 4 0
Sample handling and custody Up-to-date (IEPA, 1994) More lenient but acceptable Unspecified & Unacceptable
6 4 0
Analytical method Standard methods (approved by the USEPA) Non-standard Unknown
6 2 0
Not available
Quality Control Up-to-date (IEPA, 1994) More lenient but acceptable Unspecified & unacceptable
6 4 0
75

Table 4.7. Tier 1 Rating Factors: Evaluating Data Comparability and Usability, C/U Score
QAPP Rating factors Possible values Score
Sampling frequency Continuous At least biweekly At least monthly Less than monthly
6 4 2 0
Sampling period Long term Year Season Less than a month
6 4 2 0
Available/not available
Sampling method 2-D composite 1-D composite flow weighted 1-D composite regular grid Grab or unknown
4 3 2 0
Table 4.8. Tier 1 Evaluation Scale
Class Min QAPP score Min C/U score Data rating Excellent 32 14 2 Good 27 10 1 Acceptable 22 6 0 Poor 17 4 -1 Very Poor 0 0 -2 No Information NI NI
Second Tier. Possible outliers in data were identified using statistical methods. Data from individual projects are first evaluated separately for consistency within an individual sampling site. Statistical evaluation of individual datasets used the following techniques:
1. Basic statistics (mean, median, and standard deviation) 2. Probabilistic distribution plot, quantile plot, test for normal or log-normal distributions 3. Time-series plots 4. Scatter plots (change of parameter with flow etc.) 5. Statistical tests for suspected outliers
Data reported as “below detection limit” or “nondetects” were treated according to the
USEPA recommendation (USEPA, 2000c). For statistical purposes, data were separated into three categories depending on percent nondetects: (1) less than 15 percent data, (2) between 15 and 50 percent data, and (3) more than 50 percent data. The proportion of nondetects above 15 percent affects the distribution fitting and special procedures need to be applied. Some statistical characteristics cannot be properly estimated when more than 50 percent of the data are reported nondetects.
76

When a sample result is suspected to be an outlier, additional data are analyzed to seek possible explanations for the unusual value. This may include, but is not limited to, preceding flow and rainfall data, relevant chemical constituents (pH, temperature, suspended solids, etc.), and available biological data (fish and macroinvertebrates). If this fails to provide a reasonable explanation, additional effort is used to gather information from the original data source, such as the field and laboratory reports.
Outliers were treated on a case-by-case basis. Outliers associated with typographical or
measurement errors were marked as identified outliers, and every effort has been made to correct the result values in the FoxDB. Measurements identified by statistical procedures as outliers were marked as suspected outliers when additional data do not provide an explanation of the problem. The data analysis and all outliers found were properly documented and flagged in the FoxDB. Water quality analysis should be carried out both with and without outliers for comparison purposes.
Usability of datasets may be greatly enhanced by combining data collected from identical
locations and matching time periods but for different projects, provided the data quality (QAPP score and Sampling Method under C/U score) determined in tier 1 is comparable. Such data were evaluated for consistency between datasets to verify whether these datasets may be merged. The datasets were compared using the following techniques:
1. Quantile-quantile (q-q) plots 2. Two-sample tests for population means 3. Two-sample tests for population distribution
After merging the data, the C/U score can be recalculated to reflect a change in sampling
frequency of combined dataset.
77


Chapter 5. Water Quality Analyses
Water quality data collected in the Fox River watershed during 1998–2002 by various agencies were analyzed. The evaluation focused on the following constituents: nutrients (nitrogen and phosphorus), dissolved oxygen (DO), pH, suspended solids, fecal coliform, algae and biomass, and selected heavy metals (those for which the Illinois Environmental Protection Agency or IEPA specified water quality standards).
All data stored in the FoxDB were used in the following analyses. Storing the data in the
FoxDB provides consistent and efficient data access. Data from different sources can be easily compared, combined, or separated, as desired. The Fox River Study Group (FRSG) requested evaluation of their monitoring data (May 2002−December 2002) while this study was in progress. Appendix 5 includes the interim report prepared for the FRSG in March 2003.
The discussion for each constituent includes: 1) a summary of available data and data
limitations; 2) observations of seasonal effects or trends; 3) longitudinal changes along the Fox River; 4) flow regime effects or trends; and 5) analysis of compliance with any applicable water quality standards or guidelines. Appendix 6 provides basic statistical characteristics for each constituent.
The chapter concludes with a summary of water quality problems inferred from the data
and a matrix showing the critical times and critical conditions when identified problems typically occur. These times and conditions should be the focus of modeling efforts for the given constituent. A series of maps show the spatial extent of available data and illustrate where monitoring data are not available.
5.1. Water Uses and Water Quality Standards
Water pollution control programs are designed to protect the beneficial uses of the nation’s water resources. Each state is responsible for establishing water quality standards that protect the designated beneficial uses. Illinois waters are designated for various uses, including aquatic life, agricultural use, primary contact (e.g., swimming and water skiing), secondary contact (e.g., boating and fishing), industrial use, drinking water, and food processing water supply.
The Illinois Pollution Control Board (IPCB) is responsible for setting water quality
standards to protect designated uses in water bodies in Illinois. The federal Clean Water Act requires the states to review and update water quality standards every three years. The IEPA, in conjunction with the U.S. Environmental Protection Agency (USEPA), identifies and prioritizes those standards to be developed or revised during this three-year period. The IEPA is responsible for developing scientifically based water quality standards and proposing them to the IPCB for adoption into state rules and regulations.
To assess the support of the designated uses and to identify potential causes of
impairment, the IEPA relies on rules and regulations adopted by the IPCB. The IPCB has established four primary sets of narrative and numeric water quality standards, each set designed to help protect particular beneficial uses in particular water bodies:
79

● General Use Standards: These standards are intended to protect aquatic life, wildlife, agricultural, primary contact, secondary contact, and most industrial uses. These standards also are designed to ensure the aesthetic quality of the state’s aquatic environment.
● Public and Food Processing Water Supply Standards: These standards apply to water bodies where water is withdrawn from surface waters of the state for human consumption or for processing of food products intended for human consumption.
● Lake Michigan Basin Standards: These standards protect the beneficial uses of open waters, harbors and waters within breakwaters, and the waters within Illinois jurisdiction tributary to Lake Michigan, except for the Chicago River, North Shore Channel, and Calumet River.
● Secondary Contact and Indigenous Aquatic Life Standards: These standards are intended to protect limited uses of those waters not suited for general use activities but are nonetheless suited for secondary contact uses and are capable of supporting indigenous aquatic life limited only by the physical configuration of the water body, its characteristics and origin, and the presence of contaminants in amounts that do not exceed these water quality standards. These standards only apply to about 80 miles of canals and streams plus Lake Calumet in northeastern Illinois.
The standards are defined in Title 35 of the Illinois Administrative Code, Subtitle C
(Water Pollution), Chapter I, Section 302 Water Quality Standards (IAC, 2002). General use standards are applicable to all streams of the Fox River watershed. A limited number of reaches require compliance with public and food processing water supply standards. Water quality standards specific to constituents investigated for this report are described in relevant sections.
The USEPA developed the National Strategy for the Development of Regional Nutrient
Criteria in June 1998 (USEPA, 1998). The USEPA began developing water quality criteria for nutrients because states and tribes consistently identify excessive levels of nutrients as a major reason why surface waters do not meet designated uses. Technical guidance manuals published in 2000 describe a process for assessing nutrient conditions in different water body types (USEPA, 2000a). The guidance manuals do not contain site-specific numeric nutrient criteria for any river or stream systems. While this guidance contains USEPA's scientific recommendations regarding defensible approaches for developing regional nutrient criteria, it is not regulatory. Thus it does not impose legally binding requirements. States and tribes can adopt other scientifically defensible approaches for developing regional or local nutrient criteria.
5.2. Analyses of FoxDB Water Quality Data 5.2.1. Methodology
Water quality data in the Fox DB were analyzed primarily in terms of model selection. Spatial, temporal, and seasonal trends were explored. Compliance with water quality standards were evaluated for those constituents with available standards. Patterns of concentration distribution were evaluated visually by creating scatter plots for each station. Plots from various stations are included as examples of recognizable patterns that illustrate a general trend. The
80

probability of compliance with water quality standards was evaluated from a fitted log-normal or normal distribution. The actual distribution was used in cases where the theoretical distribution did not adequately fit the data. The probability of compliance with the standard is the probability that the standard’s numerical value will not be exceeded. For a large number of samples, it corresponds to the percentage of samples satisfying the criterion.
For each water quality constituent category, the “Available Data” section gives an
overview of data available for the particular constituent in question: number of stations sampled, monitoring agencies, number of samples, etc. Appendix 6 summarizes basic statistical characteristics for investigated constituents. Spatial, temporal, or constituent data gaps are identified. Data gaps also are summarized later in the “Data Gaps” section of this chapter. The “Seasonal Effects” section describes changes in constituent distribution during the year (month-to-month comparison). Seasons used in this report were: winter (December–February), spring (March–May), summer (June–August), and fall (September–November). The “Flow Regime Effects” section describes changes in concentration with flow and allows preliminary assessment of contributions from point and nonpoint sources. The “Longitudinal Changes” section describes changes in concentration as a particular constituent moves downstream along the Fox River. Analysis of Variance (ANOVA) methods was used to evaluate differences with respect to the investigated factor (location or month). Only statistically significant trends and differences are reported (α = 0.05). The purpose of evaluations in the “Water Quality Standards” sections is to use the standard as guidance for selecting water constituents of concern for future modeling activities (Phase II), not to assess whether water quality violates the standard.
Unless specifically stated, all data described in the “Available Data” were used in
analyses. Station numbers used in this chapter are unique station identifiers specific to the FoxDB. The station numbers were assigned sequentially when data were loaded to the FoxDB. They have no reference to the location of a station along the stream, station importance, or the starting of any sampling program. However, they do provide a quick access to data and an exact cross reference to the FoxDB. 5.2.2. Nitrogen
Available Data. Nitrogen in its various forms is routinely monitored by several agencies, such as the IEPA, FRSG, Fox Metro Water Reclamation District (FMWRD), and others. Ammonia nitrogen data are available for 10 sites on the Fox River and six sites on its tributaries. Nitrate or nitrate-nitrite nitrogen data are available for 12 sites on the Fox River and five sites on its tributaries (including one site with only four samples taken); total Kjeldahl nitrogen (TKN) data are available for 11 sites on the Fox River and 10 sites on its tributaries (including five sites with only five samples). There are eight sites with organic nitrogen data on the Fox River and one site on a tributary (only two samples taken). Nitrogen data exist for additional sites sampled only once or twice over the last five years. The 1999 ammonia data collected by the IEPA were identified by the IEPA as unreliable because of possible problems with laboratory contamination and were excluded from the analyses. At the time of this writing, these data remained in the IEPA database, but have been eliminated from the FoxDB. Most stations (eight for ammonia nitrogen, nitrate or nitrate-nitrite nitrogen, and TKN) have data available from all five years. However, the same is true for only two stations with respect to organic nitrogen data.
81

The data presented in this section include only data directly available from the FoxDB. Additional information that possibly can be calculated from existing values (e.g., organic nitrogen from TKN and ammonia nitrogen) is not included.
Seasonal Variations. Nitrate nitrogen concentrations are higher in winter and spring
than in summer as illustrated by data collected at South Elgin (station 26) and shown in Figure 5.1. The winter watershedwide average reaches about 2 milligrams per liter (mg/L) and declines to about 0.65 mg/L in July and August. Both organic nitrogen (Figure 5.2) and TKN concentrations follow the opposite trend. Total nitrogen remains at approximately the same level, with spring concentrations being slightly higher (Figure 5.3). Ammonia nitrogen concentrations in winter are slightly higher than during summer. The lowest ammonia nitrogen concentrations occur during spring.
Longitudinal Changes. Average nitrate nitrogen concentrations slightly increase from
upstream to downstream (Figure 5.4). The TKN concentrations remain approximately constant with a slight fluctuation among stations until a decrease in concentration at Ottawa (station 31, Route 71). Organic nitrogen concentrations do not change significantly among stations.
Flow Regime Variations. Measured average nitrate nitrogen concentrations appear to
increase with measured flow (Figure 5.5). April has the highest average flow (Figure 2.3), but highest concentrations have been recorded in January and February (Figure 5.1). This apparent contradiction is attributed to sampling frequency. Samples represent a snapshot of conditions while flows plotted in Figure 2.3 are monthly averages. The TKN concentrations decrease with flow (Figure 5.6; a similar trend is observed for organic nitrogen). Total nitrogen concentrations combine these trends and result in a U-shaped distribution (Figure 5.7). Both low and high flows exhibit higher total nitrogen concentrations than medium flows. Unfortunately, only stations 26 (South Elgin) and 240 (I-90 Bridge north of Elgin) have a sufficient number of total nitrogen measurements to evaluate the flow relationship. Ammonia nitrogen concentrations do not correlate with flow for most stations; only three stations indicate a slight increase in ammonia concentrations for high flows (station 33: Route 34, Oswego; station 27: Montgomery; and station 34: Yorkville). However, all stations indicate an increase in ammonia loads with increased flow.
Month
Con
cent
ratio
n (m
g/L)
1 2 3 4 5 6 7 8 9 10 11 120
1
2
3
4
5
Figure 5.1. Nitrate nitrogen concentration by month, station 26 (South Elgin), 1998–2002
82
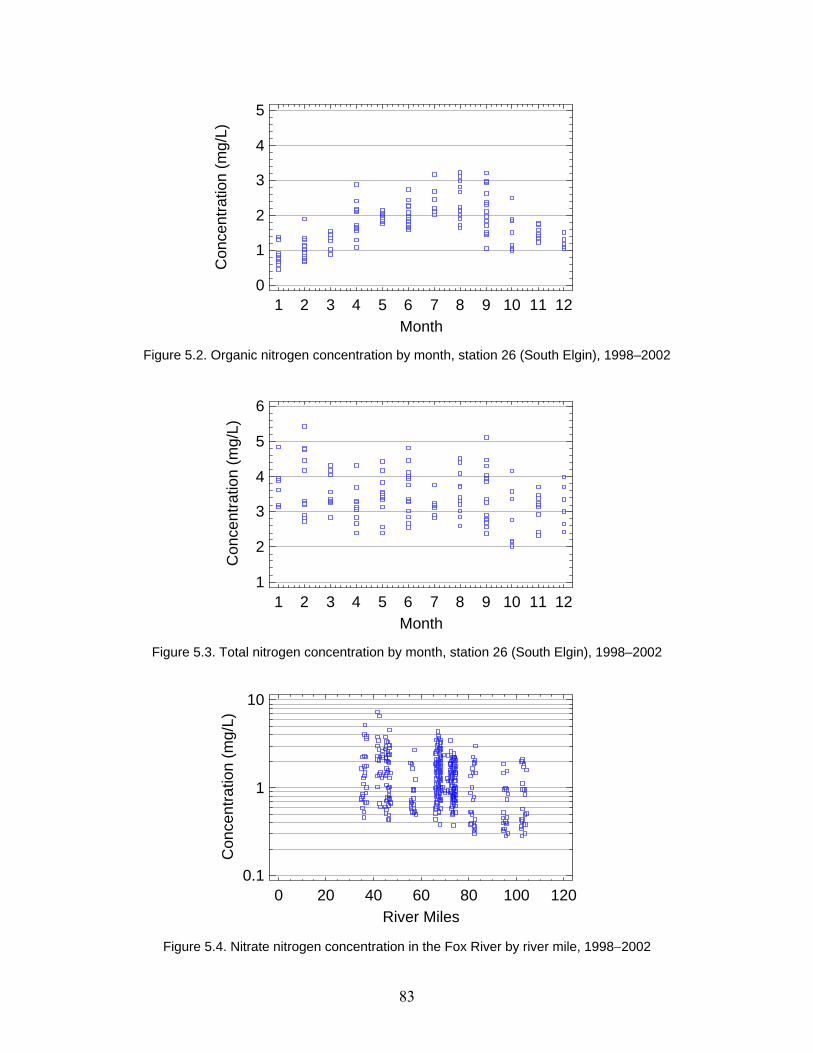
Month
Con
cent
ratio
n (m
g/L)
1 2 3 4 5 6 7 8 9 10 11 120
1
2
3
4
5
Figure 5.2. Organic nitrogen concentration by month, station 26 (South Elgin), 1998–2002
Month
Con
cent
ratio
n (m
g/L)
1 2 3 4 5 6 7 8 9 10 11 121
2
3
4
5
6
Figure 5.3. Total nitrogen concentration by month, station 26 (South Elgin), 1998–2002
River Miles
Con
cent
ratio
n (m
g/L)
0 20 40 60 80 100 1200.1
1
10
Figure 5.4. Nitrate nitrogen concentration in the Fox River by river mile, 1998−2002
83
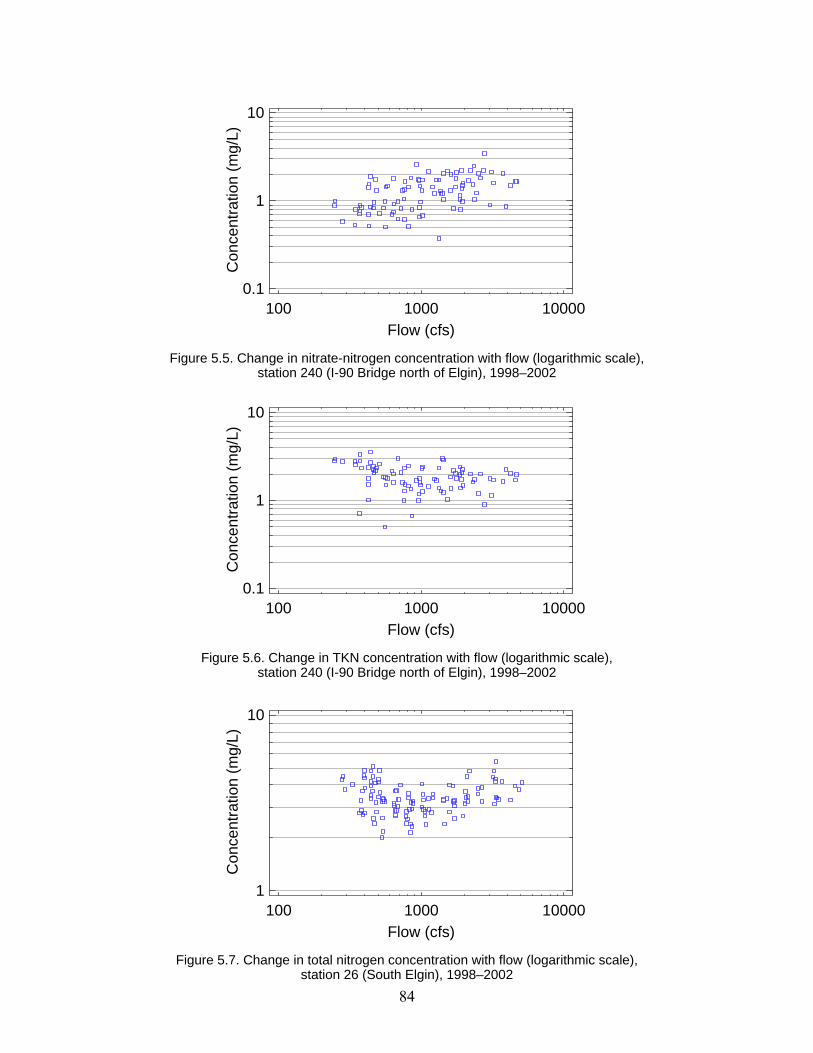
Flow (cfs)
Con
cent
ratio
n (m
g/L)
100 1000 100000.1
1
10
Figure 5.5. Change in nitrate-nitrogen concentration with flow (logarithmic scale),
station 240 (I-90 Bridge north of Elgin), 1998–2002
Flow (cfs)
Con
cent
ratio
n (m
g/L)
100 1000 100000.1
1
10
Figure 5.6. Change in TKN concentration with flow (logarithmic scale), station 240 (I-90 Bridge north of Elgin), 1998–2002
Flow (cfs)
Con
cent
ratio
n (m
g/L)
100 1000 100001
10
Figure 5.7. Change in total nitrogen concentration with flow (logarithmic scale), station 26 (South Elgin), 1998–2002
84
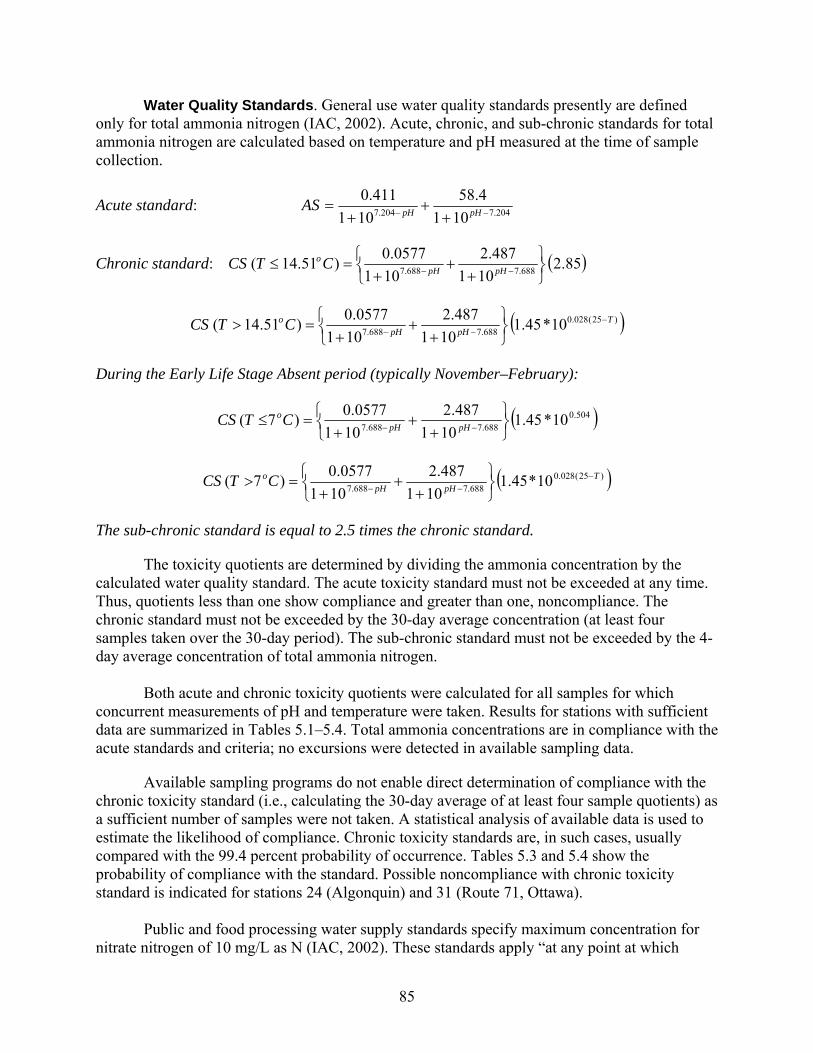
Water Quality Standards. General use water quality standards presently are defined only for total ammonia nitrogen (IAC, 2002). Acute, chronic, and sub-chronic standards for total ammonia nitrogen are calculated based on temperature and pH measured at the time of sample collection.
Acute standard: 204.7204.7 1014.58
101411.0
−− ++
+= pHpHAS
Chronic standard: ( )85.2101
487.2101
0577.0)51.14( 688.7688.7 ⎭⎬⎫
⎩⎨⎧
++
+=≤ −− pHpH
o CTCS
( ))25(028.0688.7688.7 10*45.1
101487.2
1010577.0)51.14( T
pHpHo CTCS −
−− ⎭⎬⎫
⎩⎨⎧
++
+=>
During the Early Life Stage Absent period (typically November–February):
( )504.0688.7688.7 10*45.1
101487.2
1010577.0)7(
⎭⎬⎫
⎩⎨⎧
++
+=≤ −− pHpH
oCTCS
( ))25(028.0688.7688.7 10*45.1
101487.2
1010577.0)7( T
pHpHoCTCS −
−− ⎭⎬⎫
⎩⎨⎧
++
+=>
The sub-chronic standard is equal to 2.5 times the chronic standard.
The toxicity quotients are determined by dividing the ammonia concentration by the calculated water quality standard. The acute toxicity standard must not be exceeded at any time. Thus, quotients less than one show compliance and greater than one, noncompliance. The chronic standard must not be exceeded by the 30-day average concentration (at least four samples taken over the 30-day period). The sub-chronic standard must not be exceeded by the 4-day average concentration of total ammonia nitrogen.
Both acute and chronic toxicity quotients were calculated for all samples for which
concurrent measurements of pH and temperature were taken. Results for stations with sufficient data are summarized in Tables 5.1–5.4. Total ammonia concentrations are in compliance with the acute standards and criteria; no excursions were detected in available sampling data.
Available sampling programs do not enable direct determination of compliance with the chronic toxicity standard (i.e., calculating the 30-day average of at least four sample quotients) as a sufficient number of samples were not taken. A statistical analysis of available data is used to estimate the likelihood of compliance. Chronic toxicity standards are, in such cases, usually compared with the 99.4 percent probability of occurrence. Tables 5.3 and 5.4 show the probability of compliance with the standard. Possible noncompliance with chronic toxicity standard is indicated for stations 24 (Algonquin) and 31 (Route 71, Ottawa).
Public and food processing water supply standards specify maximum concentration for nitrate nitrogen of 10 mg/L as N (IAC, 2002). These standards apply “at any point at which
85

Table 5.1. Fox River: Probability of Compliance with Ammonia Acute Toxicity Standard Station
Location
Compliance (%)
Count
Max acute quotient
23 Route 176 > 99.8 29 0.03 24 Algonquin > 99.8 36 0.13 26 South Elgin > 99.8 46 0.08 27 Montgomery > 99.8 261 0.12 31 Route 71, Ottawa > 99.8 14 0.08 33 Route 34, Oswego > 99.8 218 0.21 34 Yorkville > 99.8 74 0.13 40 Geneva > 99.8 21 0.06
184 Johnsburg > 99.8 21 0.04
Table 5.2. Fox River Tributaries: Probability of Compliance with Ammonia Acute Toxicity Standard
Station
Location
Compliance (%)
Count
Max acute quotient
25 Route 20, Poplar Creek > 99.8 13 0.02 28 Route 47, Blackberry Creek > 99.8 12 0.04 29 Somonauk Creek, 1 mi N
Sheridan > 99.8 13 0.06
236 Nippersink Creek, Spring Grove
> 99.8 13 0.08
Table 5.3. Fox River: Probability of Compliance with Ammonia Chronic Toxicity Standard Station
Location
Compliance (%)
Count
Max chronic quotient
23 Route 176 > 99.8 29 0.20 24 Algonquin 99.3 36 0.34 26 South Elgin 99.6 46 0.28 27 Montgomery > 99.8 261 0.30 31 Route 71, Ottawa 99.0 14 0.22 33 Route 34, Oswego > 99.8 218 0.33 34 Yorkville > 99.8 74 0.39 40 Geneva > 99.8 21 0.35
184 Johnsburg > 99.8 21 0.24
86

Table 5.4. Fox River Tributaries: Probability of Compliance with Ammonia Chronic Toxicity Standard
Station
Location
Compliance (%)
Count
Max chronic quotient
25 Route 20, Poplar Creek > 99.8 13 0.05 28 Route 47, Blackberry Creek > 99.8 12 0.13 29 Somonauk Creek, 1 mi N
Sheridan 99.7 13 0.18
236 Nippersink Creek, Spring Grove > 99.8 13 0.38 water is withdrawn for treatment and distribution as a potable supply or for food processing.” Only two reaches are designated by the IEPA for public water supply (intakes in Aurora and Elgin). All reported measurements of nitrate nitrogen are below the public water supply standard.
National numeric criteria recommended by the USEPA (2000a) were derived as 25th
percentile of concentrations within each ecoregion to reflect reference conditions. The State of Illinois has not adopted these criteria into its legislation. The total nitrogen criterion for streams in the Corn Belt Ecoregion is 2.18 (mg/L) as N. Most measurements (94% of all data) exceed the USEPA recommended nitrogen criterion. The highest level of compliance with the criterion is 16 percent for station 40 (Geneva).
5.2.3. Phosphorus
Available Data. There were 13 sites on the Fox River and 29 on its tributaries with at least five measurements of phosphorus over last five years. Total phosphorus data are available for 12 sites on the Fox River and 23 sites on its tributaries, dissolved phosphorus data for 12 sites on the Fox River and 12 sites on its tributaries. The monitoring agencies included IEPA, USGS, FRSG, FMWRD, Fox River Water Reclamation District (FRWRD), and Max McGraw Wildlife Foundation (MMGWF). Total phosphorus data were available from all five years at seven stations and from only one year at eight stations (three stations in 1998 and five stations in 2002).
Seasonal Variations. Total phosphorus reaches higher concentration levels during the
summer months for the 1998–2002 data (Figure 5.8). Data from 1998–2003 is shown by year, and a comparison between years reveals the concentration for most stations on the Fox River (five out of seven stations with more than two years of data) was higher in years 2002 and 2003 than in other years. The data show phosphorus concentrations in the Fox River increase with decreasing flow. The seasonal variations noted above also are associated with low-flow conditions. Current FRSG measurements (2003) are significantly higher than previous measurements from the same season (Figure 5.9). However, flow during the FRSG sampling in 2003 was lower than during the same months in other years.
Data from station 24 (Algonquin), shown in Figure 5.10, illustrate the change in total phosphorus load in pounds per day (lb/day) with flow categorized by years. The loads during the first four months of 2002 and 2003 are comparable. However, these loads are still higher than
87

Month
Con
cent
ratio
n (m
g/L)
1 2 3 4 5 6 7 8 9 10 11 120
0.1
0.2
0.3
0.4
0.5
Figure 5.8. Total phosphorus concentration by month, station 24 (Algonquin), 1998–2002
Month
Con
cent
ratio
n (m
g/L)
Year199819992000200120022003
1 2 3 4 5 6 7 8 9 10 11 120
0.1
0.2
0.3
0.4
0.5
Figure 5.9. Total phosphorus concentration by month and year, station 24 (Algonquin), 1998–2003
Flow (cfs)
Load
(lb/
day)
Year199819992000200120022003
100 1000 10000100
1000
10000
Figure 5.10. Change in total phosphorus load with flow by year, station 24 (Algonquin), 1998–2003
88

loads corresponding to similar flows for other years. Data presented in Figure 5.10 were collected by the IEPA (1998–2002) and by the FRSG (2002–2003). Both organizations use the same analytical method, although the analyses are performed by different laboratories.
Flow Regime Effects. Almost all stations (9 out of 12 stations on the Fox River with more than 5 measurements) exhibit a strong trend of decreasing phosphorus concentrations with increasing flow for both total and dissolved phosphorus. High concentrations of phosphorus during low flows may be attributed to point sources or other sources not related to runoff events (e.g., release from sediment). Phosphorus associated with runoff events (high flows) represents a higher total load but results in lower concentrations due to increased flow volume during runoff events. This is illustrated by the data collected at station 197 (South Elgin) in Figure 5.11.
Longitudinal Changes. Figure 5.12 shows a steady increase in average phosphorus
concentrations from station 197 (Route 173, Wisconsin-Illinois border) to station 34 (Yorkville), and a decreasing trend downstream of Yorkville.
Water Quality Standards. Presently, there are no general use water quality standards for phosphorus in rivers and streams. Section 302.205 of Title 35 (IAC, 2002) defines the phosphorus standard for lakes and reservoirs as follows: “Phosphorus as P shall not exceed 0.05 mg/L in any reservoir or lake with a surface area of 8.1 hectares (20 acres) or more, or in any stream at the point where it enters any such reservoir or lake.” Low-level pools constructed in free-flowing streams are excluded from this definition. Consequently, the standard does not apply to the study area.
National numeric criteria recommended by the USEPA (2000a) were derived as 25th
percentile concentrations within each ecoregion to reflect reference conditions. The State of Illinois has not adopted these criteria into its legislation. The total phosphorus criterion for streams in the Corn Belt Ecoregion is 0.076 mg/L as P. To control eutrophication, the USEPA recommends that total phosphate concentrations should not exceed 0.1 mg/L as P in streams (USEPA, 1986).
Flow (cfs)
Con
cent
ratio
n (m
g/L)
100 1000 100000.01
0.1
1
10
Figure 5.11. Change in total phosphorus concentration with flow (logarithmic scale),
station 26 (South Elgin), 1998–2002
89

River Miles
Con
cent
ratio
n (m
g/L)
0 20 40 60 80 100 1200.01
0.1
1
10
Figure 5.12. Total phosphorus concentration in the Fox River by river mile, 1998–2002
Table 5.5. Fox River: Percent Compliance with 0.076-mg/L Total Phosphorus Criterion, 1998–2002
Station Location Compliance (%) Count Max TP
23 Route 176 25.4 58 0.33 24 Algonquin 13.2 60 0.43 26 South Elgin 1.0 181 1.56 27 Montgomery < 1.0 60 0.82 31 Route 71, Ottawa < 1.0 33 0.49 34 Yorkville < 1.0 26 0.65 35 National St., Elgin < 1.0 19 0.36 40 Geneva < 1.0 24 0.78
184 Johnsburg 3.3 24 0.36 240 I-90 Bridge N of Elgin < 1.0 97 0.35 273 Kimball-Lawrence St., Elgin < 1.0 19 0.37
Tables 5.5 and 5.6 show a compliance with the 0.076-mg/L criterion for the Fox River and its tributaries, respectively. Most measurements (95% of all data) exceed the USEPA recommended total phosphorus criterion of 0.076 mg/L as P (see also Figure 5.12). Phosphorus concentrations among Fox River stations are the lowest overall at station 197 (Route 173, Wisconsin-Illinois border), which complied with the recommended criterion in 55 percent of all cases. Phosphorus concentrations are the second lowest at station 23 (Fox River by Route 176), which complied with the recommended criterion in 25 percent of all cases. Phosphorus concentrations in the Fox River are higher than concentrations in its tributaries.
90
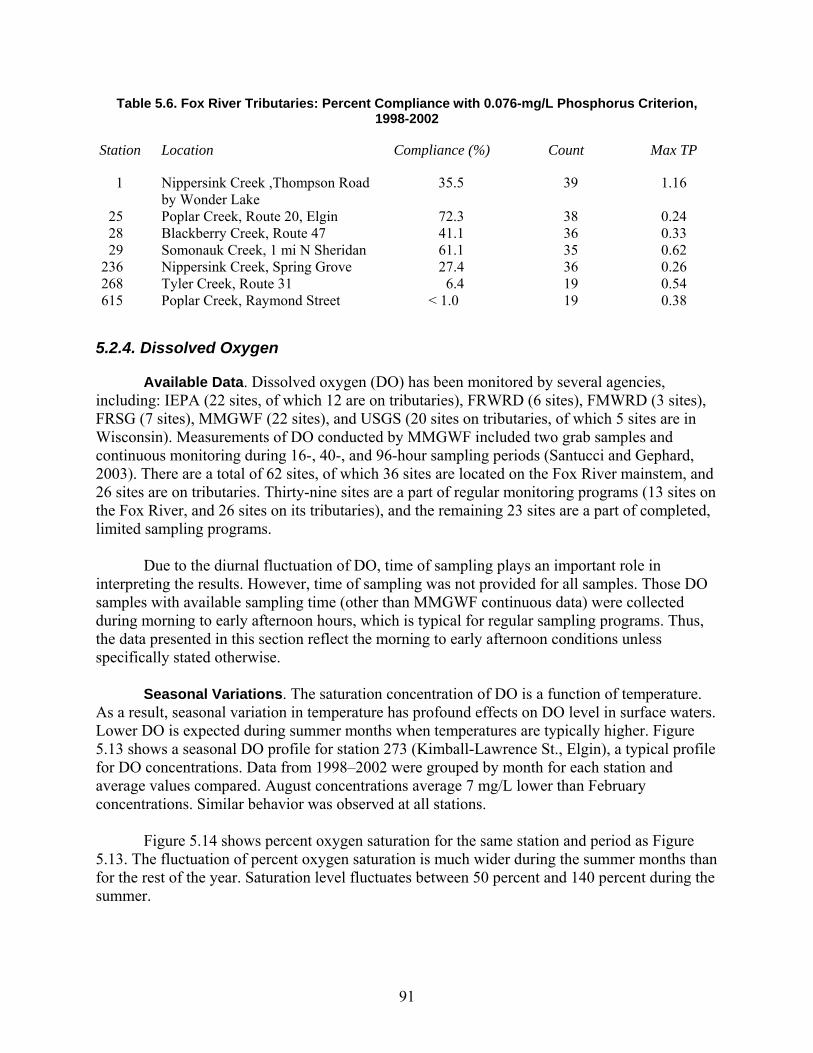
Table 5.6. Fox River Tributaries: Percent Compliance with 0.076-mg/L Phosphorus Criterion, 1998-2002
Station Location Compliance (%) Count Max TP
1 Nippersink Creek ,Thompson Road by Wonder Lake
35.5 39 1.16
25 Poplar Creek, Route 20, Elgin 72.3 38 0.24 28 Blackberry Creek, Route 47 41.1 36 0.33 29 Somonauk Creek, 1 mi N Sheridan 61.1 35 0.62
236 Nippersink Creek, Spring Grove 27.4 36 0.26 268 Tyler Creek, Route 31 6.4 19 0.54 615 Poplar Creek, Raymond Street < 1.0 19 0.38
5.2.4. Dissolved Oxygen
Available Data. Dissolved oxygen (DO) has been monitored by several agencies, including: IEPA (22 sites, of which 12 are on tributaries), FRWRD (6 sites), FMWRD (3 sites), FRSG (7 sites), MMGWF (22 sites), and USGS (20 sites on tributaries, of which 5 sites are in Wisconsin). Measurements of DO conducted by MMGWF included two grab samples and continuous monitoring during 16-, 40-, and 96-hour sampling periods (Santucci and Gephard, 2003). There are a total of 62 sites, of which 36 sites are located on the Fox River mainstem, and 26 sites are on tributaries. Thirty-nine sites are a part of regular monitoring programs (13 sites on the Fox River, and 26 sites on its tributaries), and the remaining 23 sites are a part of completed, limited sampling programs.
Due to the diurnal fluctuation of DO, time of sampling plays an important role in
interpreting the results. However, time of sampling was not provided for all samples. Those DO samples with available sampling time (other than MMGWF continuous data) were collected during morning to early afternoon hours, which is typical for regular sampling programs. Thus, the data presented in this section reflect the morning to early afternoon conditions unless specifically stated otherwise.
Seasonal Variations. The saturation concentration of DO is a function of temperature.
As a result, seasonal variation in temperature has profound effects on DO level in surface waters. Lower DO is expected during summer months when temperatures are typically higher. Figure 5.13 shows a seasonal DO profile for station 273 (Kimball-Lawrence St., Elgin), a typical profile for DO concentrations. Data from 1998–2002 were grouped by month for each station and average values compared. August concentrations average 7 mg/L lower than February concentrations. Similar behavior was observed at all stations.
Figure 5.14 shows percent oxygen saturation for the same station and period as Figure 5.13. The fluctuation of percent oxygen saturation is much wider during the summer months than for the rest of the year. Saturation level fluctuates between 50 percent and 140 percent during the summer.
91

Month
Con
cent
ratio
n (m
g/L)
1 2 3 4 5 6 7 8 9 10 11 120
4
8
12
16
20
Figure 5.13. Dissolved oxygen concentration by month, station 273
(Kimball-Lawrence St., Elgin), 1998–2002
Month
Sat
urat
ion
(%)
1 2 3 4 5 6 7 8 9 10 11 120
255075
100125150175
Figure 5.14. Percent oxygen saturation by month, station 273
(Kimball-Lawrence St., Elgin), 1998–2002
Longitudinal Changes. Figures 5.15 and 5.16 show percent oxygen saturation at stations on the Fox River for summer and the combined data for the other months, respectively. Stations are ordered from downstream to upstream. The figures allow comparisons of DO saturation fluctuation among individual stations. Stations 33 (Route 34, Oswego) and 31 (Route 71 near Ottawa) show the widest fluctuation and the largest oxygen saturation during the summer months. Although the DO concentration and degree of saturation fluctuates among stations, there is no clear indication of a pattern or trend upstream to downstream along the river.
92
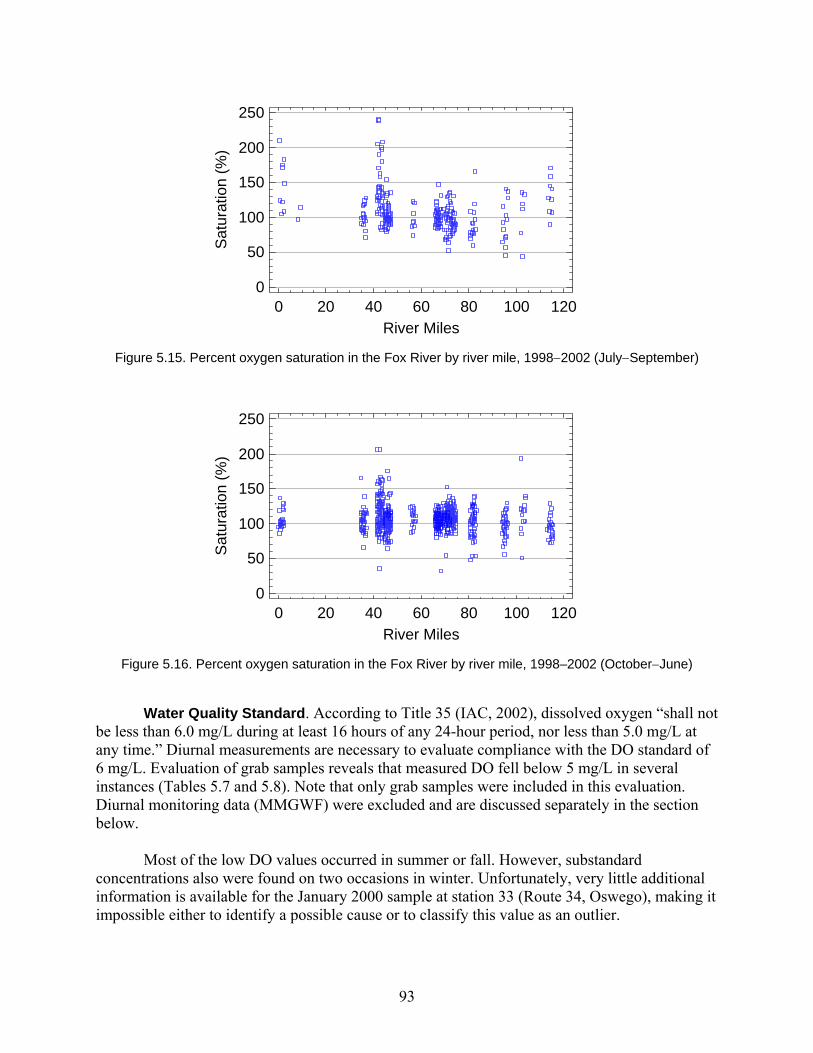
River Miles
Sat
urat
ion
(%)
0 20 40 60 80 100 1200
50
100
150
200
250
Figure 5.15. Percent oxygen saturation in the Fox River by river mile, 1998−2002 (July−September)
River Miles
Sat
urat
ion
(%)
0 20 40 60 80 100 1200
50
100
150
200
250
Figure 5.16. Percent oxygen saturation in the Fox River by river mile, 1998–2002 (October−June)
Water Quality Standard. According to Title 35 (IAC, 2002), dissolved oxygen “shall not be less than 6.0 mg/L during at least 16 hours of any 24-hour period, nor less than 5.0 mg/L at any time.” Diurnal measurements are necessary to evaluate compliance with the DO standard of 6 mg/L. Evaluation of grab samples reveals that measured DO fell below 5 mg/L in several instances (Tables 5.7 and 5.8). Note that only grab samples were included in this evaluation. Diurnal monitoring data (MMGWF) were excluded and are discussed separately in the section below.
Most of the low DO values occurred in summer or fall. However, substandard
concentrations also were found on two occasions in winter. Unfortunately, very little additional information is available for the January 2000 sample at station 33 (Route 34, Oswego), making it impossible either to identify a possible cause or to classify this value as an outlier.
93
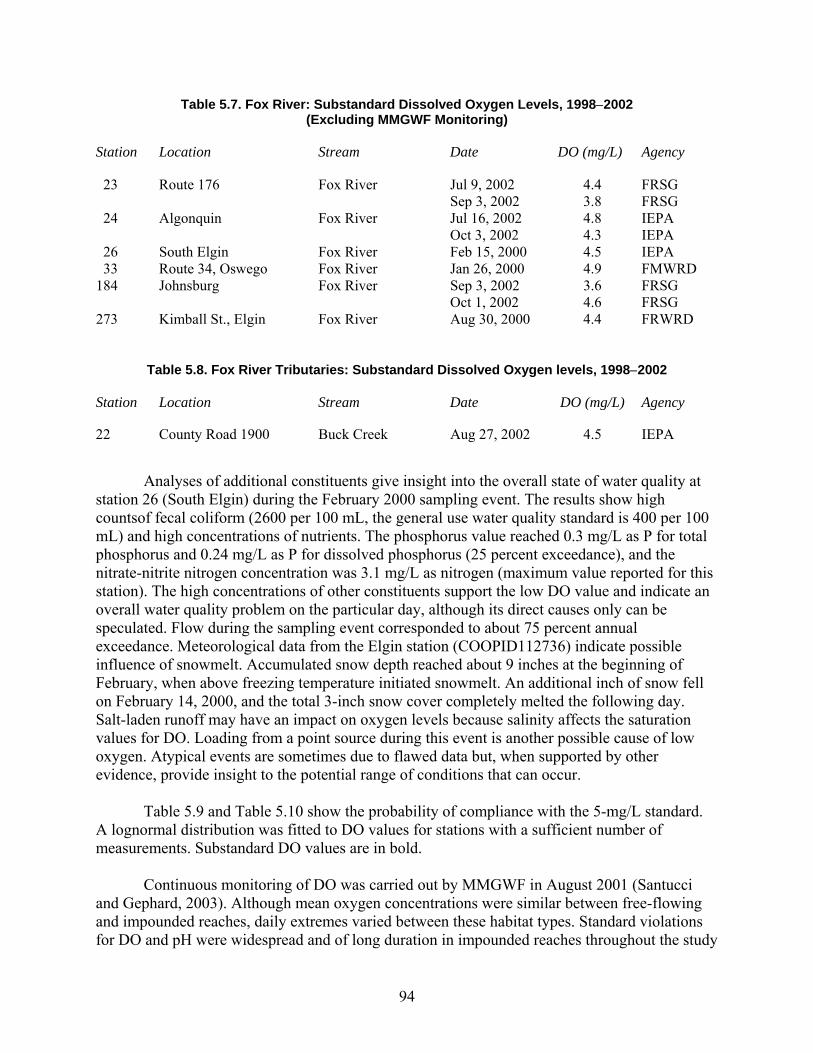
Table 5.7. Fox River: Substandard Dissolved Oxygen Levels, 1998−2002 (Excluding MMGWF Monitoring)
Station Location Stream Date DO (mg/L) Agency
23 Route 176 Fox River Jul 9, 2002 4.4 FRSG Sep 3, 2002 3.8 FRSG
24 Algonquin Fox River Jul 16, 2002 4.8 IEPA Oct 3, 2002 4.3 IEPA
26 South Elgin Fox River Feb 15, 2000 4.5 IEPA 33 Route 34, Oswego Fox River Jan 26, 2000 4.9 FMWRD
184 Johnsburg Fox River Sep 3, 2002 3.6 FRSG Oct 1, 2002 4.6 FRSG
273 Kimball St., Elgin Fox River Aug 30, 2000 4.4 FRWRD
Table 5.8. Fox River Tributaries: Substandard Dissolved Oxygen levels, 1998−2002
Station Location Stream Date DO (mg/L) Agency 22 County Road 1900 Buck Creek Aug 27, 2002 4.5 IEPA
Analyses of additional constituents give insight into the overall state of water quality at station 26 (South Elgin) during the February 2000 sampling event. The results show high countsof fecal coliform (2600 per 100 mL, the general use water quality standard is 400 per 100 mL) and high concentrations of nutrients. The phosphorus value reached 0.3 mg/L as P for total phosphorus and 0.24 mg/L as P for dissolved phosphorus (25 percent exceedance), and the nitrate-nitrite nitrogen concentration was 3.1 mg/L as nitrogen (maximum value reported for this station). The high concentrations of other constituents support the low DO value and indicate an overall water quality problem on the particular day, although its direct causes only can be speculated. Flow during the sampling event corresponded to about 75 percent annual exceedance. Meteorological data from the Elgin station (COOPID112736) indicate possible influence of snowmelt. Accumulated snow depth reached about 9 inches at the beginning of February, when above freezing temperature initiated snowmelt. An additional inch of snow fell on February 14, 2000, and the total 3-inch snow cover completely melted the following day. Salt-laden runoff may have an impact on oxygen levels because salinity affects the saturation values for DO. Loading from a point source during this event is another possible cause of low oxygen. Atypical events are sometimes due to flawed data but, when supported by other evidence, provide insight to the potential range of conditions that can occur.
Table 5.9 and Table 5.10 show the probability of compliance with the 5-mg/L standard.
A lognormal distribution was fitted to DO values for stations with a sufficient number of measurements. Substandard DO values are in bold.
Continuous monitoring of DO was carried out by MMGWF in August 2001 (Santucci
and Gephard, 2003). Although mean oxygen concentrations were similar between free-flowing and impounded reaches, daily extremes varied between these habitat types. Standard violations for DO and pH were widespread and of long duration in impounded reaches throughout the study
94

Table 5.9. Fox River: Probability of Compliance with the 5-mg/L DO Standard, 1998−2002
Station Location Compliance (%) Count Minimal DO
31 Route 71, Ottawa > 99.8 33 7.7 34 Yorkville > 99.8 59 5.6 33 Route 34, Oswego > 99.8 166 4.9 27 Montgomery > 99.8 231 6.6 40 Geneva 99.5 25 6.0 26 South Elgin 99.5 201 4.5 35 National St., Elgin > 99.8 21 8.6
273 Kimball-Lawrence St., Elgin 99.2 95 4.4 240 I-90 Bridge N of Elgin > 99.8 113 6.4
24 Algonquin 98.5 69 4.3 23 Route 176 95.7 49 3.8
184 Johnsburg 92.3 21 3.6 Notes: Substandard DO values are in bold.
Table 5.10. Fox River Tributaries: Probability of Compliance with the 5-mg/L DO Standard, 1998−2002
Station
Location
Stream
Compliance (%)
Count
Minimal DO
1 Thompson Road by Wonder Lake Nippersink Creek > 99.8 35 6.3 3 Bull Valley Road Boone Creek N/A 3 8.7
14 Leroy Oaks Ferson Creek N/A 3 9.0 22 County Road 1900 Buck Creek N/A 3 4.5 25 Route 20, Elgin Poplar Creek > 99.8 41 7.2 28 Route 47 Blackberry Creek 98.7 39 5.2 29 1 mi N Sheridan Somonauk Creek 99.8 38 6.3
236 Wind Road, Spring Grove Nippersink Creek 99.5 39 5.7 268 Route 31 Tyler Creek > 99.8 21 8.8 Notes: NA indicates not applicable, insufficient data. Substandard DO values are in bold. area, but they occurred infrequently and for shorter time periods in free-flowing habitats. Minimum DO concentrations were below the 5-mg/L standard at eight of 11 impounded stations during the first sampling event and all four impoundments monitored during the second event. The water quality standard allows DO to drop below 6 mg/L, provided it lasts less than eight hours in a 24-hour period. When substandard conditions existed in impounded areas, they typically lasted for more than 8 hours in a 24-hour period (>15 hours at two stations). In contrast, DO fell below 6 mg/L at only two of 11 stations in the free-flowing river, and these conditions lasted for only a short time (<2 hours). Substandard oxygen and pH conditions in Fox River impounded areas occurred during periods of low flows in combination with warm water temperatures (Santucci and Gephard, 2003).
95

5.2.5. pH
Available Data. There are 13 sites on the Fox River and 13 on its tributaries with at least five measurements over the last five years. There are 39 additional sites with from one to four measurements available. The monitoring agencies include IEPA, FRSG, FRWRD, and MMGWF. Eight stations have data from all years, two stations have data only from 1998, and two stations have data only from 2002.
Seasonal Variations. The pattern varies from station to station. Flow Regime Variations. A relationship between flow and pH is observed only at
stations downstream of Montgomery: 27 (Montgomery), 31 (Route 71, Ottawa), 33 (Route 34, Oswego), and 34 (Yorkville). The value of pH for these stations decreases with increasing flow (Figure 5.17). Santucci and Gephard (2003) reported that high pH values during continuous monitoring often were associated with oxygen levels above saturation. Grab samples confirm this for stations 31 (Route 71, Ottawa), 197 (Route 173, Wisconsin-Illinois border), and 240 (I-90 Bridge north of Elgin).
Stream pH is affected by consumption of carbon dioxide during photosynthesis. High photosynthesis during low-flow periods can contribute to an increase of stream pH value above the standard.
Longitudinal Changes. There are differences among stations but no clear pattern from upstream to downstream.
Water Quality Standards. Illinois water quality standards state “pH shall be within the range of 6.5 to 9.0 except for natural causes” (IAC, 2002). There were no cases of pH being less than 6.5 over the last five years and only four cases when pH dropped below 7. Only one value less than 7 was reported at tributaries (station 28 – Route 47, Blackberry Creek). The minimum value measured during the investigated period along the Fox River was 6.6 (two cases). However, pH values above 9 often were reported (Tables 5.11 and 5.12). Most of them were measured by the FMWRD at station 33 (Route 34, Oswego). This station is not monitored by other agencies (only two samples were analyzed by the IEPA for this location).
Flow (cfs)
pH
100 1000 100007
8
9
10
11
Figure 5.17. Change in pH with flow (semi-logarithmic scale), station 27 (Montgomery), 1998–2002
96
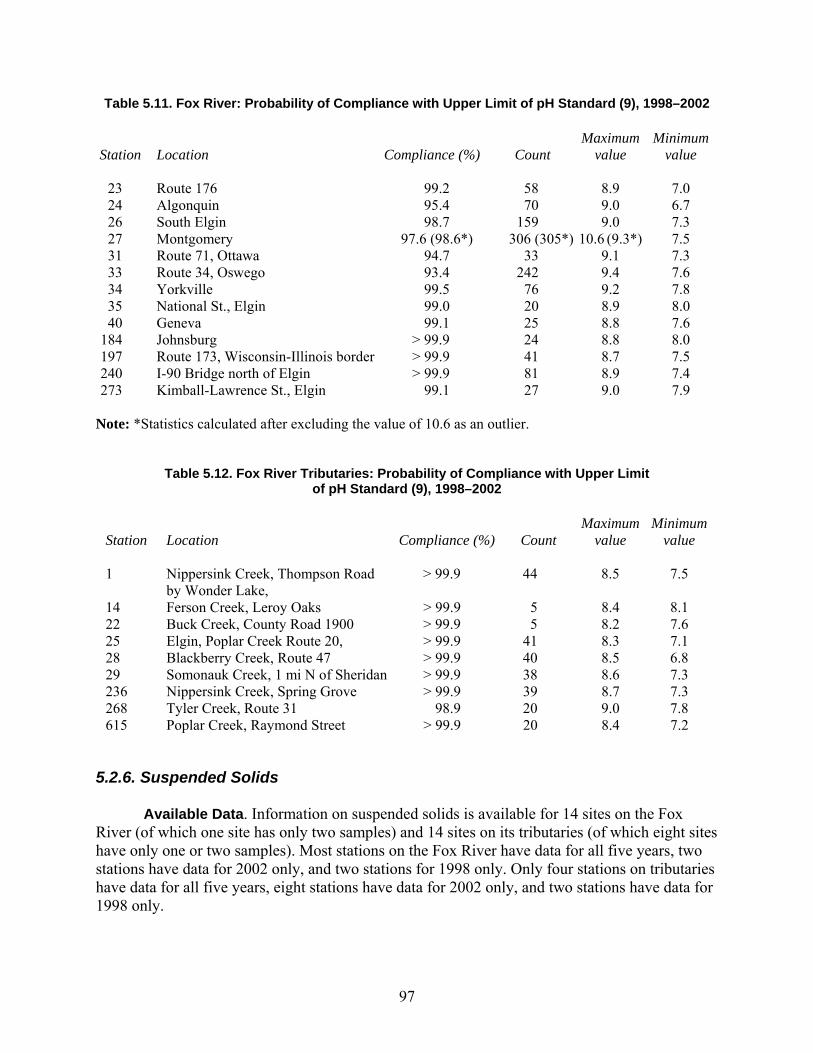
Table 5.11. Fox River: Probability of Compliance with Upper Limit of pH Standard (9), 1998–2002 Station
Location
Compliance (%)
Count
Maximum value
Minimum value
23 Route 176 99.2 58 8.9 7.0 24 Algonquin 95.4 70 9.0 6.7 26 South Elgin 98.7 159 9.0 7.3 27 Montgomery 97.6 (98.6*) 306 (305*) 10.6 (9.3*) 7.5 31 Route 71, Ottawa 94.7 33 9.1 7.3 33 Route 34, Oswego 93.4 242 9.4 7.6 34 Yorkville 99.5 76 9.2 7.8 35 National St., Elgin 99.0 20 8.9 8.0 40 Geneva 99.1 25 8.8 7.6
184 Johnsburg > 99.9 24 8.8 8.0 197 Route 173, Wisconsin-Illinois border > 99.9 41 8.7 7.5 240 I-90 Bridge north of Elgin > 99.9 81 8.9 7.4 273 Kimball-Lawrence St., Elgin 99.1 27 9.0 7.9
Note: *Statistics calculated after excluding the value of 10.6 as an outlier.
Table 5.12. Fox River Tributaries: Probability of Compliance with Upper Limit of pH Standard (9), 1998–2002
Station
Location
Compliance (%)
Count
Maximum value
Minimum value
1 Nippersink Creek, Thompson Road
by Wonder Lake, > 99.9 44 8.5 7.5
14 Ferson Creek, Leroy Oaks > 99.9 5 8.4 8.1 22 Buck Creek, County Road 1900 > 99.9 5 8.2 7.6 25 Elgin, Poplar Creek Route 20, > 99.9 41 8.3 7.1 28 Blackberry Creek, Route 47 > 99.9 40 8.5 6.8 29 Somonauk Creek, 1 mi N of Sheridan > 99.9 38 8.6 7.3 236 Nippersink Creek, Spring Grove > 99.9 39 8.7 7.3 268 Tyler Creek, Route 31 98.9 20 9.0 7.8 615 Poplar Creek, Raymond Street > 99.9 20 8.4 7.2
5.2.6. Suspended Solids
Available Data. Information on suspended solids is available for 14 sites on the Fox River (of which one site has only two samples) and 14 sites on its tributaries (of which eight sites have only one or two samples). Most stations on the Fox River have data for all five years, two stations have data for 2002 only, and two stations for 1998 only. Only four stations on tributaries have data for all five years, eight stations have data for 2002 only, and two stations have data for 1998 only.
97

Data on suspended solids in the Fox River were collected by the IEPA at nine sites. Most samples on tributaries were taken and analyzed by the IEPA. The FRWRD sampled two tributaries in 1998 in addition to four stations on the mainstem sampled throughout the investigated period. The FMWRD analyzed suspended solids for two stations on the Fox River as part of their quarterly sampling.
Seasonal Variations. All stations exhibit a similar pattern that is illustrated by the data collected at station 27 (Montgomery) in Figure 5.18. Late fall and winter concentrations are low followed by an increase in spring (April−May). Concentrations stay high until September or October. The peak concentrations usually occur in July.
Suspended solids are a mixture of inorganic (silt and clay) and organic (decomposed plant material, soil humus, and algae) material. High summer concentrations are influenced by increased algal populations.
Flow Regime Variations. The relationship between concentration of suspended solids and flow is ambiguous. It is commonly assumed that high flow rates are associated with high suspended solid concentrations as runoff erodes soil or organic particles. However, this typical trend is not apparent, as illustrated by the data from station 27 (Montgomery) shown in Figure 5.19.
The expected flow-suspended solids relationship possibly is perturbed by the contribution
of algae during the summer. Figure 5.20 shows the relationship with flow broken down by quarters. The data show a positive correlation between suspended solids concentration and flow for all quarters with January−March data showing the steepest increase. Suspended algae, limited erosion during the winter months, and contribution from point sources are likely causes for these relationships.
Interference with algae concentration complicates determination of soil erosion.
Planktonic algal concentrations theoretically are lower at high flows. Therefore, high suspended
Month
Con
cent
ratio
n (m
g/L)
1 2 3 4 5 6 7 8 9 10 11 121
10
100
1000
Figure 5.18. Suspended solids by months, station 27 (Montgomery), 1998–2002
98

Flow (cfs)
Con
cent
ratio
n (m
g/L)
100 1000 100001
10
100
1000
Figure 5.19. Change in suspended solids with flow (logarithmic scale),
station 27 (Montgomery), 1998–2002
Flow (cfs)
Con
cent
ratio
n (m
g/L)
QuartersJan - MarApr - JunJul - SepOct - Dec
100 1000 100001
10
100
1000
Figure 5.20. Change in suspended solids with flow (logarithmic scale), categorized
by quarters, station 27 (Montgomery), 1998–2002 solids loads during high flows mostly can be attributed to surface runoff and streambank erosion. The inorganic and organic portions of suspended solids can be determined to quantify the possible influence of algae. Only the IEPA samples contain information on volatile suspended solids (VSS), the organic portion of suspended solids. The organic material represents between 20 and 60 percent of suspended solids with average values between 30 and 40 percent. The organic portion decreases with increasing flow. Detailed analyses and the watershed loading model can help to fully clarify the issue.
Longitudinal Changes. Average suspended solids concentrations remain approximately
constant along the Fox River (Figure 5.21). Only the first and the last stations, stations 197 (Route 173, Wisconsin-Illinois border) and 31 (Route 71, Ottawa) have statistically significant higher average concentrations than the stations between them.
99

River Miles
Con
cent
ratio
n (m
g/L)
0 20 40 60 80 100 1201
10
100
1000
Figure 5.21. Suspended solids concentration in the Fox River by river mile, 1998–2002
Table 5.13. Fox River: Suspended Solids Concentration (mg/L), Basic Statistics Derived Using Log-Normal Distribution, 1998–2002
Station Location Count Minimum Average Maximum
23 Route 176 70 3 35 122 24 Algonquin 72 6 37 194 26 South Elgin 211 1 36 224 27 Montgomery 79 3 45 234 31 Route 71, Ottawa 30 11 63 202 33 Route 34, Oswego 22 4 40 86 34 Yorkville 26 6 31 118 35 National St., Elgin 22 1 41 100 40 Geneva 22 3 40 141
184 Johnsburg 23 3 26 71 240 I-90 Bridge N of Elgin 123 1 43 107 273 Kimball-Lawrence St., Elgin 23 1 46 168
Percentiles
Station Location 25 50 75 90 99
23 Route 176 19 31 47 62 122 24 Algonquin 16 28 45 56 194 26 South Elgin 18 31 43 61 148 27 Montgomery 22 37 53 78 234 31 Route 71, Ottawa 29 56 75 127 202 33 Route 34, Oswego 24 44 54 72 86 34 Yorkville 14 27 38 52 118 35 National St., Elgin 16 41 55 78 100 40 Geneva 19 35 49 71 141
184 Johnsburg 11 22 37 42 71 240 I-90 Bridge N of Elgin 26 40 57 73 102 273 Kimball-Lawrence St., Elgin 19 41 59 93 168
100
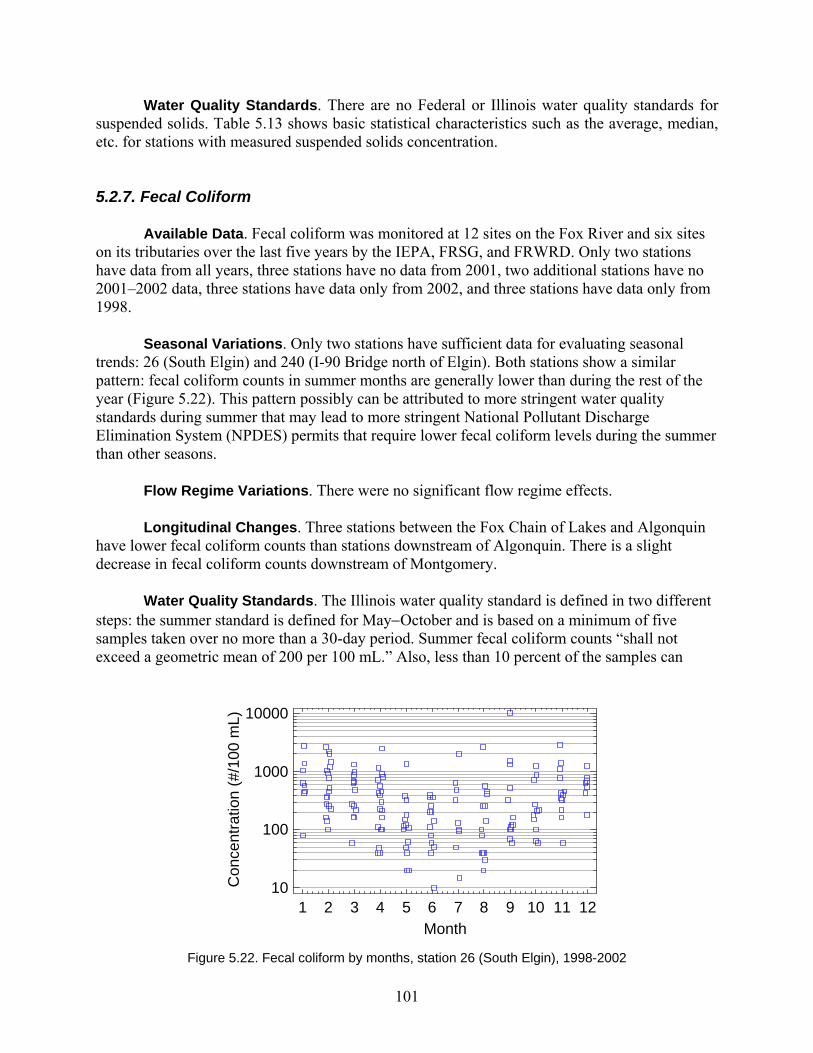
Water Quality Standards. There are no Federal or Illinois water quality standards for suspended solids. Table 5.13 shows basic statistical characteristics such as the average, median, etc. for stations with measured suspended solids concentration.
5.2.7. Fecal Coliform
Available Data. Fecal coliform was monitored at 12 sites on the Fox River and six sites on its tributaries over the last five years by the IEPA, FRSG, and FRWRD. Only two stations have data from all years, three stations have no data from 2001, two additional stations have no 2001–2002 data, three stations have data only from 2002, and three stations have data only from 1998.
Seasonal Variations. Only two stations have sufficient data for evaluating seasonal trends: 26 (South Elgin) and 240 (I-90 Bridge north of Elgin). Both stations show a similar pattern: fecal coliform counts in summer months are generally lower than during the rest of the year (Figure 5.22). This pattern possibly can be attributed to more stringent water quality standards during summer that may lead to more stringent National Pollutant Discharge Elimination System (NPDES) permits that require lower fecal coliform levels during the summer than other seasons.
Flow Regime Variations. There were no significant flow regime effects. Longitudinal Changes. Three stations between the Fox Chain of Lakes and Algonquin
have lower fecal coliform counts than stations downstream of Algonquin. There is a slight decrease in fecal coliform counts downstream of Montgomery.
Water Quality Standards. The Illinois water quality standard is defined in two different steps: the summer standard is defined for May−October and is based on a minimum of five samples taken over no more than a 30-day period. Summer fecal coliform counts “shall not exceed a geometric mean of 200 per 100 mL.” Also, less than 10 percent of the samples can
Month
Con
cent
ratio
n (#
/100
mL)
1 2 3 4 5 6 7 8 9 10 11 1210
100
1000
10000
Figure 5.22. Fecal coliform by months, station 26 (South Elgin), 1998-2002
101

exceed 400 per 100 mL during any 30-day period (IAC, 2002). None of the monitoring programs carried out in the Fox River watershed over the last five years is adequate for determining compliance with the standard.
The probability limit of compliance (i.e., the percentage of samples that should meet the
standard) is not clear from the formulation of the summer standard. Based on the formulation of the standard, the 400/100 mL limit can be exceeded by no more than 10 percent of the total number of samples, or the compliance must be greater than 90 percent for any 30-day period. Tables 5.14 and 5.15 show overall percent compliance with the standard for last five years (i.e., without incorporating the 30-day averaging period). Although the proper evaluation of achieving the standard is not possible with currently available data, the high fecal coliform counts exhibited at almost all stations (all stations downstream of Algonquin) indicate a probable noncompliance with the water quality standard.
Table 5.14. Fox River: Probability of Compliance with Fecal Coliform Standard (400/100 mL), 1998–2002
Station
Location
Compliance (%)
Count
Maximum value (#/100 mL)
23 Route 176 >90 29 1160 24 Algonquin >90 34 4000 26 South Elgin 62 162 TNTC 27 Montgomery 65 31 TNTC 31 Route 71, Ottawa 80 13 1517 34 Yorkville 76 21 4000 35 National St, Elgin 55 22 2720 40 Geneva 81 17 2000
184 Johnsburg >90 18 100 240 I-90 Bridge N of Elgin 73 107 2960 273 Kimball-Lawrence St., Elgin 60 21 1000
Note: TNTC = too numerous to count.
Table 5.15. Fox River Tributaries: Probability of Compliance with Fecal Coliform Standard (400/100 mL), 1998–2002
Station
Location
Stream
Compliance (%)
Count
Maximum value (#/100mL)
25 Route 20, Elgin Poplar Creek 52 14 TNTC 28 Route 47 Blackberry Creek 54 13 7340 29 1 mi N of Sheridan Somonauk Creek 68 13 3800
236 Wind Road Nippersink Creek 60 15 5900 268 Route 31 Tyler Creek 73 22 1340 615 Raymond St. Poplar Creek 58 22 2340 Note: TNTC = too numerous to count.
102

5.2.8. Algae and Biomass – Chlorophyll a
Available Data. There are 31 stations with information on chlorophyll on the Fox River, including 10 stations with more than five observations, and 31 stations on 19 lakes within the study watershed. Tributaries were not sampled for chlorophyll. Monitoring agencies include FRSG (seven stations), IEPA (two stations), FRWRD (two stations), and MMGWF (22 stations). Only the two stations sampled by FRWRD have data from all five years: station 26 (South Elgin) and station 240 (I-90 Bridge north of Elgin). All the agencies monitor mostly at independent locations. The FRSG and FRWRD share one sampling station (26 – South Elgin).
Seasonal Variations. The limited number of samples does not allow for statistical
comparison. Generally, chlorophyll concentrations are higher during summer and early fall. Flow Regime Variations. Analyses indicate a decrease in chlorophyll a concentration
with increasing flow. However, more data would be required to confirm this relationship. Longitudinal Changes. The apparent slight increase in chlorophyll a concentration from
upstream to downstream is not statistically significant. Water Quality Standards. A standard for chlorophyll is not specifically defined in the
State of Illinois. Title 35 (IAC, 2002) states: “waters of the State shall be free from sludge or bottom deposits, floating debris, visible oil, odor, plant or algal growth, color or turbidity of other than natural origin,” but does not give any specific numerical guidelines. There is generally a good agreement between planktonic primary production and algal biomass, and algal biomass is an excellent trophic state indicator. Chlorophyll a is the dominant type of chlorophyll in the algae most commonly found in surface waters, and it is a commonly used variable for algal biomass. Pheophytin is a breakdown product of chlorophyll, and the ratio of chlorophyll to pheophytin provides information about the health of the algal population. The proportion of pheophytin is low during periods of algae growth and high during periods of algae population decline, such as follows prolonged cloudy weather or exposure of algae to toxic substances. Only values corrected for pheophytin have been considered in the analyses below.
The USEPA Nutrient Guidance (USEPA, 2000a) defines chlorophyll criteria for Corn
Belt Region (VI) as follows: 2.7 micrograms per liter or µg/L (chlorophyll a measured by the fluorometric method with acid correction), 7.33 µg/L (chlorophyll a measured by the spectrophotometric method with acid correction), or 6.83 µg/L (chlorophyll a b c measured by the trichromatic method). Eutrophic conditions are often associated with chlorophyll a concentrations exceeding 10 µg/L (USEPA, 1974).
Table 5.16 shows basic statistical characteristics such as the average, median, etc. for
stations with measured chlorophyll a. Even the minimum values exceed the recommended criteria for all stations. The minimum values are also at least two times higher than the USEPA indicator of eutrophic condition.
103

Table 5.16. Fox River: Chlorophyll a Concentration (µg/L): Basic Statistics Derived Using Log-Normal Distribution, 1998–2002
Station Location Count Minimum Average Maximum
23 Route 176 20 42 101 246 24 Algonquin 25 32 97 259 26 South Elgin 27 21 101 246 27 Montgomery 24 54 108 273 34 Yorkville 25 46 109 328 40 Geneva 21 40 112 270
184 Johnsburg 23 24 89 251
Percentiles Station Location 25 50 75 90 99
23 Route 176 72 108 123 182 294 24 Algonquin 67 97 147 192 337 26 South Elgin 79 101 157 193 328 27 Montgomery 60 97 176 224 404 34 Yorkville 69 96 206 240 456 40 Geneva 84 99 168 222 388
184 Johnsburg 62 83 117 173 300
5.2.9. Priority Pollutants
Priority pollutants refer to a list of about 130 specific pollutants. The priority pollutants are a subset of “toxic pollutants” as defined in the Clean Water Act. These 130 pollutants were assigned a high priority for development of water quality criteria and effluent limitation guidelines because they are frequently found in wastewater. Heavy metals, pesticides, and other chemicals are among those included on the priority pollutant list:
• Heavy Metals (Total and Dissolved): “Heavy Metal” refers to heavy, dense, metallic elements that usually occur at only trace levels in water. However, certain forms of these metals are very toxic and tend to accumulate in the suspended and bed sediments of water bodies (arsenic, cadmium, chromium, lead, mercury, zinc, etc.).
• Pesticides: Pesticides comprise a large class of compounds of concern. Typical pesticides and herbicides include DDT, aldrin, chlordane, endosulfan, endrin, heptachlor, and diazinon. Concentrations of pesticides in urban runoff may be equal or even greater than the pesticides in agricultural runoff.
• Polycyclic Aromatic Hydrocarbons (PAHs): Polycyclic Aromatic Hydrocarbons include a family of semi-volatile organic pollutants such as naphthalene, anthracene, pyrene, and benzo(a)pyrene. There are typically two main sources of PAHs: spilled or released petroleum products (from oil spills or the discharge of oil production brines) and combustion products that are found in urban runoff.
104

• Polychlorinated biphenyls (PCBs): Polychlorinated biphenyls are organic chemicals that formerly had widespread use in electrical transformers and hydraulic equipment. This class of chemicals is extremely persistent in the environment and has been proven to bioconcentrate in the food chain, thereby leading to environmental and human health concerns in areas such as the Great Lakes.
This section focuses on evaluating ambient water quality with respect to trace metals.
Due to the accumulation of metals in sediment or in biota, a comprehensive assessment of toxic effects caused by trace metals would have to include evaluation of sediment concentrations (Chapter 6) as well as concentrations in tissues and biotic indices.
Available Data. Metals were measured at 10 sites on the Fox River and 12 sites on its
tributaries over the last five years. Most sampling was carried out by the IEPA (21 stations). Data also were provided by the FRWRD (two stations) and FMWRD (two stations). Most stations have data from all five years; there are two stations with data only from 2002.
Most sampling results by the IEPA were reported as below detection limits (95% of data
for regulated constituent). The FMWRD sampled two stations on a quarterly basis for 26 metals: station 27 (Montgomery) and station 33 (Route 34, Oswego). Samples were analyzed for both total and dissolved forms since 2000. Only total concentrations were reported for prior samples. The FRWRD sampled two stations: station 26 (South Elgin) and station 240 (I-90 Bridge north of Elgin). Five samples were collected in September−October 1998, with an additional sample collected in May 1999.
Seasonal Variations. Only the FMWRD sampling provides enough data for analyses of
seasonal effects. Samples were usually collected in February, June, August, and November. August average concentrations of total copper are higher than average concentrations in February or November (Figure 5.23). A similar trend was observed for other metals, such as zinc (Figure 5.24), iron, etc.
Month
Con
cent
ratio
n (m
g/L)
1 2 3 4 5 6 7 8 9 10 11 121
10
100
Figure 5.23. Total copper concentration by month, station 27 (Montgomery),
1998–2002 FMWRD
105

Month
Con
cent
ratio
n (m
g/L)
1 2 3 4 5 6 7 8 9 10 11 121
10
100
Figure 5.24. Total zinc concentration by month, station 27 (Montgomery),
1998–2002 FMWRD Flow Regime Variations. No significant flow regime effects were noted. Longitudinal Changes. Data were insufficient for evaluation. Water Quality Standards. Water quality standards for priority pollutants are defined
based on toxicity of the compound. According to Title 35 (IAC, 2002), acute standard (AS) for the aquatic life protection “shall not be exceeded at any time.” The chronic standard (CS) “shall not be exceeded by the arithmetic average of at least four consecutive samples collected over any period of at least four days.” The human health standard (HHS) “shall not be exceeded when the stream flow is at or above the harmonic mean flow…nor shall an annual average, based on at least eight samples, collected in a manner representative of the sampling period, exceed the HHS.”
For the metals that have water quality-based standards dependent upon hardness, the
water quality standard is calculated using the hardness of the water body at the time the metals sample was collected. To calculate attainment status of chronic metals standards, the concentration of the metal in each sample is divided by the calculated water quality standard for the sample. This ratio, called a quotient, indicates how many times the measured value exceeds the standard. The water quality standard is attained if the mean of the sample quotients is less than or equal to one for the duration of the averaging period.
The acute standard was exceeded on three occasions (Table 5.17) for various
constituents. The IEPA sampling on May 26, 1999 in Algonquin showed unusually high concentrations for most analyzed metals. For example, the acute standard for copper was exceeded by 10 times and the chronic standard by about 20 times.
106

Table 5.17. Acute Toxicity of Metals: Measurements Exceeding Acute Standard, 1998–2002
Station
Stream
Date
Constituent
Conc. (µg/L)
Acute quotient
Agency
24 Fox River, Algonquin May 26, 1999 Ni, total 389 1.99 IEPA
Cu, total 485 10.48 IEPA 26 Fox River, South Elgin May 17, 2002 Zn, total 500 1.62 IEPA 25 Poplar Creek Apr 13, 1999 Fe, dissolved 1300 1.30 IPEA
Table 5.18. Fox River: Chronic Toxicity of Metals: Measurements Exceeding Chronic Standard, 1998–2002
Station
Location
Date
Constituent Conc. (µg/L)
Chronic quotient
Agency
24 Algonquin 17 Mar 1998 Zn, total 130 1.97 IEPA
26 May 1999 Zn, total 203 3.91 IEPA Ni, total 389 32.84 IEPA Cu, total 485 17.17 IEPA 13 Feb 2001 Ni, total 30 2.32 IEPA
26 South Elgin 16 Sep 1998 Ni, total 13 1.33 FRWRD 17 May 2002 Zn, total 500 9.04 IEPA
27 Montgomery 2 Feb 1998 Ni, total 39 2.71 FMWRD 3 Aug 1998 Ni, total 33 2.62 FMWRD 2 Nov 1998 Ni, total 16 1.18 FMWRD 1 Feb 1999 Ni, total 28 2.30 FMWRD 1 Jun 1999 Ni, total 29 2.27 FMWRD 1 Aug 2000 Ni, total 16 1.38 FMWRD Cu, total 30 1.08 FMWRD Zn, total 67 1.32 FMWRD 28 Nov 2000 Ni, total 33 2.25 IEPA 4 Jun 2002 Zn, total 65 1.30 FMWRD
33 Route 34, Oswego 2 Feb 1998 Ni, total 45 3.33 FMWRD 2 Jun 1998 Ni, total 16 1.27 FMWRD 3 Aug 1998 Ni, total 33 2.83 FMWRD 2 Nov 1998 Ni, total 19 1.42 FMWRD 1 Feb 1999 Ni, total 30 2.48 FMWRD 1 Jun 1999 Ni, total 27 2.02 FMWRD 1 Jun 2000 Ni, total 13 1.1 FMWRD Cu, total 43 1.54 FMWRD
240 I-90 Bridge north of Elgin 16 Sep 1998 Ni, total 12 1.16 FRWRD
107

Table 5.19. Fox River Tributaries: Chronic Toxicity of Metals: Measurements Exceeding Chronic Standard, 1998–2002
Station
Location
Date
Constituent Conc. [µg/L]
Chronic quotient
Agency
25 Poplar Creek, Route 20 May 6, 2002 Cd, total 4 1.36 IEPA 28 Blackberry Creek, Route
47 Dec 21, 1999 Ni, total 29 1.88 IEPA
Cu, total 49 1.33 IEPA 94 Little Indian Creek at
Syndam Road Aug 27, 2002 Cd, total 4 1.36 IEPA
236 Nippersink Creek, Spring Grove,
Jul 17, 2000 Ni, dissolved 25 1.96 IEPA
Statistical evaluation of chronic toxicity is limited by the prevalence of reported concentrations below the detection limit. Only 5 percent of reported concentrations for constituents with Illinois water quality standards are actual values, not the detection limit, which does not allow calculating the probability of compliance with a standard. However, this does not mean heavy metals are not a problem in the Fox River watershed. For example, the IEPA detection limit for cadmium or nickel exceeds the chronic standard. The evaluation of compliance with acute and chronic standards is impossible with existing data. Tables 5.18 and 5.19, respectively, display actual measurements exceeding chronic standards in the Fox River mainstem and its tributaries. 5.3. Data Gaps
The following sections describe available data and its limitations (data gaps) in terms of geographic coverage in the watershed, period of record, constituents monitored, and monitoring type and frequency.
5.3.1. Geographic Coverage and Period of Record
The FoxDB includes water quality data collected at 190 different sites in the Fox River watershed; 88 sites are located directly on the Fox River and 102 sites are on the tributaries. However, only 60 sites were sampled at least once during the last five years (1998-2002): 38 sites on the Fox River and 22 sites on its tributaries (Figure 5.25). The middle part of the watershed (mostly in Kane County) was monitored extensively contrary to a sporadic coverage of the lower part of the watershed. The middle part has been a focus of water quality studies due to its urbanization level and numerous impoundments in this region.
The dams and associated impoundments introduce discontinuity and limit whether the
sample accurately reflects water quality above and below the monitoring site. Water quality, as
108

!(
!(
!(
!(
!(
!(
!(
!(!(
!(
!(
!(
!(
!(
!(
!(
!(
!(
!(
!(
!(
!(
!(
!(
!(
!(
!(
!(
!(
!(
!(!(
!(
!(
!(
!(
!(
!(!(
!(
!(
!(!(
!(
!(
!(
!(
!(
!(
!(
!(!(
!(
!(
!(
!(!(
!(
!(
!(
!(
!(
!(
!(
!(
!(
!(
!(
!(
!(!(
!(
!(
!(
!(
!(!(
!(
!(
!(!(
!(
!(
!(
!(
!(
!(
!(
!(!(!(!(
!(!(
!(
!(
!(
!(!(
!(
!(
!(
!(
!(
!(!(
!(!(
!(
!(!(!(
!(!( !(!(
!(
!(
!(
!(
!(
!(
!(
!(
!(
!(
!(
!(
!(
!(!(
!(
!(
!(
!(
!(
!(!(
!(
!(!(
!(
!(
!(
!(!(
!(!(
!(
!(!(
!(
!(
!(!(
!(!(
!(
!(
!(
!(!(
!(
!(
!(!(
!(
!(
!(!(
!(
!(
!(
!(
!(
!(
!(
!(
!(
!(
!(
!(
!(
!(
!(
!(!(
!(
!(
MCHENRY
LAKE
COOK
DUPAGE
WILL
KENDALL
KANE
DEKALB
LEE
LASALLE
Nippersink C re ek Squaw Creek
Tyler Creek
Mill Creek
Black be rry Creek
Fox
Riv
er
Big Rock Creek
Little Rock Creek
Little Indian Creek
Indian Creek
Buck Creek
WISCONSIN
ILLINOIS
Fox River
GRUNDY
±
0 5 102.5 Miles
1:600,000
Water Quality Data!( Before 1998
!( 1998 - Present
Lakes
Rivers and Streams
Figure 5.25. Stations for which water quality data are available
109

well as chemical and biological processes, differ between free-flowing and impounded reaches. Data from individual impoundments and free-flow areas would be required to fully understand and evaluate water quality in the Fox River.
The next series of maps shows the availability of recent measurements for individual constituents: DO, ammonia nitrogen, nitrate nitrogen, phosphorus, fecal coliform, suspended solids, and trace metals (Figures 5.26−5.32). Only stations with recent data (1998–2002) are displayed, categorized by number of data points available. These figures include grab samples as well as continuous water quality measurements. Generally, water quality data are very limited for the lower part of the watershed and for the Fox River tributaries.
A standard constituent included in most monitoring programs is DO, a primary indicator
of enrichment by organic matter. Most stations with DO measurements are located in the middle part of the watershed (Figure 5.26), which is typical for all constituents. Most tributaries have either no data or limited data available.
Sites with available nutrient data (ammonia, nitrate, and phosphorus, Figures 5.27–5.29)
and associated constituents (suspended solids, Figure 5.31) exhibit a similar spatial pattern. Sufficient data were gathered at sites evenly located along the mainstem with a cluster of sites around Elgin. Other sites have no data or limited data.
Fecal coliform was sampled at several sites along the mainstem, again with a cluster of
sites around Elgin (Figure 5.30). Limited trace metals data (Figure 5.32) are available for some tributaries and for the Fox River. Symbols indicate a total number of samples analyzed over the last five years, including those many concentrations below detection limit.
The sampling of tributaries mostly is limited to locations near their confluence with the
Fox River. Table 5.20 summarizes data available for Fox River tributaries. Stations nearest to the confluence are included because of their importance in modeling water quality in the Fox River. Only three tributaries are a part of regular monitoring programs (Poplar Creek, Blackberry Creek, and Somonauk Creek).
Three tributaries represent a top priority in bridging the data gap: Crystal Creek has no current data, but there are several point sources in its watershed (Lake in the Hills Sanitary Treatment Plant or STP, and Crystal Lake STP). Recent data available for both Tyler Creek and Ferson Creek are insufficient (sampled once or twice). However, these creeks represent significant tributaries in the area of interest.
High priority can be assigned to Flint Creek, There are three point sources upstream in
the Flint Creek watershed: Barrington STP, Cary STP, and Quaker Oats. Current data are insufficient (all sampled once in July 2000).
Poplar Creek has data available from the IEPA’s regular monitoring at 6-week sampling intervals. These data would be desirable to refine. There are no data for Waubansee Creek draining an area that is experiencing high growth. No current data exist for Indian Creek, Little Rock Creek, Big Rock Creek, or Buck Creek, significant tributaries in the area downstream of Yorkville. Gathering of the data for these tributaries should receive medium priority.
110

!(
!<
!<
!<
!<
!<
!<
!<!<
!<
!<
!<
!<
!<
!(
!(
!(
!(
!(
!(
!(
!(
!(
!(
!(
!(
!<
!(
!<
!<
!(
!(
!(
!(
!(
!(
!(
!(!(
!(!(
!(
!(!(
!(
!(
!(!(
!(!(
!(
!(
!(
!(
!(
!(
!<!(
!(
!<
MCHENRY
LAKE
COOK
DUPAGE
WILL
KENDALL
KANE
DEKALB
LEE
LASALLE
Nippersink C re ek Squaw Creek
Tyler Creek
Mill Creek
Blac
k be rry Creek
Fox
Riv
er
Big Rock Creek
Little Rock Creek
Little Indian Creek
Indian Creek
Buck C re ek
WISCONSIN
ILLINOIS
Fox River
GRUNDY
±
0 5 102.5 Miles
1:600,000
Dissolved Oxygen!( No available data
!< 1 - 4 measurements
!( 5 or more measurements
Lakes
Rivers and Streams
Figure 5.26. Stations for which dissolved oxygen data are available, 1998–2002
111
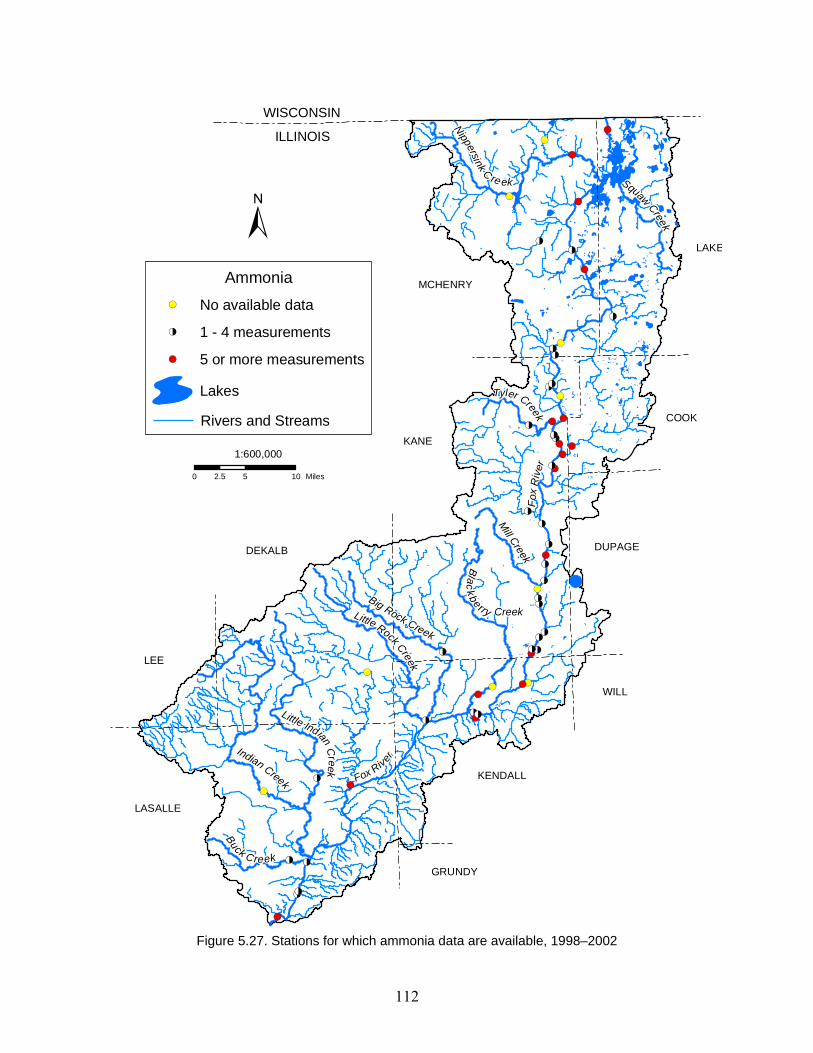
!(
!(
!<
!<
!<
!<
!(
!(!(
!(
!<
!(
!(
!<
!(
!(
!(
!(
!(
!(
!(
!<
!(
!(
!(
!(
!<
!(
!<
!<
!(
!(
!(
!(
!(
!(
!(
!<!<
!<!<
!<
!<!<
!<
!<
!<!<
!<!<
!<
!<
!<
!<
!<
!<
!<!<
!(
!(
MCHENRY
LAKE
COOK
DUPAGE
WILL
KENDALL
KANE
DEKALB
LEE
LASALLE
Nippersink C re ek Squaw Creek
Tyler Creek
Mill Creek
Black be rry Creek
Fox
Riv
er
Big Rock Creek
Little Rock Creek
Little Indian Creek
Indian Creek
Buck Creek
WISCONSIN
ILLINOIS
Fox River
GRUNDY
±
1:600,000
0 5 102.5 Miles
Ammonia!( No available data
!< 1 - 4 measurements
!( 5 or more measurements
Lakes
Rivers and Streams
Figure 5.27. Stations for which ammonia data are available, 1998–2002
112
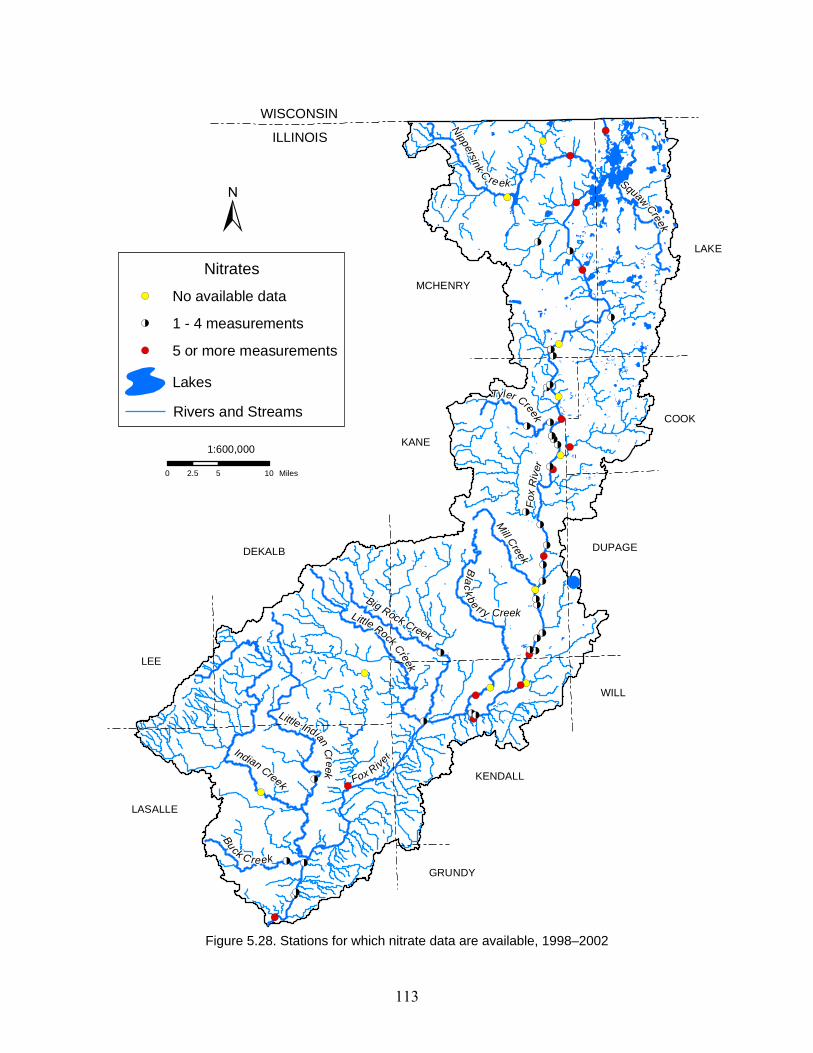
!(
!(
!<
!<
!<
!<
!(
!(!(
!(
!<
!(
!(
!<
!(
!(
!(
!(
!(
!(
!(
!<
!(
!(
!(
!<
!<
!(
!<
!<
!(
!(
!(
!(
!(
!<
!<
!<!<
!<!<
!<
!<!<
!<
!<
!<!<
!<!<
!<
!<
!<
!<
!<
!<
!<!<
!(
!(
MCHENRY
LAKE
COOK
DUPAGE
WILL
KENDALL
KANE
DEKALB
LEE
LASALLE
Nippersink C re ek Squaw Creek
Tyler Creek
Mill Creek
Blac
k be rry Creek
Fox
Riv
er
Big Rock Creek
Little Rock Creek
Little Indian Creek
Indian Creek
Buck C reek
WISCONSIN
ILLINOIS
Fox River
GRUNDY
±
0 5 102.5 Miles
1:600,000
Nitrates!( No available data
!< 1 - 4 measurements
!( 5 or more measurements
Lakes
Rivers and Streams
Figure 5.28. Stations for which nitrate data are available, 1998–2002
113

!(
!<
!<
!<
!<
!<
!<
!<!<
!<
!<
!<
!<
!<
!(
!(
!(
!(
!(
!(
!(
!<
!(
!<
!(
!(
!<
!(
!<
!<
!(
!(
!(
!(
!(
!(
!(
!<!<
!<!<
!<
!<!<
!<
!<
!<!<
!<!<
!<
!<
!<
!<
!<
!<
!<!<
!(
!(
MCHENRY
LAKE
COOK
DUPAGE
WILL
KENDALL
KANE
DEKALB
LEE
LASALLE
Nippersink C re ek Squaw Creek
Tyler Creek
Mill Creek
Blac
k be rry Creek
Fox
Riv
er
Big Rock Creek
Little Rock Creek
Little Indian Creek
Indian Creek
Buck C reek
WISCONSIN
ILLINOIS
Fox River
GRUNDY
0 5 102.5 Miles
1:600,000
±Phosphorus
!( No available data
!< 1 - 4 measurements
!( 5 or more measurements
Lakes
Rivers and Streams
Figure 5.29. Stations for which phosphorus data are available, 1998–2002
114
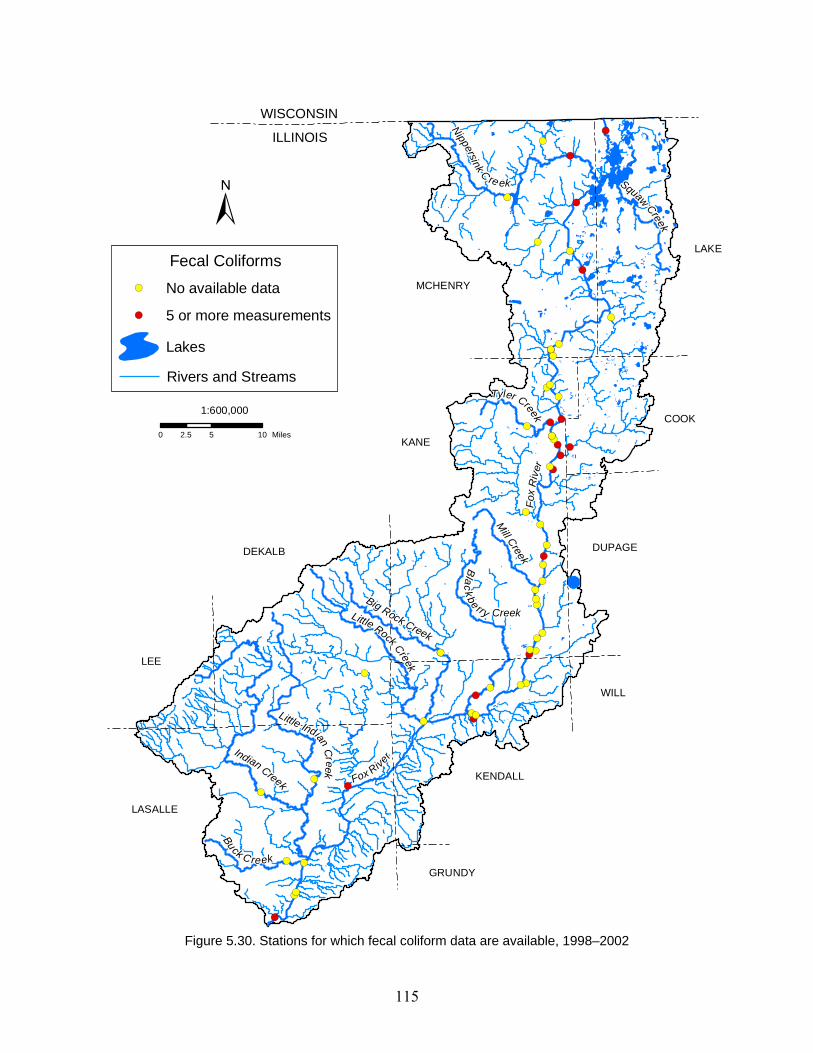
!(
!(
!(
!(
!(
!(
!(
!(!(
!(
!(
!(
!(
!(
!(
!(
!(
!(
!(
!(
!(
!(
!(
!(
!(
!(
!(
!(
!(
!(
!(
!(
!(
!(
!(
!(
!(
!(!(
!(!(
!(
!(!(
!(
!(
!(!(
!(!(
!(
!(
!(
!(
!(
!(
!(!(
!(
!(
MCHENRY
LAKE
COOK
DUPAGE
WILL
KENDALL
KANE
DEKALB
LEE
LASALLE
Nippersink C re ek Squaw Creek
Tyler Creek
Mill Creek
Blac
k be rry Creek
Fox
Riv
er
Big Rock Creek
Little Rock Creek
Little Indian Creek
Indian Creek
Buck C reek
WISCONSIN
ILLINOIS
Fox River
GRUNDY
±
0 5 102.5 Miles
1:600,000
Fecal Coliforms!( No available data
!( 5 or more measurements
Lakes
Rivers and Streams
Figure 5.30. Stations for which fecal coliform data are available, 1998–2002
115

!(
!(
!<
!<
!<
!<
!(
!(!(
!(
!<
!(
!(
!<
!(
!(
!(
!(
!(
!(
!(
!<
!(
!(
!(
!(
!<
!(
!<
!<
!(
!(
!(
!(
!(
!(
!(
!<!<
!<!<
!<
!<!<
!<
!<
!<!<
!<!<
!<
!<
!<
!<
!<
!<
!<!<
!(
!(
MCHENRY
LAKE
COOK
DUPAGE
WILL
KENDALL
KANE
DEKALB
LEE
LASALLE
Squaw Creek
Nippersink C re ek
Tyler Creek
Mill Creek
Black be rry Creek
Fox
Riv
er
Big Rock Creek
Little Rock Creek
Little Indian Creek
Indian Creek
Buck C re ek
WISCONSIN
ILLINOIS
Fox River
GRUNDY
0 5 102.5 Miles
1:600,000
±Suspended Solids
!( No available data
!< 1 - 4 measurements
!( 5 or more measurements
Lakes
Rivers and Streams
Figure 5.31. Stations for which suspended solids data are available, 1998–2002
116
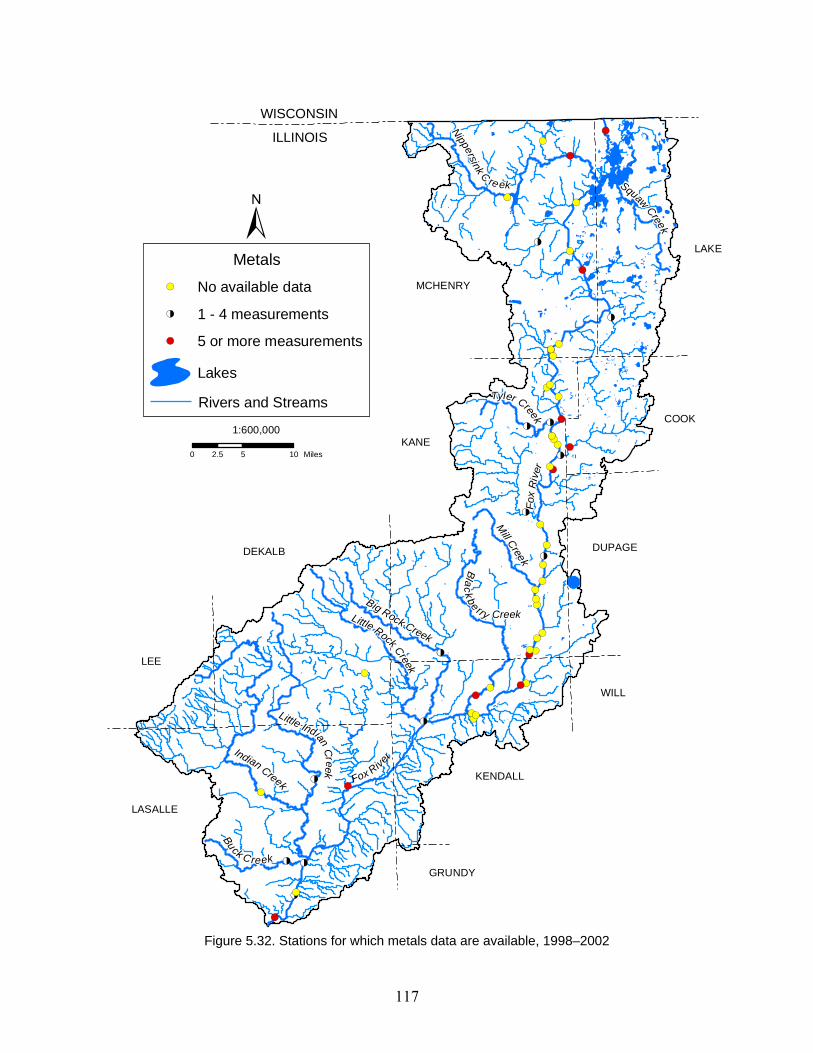
!(
!(
!<
!<
!<
!<
!(
!(!(
!(
!<
!(
!(
!<
!(
!(
!(
!(
!(
!(
!(
!<
!(
!(
!(
!(
!<
!<
!<
!<
!(
!(
!(
!(
!(
!<
!(
!(!(
!(!(
!(
!(!(
!(
!(
!(!(
!(!(
!(
!(
!(
!(
!(
!(
!(!(
!<
!(
MCHENRY
LAKE
COOK
DUPAGE
WILL
KENDALL
KANE
DEKALB
LEE
LASALLE
Nippersink C re ek Squaw Creek
Tyler Creek
Mill Creek
Blac k be rry Creek
Fox
Riv
er
Big Rock Creek
Little Rock Creek
Little Indian Creek
Indian Creek
Buck C reek
WISCONSIN
ILLINOIS
Fox River
GRUNDY
0 5 102.5 Miles
1:600,000
±Metals
!( No available data
!< 1 - 4 measurements
!( 5 or more measurements
Lakes
Rivers and Streams
Figure 5.32. Stations for which metals data are available, 1998–2002
117

Table 5.20. List of Fox River Tributaries and Available Water Quality Data Ordered from Upstream to Downstream
Tributary name Station ID Agency Year Sampling frequency Boone Creek 3 NAWQA 2000 (1 sample) IEPA 2002 (2 samples) Flint Creek 4 NAWQA 2000 (1 sample) Spring Creek 275* * (1970s, 1980s) * Crystal Creek 271* * (1970s) * Tyler Creek 5 NAWQA 2000 (1 sample) 268 FRWRD 1998 1 week Poplar Creek 25 IEPA 1998–2002 6 weeks NAWQA 2000 (1 sample) 615 FRWRD 1998 1 week Ferson Creek 14 NAWQA 2000 (1 sample) IEPA 2002 (2 samples) Mill Creek 15 NAWQA 2000 (1 sample) Waubansee Creek 16 NAWQA 2000 (1 sample) Blackberry Creek 28 IEPA 1998–2002 6 weeks 17 NAWQA 2000 (1 sample) Little Rock Creek 19 NAWQA 2000 (1 sample) IEPA 2002 (1 sample) Big Rock Creek 75* * (1970s, 1980s) * 18 NAWQA 2000 (1 sample) 99 IEPA 2002 (1 sample) Somonauk Creek 29 IEPA 1998–2002 6 weeks 20 NAWQA 2000 (1 sample) Indian Creek 74* * (1970s, 1980s) * 564* * (1980s) * 21 NAWQA 2000 (1 sample) Little Indian Creek 94 IEPA 2002 (2 samples) Buck Creek 22 NAWQA 2000 (1 sample) IEPA 2002 (2 samples) Note: *Stations with no recent data available.
5.3.2. Chemical Data Gaps
There are pollution issues typically associated with urbanizing area for which little or no data are available in the study area. The insufficiency of data precludes determining if these are problematic in the Fox River watershed.
Priority Pollutants. A lack of accurate values for trace metals and especially their
dissolved form is a serious limitation. State-of-the-art “clean” techniques minimizing sample contamination are not presently used in collecting and analyzing priority pollutants. In addition, analytical methods with relatively high detection limits hinder data usability. For example, the IEPA detection limit for cadmium or nickel is higher than the respective chronic standards, which precludes evaluating compliance with the standards.
118

Winter Runoff. Potential pollutants associated with melting snow are a concern to watershed managers in northern climates, especially in areas applying chemicals for road deicing. Snowmelt and associated early spring runoff can carry substantial portions of the annual load of pollutants such as hydrocarbons, metals, solids, nutrients, and chlorides. Snowmelt runoff originates from short duration chemically driven events due to application of deicers and from longer duration end-of-season events due to warmer temperatures. Snowmelt runoff carries pollutants that have accumulated in the snowpack for prolonged periods, as well as street and soil surface material that washes off these surfaces. In addition, high concentrations of chlorides can increase toxicity of heavy metals by increasing the dissolved fraction of heavy metals (Warren and Zimmerman, 1994).
Emerging Water Quality Issues. During the last three decades, monitoring and
evaluation of the impact of chemical pollution has focused almost exclusively on the “conventional” priority pollutants. Another diverse group of chemicals has received comparatively little attention as potential environmental pollutants. This includes pharmaceuticals, active ingredients in personal care products, nutraceuticals, fragrances, sun-screen agents, and many others (e.g., Kolpin et al., 2002). These compounds and their metabolites are introduced to the aquatic environment primarily by untreated and treated sewage, although there are a number of exposure routes. Immediate effects could escape detection if they are subtle, while long-term effects could be insidious (Daughton and Ternes, 1999). 5.3.3. Limitations Imposed by Frequency and Type of Monitoring
Frequency. Current regular monitoring programs are not conducted with a frequency needed for evaluating compliance with IEPA water quality standards. Many standards require at least four samples within a 30-day period. Sampling once every six weeks or even biweekly does not satisfy this requirement. In this report, a probabilistic evaluation was substituted for direct assessment of compliance. This has been possible because the purpose of the previous analyses was to identify problematic areas and constituents. However, no firm conclusion can be made on compliance with water quality standards. This includes standards for fecal coliform and chronic standards for ammonia nitrogen.
Diurnal Measurements. Evaluation of nutrient enrichment and the effect of algae on the
oxygen regime is possible only with diurnal measurements. Algae produce oxygen during the day and consume it during the night, causing a wide fluctuation in oxygen concentration. A daytime grab sample cannot always indicate possible problems. Diurnal measurements are critical for evaluating compliance with the IEPA standards for DO. Continuous monitoring of DO and other constituents (e.g., temperature, pH, and conductivity) is now possible with available instrumentation. Only the MMGWF conducted continuous monitoring in the Fox River during the last five years. Critical night conditions are not reflected in available grab samples that were mostly collected in the morning or early afternoon.
Event-Driven Sampling. Current sampling programs do not address all problems related
to urban, and agricultural runoff or combined sewer overflows. Water quality can change rapidly during runoff events with receding and rising portions of the hydrograph yielding different
119

concentrations for the same flow. Thus, a single sample is not representative of the mean concentration during the event. Flow proportional sampling or multiple sampling of the event would be required to evaluate average event concentrations or loads associated with the event. 5.4. Summary
Water quality data compiled in the FoxDB were analyzed for major constituents. Table 5.21 summarizes results of analyses described in this chapter for key locations on the Fox River. Problems are identified either by presence of values exceeding the standards (DO, P, and pH) or by probabilistic evaluation (ammonia nitrogen and fecal coliform). Water quality data for two locations, Algonquin and South Elgin, indicate possible problems for all investigated constituents.
Table 5.22 reviews critical time and critical conditions for investigated constituents. The constituents can be categorized into two groups: problems associated with summer and low-flow period, or with high-flow periods (usually spring runoff events). Steady-state water quality models are appropriate to describe summer fairly constant low-flow conditions. Pollutants associated with runoff events should be modeled using dynamic models.
Table 5.21. Water Quality Problems Identified at Selected Locations
Probabilistic non-compliance
Presence of samples with substandard
values Ammonia nitrogen Fecal Coliform Phosphorus DO pH
Location (Chronic quotient >1) (>400/100mL) (>0.076 mg/L+) (<5 mg/L) (>9) Johnsburg X X Route 176 X X Algonquin X X X X X South Elgin X X X X Geneva X X X Montgomery X X X Oswego X X X Yorkville X X X Ottawa X X X X Note: + Not a water quality standard
120

Table 5.22. Critical Times and Conditions Identified for Selected Constituents in the Fox River Watershed
Constituent Critical time Critical conditions
DO Summer (seasonal variation) High temperature, low flow Prior to sunrise (diurnal variation) Impoundment, algae Total nitrogen Concentration fairly constant Both high and low flows Ammonia Varies, typically summer (lower standard) Low flow, high temperature and high
pH (effects standard) Nitrate/nitrite Spring Precipitation events Total phosphorus Summer Low flow (concentration)
High flow (load) Fecal coliform Summer (lower standard) No clear pattern pH Varies Low flow, algae Suspended solids Summer (concentration)
Spring to early summer (load) High flow
Algae Summer Low flow, nutrient enrichment Trace metals Summer Insufficient data available
121


Chapter 6. Sediment Chemistry Analyses 6.1. Introduction
Sediment chemistry is closely linked to the water quality of the overlying water body. Many water-borne pollutant and nutrient species are predominately associated with particulate matter that can settle and become sediment. Fine-grained silt or clay sediments have the potential to sorb or otherwise sequester greater quantities of pollutant species than sand-sized sediments because of their higher surface area. Because fine-grained sediments tend to accumulate behind dams, dam removal options must consider the quality of the exposed sediments. Moreover, dissolved oxygen (DO) is usually rapidly depleted (within millimeters or mm to a few centimeters or cm) below the sediment-water interface of fine-grained sediments resulting in significant sediment oxygen demand (SOD), which helps to depress DO concentrations in the overlying water column. The resulting anoxic conditions can also drive the development of steep chemical gradients for various pollutant and nutrient species with the result that sediment-water exchange can constitute a significant component of nutrient or pollutant budgets for a water body.
This chapter focuses on description and analysis of the sediment chemistry data compiled
for the Fox River database (FoxDB). The major sediment chemistry data sources are described and summarized to identify significant spatial, temporal, and chemical data gaps.
6.2. Data Sources
There are four main sources of sediment chemistry data in the FoxDB. Data obtained from the U.S. Environmental Protection Agency (USEPA) Legacy STORET system originated from the routine or intensive monitoring programs of the Illinois EPA or IEPA (USEPA, 2003g). Data exist for 30 mainstem and 29 tributary stations over a total period of record from 1974 to 1996, although most stations were sampled on only one or two dates over this period. These data can be selected from the FoxDB by querying Project Code 21ILSED. Surficial sediments (~0-3 cm depth) were analyzed for a variety of inorganic and organic species, including Total Phosphorus (total P) and Total Kjeldahl Nitrogen (TKN). Since the early 1980s, sediment samples have been wet sieved to less than 63 microns (µm) prior to analysis. Short (1997) compared data for sieved and unsieved stream sediments from Illinois from IEPA data for 12 chemical parameters. Chemical Oxygen Demand (COD) was the only parameter for which mean sieved and unsieved concentrations were statistically different, and COD was dropped from analyses in 1991.
A pilot project of the U.S. Geological Survey (USGS) National Water Quality
Assessment (NAQWA) Program was conducted in the upper Illinois River basin in 1987, and results have been summarized in several publications (Colman and Sanzolone 1991, 1992; Fitzpatrick et al., 1995, 1998). Data specific to the Illinois portion of the Fox River basin consist of 24 stations on the mainstem of the Fox River and 54 tributary stations. Surficial sediments (~0-3 cm depth) were collected in September and October 1987. These data can be selected by querying Project Code 2 in the FoxDB. Mainstem samples were wet sieved (< 63 µm) in the
123

field, while tributary samples were dry sieved in the laboratory. These streambed sediments were analyzed for 46 elements. A comparison between wet and dry sieving methods was conducted at 21 sites. Wet sieved concentrations were higher than dry sieved concentrations by up to 17 percent for most elements (Colman and Sanzolone, 1992).
In a recent USGS NAQWA investigation, sediment sampling was conducted at 46 sites in
the Fox and Des Plaines River basins between 1999 and 2001 (Adolphson et. al., 2002). Surficial sediments were sampled at 14 tributary stations in the Illinois portion of the Fox River watershed in July 2000 and analyzed for 46 elements. Wet sieving (< 63 µm) was performed in the field prior to analysis. These data can be selected by querying Project Code 11 in the FoxDB.
Santucci and Gephard (2003) collected both surficial and cored sediments between
August and September 2000. Samples from both above and below 12 mainstem dams (Algonquin to Dayton) were analyzed for an extensive suite of inorganic and organic constituents (80 total). These data can be selected by querying Project Code 12 in the FoxDB. Sediment samples apparently were not sieved prior to analysis, and the cored samples were homogenized and treated as a single composite sample. The geographical coverage of these four major sediment chemistry datasets is presented in Figure 6.1.
6.3. Sediment Quality Analyses
Despite the incompleteness of the current sediment chemistry dataset, comparing the four primary datasets against each other and with respect to location in the watershed (upstream to downstream, mainstem vs. tributaries) serves to establish similarities and differences among data sources and locations. A few such examples are provided below. The original reports and publications that present and discuss these data can be consulted for more information about individual datasets. It is possible to roughly assess the relative degree of sediment contamination in the basin with the data at hand by comparison to published sediment quality guidelines for certain contaminants. These guidelines are best viewed as screening criteria, most appropriately used to help establish if additional more detailed chemical or sediment toxicity studies are warranted. At present, there are no enforceable sediment concentration standards for streams in Illinois, or in any other state.
6.3.1. Total Phosphorus and Total Kjeldahl Nitrogen
Total phosphorus (P) and total Kjeldahl nitrogen (TKN) concentrations for mainstem Fox River sediments are presented as a function of decimal latitude (a surrogate for location along the river) in Figures 6.2 and 6.3. Three major data sources contain total P data, and two contain TKN data. A preliminary assessment of USEPA (2003g) data revealed no discernible differences in either total P or TKN concentrations from samples collected at the same site at different times. Hence, all sampling dates for this dataset are included in the figures. The lower and upper horizontal dotted lines in the figures refer to the “elevated” and “highly elevated” concentrations, respectively, for total P and TKN given in Short (1997). These concentrations are based on an
124

")")")")")")")")")")")")")")")")")")")")")")")")")")")")")")")")")")")")")")")")")")")")")")")")")")")")")")")")")")")")")")")")")")")")")")")")")")")")")")")")")")")")")")")")")")")")")")")")")")")")")")")")")")")")")")")")")")")")")")")")")")")")")")")")")")")")")")")")")")")")")")")")")")")")")")")")")")")")")")")")
")")")")")")")")")")")")")")")")")")")")")")")")")")")")")")")")")")")")")")")")")")")")")")")")")")")")")")")")")")")")")")")")")")")")")")")")")")")")")")")")")")")")")")")")")")")")")")")")")")")")")")")")")")")")")")")")")")")")")")")")")")")")")")")")")")")")")")")")")")")")")")")")")")")")")")")")")")")")")")")")
")")")")")")")")")")")")")")")")")")")")")")")")")")")")")")")")")")")")")")")")")")")")")")")")")")")")")")")")")")")")")")")")")")")")")")")")")")")")")")")")")")")")")")")")")")")")")")")")")")")")")")")")")")")")")")")")")")")")")")")")")")")")")")")")")")")")")")")")")")")")")")")")")")")")")")")")")")")")")")")")
")")")")")")")")")")")")")")")")")")")")")")")")")")")")")")")")")")")")")")")")")")")")")")")")")")")")")")")")")")")")")")")")")")")")")")")")")")")")")")")")
")")")")")")")")")")")")")")")")")")")")")")")")")")")")")")")")")")")")")")")")")")")")")")")")")")")")")")")")")")")")")")")")")")")")")")")")")")")")")")")")
")")")")")")")")")")")")")")")")")")")")")")")")")")")")")")")")")")")")")")")")")")")")")")")")")")")")")")")")")")")")")")")")")")")")")")")")")")")")")")")")
")")")")")")")")")")")")")")")")")")")")")")")")")")")")")")")")")")")")")")")")")")")")")")")")")")")")")")")")")")")")")")")")")")")")")")")")")")")")")")")")
")")")")")")")")")")")")")")")")")")")")")")")")")")")")")")")")")")")")")")")")")")")")")")")")")")")")")")")")")")")")")")")")")")")")")")")")")")")")")")")")
")")")")")")")")")")")")")")")")")")")")")")")")")")")")")")")")")")")")")")")")")")")")")")")")")")")")")")")")")")")")")")")")")")")")")")")")")")")")")")")")
")")")")")")")")")")")")")")")")")")")")")")")")")")")")")")")")")")")")")")")")")")")")")")")")")")")")")")")")")")")")")")")")")")")")")")")")")")")")")")")")
")")")")")")")")")")")")")")")")")")")")")")")")")")")")")")")")")")")")")")")")")")")")")")")")")")")")")")")")")")")")")")")")")")")")")")")")")")")")")")")")
")")")")")")")")")")")")")")")")")")")")")")")")")")")")")")")")")")")")")")")")")")")")")")")")")")")")")")")")")")")")")")")")")")")")")")")")")")")")")")")")
")")")")")")")")")")")")")")")")")")")")")")")")")")")")")")")")")")")")")")")")")")")")")")")")")")")")")")")")")")")")")")")")")")")")")")")")")")")")")")")")
")")")")")")")")")")")")")")")")")")")")")")")")")")")")")")")")")")")")")")")")")")")")")")")")")")")")")")")")")")")")")")")")")")")")")")")")")")")")")")")")
")")")")")")")")")")")")")")")")")")")")")")")")")")")")")")")")")")")")")")")")")")")")")")")")")")")")")")")")")")")")")")")")")")")")")")")")")")")")")")")")
")")")")")")")")")")")")")")")")")")")")")")")")")")")")")")")")")")")")")")")")")")")")")")")")")")")")")")")")")")")")")")")")")")")")")")")")")")")")")")")")
")")")")")")")")")")")")")")")")")")")")")")")")")")")")")")")")")")")")")")")")")")")")")")")")")")")")")")")")")")")")")")")")")")")")")")")")")")")")")")")")
")")")")")")")")")")")")")")")")")")")")")")")")")")")")")")")")")")")")")")")")")")")")")")")")")")")")")")")")")")")")")")")")")")")")")")")")")")")")")")")")
")")")")")")")")")")")")")")")")")")")")")")")")")")")")")")")")")")")")")")")")")")")")")")")")")")")")")")")")")")")")")")")")")")")")")")")")")")")")")")")")
")")")")")")")")")")")")")")")")")")")")")")")")")")")")")")")")")")")")")")")")")")")")")")")")")")")")")")")")")")")")")")")")")")")")")")")")")")")")")")")")
")")")")")")")")")")")")")")")")")")")")")")")")")")")")")")")")")")")")")")")")")")")")")")")")")")")")")")")")")")")")")")")")")")")")")")")")")")")")")")")")
")")")")")")")")")")")")")")")")")")")")")")")")")")")")")")")")")")")")")")")")")")")")")")")")")")")")")")")")")")")")")")")")")")")")")")")")")")")")")")")")
")")")")")")")")")")")")")")")")")")")")")")")")")")")")")")")")")")")")")")")")")")")")")")")")")")")")")")")")")")")")")")")")")")")")")")")")")")")")")")")")
")")")")")")")")")")")")")")")")")")")")")")")")")")")")")")")")")")")")")")")")")")")")")")")")")")")")")")")")")")")")")")")")")")")")")")")")")")")")")")")")
")")")")")")")")")")")")")")")")")")")")")")")")")")")")")")")")")")")")")")")")")")")")")")")")")")")")")")")")")")")")")")")")")")")")")")")")")")")")")")")")
")")")")")")")")")")")")")")")")")")")")")")")")")")")")")")")")")")")")")")")")")")")")")")")")")")")")")")")")")")")")")")")")")")")")")")")")")")")")")")")")
")")")")")")")")")")")")")")")")")")")")")")")")")")")")")")")")")")")")")")")")")")")")")")")")")")")")")")")")")")")")")")")")")")")")")")")")")")")")")")")")
")")")")")")")")")")")")")")")")")")")")")")")")")")")")")")")")")")")")")")")")")")")")")")")")")")")")")")")")")")")")")")")")")")")")")")")")")")")")")")")")
")")")")")")")")")")")")")")")")")")")")")")")")")")")")")")")")")")")")")")")")")")")")")")")")")")")")")")")")")")")")")")")")")")")")")")")")")")")")")")")")
")")")")")")")")")")")")")")")")")")")")")")")")")")")")")")")")")")")")")")")")")")")")")")")")")")")")")")")")")")")")")")")")")")")")")")")")")")")")")")")")
")")")")")")")")")")")")")")")")")")")")")")")")")")")")")")")")")")")")")")")")")")")")")")")")")")")")")")")")")")")")")")")")")")")")")")")")")")")")")")")")
")")")")")")")")")")")")")")")")")")")")")")")")")")")")")")")")")")")")")")")")")")")")")")")")")")")")")")")")")")")")")")")")")")")")")")")")")")")")")")")")
")")")")")")")")")")")")")")")")")")")")")")")")")")")")")")")")")")")")")")")")")")")")")")")")")")")")")")")")")")")")")")")")")")")")")")")")")")")")")")")")
")")")")")")")")")")")")")")")")")")")")")")")")")")")")")")")")")")")")")")")")")")")")")")")")")")")")")")")")")")")")")")")")")")")")")")")")")")")")")")")")
")")")")")")")")")")")")")")")")")")")")")")")")")")")")")")")")")")")")")")")")")")")")")")")")")")")")")")")")")")")")")")")")")")")")")")")")")")")")")")")")
")")")")")")")")")")")")")")")")")")")")")")")")")")")")")")")")")")")")")")")")")")")")")")")")")")")")")")")")")")")")")")")")")")")")")")")")")")")")")")")")
")")")")")")")")")")")")")")")")")")")")")")")")")")")")")")")")")")")")")")")")")")")")")")")")")")")")")")")")")")")")")")")")")")")")")")")")")")")")")")")")
")")")")")")")")")")")")")")")")")")")")")")")")")")")")")")")")")")")")")")")")")")")")")")")")")")")")")")")")")")")")")")")")")")")")")")")")")")")")")")")")
")")")")")")")")")")")")")")")")")")")")")")")")")")")")")")")")")")")")")")")")")")")")")")")")")")")")")")")")")")")")")")")")")")")")")")")")")")")")")")")")
")")")")")")")")")")")")")")")")")")")")")")")")")")")")")")")")")")")")")")")")")")")")")")")")")")")")")")")")")")")")")")")")")")")")")")")")")")")")")")")")
")")")")")")")")")")")")")")")")")")")")")")")")")")")")")")")")")")")")")")")")")")")")")")")")")")")")")")")")")")")")")")")")")")")")")")")")")")")")")")")")
")")")")")")")")")")")")")")")")")")")")")")")")")")")")")")")")")")")")")")")")")")")")")")")")")")")")")")")")")")")")")")")")")")")")")")")")")")")")")")")")
")")")")")")")")")")")")")")")")")")")")")")")")")")")")")")")")")")")")")")")")")")")")")")")")")")")")")")")")")")")")")")")")")")")")")")")")")")")")")")")")
")")")")")")")")")")")")")")")")")")")")")")")")")")")")")")")")")")")")")")")")")")")")")")")")")")")")")")")")")")")")")")")")")")")")")")")")")")")")")")")")
")")")")")")")")")")")")")")")")")")")")")")")")")")")")")")")")")")")")")")")")")")")")")")")")")")")")")")")")")")")")")")")")")")")")")")")")")")")")")")")")
")")")")")")")")")")")")")")")")")")")")")")")")")")")")")")")")")")")")")")")")")")")")")")")")")")")")")")")")")")")")")")")")")")")")")")")")")")")")")")")")
")")")")")")")")")")")")")")")")")")")")")")")")")")")")")")")")")")")")")")")")")")")")")")")")")")")")")")")")")")")")")")")")")")")")")")")")")")")")")")")")
")")")")")")")")")")")")")")")")")")")")")")")")")")")")")")")")")")")")")")")")")")")")")")")")")")")")")")")")")")")")")")")")")")")")")")")")")")")")")")")")
")")")")")")")")")")")")")")")")")")")")")")")")")")")")")")")")")")")")")")")")")")")")")")")")")")")")")")")")")")")")")")")")")")")")")")")")")")")")")")")")
")")")")")")")")")")")")")")")")")")")")")")")")")")")")")")")")")")")")")")")")")")")")")")")")")")")")")")")")")")")")")")")")")")")")")")")")")")")")")")")")
")")")")")")")")")")")")")")")")")")")")")")")")")")")")")")")")")")")")")")")")")")")")")")")")")")")")")")")")")")")")")")")")")")")")")")")")")")")")")")")")
")")")")")")")")")")")")")")")")")")")")")")")")")")")")")")")")")")")")")")")")")")")")")")")")")")")")")")")")")")")")")")")")")")")")")")")")")")")")")")")")
")")")")")")")")")")")")")")")")")")")")")")")")")")")")")")")")")")")")")")")")")")")")")")")")")")")")")")")")")")")")")")")")")")")")")")")")")")")")")")")")
")")")")")")")")")")")")")")")")")")")")")")")")")")")")")")")")")")")")")")")")")")")")")")")")")")")")")")")")")")")")")")")")")")")")")")")")")")")")")")")")
")")")")")")")")")")")")")")")")")")")")")")")")")")")")")")")")")")")")")")")")")")")")")")")")")")")")")")")")")")")")")")")")")")")")")")")")")")")")")")")")
")")")")")")")")")")")")")")")")")")")")")")")")")")")")")")")")")")")")")")")")")")")")")")")")")")")")")")")")")")")")")")")")")")")")")")")")")")")")")")")")
")")")")")")")")")")")")")")")")")")")")")")")")")")")")")")")")")")")")")")")")")")")")")")")")")")")")")")")")")")")")")")")")")")")")")")")")")")")")")")")")
")")")")")")")")")")")")")")")")")")")")")")")")")")")")")")")")")")")")")")")")")")")")")")")")")")")")")")")")")")")")")")")")")")")")")")")")")")")")")")")")
")")")")")")")")")")")")")")")")")")")")")")")")")")")")")")")")")")")")")")")")")")")")")")")")")")")")")")")")")")")")")")")")")")")")")")")")")")")")")")")")
")")")")")")")")")")")")")")")")")")")")")")")")")")")")")")")")")")")")")")")")")")")")")")")")")")")")")")")")")")")")")")")")")")")")")")")")")")")")")")")")
")")")")")")")")")")")")")")")")")")")")")")")")")")")")")")")")")")")")")")")")")")")")")")")")")")")")")")")")")")")")")")")")")")")")")")")")")")")")")")")")
")")")")")")")")")")")")")")")")")")")")")")")")")")")")")")")")")")")")")")")")")")")")")")")")")")")")")")")")")")")")")")")")")")")")")")")")")")")")")")")")
")")")")")")")")")")")")")")")")")")")")")")")")")")")")")")")")")")")")")")")")")")")")")")")")")")")")")")")")")")")")")")")")")")")")")")")")")")")")")")")")
")")")")")")")")")")")")")")")")")")")")")")")")")")")")")")")")")")")")")")")")")")")")")")")")")")")")")")")")")")")")")")")")")")")")")")")")")")")")")")")")
")")")")")")")")")")")")")")")")")")")")")")")")")")")")")")")")")")")")")")")")")")")")")")")")")")")")")")")")")")")")")")")")")")")")")")")")")")")")")")")")
")")")")")")")")")")")")")")")")")")")")")")")")")")")")")")")")")")")")")")")")")")")")")")")")")")")")")")")")")")")")")")")")")")")")")")")")")")")")")")")")
")")")")")")")")")")")")")")")")")")")")")")")")")")")")")")")")")")")")")")")")")")")")")")")")")")")")")")")")")")")")")")")")")")")")")")")")")")")")")")")")
")")")")")")")")")")")")")")")")")")")")")")")")")")")")")")")")")")")")")")")")")")")")")")")")")")")")")")")")")")")")")")")")")")")")")")")")")")")")")")")")
")")")")")")")")")")")")")")")")")")")")")")")")")")")")")")")")")")")")")")")")")")")")")")")")")")")")")")")")")")")")")")")")")")")")")")")")")")")")")")")")
")")")")")")")")")")")")")")")")")")")")")")")")")")")")")")")")")")")")")")")")")")")")")")")")")")")")")")")")")")")")")")")")")")")")")")")")")")")")")")")")
")")")")")")")")")")")")")")")")")")")")")")")")")")")")")")")")")")")")")")")")")")")")")")")")")")")")")")")")")")")")")")")")")")")")")")")")")")")")")")")")
")")")")")")")")")")")")")")")")")")")")")")")")")")")")")")")")")")")")")")")")")")")")")")")")")")")")")")")")")")")")")")")")")")")")")")")")")")")")")")")")
")")")")")")")")")")")")")")")")")")")")")")")")")")")")")")")")")")")")")")")")")")")")")")")")")")")")")")")")")")")")")")")")")")")")")")")")")")")")")")")")
")")")")")")")")")")")")")")")")")")")")")")")")")")")")")")")")")")")")")")")")")")")")")")")")")")")")")")")")")")")")")")")")")")")")")")")")")")")")")")")")
")")")")")")")")")")")")")")")")")")")")")")")")")")")")")")")")")")")")")")")")")")")")")")")")")")")")")")")")")")")")")")")")")")")")")")")")")")")")")")")")
")")")")")")")")")")")")")")")")")")")")")")")")")")")")")")")")")")")")")")")")")")")")")")")")")")")")")")")")")")")")")")")")")")")")")")")")")")")")")")")")
")")")")")")")")")")")")")")")")")")")")")")")")")")")")")")")")")")")")")")")")")")")")")")")")")")")")")")")")")")")")")")")")")")")")")")")")")")")")")")")")
")")")")")")")")")")")")")")")")")")")")")")")")")")")")")")")")")")")")")")")")")")")")")")")")")")")")")")")")")")")")")")")")")")")")")")")")")")")")")")")")
")")")")")")")")")")")")")")")")")")")")")")")")")")")")")")")")")")")")")")")")")")")")")")")")")")")")")")")")")")")")")")")")")")")")")")")")")")")")")")")")")")")")")")")")")")")")")")")")")")")")")")")")")")")")")")")")")")")")")")")")")")")")")")")")")")")")")")")")")")")")")")")")")")")")")")")")")")")")")")")")
")")")")")")")")")")")")")")")")")")")")")")")")")")")")")")")")")")")")")")")")")")")")")")")")")")")")")")")")")")")")")")")")")")")")")")")")")")")")")")")")
")")")")")")")")")")")")")")")")")")")")")")")")")")")")")")")")")")")")")")")")")")")")")")")")")")")")")")")")")")")")")")")")")")")")")")")")")")")")")")")")
")")")")")")")")")")")")")")")")")")")")")")")")")")")")")")")")")")")")")")")")")")")")")")")")")")")")")")")")")")")")")")")")")")")")")")")")")")")")")")")")
")")")")")")")")")")")")")")")")")")")")")")")")")")")")")")")")")")")")")")")")")")")")")")")")")")")")")")")")")")")")")")")")")")")")")")")")")")")")")")")")
")")")")")")")")")")")")")")")")")")")")")")")")")")")")")")")")")")")")")")")")")")")")")")")")")")")")")")")")")")")")")")")")")")")")")")")")")")")")")")")")
")")")")")")")")")")")")")")")")")")")")")")")")")")")")")")")")")")")")")")")")")")")")")")")")")")")")")")")")")")")")")")")")")")")")")")")")")")")")")")")")
")")")")")")")")")")")")")")")")")")")")")")")")")")")")")")")")")")")")")")")")")")")")")")")")")")")")")")")")")")")")")")")")")")")")")")")")")")")")")")")")
")")")")")")")")")")")")")")")")")")")")")")")")")")")")")")")")")")")")")")")")")")")")")")")")")")")")")")")")")")")")")")")")")")")")")")")")")")")")")")")")
")")")")")")")")")")")")")")")")")")")")")")")")")")")")")")")")")")")")")")")")")")")")")")")")")")")")")")")")")")")")")")")")")")")")")")")")")")")")")")")")
")")")")")")")")")")")")")")")")")")")")")")")")")")")")")")")")")")")")")")")")")")")")")")")")")")")")")")")")")")")")")")")")")")")")")")")")")")")")")")")")
")")")")")")")")")")")")")")")")")")")")")")")")")")")")")")")")")")")")")")")")")")")")")")")")")")")")")")")")")")")")")")")")")")")")")")")")")")")")")")")")
")")")")")")")")")")")")")")")")")")")")")")")")")")")")")")")")")")")")")")")")")")")")")")")")")")")")")")")")")")")")")")")")")")")")")")")")")")")")")")")")
")")")")")")")")")")")")")")")")")")")")")")")")")")")")")")")")")")")")")")")")")")")")")")")")")")")")")")")")")")")")")")")")")")")")")")")")")")")")")")")")
")")")")")")")")")")")")")")")")")")")")")")")")")")")")")")")")")")")")")")")")")")")")")")")")")")")")")")")")")")")")")")")")")")")")")")")")")")")")")")")")
")")")")")")")")")")")")")")")")")")")")")")")")")")")")")")")")")")")")")")")")")")")")")")")")")")")")")")")")")")")")")")")")")")")")")")")")")")")")")")")")
#
#
#
#
#
#
#
#
#
#
#
#
#
#
!(!(!(!(
!(
!(
!(!(
!(!(!(!(
!(
!(!(!(!(!(!(!(!(!(
!(
!(!(
!(
!(
!(
!(
!(
!(
!(
!(
!(!(!(!(
!(
!(!(!(!(
!(!(!(!(!(!(!(!(
!(
!(!(!(!(!(
!(
!(
!(
!(!(!(!(!(
!(
!(
!(
!(
!(
!(!(
!(
!(
!( !(!(!(!(!(!( !(!(
!( !(
!(!(!(!(!(!(
!(!(
!(
!( !(!( !(
!(!(!(
!(
!(
!(!(
!(
!(
GFGFGFGFGFGFGFGFGFGFGFGFGFGFGFGFGFGFGFGFGFGFGFGFGFGFGFGFGFGFGFGFGFGFGFGFGFGFGFGFGFGFGFGFGFGFGFGFGFGFGFGFGFGFGFGFGFGFGFGFGFGFGFGFGFGFGFGFGFGFGFGFGFGFGFGFGFGFGFGFGFGFGFGFGFGFGFGFGFGFGFGFGFGFGFGFGFGFGFGFGFGFGFGFGFGFGFGFGFGFGFGFGFGFGFGFGFGFGFGFGFGFGFGFGFGFGFGFGFGFGFGFGFGFGFGFGFGFGFGFGFGFGFGFGFGFGFGF
GFGFGFGFGFGFGFGFGFGFGFGFGFGFGFGFGFGFGFGFGFGFGFGFGFGFGFGFGFGFGFGFGFGFGFGFGF
GFGFGFGFGFGFGFGFGFGFGFGFGFGFGFGFGFGFGFGFGFGFGFGFGFGFGFGFGFGFGFGFGF
GFGFGFGFGFGFGFGFGFGFGFGFGFGFGFGFGFGFGFGFGFGFGFGFGFGFGFGFGFGFGFGFGFGFGFGFGFGFGFGFGFGFGFGFGFGFGFGFGFGFGFGFGFGFGFGFGFGFGFGFGFGFGFGFGFGFGFGFGFGF
GFGFGFGFGFGFGFGFGFGFGFGFGFGFGFGFGFGFGFGFGFGFGFGFGFGFGFGFGFGFGFGFGFGFGFGFGFGFGFGFGFGFGFGFGFGFGFGFGFGFGFGFGFGFGFGFGFGFGFGFGFGFGFGFGFGFGFGFGFGF
GFGFGFGFGFGFGFGFGFGFGFGFGF
GFGFGFGFGFGFGFGFGFGFGFGFGFGFGFGFGFGFGFGFGFGFGFGFGFGFGFGFGFGFGFGFGFGFGFGFGF
GFGFGFGFGFGFGFGFGFGFGFGFGFGFGFGFGFGFGFGFGFGFGFGFGFGFGFGFGFGFGFGFGFGFGFGFGFGFGFGFGFGFGFGFGFGFGFGFGFGFGFGFGFGFGFGFGFGFGFGFGFGFGFGFGFGFGFGFGFGF
GFGFGFGFGFGFGFGFGFGFGFGFGFGFGFGFGFGFGFGFGFGFGFGFGFGFGFGFGFGFGFGFGFGFGFGFGF
GFGFGFGFGFGFGFGFGFGFGFGFGFGFGFGFGFGFGFGFGFGFGFGFGFGFGFGFGFGFGFGFGFGFGFGFGFGFGFGFGFGFGFGFGFGFGFGFGFGFGFGFGFGFGFGFGFGFGFGFGFGFGFGFGFGFGFGFGFGFGFGFGFGFGFGFGFGFGFGFGFGFGFGFGFGFGFGFGFGFGFGFGFGFGFGFGFGFGFGFGFGFGFGFGFGFGFGFGFGFGFGFGFGFGFGFGFGFGFGFGFGFGFGFGFGFGFGFGFGFGFGFGFGFGFGFGFGFGFGFGFGFGFGFGFGFGFGFGFGFGFGFGFGFGFGFGFGFGFGFGFGFGFGFGFGFGFGFGFGFGFGFGFGFGFGFGFGFGFGFGFGFGFGFGFGFGFGFGFGFGFGFGFGFGFGFGFGFGFGFGFGFGF
GFGFGFGFGFGFGFGFGFGFGFGFGFGFGFGFGFGFGFGFGFGFGFGFGFGFGFGFGFGFGFGFGFGFGFGFGFGFGFGFGFGFGFGFGFGFGFGFGFGFGFGFGFGFGFGFGFGFGFGFGFGFGFGFGFGFGFGFGFGF
GFGFGFGFGFGFGFGFGFGFGFGFGFGFGFGFGFGFGFGFGFGFGFGFGFGFGFGFGFGFGFGFGFGFGFGFGFGFGFGFGFGFGFGFGFGFGFGFGFGFGFGFGFGFGFGFGFGFGFGFGFGFGFGFGFGFGFGFGFGFGFGFGFGFGFGFGFGFGFGFGFGFGFGFGFGFGFGFGFGFGFGFGFGFGFGFGFGFGFGFGFGFGFGFGFGFGFGFGFGFGFGFGFGFGFGFGFGFGFGFGFGFGFGFGFGFGFGFGFGFGFGFGFGFGFGFGFGFGFGFGFGFGFGFGFGFGFGFGFGFGFGF
GFGFGFGFGFGFGFGFGFGFGFGFGFGFGFGFGFGFGFGFGFGFGFGFGFGFGFGFGFGFGFGFGFGFGFGFGF
GFGFGFGFGFGFGFGFGFGFGFGFGFGFGFGFGFGFGFGFGFGFGFGFGFGFGFGFGFGFGFGFGFGFGFGFGFGFGFGFGFGFGFGFGFGFGFGFGFGFGFGFGFGFGFGFGFGFGFGFGFGFGFGFGFGFGFGFGFGFGFGFGFGFGFGFGFGFGFGFGFGFGFGFGFGFGFGFGFGFGFGFGFGFGFGFGFGFGFGFGFGFGFGFGFGFGFGFGFGFGFGFGFGFGFGFGFGFGFGFGFGFGFGFGFGFGFGFGFGFGFGFGFGFGFGFGFGFGFGFGFGFGFGFGFGFGFGFGFGFGFGFGF
GFGFGFGFGFGFGFGFGFGFGFGFGFGFGFGFGFGFGFGFGFGFGFGFGFGFGFGFGFGFGFGFGFGFGFGF
GFGFGFGFGFGFGFGFGFGFGFGFGFGFGFGFGFGFGFGFGFGFGFGFGFGFGFGFGFGFGFGFGFGFGFGF
GFGFGFGFGFGFGFGFGFGFGFGFGFGFGFGFGFGFGFGFGFGFGFGFGFGFGFGFGFGFGFGFGFGFGFGF
GFGFGFGFGFGFGFGFGFGFGFGFGFGFGFGFGFGFGFGFGFGFGFGFGFGFGFGFGFGFGFGFGFGFGFGF
GFGFGFGFGFGFGFGFGFGFGFGFGFGFGFGFGFGFGFGFGFGFGFGFGFGFGFGFGFGFGFGFGFGFGFGF
GFGFGFGFGFGFGFGFGFGFGFGFGFGFGFGFGFGFGFGFGFGFGFGFGFGFGFGFGFGFGFGFGFGFGFGF
GFGFGFGFGFGFGFGFGFGFGFGFGFGFGFGFGFGFGFGFGFGFGFGFGFGFGFGFGFGFGFGFGFGFGFGF
GFGFGFGFGFGFGFGFGFGFGFGFGFGFGFGFGFGFGFGFGFGFGFGFGFGFGFGFGFGFGFGFGFGFGFGFGFGFGFGFGFGFGFGFGFGFGFGFGFGFGFGFGFGFGFGFGFGFGFGFGFGFGFGFGFGFGFGFGFGFGFGFGFGFGFGFGFGFGFGFGFGFGFGFGFGFGFGFGFGFGFGFGFGFGFGFGFGFGFGFGFGFGFGFGFGFGFGF
GFGFGFGFGFGFGFGFGFGFGFGFGFGFGFGFGFGFGFGFGFGFGFGFGFGFGFGFGFGFGFGFGFGFGFGF
GFGFGFGFGFGFGFGFGFGFGFGFGFGFGFGFGFGFGFGFGFGFGFGFGFGFGFGFGFGFGFGFGFGFGFGFGFGFGFGFGFGFGFGFGFGFGFGFGFGFGFGFGFGFGFGFGFGFGFGFGFGFGFGFGFGFGFGFGFGFGFGFGFGFGFGFGFGFGFGFGFGFGFGFGFGFGFGFGFGFGFGFGFGFGFGFGFGFGFGFGFGFGFGFGFGFGFGF
GFGFGFGFGFGFGFGFGFGFGFGFGFGFGFGFGFGFGFGFGFGFGFGFGFGFGFGFGFGFGFGFGFGFGF
GFGFGFGFGFGFGFGFGFGFGFGFGFGFGFGFGFGFGFGFGFGFGFGFGFGFGFGFGFGFGFGFGFGFGFGF
GFGFGFGFGFGFGFGFGFGFGFGFGFGFGFGFGFGFGFGFGFGFGFGFGFGFGFGFGFGFGFGFGFGFGFGF
GFGFGFGFGFGFGFGFGFGFGFGFGFGFGFGFGFGFGFGFGFGFGFGFGFGFGFGFGFGFGFGFGFGFGFGFGFGFGFGFGFGFGFGFGFGFGFGFGFGFGFGFGFGFGFGFGFGFGFGFGFGFGFGFGFGFGFGFGFGF
GFGFGFGFGFGFGFGFGFGFGFGFGFGFGFGFGFGFGFGFGFGFGFGFGFGFGFGFGFGFGFGFGFGFGFGFGF
GFGFGFGFGFGFGFGFGFGFGFGFGFGFGFGFGFGFGFGFGFGFGFGFGFGFGFGFGFGFGFGFGFGFGFGFGF
GFGFGFGFGFGFGFGFGFGFGFGFGFGFGFGFGFGFGFGFGFGFGFGFGFGFGFGFGFGFGFGFGFGFGFGFGF
GFGFGFGFGFGFGFGFGFGFGFGFGFGFGFGFGFGFGFGFGFGFGFGFGFGFGFGFGFGFGFGFGF
GFGFGFGFGFGFGFGFGFGFGFGFGFGFGFGFGFGFGFGFGFGFGFGFGFGFGFGFGFGFGFGFGFGFGFGFGFGFGFGFGFGFGFGFGFGFGFGFGFGFGFGFGFGFGFGFGFGFGFGFGFGFGFGFGFGFGFGFGFGF
GFGFGFGFGFGFGFGFGFGFGFGFGFGFGFGFGFGFGFGFGFGFGFGFGFGFGFGFGFGFGFGFGFGFGFGFGFGFGFGFGFGFGFGFGFGFGFGFGFGFGFGFGFGFGFGFGFGFGFGFGFGFGFGFGFGFGFGFGFGF
GFGFGFGFGFGFGFGFGFGFGFGFGFGFGFGFGFGFGFGFGFGFGFGFGFGFGFGFGFGFGFGFGFGFGFGFGF
GFGFGFGFGFGFGFGFGFGFGFGFGFGFGFGFGFGFGFGFGFGFGFGFGFGFGFGFGFGFGFGFGFGFGFGFGF
GFGFGFGFGFGFGFGFGFGFGFGFGFGFGFGFGFGFGFGFGFGFGFGFGFGFGFGFGFGFGFGFGFGFGFGFGF
GFGFGFGFGFGFGFGFGFGFGFGFGFGFGFGFGF
GFGFGFGFGFGFGFGFGFGFGFGFGFGFGFGFGFGFGFGFGFGFGFGFGFGFGFGFGFGFGFGFGFGFGFGFGFGFGFGFGFGFGFGFGFGFGFGFGFGFGFGFGFGFGFGFGFGFGFGFGFGFGFGFGFGFGFGFGFGF
GFGFGFGFGFGFGFGFGFGFGFGFGFGFGFGFGFGFGFGFGFGFGFGFGFGFGFGFGFGFGFGFGFGFGFGFGFGFGFGFGFGFGFGFGFGFGFGFGFGFGFGFGFGFGFGFGFGFGFGFGFGFGFGFGFGFGFGFGFGF
GFGFGFGFGFGFGFGFGFGFGFGFGFGFGFGFGFGFGFGFGFGFGFGFGFGFGFGFGFGFGFGFGFGFGFGFGF
GFGFGFGFGFGFGFGFGFGFGFGFGFGFGFGFGFGFGFGFGFGFGFGFGFGFGFGFGFGFGFGFGFGFGFGFGFGFGFGFGFGFGFGFGFGFGFGFGFGFGFGFGFGFGFGFGFGFGFGFGFGFGFGFGFGFGFGFGFGF
GFGFGFGFGFGFGFGFGFGFGFGFGFGFGFGFGFGFGFGFGFGFGFGFGFGFGFGFGFGFGFGFGFGFGFGFGF
GFGFGFGFGFGFGFGFGFGFGFGFGFGFGFGFGFGFGFGFGFGFGFGFGFGFGFGFGFGFGFGFGFGFGFGFGFGFGFGFGFGFGFGFGFGFGFGFGFGFGFGFGFGFGFGFGFGFGFGFGFGFGFGFGFGFGFGFGFGFGFGFGFGFGFGFGFGFGFGFGFGFGFGFGFGFGFGFGFGFGFGFGFGFGFGFGFGFGF
GFGFGFGFGFGFGFGFGFGFGFGFGFGFGFGFGFGFGFGFGFGFGFGFGFGFGFGFGFGFGFGFGFGFGFGFGFGFGFGFGFGFGFGFGFGFGFGFGFGFGFGFGFGFGFGFGFGFGFGFGFGFGFGFGFGFGFGFGFGF
GFGFGFGFGFGFGFGFGFGFGFGFGFGFGFGFGFGFGFGFGFGFGFGFGFGFGFGFGFGFGFGFGFGFGFGFGF
GFGFGFGFGFGFGFGFGFGFGFGFGFGFGFGFGFGFGFGFGFGFGFGFGFGFGFGFGFGFGFGFGFGFGFGFGFGFGFGFGFGFGFGFGFGFGFGFGFGFGFGFGFGFGFGFGFGFGFGFGFGFGFGFGFGFGFGFGFGFGFGFGFGFGFGFGFGFGFGFGFGFGFGFGFGFGFGFGFGFGFGF
GFGFGFGFGFGFGFGFGFGFGFGFGFGFGFGFGFGFGFGFGFGFGFGFGFGFGFGFGFGFGFGFGFGFGFGFGFGFGFGFGFGFGFGFGFGFGFGFGFGFGFGFGFGFGFGFGFGFGFGFGFGFGFGFGFGFGFGFGF
GFGFGFGFGFGFGFGFGFGFGFGFGFGFGFGFGFGFGFGFGFGFGFGFGFGFGFGFGFGFGFGFGFGFGFGFGF
GFGFGFGFGFGFGFGFGFGFGFGFGFGFGFGFGFGFGFGFGFGFGFGFGFGFGFGFGFGFGFGFGFGFGFGFGF
GFGFGFGFGFGFGFGFGFGFGFGFGFGFGFGFGFGFGFGFGFGFGFGFGFGFGFGFGFGFGFGFGFGFGFGFGFGFGFGFGFGFGFGFGFGFGFGFGFGFGFGFGFGFGFGFGFGFGFGFGFGFGFGFGFGFGFGFGF
GFGFGFGFGFGFGFGFGFGFGFGFGFGFGFGFGFGFGFGFGFGFGFGFGFGFGFGFGFGFGFGFGFGFGFGFGFGFGFGFGFGFGFGFGFGFGFGFGFGFGFGFGFGFGFGFGFGFGFGFGFGFGFGFGFGFGFGFGFGF
GFGFGFGFGFGFGFGFGFGFGFGFGFGFGFGFGFGFGFGFGFGFGFGFGFGFGFGFGFGFGFGFGFGFGFGFGFGFGFGFGFGFGFGFGFGFGFGFGFGFGFGFGFGFGFGFGFGFGFGFGFGFGFGFGFGFGFGFGFGF
GFGFGFGFGFGF
MCHENRY
LAKE
COOK
DUPAGE
WILL
KENDALL
KANE
DEKALB
LEE
LASALLE
GRUNDY
Nippersink C re ek Squaw Creek
Tyler Creek
Mill Creek
Black be rry Creek
Fox
Riv
er
Big Rock Creek
Little Rock Creek
Little Indian Creek
Indian Creek
Buck C reek
WISCONSIN
ILLINOIS
Fox River
±
0 5 102.5 Miles
1:600,000
*offset slightly for clarity
Site Project Reference
Rivers and Streams
Lakes
# Adolphson et al., 2002*!( Colman and Sanzolone, 1991") Santucci and Gephard, 2003GF USEPA, 2003g*
Figure 6.1. Fox River watershed major sediment chemistry datasets
125

42.6 42.4 42.2 42.0 41.8 41.6 41.4 41.2
0
500
1000
1500
2000
2500
3000
Elevated (Short, 1997)
Tota
l Pho
spho
rus
(mg/
kg)
Decimal Latitude
USEPA (2003g) Santucci & Gephard (2003)Colman & Sanzolone (1991)Highly elevated (Short, 1997)
Figure 6.2. Fox River total P concentrations against decimal latitude
42.6 42.4 42.2 42.0 41.8 41.6 41.4 41.20
2000
4000
6000
8000
10000
12000
14000
Elevated (Short, 1997)
Tota
l Kje
ldah
l Nitr
ogen
(mg/
kg)
Decimal Latitude
USEPA (2003g) Santucci & Gephard (2003)
Highly elevated (Short, 1997)
Figure 6.3. Fox River TKN concentrations against decimal latitude
126

analysis of sieved stream sediment data for Illinois between 1982 and 1995 from the Legacy STORET system. “Elevated” and “highly elevated” refer to those concentrations of a particular constituent that equal or exceed the 85th and 98th percentiles, respectively, (along the normal distribution curve) of the samples included in the analysis.
The figures reveal that neither total P nor TKN vary in any discernible way from
upstream to downstream (north to south) along the Fox River. Moreover, no total P values exceed the “highly elevated” value of 2800 milligrams per kilogram (mg/kg) total P, while roughly 20 percent of the TKN concentrations exceed the “highly elevated” value of 4680 mg/kg TKN. This indicates that Fox River sediments are moderately enriched in total P and organic nitrogen, which agrees with the conclusions given by Santucci and Gephard (2003).
Figures 6.4 and 6.5, respectively, present statistical (“Box and Whisker”) plots of the
total P and TKN data. Mean and median sediment total P concentrations in the Fox River mainstem are higher than concentrations in its tributaries. This difference is especially apparent in the Colman and Sanzolone (1991) dataset, although in this instance at least part of this difference could result from the fact that the Fox River samples were wet sieved while the tributary samples were dry sieved. For TKN, the USEPA (2003g) median Fox River concentration is somewhat higher than the pooled tributary concentration, but mean concentrations are more alike. However, Fox River mean and median TKN values from Santucci and Gephard (2003) are lower than even the USEPA (2003g) tributary values.
Figures 6.6 and 6.7 compare above dam and below dam total P and TKN concentrations
from the Santucci and Gephard (2003) study. Mean and median concentrations for both total P and TKN were higher in above dam pools. This difference also was noted by Santucci and Gephard for many of the chemical constituents analyzed in their study, and is not too surprising. These pools contain a larger percentage of finer grained sediments that trap more pollutants than do stream reaches immediately downstream.
6.3.2. Total Mercury and Copper
Figure 6.8 presents total mercury (Hg) concentrations for Fox River sediments as a function of decimal latitude. These same data are summarized as “Box and Whisker” plots in Figure 6.9. The horizontal dotted lines on these figures refer to the “Probable Effect Concentration” (PEC) for Hg (lower line, 1.06 mg/kg) from MacDonald et al. (2000), and the “highly elevated” value (1.4 mg/kg) from Short (1997). Figure 6.10 compares total sediment Hg concentrations for above and below dam locations for each dam site in the Santucci and Gephard (2003) study. Figure 6.11 compares total Hg concentrations for Fox River sediments with those of tributary streams.
Total sediment Hg concentrations frequently exceed available sediment quality
guidelines above six dams. However, exceeding these criteria does not directly imply that sensitive sediment-dwelling organisms are being adversely affected. The PEC values from MacDonald et al. (2000) are based on “weight of evidence” observations from carefully controlled (primarily laboratory) studies that assessed the toxicity of contaminants to certain aquatic species.
127

0
500
1000
1500
2000
2500
3000
Elevated (Short, 1997)
25%
50%
75%
Mean
1.5x
(75%
- 25
%)
Minimum
statisticaloutliers
Maximum
Tota
l Pho
spho
rus
(mg/
kg)
USEPA (2003g) mainstem USEPA (2003g) tributaries Santucci & Gephard (2003) Colman & Sanzolone (1991) mainstem Colman & Sanzolone (1991) tributaries
Highly elevated (Short, 1997)
Figure 6.4. Box and whisker plot comparison of mainstem (hatched boxes) and tributary total P
concentrations, with a partial key for the box plots in the inset
0
2000
4000
6000
8000
10000
12000
14000
Elevated (Short, 1997)
25%
50%
75%
Mean
1.5x
(75%
- 25
%)
Minimum
statisticaloutliers
Maximum
Tota
l Kje
ldah
l Nitr
ogen
(mg/
kg)
USEPA (2003g) mainstem USEPA (2003g) tributaries Santucci & Gephard (2003)
Highly elevated (Short, 1997)
Figure 6.5. Box and whisker plot comparison of mainstem (hatched boxes)
and tributary TKN concentrations
128

0
500
1000
1500
2000
25%
50%
75%
Mean
1.5x
(75%
- 25
%)
Minimum
statisticaloutliers
Maximum
Tota
l Pho
spho
rus
(mg/
kg)
Above Dams Below Dams
Figure 6.6. Box and whisker plot comparison of above and below dam total P concentrations
from Santucci and Gephard (2003)
0
1000
2000
3000
4000
5000 Above Dams Below Dams
25%
50%
75%
Mean
1.5x
(75%
- 25
%)
Minimum
statisticaloutliers
Maximum
Tota
l Kje
ldah
l Nitr
ogen
(mg/
kg)
Figure 6.7. Box and whisker plot comparison of above and below dam TKN concentrations
from Santucci and Gephard (2003)
129
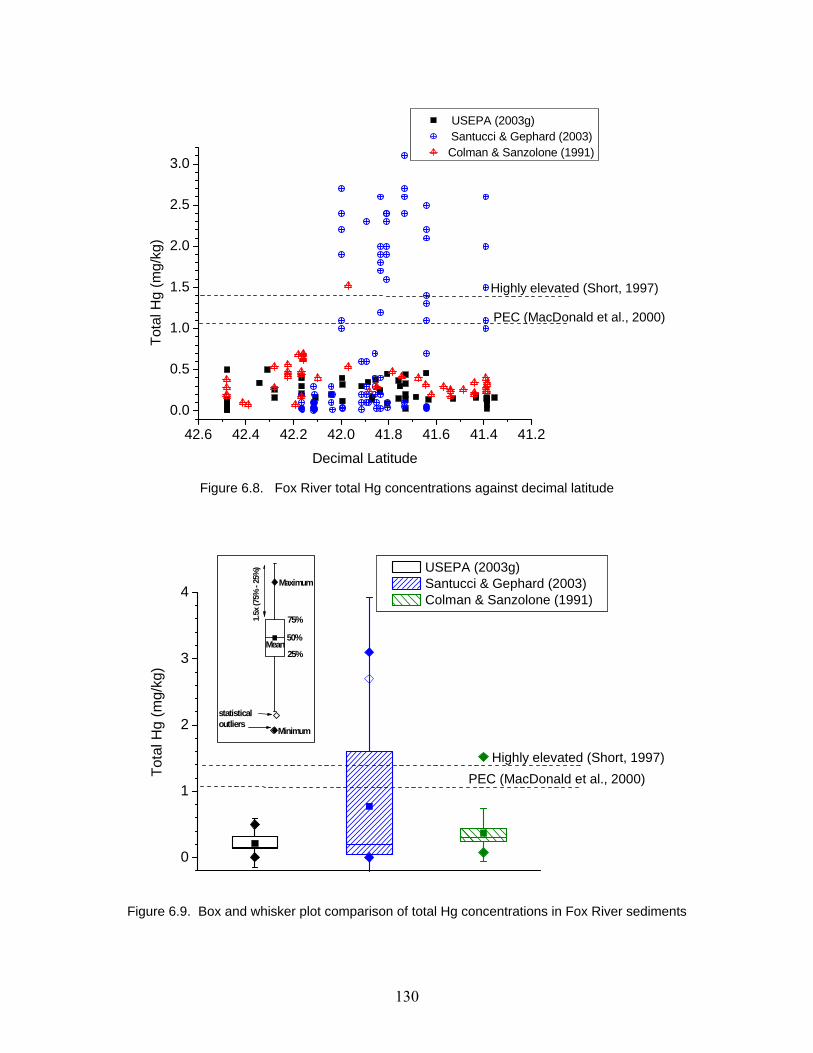
42.6 42.4 42.2 42.0 41.8 41.6 41.4 41.2
0.0
0.5
1.0
1.5
2.0
2.5
3.0
USEPA (2003g) Santucci & Gephard (2003)Colman & Sanzolone (1991)
Tota
l Hg
(mg/
kg)
Decimal Latitude
Highly elevated (Short, 1997)
PEC (MacDonald et al., 2000)
Figure 6.8. Fox River total Hg concentrations against decimal latitude
0
1
2
3
4
25%
50%
75%
Mean
1.5x
(75%
- 25
%)
Minimum
statisticaloutliers
Maximum
Tota
l Hg
(mg/
kg)
USEPA (2003g) Santucci & Gephard (2003) Colman & Sanzolone (1991)
Highly elevated (Short, 1997)PEC (MacDonald et al., 2000)
Figure 6.9. Box and whisker plot comparison of total Hg concentrations in Fox River sediments
130

Algonquin
Carpentersville
Kimball St.S. Elgin
St. Charles
Geneva
N. Batavia
S. Batavia
N. Aurora
MontgomeryYorkville
Dayton
0.0
0.5
1.0
1.5
2.0
2.5
3.0
Tota
l Hg
(mg/
kg)
Above dams Below dams
Highly elevated (Short, 1997)
PEC (MacDonald et al., 2000)
Figure 6.10. Comparison of above dam and below dam total Hg concentrations
for the Fox River from Santucci and Gephard (2003)
0.0
0.5
1.0
25%
50%
75%
Mean
1.5x
(75%
- 25
%)
Minimum
statisticaloutliers
Maximum
Tota
l Hg
(mg/
kg)
USEPA (2003g) mainstem Colman & Sanzolone (1991) mainstem USEPA (2003g) tributaries Adolphson et al. (2002) Colman & Sanzolone (1991) tributaries
Figure 6.11. Box and whisker plot comparison of mainstem and tributary total Hg concentrations
131

Many other experts advocate that it is the specific form or bioavailability of a chemical contaminant that determines toxicity, rather than its total concentration. This is certainly the case for Hg where methyl mercury (MeHg) is known to be a particularly toxic and bioaccumulative form of Hg. The MeHg concentrations have apparently not been measured in Fox River sediments. A recent USGS study (Krabbenhoft et al., 1999) gives one value for Nippersink Creek sediments (0.08 nanograms per gram or ng/g), which is about 1 percent of the total Hg concentration (8.7 ng/g) measured at the same site. Of the contaminants measured for which sediment quality guidelines have been advanced, the total Hg concentrations found by Santucci and Gephard (2003) most often exceed these guidelines. This certainly merits further investigation. Given that no USEPA (2003g) and only one Colman and Sanzolone (1991) Fox River total Hg value exceeds 1 mg/kg, a logical first step would be to verify the Santucci and Gephard results by a check of the field and laboratory procedures.
Mean and median total Hg concentrations were considerably lower in sediments collected
in Fox River tributaries (open boxes in Figure 6.11) than those in the Fox River itself (cross-hatched boxes). It is also worth noting that these tributary values are similar to the Nippersink Creek value (0.087 mg/kg) found by Krabbenhoft et al. (1999) with the benefit of state-of-the-art “ultra-clean” sampling and analysis techniques for Hg. These techniques, as fully described in Olsen and DeWild (1999), minimize potential contamination sources during the collection and analysis of environmental samples for Hg. Water column total Hg and MeHg concentrations at this Nippersink Creek location derived using these “ultra-clean” techniques were 1.42 ng/L, and 0.04 ng/L, respectively.
Sediment concentrations for total copper (Cu) are compared in Figure 6.12. In this
instance only a very few Fox River samples exceed the MacDonald et al. (2000) PEC value for Cu (149 mg/kg), or the “highly elevated” Cu value (170 mg/kg) from Short (1997). Comparison of data from the same general sources (USEPA, 2003g; Colman and Sanzolone, 1991) shows that mean and median Cu concentrations are considerably lower in Fox River tributary sediments than in the mainstem. However, mainstem mean and median Cu concentrations from the Santucci and Gephard (2003) study are more comparable to the tributary concentrations. The concentrations of other potential metal contaminants in the database (e.g., zinc and cadmium) follow similar patterns. That is, sediment concentrations are higher in the Fox River than in its tributaries, with relatively few samples exceeding available sediment quality guidelines.
6.3.3. Organic Pollutants
Only USEPA (2003g) and the Santucci and Gephard (2003) study contain data for possible organic contaminants, and only USEPA (2003g) contains data for tributary sediments. An examination of the available USEPA data indicates that the vast majority of measured concentrations are near or below method detection limits. The Santucci and Gephard (2003) study analyzed for a much more extensive suite of potential organic contaminants in sediments. Some pesticide and polyaromatic hydrocarbon (PAH) compounds, particularly from above dam pools, exceeded the PEC values of MacDonald et al. (2000), but not as frequently as for Hg. The Santucci and Gephard dataset also includes sediment concentrations for several alkylphenol compounds, which are potential endocrine disruptors. Very little is known about the fate,
132

0
25
50
75
100
125
150
175
200
25%
50%
75%
Mean
1.5x (
75%
- 25%
)
Minimum
statisticaloutliers
Maximum
Tota
l Cu
(mg/
kg)
USEPA (2003g) mainstem USEPA (2003g) tributaries Colman & Sanzolone (1991) mainstem Colman & Sanzolone (1991) tributaries Santucci & Gephard (2003) Adolphson et al. (2002)
Highly elevated (Short, 1997)
PEC (MacDonald et al., 2000)
Figure 6.12. Box and whisker plot comparison of mainstem and tributary total Cu concentrations
transport, or toxicity of these and similar compounds in natural water bodies, although reconnaissance studies are beginning to appear (Kolpin et al., 2002).
6.4. Limitations and Data Gaps
Geographic coverage is quite extensive between these major datasets, especially along the Fox River itself (Figure 6.1). Temporal coverage, however, is very inadequate as only one major dataset (USEPA 2003g) contains data for stations sampled at more than one time. Moreover, even this data set is limited to one or two sampling dates for most stations. Cored, sectioned, and dated sediments could be used to help determine historical temporal trends in sediment and water quality, but such data appear to be lacking within the Fox River watershed. The Santucci and Gephard (2003) dataset is the only one that includes sediment core data, but the cores were homogenized and treated as a single sample. In any case, the lack of adequate temporal coverage diminishes the significance of the geographical coverage.
Other limitations of the sediment chemistry dataset concern the type of data currently
available. As mentioned above, the current dataset contains no sectioned core data, and most data refer to surficial sediments. In addition, two of the four major datasets (Colman and Sanzolone, 1991; Adolphson et al., 2002) contain no data on possible organic contaminant concentrations. Because these datasets were exclusively (Adolphson et al., 2002) or predominately (Colman and Sanzolone, 1991) concerned with tributaries, available data for possible organic contaminants in tributary sediments are much less extensive than for Fox River sediments.
133

Another limitation is that available sediment chemistry data are of very limited utility for water quality modeling purposes. The SOD, which is driven primarily by the microbial respiration of organic matter at or near the sediment-water interface, contributes to DO depletion observed during the summer months in impounded reaches of the river. Butts and Evans (1978) measured SOD rates in the Fox River between 1.0 and 4.8 grams per square meter per day (g/m2/day). These measurements should be updated and supplemented by complementary measurements for water quality modeling purposes. Complementary measurements could include pore water concentrations of important nutrient species to help assess the impact of bed sediments on nutrient budgets. In addition, potentially toxic species such as ammonia and hydrogen sulfide typically exist in much higher concentrations in anoxic sediment pore waters than in oxic overlying waters, and this can adversely affect sensitive sediment-dwelling organisms. No sediment pore water data were located for the Fox River or its tributaries for inclusion in the FoxDB.
6.5. Summary
The geographic coverage of the sediment chemistry data within the FoxDB is good, especially along the mainstem. Temporal coverage, however, is poor. Only the data collected by the IEPA and maintained by the USEPA in their STORET system contains data for sediments collected more than once at the same location. Even in this instance, temporal coverage is not complete enough to even attempt to discern temporal trends in sediment quality. With the available data, however, several general conclusions can be drawn. First, tributary sediment quality is generally better than that along the mainstem. This trend is more distinct for potential metal contaminants (e.g., Hg and Cu), and less distinct for total nutrient concentrations (total P and TKN). A similar trend probably holds for many potential organic contaminants, although only the USEPA (2003g) dataset contains organic contaminant data for tributaries. Fortunately, most analyses indicate concentrations near or below method detection limits.
Along the mainstem, the Santucci and Gephard (2003) data reveal higher concentrations
of total nutrient, metal and organic contaminant concentrations in above dam pools than in stream reaches immediately downstream. Fortunately, even in above dam pools, most constituents are present at concentrations below available sediment quality guidelines in most samples. Total Hg concentrations appear to be an exception to this trend, with elevated Hg concentrations predominating in six above dam pools.
The available dataset is generally inadequate to aid water quality modeling efforts. For
example, sediment-water exchange of nutrients could be significant under low-flow conditions in above dam pools and upstream in the Fox Chain of Lakes. Nutrient data for sediment pore waters would help to assess the significance of this component, but none are available. Other gaps in the available sediment chemistry dataset include:
● The lack of sufficient data to assess any temporal trends. ● No data from sectioned and preferably dated sediment cores. ● Relatively poor coverage of organic contaminant data for tributary sediments.
134

Chapter 7. Modeling Issues The purpose of developing a hydrologic and water quality model of the Fox River
watershed is to create a tool to assist with watershed decision-making for attaining water quality standards and developing sustainable management measures. The model can provide insight to sources and impacts of nonpoint and point sources of pollution, simulate water quality conditions of alternative scenarios for future land-use practices and effluent loading to the system, and help in designing and assessing alternate management practices to reduce such impacts. A variety of water quality computer models can be customized to represent a given watershed. Many factors need to be considered in selection of the most appropriate model for the given circumstances and desired output information. This chapter includes background information on types of water quality models to provide the reader with a general understanding of water quality models, a brief discussion of previous and ongoing model studies in the watershed, a discussion of issues related to model selection, and model recommendations for the Fox River watershed. In particular, several commonly used watershed loading models and receiving water models were reviewed: Geographic Information System (GIS) Pollutant Load Application (PLOAD), Soil and Water Assessment Tool (SWAT), Hydraulic Simulation Program-Fortran (HSPF) and Enhanced Stream Water Quality Model (QUAL2E), Water Quality Analysis Simulation Program (WASP), One-dimensional Water Quality Model for Streams (CE-QUAL-RIV-1), and Dynamic Toxics Wasteland Allocation Model (DYNTOX). Appendix 7 presents detailed descriptions of these models. 7.1. Water Quality Modeling Background
Models are computer code expressing mathematical relationships that simulate physical and chemical processes occurring under the environmental settings in a watershed. Natural systems are extremely complex and can vary dramatically from one region to another. Data are needed to calibrate the mathematical expressions in the models. Often, it is the availability of data to calibrate the processes that limits or dictates the level of detail and the complexity of the processes modeled. In general, complex models that simulate more processes require more data for calibration. Computer models that simulate pollution processes related to surface water quality are normally categorized into two groups: watershed loading models and receiving water models.
Watershed loading models simulate the generation and movement of pollutants from the
point of origin (source) on land surfaces to point of discharge into receiving waters. Watershed models can operate on a watershed as a whole, integrating all loads within a watershed, and allow for the subdivision of the watershed into contributing sub-basins. Loading models may include simple loading rate assessments by using regionally estimated water quality constituent coefficients for certain land-use types and estimated annual precipitation. They may also adopt complex simulation techniques that explicitly describe the processes of rainfall, runoff, sediment detachment, and transport to receiving waters (USEPA, 1997).
Transport of constituents from the land surface to the stream system is driven by
precipitation events, and controlled by the watershed area, land cover (in terms of impedance to transport), sediment transport mechanisms, and slope, while the availability or loading of a
135

constituent is a function of the parent material and land use. Precipitation and streamflow data together with area, land cover, and slope are used to calibrate the processes simulating the runoff response from the watershed for a given rainfall event. Calibration of the model for a particular area requires simultaneous measurement of precipitation and streamflow. Next, transport and delivery of various constituents are calibrated using information on land use and observed water quality data. Often, this information is not available, and processes (defined by coefficients and rate parameters) from previous studies are used initially, until field measurements are performed, wherever possible. Once these processes are established, nonpoint source loading to the stream system can be modeled for selected scenarios. Sophisticated watershed loading models also have mechanisms to simulate movement of selected constituents through the stream network. However, the in-stream flow routing may be very simplistic compared to other sophisticated hydraulic models such as UNET (one-dimensional unsteady flow through a full network of open channels) and FEQ (full equation unsteady flow) models. Watershed loading models simulate flow and concentration of selected constituents for the modeled time period at the chosen outlet point.
After constituents enter a stream network, either from point or nonpoint sources, they are
subject to various transport mechanisms in the stream system. Receiving water quality models simulate in-stream hydraulics and water quality processes. Those models typically include subroutines that simulate hydraulic routing, as well as chemical and biological processes. Receiving water models can be divided into two groups in terms of hydraulics: steady-state models and dynamic models. Steady-state models only allow simulations of constant flows and associated physical, chemical, and biological transformation of water quality constituents. Dynamic models simulate time-varying and unsteady flows.
Receiving water models require information on a channel’s physical characteristics that
influence the mixing of constituents and travel time along the stream. A river is divided into “reaches” within the model based on the channel characteristics. Reaches represent physical segments along the river. The reactions of modeled water quality constituents as they are transported along the river from reach to reach are simulated. Some substances that enter the stream network are conservative, and do not react or interact with other matter. Most constituents of interest in water quality of streams do interact. For example, nutrients such as nitrogen and phosphorus interact with algae and have an impact on dissolved oxygen (DO) levels. The chemical and physical interactions of constituents within the stream system are time dependent and have complex feedback loops. Some reactions such as the nutrient-algae interaction are dominant during low-flow events and can be modeled under the assumption of relatively steady flow conditions. During high flows, algae populations are flushed, but the delivery of constituents from the land surface peaks, and these events require dynamic, time-varying flow models. Along a stream network, timing of inflows may be a significant consideration. Steady flow models are based on the assumption that flow rate does not change during the modeled time period. In a more complex model, varying flow conditions are introduced, which is more appropriate for modeling water quality conditions associated with precipitation events. However, as the complexity of the physical and chemical processes being simulated increases, so too does the need for field monitoring for model calibration. Receiving stream models provide information on the concentration of modeled constituents within each reach for the time period modeled.
136

It is common practice to use model coefficients and rate parameters determined from other studies. Given that watersheds or streams are sufficiently similar, these standard values from the literature may adequately represent the watershed under study. The transferability of this information is more likely within a given watershed. Comparing model results with field observations during model calibration provides a basis for adjusting these “book values” of coefficients and parameters to represent local conditions.
Data required for watershed loading models falls into three general categories. First, data
types that describe the physical setting of the watershed include watershed size, division of the watershed into homogenous sub-areas (hydrologic response units or HRUs) on the basis of imperviousness, slope, fraction of impervious areas directly connected to a channel, maximum surface storage, soil characteristics, crop and vegetative cover, curb density or street gutter length, and sewer system or natural drainage characteristics. Second, data related to defining processes include reaction rate coefficients, adsorption/desorption coefficients, growth stage of crops, daily accumulation rates of litter, traffic density and speed, potency factors for pollutants (pollutant strength on sediment), and solar radiation for some models. Finally, data are needed to define driving or forcing functions of input variables. These are ambient temperature, precipitation, atmospheric fallout, evaporation rates, etc. (USEPA, 1997).
Data for receiving water quality models can be slightly different depending on types of
models. In general, dynamic water quality models that simulate time-varying flows and constituents in the stream system require more data than steady-state water quality models. River geometry; stream network; physical, chemical, and biological properties for each reach; flow; climate; inflows; and withdrawals are among the data commonly required by receiving water quality models (USEPA, 1997). 7.2. Previous Water Quality Modeling Studies for the Fox River Watershed
An analysis of pollutant loads and water quality conditions in the Fox River watershed except the southwestern portion of Kane County was conducted by Northeastern Illinois Planning Commission (NIPC, 1978). The water quality of the Fox River watershed was assessed by using a water quality model (Hydrocomp) and evaluating the effects of NIPC’s water quality management plans. The modeling results for a 13-month period from April 1976−April 1977 indicated generally good water quality in the Fox River watershed, except violations of the in-stream ammonia, phosphorous, and DO concentration levels (NIPC, 1978). With a focus on these sources of pollution, various land-use management practices and point source pollution management plans were simulated. Modeling results at Algonquin showed that the implementation of water quality management plans slightly improved the DO, and biochemical oxygen demand (BOD) concentration levels in the river, given the projected land-use scenario in 1983 (NIPC, 1978). The sources and major pollutants are listed in Table 7.1.
The Illinois State Water Survey (ISWS) has completed the initial phase of a study to
develop a continuous hydrologic simulation model for the entire Illinois River basin (Singh et al., 2003). In this study, the Better Assessment Science Integrating Point and Nonpoint Sources, version 3.0 (BASINS-3.0) modeling system developed by the USEPA and its embedded model
137
Table 7.1. Sources and Predicted Amounts of Pollutants in Percentages at Algonquin in 1983 (NIPC, 1978)
Pollutants (%)
Source BOD Ammonia Combined sewer overflows 2 2 Wastewater treatment plants 8 59 Stormwater runoff 18 28 Pollution from Wisconsin 72 12
HSPF, were used to simulate streamflow in the river basin. Streamflow for the nine major tributary watersheds of the basin (Fox, Des Plaines, Kankakee, Spoon, Vermilion, Mackinaw, Sangamon, La Moine, and Macoupin) was simulated using separate HSPF models for each watershed. Simulated streamflow outputs from these tributary watersheds then were added to the mainstem of the Illinois River, and a separate model also was developed for its watershed. The model constructed for the entire Illinois River basin provides a strong framework for additional model development and refinement. The model will be used to conduct analyses in support of the restoration needs assessment for the Illinois River ecosystem restoration project.
The Kane County Department of Environmental Management and USGS developed hydrologic and hydraulic models to improve and update floodplain delineation in Blackberry Creek watershed (Soong and Straub, 2003; Soong, 2001). They also intended to use these models for the analyses of future watershed conditions according to the 2020 Land Resource Management Plan, including detention requirements, flood mitigation, and wetland protection alternatives developed by the county. For the floodplain delineation, HSPF was used to generate continuous streamflow record at Blackberry Creek, and the U.S. Army Corps of Engineer’s model HEC-RAS was used for flood profile analysis. In addition, a two-dimensional finite-element surface-water modeling system (FESWMS) model was adopted to analyze the occurrence and conditions of flood diversion at Jericho Lake in the watershed (Soong and Straub, 2003).
Using the HSPF model, Duncker et al. (1995) studied the rainfall-runoff relations for five
watersheds (6.3–59.6 square miles) and three single-land-use watersheds (38.2–305 acres) in Lake County, Illinois. Rainfall data collected for 1990–1993 were used for model calibration and verification. They noted significant differences between the best model parameters for the single-land-use watersheds and those for larger watersheds. Model parameters were refined through regional calibration and verified for other watersheds not included in the calibration. The models satisfactorily simulated the long-term, annual, and monthly water balances.
Researchers in the Department of Landscape Architecture at the University of Illinois at
Urbana-Champaign are conducting a study using the HSPF model to examine the effect of land-use changes and best management practices for the mitigation of nonpoint source pollutions in the Blackberry Creek watershed. That study simulates hydrology and sediment and water quality constituents (dissolved nitrite plus nitrate and orthophosphate). That study delineates 25 sub-watersheds within the Blackberry Creek watershed based on 30-meter resolution digital elevation
138

model (DEM) and reach files (RF-3) using 1970–1995 meteorological data collected at Chicago Midway Airport and Rockford Airport, both in Illinois. Surface water–daily streamflow data from 1960 to 2001 at Blackberry Creek near Yorkville (USGS gaging station # 05551700) were used for the water budget calibration. Water quality data collected from the monitoring station at Yorkville (IEPA station DTD02) were used for calibration of sediment and nutrients. Sustainable land-use plans and landscape design patterns will be developed based on the modeling results (S. Kang, personal communication, August 11, 2003). 7.3. Considerations in Model Selection
Appropriate model selection depends on the types of water quality problems, potential sources and timing of their occurrence, desired spatial and temporal scales of model results, data availability, model complexity, uncertainty, and available resources. These issues are discussed in the following sections.
7.3.1. Constituents and Sources
Table 5.22 shows the critical times and conditions for various water quality constituents of concern from analysis of the Fox River water quality data. Critical times and conditions identified for the constituents range from hourly to seasonal time scales. In addition, rain events carry large loads and result in higher concentrations of nitrate/nitrite in receiving rivers and streams. Those critical times/conditions correspond to the environmental conditions when natural (pollution) processes pose the most stress for water quality and health of ecosystems. They can be related to environmental factors (e.g., temperature and light availability), hydraulics (low vs. high flow and dams), and overland pollution processes (e.g., runoff). They represent challenges for selecting appropriate computer models to assist with watershed management and planning. Models selected for addressing water quality issues within the Fox River watershed should simulate pollution processes properly and resulting water quality at proper time scales and flow conditions. Water quality constituents simulated should include DO, nitrogen, phosphorus, fecal coliform, algae, and suspended sediment. 7.3.2. Spatial and Temporal Features
The spatial resolution of watershed loading models is typically more a product of data availability than model capability. Watershed loading models simulate runoff characteristics at outlet points from defined sub-watersheds. Within a given watershed, the more sub-watersheds selected, the greater number of locations or points for calculation of runoff characteristics. However, the accuracy (or uncertainty) of the results can only be validated by available monitoring data. The spatial resolution of system variables, such as topography, land cover, and availability of climatic data also must be taken into consideration.
In general, the size of watersheds differ according to gaging stations, channel
characteristics, or area of interest. Flow records at gaging stations allow model calibration and
139

validation. Therefore, flow outlet points of watersheds should be determined based on the locations and number of gaging stations. Channel characteristics, such as cross section, slope, and length, affect the behavior of water, sediment, and water quality constituents. The watershed should correspond to the appropriate channel size and area of particular interest. The size of specific areas with critical water quality issues that require detailed modeling may be an important factor for determining spatial resolution of the modeling work.
Temporal scales of modeling studies can be on the order of years, days, or hours. Some
models simulate only responses of a watershed to storm events, while others are designed for continuous simulation to assess long-term responses. The availability of climatic data, such as temperature and rainfall, will affect the time step used in a watershed loading model. In areas where only daily rainfall data are available, modeling hourly runoff requires assumptions about the rainfall distribution that introduce uncertainty into the model results. Of the models reviewed in this report, the HSPF model can be used to simulate both storm events and continuous simulation, and the SWAT model is for continuous simulations only. Within a large watershed, it is possible to use different time steps and temporal scales to model various tributaries. Tributaries with highly urbanized land use and more detailed precipitation data may be modeled for a shorter time scale to assess storm contributions, while better results for predominantly agricultural tributary watersheds may use a daily time step. The results of these models (loadings from the tributaries) are inputs to the mainstem of the river, and results can be aggregated (summed over a day) or disaggregated (daily loads proportioned over 24 hours) for simulations of water quality in the mainstem.
Receiving stream models for rivers such as the Fox River require information on the
spatial features such as width, depth, length, and channel geometry for different segments of the river. It is often reasonable to assume that there is little variation of concentration across the width and depth of the stream compared to variation of concentration in the longitudinal direction. For this reason, one-dimensional models (QUAL2E, DYNTOX, CE-QUAL-RIV-1, and HSPF) are appropriate to simulate most riverine water quality issues (USEPA, 1997).
The variability of flow in a river, as well as time variations in inflow (discharges) and
outflow (withdrawals) must be considered when determining the temporal scale of a receiving stream model. In addition, chemical and physical interactions of constituents within the riverine system are time dependent and may have complex feedback loops. For example, nitrogen may be in the form of ammonia nitrogen, nitrite, nitrate, and organics. Depending on factors such as DO and pH, nitrogen transforms at different rates as it travels in different reaches of the river. Furthermore, hydraulic features such as dams may dramatically affect various in-stream processes, and kinetics of the processes must be taken into consideration for model selection. For example, as water passes over a dam, aeration occurs when DO is below saturation concentration, but deaeration occurs when DO is above saturation concentration, with a deleterious net effect. The DO concentration in the water is affected by water level differences, air and water temperatures, dam height, dam shape, and water quality. The instantaneous change of DO at a dam site may have a more lasting effect on water quality than any other single physical factor (Butts and Evans, 1978b). In a study of dams in the northeastern Illinois conducted for NIPC by ISWS staff (Butts and Evans, 1978b), individual dam calibration factors were developed for those dams in selected watersheds, including the Fox River. The findings of
140

the study were incorporated in the QUAL2E model code. The HSPF model does not include sub-routines for physically based simulation of dams. The QUAL2E model, operated in a quasi-dynamic mode, simulates temporal variations in water quality conditions under steady flow conditions in which the flow does not change, and discharges and withdrawals are constant for a given simulation. This is a reasonable approximation for low-flow conditions. Various steady flow and discharge/withdrawal conditions can be explored with different input datasets. A set of similar models could be calibrated to represent low-flow conditions in different seasons. Simulation of time-varying flow, such as storm conditions, can be accomplished using models such as the HSPF.
7.3.3. Model Complexity
In general, models with greater complexity do not automatically generate more accurate predictions. Because complex models often require a large number of unobservable parameters for which values must be assigned, they may make it easier to obtain a spurious match between model predictions and observations. Adding more complexity to the analysis implies that more time, funding, expertise, and data will be required. Thus, it is generally a good idea not to have any more temporal and spatial details than is necessary to address the problem at hand. However, if foreseeable model applications cover a wide range of complexity, it is advantageous to adopt a more complex model to address various scientific and engineering applications than to continuously switch models from one phase of a project to another or from one project to another (Nix, 1990). Table 7.2 shows the range of model complexity of the models reviewed herein. 7.3.4. Types of Model Uncertainty
Model applications for decision-making have been hampered by uncertainties associated with model predictions. Increasingly, resource managers are requiring analysis of uncertainties associated with modeling results so they can consider the implications of the uncertainty in their decision-making.
Beck (1987) stated that four problem areas are associated with uncertainty in water
quality mathematical models. They are: 1) uncertainty about the relationships among the variables characterizing the dynamic behavior of systems, which is uncertainty about model
Table 7.2. Range of Model Complexity (USEPA, 1997)
Model Range of complexity PLOAD Low SWAT Medium HSPF High CE-QUAL-RIV-1 High QUAL2E Medium WASP 6 Medium DYNTOX Low
141

structure, 2) uncertainty about the value of the parameters appearing in the identified structure of the model for the system’s behavior, 3) uncertainty associated with predictions of the future behavior of the system, and 4) the design of experiments, or monitoring programs, for the specific purpose of reducing the critical uncertainties associated with a model. The sources of uncertainty most usually accounted for are uncertainty in the initial state of the system, uncertainty in the model parameter estimates, uncertainty in the observed input disturbances and output responses, and uncertainty arising from unobserved input disturbances of the system (Beck, 1987, p. 1396).
Various sensitivity analysis methods have been used to identify model parameters that
significantly affect model prediction uncertainty and the water quality constituents for which model-prediction uncertainty is unacceptable (Melching and Yoon, 1996). Uncertainty analysis helps to determine the robustness of a mathematical model or analysis that tests a plausible range of estimates of key independent variables to determine if such variations make meaningful changes to the results of the analysis (Morgan and Henrion, 1990). Among many models, only the QUAL2E has uncertainty analysis sub-routines incorporated. Melching and Yoon (1996), Masliev and Somlyody (1994), Morgan and Henrion, (1990) performed uncertainty analysis for other models has been performed using sensitivity analysis (SA), first-order reliability analysis (FORA), Monte Carlo simulation (MCS), and Latin hypercube sampling (LHS).
7.3.5. Data Needs and Model Experience
The capability of any model to accurately address water conditions is directly related to the accuracy of input data and the level of expertise required to manage the model. For complex models, a large portion of the error in model prediction can result from the lack of sufficient data. To have reasonable predictions, large quantities of data are required, such as channel geometry, slopes, land-use perviousness factors, reaction rate coefficients, soil properties (including texture, permeability, and erodibility), and monitoring data for discharge, river stage, reaeration, water quality, precipitation, temperature, evapotranspiration, etc. Much of the needed data are not readily available from standard monitoring practices. For this project, all available data and analyses for the Fox River have been compiled in phase I. Additional input data will be needed to develop a detailed hydrologic and water quality simulation model for the Fox River watershed.
Selection of a model or a combination of models is an important decision, not only
because of the time and resources a modeling effort involves, but also due to the technical expertise needed to develop and maintain the model. Preferably only those models should be selected that have been widely used and tested under varying physiographic conditions, which are periodically updated by their developers to keep up with the changing technology, and for which vast user support is available through well-developed user’s manuals and Internet-based discussion groups. Generally, federally supported models are expected to have continued technical and developmental support. The ISWS has experience with the BASINS-HSPF, SWAT, and QUAL2E models that have continued technical, developmental support from USEPA. The use of such models will save time and costs, and provide appropriate problem-solving capacity. These models are part of the public domain and are available at no cost to any user.
142
7.4. Model Recommendations for the Fox River Watershed
Given the size of the Fox River watershed and the diversity of land use in the watershed, no one model will serve as an adequate tool to generate information about all watershed processes. Furthermore, while considerable data have been collected for the watershed, considerable additional data are needed to calibrate water quality models of sufficient spatial and temporal resolution to represent all areas of interest in the watershed. It is recommended to establish a flexible, modular framework that can be refined as data become available for the study area. The model framework should be designed to reflect the level of detail desired in the future, not constrained by currently available data. The watershed may be represented by an integrated suite of models, including both watershed load and receiving water models. It is recommended that watershed load models initially be developed for major tributaries to the Fox River in the study area. The Fox River should be represented by a receiving water model to simulate the movement and transformation of pollutants within the river. Tributary watershed models may be updated and refined as data become available. At some future date, it may be desirable to develop receiving water models for the tributaries. The complexity and detail of each tributary model can vary, yet still provide “input” to the Fox River receiving stream model. Additional watershed loading from areas draining directly to the Fox River also must be simulated.
The USEPA’s BASINS modeling system (USEPA, 2003a, 2003b, and 2001a) integrates
a GIS, national watershed and meteorological data, and state-of-the-art environmental assessment and modeling tools into one package. The modeling system includes a suite of models that can be used to perform an integrated analysis of point and nonpoint sources. Specifically, BASINS includes assessment tools (TARGET, ASSESS, and DATA MINING) for evaluating water quality and point source loadings at large or small scales; utilities including local data import and management of local water quality observation data; two watershed delineation tools; utilities for classifying DEMs, land use, soils, and water quality data; an in-stream (receiving) water quality model (QUAL2E); a simplified GIS-based nonpoint source annual loading model (PLOAD); two watershed loading and transport models (HSPF and SWAT); a postprocessor (GenScn) of model data and scenario generator to visualize, analyze, and compare results from HSPF and SWAT; and mapping, graphing, and reporting formats for documentation. The BASINS modeling framework provides the state-of-art integration of GIS tools with water quality modeling. Nationally derived environmental and GIS databases have been prepared for use with BASINS for nationwide assessments, but these do not have high-resolution data. It is necessary to prepare datasets with updated, higher resolution information on streamflow, precipitation networks, land use, soils, stream geometry, etc. Datasets for the Fox River watershed are identified on Fox River Watershed Investigation Web site (http://ilrdss.sws.uiuc.edu/fox).
Various model options offered within the BASINS framework illustrate the point that
different modeling approaches are needed to meet objectives of various modeling applications. Modeling routines offered in nonpoint source watershed loading models may allow for detailed specifications related to agricultural practices such as planting and harvesting or emphasize the hydrologic processes and the urban landscape. Both the HSPF and the SWAT models have some mechanism for stream routing, but the hydraulics are not well developed. A unique river such as
143
the Fox requires more detailed hydraulics, as offered in the QUAL2E receiving water model, to simulate features such as the many dams.
7.4.1. Watershed Loading Modeling
Given the mixed land uses within the study area (from Stratton Dam to the confluence of the Fox River with the Illinois River) and anticipated growth of population and urbanization, the HSPF model within the BASINS modeling framework is recommended for the watershed loading modeling of pollutant loads. The HSPF model allows modeling of pollution processes that occur in both pervious and impervious lands, with a variety of options for modeling urbanized landscapes. The fairly complex model can accommodate the level of spatial and temporal detail to address issues in the Fox River watershed. The model can simulate the constituents of interest and has the flexibility to use hourly or daily time steps. It can be used to model storm events or long-term continuous simulations. The HSPF model has been used extensively by researchers and has a solid history of successful applications. The major tributary watersheds are shown in Figure 2.2. Thirteen tributaries listed are within the study area below Stratton Dam. Individual watershed loading models should be customized for each of these watersheds as well as selected additional watersheds of smaller tributaries that drain directly to the Fox River. It is expected that the number of modeled tributary watersheds will be between 13 and 25. The 12-digit Hydrologic Unit code (HUC12) boundaries shown in Figure 2.2 provide insight to the number of sub-watersheds that eventually may be delineated for detailed assessments of areas of special interest.
In addition to developing the HSPF models, insight could be gained by also calibrating a
SWAT model for two selected tributaries for a comparative study of results generated by the HSPF and SWAT models. The SWAT model was designed for modeling of agriculturally dominated watersheds with crop management practice options and plant growth capability. The comparison will allow identification of strengths/weaknesses and sensitive parameters in both models. The results will be taken into account when formulating management measures and implementation plans in later phases of study. The modeling comparison will provide information to determine if the SWAT model should be used for watersheds not expected to experience significant urban growth.
The HSPF model is continuously improved by the USEPA. A newer version, WinHSPF
(a Windows interface of the HSPF) was released recently. The BASINS-3.0 model contains version 12.0 of the HSPF. Detailed users’ manuals for the model, its Windows interface, postprocessor (GenScn), and optimization program (HSPEXP) are freely available. The USEPA provides interactive users support via the Internet through a Listserve, and through several training programs conducted on a regular basis. The U.S. Department of Agriculture Agricultural Research Service (USDA-ARS) is continually improving the SWAT model. Detailed users’ manuals for the model and its theoretical documentation are available. The SWAT modeling group provides interactive user support via the Internet through a Listserve, and through several training programs conducted on a regular basis.
144

7.4.2. Receiving Water Quality Modeling
Information generated by watershed loading models provides inputs to receiving water models for simulation of in-stream processes and water quality. It is recommended that a receiving water quality model be developed for the Fox River mainstem. The river should be divided into segments to account for heterogeneity in hydraulic characteristics such as flow, river depth, and slope. Reaches should be established with consideration of changes in channel hydraulics (e.g., velocity, time of travel, and dams); outlets from tributaries that are expected to have a significant impact on water quality (determined from the watershed model); effluent outfalls; and locations suitable for calibration, given available data and segments of the river that are of particular interest. Channel geometry may be determined from several sources, including cross-section surveys from flood insurance studies conducted for the Federal Emergency Management Agency, the FEQ unsteady–flow model of the Fox River (Knapp and Ortel, 1992), gaging station cross sections, and other sources. Point discharges regulated under National Pollution Discharge Elimination System (NPDES) permits with average annual flow of 0.1 million gallons per day or greater should be included to study the impacts of those point sources (approximately 70 sites).
The steady-state model QUAL2E is recommended for simulation of water quality under
low-flow conditions in which flow does not change, and discharges and withdrawals are constant. The assumption of steady-state streamflow is appropriate for relatively stable, low flows. Low flows for modeling can be selected to correspond to statistical probabilities of occurrence, such as the 90 percent annual chance of exceedence flow (the flow exceeded 90 percent of the time) using the Illinois Streamflow Assessment Model (ILSAM) model developed by Vern Knapp, ISWS (Knapp and Meyers, 1999). The ILSAM model can be used to define flows in terms of annual and monthly flow exceedence probability. Like other streams and rivers in northeastern Illinois, low head dams are a major feature in the Fox River and have profound effects on in-stream hydraulics and water quality (Santucci and Gephard, 2003). Model variables and rate parameters defining processes, such as reaeration, sediment oxygen demand, and algae growth rates, may be selected from data collected along the Fox River as available and then from studies of similar rivers. Another feature of the QUAL2E model is its incorporated module for uncertainty analysis that allows quantification of uncertainties associated with model predictions. The uncertainty module should be applied to the water quality simulations and the model results reported with associated uncertainty to the Fox River Study Group. The QUAL2E model has been an industry standard for years, and many engineers have expertise with its application. This will facilitate the model’s use by others as needed.
Large loads of some pollutants, such as suspended sediments and nitrogen, occur during
and immediately after rain events. Sediment-bound chemical constituents such as phosphorus could be released to the water column from sediment deposited in the river channel and pose a threat to water quality later. Simulation of time-varying flows can be accomplished using a flow dynamic model such as the HSPF model (RCHRES module). The model allows simulation of sediment transport and deposition and is appropriate for studying effects of pollutant loads on short- and long-term water quality. The HSPF model could be used for the Fox River for high-flow conditions in conjunction with QUAL2E applications for low-flow conditions.
145

Calibration of receiving water models can be done at a higher spatial resolution than the watershed loading models when monitoring data are available. For example, additional calibration locations can be chosen for detailed investigation of particular water quality conditions in river reaches of concern (e.g., in-stream pools) to improve model reliability. An assessment of the model accuracy and precision, and sensitivity to various coefficients and parameters should be conducted. The initial model could be used to identify data gaps, such as inputs to the system for which there are no field observations but the potential for significant impacts. Simulations can be conducted to evaluate a limited set of scenarios of changing conditions and could be used to assist with the identification of future monitoring locations.
146

Chapter 8. Fox River Watershed Investigation Web Site
The Fox River Watershed Investigation Web site (http://ilrdss.sws.uiuc.edu/fox) is the information hub for the project. It is hosted as part of the Illinois Rivers Decision Support System (ILRDSS) to provide easy access to data and information used in this project.
8.1. Current Features
Current features displayed on the Fox River Watershed Investigation Web site (Figure 8.1) include a publications database, publications bibliography, Web Mapping application, and downloadable versions of Geographic Information Systems (GIS) datasets, water quality database, Data Loader & Viewer program, and the phase I report. 8.2. Publications Database
This database contains links to publications found in the initial literature review of the study area. It is searchable by title, authors, abstract, time period, and several other criteria. The current database contains 35 publications.
Figure 8.1. Fox River Watershed Investigation Web site
147
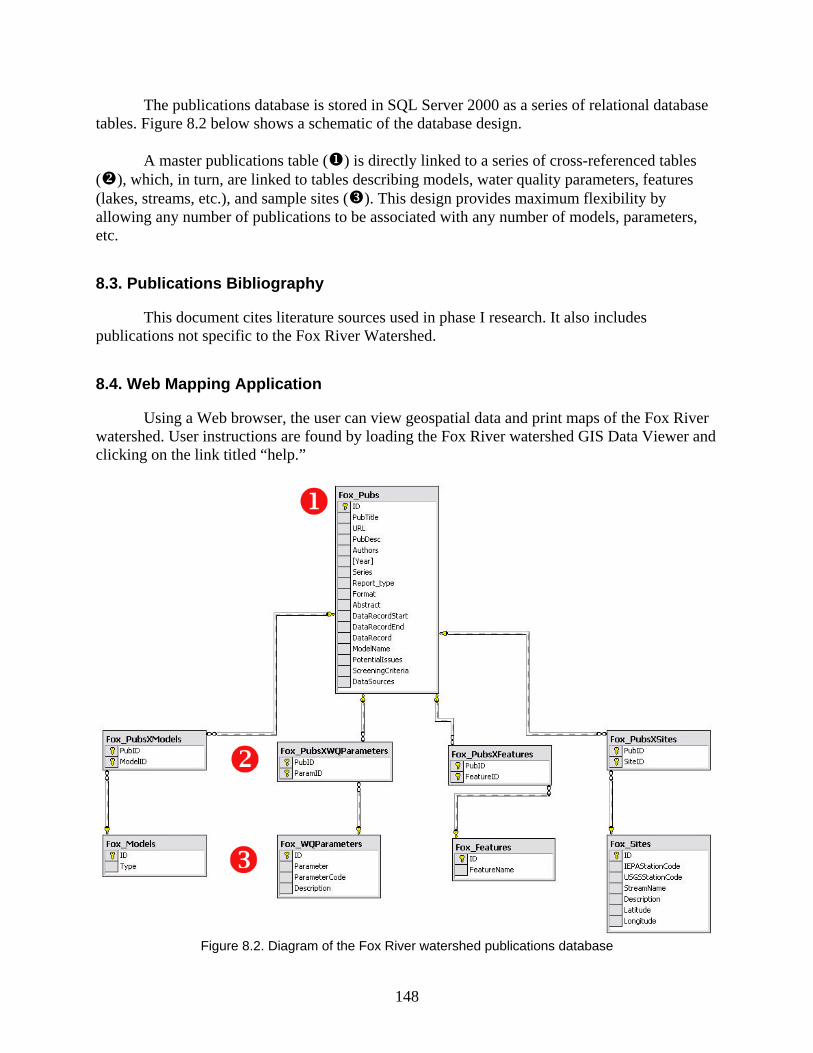
The publications database is stored in SQL Server 2000 as a series of relational database tables. Figure 8.2 below shows a schematic of the database design.
A master publications table ( ) is directly linked to a series of cross-referenced tables ( ), which, in turn, are linked to tables describing models, water quality parameters, features (lakes, streams, etc.), and sample sites ( ). This design provides maximum flexibility by allowing any number of publications to be associated with any number of models, parameters, etc. 8.3. Publications Bibliography
This document cites literature sources used in phase I research. It also includes publications not specific to the Fox River Watershed. 8.4. Web Mapping Application
Using a Web browser, the user can view geospatial data and print maps of the Fox River watershed. User instructions are found by loading the Fox River watershed GIS Data Viewer and clicking on the link titled “help.”
Figure 8.2. Diagram of the Fox River watershed publications database
148

8.5. Geographic Information System Datasets
All GIS datasets used in the Web mapping application are available for individual download from the ILRDSS Web site.
Geospatial datasets for the project were compiled from a variety of sources and
sometimes edited to fit within the Fox River watershed boundary. Metadata for each dataset can be viewed at the Web site either using the tools available within the Web mapping application, or by visiting the project homepage (http://ilrdss.sws.uiuc.edu/fox) and clicking on the following links: “Downloads” “GIS Datasets” Metadata button ( ) next to each dataset.
Current GIS datasets include, but are not limited to: Ambient Water Quality Monitoring Station Locations Discharge Gaging Station Locations Elevation (DEM) FoxDB Water Quality Sample Locations (updated periodically) Hydrography (rivers, streams, lakes) National Hydrography Dataset Landcover NPDES Permit Locations Sediment Monitoring Station Locations Dams on the main stem of the Fox River Towns Watershed boundary (HUC12) Weather Stations
8.6. Downloads
Several products can be downloaded from the Web site including the FoxDB water quality database (Microsoft Access format), Data Loader & Viewer program, GIS datasets, and the phase I report. Appendix 2 provides the data dictionary for the FoxDB. Appendix 4 provides directions for installing and using the Data Loader & Viewer program.
149


Chapter 9. Summary
Indications of water quality problems have led to a designation of the Fox River in Illinois and some of its tributaries on the Illinois Environmental Protection Agency Agency's list of impaired waters (IEPA, 2003, 303(d) list). Concerns about water quality led to the formation of the Fox River Study Group, Inc. (FRSG), a diverse coalition of watershed stakeholders who organized with the common interest of fostering sustainable growth in the Fox River watershed. Initially, the FRSG initiated a water quality sampling program in 2001 to augment water quality data collection in the watershed. The FRSG recognized a unique opportunity to collaborate on developing a comprehensive plan of study for the watershed with the objective of developing tools to provide watershed management guidance. The Illinois State Water Survey (ISWS) proposed a multi-phase plan, the Fox River Watershed Investigation, to develop tools for watershed planning and management. The Fox River Watershed Investigation is the basis for the FRSG work plan, and the Illinois Environmental Protection Agency (IEPA) funded phase I of the Fox River Watershed Investigation.
The goal of the Fox River Watershed Investigation is to develop objective, scientific tools
that provide information to guide watershed planning and management. Effective planning and management decisions require information on links between causes and effects. Water quality models link pollution sources to effects by simulating the pollution processes and their impacts on water quality of the receiving waters. The Fox River Watershed Investigation was designed to proceed in a stepwise, logical manner to develop models and design a monitoring network that will serve as tools for watershed management well into the future. Collaboration with stakeholders and information dissemination are integral to the project.
Objectives of phase I were: 1) to compile available data, 2) to identify water quality
issues, 3) to analyze water quality data for temporal and spatial trends, and data gaps, 4) to develop recommendations for watershed modeling on the basis of the information and analysis, and 5) to provide ready access to the information collected. This report is one of the products of phase I. The Fox River Watershed Investigation Web site (http://ilrdss.sws.uiuc.edu/fox), the information hub for the project, is hosted as part of the Illinois Rivers Decision Support System. The Web site includes: a searchable publication database; a Web mapping application for viewing geospatial data and printing maps of the Fox River watershed; links to GIS datasets; the Fox River database (FoxDB) a Microsoft Access database of water quality data compiled for the project, and the Data Loader & Viewer, a program designed for entering new data. The FoxDB and the Data Loader & Viewer may be downloaded from the Web site.
9.1. Review of Water Quality Studies
A variety of studies of water quality in the Fox River watershed have been conducted and reflect different interests and objectives. A thorough literature review was performed to provide a comprehensive assessment of water quality issues identified and to identify data sources. A brief statement of the findings of previous studies follows and a complete discussion and summary may be found in Chapter 3.
151

Pollution sources in the Fox River watershed include those regulated under the National Pollution Discharge Elimination System (NPDES) program and nonpoint sources such as surface runoff, groundwater seepage, and atmospheric deposition. Municipal and industrial wastewater treatment discharges may constitute a significant portion of the river’s base flow and dominate in-stream water quality at low-flow conditions. Impacts of nonpoint sources are largely governed by rainfall, land uses, and land management practices. Designated uses of the Fox River are impaired due to nutrients, organic enrichment/low dissolved oxygen (DO), pathogens, suspended solids, flow alteration, and habitat alteration. Ecosystem monitoring found that the Fox River and Des Plaines River watersheds (assessed as watershed units) generally scored below the statewide average for most biological indicators. This deteriorated biological integrity correlated with urbanization and in-stream dam structures.
On a regional scale, chemical forms and spatial distributions of nutrients are governed by
land uses in the watershed. The Fox River watershed has a lower ammonia level than the Des Plaines River watershed and lower nitrate concentrations than the Kankakee River watershed. Phosphorus levels are comparable with the Kankakee River watershed and lower than the Des Plaines River watershed. Most recent studies indicated nutrient-enriched conditions, with high algal biomass in the Fox River during summer and fall seasons.
The Fox River watershed exhibited the largest variability in suspended solids
concentrations compared to the neighboring watersheds in the upper Illinois River basin. Elements that exceeded U.S. Environmental Protection Agency (USEPA) freshwater chronic and acute criteria based on sampling during 1978–1986 include total cadmium, chromium, copper, iron, lead, mercury, silver, and zinc. Fecal coliform counts varied widely with several orders of magnitude difference, suggesting pathogen-related parameters are greatly affected by nonpoint sources such as surface runoff related to rain events. Concentrations of pesticide and synthetic organics compounds in the Fox River watershed were lower than those in the Chicago River and Des Plaines River watersheds.
Emerging water quality issues related to chemicals used in household products,
pharmaceuticals, and other consumables, as well as hormones, have been getting more attention in recent years. These chemicals are of concern because they are developed for the express purpose of causing biological effects. Potential concerns include increased toxic effects, development of more resistant bacteria, and endocrine disruption in humans and animals. The impact of these constituents are not yet defined. While not identified as problematic in the Fox watershed, stakeholders should be cognizant of the potential and this may be an area of consideration in the future.
9.2. Water Quality Database
A variety of monitoring activities have been pursued in the Fox River watershed over the years. Some monitoring efforts are designed to collect long-term datasets to monitor ambient water quality conditions, some for short-term projects, some for compliance or permit monitoring, and others are by volunteer citizen groups. These monitoring activities are described in Chapter 4. A database, FoxDB, was created to provide a central repository for the data, which is stored in a consistent format for retrieval and comparison. As part of the present study, the
152

structure and attributes of the original datasets were reviewed and translated to a common format in the FoxDB. The quality of the data, collection protocol, and laboratory analyses were reviewed to assign a consistent grade to the datasets for comparability and reliability. Storing the data in the FoxDB provides consistent and efficient data access. Data from different sources also can be easily compared, combined, or separated, as desired.
The FoxDB serves several functions. In order to perform a comprehensive statistical
assessment of all available chemical water quality data, it was necessary to compile the data into a consistent format. These data will be needed for the initial calibration of water quality models. The FoxDB serves as a central repository for data collected by a variety of groups for ready comparison. It is a resource for study and information about the watershed for interested persons and can be updated to provide an information resource for watershed study into the future.
9.3. Water Quality Data Analysis
The analysis of the water quality data compiled in the FoxDB is a central aspect of the phase I study. The data analysis was performed to provide an updated assessment of water quality issues, identify data trends for consideration in model choices, and to identify data gaps. Water quality data collected in the Fox River watershed during 1998–2002 by various agencies were analyzed, and results are presented in Chapter 5. The evaluation focused on the following parameters: nutrients (nitrogen and phosphorus), DO, pH, suspended solids, fecal coliform, algae and biomass, and selected priority pollutants (copper, lead, nickel, iron, and zinc).
Water quality data in the Fox DB were analyzed primarily for model selection. Spatial,
temporal, and seasonal trends were explored. Compliance with water quality standards was evaluated for those parameters for which standards were available. Potential water quality problems were identified either by presence of values exceeding the standards or by probabilistic evaluation. The purpose of comparing the data to water quality standards was to use the standards as guidance for selecting water constituents of concern for future modeling activities.
Data collected from the mainstem of the Fox River were evaluated, as well as water
quality data from tributaries. Low DO concentrations were observed at most stations along the mainstem of the Fox River from Johnsburg to Oswego. Ammonia nitrogen may be problematic near Algonquin in McHenry County, and also near the mouth of the Fox River at Ottawa. Samples with high phosphorus concentrations were observed at Algonquin, South Elgin, and Yorkville. Fecal coliform concentrations have exceeded standards at most stations from Algonquin to Ottawa. Water quality data for tributaries were less complete than along the mainstem. Low DO was observed in Buck Creek. Ammonia nitrogen levels may have exceeded standards on Poplar, Blackberry, Somonauk, and Nippersink Creeks. Levels of total cadmium, copper, and nickel exceeded standards in samples collected from Poplar, Blackberry, Nippersink, and Little Indian Creeks.
The temporal patterns of the various water quality constituents were investigated, and the
parameters can be categorized into two groups: problems associated with summer and low-flow periods, or with high flows (usually spring runoff events). Steady-state water quality models are
153

appropriate to describe fairly constant low-flow conditions in summer. Pollutants associated with runoff events should be modeled using dynamic models.
The FoxDB includes water quality data collected at 190 different sites in the Fox
watershed: 88 sites located directly on the Fox River and 102 sites on the tributaries. However, only 60 sites were sampled at least once during 1998–2002: 38 sites on the Fox River and 22 sites on its tributaries. The central part of the watershed (Kane County) has been monitored extensively, while there is sporadic coverage of the watershed’s lower part. The central part of the watershed has been a focus of several water quality studies due to its urbanization level and numerous impoundments in this region. The dams and associated impoundments introduce discontinuity in the flow so that samples do not necessarily reflect water quality above and below the monitoring site. Water quality as well as chemical and biological processes differ between free-flowing and impounded reaches.
Generally, recent water quality data (1998–2002) are very limited for the lower part of
the watershed and for tributaries. Most monitoring programs include DO as a primary indicator of enrichment by organic matter. Most stations with recent DO data are located in the central part of the watershed. Most tributaries have either no DO data or limited data available. Sites with available nutrient data (ammonia, nitrate, and phosphorus) and associated parameters (suspended solids) are evenly located along the mainstem with a cluster of sites around Elgin: other sites have no data or limited data. Fecal coliform was sampled at several sites along the mainstem, again with a cluster of sites around Elgin. Limited trace metal data are available for some tributaries and for the Fox River.
Three tributaries represent a top priority for filling the data gaps: Crystal Creek has no
current data while there are several point sources in its watershed, including Lake in the Hills Sanitary Treatment Plant and Crystal Lake Sanitary Treatment Plant. Recent data for both Tyler Creek and Ferson Creek are insufficient because these locations were just sampled once or twice. However, these creeks represent significant tributaries in the area of interest. Sampling data also are lacking for major tributaries in the lower portion of the watershed.
9.4. Sediment Chemistry
The geographic coverage of the sediment chemistry data within the FoxDB is good, especially along the mainstem. However, the temporal coverage is poor. With the available data, several general conclusions can be drawn. Sediment quality of tributaries is generally better than that along the mainstem. This trend is more distinct for potential metal contaminants (e.g., mercury and copper), and less distinct for total nutrient concentrations (total phosphorus and total Kjeldahl nitrogen). A similar trend probably holds for many potential organic contaminants, although only the USEPA dataset contains organic contaminant data for tributaries. Most analyses indicate concentrations near or below method detection limits. Most constituents in above dam pools tend to have higher concentrations, but are present at concentrations below available sediment quality guidelines in most samples. Total mercury concentrations appear to be an exception to this trend, with elevated mercury concentrations predominating in six above dam pools. Sediment oxygen demand, particularly in pooled areas along the Fox River should be included in water quality modeling, and additional field data will need to be collected for model calibration.
154

9.5. Modeling Issues
It is recommended that a flexible, modular framework be established for the Fox River watershed model. The framework initially should consist of watershed loading models for major tributaries to the Fox River and a receiving stream model of the Fox River mainstem. The modular framework should be such that various components (e.g., tributary watershed models) can be refined as data become available. The BASINS model framework is recommended, particularly the HSPF model for watershed loading in urbanizing watersheds. Initially, a QUAL2E or similar model is suggested for the mainstem to simulate low-flow DO cycle, but an unsteady flow model, such as HSPF, will also be needed for unsteady flow considerations along the mainstem of the Fox River.
The data assembled in the FoxDB and various GIS datasets identified in Chapter 2
provide a foundation for the model framework. It is suggested that the model framework be developed and the models calibrated to the extent possible using these data. Customized models then may be used to evaluate additional data needs and design an intensive monitoring program for model calibration. Datasets should be collected to validate the models, and an uncertainty analysis should be performed for parameters of major significance.
155


References
Ackerman, W.C. 1971. Minor Elements in Illinois Surface Waters. Illinois State Water Survey, Technical Letter 14, Champaign, IL.
Adams, J.R., R.K. Raman, and E. Delisio. 1989. Sediment Transport and Water Quality Characteristics of Two Streams in Kane County. Illinois State Water Survey, Contract Report 471, Champaign, IL.
Adolphson, D.L., T.L. Arnold, F.A. Fitzpatrick, M.A. Harris, K.D. Richards, B.C. Scudder, and J.S. Stewart. 2002. Urban Land-Use-Gradient Study, Des Plaines and Fox River Basins, Illinois, 1999-2001. U.S. Geological Survey OFR 01-459 (http://il.water.usgs.gov/nawqa/uirb/lu_grad /index.html, accessed June 19, 2003).
Angel, J. 2003. Illinois State Climatologist Office, Active Climate Stations in Illinois (http://www.sws.uiuc.edu/atmos/statecli/General/activenosc2.pdf, accessed October 18, 2003).
Arnold, J.G., R. Srinivasan, R.S. Muttiah, and J.R. Williams. 1998. Large Area Hydrologic Modeling and Assessment Part 1: Model Development. Journal of American Water Resources Association 34(1):73-89.
Arnold, J.G., J.R. Williams, and D.R. Maidment. 1995. Continuous-time Water and Sediment-Routing Model for Large Basins. Journal of Hydraulic Engineering 121(2):171-183.
Baird, C. 1995 Environmental Chemistry. W.H. Freeman, New York, NY.
Barnes, K.K., D.W. Kolpin, M.T. Meyer, E.M. Thurman, E.T. Furlong, S.D. Zaugg, and L.B.
Barber. 2002. Water-Quality Data for Pharmaceuticals, Hormones, and Other Organic Wastewater Contaminants in U.S. Streams, 1999 – 2000. U.S. Geological Survey, Open-File Report 02-94, Iowa City, IA.
Beck, M.B. 1987. Water Quality Modeling: A Review of the Analysis of Uncertainty. Water Resources Research 23(23):1393-1442.
Bertrand, W.A., R.L. Hite, D.M. Day, W. Ettinger, W. Matsunaga, S. Kohler, J. Mick, and R. Schanzle. 1996. Biological Stream Characterization (BSC): Biological Assessment of Illinois Stream Quality through 1993. Bureau of Water, Illinois Environmental Protection Agency, Report IEPA/BOW/96-058, Springfield, IL.
Bhowmik, N.G., J.R. Adams, A.P. Bonini, A.M. Klock, and M. Demissie. 1986. Sediment Loads of Illinois Streams and Rivers. Illinois State Water Survey, Report of Investigation 106, Champaign, IL.
Bhowmik, N.G., and M. Demissie. 2002. Sediment Management Alternatives for the Fox Chain of Lakes along the Fox River in Illinois. Illinois State Water Survey, Contract Report 2002-04, Champaign, IL.
157

Bicknell, B.R., J.C. Imhoff, J.L. Kittle, Jr., T.H. Jobes, and A.S. Donigian, Jr. 2001. Hydrological Simulation Program – FORTRAN, Version 12, User’s Manual. National Exposure Research Laboratory, Office of Research and Development, U.S. Environmental Protection Agency, Athens, GA.
Bicknell, B.R, A.S. Donigian, Jr., and T.A. Barnwell. 1985. Modeling Water Quality and the Effects of Agricultural Best Management Practices in the Iowa River Basin. Water Science Technology 17:1141-1153.
Bowie, G.L., W.B. Mills, D.B. Porcella, C.L. Campbell, J.R. Pagenpofk, G.L. Rupp, K.M. Johnson, P.W.H. Chan, and S.A. Gherini. 1985. Rates, Constants, and Kinetics Formulations in Surface Water Quality Modeling. Office of Research and Development, U.S. Environmental Protection Agency, EPA/600/3-85/040, Athens, GA.
Brick, C.M and J.N. Moore. 1996. Diel Variation of Trace Metals in the Upper Clark Fort River, Montana. Environmental Science & Technology 30:1953-1960.
Brun, S.E., and L.E. Band. 2000. Simulating Runoff Behavior in an Urbanizing Watershed. Computer, Environment and Urban Systems 24:5-22.
Butts, T.A., and R.L. Evans. 1978a. Sediment Oxygen Demand Studies of Selected Northeastern Illinois Streams. Illinois State Water Survey, Circular 129/78, Urbana, IL.
Butts, T.A., and R.L. Evans. 1978b. Effects of Channel Dams on Dissolved Oxygen Concentrations in Northeastern Illinois Streams. Illinois State Water Survey, Circular 132/78, Urbana, IL.
Chicago Area Paddling Fishing Guide. 2003. Dams and Obstructions in the Chicago Area, Fox River (http://pages.ripco.net/~jwn/dam.html#fox_river, accessed August 26, 2003).
Colman, J.A., and R.F. Sanzolone. 1992. Geochemical Characterization of Streambed Sediment in the Upper Illinois River basin. Water Resources Bulletin 28(5):933-950.
Colman, J.A., and R.F. Sanzolone. 1991. Surface Water Quality Assessment of the Upper Illinois River Basin in Illinois, Indiana, and Wisconsin: Geochemical Data for Fine-Fraction Streambed Sediment from High- and Low-Order Streams, 1987. U.S. Geological Survey, Open File Report 90-571, Urbana, IL.
Daughton, C.G., and T.A. Ternes. 1999. Special Report: Pharmaceuticals and Personal Care Products in the Environment: Agents of Subtle Change? Environmental Health Perspective 107(suppl 6):907-938.
Dean, J.D., D.W. Meier, B.R. Bicknell, and A.S. Donigian, Jr. 1984. Simulation of DDT Transport and Fate in the Arroyo Colorado Watershed, Texas, Draft Report. National Exposure Research Laboratory, Office of Research and Development, USEPA, Athens, GA, p.199.
158

Donigian, A.S., Jr., R.V. Chinnaswamy, and T.H. Jobes. 1997. Conceptual Design of Multipurpose Detention Facilities for both Flood Protection and Nonpoint Source Pollution Control. Draft Final Report, prepared for Santa Clara Valley Water District, San Jose, CA.
Donigian, A.S., Jr., W.C. Huber, and T.O. Barnwell Jr. 1991. Modeling of Nonpoint Source Water Quality in Urban and Non-Urban areas. Environmental Research Laboratory U.S. Environmental Protection Agency, Office of Research and Development, EPA/600/3-91/039, Athens, GA.
Dreher, D.W. 1997. Watershed Urbanization Impacts on Stream Quality Indicators in Northeastern Illinois. National Symposium of Assessing the Cumulative Impacts of Watershed Development on Aquatic Ecosystems and Water Quality, U.S. Environmental Protection Agency, March 19-21, 1996, Chicago, IL.
Duda, P. J. Kittle, Jr., and M. Gray. 2001. WinHSPF Version 2.0, An Interactive Windows Interface to HSPF, User’s Manual. Office of Water, U.S. Environmental Protection Agency, Washington, DC.
Duncker, J.J., T.J. Vail, and C.S. Melching. 1995. Regional Rainfall-Runoff Relations for Simulation of Streamflow for Watersheds in Lake County, Illinois. U.S. Geological Survey, WRIR 95-4023, Urbana, IL.
Elmore, G.R., G.D. Harmon, R.P. Reilly, G.T. Lum, and P.R. Larson. 1977. Historical Water Quality Data, Fox River Basin. Northeastern Illinois Planning Commission, Staff paper No. 16, Chicago, IL.
Environmental Software and Services. 2003. GAIA. Dynamics of Ecosystems Simulation Models: Dynamic Toxics Model (DYNTOX): Description (http://www.ess.co.at/GAIA/models/dyntox.htm, accessed April 06, 2003).
Fallon, J.D., D.P. Tierney, and E.M. Thurman. 2002. Movement of Atrazine and Deethylatrazine through a Midwestern Reservoir. Journal of the American Water Works Association 94(11):54-66.
Fitzpatrick, F.A., T.L Arnold, and J.A. Colman. 1998. Surface Water Quality Assessment of the Upper Illinois River Basin in Illinois, Indiana, and Wisconsin-Spatial Distribution of Geochemicals in the Fine Fraction of Streambed Sediment, 1987. U.S. Geological Survey, Water-Resources Investigations Report 98-4109, Urbana, IL.
Fitzpatrick, F.A., T.H. Larson, S.S. McFadden, and R.H. Gilkeson. 1992. Hydrologic Environments along the Fox River Valley in Kane County, Illinois. Illinois State Geological Survey, Open-File Series 1992-6, Champaign, IL.
Fitzpatrick, F.A., B.C. Scudder, J.K. Crawford, A.R. Schmidt, J.B. Sieverling, J.A. Colman, C.G. Crawford, and D.J. Sullivan. 1995. Surface Water-Quality Assessment of the Upper Illinois River Basin in Illinois, Indiana, and Wisconsin: Major and Trace Elements in Water, Sediment, and Biota, 1978-90. U.S. Geological Survey, Water-Resources Investigations Report 95-4045, Urbana, IL.
159

Fox River Ecosystem Partnership (FREP). 1998. Integrated Management Plan for the Fox River Watershed in Illinois (http://www.foxriverecosystem.org/management_plan.htm, accessed August 27, 2003).
Gilkeson, R.H., K. Cartwright, J.B. Cowart, and R.B. Holtzman. 1983. Hydrologic and Geochemical Study of Selected Natural Radioisotopes and Barium in Groundwater in Illinois. Illinois State Geological Survey, Contract/Grant Report 1983-6, Champaign, IL.
Gottschalk, L.C. 1977. Nature of Sedimentation Problem. In Sedimentation Engineering (V.A. Vanoni, ed.), American Society of Civil Engineering Manuals and Reports on Engineering Practice-No. 54, ASCE Task Committee, ASCE, New York, NY.
Halling-Sorensen, B.S., N. Nielson, P.F. Lanzky, F. Inberslev, J. Holten Lutzhoft, and S.E. Jorgensen. 1998. Occurrence, Fate and Effects of Pharmaceutical Substances in the Environment - A Review. Chemosphere 36:357-393.
Harmeson, R.H., and T.E. Larson. 1969. Quality of Surface Water in Illinois, 1956 – 1966. Illinois State Water Survey, Bulletin 54, Urbana, IL.
Harmeson, R.H., T.E. Larson, L.M. Henley, R.A. Sinclair, and J.C. Neill. 1973. Quality of Surface Water in Illinois, 1966 – 1971. Illinois State Water Survey, Bulletin 56, Urbana, IL.
Hem, J.D. 1985. Study and Interpretation of the Chemical Characteristics of Natural Water (3rd ed.). U.S. Geological Survey, Water-Supply Paper 2254, Reston, VA.
Huff, J.E., and S. LaDieu. 1995. Ammonia Water Quality Study on the Fox River from Flint Creek near Barrington to Blackberry Creek near Yorkville. Huff and Huff, Inc., LaGrange, IL.
Hummel. P., J. Kittle, Jr., and M. Gray. 2001. A Tool for Managing Watershed Modeling Time – Series Data: User’s Manual. AQUA TERRA Consultants, Health Protection and Modeling Branch, Standards and Health Protection Division, Office of Science and Technology Office of Water, Mountain View, CA.
Illinois Administrative Code. 2002. Title 35 Environmental Protection, Subtitle C: Water Pollution, Chapter I: Pollution Control Board, Part 302 Water Quality Standards, (http://www.ipcb.state.il.us/Archive/dscgi/ds.py/View/Collection-353, accessed August 13, 2003).
Illinois Department of Agriculture. 2003. Illinois Land Cover 1999-2000. (http://www.agr.state.il.us/gis/landcover99-00.html, accessed August 18, 2003).
Illinois Department of Natural Resources. 2001. Critical Trends in Illinois Ecosystems. Critical Trends Assessment Program, Office of Scientific Research and Analysis, IDNR, Springfield, IL.
160

Illinois Department of Natural Resources. 2000. Fox River Area Assessment. Volume 5: Early Accounts of the Ecology of the Fox River Area. Critical Trends Assessment Program, Office of Scientific Research and Analysis, IDNR, Springfield, IL.
Illinois Department of Natural Resources. 1998a. Fox River Area Assessment. Volume l: Geology. Critical Trends Assessment Program, Office of Scientific Research and Analysis, IDNR, Springfield, IL.
Illinois Department of Natural Resources. 1998b. Fox River Area Assessment. Volume 2: Water Resources. Critical Trends Assessment Program, Office of Scientific Research and Analysis, IDNR, Springfield, IL.
Illinois Department of Natural Resources. 1998c. Fox River Area Assessment. Volume 3: Living Resources. Critical Trends Assessment Program, Office of Scientific Research and Analysis, IDNR, Springfield, IL.
Illinois Department of Natural Resources. 1997a. Fox River Area Assessment. Volume 4: Socio-Economic Profile, Environmental Quality, Archaeological Resources. Critical Trends Assessment Program, IDNR, Office of Scientific Research and Analysis, IDNR, Springfield, IL.
Illinois Department of Natural Resources. 1997b. The Fox River Basin, An Inventory of the Regions’ Resources. Critical Trends Assessment Program, Office of Realty and Environmental Planning and The Nature of Illinois Foundation, IDNR, Springfield IL.
Illinois Department of Natural Resources. 1996. Illinois Land Cover – An Atlas on Compact Disc. Illinois Department of natural Resources, Springfield , IL.
Illinois Department of Natural Resources, Office of Realty and Planning, Energy and Environmental Research. 1991. CENSUS90 (http://www.isgs.uiuc.edu/nsdihome/outmeta/census90.html accessed September 2, 2003).
Illinois Environmental Protection Agency. 2003. Illinois 2002 Section 303(d) List. IEPA, IEPA/BOW/03-016, Springfield, IL (http://www.epa.state.il.us/water/watershed/reports/303d-report/2002-report/303d-report-2002.pdf, accessed November 6, 2003).
Illinois Environmental Protection Agency. 2002a. Illinois Water Quality Report 2002. IEPA, IEPA/BOW/02-006, Springfield, IL (http://www.epa.state.il.us/water/water-quality/report-2002/305b-2002.pdf, accessed August 22, 2003).
Illinois Environmental Protection Agency. 2002b. River and Stream Monitoring Programs (http://www.epa.state.il.us/water/surface-water/river-stream-mon.html, accessed February 2003).
Illinois Environmental Protection Agency. 2000. Illinois Water Quality Report 2000. IEPA, IEPA/BOW/00-005, Springfield, IL.
161

Illinois Environmental Protection Agency. 1994. Quality Assurance Project Plan. Bureau of Water, IEPA, Springfield, IL.
Jorgensen, S.E., and B. Halling-Sorensen. 2000. Drugs in the Environment. Chemosphere 40:691-699.
Karr, J.R., K.D. Fausch, P.L. Angermeier, P.R. Yant, and I.J. Schlosser. 1986. Assessing Biological Integrity in Running Water: A Method and Its Rationale. Illinois Natural History Survey, Special Publication 5, Champaign, IL.
Kirsch, K.A., and J.G. Arnold. 2002. Predicting Sediment and Phosphorus Loads in the Rock River Basin Using SWAT. Transactions of the American Society of Agricultural Engineers 45(6):1757-1769.
Knapp, H.V., and M.W. Myers. 1999. Fox River Streamflow Assessment Model: 1999 Update to the Hydrologic Analysis. Illinois State Water Survey, Contract Report 649, Champaign, IL.
Knapp, H.V., and T.W. Ortel. 1992. Effect of Stratton Dam Operation on Flood Control Along the Fox River and Fox Chain of Lakes. Illinois State Water Survey, Contract Report 533, Champaign, IL.
Knisel, W.G. 1980. CREAMS, a Field Scale Model for Chemicals, Runoff and Erosion from Agricultural Management Systems. U.S. Department of Agriculture, Conservation Research Report No. 26, Washington, DC.
Kolpin, D.W., E.T. Furlong, M.T. Meyer, E.M. Thurman, S.D. Zaugg, L.B. Barber, and H.T. Buxton. 2002. Pharmaceuticals, Hormone, and Other Organic Wastewater Contaminants in U.S. Streams, 1999 - 2000: A National Reconnaissance. Environmental Science & Technology 36:1202-1211.
Kothandaraman, V.R.L. Evans, N.G. Bhowmik, J.B. Stall, D.L. Gross, J.A. Lineback, and G.B. Dreher. 1977. Fox Chain of Lakes Investigation and Water Quality Management Plan. Illinois State Water Survey, Cooperative Resources Report 5, Urbana, IL.
Krabbenhoft, D.P., J.G. Wiener, W.G. Brumbaugh, M.L. Olson, J.F. Dewild, and T.J. Sabin. 1999. A National Pilot Study of Mercury Contamination of Aquatic Ecosystems along Multiple Gradients. U.S. Geological Survey, Water Resources Investigations Report 99-4018B, Middleton, WI, pp. 147-160.
Leonard, R.A., W.G. Knisel, and D.A. Still. 1987. GLEAMS: Groundwater Loading Effects on Agricultural Management Systems. Transactions of the American Society of Agricultural Engineers 30(5):1403-1428.
Limo-Tech, Inc. 1985. Dynamic Toxics Waste Load Allocation Model (DYNTOX) User’s Manual. U.S. Environmental Protection Agency, Monitoring and Data Support Division, Washington, DC.
162
Luman, D., L. Smith, and C. Goldsmith. 2002. Illinois Surface Topography, Illinois Map 11. Illinois State Geological Survey, Urbana, IL.
Lumb, A.M., R.B. McCammon, and J.L. Kittle, Jr. 1994. Users Manual for an Expert System (HSPEXP) for Calibration of the Hydrological Simulation Program – Fortran. U.S. Geological Survey, Water-Resources Investigations Report 94-4168, Reston, VA.
MacDonald, D.D., C.G. Ingersoll, and T.A. Berger. 2000. Development and Evaluation of Consensus-based Sediment Quality Guidelines for Freshwater Ecosystems. Archives of Environmental Contamination and Toxicology 39:20-31.
Masliev, I., and L. Somlyody. 1994. Probabilistic Methods for Uncertainty Analysis and Parameter Estimation for Dissolved Oxygen Models. Water Science Technology 30(2):99-108.
McConkey, S.A., R.S. Larson, and K.P. Singh. 1992. Pilot Study: Riffle-Pool Geometry below Algonquin and Aquatic Habitat Assessment. Illinois State Water Survey, Contract Report 542, Champaign, IL.
McMurray, S.W., M.S. Coyne, and E. Perfect. 1998. Fecal Coliform Transport through Intact Soil Blocks Amended by Poultry Manure. Journal of Environmental Quality 27:86-92.
Melching C.S., and C.G. Yoon. 1996. Key Sources of Uncertainty in QUAL2E Model of Passaic River. Journal of Water Resources Planning and Management 122(2):105-113.
Merrington, G., L. Winder, R. Parkinson, and M. Redman. 2003. Agricultural Pollution: Environmental Problems and Practical Solutions. Spoon Press, London, U.K., and New York, NY.
Miller, S.N., W.G. Kepner, M.H. Mehaffey, M. Hernandez, R.C. Miller, D.C. Goodrich, K.K. Devonald, D.T. Heggem, and W.P. Miller. 2002. Integrating Landscape Assessment and Hydrologic Modeling for Land Cover Change Analysis. Journal of American Water Resources Association. 38(4):915-929.
Morgan, M.G., and M. Henrion. 1990. Uncertainty: A Guide to Dealing with Uncertainty in Quantitative Risk and Policy Analysis. Cambridge University Press, New York, NY.
National Academy of Sciences. 1972. Water Quality Criteria. National Academy of Sciences, Washington, DC, p.594.
National Atmospheric Deposition Program. 2003. Illinois State Water Survey, Champaign, IL (http://nadp.sws.uiuc.edu/sites/siteinfo.asp?net=NTN&id=IL19, accessed June 2, 2003).
Natural Resource Conservation Service. 2003a. Watershed Boundary Dataset WBD (http://www.ftw.nrcs.usda.gov/hucdata.html, accessed August 26, 2003).
Natural Resource Conservation Service. 2003b. National STATSGO Database, Data Access (http://www.ftw.nrcs.usda.gov/stat_data.html, accessed August 26, 2003).
163

Natural Resource Conservation Service. 2003c. National SSURGO Database, Data Access (http://www.ftw.nrcs.usda.gov/ssur_data.html, accessed August 26, 2003).
Neitsch, S.L., J.G. Arnold, J.R. Kiniry, R. Srivivasan, and J.R.Williams. 2002. Soils and Water Assessment Tool User’s Manual. Texas Water Resources Institute, TWRI Report TR-192, College Station, TX.
Nix, J.S. 1990. Mathematical Modeling of the Combined Sewer System. In P.E. Moffa, Control and Treatment of Combined Sewer Overflows. Van Nostrand Reinhold Company, New York, NY, pp. 23-78.
Northeastern Illinois Planning Commission. 2001. Data Bulletin 1-2001: Summary of 2000 Census Public Law 94-171 Redistricting Data, March 2001 (http://www.nipc.cog.il.us/new-pubs.htm#Data, accessed August 22, 2003).
Northeastern Illinois Planning Commission (NIPC). 2000. Toward 2020 Population, Household and Employment Forecasts for Counties and Municipalities in Northeastern Illinois (http://www.nipc.cog.il.us/fore2020.htm, accessed August 18, 2003).
Northeastern Illinois Planning Commission. 1978. Areawide Water Quality Management Plan. Chapter 19 (Fox River Basin), NIPC, Chicago, IL.
Olson, M.L., and DeWild, J.F. 1999. Techniques for the Collection and Species-specific Analysis of Low Levels of Mercury in Water, Sediment, and Biota. U.S. Geological Survey, Water Resources Investigations Report 99-4018B, pp. 191-202.
Robertson, D.M., D.A. Saad, and A.M. Wieben. 2001. An Alternative Regionalization Scheme for Defining Nutrient Criteria for Rivers and Streams. U.S. Geological Survey, Water-Resources Investigation Report 01-4073, Reston, VA.
Santhis C., J.G. Arnold, J.R. Williams, L.M. Hauck, and W.A. Dugas. 2001. Application of a Watershed Model to Evaluate Management Effects on Point and Nonpoint Source Pollution. Journal of Transactions of the ASAE 44(6):1559-1570.
Santucci, Jr., V.J., and S.R. Gephard. 2003. Fox River Fish Passage Feasibility Study. Max McGraw Wildlife Foundation, Dundee, IL.
Schrader, D.L., and R.H. Holmes, Jr. 2000. Suspended-Sediment Budget, Flow Distribution, and Lake Circulation for the Fox Chain of Lakes in Lake and McHenry Counties, Illinois, 1997-1999. U.S. Geological Survey, Water Resources Investigation Report 00-4115, DeKalb, IL.
Schumacher, B.A., and B.L. Conkling. 1991. User's Guide to the Quality Assurance/Quality Control Evaluation Scale of Historical Datasets. U.S. Environmental Protection Agency, Las Vegas, NV.
Shackelford, W.M., and D.M. Cline. 1986. Organic Compounds in Water. Environmental Science & Technology 20:(7):652-657.
164

Short, M.B. 1997. Evaluation of Illinois Sieved Stream Sediment Data, 1982-1995. Illinois Environmental Protection Agency, Division of Water Pollution Control Staff Report, Springfield, IL.
Short, M.B., and M.S. Henebry. 2001. Surface Water Pesticide Monitoring of Illinois Streams: Summary of Results, 1985 – 1998. Illinois Environmental Protection Agency, IEPA/BOW/00-002, Springfield, IL.
Singh, K.P., T.A. Butts, H.V. Knapp, D.B. Shackleford, and B.S. Larson. 1995. Considerations in Water Use Planning for the Fox River. Illinois State Water Survey, Contract Report 586, Champaign, IL.
Singh, J., H.V. Knapp, P. Saco, M. Demissie, and Y. Lian. 2003. Hydrologic Model Development for Illinois River Basin using BASINS 3.0. Final Project Report (in review). Illinois State Water Survey, Champaign, IL.
Soong, T.W. 2001. Illinois District Project Factsheets. Hydrological Study Activity in the Blackberry Creek Watershed, Illinois (http://il.water.usgs.gov/proj/factsheets/soong_fs.pdf, accessed on August 5, 2003).
Soong, T.W., and T.D. Straub. 2003. Flood-Frequency Curves Estimated by Regional Regression Equations and Simulated Flood Series in the Ungaged Areas of Blackberry Creek Watershed, Illinois. Proceedings of the World Water and Environmental Resources Congress, American Socieity of Civil Engineers, June 23-26, 2003, Philadelphia, PA, CD-ROM.
Srinivasan, R., H. Lu, C.L. Dujardin, and T. Gulbransen. 2002. Total Maximum Daily Load (TMDL) Development Methodology for Waterbodies in New York State Closed to Shellfish Harvesting (http://www.hydroqual.com/papers/srangarajan/a_sr_02.htm, accessed August 29, 2003).
Sullivan, D.J. 2000. Nutrients and Suspended Solids in Surface Waters of the Upper Illinois River Basin in Illinois, Indiana, and Wisconsin, 1978-97. U.S. Geological Survey, Water-Resources Investigations Report 99-4275, Middleton, WI.
Sullivan, D.J., T.W. Stinson, J.K. Crawford, and A.R. Schmidt. 1998. Surface-Water-Quality Assessment of the Upper Illinois River Basin in Illinois, Indiana, and Wisconsin − Pesticides and Other Synthetic Organic Compounds in Water, Sediment, and Biota, 1975-90. U.S. Geological Survey, Water-Resources Investigations Report 96-4135, Urbana, IL.
Terrio, P.J. 1995. Water-Quality Assessment of the Upper Illinois River Basin in Illinois, Indiana, and Wisconsin: Nutrients, Dissolved Oxygen, and Fecal – Indicator Bacteria in Surface Water, April 1987 through August 1990. U.S. Geological Survey, Water-Resources Investigations Report 95-4005, Urbana, IL.
U.S. Army Corps of Engineers. 2002. CE-QUAL-RIV1 Version 2.0: One-dimensional, Dynamic Flow and Water Quality Model for Streams (http://www.wes.army.mil/el/elmodels/riv1info.html, accessed May 10, 2003).
165

U.S. Army Corps of Engineers. 1995. CE-QUAL-RIV1: A Dynamic, One-Dimensional (Longitudinal) Water Quality Model for Streams, User’s Manual. USACE Instruction Report EL-95-2, Washington, DC.
U.S. Census Bureau. 2000. Census 2000 TIGER/Line Data (http://www.esri.com/data/download/census2000_tigerline/ accessed September 2, 2003).
U.S. Environmental Protection Agency. 2003a. BASINS homepage (http://www.epa.gov/waterscience/BASINS/, accessed August 23, 2003).
U.S. Environmental Protection Agency. 2003b. BASINS, Flow Calibration Tutorial (http://www.epa.gov/waterscience/ftp/basins/training/tutorial/di.htm, accessed April 06, 2003).
U.S. Environmental Protection Agency. 2003c. EnviroFacts Data Warehouse, (http://www.epa.gov/enviro/index_java.html accessed March 12, 2003).
U.S. Environmental Protection Agency. 2003d. QUAL2E: Description (http://www.epa.gov/docs/QUAL2E_WINDOWS/metadata.txt.html, accessed April 05, 2003).
U.S. Environmental Protection Agency. 2003e. Quarterly Non-Compliance Reports (QNCRs) (http://www.epa.gov/region5/water/weca/qncrs.htm#2003, accessed August 15, 2003).
U.S. Environmental Protection Agency. 2003f. STORET home page (http://www.epa.gov/storet/, accessed June 12, 2003).
U.S. Environmental Protection Agency. 2003g. Legacy STORET Data Center (http://www.epa.gov/storpubl/legacy/gateway.htm, accessed June 12, 2003); Reference Tables for the Legacy Data Center (http://www.epa.gov/storpubl/legacy/ref_tables.htm, accessed June 12, 2003); and Reference Tables for the Modern STORET (ftp://ftp.epa.gov/storet/reference_tables/, accessed June 12, 2003).
U.S. Environmental Protection Agency. 2002. National Water Quality Inventory, 2000 Report. U.S. Environmental Protection Agency, EPA-841-R-02-001, Washington DC.
U.S. Environmental Protection Agency. 2001a. A Better Assessment Science Integrating Point and Nonpoint Sources (BASINS) Version 3.0. Office of Water, USEPA, EPA-823-8-01-001, Washington, DC.
U.S. Environmental Protection Agency. 2001b. PLOAD version 3.0, An ArcView GIS Tool to Calculate Nonpoint Sources of Pollution in Watershed and Stormwater Projects, User’s Manual. Office of Water, USEPA, Washington, DC.
U.S. Environmental Protection Agency. 2001c. Protocol for Developing Pathogen TMDLs. Office of Water, USEPA, EPA841-R-00-002, Washington DC.
166

U.S. Environmental Protection Agency. 2001d. EPA Requirements for Quality Assurance Project Plans. Office of Environmental Information, USEPA, EPA QA/R-5, EPA/240/B-01/00, Washington, DC.
U.S. Environmental Protection Agency. 2000a. Nutrient Criteria Technical Guidance Manual: Rivers and Streams. USEPA, EPA-822-B-00-002, Washington, DC.
U.S. Environmental Protection Agency. 2000b. Ambient Water Quality Criteria Recommendations, Information Supporting the Development of State And Tribal Nutrient Criteria for Rivers and Streams in Nutrient Ecoregion VI. USEPA, EPA-822-B-00-017, Washington, DC.
U.S. Environmental Protection Agency. 2000c. Guidance for Data Quality Assessment. Practical Methods for Data Analysis. Office of Environmental Information, USEPA, EPA QA/G-9, QA00 Update, EPA/600/R-96/084, Washington, DC.
U.S. Environmental Protection Agency. 1998. National Strategy for the Development of Regional Nutrient Criteria. Office of Water, USEPA, EPA-822-F-98-002, Washington, DC.
U.S. Environmental Protection Agency. 1997. Compendium of Tools for Watershed Assessment and TMDL Development. Office of Water, USEPA, USEPA841-B-97-006, Washington, DC.
U.S. Environmental Protection Agency. 1995. QUAL2E Windows Interface User’s Guide. Office of Water, USEPA, Washington, DC.
U.S. Environmental Protection Agency. 1992a. Drinking Water Regulations and Health Advisories (11/92). USEPA, Washington, DC, p. 11.
U.S. Environmental Protection Agency. 1992b. Toxic Substances Spreadsheet (12/92). Water Management Division, USEPA Region IV, Atlanta, GA.
U.S. Environmental Protection Agency. 1987. The Enhanced Stream Water Quality Models QUAL2E and QUAL2E-UNCAS. Environmental Research Laboratory, USEPA, EPA/600/3-87/007, Athens, GA.
U.S. Environmental Protection Agency. 1986. Quality Criteria for Water. USEPA, Office of Federal Regulations and Standards, 440/5-86-001, Washington, DC.
U.S. Environmental Protection Agency. 1974. The Relationships of Phosphorus and Nitrogen to the Trophic State of Northeast and North-central Lakes and Reservoirs. USEPA, National Eutrophication Survey Working Paper No 23, USEPA, Washington, DC.
U.S. Food and Drug Administration. 1991a. Compliance Policy Guide 7141.01, Pesticide Residues in Food or Feed – Enforcement Criteria, Attachment B.1, Aldrin and Dieldrin, Action Levels for Unavoidable Pesticide Residues in Food and Feed Commodities (4/1/87). Washington, DC., p. 2.
167

U.S. Food and Drug Administration. 1991b. Compliance Policy Guide 7141.01, Pesticide Residues in Food or Feed – Enforcement Criteria, Attachment B.3, Chlordane, Action Levels for Unavoidable Pesticide Residues in Food and Feed Commodities (11/20/89). Washington, DC., p. 2.
U.S. Food and Drug Administration. 1991c. Compliance Policy Guide 7141.01, Pesticide Residues in Food or Feed – Enforcement Criteria, Attachment B.5, DDT, TDE, and DDE, Action Levels for Unavoidable Pesticide Residues in Food and Feed Commodities (4/1/87). Washington, DC., p. 2.
U.S. Food and Drug Administration. 1990. Action Levels for Residues of Certain Pesticides in Food and Feed. Federal Register 55(74):14361-14362.
U.S. Geological Survey. 2003a. Water Resources Data Illinois, Water Year 2002. USGS, Water-Data Report IL-02, Urbana, IL.
U.S. Geological Survey. 2003b. National Hydrography Dataset home page (http://nhd.usgs.gov/, accessed August 18, 2003).
U.S. Geological Survey. 2003c. National Water Information System home page (http://waterdata.usgs.gov/nwis, accessed June 19, 2003).
U.S. Geological Survey. 2003d. The USGS Surface-Water Quality and Flow Modeling Interest Group, (SMIG). Archives of Models and Modeling Tools (http://smig.usgs.gov/SMIG/, accessed September 25, 2003).
U.S. Geological Survey. 2003e. USGS National Water Quality Assessment Data Warehouse (http://infotrek.er.usgs.gov/servlet/page?_pageid=543&_dad=portal30&_schema=PORTAL30, accessed August 29, 2003).
U.S. Geological Survey. 2000. U.S. GeoData Digital Elevation Models Fact Sheet 040-00 (http://mac.usgs.gov/mac/isb/pubs/factsheets/fs04000.html, accessed August 26, 2003).
Warren, L.A., and A.P. Zimmerman. 1994. The Influence of Temperature and NaCl on Cadmium, Copper, and Zinc Partitioning Among Suspended Particulate and Dissolved Phases in an Urban River. Water Resources 28(9):1921-1931.
Waters, T.F. 1995. Sediment in Streams: Sources, Biological Effects, and Control. American Fisheries Society, Monograph 7, Bethesda, MD.
WEFTEC. 2002. WEFTEC 02 Preview: Illinois Experts Discuss Latest Water Quality Issues. Water Environment & Technology 14(9):37-48.
Williams, J.R., C.A. Jones, and P.T. Dyke. 1984. A Modeling Approach to Determining the Relationship between Erosion and Soil Productivity. Transactions of the American Society of Agricultural Engineers 27(1):129-144.
168

Williams, J.R., A.D. Nicks, and J.G. Arnold. 1985. Simulator for Water Resources in Rural Basins. Journal of Hydraulic Engineering 111(6): 970-986.
Wool, T.A., R.B. Ambrose, J.L. Martin, E.A. Comer, 2003. Water Quality Analysis Simulation Program (WASP), Version 6.0, Draft User’s Manual. Environmental Research Laboratory, USEPA, Athens, GA (http://www.epa.gov/region4/water/tmdl/tools/WASP6_Manual.pdf, accessed August 23, 2003).
169


Appendix 1. Fox River Study Group Outreach Statement
Working Together Toward Sustainable Growth in the Fox River Watershed
The Fox River Watershed From its headwaters near Waukesha, the Fox River drains 938 square miles in southeastern Wisconsin prior to entering Illinois. Between the McHenry County/Wisconsin border and its junction with the Illinois River near Ottawa, the river runs for 115 miles and drains an additional 1,720 square miles. Although it is only 3% of the total area in Illinois, the watershed is home to about 450,000 people (11% of the state total); a number that is likely to increase by more than 30% over the next 20 years. The Fox River is a multi-purpose resource that contributes critical habitat for wildlife, serves as a valuable resource for recreation, receives and assimilates pollutants from point and non-point sources and provides source water for public water supplies. Habitat modifications may also play a significant role in the dynamics of the river. Because of the rapid pace of development in the Fox River watershed, maintaining these resources requires comprehensive planning. The Fox River Study Group
The Fox River Study Group (FRSG) is a diverse coalition of stakeholders working together to assess water quality in the Fox River watershed. Participants include Friends of the Fox River, Sierra Club, Fox River Water Reclamation District (Elgin), Fox Metro Water Reclamation District (Aurora), Fox River Ecosystem Partnership, Illinois Environmental Protection Agency (IEPA), Northeastern Illinois Planning Commission, as well as representatives from Algonquin, Aurora, Batavia, Crystal Lake, Elgin, Geneva, Island Lake, Kane County, Lake in the Hills, St. Charles and Yorkville.
The FRSG began meeting in the summer of 2001 to plan how to prepare for the upcoming Total Maximum Daily Load (TMDL) study on the River. A TMDL study is required by federal law because three segments of the Fox River appeared on the Illinois Environmental Protection Agency's list of impaired waters (the 1998 303(d) list). These segments, which lie between Holiday Hills and North Aurora, were listed because results from at least one water sample suggest there are water quality concerns. The most common concerns include low dissolved oxygen levels or high concentrations of fecal coliform bacteria. The 303(d) listing was updated in 2002, and now includes the entire length of the Fox River from the Wisconsin state line to the river’s mouth at Ottawa with the most numerous causes listed as flow alteration, habitat alteration, low dissolved oxygen, nutrients, organic enrichment, PCBs, siltation or suspended solids.
Although the emphasis in the original meetings was on monitoring water quality, it soon became clear that the FRSG presented a unique opportunity to foster sustainable growth throughout the watershed. To guide those efforts, the FRSG reached a consensus on the following work plan.
171

The Work Plan
The work plan is made up of four phases. Brief descriptions of the objectives of each phase, the schedule, and estimated costs are given in the table below. Phase I work is being conducted by the Illinois State Water Survey and funded by the IEPA. Part of the Phase II effort also began in April 2002 when the FRSG water quality monitoring program started collecting samples at seven sites along the Fox River. This program, an all-volunteer effort organized by the Fox River and Fox Metro water reclamation districts, was carefully designed to satisfy rigorous data quality requirements of the IEPA. Results from this program will be combined with results from Phase I to identify times and locations where additional information is needed. Those data, especially information describing how the watershed responds to storm events, will be used in Phase III to calibrate a model of the Fox River watershed.
The fourth and final phase of the work plan is to implement and maintain the watershed model as a management tool. The model will be used to:
• Ensure efficient use of taxpayer and private moneys on watershed projects
• Assess the effect of various development options throughout the watershed
• Educate stakeholders
• Evaluate management priorities
• Identify sensitive regions within the watershed
• Develop effective continuing monitoring programs Funding The estimated cost to complete the first three phases of the work plan is $1,560,000.
Phase Tasks Estimated Cost Schedule
I Critical and comprehensive review of existing water quality and quantity and land use data
$160,000 April 2002-
November 2003
II Design and implement watershed monitoring and initial modeling
$500,000 April 2002-begin monitoring
November 2003-July 2005 -develop model
III Watershed model calibration $900,000 August 2005-July 2008
IV Watershed model application and TMDL implementation
July 2008 onward
172

That total does not include costs of the all-volunteer FRSG monitoring program, conservatively estimated at $100,000. In Phase IV it will be important to continue monitoring to maintain and adapt the model to changes in the watershed. We expect those costs to average about $100,000 per year. Residents of and visitors to the Fox River watershed as well as all the receiving waters downstream from the Fox River will benefit from these efforts. All stake holders, including federal, state, local governments, corporate citizens and private foundations, who enjoy the benefits the Fox River watershed and will further benefit from sustainable growth in the the watershed need to share in the cost of the study, planning and adaptive management of the watershed.
The Fox River Study Group is currently seeking federal funding for Phase II of the work plan through the Watershed Initiative and other USEPA initiatives. The Group is soliciting local matching funds by asking Fox River Valley communities to budget 25¢ per capita into their yearly budgets to support the study. The towns of Aurora and Elgin, which take their drinking water from the Fox River, are being asked to contribute 50¢ per capita.
173


Appendix 2. FoxDB Data Dictionary
Primary Table Descriptions
The tables are grouped into five major groups with the table TBLIDLocations being an independent table used to signify the original location from which the data were acquired. The tables are grouped as project-related, parameter-related, results-related, and station-related tables that define codes within the main table. The groups of the main tables are: Project: TBLProjects_Programs (This is a definition group for TBLSample) Sample: TBLSample Station: TBLStation_Information (This is a definition group for TBLSample) Results: TBLResults Parameter: TBLParameter_Codes (This is a definition group for TBLResults) TBLIDLocations Column Name Description Data TypeIDLoc ID Code Nvarchar(1) ID_Description Location Data Acquired From Nvarchar(50)
Project-Related Tables: TBLProjects_Programs Column Name Description Data TypeProject_Code Unique value assigned Nvarchar(50)
Program_Project Name of the project for a particular monitoring effort Nvarchar(255)
Organization_ID Code of organization conducting the project. Lookup is TBLOrganization.
Int
Project_Study_Area Description of the project study area. Nvarchar(50) Project_Purpose Description of the project, type of monitoring and
intent, etc. Nvarchar(255)
Project_Start_Date Starting date of the project (MMDDYYY) Smalldatetime Project_End_Date Ending date of the project (MMDDYYY) Smalldatetime Contact_Name If appropriate/available Nvarchar(50) Contact_Phone If appropriate/available Nvarchar(12)
TBLProject_Grade Column Name Description Data TypeProject_Code Project Code Nvarchar(50) QAPPCode Parameter Groups (see TBLParameter_Groups)
within a Project assigned a Grade Int
QAPP_Grade Quality Grade assigned to Group by Project Int CU_Grade Comparability Grade assigned to Group by Project Int
175

TBLOrganization Column Name Description Data TypeOrganization _ID Unique four-digit number for the organization Int Organization_Code Unique identifier for a federal, state, local, or
independent entity. Examples: USEPA, IEPA, ISWS, USGS, Huff & Huff, and NIPC
Nvarchar(50)
Organization_Name Official name of the organization Nvarchar(255) Description Short narrative describing the organization Nvarchar(255) Contact_Name As available Nvarchar(50) Contact_Phone As available Nvarchar(12) Address If appropriate/available Nvarchar(50) Zip If appropriate/available Int Web_Site If appropriate/available Nvarchar(50)
TBLZip Column Name Description Data TypeZip Lookup for TBLOrganization Int City Nvarchar(50) State Nvarchar(2)
Station-Related Tables: TBLStation_Information Column name Description Data TypeStation_ID Unique identification for stations in the database Int Latitude Latitude in decimal degrees Float(53) Longitude Longitude in decimal degrees Float(53) Lat_Long_Accuracy Code describing accuracy and origin of latitude and
longitude for the station reference location. The lookup table is TBLLat_Long_Accuracy.
Nvarchar(2)
EPA_Station_Code The station code used by the USEPA and the IEPA. Not all stations have a code assigned by USEPA/IEPA.
Nvarchar(20)
USGS_Station_Code The station code used by the USGS. Not all stations have a code assigned by USGS.
Int
Station_Code1 Reserved for other organizations code Nvarchar(50) Station_Code2 Reserved for other organizations code Nvarchar(50) Place_Name_Description Descriptive information about the station site, such
as bridge/road names, nearby communities, or features.
Nvarchar(255)
TempRiver_Stream_Lake Location information from Legacy STORET data, a merge of the three station_name fields. For reference only.
Nvarchar(50)
Total Area Drainage area of river/stream or lake at the station, units of square miles, if available
Float(53)
Hydrologic_Unit_Code Eight-digit code assigned by the USGS. Int
176

Station_Type Code describing the feature where the station is located, e.g. river/stream, lake, wetland, etc. Lookup is TBLstoret_code. Same as new STORET.
Int
Water_Body_Name Common name of water feature where station is located. Feature name determined from NHD 1:100K GIS coverage and/or RF3.
Nvarchar(50)
RF3_River_Reach RF3 Reach Code of a reach where station is located. Nvarchar(50) NHD_24K_River_Reach NHD Reach Code of a reach where station is located. Nvarchar(50) Ambnt Indicates whether station is ambient Char(1)
TBLStation_Type Column Name Description Data TypeStation_Type Links to Station Primary Type Int Primary_Type Letter code describing the feature where the station
is located, e.g. river/stream, lake, wetland, etc. Lookup is TBLstoret_code. Same as new STORET.
Nvarchar(50)
Secondary_Type Letter code, further describing the feature where the station is located, e.g., type of wetland, etc. Lookup is TBLstoret_code. Same as new STORET.
Nvarchar(50)
Natural_Indicator_Type Single character describing station site, Y= natural feature, N= artificial/manmade feature. Same as new STORET.
Nvarchar(1)
TBLLandUsage Column Name Description Data TypeStation_ID Int Land_Use Description (only available for select Stations) Nvarchar(50) Land_Use_Code Code for Description Nvarchar(5)
TBLLat_Long_Accuracy Column Name Description Data TypeLat_Long_Accuracy_ Code
Code to Link with Station Table Nvarchar(2)
Accuracy_Description Describes Accuracy of Latitude and Longitude Nvarchar(250) Sample-Related Tables: TBLSample Column Name Description Data TypeIDLoc Code to identify original data source from which the
data was retrieved. Lookup table is TBLIDLocations.
Nvarchar(1)
Sample_Code Unique sample identification number, number assigned if not provided by data originator. A sample is a monitoring activity (e.g., ambient samples, measurements, observations) that is performed at a specific date, time, and location in order to characterize the environment.
Int
177
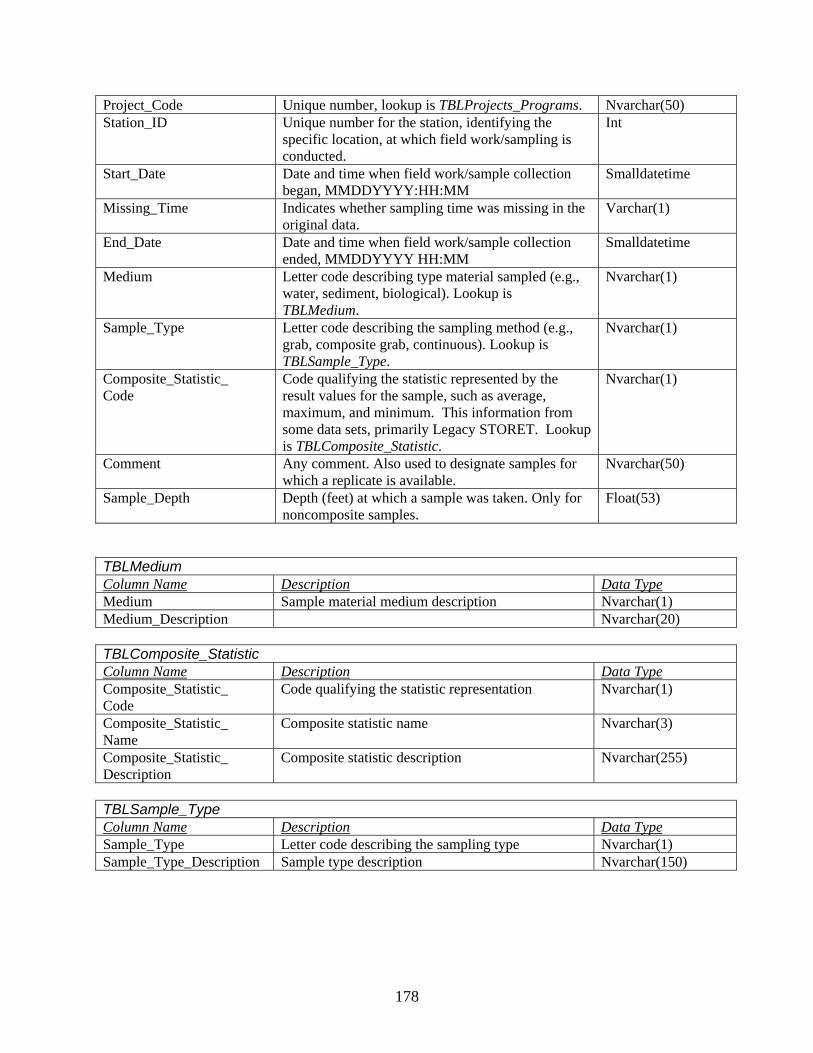
Project_Code Unique number, lookup is TBLProjects_Programs. Nvarchar(50) Station_ID Unique number for the station, identifying the
specific location, at which field work/sampling is conducted.
Int
Start_Date Date and time when field work/sample collection began, MMDDYYYY:HH:MM
Smalldatetime
Missing_Time Indicates whether sampling time was missing in the original data.
Varchar(1)
End_Date Date and time when field work/sample collection ended, MMDDYYYY HH:MM
Smalldatetime
Medium Letter code describing type material sampled (e.g., water, sediment, biological). Lookup is TBLMedium.
Nvarchar(1)
Sample_Type Letter code describing the sampling method (e.g., grab, composite grab, continuous). Lookup is TBLSample_Type.
Nvarchar(1)
Composite_Statistic_ Code
Code qualifying the statistic represented by the result values for the sample, such as average, maximum, and minimum. This information from some data sets, primarily Legacy STORET. Lookup is TBLComposite_Statistic.
Nvarchar(1)
Comment Any comment. Also used to designate samples for which a replicate is available.
Nvarchar(50)
Sample_Depth Depth (feet) at which a sample was taken. Only for noncomposite samples.
Float(53)
TBLMedium Column Name Description Data TypeMedium Sample material medium description Nvarchar(1) Medium_Description Nvarchar(20)
TBLComposite_Statistic Column Name Description Data TypeComposite_Statistic_ Code
Code qualifying the statistic representation Nvarchar(1)
Composite_Statistic_ Name
Composite statistic name Nvarchar(3)
Composite_Statistic_ Description
Composite statistic description Nvarchar(255)
TBLSample_Type Column Name Description Data TypeSample_Type Letter code describing the sampling type Nvarchar(1) Sample_Type_Description Sample type description Nvarchar(150)
178

Results-Related Tables: TBLResults Column Name Description Data TypeSample_Code Unique sample identification number, number
assigned if not provided by data originator. A sample is a monitoring activity (e.g., ambient samples, measurements, and observations) performed at a specific date, time, and location in order to characterize the environment.
Int
Parameter_Code Five-digit, zero-filled code used by USEPA and USGS for the characteristic measured. The lookup table is TBLParameter_Codes. Units of measurement are specified with the code. A parameter is the substance or property being measured.
Int
Result_Value Data value for a sample result or a code representing an observation. Result values can be numeric or alphanumeric values.
Float(53)
Remark_Code A single character code and definition used to further quantify a result. Lookup is TBLResults_Remarks for code descriptions.
Nvarchar(1)
Grade Used to flag questionable data. Nvarchar(2) IDLOC Code to identify original data source from which
data were retrieved. Lookup is TBLIDLocations. Nvarchar(1)
Comments Nvarchar(50) TBLResults_Val_NonNumeric Column Name Description Data TypeSample_Code Unique sample identification number, number
assigned if not provided by data originator. A sample is a monitoring activity (e.g., ambient samples, measurements, and observations) performed at a specific date, time, and location in order to characterize the environment.
Int
Parameter_Code Five-digit, zero-filled code used by USEPA and USGS for the characteristic measured. Lookup is TBLParameter_Codes. Units of measurement are specified with the code. A parameter is the substance or property being measured.
Int
Result_Value Data value for a sample result or a code representing an observation. Result values can be numeric or alphanumeric values.
Nvarchar(5)
Remark_Code A single character code and definition used to further quantify a result. Lookup is TBLResults_Remarks for code descriptions.
Nvarchar(1)
179
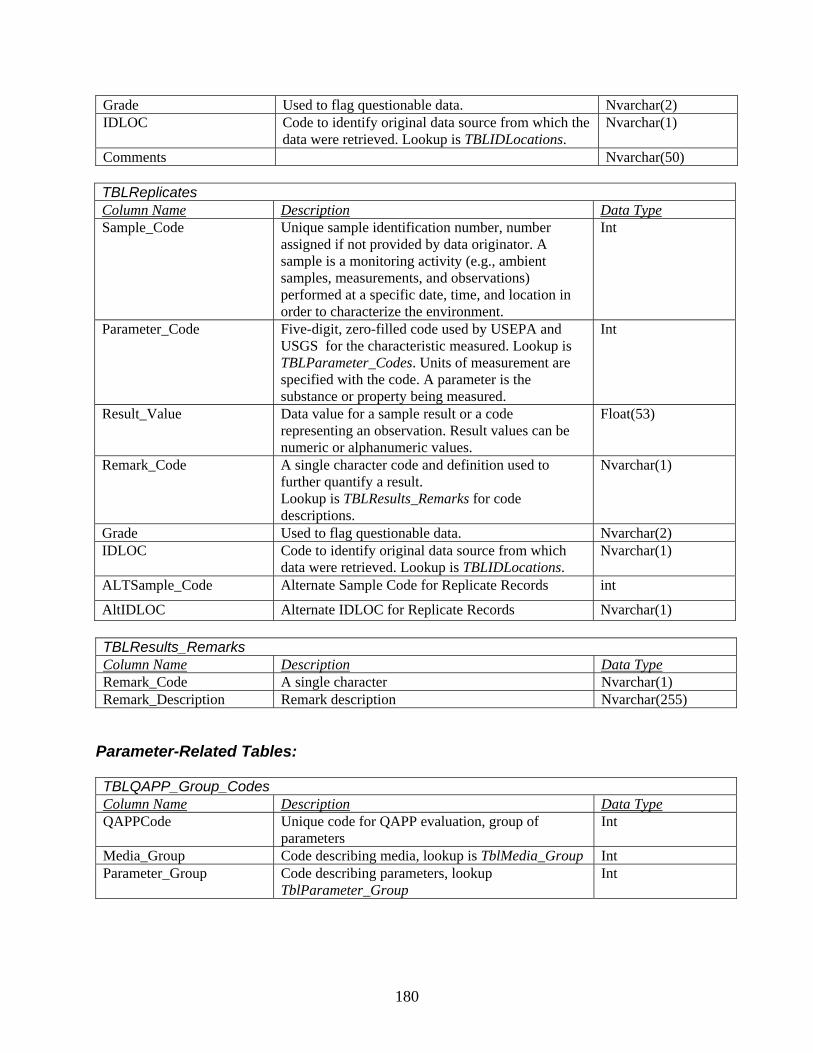
Grade Used to flag questionable data. Nvarchar(2) IDLOC Code to identify original data source from which the
data were retrieved. Lookup is TBLIDLocations. Nvarchar(1)
Comments Nvarchar(50) TBLReplicates Column Name Description Data TypeSample_Code Unique sample identification number, number
assigned if not provided by data originator. A sample is a monitoring activity (e.g., ambient samples, measurements, and observations) performed at a specific date, time, and location in order to characterize the environment.
Int
Parameter_Code Five-digit, zero-filled code used by USEPA and USGS for the characteristic measured. Lookup is TBLParameter_Codes. Units of measurement are specified with the code. A parameter is the substance or property being measured.
Int
Result_Value Data value for a sample result or a code representing an observation. Result values can be numeric or alphanumeric values.
Float(53)
Remark_Code A single character code and definition used to further quantify a result. Lookup is TBLResults_Remarks for code descriptions.
Nvarchar(1)
Grade Used to flag questionable data. Nvarchar(2) IDLOC Code to identify original data source from which
data were retrieved. Lookup is TBLIDLocations. Nvarchar(1)
ALTSample_Code Alternate Sample Code for Replicate Records int
AltIDLOC Alternate IDLOC for Replicate Records Nvarchar(1) TBLResults_Remarks Column Name Description Data TypeRemark_Code A single character Nvarchar(1) Remark_Description Remark description Nvarchar(255)
Parameter-Related Tables: TBLQAPP_Group_Codes Column Name Description Data TypeQAPPCode Unique code for QAPP evaluation, group of
parameters Int
Media_Group Code describing media, lookup is TblMedia_Group Int Parameter_Group Code describing parameters, lookup
TblParameter_Group Int
180

TBLQAPPGroups Column Name Description Data TypeQAPPCode Unique code for QAPP evaluation, group of
parameters Int
Parameter_Code Five-digit code assigned to the QAPPCode Int TBLReporting_Units Column Name Description Data TypeReporting_Units Reporting unit Nvarchar(1) Reporting_Units_ Description
Reporting units description Nvarchar(255)
TBLEPA_Group_Code Column Name Description Data TypeEPAGroup_Code Group code from original Legacy data Int EPAGroup_Description From Legacy description of code Nvarchar(255)
TBLParameter_Codes Column name description Data TypeParameter_Code Five-digit code Int EPAGroup_Code USEPA Group code Int Reporting_Units Reporting units Nvarchar(1) Decimal_Point Decimal point Int Short_Name Short name Nvarchar(100) Full_Name Full name Nvarchar(255)
TBLParameterCAS Column Name Description Data TypeParameter_Code Parameter code Int CASNum CAS # (Chemical Abstract Number) Nvarchar(50)
TBLParameter_Group Column name Description Data TypeParameter_Group Defined for QAPP Grade Int First_Order_Parameter_ Group
A general Parameter Group defined for QAPP evaluation
Nvarchar(50)
Second_Order_Parameter_Group
A specific Parameter Group defined for QAPP evaluation
Nvarchar(50)
TBLMedia_Group Column name Description Data TypeMedia_Group Defined for QAPP Grade Int Media_Group_ Description
Describes medium Nvarchar(50)
181


Appendix 3. Importing Data to FoxDB from USGS and EPA Databases
The U.S. Geological Survey (USGS), the U.S. Environmental Protection Agency (USEPA), and the Illinois Environmental Protection Agency (IEPA) have long-term, routine water quality data collection programs. The USGS and the USEPA maintain standard databases to archive data. This appendix provides information on how data from these national databases were imported into the FoxDB. Not all fields in the national databases are listed in the following tables. Some fields in the Legacy STORET records did not contain any data for the Fox River watershed stations, some code values were not used, and some information was not relevant to the current study; thus, equivalent fields or codes in the FoxDB do not exist. This appendix is not meant to provide instructions for accessing the data, those are provided at the respective Web sites, but rather to show the relationship between data fields used in the national databases and tables and fields in the FoxDB database.
The USGS collects water quality data that may be accessed through the National Water
Information System Web site (NWISWeb, http://waterdata.usgs.gov/nwis/nwis). Water quality sample information may be retrieved on the basis of user-selected search criteria, such as hydrologic unit or station number. Each data record includes, but is not limited to the USGS station number, the date, the parameter, and the result value. Listed in Table A3.1 are the fields and descriptions that document USGS data fields imported to the FoxDB, and how these fields appear in the FoxDB. The USGS field names and their descriptions are listed in the first two columns of Table A3.1, and the corresponding table and field name in the FoxDB are listed in the last two columns.
There are some special cases. Both the USGS database and the FoxDB have a field to
enter information qualifying a result value. The USGS database field remark_cd has a lookup table with definitions of the codes used in this field. Somewhat different codes are used in the FoxDB. Table A3.2 lists the USGS code and the equivalent code in the FoxDB. Likewise, the field medium_cd has a corresponding lookup table with code definitions; however, all data retrieved for import to the FoxDB had a value of 9 in this field. The USGS NWIS defines a 9 in the medium_cd field as: “surface water, water on the surface of the earth stored or transported in rivers, streams, estuaries, lakes, ponds, swamps, glaciers or other aquatic areas. It also may refer to water in urban drains and storm-sewer systems.” In the FoxDB this information is documented by entering a value of W, for Medium in TBLSample (W is the code for water in the FoxDB).
The USEPA and the IEPA collect a variety of water quality data. Eventually these data
will be regularly posted at the USEPA Website (http://www.epa.gov/storet/dbtop.html). Water quality sample information provided to the USEPA prior to 1999 may be retrieved from the STORET Legacy Data Center (Legacy). Data submitted to the USEPA from 1999 on will be posted in the “modernized” STORET (also called the new STORET database). However, at the time of this study, data collected in 1999 and later in the Fox River watershed were not available through the “new” STORET database and were acquired directly from the IEPA in various formats. The following discussion relates only to the electronic data retrieved from the Legacy Data Center.
183

Table A3.1. USGS NWIS Data Fields Imported to the FoxDB
USGS field name USGS field description
FoxDB table name
FoxDB field name
agency_cd Agency code TBLOrganization Organization_Code
site_no Site identification number TBLStation_Information USGS_Station_Code
station_nm Site name TBLStation_Information Place_Name_Description dec_lat_va Decimal latitude TBLStation_Information Latitude dec_long_va Decimal longitude TBLStation_Information Longitude
coord_acy_cd Latitude-longitude accuracy
TBLStation_Information
Lat_Long_Accuracy_Code
huc_cd Hydrologic unit code TBLStation_Information Hydrologic_Unit_Code drain_area_va Drainage area TBLStation_Information Total_Area sample_dt Date of sample TBLSample Start_Date (date and time) sample_tm Time of sample TBLSample Start_Date (date and time) parameter_cd Parameter Code TBLResults Parameter_Code result_va Value TBLResults Result_Value remark_cd Remark Code TBLResults Remark_Code
qa_cd Quality Assurace Code Used to assign QAPP grade
qw_method_cd Quality Assurance Method Used to assign QAPP grade
result_sg Results significant figure TBLParameter_Codes Decimal_Point
medium_cd Sample medium code TBLSample Medium Table A3.2. USGS NWIS remark_cd and FoxDB Remark_Code Equivalents USGS NWIS remark_cd
Description
FoxDB Remark_Code
< Actual value is known to be less than the
value shown. K
> Actual value is known to be greater than the value shown.
L
A Average value A E Estimated value J M Presence of material verified but not
quantified M
N Presumptive evidence of presence of material
N
U Analyzed for, not detected U
184

Through the Legacy Data Center option at the USEPA Web site given above, users may identify search criteria, such as hydrologic unit or station number to retrieve data on line. Each data record includes, but is not limited to, USEPA/IEPA station number, station descriptors, date, parameter, and result value. This appendix is not meant to provide instructions for accessing the Legacy data, but rather to show how data retrieved from this source were imported to the FoxDB.
Fields and descriptions that document the Legacy data fields that were imported to the
FoxDB, and how they appear in the FoxDB are listed in Table A3.3. The Legacy field names are listed in the first column of Table A3.3, and the corresponding table and field name in the FoxDB are listed in the last two columns.
Information given in the Legacy Station Location Name 1, Station Location Name 2, and
Station Location Name 3 fields were reviewed and used to populate the FoxDB fields in TBLStation_Information, Place_Name_Description and Water_Body_Name. Entries in the Legacy STORET Station Type Code field are a combination of codes. Information recorded for stations in the Fox River watershed and subsequently included in the FoxDB are listed in the first column of Table A3.4, and the corresponding entries in the FoxDB tables and fields are listed in the remaining columns.
Many fields were not populated for any record; thus, many fields that are part of the
Legacy database are omitted from the lists in the following tables. Some fields had a variety of possible values, but only one value occurred in the retrieved data. For example, in the only value found (other than blank, no information) the Primary Activity Category was T, temporal composite. Table A3.5 lists other values that Legacy STORET defines for this field and how these fields appear in the FoxDB. The Secondary Activity Category is another example where only one value occurred: water. The information coded was sometimes ambiguous; for example, the Composite Method Code field was blank (no information) or had values of B: “Samples are not composited. Sample is a simple grab sample. STORET also used this code for noncomposite replicate samples.” If B was recorded for a sample, the results listed for the sample were reviewed to determine if, in fact, they were replicates, and then imported to the FoxDB accordingly. There are some duplications of information in the Legacy scheme, and data entry in some fields is not consistent.
185

Table A3.3. USEPA Legacy STORET Data Fields Imported to the FoxDB
Legacy STORET Field
FoxDB Table
FoxDB Field
Organization Code TBLOrganization Organization_Code Organization Name TBLOrganization Organization_Name Primary Station ID TBLStation_Information EPA_Station_Code Secondary ID #1 TBLStation_Information stationcode1 Secondary ID #2 TBLStation_Information Stationcode2
Station Location Name 1 TBLStation_Information Place_Name_Description and Water_Body_Name
Station Location Name 2 TBLStation_Information Place_Name_Description and Water_Body_Name
Station Location Name 3 TBLStation_Information Place_Name_Description and Water_Body_Name
Latitude TBLStation_Information Latitude Longitude TBLStation_Information Longitude Hydrologic Unit Code TBLStation_Information Hydrologic_Unit_Code Legacy STORET Station Type Code (See Table A2B.4) TBLStation_Information
Station_Type See Table A3.4
Sample Code TBLSample Sample_Code Start Date TBLSample Start_Date (date and time) End Date TBLSample End_Date (date and time) Composite Method Code TBLSample Sample_Type Sample Depth TBLSample Sample_Depth Start Time TBLSample Start_Date (date and time) End Time TBLSample End_Date (date and time)
Primary Activity Category TBLSample TBLProjects_Programs See Table A3.5
Secondary Activity Category TBLSample Medium Parameter Code TBLResults Parameter_Code Parameter Long Name TBLParameter_Codes Full_Name Result Value TBLResults Result_Value Remark Code TBLResults Remark_Code Composite Statistic Code TBLSample Composite_Statistic_Code
186

Table A3.4. Legacy STORET Station Type and FoxDB Translation
FoxDB Translation
TBLStation_ Information TBLSample
Legacy STORET Station Type
Station_ Primary_
Type
Station_ Secondary_
Type
Ambnt
Medium TYPA/AMBNT/STREAM/BIO River/Stream N/A Y (yes) Biological SEWER/TYPA/MUN/OUTFL/ NONAMB/PIPE Facility (1) N (no) (2) AMBNT/STREAM River/Stream N/A Y (yes) (2) SEWER/TYPA/MUN/OUTFL/ NONAMB Facility (1) N (no) (2) TYPA/AMBNT/STREAM River/Stream N/A Y (yes) (2) TYPA/AMBNT/LAKE Lake N/A Y (yes) (2) Notes: 1. Use station description to determine Municipal Sewage or Municipal Water supply. 2. Value determined from parameters sampled. N/A not applicable (no secondary type available).
Table A3.5. Interpretation of Legacy Primary Activity Category to FoxDB Tables and Fields
Legacy STORET FoxDB
Code Primary_Activity_ Category
TBLSample Medium
TBLSample Sample_Type
TBLProject_ProgramsProject_Purpose
C Effluent Permit Condition effluent monitoring
L Biological Sample Biological J Tissue Biological Fish tissue S Spatial Composite Spatial composite T Temporal Composite Temporal Composite
B Both Spatial and Temporal Composite
F Flow Proportional Flow proportional G Grab Sample Grab sample D Replicate Moved to Replicate table
187


Appendix 4. FoxDB Data Loader & Viewer Program
A Visual Basic program was created for data entry to the Microsoft (MS) Access
database, FoxDB. There are options to view selected tables in the FoxDB, primarily to aid with data entry, but they also provide a means for persons not familiar with MS Access to view the data. The program is called FoxDB Data Loader & Viewer and may be downloaded from the Fox River Waterhsed Investigation Web site (http://ilrdss.sws.uiuc.edu/fox). The readme file that accompanies the program files describes how to install the program and how to link to the FoxDB MS Access file. It is strongly recommended that the reader be familiar with the structure of the FoxDB before using the program. The FoxDB is described in Chapter 4, and the data dictionary for the tables is provided in Appendix 2.
When the Data Loader & Viewer program is run, there are viewing screens for project,
station, sample, and results records. Data entry screens are used to add sample records and results records. The program includes screens to export the information from the database in a way that can be easily imported into another (master) copy of the database.
When the program is started, the user must click on Data on the upper task bar and then
may choose to View or Add Data or Export. When View or Add Data is selected the Sample screen is displayed automatically. Tabs displayed at the top of the screen can be selected to access other screens. Other screens may be activated by clicking on the tab at the top of the screen. Four screen options for viewing data in the FoxDB are:
View Projects View Stations View Samples View Results
Data is entered by first creating a sample from the Sample screen. Results are entered individually for each parameter from the Results screen. Tabs for these screens are labeled
Sample Results
Viewing Data
Screens are available for viewing data. The user must select the corresponding tab to enable screens for viewing of projects, stations, samples and results.
189

Projects cannot be added or changed through the Loader & Viewer program. They are preloaded and may be viewed under the View Projects tab shown in Figure A4.1.
Figure A4.1. View project screen
190

The View Station screen is shown in Figure A4.2. The user can search for a station by Project, Location, or Water Body name by checking the box next to the search category. The Location search uses the “place_name_description” field in the database. For example, by entering Poplar, the user finds all the stations with Poplar in the place name description field.
Figure A4.2. View station screen
191

Information about samples may be viewed by selecting View Samples. The user can select samples to view by Date, Station, or Project (Figure A4.3).
Figure A4.3. View sample screen
192

Results for a particular sample can be displayed. At the View Results screen (Figure A4.4), the user enters the sample number, and clicks on the Load Results button.
Figure A4.4. View results screen
Entering Data
The following images show the screens to enter new samples and results. Pull-down menus are available for fields that are looked up from other tables. A sample must be established in the FoxDB before results are entered.
193

Sample Entry Screen
Through the Sample screen, (Figure A4.5) the user specifies the Station, Project, Sample Type, Composite Statistic, and Medium, and then enters the Start Date and Time. If the time is not known, the user checks Missing Time. When the Update button is selected, the “new” sample is created in the FoxDB and the Results screen opens.
Entries also may be edited from this screen. The sample may be located by selecting the
project or station of interest from the Project and Station pull-down menus, then clicking on the Load Results button. Arrow keys may be used to move from sample to sample. When the sample is located, the user presses the Update button to select the sample. An entire sample can be deleted, or the user can go to the Results screen to add additional data or correct entries.
Figure A4.5. Sample screen
194

Results Entry Screen Results may be entered on the next screen (Figure A4.6). When a sample is selected, the
descriptive information appears on the left part of the screen. A “sample” must exist in the database before results can be entered. If a sample was just entered, the information automatically will be entered on the left part of the screen. The user also may search for a sample to enter additional results. A date must be chosen within the box on the left, and then the Find Sample button will search for all samples with that date. Arrows allow the user to page through the samples listed.
To enter a value for a parameter, the parameter is selected and the result value entered.
There are several ways to select a parameter. A parameter can be selected from the pull-down menu under Parameter Code, or a search may be done using the Partial Parameter Name button to find all parameters containing the text entered in the adjacent field. For example, to find all parameters containing the word “oxygen” in the parameter name, the user enters “oxygen” in the blank field and clicks on the Partial Parameter Name button. This will search the Parameter Full Name field of the FoxDB, and parameters found will be listed in the pull-down menu. The user can enter the five-digit parameter code in the Parameter code field, and then use the pull-down menu to select the parameter. If the “Replicates” box is checked, the value will be added to the table (TBLReplicates).
Figure A4.6. Results screen 195

Data Export
The purpose of this option is to permit data entry at multiple sites. These data can be exported to a master database. Exported data is written to four comma-delimited files (Figure A4.7). Files created during Export are:
• Sample File • Results File • Nonnumeric Results File • Replicates File
When the user selects the export option from the opening screen of the program, there are two options for selection of data to export. One option is to export all data entered by the user. The user selects all records to exercise this option. Alternatively, the user may enter a date, and all data with that sample date or a later date will exported. Data is entered in the box next to the From prompt. For example, all Fox River Study Group records then will be written to the files. If All Records is not selected, the user must select a date from the pull-down menu to export all records from the specified date.
Figure A4.7. Export data screen
196

Appendix 5. Fox River Study Group Interim Monitoring Evaluation
Submitted to Fox River Study Group 26 March 2003
Introduction
The purpose of this report is to review data collected by the Fox River Study Group (FRSG) from April to December 2002 and evaluate the monitoring design. Statistic analyses were carried out with selected results presented in this report (details available upon request). While a complete review and recommendations will be provided in final report, analyses related directly to the FRSG data are summarized and presented to the FRSG to facilitate their decision on continuation or changes to data collection.
Existing Design Study Design
The FRSG monitoring is designed as systematic sampling. Sites are sampled bi-weekly, every other Tuesday at 10 am. Systematic sampling gives excellent results when evaluating long-term trends. It is less suitable for evaluating runoff related problems than event related sampling. Current sampling design does not address problems related to CSOs, urban, or agricultural runoff. For example, evaluating compliance with IEPA standards for pathogens requires “a minimum of five samples taken over not more than a 30 day period.”
Figure 1 shows average daily flow at the Algonquin gaging station (USGS 0555000) over
the period sampled by the FRSG with the FRSG sampling dates marked (flow is on logarithmic scale). Many sampling dates and all those before September 12, 2002, are associated with runoff events of various magnitudes. Flow measured at Algonquin, South Elgin, and Dayton USGS gaging sites show flow conditions were above average from April to June 2002 and below average from July to December 2002. Water quality can change rapidly during runoff events with receding and raising portions of hydrograph yielding different concentrations for the same flow. Thus, a single sample is not representative of the mean concentration during the event. Flow proportional sampling is recommended to evaluate average event concentration or load associated with the event.
100
1000
10000
31-J
an
28-F
eb
28-M
ar
25-A
pr
23-M
ay
20-J
un
18-J
ul
15-A
ug
12-S
ep
10-O
ct
7-N
ov
5-D
ec
2-Ja
n
30-J
an
27-F
eb
27-M
ar
05550000 FOX RIVER AT ALGONQUIN, IL
FRSG Sampling
Figure 1. Flow at Algonquin site and the FRSG sampling dates. Flow in cfs on logarithmic scale.
197

Station Locations
The sites monitored by the FRSG correspond to IEPA ambient water quality sites. Figure 2 shows location of the FRSG sites as well as stream network and facilities with NPDES permits (1998 - present). NPDES facilities are classified by average design flow (mgd). Only stations with average design flow greater than 0.3 mgd and geographical information available are displayed. Information on NPDES facilities was downloaded from the USEPA EnviroFacts Data Warehouse.
The FRSG sites capture individual effects of most point sources displayed. However,
there are several major NPDES facilities as well as tributaries on a reach between the Algonquin and Elgin monitoring sites. Their effect cannot be separated within the present monitoring locations.
LegendNPDES permits (after 1998)
Flow_RateY
Y
Y
Y
0.3 - 1.0
1.0 - 2.5
2.5 - 6.0
> 6.0
[ FRSG monitoring sites
[
[
[
[
[X
X
X
X
Y
Y
Y
Y
Elgin (FRSG_04)
Geneva (FRSG_03)
Rt. 176 (FRSG_06)
Johnsburg (FRSG_07)
Yorkville (FRSG_01)
[
[
X
XX
XX
X
X X
XXX
X
X
XX
XX
Y
Y
Y
Y
Y
Y
Y
Y
Y
YY Y
Y
Y
YY
Y
Y
Y
YY
Y
Y
Y
Y
Y
Y
Y
Y
Y
X
X
X
X
X
X
X
Algonquin (FRSG_05)
Montgomery (FRSG_02)
Figure 2. Location of FRSG monitoring sites with respect to point sources
and the Fox River tributaries. Flow rate in mgd.
198
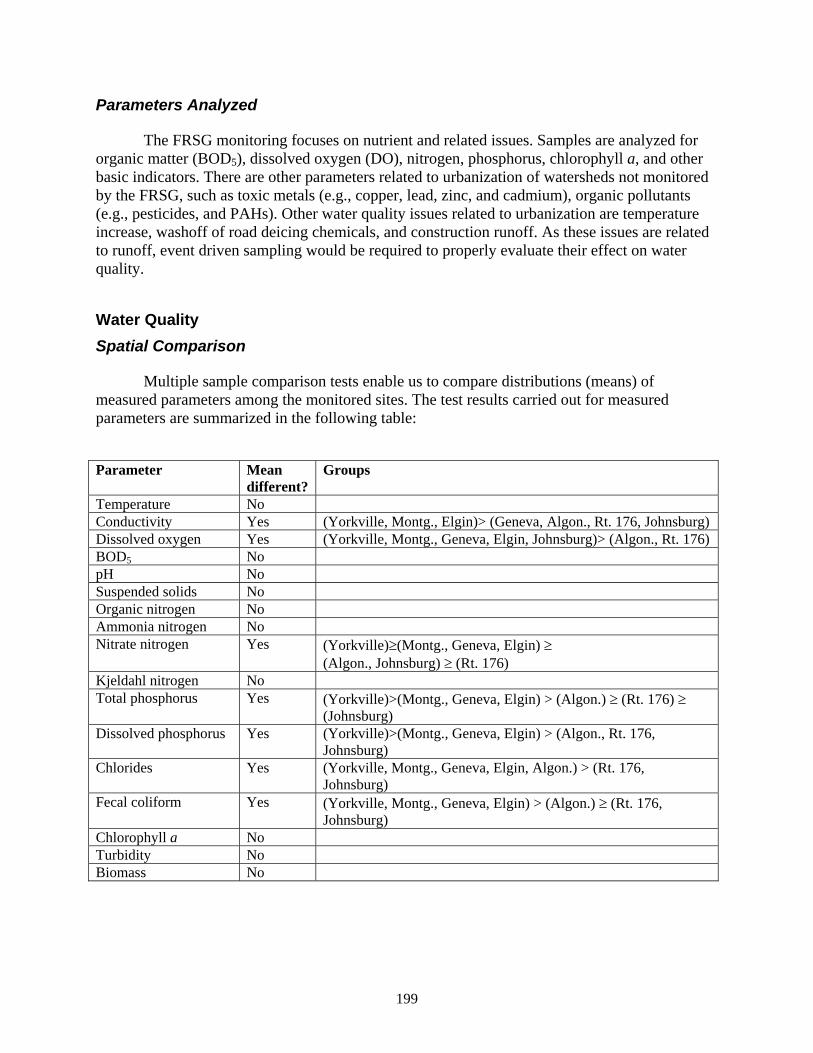
Parameters Analyzed
The FRSG monitoring focuses on nutrient and related issues. Samples are analyzed for organic matter (BOD5), dissolved oxygen (DO), nitrogen, phosphorus, chlorophyll a, and other basic indicators. There are other parameters related to urbanization of watersheds not monitored by the FRSG, such as toxic metals (e.g., copper, lead, zinc, and cadmium), organic pollutants (e.g., pesticides, and PAHs). Other water quality issues related to urbanization are temperature increase, washoff of road deicing chemicals, and construction runoff. As these issues are related to runoff, event driven sampling would be required to properly evaluate their effect on water quality.
Water Quality Spatial Comparison
Multiple sample comparison tests enable us to compare distributions (means) of measured parameters among the monitored sites. The test results carried out for measured parameters are summarized in the following table: Parameter Mean
different? Groups
Temperature No Conductivity Yes (Yorkville, Montg., Elgin)> (Geneva, Algon., Rt. 176, Johnsburg) Dissolved oxygen Yes (Yorkville, Montg., Geneva, Elgin, Johnsburg)> (Algon., Rt. 176) BOD5 No pH No Suspended solids No Organic nitrogen No Ammonia nitrogen No Nitrate nitrogen Yes (Yorkville)≥(Montg., Geneva, Elgin) ≥
(Algon., Johnsburg) ≥ (Rt. 176) Kjeldahl nitrogen No Total phosphorus Yes (Yorkville)>(Montg., Geneva, Elgin) > (Algon.) ≥ (Rt. 176) ≥
(Johnsburg) Dissolved phosphorus Yes (Yorkville)>(Montg., Geneva, Elgin) > (Algon., Rt. 176,
Johnsburg) Chlorides Yes (Yorkville, Montg., Geneva, Elgin, Algon.) > (Rt. 176,
Johnsburg) Fecal coliform Yes (Yorkville, Montg., Geneva, Elgin) > (Algon.) ≥ (Rt. 176,
Johnsburg) Chlorophyll a No Turbidity No Biomass No
199
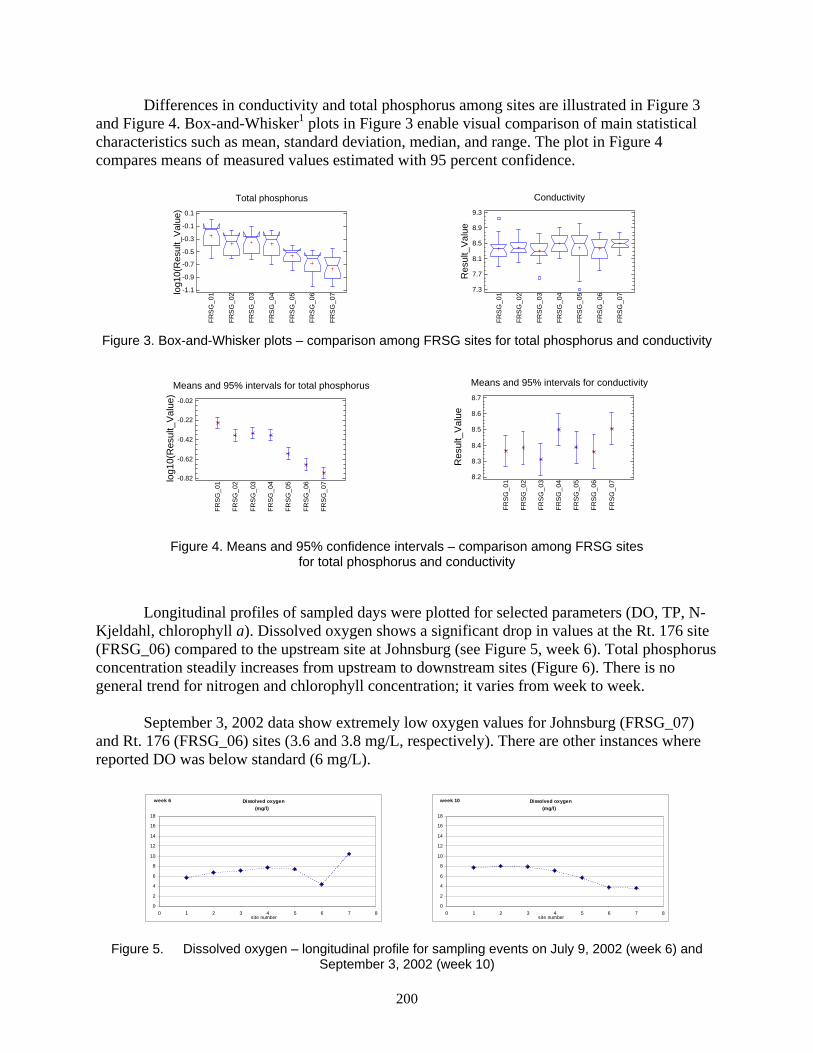
Differences in conductivity and total phosphorus among sites are illustrated in Figure 3 and Figure 4. Box-and-Whisker1 plots in Figure 3 enable visual comparison of main statistical characteristics such as mean, standard deviation, median, and range. The plot in Figure 4 compares means of measured values estimated with 95 percent confidence.
Total phosphorus
log1
0(R
esul
t_V
alue
)
FRSG
_01
FRSG
_02
FRSG
_03
FRSG
_04
FRSG
_05
FRSG
_06
FRSG
_07-1.1
-0.9
-0.7
-0.5
-0.3
-0.1
0.1
Conductivity
Res
ult_
Valu
e
FRSG
_01
FRSG
_02
FRSG
_03
FRSG
_04
FRSG
_05
FRSG
_06
FRSG
_07
7.3
7.7
8.1
8.5
8.9
9.3
Figure 3. Box-and-Whisker plots – comparison among FRSG sites for total phosphorus and conductivity
Means and 95% intervals for total phosphorus
log1
0(R
esul
t_V
alue
)
FRS
G_0
1
FRS
G_0
2
FRS
G_0
3
FRS
G_0
4
FRS
G_0
5
FRS
G_0
6
FRS
G_0
7
-0.82
-0.62
-0.42
-0.22
-0.02
Means and 95% intervals for conductivity
Res
ult_
Val
ue
FRSG
_01
FRSG
_02
FRSG
_03
FRSG
_04
FRSG
_05
FRSG
_06
FRSG
_07
8.2
8.3
8.4
8.5
8.6
8.7
Figure 4. Means and 95% confidence intervals – comparison among FRSG sites for total phosphorus and conductivity
Longitudinal profiles of sampled days were plotted for selected parameters (DO, TP, N-Kjeldahl, chlorophyll a). Dissolved oxygen shows a significant drop in values at the Rt. 176 site (FRSG_06) compared to the upstream site at Johnsburg (see Figure 5, week 6). Total phosphorus concentration steadily increases from upstream to downstream sites (Figure 6). There is no general trend for nitrogen and chlorophyll concentration; it varies from week to week.
September 3, 2002 data show extremely low oxygen values for Johnsburg (FRSG_07)
and Rt. 176 (FRSG_06) sites (3.6 and 3.8 mg/L, respectively). There are other instances where reported DO was below standard (6 mg/L).
Dissolved oxygen
0
2
4
6
8
10
12
14
16
18
0 1 2 3 4 5 6 7 8
week 6
site number
(mg/l)
Dissolved oxygen
0
2
4
6
8
10
12
14
16
18
0 1 2 3 4 5 6 7 8
week 10
site number
(mg/l)
Figure 5. Dissolved oxygen – longitudinal profile for sampling events on July 9, 2002 (week 6) and September 3, 2002 (week 10)
200

Total phosphorus
0
0.2
0.4
0.6
0.8
1
1.2
0 1 2 3 4 5 6 7 8
week 6
site number
(mg/l)
Total phosphorus
0
0.2
0.4
0.6
0.8
1
1.2
0 1 2 3 4 5 6 7 8
week 10
site number
(mg/l)
Figure 6. Total phosphorus – longitudinal profile for sampling events on July 9, 2002 (week 6)
and September 3, 2002 (week 10)
Relation with Flow
Parameters were plotted against the flow. Figure 7 shows a decrease in total phosphorus concentration with increasing flow. This indicates prevalence of point source contributions of phosphorus in the watershed. Higher nitrogen (Kjeldahl) concentrations are also associated with lower flows, although the relationship is not as obvious as for phosphorus (Figure 8). Conductivity, chlorides, and fecal coliform follow the same general trend of increasing concentrations with decreasing flows.
(a)
Plot of log10(P665) vs log10(Flow)
log10(Flow)
log1
0(P
665)
2.3 2.6 2.9 3.2 3.5 3.8-0.8
-0.7
-0.6
-0.5
-0.4
(b)
Plot of log10(P665) vs log10(Flow)
log10(Flow)
log1
0(P
665)
2.4 2.6 2.8 3 3.2 3.4 3.6-0.7
-0.6
-0.5
-0.4
-0.3
-0.2
-0.1
Figure 7. Changes in total phosphorus with flow for Algonquin (a) and Elgin (b) sites. Log-log scale.
(a)
Plot of log10(P625) vs log10(Flow)
log10(Flow)
log1
0(P
625)
2.3 2.6 2.9 3.2 3.5 3.80
0.1
0.2
0.3
0.4
0.5
(b)
Plot of log10(P625) vs log10(Flow)
log10(Flow)
log1
0(P
625)
2.4 2.6 2.8 3 3.2 3.4 3.60.13
0.23
0.33
0.43
0.53
Figure 8. Changes in Kjeldahl nitrogen with flow for Algonquin (a) and Elgin (b) sites. Log-log scale.
201
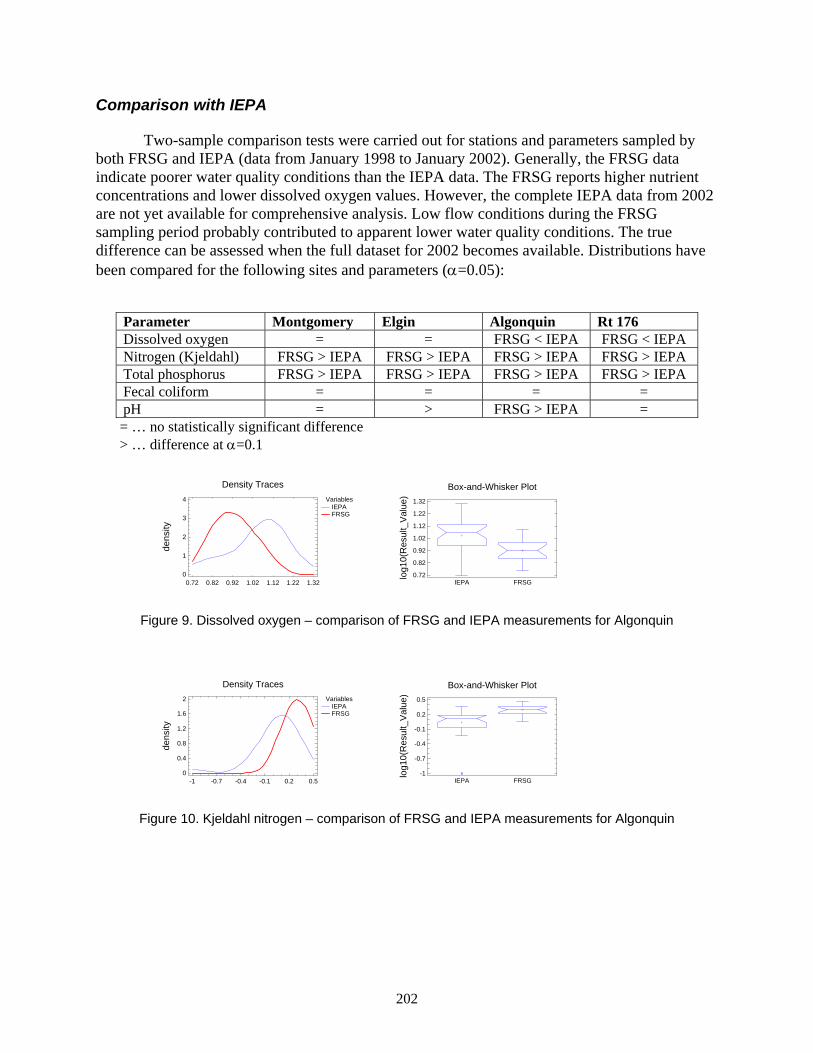
Comparison with IEPA
Two-sample comparison tests were carried out for stations and parameters sampled by both FRSG and IEPA (data from January 1998 to January 2002). Generally, the FRSG data indicate poorer water quality conditions than the IEPA data. The FRSG reports higher nutrient concentrations and lower dissolved oxygen values. However, the complete IEPA data from 2002 are not yet available for comprehensive analysis. Low flow conditions during the FRSG sampling period probably contributed to apparent lower water quality conditions. The true difference can be assessed when the full dataset for 2002 becomes available. Distributions have been compared for the following sites and parameters (α=0.05):
Parameter Montgomery Elgin Algonquin Rt 176 Dissolved oxygen = = FRSG < IEPA FRSG < IEPA Nitrogen (Kjeldahl) FRSG > IEPA FRSG > IEPA FRSG > IEPA FRSG > IEPA Total phosphorus FRSG > IEPA FRSG > IEPA FRSG > IEPA FRSG > IEPA Fecal coliform = = = = pH = > FRSG > IEPA = = … no statistically significant difference > … difference at α=0.1
VariablesIEPAFRSG
Density Traces
dens
ity
0.72 0.82 0.92 1.02 1.12 1.22 1.320
1
2
3
4
Box-and-Whisker Plot
log1
0(R
esul
t_V
alue
)
0.72
0.82
0.92
1.02
1.12
1.22
1.32
IEPA FRSG
Figure 9. Dissolved oxygen – comparison of FRSG and IEPA measurements for Algonquin
VariablesIEPAFRSG
Density Traces
dens
ity
-1 -0.7 -0.4 -0.1 0.2 0.50
0.4
0.8
1.2
1.6
2
Box-and-Whisker Plot
log1
0(R
esul
t_V
alue
)
IEPA FRSG-1
-0.7
-0.4
-0.1
0.2
0.5
Figure 10. Kjeldahl nitrogen – comparison of FRSG and IEPA measurements for Algonquin
202
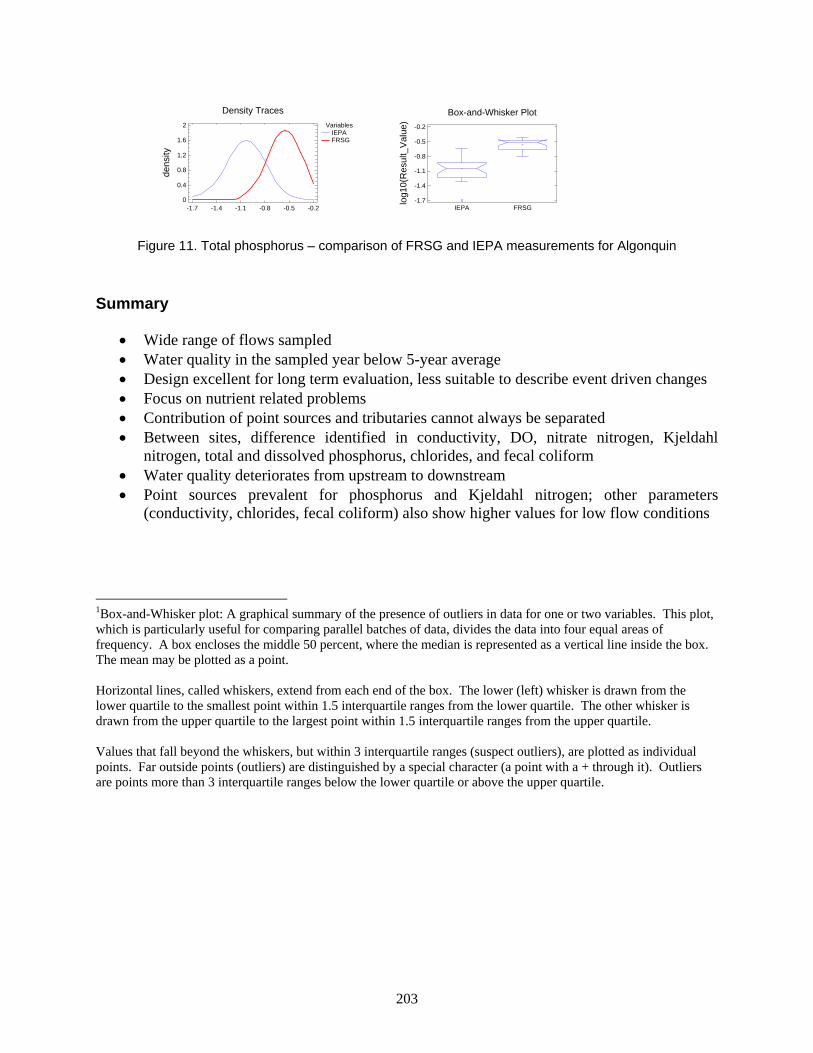
VariablesIEPAFRSG
Density Traces
dens
ity
-1.7 -1.4 -1.1 -0.8 -0.5 -0.20
0.4
0.8
1.2
1.6
2
Box-and-Whisker Plot
log1
0(R
esul
t_V
alue
)
IEPA FRSG-1.7
-1.4
-1.1
-0.8
-0.5
-0.2
Figure 11. Total phosphorus – comparison of FRSG and IEPA measurements for Algonquin
Summary
• Wide range of flows sampled • Water quality in the sampled year below 5-year average • Design excellent for long term evaluation, less suitable to describe event driven changes • Focus on nutrient related problems • Contribution of point sources and tributaries cannot always be separated • Between sites, difference identified in conductivity, DO, nitrate nitrogen, Kjeldahl
nitrogen, total and dissolved phosphorus, chlorides, and fecal coliform • Water quality deteriorates from upstream to downstream • Point sources prevalent for phosphorus and Kjeldahl nitrogen; other parameters
(conductivity, chlorides, fecal coliform) also show higher values for low flow conditions 1Box-and-Whisker plot: A graphical summary of the presence of outliers in data for one or two variables. This plot, which is particularly useful for comparing parallel batches of data, divides the data into four equal areas of frequency. A box encloses the middle 50 percent, where the median is represented as a vertical line inside the box. The mean may be plotted as a point. Horizontal lines, called whiskers, extend from each end of the box. The lower (left) whisker is drawn from the lower quartile to the smallest point within 1.5 interquartile ranges from the lower quartile. The other whisker is drawn from the upper quartile to the largest point within 1.5 interquartile ranges from the upper quartile. Values that fall beyond the whiskers, but within 3 interquartile ranges (suspect outliers), are plotted as individual points. Far outside points (outliers) are distinguished by a special character (a point with a + through it). Outliers are points more than 3 interquartile ranges below the lower quartile or above the upper quartile.
203


Appendix 6. Summary Statistics for Selected Constituents
Table A6.1. Fox River Summary Statistics for Organic Nitrogen
Station Location
Count Average
Median Standard deviation
Minimum
Maximum
Lower quartile
Upper quartile
Standard skewness
Standard kurtosis
23 Route 176 20 1.93 1.87 0.60 0.98 3.21 1.60 2.19 1.17 0.1924 Algonquin 25 1.72 1.76 0.55 0.61 2.91 1.25 2.03 0.16 -0.2526 South Elgin 125 1.72 1.70 0.64 0.46 3.22 1.30 2.10 1.80 -0.7827 Montgomery
24 1.81 1.78 0.53 1.06 2.96 1.32 2.21 1.02 -0.65
34 Yorkville 25 1.88 1.79 0.65 1.13 3.40 1.34 2.20 1.62 -0.2435 National St., Elgin
2 1.28 1.28 0.18 1.15 1.40 1.15 1.40 N/A N/A
40 Geneva 20 1.83 1.85 0.66 0.85 3.43 1.45 1.93 1.51 0.94184 Johnsburg 23 1.84 1.84 0.65 0.95 3.36 1.24 2.11 1.17 0.05240 I-90 Bridge N of Elgin 79 1.80 1.73 0.65 0.38 3.52 1.40 2.24 0.61 -0.13 273 Kimball-Lawrence St., Elgin
2 3.59
3.59 1.55 2.49 4.68 2.49 4.68 N/A N/A
Notes: No data are available for tributaries. N/A = not applicable.
205

Table A6.2. Fox River Summary Statistics for Ammonia Nitrogen
Station Location
Count Average
Median Standard deviation
Minimum
MaximumLower
quartile Upper
quartileStandard skewness
Standard kurtosis
23 Route 176 69 0.10 0.04 0.14 0.01 0.77 0.01 0.15 8.05 12.6524 Algonquin 74 0.14 0.04 0.31 0.01 2.40 0.01 0.19 20.75 73.4626 South Elgin 203 0.13 0.07 0.17 0.00 1.40 0.03 0.18 21.63 61.1227 Montgomery 314 0.10 0.05 0.12 0.01 0.66 0.02 0.12 16.89 21.5931 Route 71, Ottawa 46 0.10 0.01 0.15 0.01 0.59 0.01 0.15 5.34 4.04 33 Route 34, Oswego
241 0.06 0.03 0.08 0.01 0.53 0.02 0.07 18.07 29.53
34 Yorkville 74 0.10 0.05 0.11 0.02 0.51 0.03 0.13 7.38 7.1535 National St., Elgin 19 0.11 0.08 0.09 0.01 0.29 0.02 0.19 1.09 -0.8437 Wedron Blacktop Bridge south
of Wedron
2 0.01 0.01 0.00 0.01 0.01 0.01 0.01 N/A N/A 40 Geneva 23 0.19 0.06 0.49 0.01 2.41 0.04 0.14 9.09 21.48184 Johnsburg 23 0.07 0.05 0.05 0.03 0.20 0.03 0.10 2.43 0.41197 Route 173, Wisconsin-Illinois
border 47 0.14 0.05 0.22 0.01 1.10 0.01 0.19 8.03 13.15240 I-90 Bridge N of Elgin 111 0.11 0.08 0.09 0.00 0.55 0.04 0.13 9.10 13.55 273
Kimball-Lawrence St., Elgin
19 0.10
0.06 0.09 0.02 0.28 0.02 0.17 1.24 -0.73
Note: N/A = not applicable.
206

Table A6.3. Fox River Tributaries Summary Statistics for Ammonia Nitrogen
Station
Location
Count Average
Median
Standard deviation
Minimum
Maximum
Lower quartile
Upper quartile
Standard skewness
Standard kurtosis
3 Boone Creek, Bull Valley Road 2 0.03 0.03 0.03 0.01 0.05 0.01 0.05 N/A N/A 4 Flint Creek near Fox River
Grove 1 0.20 0.20 0.00 0.20 0.20 0.20 0.20 N/A N/A5 Tyler Creek at Randall Road 1 0.08 0.08 0.00 0.08 0.08 0.08 0.08 N/A N/A 14 Ferson Creek, Leroy Oaks 2 0.03 0.03 0.02 0.01 0.04 0.01 0.04 N/A N/A 19 Little Rock Creek near Plano 1 0.01 0.01 0.00 0.01 0.01 0.01 0.01 N/A N/A 22 Buck Creek, County Road 1900 2 0.05 0.05 0.05 0.01 0.08 0.01 0.08 N/A N/A 25 Poplar Creek, Route 20 49 0.16 0.04 0.36 0.01 2.40 0.01 0.19 15.51 47.51 28 Blackberry Creek, Route 47 48 0.15 0.03 0.22 0.01 1.20 0.01 0.25 7.90 14.45 29 Somonauk Creek, 1 mi N
of Sheridan 42 0.17 0.05 0.24 0.01 1.20 0.01 0.27 6.57 10.5594 Little Indian Creek
at Suyndam Road 2 0.02 0.02 0.01 0.01 0.02 0.01 0.02 N/A N/A99 Big Rock Creek at Jerico Road 1 0.04 0.04 0.00 0.04 0.04 0.04 0.04 N/A N/A 236 Nippersink Creek, Spring
Grove 43 0.19 0.13 0.20 0.01 0.80 0.01 0.25 3.81 2.29268 Tyler Creek, Route 31 19 0.05 0.05 0.03 0.02 0.10 0.03 0.08 0.85 -0.95 615
Poplar Creek, Raymond St.
19 0.07 0.06 0.03 0.03 0.15 0.04 0.10 1.48 0.00
Note: N/A = not applicable.
207
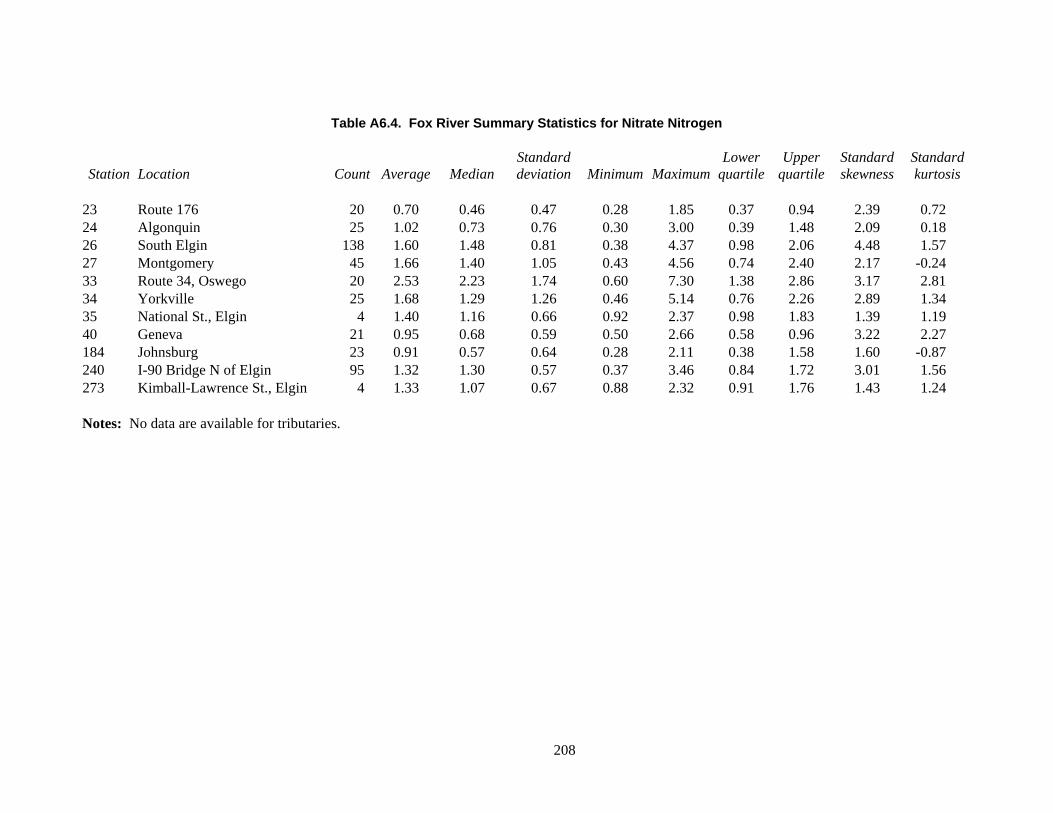
Table A6.4. Fox River Summary Statistics for Nitrate Nitrogen
Station Location
Count Average
Median Standard deviation
Minimum
Maximum
Lower quartile
Upper quartile
Standard skewness
Standard kurtosis
23 Route 176 20 0.70 0.46 0.47 0.28 1.85 0.37 0.94 2.39 0.7224 Algonquin 25 1.02 0.73 0.76 0.30 3.00 0.39 1.48 2.09 0.1826 South Elgin 138 1.60 1.48 0.81 0.38 4.37 0.98 2.06 4.48 1.5727 Montgomery 45 1.66 1.40 1.05 0.43 4.56 0.74 2.40 2.17 -0.2433 Route 34, Oswego
20 2.53 2.23 1.74 0.60 7.30 1.38 2.86 3.17 2.81
34 Yorkville 25 1.68 1.29 1.26 0.46 5.14 0.76 2.26 2.89 1.3435 National St., Elgin
4 1.40 1.16 0.66 0.92 2.37 0.98 1.83 1.39 1.19
40 Geneva 21 0.95 0.68 0.59 0.50 2.66 0.58 0.96 3.22 2.27184 Johnsburg 23 0.91 0.57 0.64 0.28 2.11 0.38 1.58 1.60 -0.87240 I-90 Bridge N of Elgin 95 1.32 1.30 0.57 0.37 3.46 0.84 1.72 3.01 1.56 273 Kimball-Lawrence St., Elgin
4 1.33 1.07 0.67 0.88 2.32 0.91 1.76 1.43 1.24
Notes: No data are available for tributaries.
208

Table A6.5. Fox River Summary Statistics for Kjeldahl Nitrogen
Station
Location
Count
Average
Median
Standard deviation
Minimum
Maximum
Lower quartile
Upper quartile
Standard skewness
Standard kurtosis
23 Route 176 58 1.63 1.56 0.83 0.30 4.37 0.97 2.04 3.26 2.1124 Algonquin 63 1.53 1.50 0.63 0.10 2.95 1.08 2.04 -0.08 -0.5326 South Elgin 172 1.76 1.70 0.65 0.10 3.66 1.34 2.14 1.81 0.3127 Montgomery 80 1.70 1.67 0.70 0.23 3.57 1.24 2.04 1.30 0.2531 Route 71, Ottawa 34 1.44 1.42 0.77 0.37 3.30 0.73 1.90 1.59 0.00 33 Route 34, Oswego
20 1.75 1.51 0.77 0.90 3.81 1.20 2.10 2.27 1.21
34 Yorkville 25 1.97 1.86 0.61 1.22 3.43 1.54 2.25 1.76 -0.0140 Geneva 21 1.95 1.91 0.64 0.91 3.51 1.53 2.06 1.37 0.83184 Johnsburg 23 1.91 1.92 0.65 1.00 3.39 1.29 2.15 1.10 -0.17197 Route 173, Wisconsin-Illinois
border 40 1.17 1.23 0.64 0.01 2.67 0.64 1.65 0.31 -0.84 240 I-90 Bridge N of Elgin 86 1.89 1.80 0.62 0.50 3.54 1.48 2.33 0.94 -0.23 273
Kimball-Lawrence St., Elgin
2 3.61
3.61 1.54 2.52 4.70 2.52 4.70 N/A N/A
Note: N/A = not applicable.
209

Table A6.6. Fox River Tributaries Summary Statistics for Kjeldahl Nitrogen
Station
Location
Count Average
MedianStandard deviation
Minimum
Maximum
Lower quartile
Upper quartile
Standard skewness
Standard kurtosis
1 Nippersink Creek, Thompson
Road by Wonder Lake 38 1.05 0.66 1.00 0.31 4.19 0.44 1.28 5.23 4.53 2 North Branch Nippersink Creek
near Richmond 1 0.71 0.71 0.00 0.71 0.71 0.71 0.71 N/A N/A3 Boone Creek, Bull Valley Road 1 0.50 0.50 0.00 0.50 0.50 0.50 0.50 N/A N/A 4 Flint Creek near Fox River
Grove 1 1.41 1.41 0.00 1.41 1.41 1.41 1.41 N/A N/A 5 Tyler Creek at Randall Road 1 0.92 0.92 0.00 0.92 0.92 0.92 0.92 N/A N/A 14 Ferson Creek, Leroy Oaks 1 0.55 0.55 0.00 0.55 0.55 0.55 0.55 N/A N/A 15 Mill Creek at Mooseheart 1 0.75 0.75 0.00 0.75 0.75 0.75 0.75 N/A N/A 16 Waubansee Creek, Oswego 1 0.48 0.48 0.00 0.48 0.48 0.48 0.48 N/A N/A 17 Blackberry Creek near Bristol 1 0.56 0.56 0.00 0.56 0.56 0.56 0.56 N/A N/A 18 Big Rock Creek near Sugar
Grove 1 0.56 0.56 0.00 0.56 0.56 0.56 0.56 N/A N/A19 Little Rock Creek near Plano 1 0.63 0.63 0.00 0.63 0.63 0.63 0.63 N/A N/A 20 Somonauk Creek near Sandwich 1 0.45 0.45 0.00 0.45 0.45 0.45 0.45 N/A N/A 21 Indian Creek near Harding 1 0.56 0.56 0.00 0.56 0.56 0.56 0.56 N/A N/A 22 Buck Creek, County Road 1900 1 0.61 0.61 0.00 0.61 0.61 0.61 0.61 N/A N/A 25 Poplar Creek, Route 20 41 0.98 0.81 1.14 0.10 7.50 0.57 1.10 12.77 36.60 28 Blackberry Creek, Route 47 27 0.82 0.52 0.76 0.10 3.14 0.23 1.04 3.36 2.41 29 Somonauk Creek, 1 mi N
of Sheridan 25 0.71 0.55 0.49 0.13 1.83 0.34 1.04 1.90 -0.03 236 Nippersink Creek, Spring Grove 26 0.88 0.79 0.43 0.10 2.16 0.61 1.00 2.86 2.89268 Tyler Creek, Route 31
2 0.88 0.88 0.04 0.85 0.90 0.85 0.90 N/A N/A
Note: N/A = not applicable.
210

Table A6.7. Fox River Summary Statistics for Nitrate-Nitrite Nitrogen
Station Location
Count
Average
Median
Standard deviation
Minimum
Maximum
Lower quartile
Upper quartile
Standard skewness
Standard kurtosis
23
Route 176 43 1.01 0.67 0.99 0.01 2.90 0.01 2.00 1.41 -1.6424 Algonquin 40 1.04 0.92 0.92 0.01 3.50 0.06 1.64 1.68 -0.1726 South Elgin 40 1.41 1.42 0.78 0.01 3.10 0.84 1.76 0.49 -0.3727 Montgomery 34 1.56 1.40 0.90 0.07 3.30 0.98 2.23 0.49 -1.1031 Route 71, Ottawa 34 2.71 2.76 1.87 0.01 7.00 1.12 4.20 0.30 -0.89 33 Route 34, Oswego 2 1.10 1.10 0.00 1.10 1.10 1.10 1.10 N/A N/A 37 Wedron Blacktop Bridge south
of Wedron
2 0.63 0.63 0.58 0.22 1.04 0.22 1.04 N/A N/A 40 Geneva 2 0.46 0.46 0.50 0.10 0.81 0.10 0.81 N/A N/A197 Route 173, Wisconsin-Illinois
border
38 1.91 1.90 1.01 0.50 4.20 1.04 2.60 1.40 -0.65
Note: N/A = not applicable.
211

Table A6.8. Fox River Tributaries Summary Statistics for Nitrate-Nitrite Nitrogen
Station
Location
Count
Average
Median
Standard deviation
Minimum
Maximum
Lower quartile
Upper quartile
Standard skewness
Standard kurtosis
3 Boone Creek, Bull Valley Road 2 1.51 1.51 0.40 1.22 1.79 1.22 1.79 N/A N/A 4 Flint Creek near Fox River
Grove 1 0.48 0.48 0.00 0.48 0.48 0.48 0.48 N/A N/A 5 Tyler Creek at Randall Road 1 1.90 1.90 0.00 1.90 1.90 1.90 1.90 N/A N/A 14 Ferson Creek, Leroy Oaks 2 1.06 1.06 0.09 0.99 1.12 0.99 1.12 N/A N/A 19 Little Rock Creek near Plano 1 3.25 3.25 0.00 3.25 3.25 3.25 3.25 N/A N/A 22 Buck Creek, County Road 1900 2 2.80 2.80 2.87 0.77 4.83 0.77 4.83 N/A N/A 25 Poplar Creek, Route 20 38 0.69 0.73 0.31 0.13 1.52 0.47 0.79 1.92 1.34 28 Blackberry Creek, Route 47 36 2.75 2.30 2.00 0.11 8.20 1.22 3.34 3.20 1.71 29 Somonauk Creek, 1 mi N
of Sheridan 36 4.31 3.50 3.19 0.51 11.70 1.54 6.55 1.88 -0.53 94 Little Indian Creek at
Suyndam Road 2 1.74 1.74 2.26 0.14 3.33 0.14 3.33 N/A N/A 99 Big Rock Creek at Jerico Road 1 1.40 1.40 0.00 1.40 1.40 1.40 1.40 N/A N/A 236
Nippersink Creek, Spring Grove
38 3.02 2.65 1.00 1.82 5.90 2.30 3.50 2.97 1.09
Note: N/A = not applicable.
212

Table A6.9. Fox River Summary Statistics for Total Phosphorus
Station
Location
Count
Average
Median
Standard deviation
Minimum
Maximum
Lower quartile
Upper quartile
Standard skewness
Standard kurtosis
23 Route 176
58 0.14 0.12 0.08 0.01 0.33 0.07 0.21 1.82 -1.1724 Algonquin 60 0.19 0.17 0.11 0.02 0.43 0.10 0.30 1.42 -1.5726 South Elgin 181 0.29 0.24 0.17 0.08 1.56 0.18 0.34 15.53 42.5227 Montgomery 60 0.36 0.33 0.18 0.12 0.82 0.23 0.49 2.32 -0.5831 Route 71, Ottawa 33 0.23 0.21 0.09 0.12 0.49 0.17 0.29 2.38 1.02 33 Route 34, Oswego
2 0.53 0.53 0.18 0.40 0.65 0.40 0.65 N/A N/A
34 Yorkville 26 0.65 0.71 0.21 0.25 1.01 0.49 0.80 -0.53 -0.7835 National St., Elgin 19 0.22 0.20 0.07 0.15 0.36 0.16 0.25 1.43 -0.35
37 Wedron Blacktop Bridge south of Wedron
2 0.39 0.39 0.08 0.33 0.44 0.33 0.44 N/A N/A
40 Geneva 24 0.48 0.51 0.16 0.24 0.78 0.35 0.56 0.20 -0.95184 Johnsburg 24 0.18 0.16 0.08 0.09 0.36 0.12 0.25 1.45 -0.50
197 Route 173, Wisconsin-Illinois border 37 0.10 0.09 0.05 0.01 0.22 0.06 0.12 1.54 -0.09
240 I-90 Bridge N of Elgin 97 0.19 0.19 0.06 0.10 0.35 0.14 0.23 1.68 -0.77 273
Kimball-Lawrence St., Elgin
19 0.22 0.20 0.07 0.13 0.37 0.17 0.27 1.48 0.04
Note: N/A = not applicable.
213

Table A6.10. Fox River Tributaries Summary Statistics for Total Phosphorus
Station Location Count Average Median Standard deviation Minimum Maximum
Lower quartile
Upper quartile
Standard skewness
Standard kurtosis
1 Nippersink Creek, Thompson
Road by Wonder Lake 39 0.20 0.08 0.27 0.03 1.16 0.05 0.18 5.66 5.49 2 North Branch Nippersink Creek
near Richmond 1 0.10 0.10 0.00 0.10 0.10 0.10 0.10 N/A N/A 3 Boone Creek, Bull Valley Road 3 0.03 0.02 0.02 0.02 0.05 0.02 0.05 1.19 N/A 4 Flint Creek near Fox River
Grove 2 0.40 0.40 0.03 0.38 0.43 0.38 0.43 N/A N/A 5 Tyler Creek at Randall Road 2 0.18 0.18 0.06 0.14 0.22 0.14 0.22 N/A N/A 14 Ferson Creek, Leroy Oaks 3 0.12 0.09 0.06 0.09 0.19 0.09 0.19 1.22 N/A 15 Mill Creek at Mooseheart 1 0.11 0.11 0.00 0.11 0.11 0.11 0.11 N/A N/A 16 Waubansee Creek, Oswego 1 0.03 0.03 0.00 0.03 0.03 0.03 0.03 N/A N/A 17 Blackberry Creek near Bristol 1 0.08 0.08 0.00 0.08 0.08 0.08 0.08 N/A N/A 18 Big Rock Creek near Sugar
Grove 1 0.040.04
0.00 0.04 0.04 0.04 0.04 N/A N/A19 Little Rock Creek near Plano 2 0.20 0.20 0.04 0.17 0.23 0.17 0.23 N/A N/A 20 Somonauk Creek near Sandwich 1 0.05 0.05 0.00 0.05 0.05 0.05 0.05 N/A N/A 21 Indian Creek near Harding 1 0.03 0.03 0.00 0.03 0.03 0.03 0.03 N/A N/A 22 Buck Creek, County Road 1900 3 0.07 0.07 0.04 0.04 0.11 0.04 0.11 0.20 N/A 25 Poplar Creek, Route 20 38 0.06 0.06 0.04 0.03 0.24 0.04 0.07 5.91 9.13 28 Blackberry Creek, Route 47 36 0.12 0.10 0.08 0.02 0.33 0.05 0.16 2.63 0.57 29 Somonauk Creek, 1 mi N
of Sheridan 35 0.09 0.06 0.11 0.02 0.62 0.04 0.09 9.56 22.34 94 Little Indian Creek at Suyndam
Road 2 0.10 0.10 0.04 0.07 0.12 0.07 0.12 N/A N/A 99 Big Rock Creek at Jerico Road 1 0.20 0.20 0.00 0.20 0.20 0.20 0.20 N/A N/A 236 Nippersink Creek, Spring Grove 36 0.11 0.10 0.05 0.04 0.26 0.08 0.15 2.32 0.71268 Tyler Creek, Route 31 19 0.19 0.16 0.11 0.06 0.54 0.11 0.24 3.33 3.94 615
Poplar Creek, Raymond St.
19 0.20 0.17 0.08 0.10 0.38 0.15 0.26 1.66 0.31
Note: N/A = not applicable.
214

Table A6.11. Fox River Summary Statistics for Dissolved Phosphorus
Station
Location
Count Average
Median
Standard deviation
Minimum
Maximum
Lower quartile
Upper quartile
Standard skewness
Standard kurtosis
23 Route 176 65 0.02 0.02 0.02 0.01 0.13 0.01 0.03 9.43 16.7724 Algonquin 62 0.06 0.02 0.14 0.01 1.10 0.02 0.04 21.48 78.4726 South Elgin 162 0.17 0.15 0.11 0.01 0.46 0.09 0.25 3.70 -0.7627 Montgomery 61 0.17 0.11 0.14 0.01 0.61 0.06 0.26 3.75 1.5431 Route 71, Ottawa 34 0.09 0.07 0.07 0.02 0.37 0.05 0.11 6.00 11.26 33 Route 34, Oswego
2 0.32 0.32 0.13 0.22 0.41 0.22 0.41 N/A N/A
34 Yorkville 25 0.38 0.39 0.22 0.06 0.80 0.17 0.54 0.42 -0.96
37 Wedron Blacktop Bridge south of Wedron
2 0.10 0.10 0.08 0.04 0.15 0.04 0.15 N/A N/A
40 Geneva 24 0.19 0.18 0.14 0.02 0.43 0.07 0.31 0.72 -1.36184 Johnsburg 24 0.04 0.03 0.04 0.01 0.19 0.02 0.04 6.43 11.80
197 Route 173, Wisconsin-Illinois border 43 0.02 0.01 0.02 0.01 0.08 0.01 0.02 6.55 8.46
240
I-90 Bridge N of Elgin
79 0.13 0.12 0.06 0.02 0.36 0.09 0.17 4.27 5.05
Note: N/A = not applicable.
215

Table A6.12. Fox River Tributaries Summary Statistics for Dissolved Phosphorus
Station Location Count Average Median Standard deviation Minimum Maximum
Lower quartile
Upper quartile
Standard skewness
Standard. kurtosis
1 Nippersink Creek, Thompson
Road by Wonder Lake 39 0.05 0.03 0.05 0.01 0.19 0.02 0.06 4.16 1.77 2 North Branch Nippersink Creek
near Richmond 1 0.04 0.04 0.00 0.04 0.04 0.04 0.04 N/A N/A 3 Boone Creek, Bull Valley Road 3 0.01 0.01 0.00 0.01 0.01 0.01 0.01 -1.22 N/A 4 Flint Creek near Fox River
Grove 2 0.23 0.23 0.07 0.18 0.28 0.18 0.28 N/A N/A 5 Tyler Creek at Randall Road 2 0.08 0.08 0.03 0.06 0.10 0.06 0.10 N/A N/A 14 Ferson Creek, Leroy Oaks 3 0.06 0.05 0.04 0.03 0.11 0.03 0.11 0.87 N/A 15 Mill Creek at Mooseheart 1 0.05 0.05 0.00 0.05 0.05 0.05 0.05 N/A N/A 16 Waubansee Creek, Oswego 1 0.01 0.01 0.00 0.01 0.01 0.01 0.01 N/A N/A 17 Blackberry Creek near Bristol 1 0.06 0.06 0.00 0.06 0.06 0.06 0.06 N/A N/A 18 Big Rock Creek near Sugar
Grove 1 0.03 0.03 0.00 0.03 0.03 0.03 0.03 N/A N/A 19 Little Rock Creek near Plano 2 0.18 0.18 0.02 0.17 0.19 0.17 0.19 N/A N/A 20 Somonauk Creek near Sandwich 1 0.05 0.05 0.00 0.05 0.05 0.05 0.05 N/A N/A 21 Indian Creek near Harding 1 0.01 0.01 0.00 0.01 0.01 0.01 0.01 N/A N/A 22 Buck Creek, County Road 1900 3 0.04 0.04 0.02 0.02 0.06 0.02 0.06 0.05 N/A 25 Poplar Creek, Route 20 46 0.02 0.02 0.01 0.01 0.04 0.01 0.03 1.99 -1.21 28 Blackberry Creek, Route 47 46 0.04 0.02 0.03 0.01 0.12 0.01 0.05 2.84 0.17 29 Somonauk Creek, 1 mi N
of Sheridan 43 0.03 0.02 0.04 0.01 0.20 0.01 0.03 9.80 18.85 94 Little Indian Creek
at Suyndam Road 2 0.07 0.07 0.02 0.05 0.08 0.05 0.08 N/A N/A 99 Big Rock Creek at Jerico Road 1 0.13 0.13 0.00 0.13 0.13 0.13 0.13 N/A N/A 236
Nippersink Creek, Spring Grove
39 0.03 0.03 0.02 0.01 0.11 0.02 0.04 4.12 4.46
Note: N/A = not applicable.
216
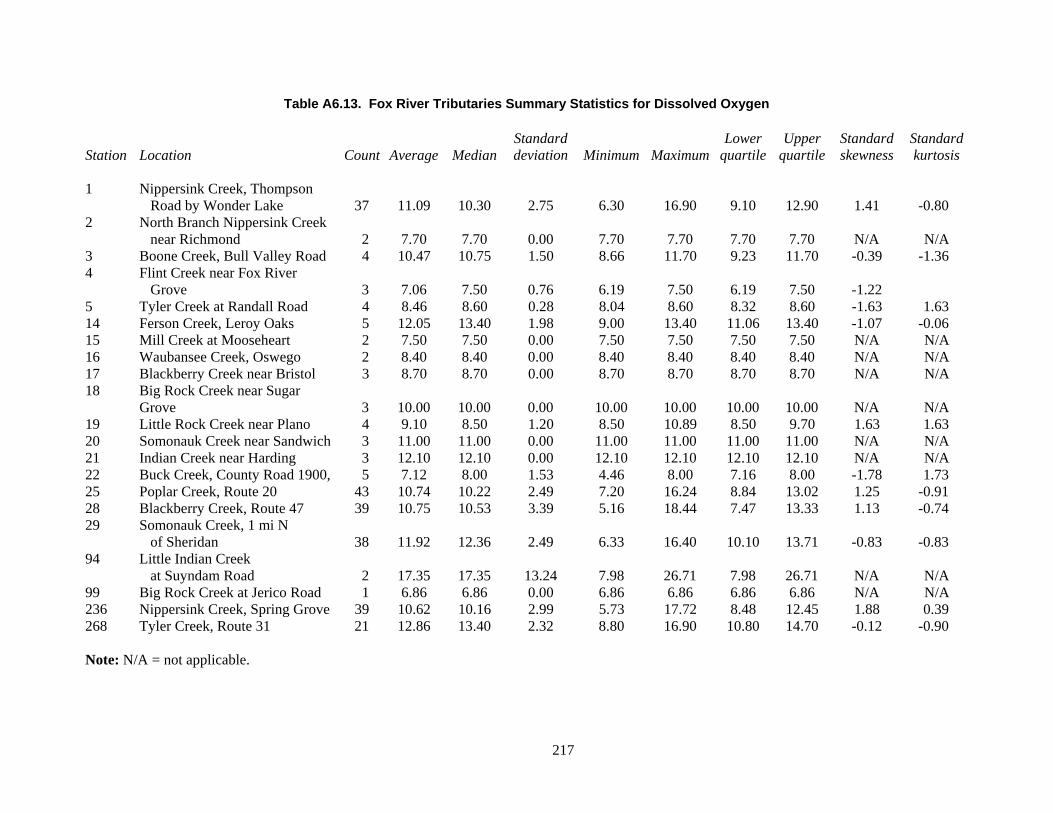
Table A6.13. Fox River Tributaries Summary Statistics for Dissolved Oxygen
Station Location Count Average Median Standard deviation Minimum Maximum
Lower quartile
Upper quartile
Standard skewness
Standard kurtosis
1 Nippersink Creek, Thompson
Road by Wonder Lake 37 11.09 10.30 2.75 6.30 16.90 9.10 12.90 1.41 -0.80 2 North Branch Nippersink Creek
near Richmond 2 7.70 7.70 0.00 7.70 7.70 7.70 7.70 N/A N/A 3 Boone Creek, Bull Valley Road 4 10.47 10.75 1.50 8.66 11.70 9.23 11.70 -0.39 -1.36 4 Flint Creek near Fox River
Grove 3 7.06 7.50 0.76 6.19 7.50 6.19 7.50 -1.22 5 Tyler Creek at Randall Road 4 8.46 8.60 0.28 8.04 8.60 8.32 8.60 -1.63 1.63 14 Ferson Creek, Leroy Oaks 5 12.05 13.40 1.98 9.00 13.40 11.06 13.40 -1.07 -0.06 15 Mill Creek at Mooseheart 2 7.50 7.50 0.00 7.50 7.50 7.50 7.50 N/A N/A 16 Waubansee Creek, Oswego 2 8.40 8.40 0.00 8.40 8.40 8.40 8.40 N/A N/A 17 Blackberry Creek near Bristol 3 8.70 8.70 0.00 8.70 8.70 8.70 8.70 N/A N/A 18 Big Rock Creek near Sugar
Grove 3 10.0010.00
0.00 10.00 10.00 10.0010.00 N/A N/A19 Little Rock Creek near Plano 4 9.10 8.50 1.20 8.50 10.89 8.50 9.70 1.63 1.63 20 Somonauk Creek near Sandwich 3 11.00 11.00 0.00 11.00 11.00 11.00 11.00 N/A N/A 21 Indian Creek near Harding 3 12.10 12.10 0.00 12.10 12.10 12.10 12.10 N/A N/A 22 Buck Creek, County Road 1900, 5 7.12 8.00 1.53 4.46 8.00 7.16 8.00 -1.78 1.73 25 Poplar Creek, Route 20 43 10.74 10.22 2.49 7.20 16.24 8.84 13.02 1.25 -0.91 28 Blackberry Creek, Route 47 39 10.75 10.53 3.39 5.16 18.44 7.47 13.33 1.13 -0.74 29 Somonauk Creek, 1 mi N
of Sheridan 38 11.92 12.36 2.49 6.33 16.40 10.10 13.71 -0.83 -0.83 94 Little Indian Creek
at Suyndam Road 2 17.35 17.35 13.24 7.98 26.71 7.98 26.71 N/A N/A 99 Big Rock Creek at Jerico Road 1 6.86 6.86 0.00 6.86 6.86 6.86 6.86 N/A N/A 236 Nippersink Creek, Spring Grove 39 10.62 10.16 2.99 5.73 17.72 8.48 12.45 1.88 0.39 268
Tyler Creek, Route 31
21 12.86
13.40 2.32 8.80 16.90 10.80 14.70 -0.12 -0.90
Note: N/A = not applicable.
217

Table A6.14. Fox River Stations Summary Statistics for pH
Station Location Count Average Median Standard deviation Minimum Maximum
Lower quartile
Upper quartile
Standard skewness
Standard kurtosis
23
Route 176 58 8.26 8.30 0.35 7.00 8.90 8.10 8.50 -3.53 3.5324 Algonquin 70 8.30 8.39 0.44 6.66 9.00 8.10 8.58 -4.20 3.8126 South Elgin 296 8.22 8.20 0.28 7.30 8.98 8.05 8.40 1.03 2.5027 Montgomery 306 8.40 8.40 0.30 7.51 10.60 8.24 8.56 7.83 31.8531 Route 71, Ottawa 33 8.33 8.34 0.41 7.25 9.14 8.21 8.58 -1.32 1.32 33 Route 34, Oswego
242 8.52 8.51 0.32 7.59 9.39 8.34 8.73 0.30 0.10
34 Yorkville 76 8.39 8.38 0.23 7.82 9.15 8.24 8.53 1.20 1.3235 National St., Elgin 20 8.40 8.41 0.20 8.05 8.89 8.25 8.50 0.55 0.3837 Wedron Blacktop Bridge south
of Wedron
2 8.44 8.44 0.34 8.20 8.68 8.20 8.68 N/A N/A40 Geneva 25 8.38 8.40 0.34 7.61 8.82 8.20 8.66 -1.54 0.12184 Johnsburg 24 8.46 8.50 0.21 8.00 8.80 8.35 8.60 -1.23 -0.18197 Route 173, Wisconsin-Illinois
border 41 8.08 8.11 0.31 7.53 8.74 7.86 8.29 -0.16 -0.88 240 I-90 Bridge N of Elgin 81 8.17 8.20 0.29 7.40 8.88 8.00 8.36 -0.85 0.22 273 Kimball-Lawrence St., Elgin 27 8.42 8.40 0.24 7.85 8.95 8.30 8.52 0.06 0.67 616 Algonquin Dam at River Mile
82.61
4 8.50
8.50 0.22 8.25 8.76 8.33 8.68 0.08 -0.69
Note: N/A = not applicable.
2 18
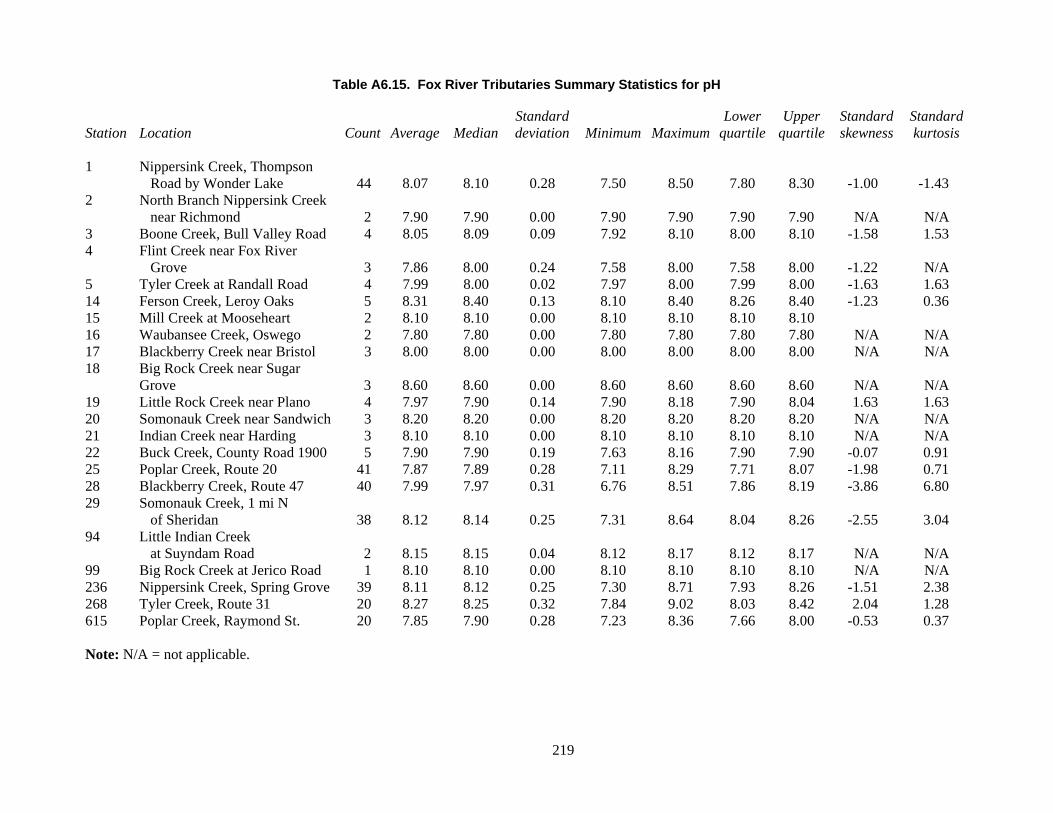
Table A6.15. Fox River Tributaries Summary Statistics for pH
Station Location Count Average Median Standard deviation
Minimum MaximumLower
quartileUpper
quartileStandard skewness
Standard kurtosis
1 Nippersink Creek, Thompson
Road by Wonder Lake 44 8.07 8.10 0.28 7.50 8.50 7.80 8.30 -1.00 -1.43 2 North Branch Nippersink Creek
near Richmond 2 7.90 7.90 0.00 7.90 7.90 7.90 7.90 N/A N/A 3 Boone Creek, Bull Valley Road 4 8.05 8.09 0.09 7.92 8.10 8.00 8.10 -1.58 1.53 4 Flint Creek near Fox River
Grove 3 7.86 8.00 0.24 7.58 8.00 7.58 8.00 -1.22 N/A 5 Tyler Creek at Randall Road 4 7.99 8.00 0.02 7.97 8.00 7.99 8.00 -1.63 1.63 14 Ferson Creek, Leroy Oaks 5 8.31 8.40 0.13 8.10 8.40 8.26 8.40 -1.23 0.3615 Mill Creek at Mooseheart 2 8.10 8.10 0.00 8.10 8.10 8.10 8.10 16 Waubansee Creek, Oswego 2 7.80 7.80 0.00 7.80 7.80 7.80 7.80 N/A N/A 17 Blackberry Creek near Bristol 3 8.00 8.00 0.00 8.00 8.00 8.00 8.00 N/A N/A 18 Big Rock Creek near Sugar
Grove 3 8.60 8.60 0.00 8.60 8.60 8.60 8.60 N/A N/A19 Little Rock Creek near Plano 4 7.97 7.90 0.14 7.90 8.18 7.90 8.04 1.63 1.63 20 Somonauk Creek near Sandwich 3 8.20 8.20 0.00 8.20 8.20 8.20 8.20 N/A N/A 21 Indian Creek near Harding 3 8.10 8.10 0.00 8.10 8.10 8.10 8.10 N/A N/A 22 Buck Creek, County Road 1900 5 7.90 7.90 0.19 7.63 8.16 7.90 7.90 -0.07 0.91 25 Poplar Creek, Route 20 41 7.87 7.89 0.28 7.11 8.29 7.71 8.07 -1.98 0.71 28 Blackberry Creek, Route 47 40 7.99 7.97 0.31 6.76 8.51 7.86 8.19 -3.86 6.80 29 Somonauk Creek, 1 mi N
of Sheridan 38 8.12 8.14 0.25 7.31 8.64 8.04 8.26 -2.55 3.04 94 Little Indian Creek
at Suyndam Road 2 8.15 8.15 0.04 8.12 8.17 8.12 8.17 N/A N/A99 Big Rock Creek at Jerico Road 1 8.10 8.10 0.00 8.10 8.10 8.10 8.10 N/A N/A 236 Nippersink Creek, Spring Grove 39 8.11 8.12 0.25 7.30 8.71 7.93 8.26 -1.51 2.38 268 Tyler Creek, Route 31 20 8.27 8.25 0.32 7.84 9.02 8.03 8.42 2.04 1.28 615
Poplar Creek, Raymond St.
20 7.85 7.90 0.28 7.23 8.36 7.66 8.00 -0.53 0.37
Note: N/A = not applicable.
219

Table A6.16. Fox River Stations Summary Statistics for Suspended Solids
Station Location
Count Average
Median
Standard deviation
Minimum
Maximum
Lower quartile
Upper quartile
Standard skewness
Standard kurtosis
23
Route 176 70 35.16 31.50 23.20 3.00 122.00 19.00 47.00 4.74 4.6024 Algonquin 72 36.57 28.50 31.94 6.00 194.00 16.50 45.00 10.35 19.4226 South Elgin 216 35.02 31.00 29.46 0.00 224.00 17.00 42.00 16.49 37.2927 Montgomery 79 45.11 37.00 41.51 3.00 234.00 22.00 53.00 9.09 13.7031 Route 71, Ottawa 30 62.63 56.00 43.99 11.00 202.00 29.00 75.00 3.07 2.59 33 Route 34, Oswego
22 39.95 44.00 23.24 4.00 86.00 24.00 54.00 0.35 -0.59
34 Yorkville 26 30.65 27.00 24.08 6.00 118.00 14.00 38.00 4.44 6.4235 National St., Elgin 23 38.78 37.00 29.18 0.00 100.00 9.00 55.00 0.86 -0.5537 Wedron Blacktop Bridge south
of Wedron
2 85.50 85.50 12.02 77.00 94.00 77.00 94.00 N/A N/A40 Geneva 22 39.86 35.00 30.22 3.00 141.00 19.00 49.00 3.67 5.00184 Johnsburg 23 25.57 22.00 16.26 3.00 71.00 11.00 37.00 1.81 1.16197 Route 173, Wisconsin-Illinois
border 38 49.08 49.00 27.25 8.00 122.00 28.00 61.00 1.70 0.51 240 I-90 Bridge N of Elgin 124 42.70 40.00 22.59 0.00 107.00 26.00 57.00 2.03 0.22 273 Kimball-Lawrence St., Elgin
23 45.96
41.00 38.07 1.00 168.00 19.00 59.00 2.98 3.57
Note: N/A = not applicable.
220

Table A6.17. Fox River Tributaries Summary Statistics for Suspended Solids
Station Location
Count
Average
Median
Standard deviation
Minimum
Maximum
Lower quartile
Upper quartile
Standard skewness
Standard kurtosis
3 Boone Creek, Bull Valley Road 2 24.50 24.50 26.16 6.00 43.00 6.00 43.00 N/A N/A 4 Flint Creek near Fox River
Grove 1 56.00 56.00 0.00 56.00 56.00 56.00 56.00 N/A N/A 5 Tyler Creek at Randall Road 1 60.00 60.00 0.00 60.00 60.00 60.00 60.00 N/A N/A 14 Ferson Creek, Leroy Oaks 2 15.50 15.50 13.44 6.00 25.00 6.00 25.00 N/A N/A 19 Little Rock Creek near Plano 1 8.00 8.00 0.00 8.00 8.00 8.00 8.00 N/A N/A 22 Buck Creek, County Road 1900 2 14.50 14.50 3.54 12.00 17.00 12.00 17.00 N/A N/A 25 Poplar Creek, Route 20 33 29.94 20.00 38.98 1.00 222.00 15.00 27.00 9.41 22.41 28 Blackberry Creek, Route 47 37 57.49 32.00 69.98 5.00 328.00 18.00 64.00 6.41 8.86 29 Somonauk Creek, 1 mi N
of Sheridan 35 44.69 23.00 70.30 4.00 328.00 13.00 39.00 7.95 13.20 94 Little Indian Creek at Suyndam
Road 2 13.50 13.50 0.71 13.00 14.00 13.00 14.00 N/A N/A 99 Big Rock Creek at Jerico Road 1 32.00 32.00 0.00 32.00 32.00 32.00 32.00 N/A N/A 236 Nippersink Creek, Spring Grove 33 36.00 26.00 24.48 10.00 110.00 18.00 54.00 2.92 1.34 268 Tyler Creek, Route 31, 23 36.43 15.00 52.57 0.00 201.00 2.00 46.00 4.00 3.74 615
Poplar Creek, Raymond St.
23 22.13
13.00
27.88 0.00 109.00 7.00 23.00 4.77
5.46
Note: N/A = not applicable.
221

Table A6.18. Fox River Stations Summary Statistics for Fecal Coliforms
Station
Location
Count Average
Median
Standard deviation
Minimum
Maximum
Lower quartile
Upper quartile
Standard skewness
Standard kurtosis
23 Route 176 29 113 19 290 1 1160 10 50 8 1224 Algonquin 34 192 22 686 6 4000 13 83 13 3726 South Elgin 169 N/A 270 N/A 0 TNTC 100 660 35 16327 Montgomery 31 N/A 176 N/A 25 TNTC 75 980 13 3531 Route 71, Ottawa
13 285 81 430 6 1517 63 310 3 4
34 Yorkville 21 500 110 982 6 4000 50 290 5 835 National St., Elgin
22 513 400 589 20 2720 140 580 5 9
40 Geneva 17 284 160 465 15 2000 77 272 6 11184 Johnsburg 18 15 5 24 1 100 2 17 5 9197 Route 173, Wisconsin-Illinois
border 12 196 146 149 31 540 78 279 2 1 240 I-90 Bridge N of Elgin 111 355 180 459 0 2960 60 440 11 21 273 Kimball-Lawrence St., Elgin 22 325 240 283 0 1000 80 600 1 0 Notes: TNTC = too numerous to count. N/A = not applicable.
222

Table A6.19. Fox River Tributaries Summary Statistics for Fecal Coliforms
Station Location
Count Average
Median Standard deviation Minimum
Maximum
Lower quartile
Upper quartile
Standard skewness
Standard kurtosis
25 Poplar Creek, Route 20 14 N/A 393 N/A 33 TNTC 69 710 6 10 28 Blackberry Creek, Route 47 13 1105 565 2041 10 7636 93 810 5 8 29 Somonauk Creek, 1 mi N
of Sheridan 13 626 210 1121 16 3800 56 377 4 4 236 Nippersink Creek, Spring Grove 15 688 219 1457 38 5900 167 520 6 11 268 Tyler Creek, Route 31 23 325 220 359 0 1340 60 500 3 3 615 Poplar Creek, Raymond St.
22 634 290 728 20 2340
120 800 3 1
Note: TNTC = too numerous to count.
223


Appendix 7. Descriptions of Water Quality Models Watershed Loading Models An ArcView GIS Tool for Pollutant Load Application (PLOAD)
Model Objective. The PLOAD model was designed to be a screening tool for end users. This generic model can be used as an analytical tool for many applications, such as National Pollutant Discharge Elimination System (NPDES) stormwater permitting, watershed management, and reservoir protection projects. This simple model based on geographical information system (GIS) calculates pollutant loads for watersheds or sub-watersheds. It estimates nonpoint sources of pollution on an annual average basis for any user-specified pollutant. These nonpoint source loads may be calculated by using either the “export coefficient” method or the U.S. Environmental Protection Agency (USEPA) simple method approach. Optionally, Best Management Practices (BMPs), which serve to reduce nonpoint source loads, may also be included in computing total watershed loads. The model is suitable for both urban and rural study areas (USEPA, 2001b).
Spatial Feature. Watershed boundaries can be defined through the “Delineation
extensions” tool in the Better Assessment Science Integrating Point and Nonpoint Sources (BASINS) system developed by the USEPA. Delineation of the watershed requires reach, digital elevation model (DEM), and hydrologic unit files (USEPA, 2001a).
Temporal Feature. The PLOAD model enables users to study long-term impacts
because it requires only the annual precipitation value and ratio of storms producing runoff (USEPA, 2001b). It is not appropriate for the simulation of rainfall event-driven constituents.
Pre/Post Processor. The PLOAD application requires preprocessed GIS and tabular
input data (watershed boundary file, land-use file, and BMP site as point and area data). It does not require any other postprocessor programs except GIS.
Constituents Simulated. The following constituents can be simulated: biochemical
oxygen demand (BOD), chemical oxygen demand (COD), total suspended solid (TSS), total dissolved solids, total nitrogen, nitrate and nitrite nitrogen, total Kjeldahl nitrogent (TKN), ammonia nitrogen, organic nitrogen, total phosphorus, dissolved phosphorus, zinc, copper, lead, cadmium, chromium, nickel, and fecal coliform (USEPA, 2001b).
Model Components. The PLOAD model requires GIS input data, such as watershed
boundary, land-use, and BMP site files as point and area data. Prior to calculating pollutant loads, the model spatially overlays the watershed and land-use files to determine the area of the various land-use types for each watershed. The land-use file should encompass the entire watershed file. The model also requires the following four tabular input data: pollutant loading rate table, impervious factor table for each land use, efficiency information table indicating pollutant removal rate of each BMP type, and point source facility locations and loads table. In addition, if the simple method is specified, annual precipitation and ratio of storms producing runoff values should be provided (USEPA, 2001b).
225
Soil and Water Assessment Tool (SWAT)
The SWAT model was developed and maintained by the U.S. Department of Agriculture (USDA) Agricultural Research Service or ARS (Arnold et al., 1998). It incorporates features of several ARS models and is a direct outgrowth of the Simulator for Water Resources in Rural Basins (SWRRB) model (Williams et al., 1985) and Routing Outputs to Outlet (ROTO) model (Arnold et al., 1995). Specific models that contributed significantly to the development of SWAT were the Chemicals, Runoff, and Erosion from Agricultural Management Systems (CREAMS) model (Knisel, 1980), Groundwater Loading Effects on Agricultural Management Systems (GLEAMS) model (Leonard et al., 1987), and Erosion-Productivity Impact Calculator (EPIC) model (Williams et al., 1984). The latest version, SWAT2000, is incorporated into the BASINS3.0 model.
Model Objective. The SWAT model was developed to predict the impact of land
management practices on water, sediment, and agricultural chemical yields in large complex watersheds with varying soils, land-use, and management conditions over long periods of time. The SWAT model is ideally suited to rural areas dominated by agricultural applications and requires a great amount of data for vegetative changes and agricultural practices (Neitsch et al., 2002). The SWAT model is appropriate for various watershed and water quality modeling studies. For example, it has been used for national and regional water resource assessment considering both current and projected management conditions; assessment of the impact of global climate on water supply and quality in the United States and Europe; simulation of a single watershed or a system of multiple hydrologically connected watersheds (Neitsch et al., 2002); sediment and phosphorus transport (Kirsch, et al., 2002); total maximum daily load (TMDL) development for watersheds dominated by agricultural operations (Srinivasan et al., 2002); evaluation of sediment, nitrogen, and phosphorus loadings from various sources, including dairy waste application areas, waste treatment plants, urban areas, conventional row crops, and rangeland; and point and nonpoint source pollution analyses (Santhis et al., 2001).
Spatial Feature. Watershed boundaries can be defined through the “Delineation
extensions” tool in the system. Delineation of the watershed requires reach, DEM, and hydrologic unit files (USEPA, 2001a). The hydrologic response units (HRU) distribution can be defined exclusively using the “Land use and Soil overlay and HRU distribution extension” in BASINS. Each watershed is divided into sub-basins and then into HRUs based on land use and soil distributions (Neitsch et al., 2002).
Temporal Feature. The SWAT model uses a daily time step for simulations running
from one to 100 years allowing long-term impact analyses (Neitsch et al., 2002). However, it is not appropriate for the simulation of rainfall event-driven constituents, such as pathogens and bacteria. This model uses a daily interval precipitation, temperature, solar radiation, wind speed, potential evapotranspiration, and relative humidity data (Neitsch et al., 2002).
Pre/Post Processor. The Generation and Analysis of Model Simulation Scenarios
(GenScn) serves as a postprocessor for the SWAT model, as well as a tool for visualizing observed water quality data and other time series data. It allows users to select locations and time periods within the subject watershed area and to create tables and graphs based on these
226

selections. It can process a variety of data formats, including SWAT output data. It also performs statistical functions and data comparisons (USEPA, 2001a).
Constituents Simulated. The following constituents can be simulated: water flow,
sediment loading, organic nitrogen, organic phosphorus, nitrate, mineral (soluble) phosphorous, ammonium, nitrite, algae as chlorophyll a, conservative metals (aluminum, antimony, arsenic, cadmium, etc.), persistent bacteria, less persistent bacteria (fecal coliform), carbonaceous BOD, DO, and pesticides (Neitsch et al., 2002).
Model Components. Major model components describe processes associated with water
movement, sediment movement, soils, temperature, weather, plant growth, nutrients, pesticides and land management (Neitsch et al., 2002). The SWAT model uses seven input files and databases to store required information about plant growth and urban land uses, tillage, fertilizer components, and pesticide properties (Neitsch et al., 2002).
Hydrological Simulation Program-Fortran Version 12 (HSPF) Pervious Land (PERLND) and Impervious Land (IMPLND) Modules
The first version of the HSPF module was released in 1976 by the USEPA and was created by combining three pre-existing models: the Hydrocomp Simulation Program (HSP), the Agricultural Runoff Management Model (ARM), and the Nonpoint Source Pollutant Loading Model (NPS). Pre- and postprocessing components were added by the USEPA and U.S. Geological Survey (USGS) in 1980s. Version 12 comes with BASINS (Bicknell et al., 2001) and is accessed through a user-friendly Windows-based graphical user interface called WinHSPF.
Model Objective. As an analytical tool, the HSPF model has been used for flood control
planning and operation; river basin and watershed planning; storm drainage analysis; fate, transport, exposure assessment, and control of pesticides, nutrients, and toxic substances (Donigian et al, 1997); water quality planning and management (Bicknell et al., 1985); point and nonpoint source pollution analyses (Donigian et al., 1991); soil erosion and sediment transport studies; and evaluation of urban and agricultural BMPs (Moore et al., 1992), and for evaluating the impacts of land-use changes (Brun and Band, 2000). This model is suitable for both urban and rural areas (Donigian et al., 1991).
Spatial Feature. Watershed boundaries can be defined through the “Delineation
extensions” tool in the BASINS systems. Watersheds ranging in size from a few square miles to several thousand square miles have been modeled for hydrology, sediment, and water quality simulations using the HSPF module. Delineation of the watershed requires reach (National Hydrography Dataset reach layer, DEM, and watershed boundary (hydrologic cataloging unit layer). The model subdivides large watersheds into smaller, more uniform pervious and impervious land segments based on land use in the watershed. The HSPF model requires users to have a User Control Input (UCI) file to run it. To create a UCI file, three types of data required: spatially distributed data (land use, reach file, soils, DEM, USGS hydrologic unit boundaries, dam sites); environmental monitoring data (locations of water quality monitoring stations, weather station and USGS gaging stations); and point source data (industrial facilities discharge
227

sites, toxic release inventory sites, permit compliance system sites, and loadings) (Bicknell et al., 1985). The HSPF has three sub-modules: Pervious Land (PERLND), Impervious Land (IMPLND), and Reaches (RCHRES). The PERLND sub-module has 12 sub-modules, that require data on air temperature, snow and ice, water budget, sediment, soil temperature, water temperature, water quality constitutions, soil moisture, detailed pesticide, nitrogen, and phosphorous behaviors, and tracer. The IMPLND sub-module also has six sub-modules that require data on air temperature, snow and ice, water budget, solids, water temperature, and wash off of quality constituents. The RCHRES sub-module which simulates in-stream behavior and has 11 sub-modules that simulate hydraulics, inorganic sediment, and generalized quality constituent behaviors, advection, conservative constituents, water temperature, DO, BOD, nitrogen and phosphorus balances, plankton, and pH (Bicknell et al., 1985).
Temporal Feature. The HSPF continuous simulation model also is capable of simulating
individual storms. It can be run using a computational time step as small as one minute, but an hourly time step is commonly used. The model can generate outputs on an hourly and a daily basis. It enables users to study both long-term and short-term impacts. It is appropriate for the simulation of rainfall event-driven constituents because it uses hourly interval precipitation data (USEPA, 2001a). It uses both hourly and daily weather data. For example, hourly data used include precipitation, evaporation, temperature, wind speed, solar radiation, potential evapotranspiration, dewpoint temperature, and cloud cover. Precipitation data, the most deterministic input, drive the hydrology of this model. Daily data can be disaggregated into hourly data using the Disaggregation Tool within the Weather Data Management Utility (WDMUtil) program linked to the HSPF model (Hummel et al., 2001).
Pre/Post Processor. As a preprocessor, the HSPF model uses WDMUtil to manage
weather data, streamflow data, and other forms of input data series used by the model. Although HSPF model outputs can be viewed and processed in WDMUtil to some extent, a more advanced GenScn post-processor is used in conjunction with the HSPF model. This postprocessor facilitates the display and interpretation of output data derived from model applications, and performs statistical functions and data comparisons (USEPA, 2001a). It allows users to select locations and time periods within the subject watershed area and to create tables and graphs based upon these selections. Due to these qualities, GenScn helps in model calibration and analysis of different environmental systems. In addition, the Expert System for Calibration of HSPF (HSPEXP) can be used to facilitate hydrologic calibration of the model (USGS, 1994).
Constituents Simulated. The HSPF model can simulate the following constituents:
streamflow (as a sum of surface runoff, interflow, and baseflow) sediment loading, inorganic suspended sediment, pathogens, BOD, DO, pH, pesticide chemicals, inorganic nitrogen, nitrite, ammonia, nitrate, orthophosphate, phosphorus, phosphate, inorganic phosphorus, tracers (chloride, bromide, dyes, etc.), carbon dioxide, inorganic carbon, zooplankton, phytoplankton, benthic algae, organic carbon, fecal coliform, pH, and alkalinity (Bicknell et al., 2001).
Model Components. The HSPF model contains three application modules and five
utility modules. The application modules simulate the hydrologic/hydraulic and water quality components of the watershed. The utility modules are used to manipulate and analyze time-series data (Bicknell et al., 2001).
228

Application Modules. The HSPF model has three application modules: PERLND, IMPLND, and RCHRES. As PERLND simulates the water quality and quantity processes that occur on pervious land areas, it is the most frequently used part of the HSPF model. To simulate these processes, PERLND models the movement of water along three paths: overland flow, interflow, and groundwater flow. Each of these three paths experiences differences in time delay and differences in interactions between water and its various dissolved constituents. A variety of storage zones are used to represent the processes that occur on the land surface and in the soil horizons. Snow accumulation and melt also are included in the PERLND module so that the complete range of physical processes affecting the generation of water and associated water quality constituents can be represented (Bicknell et al., 2001). Some of the many capabilities available in the PERLND module include the simulation of water budget, snow accumulation and melt, sediment production and removal, nitrogen and phosphorous behavior, pesticide behavior, and movement of a tracer chemical.
The IMPLND model is used in urban areas where little or no infiltration occurs.
However, some land processes do occur, and water, solids, and various pollutants are removed from the land surface by moving laterally downslope to a pervious area, stream channel, or reservoir. The IMPLND model includes all pollutant washoff capabilities of the commonly used urban runoff models, such as the storage, treatment, overflow, runoff model (STORM), and storm water management model (SWMM) (Bicknell et al., 2001).
Receiving Water Models Hydrological Simulation Program-Fortran Version 12 (HSPF) Reaches (RCHRES) Module
Model Objective. This analytical tool, has applications in planning, design, and
operation of water resources systems. The model enables the use of probabilistic analysis in the fields of water quality management. The HSPF model uses such information as the time history of rainfall, temperature, evaporation, and parameters related to land-use patterns, soil characteristics, and agricultural practices to simulate processes that occur in a watershed (Bicknell et al., 2001). Model applications and uses are water quality planning and management, point and nonpoint source pollution analyses and fate, transport, exposure assessment, and control of pesticides, nutrients, and toxic substances (Bicknell et al., 1985; Donigian et al., 1984).
Hydraulics. The HSPF dynamic model is appropriate for simulation of rainfall event-
driven constituent transport and transformation (USEPA, 2001a). The HSPF model can simulate the continuous, dynamic event or steady-state behavior of both hydrologic/hydraulic and water quality processes in a watershed. It can be used to simulate time-varying flow conditions.
Spatial Feature. The HSPF is a one-dimensional model (Duda et al., 2001). It requires
input data for river geometry and boundary conditions, inflows, withdrawals, and meteorology of each sub-basin (USEPA, 1997).
229

Temporal Feature. The HSPF model allows users to study both long-term and short-term impacts. Any time period from a few minutes to hundreds of years may be simulated (USGS, 2003d). In order to run the HPSF model, hourly precipitation metrological data are required (Hummel et al., 2001).
Constituents Simulated. The HSPF model can simulate sediment loading, inorganic
suspended sediment, pathogens, BOD, DO, pH, pesticide chemicals, inorganic nitrogen, nitrogen, nitrite, nitrate, ammonia, orthophosphate, organic phosphorous, inorganic phosphorus, tracers (chloride, bromide, dyes, etc.), carbon dioxide, inorganic carbon, organic carbon, zooplankton, phytoplankton, benthic algae, fecal coliform, and alkalinity (Bicknell et al., 2001).
The RCHRES module is used to route runoff and water quality constituents simulated by the PERLND and IMPLND models through stream channel networks and reservoirs. A number of processes can be modeled, including hydraulic behavior; water temperature, inorganic sediment depositions, scour, and transport by particle size; chemical partitioning, hydrolysis, volatilization, oxidation, biodegradation, and radionuclide decay: DO, and BOD balances; inorganic nitrogen and phosphorous balances; plankton populations; and pH, carbon dioxide, total inorganic carbon, and alkalinity (Bicknell et al., 2001).
Enhanced Stream Water Quality (QUAL2E) Model
Model Objective. The Enhanced Stream Water Quality (QUAL2E) model is intended for use as a water quality-planning tool for developing TMDLs. This model has been used to study the impact of wasteloads on in streamwater quality and to identify the magnitude and quality characteristics of nonpoint waste loads as part of a field-sampling program (USEPA, 2003d). This model is applicable to well-mixed, dendritic streams, and it allows users to simulate the fate and transport of water quality constituents in streams under a given flow condition such as steady flow (USEPA, 2001a).
Hydraulics. In general, the QUAL2E model is classified as a steady-state water quality
model. However, it also can be operated as a quasi-dynamic model, making it a very helpful water quality-planning tool. When operated as a steady-state model, this model can be used to study the impact of wasteloads (magnitude, quality, and location) on in-stream water quality. Otherwise, by operating the model dynamically, the user can study the effects of diurnal variations in meteorological data on water quality (primarily DO and temperature) and also can study diurnal variations due to algal growth and respiration. However, this model cannot model the effects of dynamic forcing functions, such as time-varying headwater flows or point loads (USEPA, 1995).
Spatial Feature. The QUAL2E is a one dimensional (longitudinal) stream water quality
model. In riverine systems, lateral and vertical gradients in water quality constituent concentrations are generally insignificant and unimportant relative to longitudinal gradients. Thus, a one-dimensional model can be used for most riverine water quality issues considered (USEPA, 1995). The model is appropriate when flows are relatively constant or change slowly during the simulation with respect to the travel time of the system (USEPA, 1995). The travel
230

time is how long it takes for a “parcel of water” to travel from one point to another. The model cannot simulate the effects of flow variations on constituent concentration and travel time.
This model represents the stream as a system of reaches of variable length, each of which
is subdivided into computational elements of the same length in all reaches (USEPA, 1997). It requires input data for river geometry, stream network, flow, boundary conditions, climate, 26 properties for each reach (physical, chemical, and biological), inflows, and withdrawals (USEPA, 1997). The model also incorporates the dam aeration theory to simulate instantaneous change in DO over low-head dams.
Temporal Feature. A steady-state model such as the QUAL2E is limited to the
simulation of time periods during which both the streamflow in river basins and input wasteloads are essentially constant (USEPA, 1995). A daily time step is required for QUAL2E reaction coefficients (USEPA, 1995). Modeling steady-state temperature and algae requires average daily local climatologial data. However, dynamic simulations require local climatological data supplied at regular (typically 3-hour) intervals (USEPA, 1987).
Constituents Simulated. The QUAL2E model simulates water quality constituents under
either steady-state or quasi-dynamic conditions (USEPA, 1997). It can simulate the major reactions of nutrient cycles, algal production, benthic and carbonaceous demand, atmospheric reaeration, and their effects on the DO balance. It can predict up to 15 water quality constituent concentrations (USEPA, 2003d). The model can simulate the following constituents: DO, BOD, ultimate BOD, 5-day BOD, temperature, algae as chlorophyll a, organic nitrogen, ammonia as nitrogen, nitrite as nitrogen, nitrate as nitrogen, organic phosphorus, dissolved phosphorus, coliform, arbitrary nonconservative constituent, and three conservative constituents (USEPA, 1995).
The Water Quality Analysis Simulation Program (WASP 6) Model
Model Objective. The WASP 6 model is a general-purpose modeling system for assessing the fate and transport of conventional and toxic pollutants in surface water bodies (USEPA, 1997). This dynamic compartment model can be used to analyze a variety of water quality problems in such diverse water bodies as ponds, streams, lakes, reservoirs, rivers, estuaries, and coastal waters (Wool et al., 2003).
Hydraulics. The WASP 6 model is a dynamic model. For dynamic simulations, the user
must specify initial constituent concentrations (flows and loadings) at the beginning of the simulation (Wool et al., 2003). It can be used to simulate time-varying flow conditions.
Spatial Feature. The WASP 6 model allows users to structure one-, two-, and three-
dimensional models (Wool et al., 2003). By using three-dimensional structure, users can simulate estuaries successfully (USEPA, 1997). The water body is divided into a series of segments for simulation purpose. Loads, boundary concentrations, and initial concentrations must be specified for each state variable (USEPA, 1997). It requires input data for water body geometry, climate, water body segmentation, flow (or input from hydrodynamic model),
231

boundary conditions, initial conditions, benthic flux, external loadings, spatially variable and time-variable functions, and rate constants (USEPA, 1997).
Temporal Feature. In general, the WASP 6 model is a short-term water quality analysis
model. The water volume and water quality constituent masses being studied in this model are accounted for over time and space using a series of mass balancing equations (Wool et al., 2003). It also allows a more detailed examination of both short-term and long-term receiving water responses as well. (USEPA, 1997). The model represents time-varying processes of advection, dispersion, point and diffuse mass loading, and boundary exchange. For water quality simulation, a time step option (day, hour, and minute as initial time and day as final time) is available (Wool et al., 2003).
Constituents Simulated. The WASP 6 model has two kinetic sub-models to simulate
two of the major classes of water quality problems: conventional pollution involving DO, BOD, phytoplankton carbon, phytoplankton nitrogen, ammonia nitrogen, nitrate nitrogen, organic nitrogen, ammonium, total Kjeldahl nitrogen (TKN), inorganic phosphorus, organic phosphorous, eutrophication, and toxic pollution involving organic chemicals, metals, and sediment (Wool et al., 2003).
A Dynamic, One-Dimensional (Longitudinal) Water Quality Model for Streams (CE-QUAL-RIV1)
Model Objective. The CE-QUAL-RIV1 model was developed to predict one-
dimensional hydraulic and water quality variations in streams and rivers with highly unsteady flows. It has been applied for a wide variety of conditions, such as regulated streams (navigable waterways with multiple locks and dams and stream re-regulation), reservoir tailwaters, and large rivers. It is applicable where lateral and vertical variations are small (USACE, 2002).
Hydraulics. The CE-QUAL-RIV1 model was developed for time-varying and highly
unsteady flow conditions, such as a riverine system resulting from the releases from peaking hydropower dams over a limited period of time (USACE, 1995). It can also be used for predictions under steady flow conditions (USACE, 2002).
Spatial Feature. The CE-QUAL-RIV1 model is a one-dimensional (cross-sectional
averaged) model, which resolves longitudinal variations in hydraulic and quality characteristics (USACE, 2002). In riverine systems, vertical temperature, density, and chemical stratifications, which can play a dominant role in the water quality of lakes and reservoirs, are nonexistent or negligible for practical purposes. Thus, although this model can be used for run-of-the-river reservoirs, dams, and regulated pools, the user must be sure that vertical stratification does not exist or is so minor that it does not affect water quality conditions (USACE, 1995). This model also has several desirable numerical features, such as a two-point, fourth-order scheme for accurately predicting the advection of water quality concentrations (USACE, 1995).
The CE-QUAL-RIV1 model requires input data for river geometry and upstream
boundary conditions, river segmentation, initial conditions, inflows, withdrawals, meteorology, external loadings, benthic flux, spatially variable and time-variable functions, and rate (USEPA, 1997).
232
Temporal Feature. In general, the CE-QUAL-RIVE1 model is a short-term water quality model. Meteorological data of 1- or 3-hour intervals are needed from National Oceanic and Atmospheric Administration (NOAA). The model allows hourly, daily, monthly, and yearly-based simulation (USACE, 1995).
Constituents Simulated. The CE-QUAL-RIV1 model can predict variations in each of
12 stated variables; temperature, carbonaceous BOD, organic nitrogen, ammonia nitrogen, nitrate plus nitrite nitrogen, DO, organic phosphorus, dissolved phosphates, algae, dissolved iron, dissolved manganese, and fecal coliform bacteria. In addition, it can simulate impacts of macrophytes (USACE, 2002).
Dynamic Toxics Wasteload Allocation (DYNTOX) Model
Model Objective. The DYNTOX model was developed for use in wasteload allocation of toxic substances. This tool assesses the impact of toxic discharges on receiving water quality over the entire range of historical and future conditions (USEPA, 1997). It is a probabilistic model to locate diffuse pollution. It is used mainly for aquatic ecosystems and has a specific interface (Environmental Software and Services, 2003). Additional new model features include partial mix factors and variable water quality criteria for metals and ammonia (Environmental Software and Services, 2003).
Hydraulics. The DYNTOX model is a steady and dynamic wasteload allocation (WLA)
model (Limo-Tech, 1985). But, in general, it is classified as a dynamic model (USEPA, 1997). Spatial Feature. The DYNTOX programs are designed mainly for use in rivers and
streams with one dimension (Limo-Tech, 1985). It requires input data for river geometry, flow (continuous records or statistical summaries), external loadings, and boundary conditions (USEPA, 1997).
Temporal Feature. This long-term model is limited when addressing time-variable
inputs and short-term violations of acute criteria (USEPA, 1997). As input, daily-based time-series flow data are required for continuous simulations (Limo-Tech, 1985).
Constituents Simulated. The DYNTOX model can simulate toxic discharge and
conservative and nonconservative substances (Limo-Tech, 1985).
233


Appendix 8. FoxDB Diagram
235
Sample Related
StationRelated
Parameter Related
Fox Database2/10/2003
Project Related
ResultsRelated
TBLResults_Val_NonNumeric
PK Sample_Code intPK IDLoc nvarcharPK Parameter_code int
Result_Value nvarcharFK3 Remark_Code nvarchar
Grade nvarcharComments char(10)
TBLMedium
PK Medium nvarchar
Medium_Description nvarchar
TBLQAPP_Group_Codes
PK QAPPCode int
Media_Group intParameter_Group int
TBLOrganization
PK Organization_ID int
Organization_Code nvarcharOrganization_Name nvarcharDescription nvarcharContact_Name nvarcharContact_Phone nvarcharAddress nvarchar
FK1 Zip intWeb_Site nvarchar
TBLQAPPGroups
PK,FK2 QAPPCode intPK,FK1 Parameter_Code int
TBLSample
PK Sample_Code intPK IDLoc nvarchar
FK3 Project_Code nvarcharStart_Date smalldatetimeMissing_Time varcharEnd_Date smalldatetime
FK4 Sample_Type nvarcharFK1 Composite_statistic_code nvarchar
Sample_Depth floatComment nvarcharStation_ID intMedium nvarchar
TBLStation_Type
PK Station_Type int
Primary_type nvarcharSecondary_type nvarcharNatural_indicator_type nvarchar
TBLReplicates
PK Parameter_code intPK Sample_Code intPK IDLoc nvarchar
Result_Value floatFK3 Remark_code nvarchar
Grade nvarcharAltSample_code intAltIDLoc nvarchar(1)
TBLParameter_Codes
PK Parameter_Code int
FK1 EPAGroup_Code intDecimal_Point intShort_Name nvarcharFull_Name nvarcharReporting_Units nvarchar
TBLZip
PK Zip int
City nvarcharState nvarchar
TBLComposite_Statistic
PK Composite_Statistic_Code nvarchar
Composite_Statistic_Name nvarcharComposite_Statistic_Description nvarchar
TBLReporting_Units
PK Reporting_Units nvarchar
Reporting_Units_Description nvarchar
TBLProject_Grade
PK Project_Code nvarchar
QAPP_Grade intCU_Grade intQAPPCode int
TBLEPA_Group_Code
PK EPAGroup_Code int
EPAGroup_Description nvarchar TBLSample_Type
PK Sample_Type nvarchar
Sample_Type_Description nvarchar
TBLResults
PK,FK2,FK2 Parameter_Code intPK,FK2 IDLoc nvarcharPK Sample_Code int
Result_Value floatFK3 Remark_Code nvarchar
Grade nvarcharComments nvarchar
TBLStation_Information
PK Station_ID int
Latitude floatLongitude float
FK1 Lat_Long_Accuracy_Code nvarcharEPA_Station_Code nvarcharUSGS_Station_Code intstationCode1 nvarcharstationcode2 nvarcharPlace_Name_Description nvarcharTempRiver_Stream_Lake nvarcharTotal_Area floatHydrologic_Unit_Code intWater_Body_Name nvarcharRF3_River_Reach nvarcharNHD_100K_River_Reach nvarcharAmbnt charStation_Type int
TblIDLocations
PK IDLoc nvarchar
ID_Description nvarchar
TBLProjects_Programs
PK Project_Code nvarchar
Program_Project nvarcharFK1 Organization_ID int
Project_Study_Area nvarcharProject_Purpose nvarcharProject_Start_Date smalldatetimeProject_End_Date smalldatetimeContact_Name nvarcharContact_Phone nvarchar
TblLandUsage
PK Station_ID int
Land_Use nvarcharLand_Use_Code nvarchar
TBLResults_Remarks
PK Remark_Code nvarchar
Remark_Description nvarchar
TBLLat_Long_Accuracy
PK Lat_Long_Accuracy_Code nvarchar
Accuracy_Description nvarchar
∞
∞
TBLMedia_Group
PK Media_Group int
Media_Group_Description nvarcharTBLParameter_Group
PK Parameter_Group int
First_Order_Parameter_Group nvarcharSecond_Order_Parameter_Group nvarchar
∞
TBLParameterCAS
Parameter_Code int
CASNum nvarchar
∞
∞
∞
∞
∞
∞
∞
∞
∞
∞∞
∞
∞∞
∞∞
∞
∞
∞
∞
∞
∞
∞∞
∞
∞
∞
Legend
PK The primary key of a relationaltable uniquely identifies eachrecord in the table.
FK A foreign key is a field in arelational table that matchesthe primary key column ofanother table.
BoldValue can not be NULL
One Many
∞
Relationship where the primary keyvalue of each record in the primarytable corresponds to many records
in the related table.
∞

Equal opportunity to participate in programs of the Illinois Department of Natural Resources (IDNR) and those funded by the U.S. Fish and Wildlife Service and other agencies is availableto all individuals regardless of race, sex, national origin, disability, age, religion, or other non-merit factors. If you believe you have been discriminated against, contact the funding source’scivil rights office and/or the Equal Employment Opportunity Officer, IDNR, One Natural Resources Way, Springfield, IL 62702-1271; 217/785-0067; TTY 217/782-9175.
� � �� �� � � � � �
� � � � �
� �� � � � ��������
������������
��� ���������