Embed Size (px)
DESCRIPTION
Fox Equation is very useful for predicting Tg of Polymer Blend and will be discussed in details in this paper
Citation preview
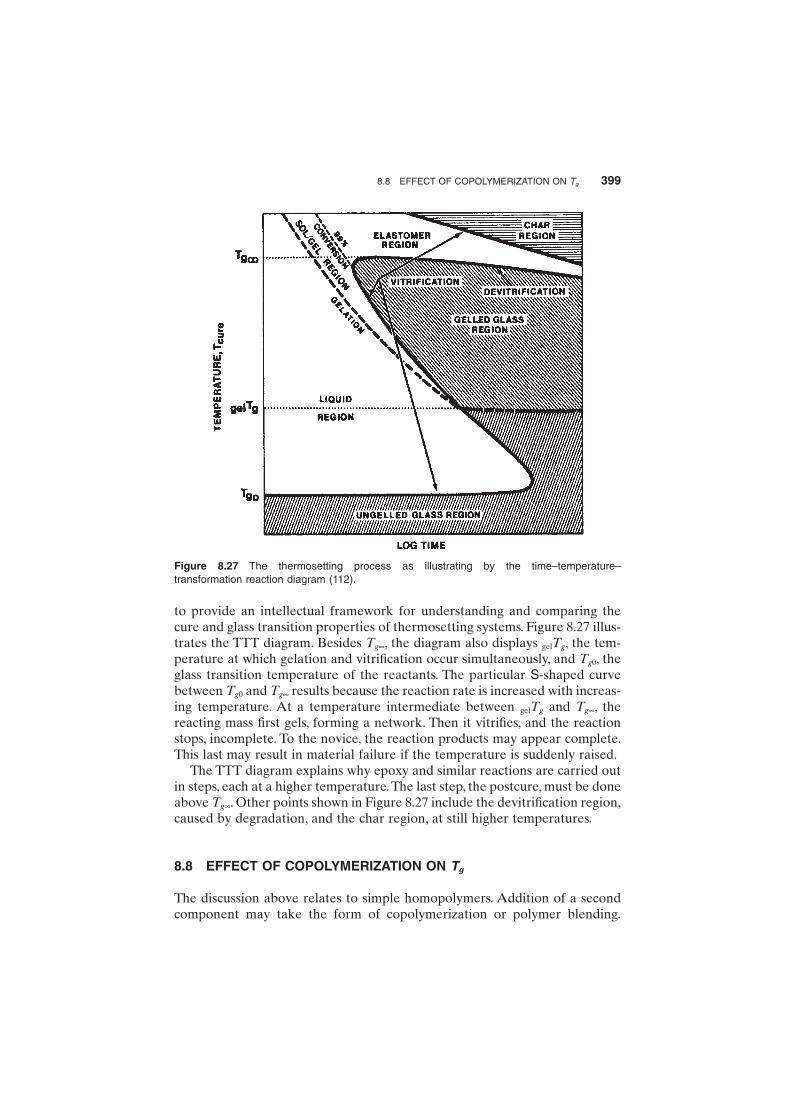
to provide an intellectual framework for understanding and comparing thecure and glass transition properties of thermosetting systems. Figure 8.27 illus-trates the TTT diagram. Besides Tg•, the diagram also displays gelTg, the tem-perature at which gelation and vitrification occur simultaneously, and Tg0, theglass transition temperature of the reactants. The particular S-shaped curvebetween Tg0 and Tg• results because the reaction rate is increased with increas-ing temperature. At a temperature intermediate between gelTg and Tg•, thereacting mass first gels, forming a network. Then it vitrifies, and the reactionstops, incomplete. To the novice, the reaction products may appear complete.This last may result in material failure if the temperature is suddenly raised.
The TTT diagram explains why epoxy and similar reactions are carried outin steps, each at a higher temperature.The last step, the postcure, must be doneabove Tg•. Other points shown in Figure 8.27 include the devitrification region,caused by degradation, and the char region, at still higher temperatures.
8.8 EFFECT OF COPOLYMERIZATION ON Tg
The discussion above relates to simple homopolymers. Addition of a secondcomponent may take the form of copolymerization or polymer blending.
8.8 EFFECT OF COPOLYMERIZATION ON Tg 399
Figure 8.27 The thermosetting process as illustrating by the time–temperature–
transformation reaction diagram (112).
Addition of low-molecular-weight compounds results in plasticization. Exper-imentally, two general cases may be distinguished: where one phase is retainedand where two or more phases result.
8.8.1 One-Phase Systems
Based on the thermodynamic theory of the glass transition, Couchman derived relations to predict the Tg composition dependence of binary mixtures of miscible high polymers (113) and other systems (114–116). Thetreatment that follows is easily generalized to the case for statistical copolymers (113).
Consider two polymers (or two kinds of mers, or one mer and one plasti-cizer) having pure-component molar entropies denoted as S1 and S2, and theirrespective mole fractions (moles of mers for the polymers) as X1 and X2. Themixed system molar entropy may be written
(8.64)
where DSm represents the excess entropy of mixing. For later convenience, S1
and S2 are referred to their respective pure-component glass transition tem-peratures of Tg1 and Tg2, when their values are denoted as S0
1 and S02.
Heat capacities are of fundamental importance in glass transition theories,because the measure of the heat absorbed provides a direct measure of theincrease in molecular motion. The use of classical thermodynamics leads to aneasy introduction of the pure-component heat capacities at constant pressure,Cp1 and Cp2:
(8.65)
The mixed-system glass transition temperature, Tg, is defined by the require-ment that S for the glassy state be identical to that for the rubbery state, at Tg.This condition and the use of appropriate superscripts G and R lead to theequation
(8.66)
Since Si0,G = Si
0,R (i = 1, 2) and XiG = Xi
R = Xi, equation (8.66) may be simplified:
(8.67)
X C C d T X C C d T S SpG
pR
T
T
pG
pR
T
T
mG
mR
g
g
g
g
1 1 1 2 2 21 2
0-( ){ } + -( ){ } + - =Ú Úln ln D D
X S C d T X S C d T S
X S C d T X S C d T S
G GpG
T
TG G
pG
T
T
mG
R RpR
T
TR R
pR
T
T
mR
g
g
g
g
g
g
g
g
1 10
1 2 20
2
1 10
1 2 20
2
1 2
1 2
, ,
, ,
ln ln
ln ln
+{ } + +{ } += +{ } + +{ } +
Ú Ú
Ú Ú
D
D
S X S C d T X S C d T SpT
T
pT
T
mg g
= +{ } + +{ } +Ú Ú1 10
1 2 20
21 2
ln ln D
S X S X S Sm= + +1 1 2 2 D
400 GLASS–RUBBER TRANSITION BEHAVIOR
In regular small-molecule mixtures, DSm is proportional to X lnX + (1 - X) ln(1 - X), where X denotes X1 and X2. Similar relations hold for polymer–solvent (plasticizer) and polymer–polymer combinations. Combined with thecontinuity relation, DSm
G = DSmR. For random copolymers these quantities are
also equal. Then
(8.68)
where D denotes transition increments. Again, the increase in the heat capac-ity at Tg reflects the increase in the molecular motion and the increased tem-perature rate of these motions.
After integration the general relationship emerges,
(8.69)
For later convenience the Xi are exchanged for mass (weight) fractions, Mi
(recall that the DCpi are then per unit mass), and equation (8.69) becomes
(8.70)
or equivalently
(8.71)
Equation (8.71) is shown to fit Tg data of thermodynamically miscible blends(see Figure 8.28). Four particular nontrivial cases of the general mixing rela-tion may be derived.
Making use of the expansions of the form ln(1 + x) = x, for small x, andnoting that Tg1/Tg2 usually is not greatly different from unity yield
(8.72)
which has the same form as the Wood equation (117), originally derived forrandom copolymers.
If DCpi Tgi = constant (76–78,118), the familiar Fox equation (119) appearsafter suitable crossmultiplying:
(8.73)1 1
1
2
2T
M
T
M
Tg g g
= +
TM C T M C T
M C M Cg
p g p g
p p
.1 1 1 2 2 2
1 1 2 2
D DD D
++
lnlnT
T
M C T T
M C M C
g
g
p g g
p p1
2 2 2 1
1 1 2 2
ÊË
ˆ¯ =
( )+
DD D
lnln ln
TM C T M C T
M C M Cg
p g p g
p p
=++
1 1 1 2 2 2
1 1 2 2
D DD D
X CT
TX C
T
Tp
g
g
pg
g
1 11
2 22
0D Dln lnÊË
ˆ¯ +
ÊË
ˆ¯ =
X C d T X C d TpT
T
pT
T
g
g
g
g
1 1 2 21 2
0D Dln lnÚ Ú+ =
8.8 EFFECT OF COPOLYMERIZATION ON Tg 401
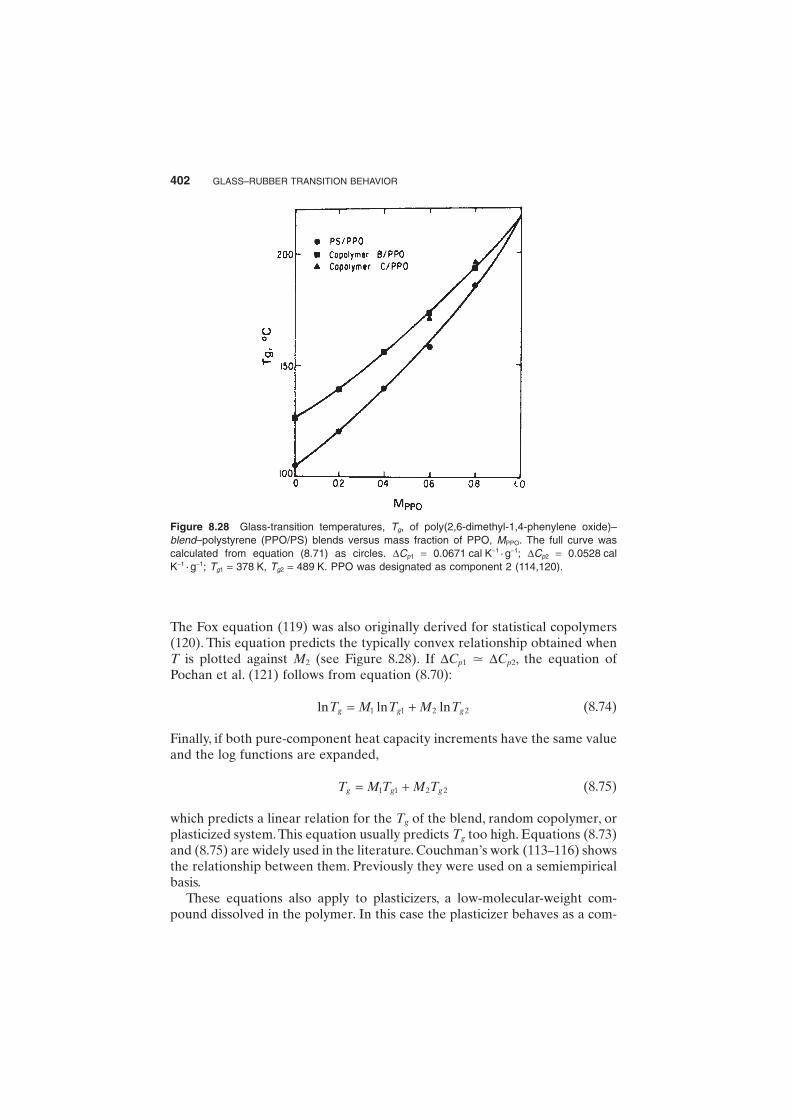
The Fox equation (119) was also originally derived for statistical copolymers(120). This equation predicts the typically convex relationship obtained whenT is plotted against M2 (see Figure 8.28). If DCp1 . DCp2, the equation ofPochan et al. (121) follows from equation (8.70):
(8.74)
Finally, if both pure-component heat capacity increments have the same valueand the log functions are expanded,
(8.75)
which predicts a linear relation for the Tg of the blend, random copolymer, orplasticized system.This equation usually predicts Tg too high. Equations (8.73)and (8.75) are widely used in the literature. Couchman’s work (113–116) showsthe relationship between them. Previously they were used on a semiempiricalbasis.
These equations also apply to plasticizers, a low-molecular-weight com-pound dissolved in the polymer. In this case the plasticizer behaves as a com-
T M T M Tg g g= +1 1 2 2
ln ln lnT M T M Tg g g= +1 1 2 2
402 GLASS–RUBBER TRANSITION BEHAVIOR
Figure 8.28 Glass-transition temperatures, Tg, of poly(2,6-dimethyl-1,4-phenylene oxide)–
blend–polystyrene (PPO/PS) blends versus mass fraction of PPO, MPPO. The full curve was
calculated from equation (8.71) as circles. DCp1 = 0.0671 cal K-1 · g-1; DCp2 = 0.0528 cal
K-1 · g-1; Tg1 = 378 K, Tg2 = 489 K. PPO was designated as component 2 (114,120).
pound with a low Tg. The effect is to lower the glass transition temperature.A secondary effect is to lower the modulus, softening it through much of thetemperature range of interest. An example is the plasticization of poly(vinylchloride) by dioctyl phthalate to make compositions known as “vinyl.”
8.8.2 Two-Phase Systems
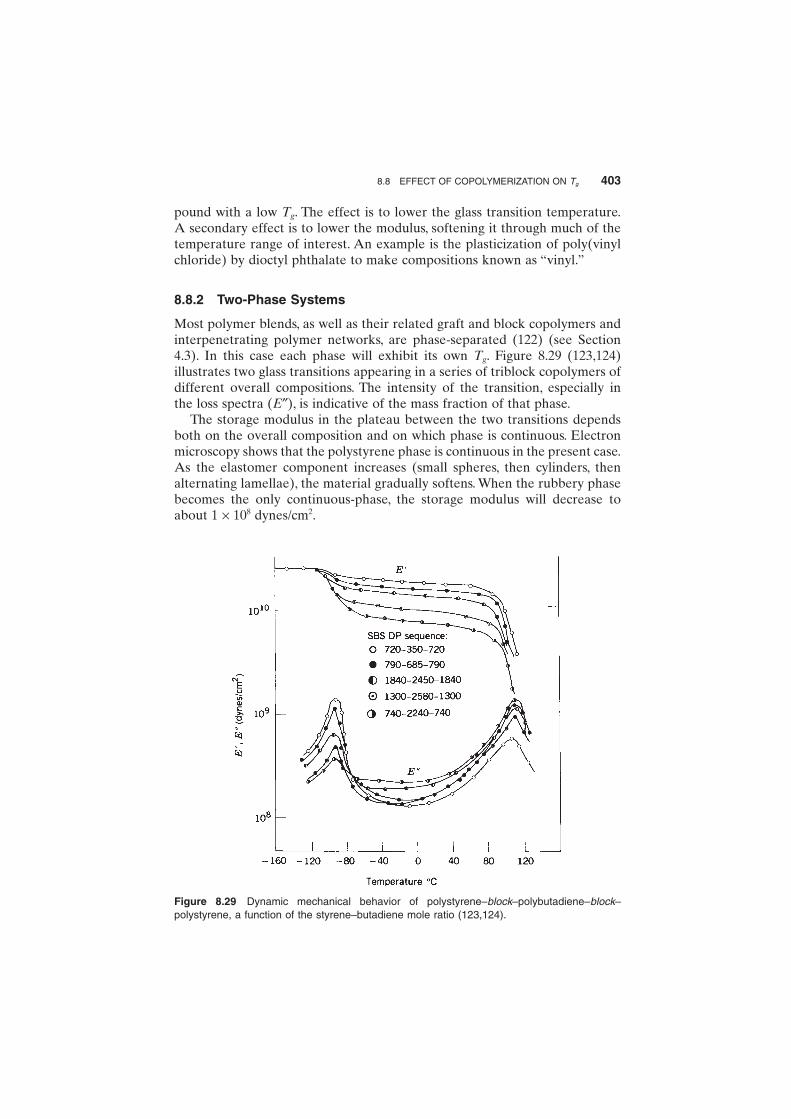
Most polymer blends, as well as their related graft and block copolymers andinterpenetrating polymer networks, are phase-separated (122) (see Section4.3). In this case each phase will exhibit its own Tg. Figure 8.29 (123,124) illustrates two glass transitions appearing in a series of triblock copolymers ofdifferent overall compositions. The intensity of the transition, especially in the loss spectra (E≤), is indicative of the mass fraction of that phase.
The storage modulus in the plateau between the two transitions dependsboth on the overall composition and on which phase is continuous. Electronmicroscopy shows that the polystyrene phase is continuous in the present case.As the elastomer component increases (small spheres, then cylinders, thenalternating lamellae), the material gradually softens. When the rubbery phasebecomes the only continuous-phase, the storage modulus will decrease toabout 1 ¥ 108 dynes/cm2.
8.8 EFFECT OF COPOLYMERIZATION ON Tg 403
Figure 8.29 Dynamic mechanical behavior of polystyrene–block–polybutadiene–block–
polystyrene, a function of the styrene–butadiene mole ratio (123,124).
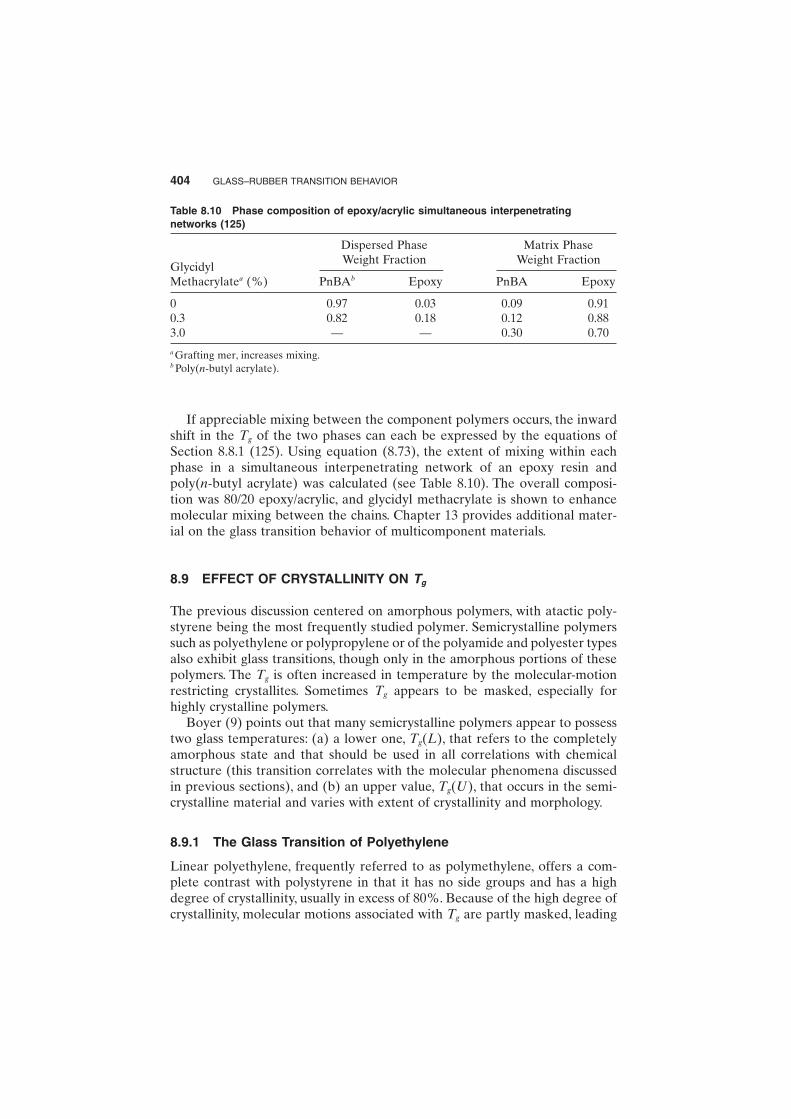
If appreciable mixing between the component polymers occurs, the inwardshift in the Tg of the two phases can each be expressed by the equations ofSection 8.8.1 (125). Using equation (8.73), the extent of mixing within eachphase in a simultaneous interpenetrating network of an epoxy resin andpoly(n-butyl acrylate) was calculated (see Table 8.10). The overall composi-tion was 80/20 epoxy/acrylic, and glycidyl methacrylate is shown to enhancemolecular mixing between the chains. Chapter 13 provides additional mater-ial on the glass transition behavior of multicomponent materials.
8.9 EFFECT OF CRYSTALLINITY ON Tg
The previous discussion centered on amorphous polymers, with atactic poly-styrene being the most frequently studied polymer. Semicrystalline polymerssuch as polyethylene or polypropylene or of the polyamide and polyester typesalso exhibit glass transitions, though only in the amorphous portions of thesepolymers. The Tg is often increased in temperature by the molecular-motionrestricting crystallites. Sometimes Tg appears to be masked, especially forhighly crystalline polymers.
Boyer (9) points out that many semicrystalline polymers appear to possesstwo glass temperatures: (a) a lower one, Tg(L), that refers to the completelyamorphous state and that should be used in all correlations with chemicalstructure (this transition correlates with the molecular phenomena discussedin previous sections), and (b) an upper value, Tg(U), that occurs in the semi-crystalline material and varies with extent of crystallinity and morphology.
8.9.1 The Glass Transition of Polyethylene
Linear polyethylene, frequently referred to as polymethylene, offers a com-plete contrast with polystyrene in that it has no side groups and has a highdegree of crystallinity, usually in excess of 80%. Because of the high degree ofcrystallinity, molecular motions associated with Tg are partly masked, leading
404 GLASS–RUBBER TRANSITION BEHAVIOR
Table 8.10 Phase composition of epoxy/acrylic simultaneous interpenetrating
networks (125)
Dispersed Phase Matrix Phase
GlycidylWeight Fraction Weight Fraction
Methacrylatea (%) PnBAb Epoxy PnBA Epoxy
0 0.97 0.03 0.09 0.910.3 0.82 0.18 0.12 0.883.0 — — 0.30 0.70
a Grafting mer, increases mixing.b Poly(n-butyl acrylate).


![O] information on triglyceride (TG) species, such as TG](https://img.pdfslide.us/doc/110x75/62cb3c5f42d02721c85055e4/o-information-on-triglyceride-tg-species-such-as-tg-.jpg)