Embed Size (px)
Citation preview

Fourth Quarter
2012
Grupo Aeroportuario del Centro Norte
Business and Strategy Overview

Our Location
13 airports and 1 hotel in 10 states in
the central-north of Mexico
* Based on 4Q12 passenger traffic
Pax: 12.6 million in 2012 (+7.0%)
Hotel NH T2
REX MTY
TAM
SLP
DGO
TRC
CUU
CJS
CUL
ZCL
ACA
ZIH
MZT
OMA holds 50-year
concessions to operate 13
airports; the concessions’
term started in 1998.
2
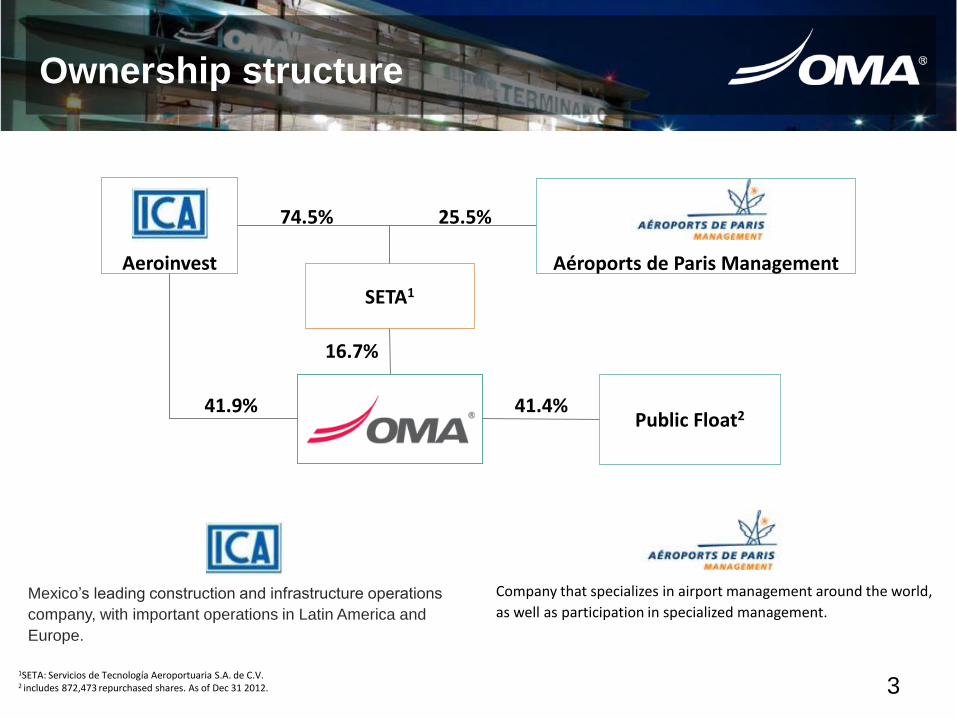
Mexico’s leading construction and infrastructure operations
company, with important operations in Latin America and
Europe.
Ownership structure
1SETA: Servicios de Tecnología Aeroportuaria S.A. de C.V. 2 includes 872,473 repurchased shares. As of Dec 31 2012.
Company that specializes in airport management around the world,
as well as participation in specialized management.
Aeroinvest
SETA1
Aéroports de Paris Management
25.5% 74.5%
16.7%
41.9%
Public Float2 41.4%
3

Main strategic actions
Increase aeronautical revenues
Air traffic
development
and
connectivity
Increase non-aeronautical revenues
Improve
passenger
experience
Diversification
Su
sta
ina
ble
co
mp
an
y
Op
era
tio
nal, s
ecu
rity
, an
d
eff
icie
nc
y le
ad
ers
hip

Current
Industry
outlook

Passenger traffic evolution
16 months of consecutive growth
+5.9% +1.6% +0.6% -18.1%
10.6
11.8
14.2 14.1
11.5 11.6 11.812.5
0
2
4
6
8
10
12
14
16
2005 2006 2007 2008 2009 2010 2011 2012 (udm nov-dic '11)
mil
lon
es
de
pa
xM
illio
n p
asse
nge
rs
12.6
7.0% growth from
2011 to 2012.
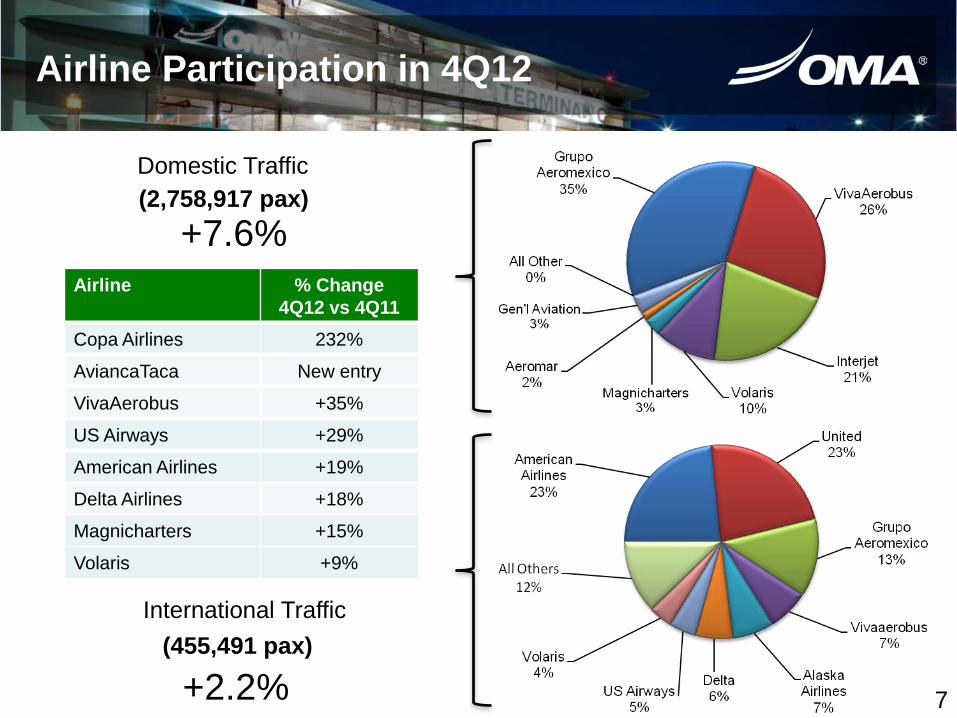
Airline % Change
4Q12 vs 4Q11
Copa Airlines 232%
AviancaTaca New entry
VivaAerobus +35%
US Airways +29%
American Airlines +19%
Delta Airlines +18%
Magnicharters +15%
Volaris +9%
Airline Participation in 4Q12
(2,758,917 pax)
(455,491 pax)
Domestic Traffic
International Traffic
+7.6%
+2.2% 7

Aircrafts available
-200
-160
-120
-80
-40
0
40
80
0
50
100
150
200
250
300
350 Avio
nes Perd
ido
s vs. Gan
ado
sA
vio
nes
Dis
po
nib
les
Aviones disponibles
Aviones perdidos - Aerolineas que dejaron de operar
Aviones nuevos - Aerolíneas existentes
(155)
80307
232
Jun ’08 Aug ’12
There is still a 75 aircraft deficit compared to June 2008.
Airline Average age
(years)
Total number
of aircrafts
Aeroméxico 9.1 113
Interjet 6.6 37
Vivaaerobus 21.8 18
Volaris 4.6 36
Aeromar 16.2 18
Magnicharters 26.6 12
jun-08 ago-12Aviones
Nuevosjun-08 ago-12
INTERJET 11 36 25 MEXICANA 78 0VOLARIS 17 37 20 ALMA 15 0
AEROMEXICO 94 114 20 AEROCALIFORNIA 22 0
VIVAAEROBUS 7 18 11 AVOLAR 8 0AEROMAR 14 16 2 ALADIA 3 0MAGNICHARTERS 5 9 4 AVIACSA 26 0
GLOBAL AIR 4 2 (2) NOVA AIR 3 0
Subtotal 152 232 80 Subtotal 155 0
Aerolíneas Existentes Aviones PerdidosExisting airlines Lost Aircrafts

Industry outlook
Fleet expansion plans of major mexican carriers Source: airlines
Airline Fleet Expansion plans
Aeroméxico • B737, B767, B777
• E145, E190
114 Has received 10 E190 planes in 2012, of an order of 20 placed in 2011. Will receive 1 additional B737-8 for 4Q12, out of an order of 10. It recently confirmed an order to buy 90 Boeing 737-8 and 10 787-9 planes.
Interjet • A320 36 In March it will start operations with Sukhoi regional jet. In 2013 it will receive 9 regional aircrafts and 6 more A320. Recently announced an order of 40 A320Neo aircrafts.
VivaAerobus • B737-300 18 In negotiation with Boing to make a fleet renovation in upcoming years with completely new aircrafts. Expected increase in fleet of 2 or 3 aircrafts in 2013.
Volaris • A319, A320 37 Plans to receive 6 A320 in 2012. For the next 15 years it will receive 44 A320 Neo Aircrafts.
Aeromar • ATR42-300 • ATR42-500
18 Added 2 planes in 2012. In 2013 it will increase its fleet with ATR aircrafts of more capacity.

Maximum Rates –
Formula Per Airport
n
nnn
n
nr
OWLMRTVNPV
)1(
)(15
1
NPV: Net Present Value, reference value of airport.
MR: Maximum Rate used to cap revenues from aeronautical services per
workload unit.
WL: Number of workload units forecasted per year (explicit forecast) in
the Master Development Plan.
O: Total outcome per year:
a. OPEX Operational costs anda expenditures (before depreciation and
amortization)
b. CAPEX Capital expeditures.
r: Discount rate.
n: Time period, every year included in the explicit forecast.
TV: Terminal Value, discounted value of all future cash flows beyond the
15th year.

Air traffic
Development
strategy

Four main actions to develop air traffic
1.- Develop a HUB in Monterrey airport
2.- Enhance the number of low cost passengers
3.- More aggressive incentive policy for new flights
4.- Increase the number of international flights

Four main actions to develop air traffic
1.- Develop a HUB in Monterrey Airport Current route network in Monterrey airport.
Chicago Tijuana
Cd. Juárez
Culiacán
Las Vegas
Atlanta
Guadalajara
Cancún
Hermosillo
Villahermosa
Dallas
Veracruz Bajío
Acapulco
Houston
Toluca
Mazatlán
Mérida
Querétaro
México
Tampico
Chihuahua
Detroit
Los Cabos
Oaxaca
Brownsville
San
Antonio
Tuxtla Gutiérrez
Panamá
Orlando
Costa Rica
La Habana
Monterrey
Puerto Vallarta
Conectivity in Monterrey increased to Cuba, Panama and Costa Rica. Potential for NY and Miami.

Four main actions to develop air traffic
1.- Develop a HUB in Monterrey Airport
Monterrey
Detroit
Toluca
El Paso
Laredo
New routes (january 2013)
New routes (april 2013)
Morelia
Chicago
Bajío
Routes that started in 2012
OMA proposed 35 potential routes to Aeroméxico, out of which 7 have started or will start in 2013.
E170 and E190 favor conectivity for regional routes.
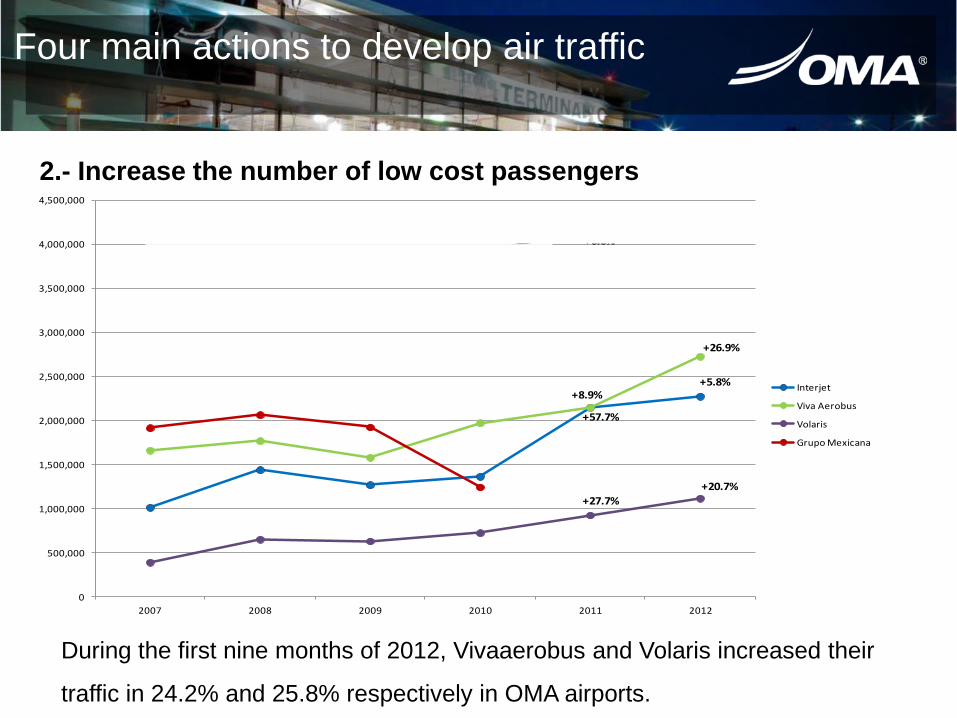
Four main actions to develop air traffic
2.- Increase the number of low cost passengers
During the first nine months of 2012, Vivaaerobus and Volaris increased their
traffic in 24.2% and 25.8% respectively in OMA airports.
0
500,000
1,000,000
1,500,000
2,000,000
2,500,000
3,000,000
3,500,000
4,000,000
4,500,000
2007 2008 2009 2010 2011 2012
Grupo Aeroméxico
Interjet
Viva Aerobus
Volaris
Grupo Mexicana
+6.6%
+57.7%
+8.9%
+27.7%
-0.5%
+5.8%
+26.9%
+20.7%
Var% 11/10 Var% 12/11

Four main actions to develop air traffic
Three main ways to increase low cost passengers:
1.- Global incentives offer
2.- Incentives policy with CANAERO
3.- Constant and direct promotion with airlines to promote new routes.
2.- Increase the number of low cost passengers

Four main actions to develop air traffic
3.- More aggressive incentive policy
A) New routes: 50% discount on landing fees, platform and jet bridges for the first 6
months of operation.
B) New frequencies: 50% discount on landing fees, platform and jet bridges for the first 6
months of operation depending on the non-peak hours of the airport for domestic
flights and 80% discount for international flights. From 50%, since November of 2011.
C) Marketing: one billboard at the airport and a promotional video of the new route in the
monitors that are inside the terminal building. Each marketing campaign has a 2
month period.

Four main actions to develop air traffic
3.- More aggressive incentive policy
Grant a 30% discount on TUA for national routes and 40% discount
on international routes that start in 2012.
Grant an incentive on incremental traffic volume: A) Turistic Airports
Year Airports % Growth Incentive
2012 ACA,MZT,ZIH, ZCL At least 5% 17%
At least 10% 20%
At least 15% 23%
At least 20% 26%
B) Regional, Border and Metropolitan Airports
Year Airports % Growth Incentive
2012 CJS,CUU,CUL,DGO,MTY,REX,SLP,TAM,TRC At least 5% 12%
At least 10% 15%
At least 15% 18%
At least 20% 21%
Four main actions to develop air traffic
Chicago Los Angeles
Phoenix
Culiacán
Las Vegas
Atlanta Dallas
Zihuatanejo
Houston
Mazatlán
Chihuahua
Detroit
Brownsville
San Antonio
Panamá
Orlando
Costa Rica
La Habana Monterrey
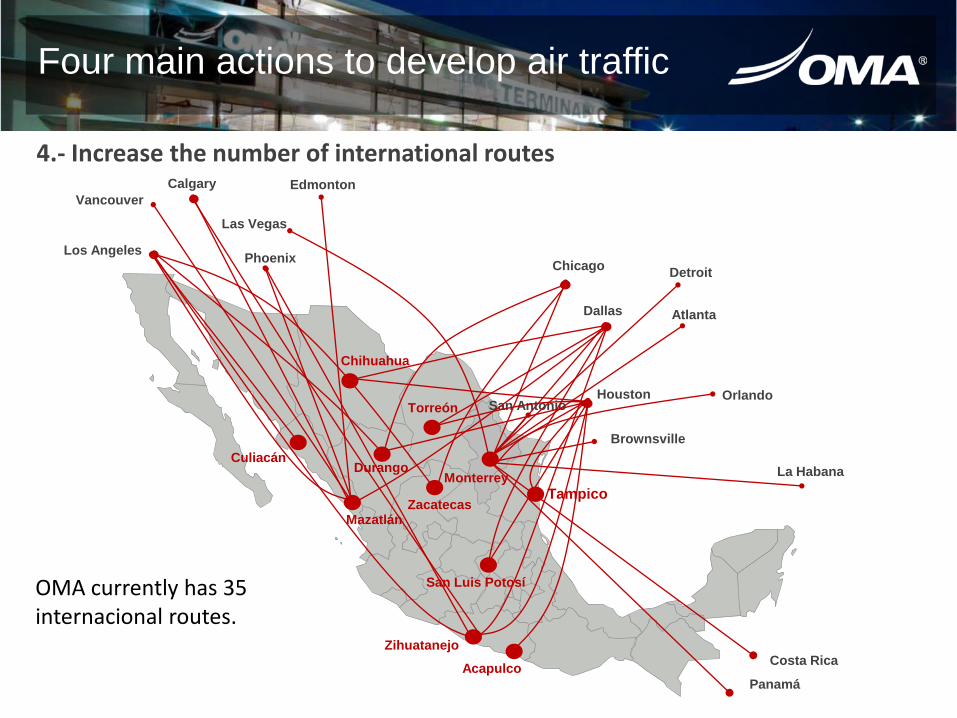
4.- Increase the number of international routes
Durango
Vancouver
Calgary Edmonton
San Luis Potosí
Tampico
Torreón
Zacatecas
Acapulco
OMA currently has 35 internacional routes.
Four main actions to develop air traffic
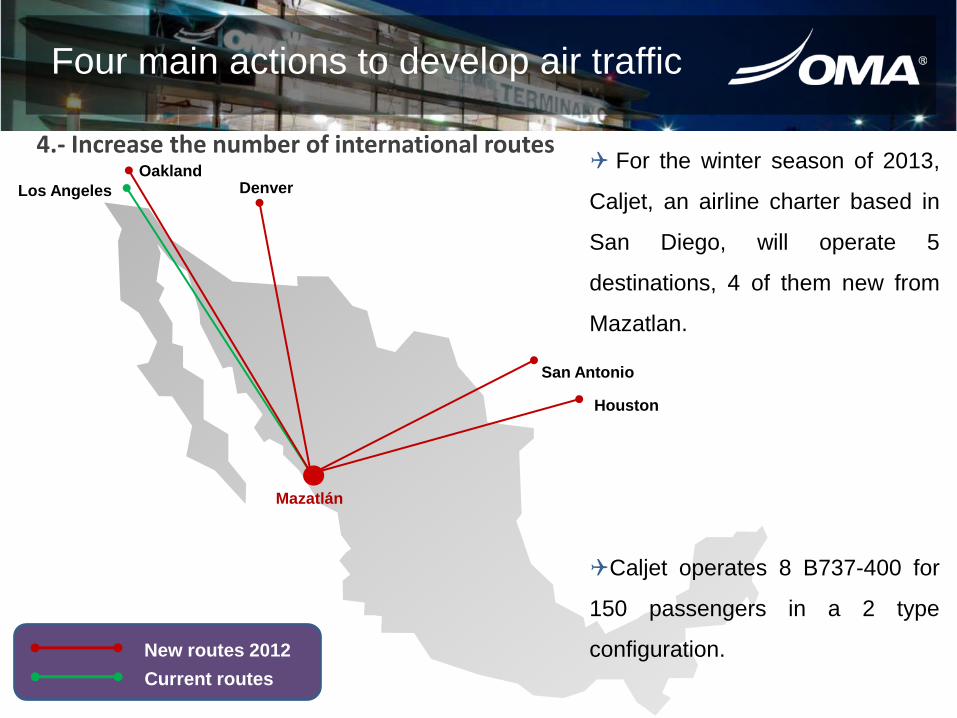
4.- Increase the number of international routes
Mazatlán
Los Angeles
Oakland Denver
San Antonio
Houston
New routes 2012
For the winter season of 2013,
Caljet, an airline charter based in
San Diego, will operate 5
destinations, 4 of them new from
Mazatlan.
Caljet operates 8 B737-400 for
150 passengers in a 2 type
configuration.
Current routes

Commercial
Strategy

Business Strategy Commercial activity development
Air traffic – Non Aeronautical Revenue (relation)
110 125 165
219 261
298 342
371 369
492
589
726
8.8 8.3 8.6 9.5
10.3 11.5
13.9 13.7
11.5 11.6 11.8 12.6
2001 2002 2003 2004 2005 2006 2007 2008 2009 2010 2011 UDM 2012
INA (MDP)
PAX (M)
NAR (Ps.M)

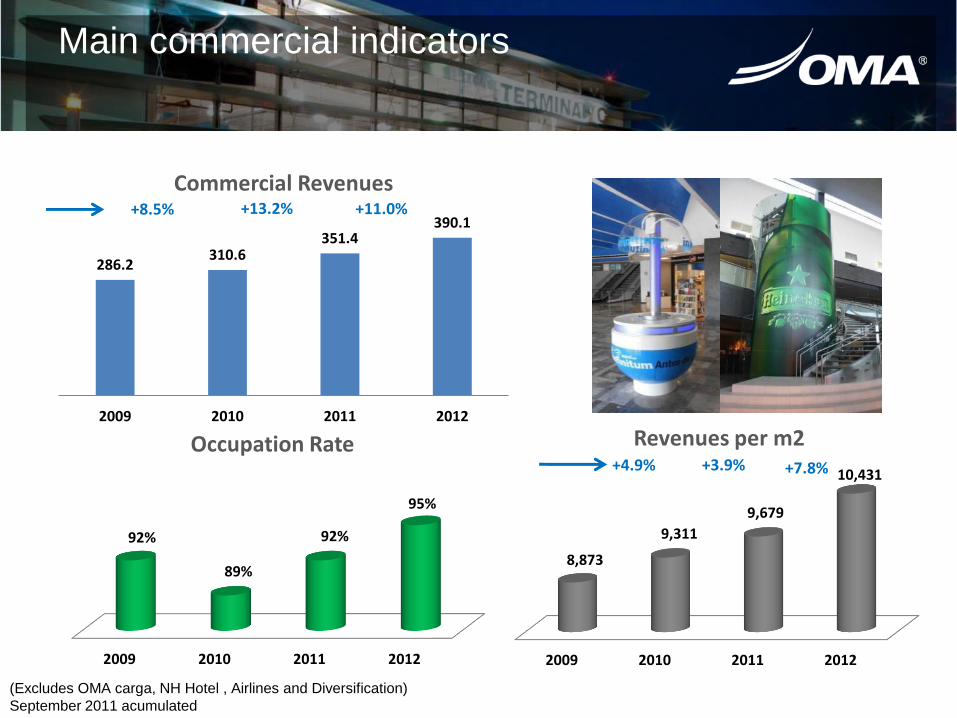
Commercial results
Commercial revenues are consistently growing in the last years:
Increasing by +11% and +Ps.38.6 million in 2012 Vs 2011.
The commercial revenue lines that have contributed the most to the variation, given its growth are the following:
Parking +10% ó +Ps. 10.9 million. Advertising +9% ó +Ps. 7.1 million. Passenger Service +205% ó +Ps. 6.1 million. Restaurants +14% ó +Ps. 5.2 million.
Average annual commercial spaces occupation from 89% in 2010 to 95% in December 2012
286.2 310.6
351.4 390.1
11.5 11.6
11.8
12.6
0
50
100
150
200
250
300
350
400
450
2009 2010 2011 2012
Commercial Income Pax
Note: Full year comparisons.
2009 2010 2011 2012
8,873
9,311
9,679
10,431
Revenues per m2
Main commercial indicators
+3.9% +4.9% +7.8%
(Excludes OMA carga, NH Hotel , Airlines and Diversification)
September 2011 acumulated
+13.2% +8.5% +11.0%
286.2 310.6
351.4 390.1
2009 2010 2011 2012
Commercial Revenues
2009 2010 2011 2012
92%
89%
92%
95%
Occupation Rate
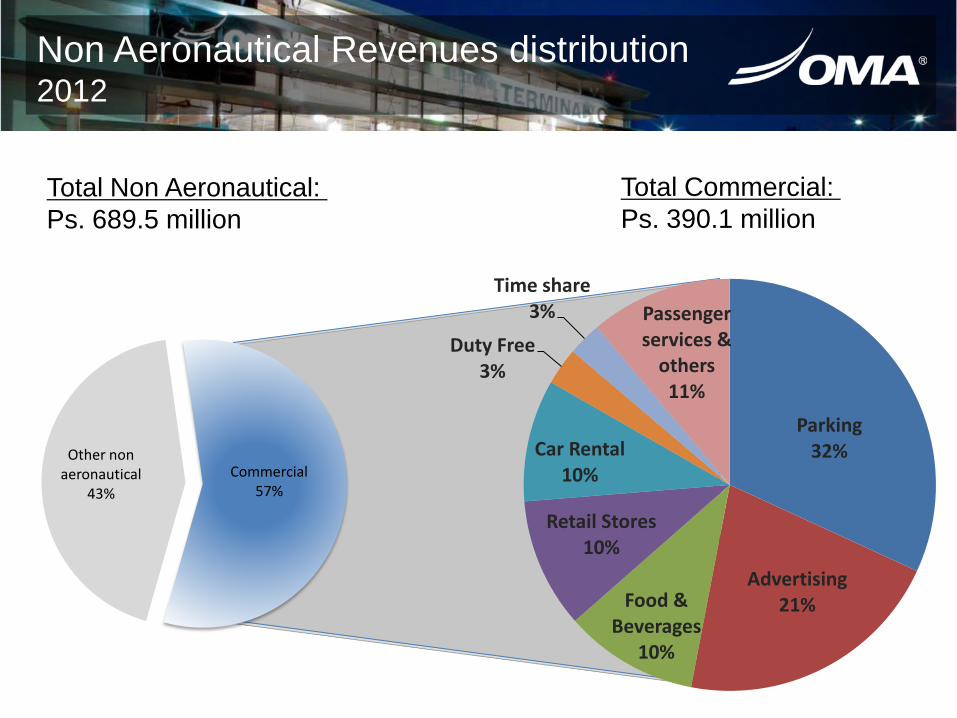
Non Aeronautical Revenues distribution 2012
Commercial 57%
Other non aeronautical
43%
Total Non Aeronautical:
Ps. 689.5 million
Total Commercial:
Ps. 390.1 million
Parking 32%
Advertising 21% Food &
Beverages 10%
Retail Stores 10%
Car Rental 10%
Duty Free 3%
Time share 3% Passenger
services & others
11%
Business Strategy Commercial activity development
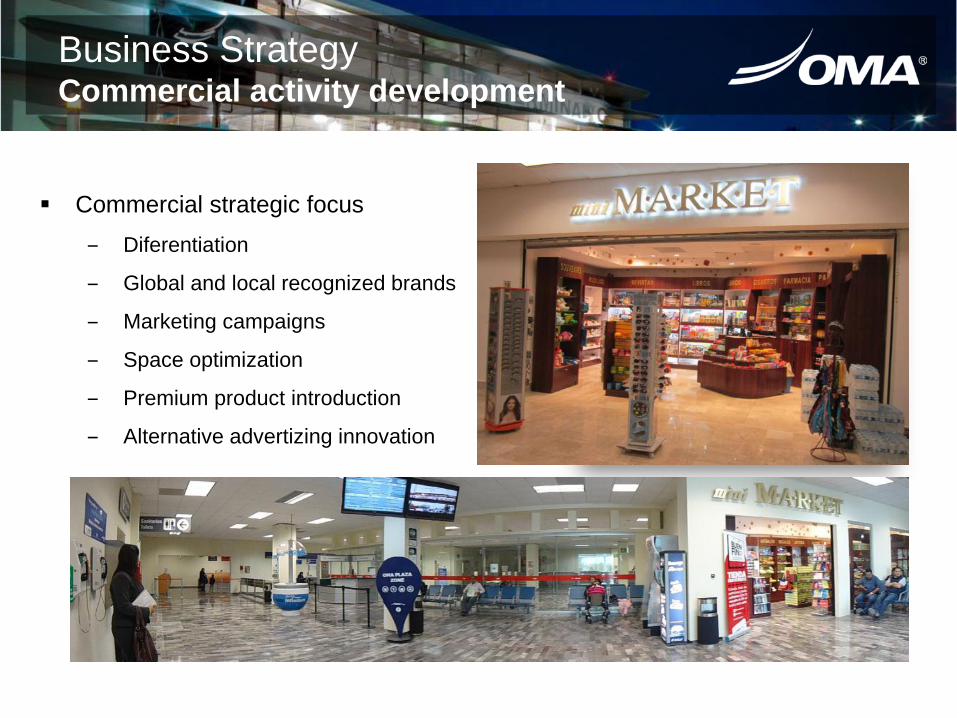
Commercial strategic focus
‒ Diferentiation
‒ Global and local recognized brands
‒ Marketing campaigns
‒ Space optimization
‒ Premium product introduction
‒ Alternative advertizing innovation

Innovative Concepts
Alternative Advertising +9% 2012 vs. 2011 Accounted for 19% of commercial revenue in 2012

Retail Stores, Restaurants and Duty Free
24% of total commercial
revenue
Commercial spaces occupation 11,783 sq.
meters in 2009 to 15,216 sq. meters in 2012.
+29% commercial space
+5% revenues 2012 vs 2011
95% occupation

Parking
32% of commercial revenues
+10% 2012 Vs 2011.
Premium – Short and Long Stay– New Low Cost –
Airport Community New strategy of sales.

Commercial passenger services
Enhance passenger
experience
+205% 2012 vs 2011

Diversification
Strategy

Business Strategy New businesses and diversification
Diversification: Take advantage of land reserve
Diversification
Offices
Commercial and retail
Industrial and Logistics
Hotels
Intermodal center
Service stations
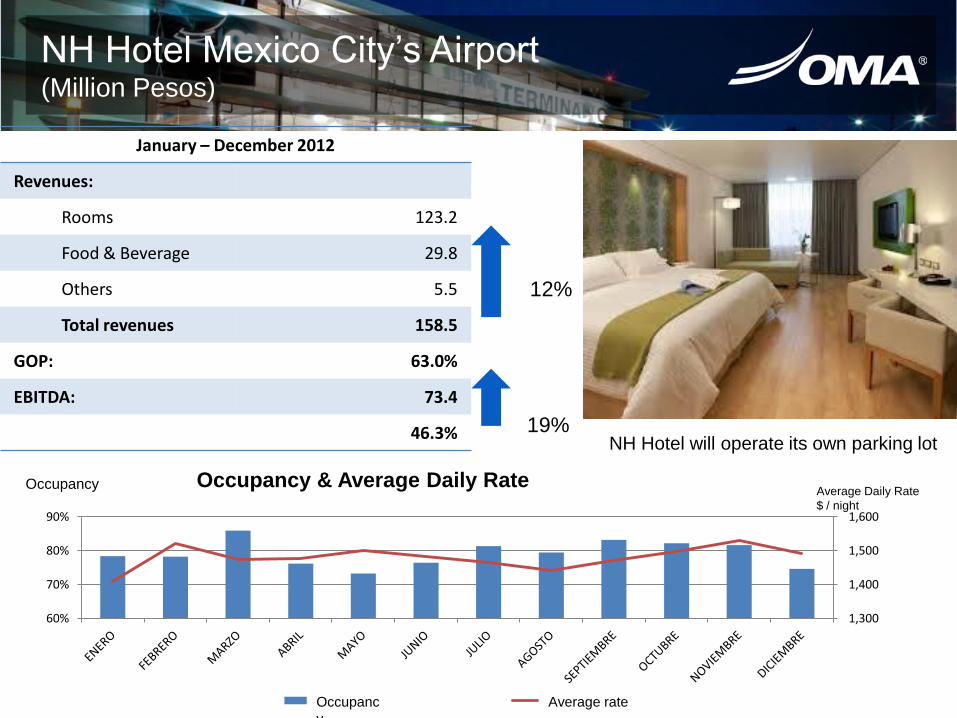
NH Hotel Mexico City’s Airport (Million Pesos)
Occupancy
January – December 2012
Revenues:
Rooms 123.2
Food & Beverage 29.8
Others 5.5
Total revenues 158.5
GOP: 63.0%
EBITDA: 73.4
46.3%
12%
19% NH Hotel will operate its own parking lot
Average Daily Rate
$ / night
Occupancy & Average Daily Rate
1,300
1,400
1,500
1,600
60%
70%
80%
90%
OCUPACION TARIFA PROMEDIO Occupanc
y
Average rate

OMA Carga - Key Highlights
0 2,000 4,000 6,000 8,000
10,000
1Q 2Q 3Q 4Q
'00
0 P
eso
s
2012 2011
OMA Carga • Revenue increased:
• 4Q-12 vs 4Q-11 – 21% • 4Q-12 vs 4Q-10 – 52%
Land
23%
Land
46%
Air77%
Air
54%
2011 2012
Volume Distribution
1. Abril 2012: New initiatives (FFCC, Customer Service)
2. Revenues per kilo Increasing
Main Drivers:
Imports, Security and Ground business conectivity
Business covered
Maneuvers (Load & Unload shipments)
Warehousing
X Ray screening
Cross dock and temporary warehousing
Import – Export Process
Secure & Control – Bonded Area

Driving growth
• MULTIMODAL: driving the "next gen"
performance
• "Clustering" for competitive advantage: AIR-
GROUND-FFCC
• Diversification: Logistics hub, Free Trade
Zones, Industrial Parks

Monterrey airport Hotel
Hotel business in other airports
‒ Monterrey airports. Complete studies, looking for partners
‒ Culiacán airport. Studies in process
Terminal B
Terminal A
Hotel
MTY Hotel – Feasibility studies complete 120-140 rooms
Monterrey Hotel negociation highlights: • Interested investor groups • Investment structure in process • Investment analysis
Marketing and financial studies complete

Cargo City Monterrey
Cargo City MTY – Only terminal in Mexico for logistic services
Development of a planned logistics
terminal integrating all the stakeholders of
the logistic supply chain: customs,
customs agents, transports, etc.
1,045 sq. m offices 95% occupation

Cargo City – Lower and higher levels
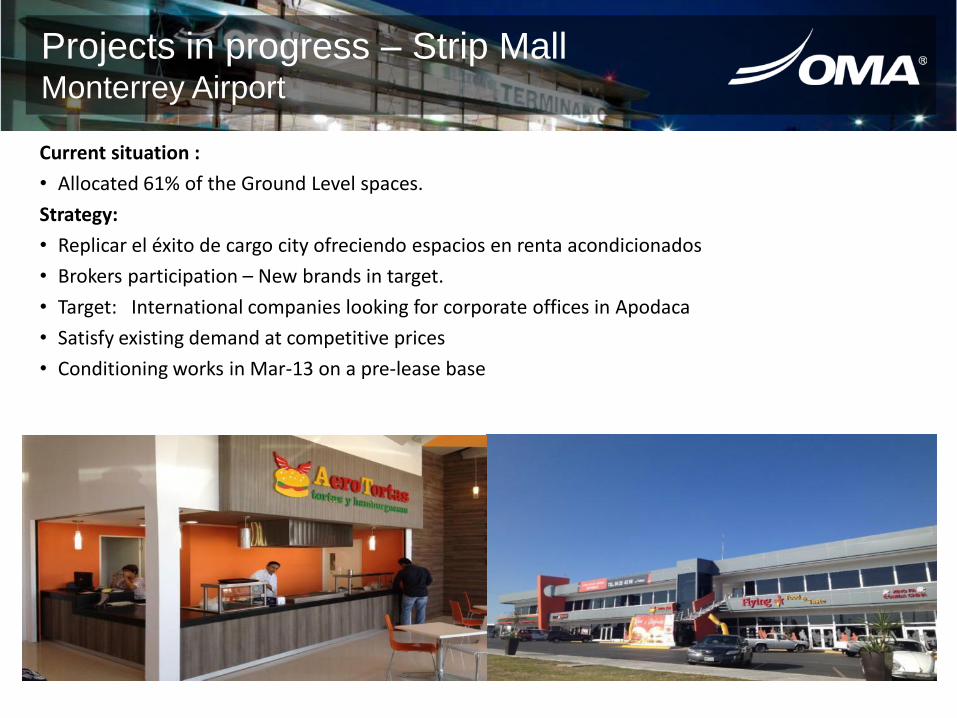
Current situation :
• Allocated 61% of the Ground Level spaces.
Strategy:
• Replicar el éxito de cargo city ofreciendo espacios en renta acondicionados
• Brokers participation – New brands in target.
• Target: International companies looking for corporate offices in Apodaca
• Satisfy existing demand at competitive prices
• Conditioning works in Mar-13 on a pre-lease base
Projects in progress – Strip Mall Monterrey Airport
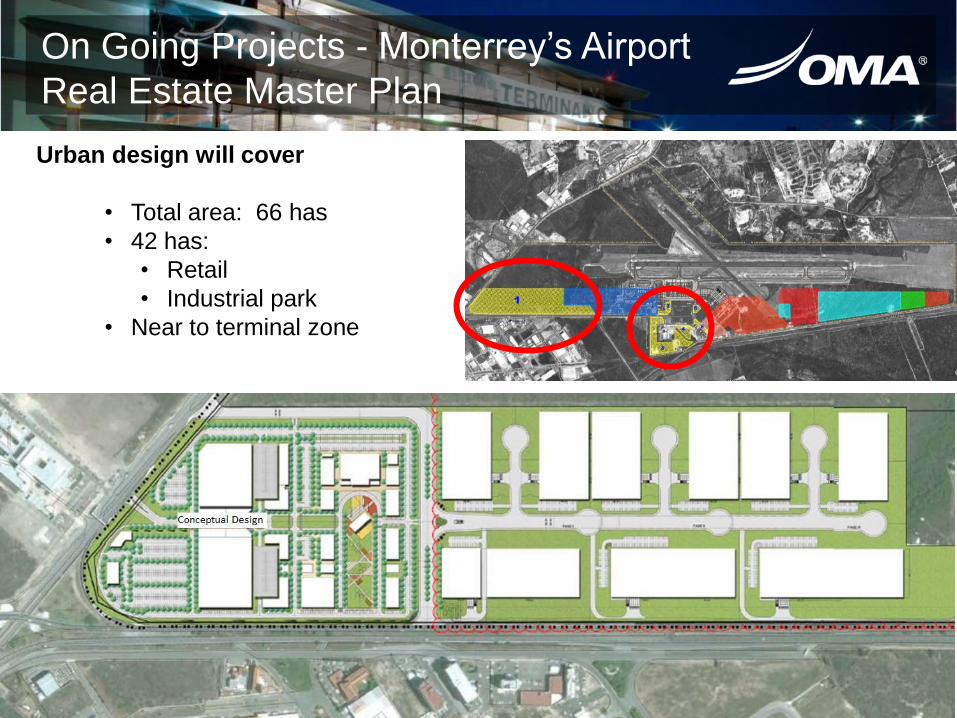
On Going Projects - Monterrey’s Airport
Real Estate Master Plan
Urban design will cover
• Total area: 66 has
• 42 has:
• Retail
• Industrial park
• Near to terminal zone

On Going Projects - Gas Station Monterrey Gas Station Construction Works
Opening date: December 24, 2012
First rent payment: December 2012

Project Render
Gas Station and Convenience Stores Other Developments
Tampico:
Local gas and tire merchant signed a contract:
• 3,200 sqm of land in lease
• Two phases:
• Convenience store and gas
station
• Commercial spaces to car related
business.
Monterrey – Convenience store at gas station:
• Contract in process
• 725 sqm land in lease.
• Term: 15 years
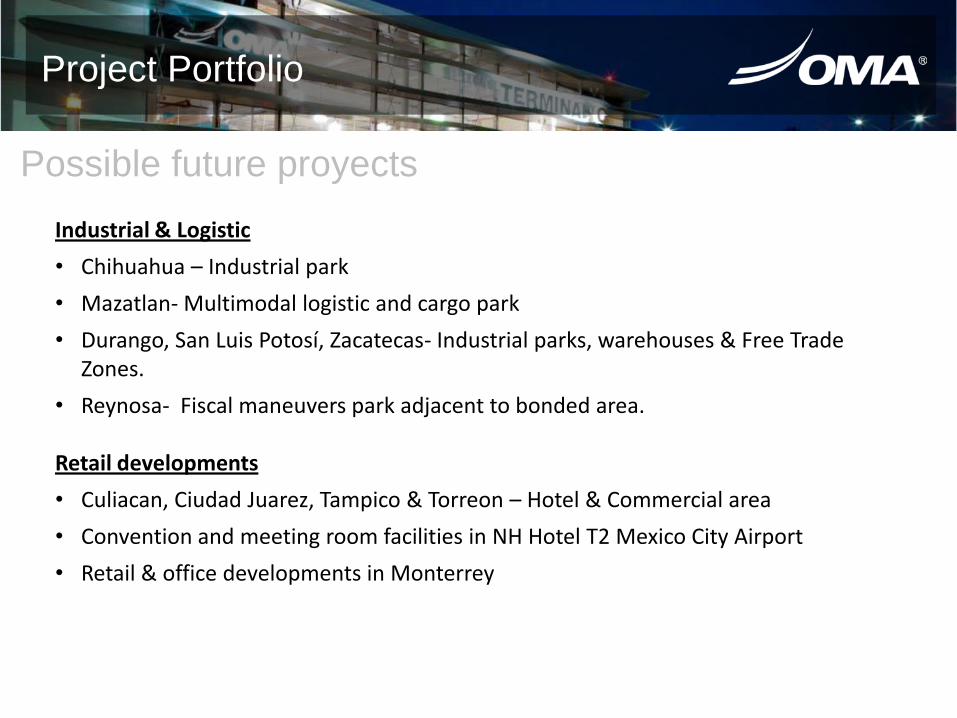
Project Portfolio
Industrial & Logistic
• Chihuahua – Industrial park
• Mazatlan- Multimodal logistic and cargo park
• Durango, San Luis Potosí, Zacatecas- Industrial parks, warehouses & Free Trade Zones.
• Reynosa- Fiscal maneuvers park adjacent to bonded area. Retail developments
• Culiacan, Ciudad Juarez, Tampico & Torreon – Hotel & Commercial area
• Convention and meeting room facilities in NH Hotel T2 Mexico City Airport
• Retail & office developments in Monterrey
Possible future proyects

4. Sustainability and
Human Capital

‒Quality: ISO 9001
‒Environment: ISO 14001
‒Environment : Environmental quality PROFEPA
‒Occupational health and security: OHSAS 18001
‒Occupational health and security : Automanagement programSTPS
‒Sustainability: Part of Sustainability Index by the Mexican Stock Exchange
‒Sustainability: Socially responsible company, by CEMEFI and AliaRSE
‒ Corporate Sustainability: Corporate transparency Index
‒Great Place to Work Mexico: Ranked top 100 by the GPTW Institute.
‒Passenger satisfaction: Mazatlán airport qualified by Airports Council
International as the best in its category for Latinamerica
Sustainability and Human Capital
Our certifications

Results and guidance

Consistent Revenue and EBITDA Growth
48
Revenues (Excluding construction revenues, Ps. Million)
1,4
62
1,3
60
1,4
40
1,5
96
1,7
70
2,0
18
2,2
69
2,2
32
2,0
55
2,1
44
2,4
59
2,8
19
2001 2002 2003 2004 2005 2006 2007 2008 2009 2010 2011 2012
EBITDA (Adjusted EBITDA for years 2010, 2011 and 2012, Ps. Million)
53
7
52
5
60
9
75
2
87
7
1,0
98
1,2
73
1,1
83
1,0
53
87
0
1,0
84
1,5
11
2001 2002 2003 2004 2005 2006 2007 2008 2009 2010 2011 2012

Strategy Execution
Strategy execution in all lines of action
+7.0% traffic increase 2012 vs 2011
International traffic recovery
MTY Connectivity
Non Aeronautical Revenues maximization (3Q12):
95% occupancy in commercial spaces
19 quarters with NAR / PAX growth
+9% Non Aeronautical Revenues / PAX (w/o NH)
+47% commercial area since 2005
Diversification: 29% of Non Aeronautical Revenues
+24% OMA Carga Revenues
+12% NH Hotel Revenues
* Acummulated 9M2012
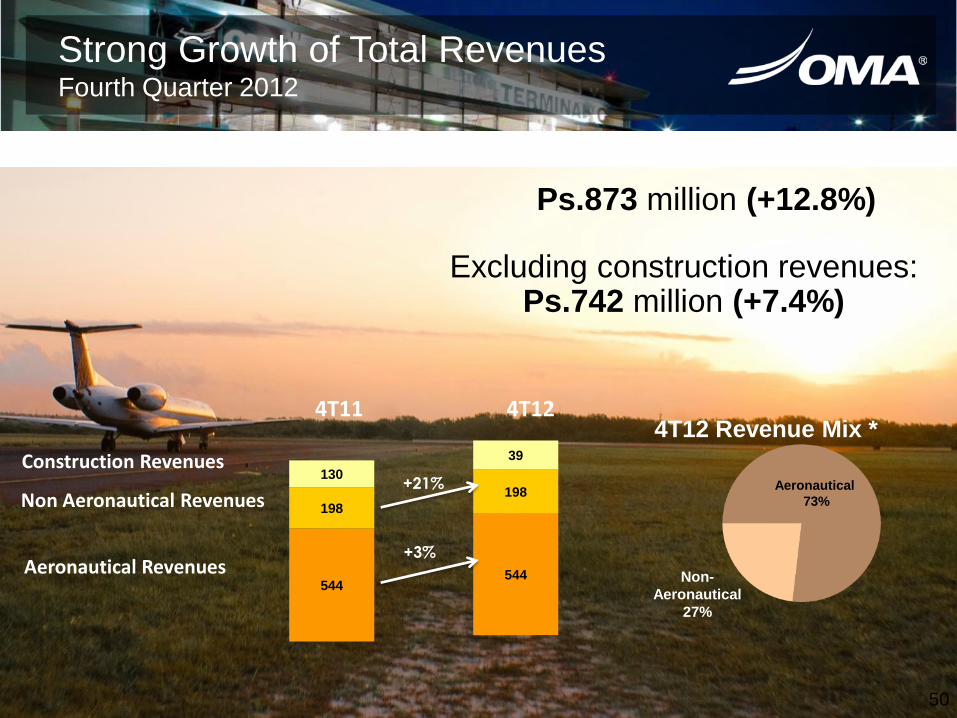
Strong Growth of Total Revenues Fourth Quarter 2012
50
Non-
Aeronautical
27%
Aeronautical
73%
Ps.873 million (+12.8%)
4T12 Revenue Mix *
544
198
39
Excluding construction revenues: Ps.742 million (+7.4%)
544
198
130
4T11 4T12
+3%
+21%
Construction Revenues
Non Aeronautical Revenues
Aeronautical Revenues

4Q12
Ps.544 M
4Q11
Ps.527 M
51
Maximizing Regulated Revenues
18%
65%
17% 17%
18%
65%
Aeronautical Revenue / Pax increased reached 169.3 MXN in 4Q12
Aeronautical Revenues:
+3.3% in 4Q12
Total traffic increased +6.8%
Full year incentives payment
Airport services, leases and access rights
Domestic Passenger Charge
International Passenger Charge

Non Aeronautical Revenues increased 21% to Ps.198 million in 4Q12
Better occupancy rate at parking lots (+7%) NH T2 Hotel maturity (+10%) Growth of OMA Carga (+21%)
In 4Q12 49 new commercial spaces, advertizing, communication, passenger
services and other 52
Improving the Passenger Experience Expansion of Commercial Activities
NAR Composition
Non Aeronautical Revenues / PAX increased 13.0% to 61.6 MXN in 4Q12.
NH Hotel 23%
Parking 19%
Advertising 12%
Airline Leasing 8%
Restaurants 6%
Cost recoveries
6%
Space Leasing 6%
Car Rental 5%
OMA Carga 5%
Baggage Screening
4%
Other 6%
* Retail, Duty Free, and other leases such as VIP lounges

53
Operating Costs and Expenses
Million pesos 4Q11 4Q12 %
Change
Total operating costs and
expenses
516 580 12.2
Cost of services 160 181 13.9
Maintenance provision 41 41 (0.9)
G & A 141 127 (9.5)
Construction cost 82 130 58
Concession tax 33 37 12
Technical Assistance
Fee
16 17 5
Depreciation &
Amortization
44 49 12
Factors:
Start of operations of baggage
screening services.
Security services contract increase.
Concession tax and technical
assistance increased due to higher
revenues.
Cost
control
initiatives
► Increase efficiency in
conjunction with
suppliers
► Strengthen audit and
cost control system
► Develop a savings
culture program
► Encourage and
implement employee
recommendations

301 341
4T11 4T12
EBITDA Adjusted EBITDA
342 382
4T11 4T12
54
Growth in Cash Flow Generation
39.1% 49.5% 38.8% 51.5%
OMA achieved 51.5% in Adjusted EBITDA Margin, an important increase in
cash flow generation.
OMA calculates Adjusted EBITDA, which further adjusts EBITDA for the
maintenance provision, construction revenue, and construction expense.
The Adjusted EBITDA margin is calculated against the sum of aeronautical
and non-aeronautical revenues.
• Data in million pesos
55
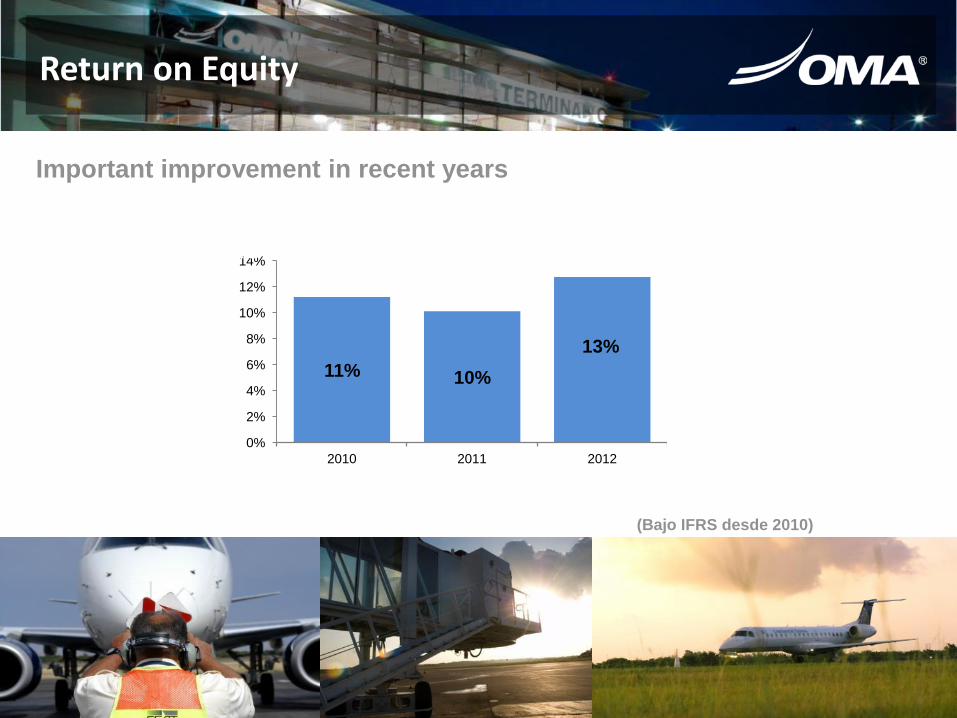
Return on Equity
Important improvement in recent years
11% 10%
13%
0%
2%
4%
6%
8%
10%
12%
14%
2010 2011 2012
ROE (bajo IFRS desde 2010)
(Bajo IFRS desde 2010)
Visibility Capex, Dividends
and guidance
2012
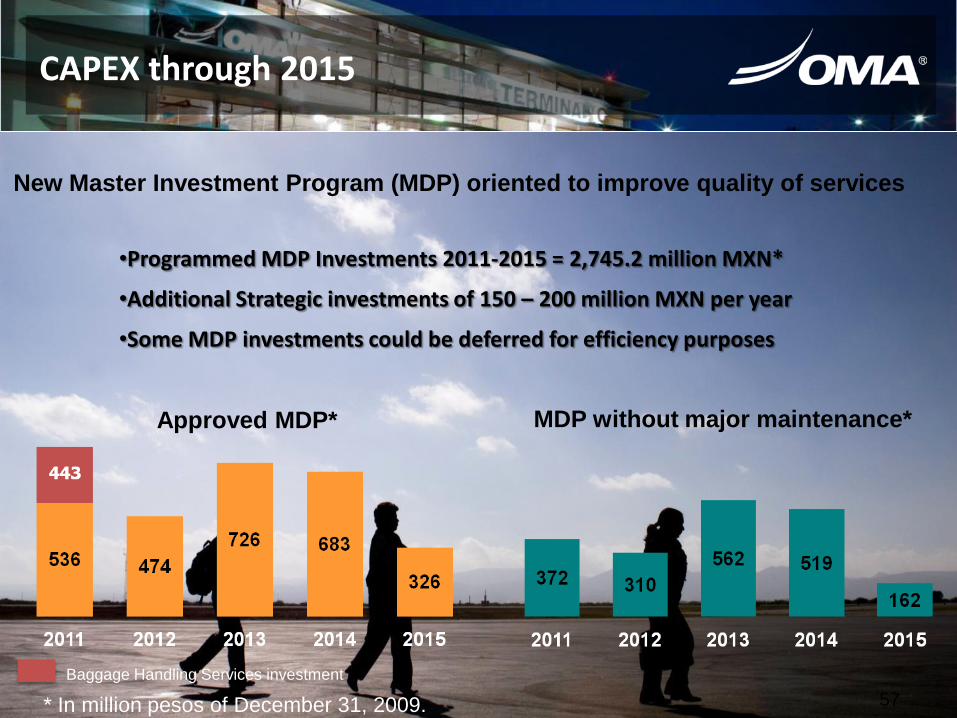
CAPEX through 2015
•Programmed MDP Investments 2011-2015 = 2,745.2 million MXN*
•Additional Strategic investments of 150 – 200 million MXN per year
•Some MDP investments could be deferred for efficiency purposes
57
New Master Investment Program (MDP) oriented to improve quality of services
Approved MDP* MDP without major maintenance*
* In million pesos of December 31, 2009.
Baggage Handling Services investment
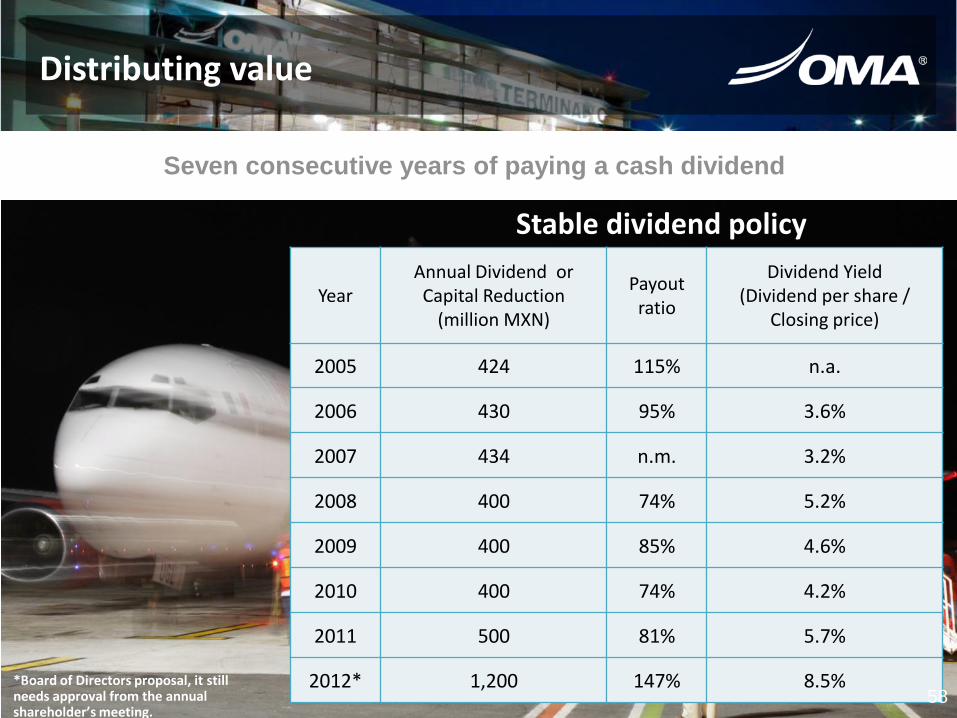
Year Annual Dividend or Capital Reduction
(million MXN)
Payout ratio
Dividend Yield (Dividend per share /
Closing price)
2005 424 115% n.a.
2006 430 95% 3.6%
2007 434 n.m. 3.2%
2008 400 74% 5.2%
2009 400 85% 4.6%
2010 400 74% 4.2%
2011 500 81% 5.7%
2012* 1,200 147% 8.5%
Seven consecutive years of paying a cash dividend
Stable dividend policy
58
Distributing value
*Board of Directors proposal, it still needs approval from the annual shareholder’s meeting.

Leverage

1.0%
99.0%
USD
MXN
60
Financial Ratios (million MXN)
Fuente: OMA UAFIDA Ajustada excluye provisión de mantenimiento, ingreso y costo de construcción. Deuda a corto plazo= prestamos a corto plazo + porción circulante del pasivo a largo plazo Deuda a largo plazo = deuda a largo plazo Deuda total = deuda a largo plazo + deuda a corto plazo Deuda neta = deuda total – efectivo y equivalentes de efectivo
Fuente: OMA
Debt Composition 2012
2011 2012
Cash and cash equivalents 524 1,152
Short term debt 29 584
Long term debt 1,535 1,510
Total debt / Adjusted EBITDA 1.3x 1.38x
Net debt / Adjusted EBITDA 0.83x 0.62x
Adjusted EBITDA/ Interest 12.7x 14.6x
Total debt/ Total assets 17% 21%
Sound Balance Sheet
Fuente: OMA Nota: nivel de caja mínimo MXN$150mm Deuda total incluye deuda de corto plazo e interés devengados no pagados
2012 debt break-down (mdp) Net debt / Adjusted EBITDA
Fuente: OMA
-1.8 -1.7
-0.1
0.4 0.8 0.8 0.6
2006 2007 2008 2009 2010 2011 2012
2,095 1,152
942
Total Debt Cash Net Debt

61
Debt /EBITDA Comparables
Debt /EBITDA Comparables
Fuente: Últimos reportes Financieros de cada compaña, calculados en moneda local OMA UAFIDA Ajustada.
-0.03 -0.55
1.33 2.04 2.14 2.33 3.69 3.34 4.97
2.24 4.13
3.09
7.00 7.33
14.37 Net debt /EBITDA Average 3.07x
GAP aquired additional debt of 287.8 million pesos in december 2012 that is not considered for being 3Q 2012 numbers.
Possilbe additional debt for ASUR of 410 mdd.
AENA’s ratio is GROSS DEBT/EBITDA. It’s shown as a reference and is not included in the average.
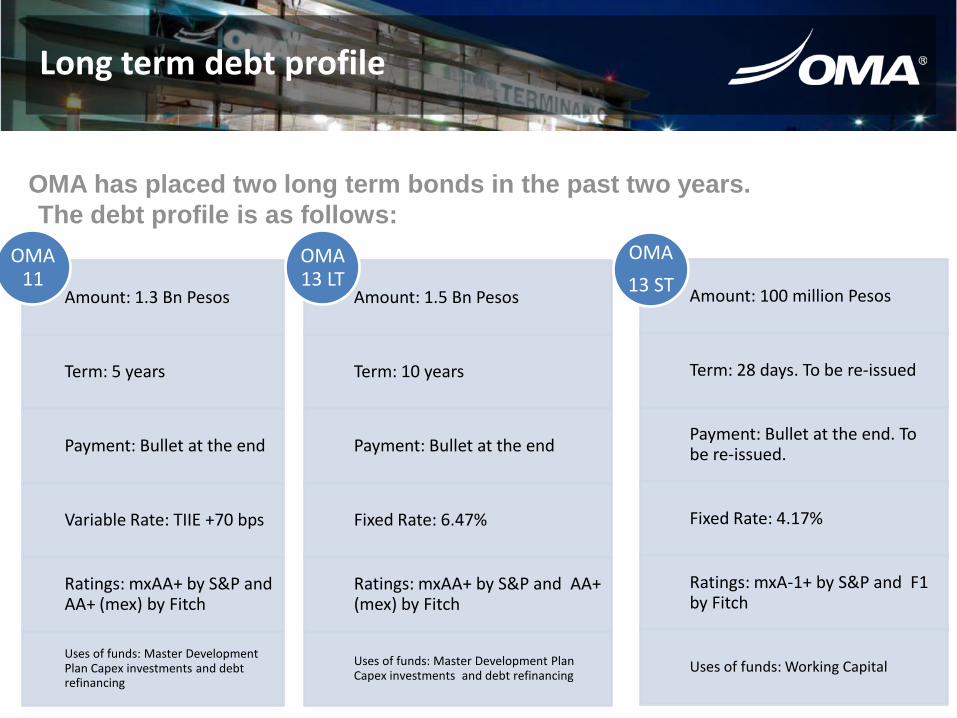
Long term debt profile
Amount: 1.3 Bn Pesos
Term: 5 years
Payment: Bullet at the end
Variable Rate: TIIE +70 bps
Ratings: mxAA+ by S&P and AA+ (mex) by Fitch
Uses of funds: Master Development Plan Capex investments and debt refinancing
OMA11
Amount: 1.5 Bn Pesos
Term: 10 years
Payment: Bullet at the end
Fixed Rate: 6.47%
Ratings: mxAA+ by S&P and AA+ (mex) by Fitch
Uses of funds: Master Development Plan Capex investments and debt refinancing
OMA13 LT
Amount: 100 million Pesos
Term: 28 days. To be re-issued
Payment: Bullet at the end. To be re-issued.
Fixed Rate: 4.17%
Ratings: mxA-1+ by S&P and F1 by Fitch
Uses of funds: Working Capital
OMA
13 ST
OMA has placed two long term bonds in the past two years.
The debt profile is as follows:

Macroeconomic Factors to take into
account

Bullish Mexican Outlook on Internal & External Factors
64
2
Factores Internos Positivos Factores Externos Positivos
1
3
4
5
6
1
2
3
Low Debt Leverage and Low Fiscal Deficit
Healthy Banking System
Trade Openness
Population Demographics
Economic and Employment Growth-Oriented Government
Macroeconomic Stability
Global Economic Recovery Increases Mexican Exports
Higher Remittances due to an Expected US Housing Recovery
Growing amount of Foreign Direct Investment (“FDI”) as Mexico increases even more its importance as North America’s key manufacture hub

65
Young Population with an Average of 27 years.
Demographic bonus
US$ per Hour ULC (1Q 2006=100, US$, 5QMA)
Favorable macroeconomic and demographic factors
0.0
0.5
1.0
1.5
2.0
2.5
2003 2004 2005 2006 2007 2008 2009 2010 2011
Mexico China
____________________
Source: BofAML Research, Bloomberg, INEGI and Banxico.
Ag
e
The gap in unit labor costs between Mexico and China
has been closing. Mexico consolidates as manufacturing
HUB

66
Growth potential in the sector
Source: Secretaria de Comunicaciones y Transportes
Source: Economist Intelligence Unit Source: Airbus (Market Analysis)
Source: Airbus Market analysis, CIA World Factbook y World Economic Forum Global Competitiveness Report
Source: Airbus Market analysis, CIA World Factbook y World Economic Forum Global Competitiveness Report
Bus - Economy 59.0%
Air 1.6%
Bus – Luxury and first class
20.6%
Train traffic 0.9%
Sea traffic 0.4%
Bus - Tourist 17.5%
Anual expected Population Growth (%) Compound Anual Growth Rate for Domestic traffic ,
2012-2031
Flights per Capita (Anual Average)
Available Seats per Km per Capita
Traffic in Mexico by travel type
Annex

Proposed new routes
Monterrey
Zacatecas
Puebla
Durango
Chicago
Morelia San Luis Potosí
Torreón Miami
Los Angeles
Cancún
Veracruz
Proposed routes for Aeromexico 8 routes proposed for 2013
Current propose routes
New routes 2012
New frequencies 2012

Proposed new routes
Proposed routes for
Vivaaerobus 7 routes proposed for 2013
Torreón
Reynosa
Tampico
México
Guadalajara
Chihuahua
Ciudad Juárez
Monterrey
Cuernavaca
Mazatlán
Bajío
Tuxtla Gutierrez
Tijuana
Cancún
Zacatecas
Acapulco
Culiacán
Mexicali
Demand elasticity continues to be strong in the air transport industry, we are seeking to grow in markets like CUL-MXL, MEX-ZCL, TAM-CUN.
Current propose routes
New routes 2012
New frequencies 2012

Proposed routes for Interjet 25 routes proposed for 2013
Monterrey
México
Tijuana
Cancún
Cd. Juárez
Torreón
Chihuahua
Mazatlán
San Luis Potosí
Zacatecas
Zihuatanejo
Guadalajara
Los Angeles
Mexicali
Culiacán Miami
San Antonio
Mérida
Villahermosa
Huatulco
Los Cabos
La Habana
Proposed new routes
Sukoi Superjet 100 permits to operate an important combination of regional routes.
Current proposed routes
New routes 2012
Proposed new routes
Guadalajara
Culiacán
Los Ángeles
Mexicali
Cancún
Tijuana
Chihuahua
Ciudad Juárez
Durango Mazatlán
México
Torreón Monterrey
Hermosillo
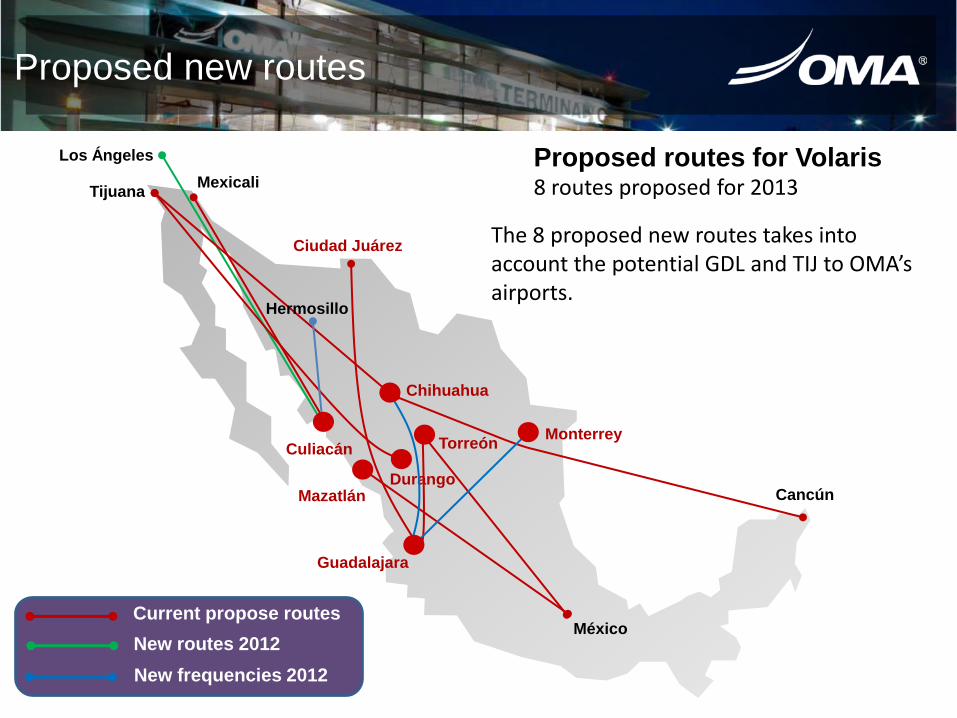
Proposed routes for Volaris 8 routes proposed for 2013
The 8 proposed new routes takes into account the potential GDL and TIJ to OMA’s airports.
Current propose routes
New routes 2012
New frequencies 2012

Proposed new routes
Torreón
Reynosa
Tampico
San Luis Potosí
Cd. Victoria
Harlingen
Guadalajara
Chihuahua
Ciudad Juárez
Zihuatanejo
Proposed routes for Aeromar 6 routes proposed for 2013
ATR42 planes allow to work with a limited market like the routes TAM-REX, REX-CVM o SLP-CUU-CJS.
Current proposed routes
New routes 2012