Embed Size (px)
Citation preview

Fourth Quarter & FY 2017Earnings ReviewTodd Stevens | President & CEO | Los Angeles, CA | February 26, 2018
Mark Smith | Sr. EVP & CFO

4Q & YE 2017 Earnings | 2
Forward Looking / Cautionary Statements
This presentation contains forward-looking statements that involve risks and uncertainties that could materially affect our expected results of operations, liquidity, cash flows and
business prospects. Such statements include those regarding our expectations as to our future:
Actual results may differ from anticipated results, sometimes materially, and reported results should not be considered an indication of future performance. While we believe
assumptions or bases underlying our expectations are reasonable and make them in good faith, they almost always vary from actual results, sometimes materially. We also believe third-
party statements we cite are accurate but have not independently verified them and do not warrant their accuracy or completeness. Factors (but not necessarily all the factors) that
could cause results to differ include:
Words such as "anticipate," "believe," "continue," "could," "estimate," "expect," "goal," "intend," "likely," "may," "might," "plan," "potential," "project," "seek," "should," "target, "will" or "would"
and similar words that reflect the prospective nature of events or outcomes typically identify forward-looking statements. Any forward-looking statement speaks only as of the date on
which such statement is made and we undertake no obligation to correct or update any forward-looking statement, whether as a result of new information, future events or otherwise,
except as required by applicable law.
See www.crc.com Investor Relations for important information about 3P reserves and other hydrocarbon resource quantities, finding and development costs, recycle ratio calculations,
and drilling locations.
• financial position, liquidity, cash flows and results of operations
• business prospects
• transactions and projects
• operating costs
• Value Creation Index (VCI) metrics are based on certain estimates
including future production rates, costs and commodity prices
• operations and operational results including production, hedging and capital
investment
• budgets and maintenance capital requirements
• reserves
• type curves
• commodity price changes
• debt limitations on our financial flexibility
• insufficient cash flow to fund planned investment
• inability to enter desirable transactions including asset sales and joint
ventures
• legislative or regulatory changes, including those related to drilling,
completion, well stimulation, operation, maintenance or abandonment of
wells or facilities, managing energy, water, land, greenhouse gases or
other emissions, protection of health, safety and the environment, or
transportation, marketing and sale of our products
• unexpected geologic conditions
• changes in business strategy
• inability to replace reserves
• insufficient capital, including as a result of lender restrictions, unavailability
of capital markets or inability to attract potential investors
• inability to enter efficient hedges
• equipment, service or labor price inflation or unavailability
• availability or timing of, or conditions imposed on, permits and approvals
• lower-than-expected production, reserves or resources from development
projects or acquisitions or higher-than-expected decline rates
• disruptions due to accidents, mechanical failures, transportation or storage
constraints, natural disasters, labor difficulties, cyber attacks or other
catastrophic events
• factors discussed in “Risk Factors” in our Annual Report on Form 10-K
available on our website at crc.com.

4Q & YE 2017 Earnings | 3
Key Highlights
618 MMboe119% Organic Reserve
Replacement Ratio
$761 Million
$429 Million$96 Million Funded by BSP
$58 Million Funded by MIRA
9 Drilling RigsSustainable Level of Activity
Capital
Adjusted EBITDAX*
ACTIVITY
PRODUCTION & RESERVES
*See www.crc.com, Investor Relations for a reconciliation to the closest GAAP
measure and other important information.
4th Quarter 2017
Program VCI* of 1.7229 Gross Wells Drilled & 460
Capital Workovers
$222 Million
$159 Million$14 Million Funded by BSP
$20 Million Funded by MIRA
1.5%Q-o-Q Production Decline
126 MBoe/d

4Q & YE 2017 Earnings | 4
Drilling
28%
Workover
20%BSP JV
Capital
26%
Exploration
2%
Other1
7%
Development
Facilities
16%
Moved from Defense to Offense – 2017 Review
• CRC 2017 capital plan was directed to oil-weighted projects in our core fields: Elk Hills, Wilmington, Kern Front, Buena Vista, Mt. Poso, Pleito
Ranch, Wheeler Ridge and the delineation of Kettleman North Dome
• JV capital was primarily focused in the San Joaquin Basin
2017 Capital Investment Program Summary
Total: $371 million
1Other includes maintenance and occupational health, safety and environmental projects, seismic and other investments.2Facility Costs and other non-return capital are apportioned to producing wells in the year they are drilled.
2017 Total Capital Invested
1.70
2.00
30%
45%
0%
10%
20%
30%
40%
50%
0.00
0.50
1.00
1.50
2.00
2.50
$55 Brent Flat
$3 NYMEX
$55 Brent 2017, $65 Brent
in 2018+ & $3 NYMEX
IRR
VC
IVCI IRR
Results of Fully-Burdened2
2017 CRC Development Program
Total: ~$240 million
Other1

4Q & YE 2017 Earnings | 5
Drilling
JV - Capital
Workover
Development
Facilities
ExplorationOther1Other1
San
Joaquin
Ventura
Los
Angeles
Production Enhancement Plans for 2018
• CRC 2018 capital plan will be directed to oil-weighted projects in our core fields: Elk Hills,
Wilmington, Kern Front, Huntington Beach, and continued delineation of Kettleman North
Dome and Buena Vista
• JV capital will be focused in the San Joaquin Basin and Huntington Beach
• We have a dynamic plan that can be scaled up or down depending on the price environment
and efficient deployment of joint venture proceeds
Capital Investment Program – Living Within Cash Flow
Approx. $425 to $450 million
1Other includes maintenance and occupational health, safety and
environmental projects, seismic and other investments.
2018E Total Capital Plan 2018E Drilling Capital – By Drive
28%
30%22%
12%
4%4%
10%
10%
Conventional
ExplorationWaterfloods
Steamfloods
Unconventional
42%
6%30%
16%
80%
The JV capital increases
flexibility or provides for
incremental deleveraging
Approx. $250 million Approx. $250 million
6%
2018E Drilling Capital – By Basin

4Q & YE 2017 Earnings | 6
Deep Inventory of Actionable Projects at $65
Portfolio Spectrum
• Growth portfolio focus, fully
burdened
• All projects meet a Value
Creation Index (VCI)1
threshold of 1.3 at $65 Brent
and $3.50 NYMEX, and
deliver robust cash flow
• Portfolio has large
contributions from all
recovery mechanisms and
reserves types
• Many projects take
advantage of existing
infrastructure, while other
new projects may require
infrastructure investment in
facilities and sales points
1VCI is calculated by dividing the net present value of the project’s expected pre-tax cash flow over its life by the net present value of the investments, each using a 10% discount rate.2Full cycle costs = operating costs + development costs + facility costs + field-level G&A + taxes other than on income.3See www.crc.com, Investor Relations for details regarding net resources.
0
2
4
6
8
10
0 100 200 300 400 500 600 700 800Deve
lop
me
nt
Ca
pit
al (B
$)
Net Resources3 (MMBoe)
0
5
10
15
20
25
30
35
40
45
50
0 100 200 300 400 500 600 700 800
Fu
ll C
ycle
Co
st2
($/B
oe
)
Net Resources3 (MMBoe)

4Q & YE 2017 Earnings | 7
70
80
90
100
110
120
130
140
2017 2018E 2019E 2020E 2021E
Oil P
rod
ucti
on
MB
/d
400
800
1,200
1,600
2,000
2017 2018E 2019E 2020E 2021E
EB
ITD
AX
$M
M
Portfolio Flexibility Provides Range of Crude Oil Scenarios
Note: Scenarios assume flat pricing from $55 to $75 Brent and $3.00 to $3.10 NYMEX gas, respectively. Assumes lease operating costs are equal to 2017 levels for the mid-point of the range of planning scenario outcomes. Ranges of portfolio planning scenario outcomes assume development of a variety of combinations of steamflood, waterflood, conventional and unconventional projects in our inventory and reflect estimates of geologic, development and permitting risk. All discretionary cash flow reinvested in business for each scenario. * See www.crc.com Investor Relations for a description of the calculation of debt-adjusted per share and other important information.
Combined with mid-cycle commodity
prices, we are positioned for growth in:
• Cash flow
• Production
• Reserves
on a debt-adjusted per share basis*
Portfolio
Planning
Scenarios
Portfolio
Planning
Scenarios
Capital focused on oil projects that provide
Increasing
Margins
Low
Decline Rates
Compounding
Cash Flow+ =
-
-
Estimated Crude Oil Production Outcomes
Estimated Range of EBITDAX Outcomes
≈
≈
0
300
600
900
1,200
1,500
2017 2018E 2019E 2020E 2021E
Ca
pit
al ($
MM
)
Estimated Ranges of Capital Investments

4Q & YE 2017 Earnings | 8
Resilient Resource Base
0
25
50
75
100
125
150
175
200
0
20
40
60
80
100
120
140
160
180
1Q16 2Q16 3Q16 4Q16 1Q17 2Q17 3Q17 4Q17 FY
2015
FY
2016
FY
2017
Ca
pit
al ($
MM
)
MB
oe
/d
)
Oil NGL Gas Capital
Production By Stream (Mboe/d)
Note: Capital and production for 2017 include BSP’s investment and exclude MIRA’s investment.
Total Capital: $75MM$401MM $371MM

4Q & YE 2017 Earnings | 9
Nimble Operations Enable Flexibility to Improve Margins
$-
$5.00
$10.00
$15.00
$20.00
$25.00
$30.00
1Q 16 2Q 16 3Q 16 4Q 16 1Q 17 2Q 17 3Q 17 4Q 17
$/B
oe
Operating Cash Margin = Oil and Gas Revenue excluding settled hedges – LOE – Taxes Other than on Income – Operating Overhead.
Margin expansion into
mid-cycle pricing

4Q & YE 2017 Earnings | 10
FY14 FY15 FY16 FY17
0
400
800
1,200
1,600
2,000
2,400
2,800
An
nu
al
($M
M)
Adj. EBITDAX Operating Cash Flow Capital Investment
Living Within Cash Flow
1 See www.crc.com, Investor Relations for a reconciliation to the closest GAAP measure and other important information.2 Does not include JV capital.3 FY17 Capital Investment includes $27mm in Changes in Capital Accruals
1 2
3

4Q & YE 2017 Earnings | 11
$3.26 $3.14 $2.95 $3.00
$2.75 $2.42
$3.09
$2.90
$2.47 $2.56 $2.77 $2.66
$2.28 $2.67
0.00
0.50
1.00
1.50
2.00
2.50
3.00
3.50
1Q 2017 2Q 2017 3Q 2017 4Q 2017 2015 2016 2017
$/
Mc
f
NYMEX Realizations
CRC – Price Realizations
66% 62%
72%79%
40%
52%
70%
63%59%
66%
72%
37%
50%
65%
0%
20%
40%
60%
80%
100%
1Q 2017 2Q 2017 3Q 2017 4Q 2017 2015 2016 2017
% o
f W
TI
& B
ren
t
WTI Brent
$51.91
$48.29
$48.21
$55.40
$48.80 $43.32
$50.95
$50.24 $47.98
$50.02
$56.92
$49.19
$42.01
$51.24
$54.66 $50.92
$52.18
$61.54
$53.64
$45.04
$54.82
30
40
50
60
70
1Q 2017 2Q 2017 3Q 2017 4Q 2017 2015 2016 2017
$/B
bl
WTI Realizations Brent
Realization %
of WTI97% 99% 104% 103% 101% 99% 101%
Realization %
of NYMEX89 % 79% 87% 92% 97% 94% 86%
Oil Price Realization (with Hedges) Gas Price Realization
NGL Price Realization - % of WTI & Brent
CRC believes near-term
differentials will remain strong
• California refinery demand for native crude continues to be strong
and reduction in heavy waterborne crude has positively
influenced differentials.
• NGL prices have been supported by lower inventories and export
markets.
-≈

4Q & YE 2017 Earnings | 12
CRC Benefitted from Price and Managed Controllables in Q4
130
248
-100
-50
0
50
100
150
200
250
300
350
400
4Q16 Volume Price Costs Interest
Working
Capital and
Other 4Q17($
MM
)
Op
era
tin
g C
ash
Flo
w

4Q & YE 2017 Earnings | 13
$100
$100
$193
$2,250
$1,000
$1,300
$0$0
$500
$1,000
$1,500
$2,000
$2,500
$3,000
$3,500
$4,000
Se
p-1
7
De
c-1
7
Ma
r-1
8
Jun
-18
Se
p-1
8
De
c-1
8
Ma
r-1
9
Jun
-19
Se
p-1
9
De
c-1
9
Ma
r-2
0
Jun
-20
Se
p-2
0
De
c-2
0
Ma
r-2
1
Jun
-21
Se
p-2
1
De
c-2
1
Ma
r-2
2
Jun
-22
Se
p-2
2
De
c-2
2
Ma
r-2
3
Jun
-23
Se
p-2
3
De
c-2
3
Ma
r-2
4
Jun
-24
Se
p-2
4
De
c-2
4
2014 RCF
2017 Term Loan
2016 Term Loan
2nd Lien Notes
Unsecured Notes
Strengthening the Balance Sheet - Improved Creditworthiness and Liquidity
• Pro forma net results from the Ares transactions which closed on February 7, 2018:
• The RCF was paid in full
• CRC received $797 million in net proceeds, $8mm of which is restricted cash
• The RCF has approximately $850 million of available borrowing capacity, excluding
$150 million minimum liquidity
• The recent amendment extends the maturity of the RCF to June 2021 and relaxes
financial covenants
1st Lien 2014 Revolving Credit Facility (RCF) -
1st Lien 2017 Term Loan 1,300
1st Lien 2016 Term Loan 1,000
2nd Lien Notes 2,250
Senior Unsecured Notes 393
Total Debt 4,943
Less cash2
(441)
Total Net Debt 4,502
Equity3
(764)
Total Net Capitalization 3,738
Total Net Debt / Total Net Capitalization 120%
Total Net Debt / LTM Adjusted EBITDAX4
5.9x
LTM Adjusted EBITDAX4
/ LTM Interest Expense 2.2x
PV-105 / Total Net Debt 1.0x
Total Net Debt / Proved Reserves ($/Boe) $7.28
Total Net Debt / Proved Developed Reserves ($/Boe) $10.23
Total Net Debt / 2017 Production ($/Boepd) $34,899
Pro-Forma1 Capitalization ($MM)
Pro-Forma1 Debt Maturities ($MM)*
1 Pro-forma capitalization table and debt maturities graph reflect the payoff of the 12/31/17 outstanding balance
of $363 million on our RCF after the completion of the Ares JV and $50 million private placement. 2 The $441 million of available cash includes (1) $15 million unrestricted cash as of 12/31/17 and (2) $426
million of available cash after the Ares transaction and proforma repayment of the RCF.3 Excludes noncontrolling interest at 12/31/17 and includes $50 million of equity from the Ares private placement.4 See www.crc.com, Investor Relations for a reconciliation to the closest GAAP measure and other important
information.5 PV-10 as of 12/31/17, see Attachment 2 of CRC’s Fourth Quarter Earnings Release from February 26, 2018 for
details on this calculation.
* Previously, the RCF, the 2017 Term Loan and the 2016 Term Loan were subject to springing maturities related to the 2020
and 2021 Notes. During the fourth quarter of 2017, CRC repurchased $65 million in principal amount of the 2020 Notes and
$35 million in principal amount of the 2021 Notes, which eliminated the springing maturity feature. The 2017 Term Loan also
has a springing maturity related to the 2016 Term Loan.
Undrawn RCF

4Q & YE 2017 Earnings | 14
PDP Value
Proved Value
Unproved4
$0
$4
$8
$12
$16
$20
$24
$55 Brent $65 Brent $75 Brent
($B
illio
n)
2017 Reserves Value1 In Excess EV
Current EV
of $6.4 Bn5
Infrastructure2
Surface & Minerals3
1-5 See endnotes in the Appendix.
See www.crc.com Investor Relations for important information about 3P reserves and other hydrocarbon quantities.

4Q & YE 2017 Earnings | 15
Strategy at a Glance
Value Directed Investments
Targeting Balance Sheet Leverage 2x-3x (mid-cycle)
Value
Focus
Live within
Cash Flow
Smart Growth
(per share)
PV10 pre-tax cash flows
PV10 of investmentsVCI =
Value Creation Index (VCI)
Enhance Production
Deliver Margin Expansion
Live within Cash Flow
Long-TermShort-Term

4Q & YE 2017 Earnings | 16
Diverse Assets with Flexible Development Opportunities
BasinNet Proved Reserves
(MMBOE)Avg. Net
Production (MBOE/d)
% Oil Production
Net Mineral Acreage
(million acres)
Identified GrossDrilling Locations2
Drive Mechanisms Competitive Advantage
618 129 64 ~2.3 33,870 Portfolio Flexibility
San Joaquin 419 90 58 1.5 25,190Big fields get bigger,
substantial infrastructure in place
Los Angeles 145 27 100 <0.1 1,950World class waterfloods,
cash flow positive
Ventura 40 6 67 0.2 4,310Upside from the
application of technology
Sacramento 14 6 0 0.5 2,420 Large, scalable
• World-class resource base that is positioned to grow
• Utilizing current costs, the SEC 2017 price deck1, PV-10 of proved reserves of $4.5 BN or $8.9 BN for proved, probable and possible reserves2
• Achieved 2017 organic recycle ratio2 of 2.1x
Drive Mechanisms: Conventional Unconventional Steamflood Waterflood Gas
1 Assumes a flat $54.98 Brent crude price deck and $2.98/MMBTU NYMEX natural gas and utilizes current costs.2 See www.crc.com Investor Relations for important information about 3P reserves and other hydrocarbon quantities. Drilling locations exclude
6,400 gross exploration locations related to unconventional reservoirs.
Figures shown are for full-year 2017, unless otherwise noted.

4Q & YE 2017 Earnings | 17
Life of Field Plans – Growing Inventory
• Comprehensive technical review of 40% of CRC’s fields
• Updated Geologic models, OOIP
• Teams shared analog experience across CRC
• Cataloged opportunities consistent with our proven reserves methodology
• Rolled into our portfolio ranking process
• Over 95% of our total proved reserves have been audited by Ryder Scott in the last three years
3P Reserves Growth
58 109 156
768 644 568618
222 251202
321
340
826
1,129
0
250
500
750
1,000
1,250
1,500
1,750
2,000
2,250
Spin-off 2015 2016 2017
MM
Bo
e
Cummulative Production Proven
Revisions Due to Price Since 2014 Unproven
>350%
Growth
See www.crc.com Investor Relations for important information about 3P reserves and other hydrocarbon quantities.

4Q & YE 2017 Earnings | 18
2017 Proved Reserves Increased with Minimal Investments
568618
300
350
400
450
500
550
600
650
Balance
as of
12/31/16
Production Performance
Related
Revisions
Extensions
and
Discoveries
Sales of
Proved Reserves
Price Related
Revisions
Balance
as of
12/31/17
Pro
ved
Re
se
rve
s (
MM
BO
E)
-≈

4Q & YE 2017 Earnings | 19
Margin Expansion Driven by Liquid-Rich Resource Base
• As we develop our reserves we anticipate the oil weight of production to trend from 64% produced in 2017 toward the 72% reflected in our 2017 Proved Reserves
• The 2017 average blended realized price of $41 per BOE was 75% of the average Brent Crude index
0%
25%
50%
75%
FY 2015 FY 2016 FY 2017 2017
Reserves
% O
il M
ix
Oil NGL Gas Blended
Realized Price*
2017 Production Mix 64% 12% 24% $41.09
2017 Proved Reserves
Mix72% 9% 19%
*Includes effects of settled hedges

4Q & YE 2017 Earnings | 20
CRC Midstream JV Structure with Ares
California Resources Elk
Hills, LLC
Elk Hills Power, LLC
Contributed
Assets
$750 MM gross proceeds
Class A (50%) and
Class C (95.25%)
Common Interests
Power and
Gas Processing
Services
Commercial Agreement
Capacity Charges
Ares Management, L.P. $750 MM gross
proceeds
Class B Preferred Interests, Class A and Class C
Common Interests
Benefits• Strategic alignment with Ares
• Provides CRC paths for opportunistic deleveraging through cash flow growth or debt reduction
• Greatly enhances liquidity
• Retain ownership and operational control
• Defined exit criteria

4Q & YE 2017 Earnings | 21
Strategic Partner Alignment
Summary of Deal
Partner ▪ Affiliate of Ares Management (Ares)
Contributed
Assets▪ Elk Hills power plant, gas processing assets and related non-borrowing base
infrastructure currently owned by CRC
Midstream JV
Capitalization
▪ Class A common interests (voting) owned 50% by Ares and 50% by California
Resources Elk Hills (CREH)
▪ Class B preferred interests (“Preferred”) owned 100% by Ares
▪ Class C common interests (distributing) owned 95.25% by CREH and 4.75% by Ares
Distribution to
Partners
▪ Preferred interests to receive distributions of 13.5% per annum on the $750 MM
contributed amount
▪ 9.5% cash pay and 4.0% PIK to be deferred for the first three years
▪ Deferred distributions are interest bearing and repaid over two years following the
deferral period
▪ Remaining cash after preferred distributions to be distributed pro rata to Class C
interests
Exit Provisions
▪ Prior to end of 5 or 7.5 years, CRC may redeem Preferred at variable amounts that
include make whole premiums
▪ At end of 5 years, CRC may elect to either redeem or extend to 7.5 years
▪ At 7.5 years, if not redeemed by CRC, Preferred can monetize the JV
Board▪ Board of Managers to consist of three CRC representatives and three
representatives from Ares

4Q & YE 2017 Earnings | 22
0.9
1.0
1.1
1.2
1.3
1.4
1.5
1.6
1.7
0% 10% 20% 30% 40% 50%
PR
OJE
CT V
CI
DISCOUNT ON SECOND LIEN NOTES
PROJECT VS. SECOND LIEN (2L) NOTE REPURCHASE*
INVEST If the VCI of an investment opportunity falls above the indifference
curve, investing in the new project could be a better option
PURCHASE DEBTIf the VCI of an investment opportunity falls below the indifference curve, repurchasing 2L notes could be a better option
Example of Investment Alternatives for Asset Sale Proceeds
Per the terms of the 2014 credit agreement on
asset sales, 2L notes must be repurchased at a
minimum 20% discount to par
Indifference Curve
*CRC will continue to review all opportunistic debt reduction transactions. We utilize our Value Creation Index (“VCI”) to guide management in allocating capital and prioritizing investments.

4Q & YE 2017 Earnings | 23
1Q 2018 2Q 2018 3Q 2018 4Q 2018 1Q 2019
Sold Calls Barrels per Day 9,000 6,200 16,100 16,100 1,100
Weighted Average Ceiling
Price per Barrel$59.58 $60.24 $58.91 $58.91 $60.00
Purchased Calls Barrels per Day - - - - 2,000
Weighted Average Ceiling
Price per Barrel- - - - $71.00
Purchased Puts Barrels per Day 1,200 1,200 6,100 1,100 14,100
Weighted Average
Floor Price per Barrel$45.82 $45.83 $61.48 $45.85 $58.93
Sold Puts Barrels per Day 29,000 29,000 24,000 19,000 10,000
Weighted Average
Floor Price per Barrel$45.00 $45.00 $46.04 $45.00 $47.50
Swaps Barrels per Day 38,300 34,000 19,000 19,000 7,000
Weighted Average
Price per Barrel$60.03 $60.00 $60.13 $60.13 $67.71
Percentage of 4Q 2017
Oil Production Hedged*49% 44% 31% 25% 26%
Opportunistically Built Oil Hedge Portfolio
Certain of our counterparties have options to increase swap volumes at weighted average costs between $60 and
$70 Brent.. For potential volume changes and further details please see Attachment 10 of our Earnings Release.
* Assumes counterparty options are not exercised.
We target hedges
on 50% of crude
oil production
Strategy Protect cash flow for capital investments and covenant compliance
4Q & YE 2017 Earnings | 24
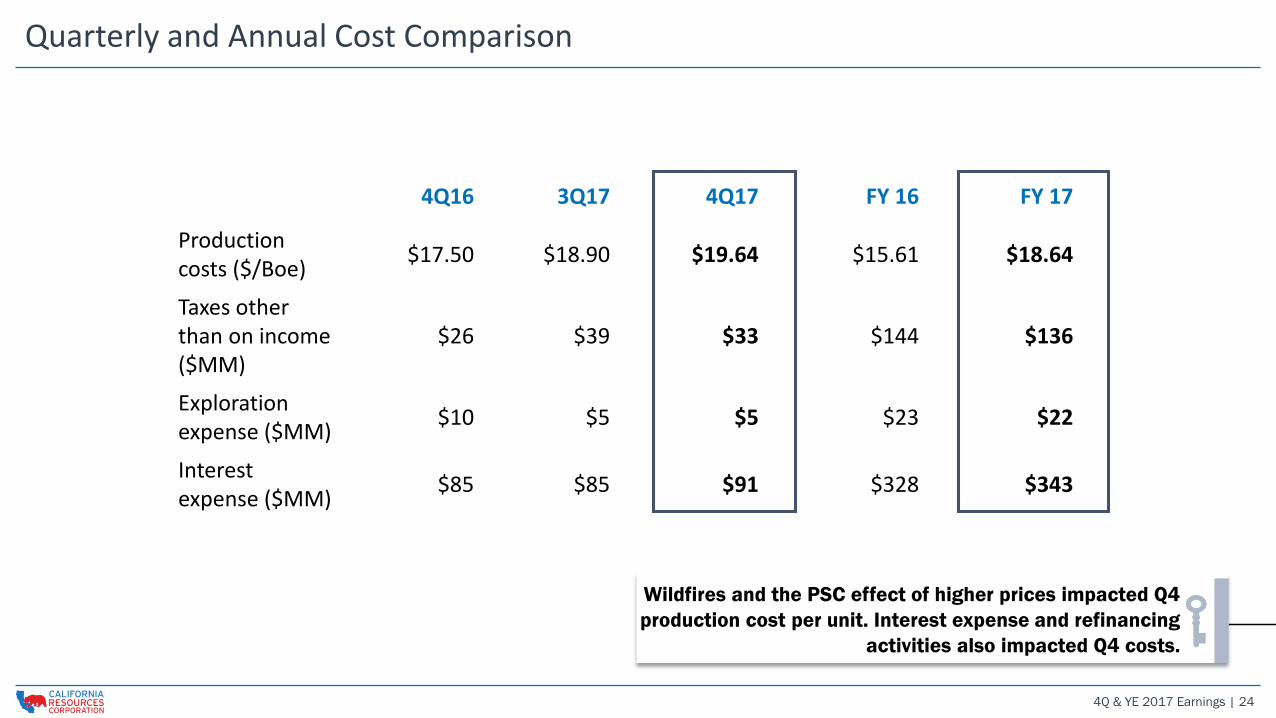
Quarterly and Annual Cost Comparison
4Q16 3Q17 4Q17 FY 16 FY 17
Productioncosts ($/Boe)
$17.50 $18.90 $19.64 $15.61 $18.64
Taxes other than on income ($MM)
$26 $39 $33 $144 $136
Exploration expense ($MM)
$10 $5 $5 $23 $22
Interest expense ($MM)
$85 $85 $91 $328 $343
Wildfires and the PSC effect of higher prices impacted Q4
production cost per unit. Interest expense and refinancing
activities also impacted Q4 costs.

4Q & YE 2017 Earnings | 25
4Q17 Results Summary
4Q16 3Q17 4Q17
Net Loss Attributable to Common Stock Per Share
($1.83) ($3.11) ($3.23)
Adjusted Net Loss Per Share* ($1.76) ($1.22) ($0.33)
Oil Production 87 MBbl/d 82 MBbl/d 80 MBbl/d
Total Production 135 MBoe/d 128 MBoe/d 126 MBoe/d
Realized Oil Price w/ Hedge ($/Bbl) $45.48 $50.02 $56.92
Realized NGL Price ($/Bbl) $28.99 $34.63 $44.03
Realized Natural Gas Price ($/Mcf) $2.79 $2.56 $2.77
Net Loss Attributable to Common Stock ($77 mm) ($48 mm) ($138 mm)
Adjusted EBITDAX* $168 mm $181 mm $222 mm
Capital Investments $31 mm $100 mm** $139 mm
Cash Flow from Operating Activities ($15 mm)*** $105 mm $23 mm* See www.crc.com Investor Relations for a reconciliation to the closest GAAP measure and other important information.
** Capital Investments include BSP Capital but exclude MIRA Capital.
*** Operating cash flow includes a semi-annual cash property tax payment.

4Q & YE 2017 Earnings | 26
1Q18 Guidance
Anticipated Realizations Against the Prevailing Index Prices for 1Q18
Oil 92% to 96% of Brent
NGLs 62% to 66% of Brent
Natural Gas 88% to 92% of NYMEX
Production, Capital and Income Statement Guidance
Production 120 to 125 Mboe/d
Capital $115 to $135 million
Production Costs $19.25 to $20.75 per Boe
Adjusted G&A $6.05 to $6.35 per Boe
DD&A $10.50 to $10.80 per Boe
Taxes other than on income $36 to $40 million
Exploration expense $6 to $10 million
Interest expense $89 to $93 million
Cash Interest $58 to $62 million
Income tax expense rate 0%
Cash tax rate 0%

4Q & YE 2017 Earnings | 27
History of Proactive Strategic Decisions
Swift, decisive actions through the commodity downturn have positioned CRC for growth. Proactive discussions with
lenders and solid asset base provide a path to recovery and an actionable inventory.
0
5
10
15
20
25
30
$0
$20
$40
$60
$80
$100
$120
07/06/14 10/06/14 01/06/15 04/06/15 07/06/15 10/06/15 01/06/16 04/06/16 07/06/16 10/06/16 01/06/17 04/06/17 07/06/17 10/06/17 01/06/18
CR
C D
rillin
g R
ig C
ou
nt
Bre
nt
Cru
de
Oil P
rice
($
/B
bl)
*
Oil Price
CRC Rig Count
1. Cut rig count/began hedging 4. Deleveraging Transactions
2. Cut 2015 Capital Budget 5. Increasing activity, invest within Cash Flow
3. Bank Amendments 6. JV Transactions
2
1
5
3Under
OXY
6
SPIN-OFF
3
3
333
44
4
4
6
63

4Q & YE 2017 Earnings | 28
The Case for CRC: Investment Thesis Overview
Grow within
cash flow
Industry leading
decline rate
Integrated and
complementary
infrastructure
Maintain
Production
Production and
Cash Flow Growth
Production Innovation Deep Inventory
Investment Case for CRC
World-class assets
with significant
inventory
Resilient model that
preserves optionality
and protects downside
Focused on value
and poised for
growth
Moved from defense to offense
Why Own CRC Now
Competitive Advantages
Disciplined portfolio management Potential for EBITDAX growth
0
400
800
1,200
1,600
2,000
2,400
2,800
2017 2018E 2019E 2020E 2021E
$M
M
Clear runway and
available cash
-

Appendix

4Q & YE 2017 Earnings | 30
2014 Revolving Credit Facility Capacity -$1 billion
Updated Capital Structure from Recent Transactions – Improved Liquidity
2017 Term Loan - $1.3 billion
2016 Term Loan - $1 billion
2015 Second Lien - $2.25 billion
Unsecured Notes - $0.393 billion
Drawn Revolver
$837
$0
$250
$500
$750
$1,000
3Q17 PF 4Q17*
($M
M)
Revolver
Availability
$431
Revolver
Availability
$850
Cash $11
Cash $441
$0
$200
$400
$600
$800
$1,000
$1,200
$1,400
3Q17 PF 4Q17*A
vaila
bilit
y ($
MM
)
Increased Liquidity**
* Pro Forma for the Ares JV and $50mm private placement
** Subject to minimum liquidity requirement under 2014 Revolving Credit Facility. Includes unrestricted cash.
Reduced Revolver Borrowing
Added in NovemberD
eb
t H
iera
rch
y
Undrawn
Revolver

4Q & YE 2017 Earnings | 31
0%
10%
20%
30%
40%
50%
1 Year Decline
Median: 29%
Best In Class Corporate Decline Rates
0%
10%
20%
30%
40%
50%
60%
70%
80%
3 Year Decline
Median: 49%
CRC
CRC
Peers included: CLR, COG, CPE, CXO, DNR, EGN, EOG, EPE, FANG, HK, LPI, MRO, MTDR, MUR, NFX, OAS, PDCE, PE, PXD, QEP,RRC, RSPP, SM, SN, WLL,WPX, and XEC.
Source: Wood Mackenzie - Operated Production Data through 2016, CRC analysis.
FY 2016 Production Percentage Liquids
Less than 55% 55% - 75% Greater than 75%

4Q & YE 2017 Earnings | 32
Significant Reduction in Net Debt from Post-Spin Peak
6,7651
4,502
3,000
4,000
5,000
6,000
7,000
2Q15 Debt Exchange for
2L
Open Market
Repurchases
Equity for Debt
Exchange
Cash Tender
for Unsecureds
Cash Flow Ares Transactions PF 4Q17
Tota
l N
et
De
bt
($ M
M)
2
Cumulative Debt Reduction Total
Total Net Principal Reduction$535
million
$153
million
$102
million
$625
million
$59
million
$789
million$2,263 million
1 Represents mid-second quarter 2015 peak debt.2 Includes operating cash flow, positive working capital and proceeds from asset sales in 1H 2017, net of restricted cash.3 Pro Forma net debt at 4Q17 includes the payoff of the 12/31/2017 outstanding balance of $363 million on our RCF and $441 million of available cash after the completion of the of Ares transactions.
-
Chose options to maximize deleveraging and minimize recurring cost to the income statement on a per share basis.
Continue to seek opportunistic transactions that reduce overall debt.
3

4Q & YE 2017 Earnings | 33
End Notes
1 Current CRC estimate of reserves value as of December 31, 2017. Includes field-level operating expenses and G&A. Assumes
$3.00/MMBTU NYMEX.
2Reflects that the value of facilities and midstream assets at 50% of estimated replacement value. This discount is estimated to
exceed the burden on reserves that would be incurred if assets were monetized. Excludes the value of the assets monetized in the
Ares transaction.
3 Surface & Minerals reflect the estimated value of undeveloped surface and minerals held in fee.
4 Unproved inventory comprises risked probable and possible reserves and contingent and prospective resources. Contingent and
prospective resources consist of volumes identified through life-of-field planning efforts to date.
5 Calculated using December 31, 2017 debt at par and market cap as of February 19, 2018.
Value Creation Index (VCI) Note: VCI is calculated by dividing the net present value of the project’s expected pre-tax cash flow over its
life by the net present value of the investments, each using a 10% discount rate.