Embed Size (px)
Citation preview

FOURTH QUARTER & FULL YEAR 2017
RESULTS
February 28, 2018
2
SAFE HARBOR
This presentation may contain forward-looking information. Forward-
looking statements describe expectations, plans, strategies, goals,
future events or intentions. The achievement of forward-looking
statements contained in this presentation is subject to risks and
uncertainties relating to a number of factors, including general
economic factors, interest rate and foreign currency exchange rate
fluctuations, changing market conditions, product competition, the
nature of product development, impact of acquisitions and
divestitures, restructurings, products withdrawals, regulatory approval
processes, all-in scenario of R&D projects and other unusual items.
Consequently, actual results or future events may differ materially
from those expressed or implied by such forward-looking statements.
Should known or unknown risks or uncertainties materialize, or
should our assumptions prove inaccurate, actual results could vary
materially from those anticipated. The Company undertakes no
obligation to publicly update or revise any forward-looking statements
This document does not constitute an offer to sell, or the solicitation
of an offer to subscribe for or buy, any securities.
FORENOTE Following the announcements in December 2016 of the divestment of
the Acetow and Vinythai businesses and in September 2017 of plans
to divest the Polyamide business, these have been reclassified as
discontinued operations and as assets held for sale. For comparative
purposes, the fourth quarter and the full year 2016 income statement
have been restated. The Vinythai transaction was completed end of
February 2017 and the Acetow transaction end of May 2017.
Besides IFRS accounts, Solvay also presents underlying Income
Statement performance indicators to provide a more consistent and
comparable indication of the Group’s financial performance. The
underlying performance indicators adjust IFRS figures for the non-
cash Purchase Price Allocation (PPA) accounting impacts related to
acquisitions, for the coupons of perpetual hybrid bonds, classified as
equity under IFRS but treated as debt in the underlying statements,
and for other elements that would distort the analysis of the Group’s
underlying performance.
February 28, 2018
Q4 & FY 2017 Results

OVERVIEW
• Delivering our plan
• Financial highlights
• Priorities and outlook
• Annexes
3 February 28, 2018
Q4 & FY 2017 Results

STRONG EARNINGS GROWTH AND CASH GENERATION
February 28, 2018
Q4 & FY 2017 Results 4
Portfolio upgrade completed
Acetow, Vinythai and Polyamide
Strong volumes
Leading to 7.5% EBITDA growth
Sustained cash generation
€871 million
Including 19% increase on continuing operations
Delivering on our plan
[1] constant scope and FX

5
UPGRADED PORTFOLIO Enhancing
customized
solution
offerings
Reducing
cyclical &
low-growth
businesses
exposure
2011 2012 2013 2014 2015 2016
Ryton
Inovyn Eco
Services
Chem-
logics
Cytec
PCC
Refri-
gerants
Indupa
Pipe-
life
Rhodia
global sustainable specialty resilient innovative MORE
Acetow
Viny-
thai
Form.
resins
2017
XL
comp
ounds
ACQUISITIONS
DIVESTMENTS
[1] Divestment in progress, expected to be finalized by the end of 2018
February 28, 2018
Q4 & FY 2017 Results
Polyamide [1]
Dakarto
Benvic
LT-CF
plant Ener-
gain
Phos-
phorous
Benvic

February 28, 2018
Q4 & FY 2017 Results 6
SIGNIFICANTLY ENHANCED PORTFOLIO
MORE GLOBAL, MORE SPECIALTY
>50% in
Europe
Europe
Asia & RoW
Latin America
North America
MORE
GLOBAL
Automotive & aerospace
Resources & environment
Electrical & electronics
Agro, feed & food
Consumer goods & healthcare
Building & construction
Industrial applications
~33% in each
main region
~20% in GDP+
markets
>50% in GDP+
markets
<20% sustainable
solutions
~49% sustainable
solutions
MORE
DIVERSIFIED
MORE
SUSTAINABLE
Sustainable solutions
Neutral impact
Challenged applications
(according to SPM methodology)
2010
€6.5 billon
2017
€10.1 billon
NET
SALES
>70% specialty
products
~25% specialty
products
MORE
SPECIALTY
Advanced Materials
Advanced Formulations
Performance Chemicals

SOLID FULL YEAR PERFORMANCE
February 28, 2018
Q4 & FY 2017 Results 7
EBITDA +7.5% (9.7% organic[1])
Volume/mix impact of 16%
Fixed costs effect -6.5%
linked to business growth
EBITDA margin sustained
at 22%
Positive contribution from
lower financial charges and
reduced tax rate
Resulting from EBITDA growth
and capex discipline
Underlying net debt reduced to
€5.3 billion
Leverage 2.6x 2.2x
Free cash flow
€871m (+19%)
Underlying EPS up 26% Cash conversion
up 8pp to 68%
[1] constant scope and FX
February 28, 2018 8
Q4 & FY 2017 Results
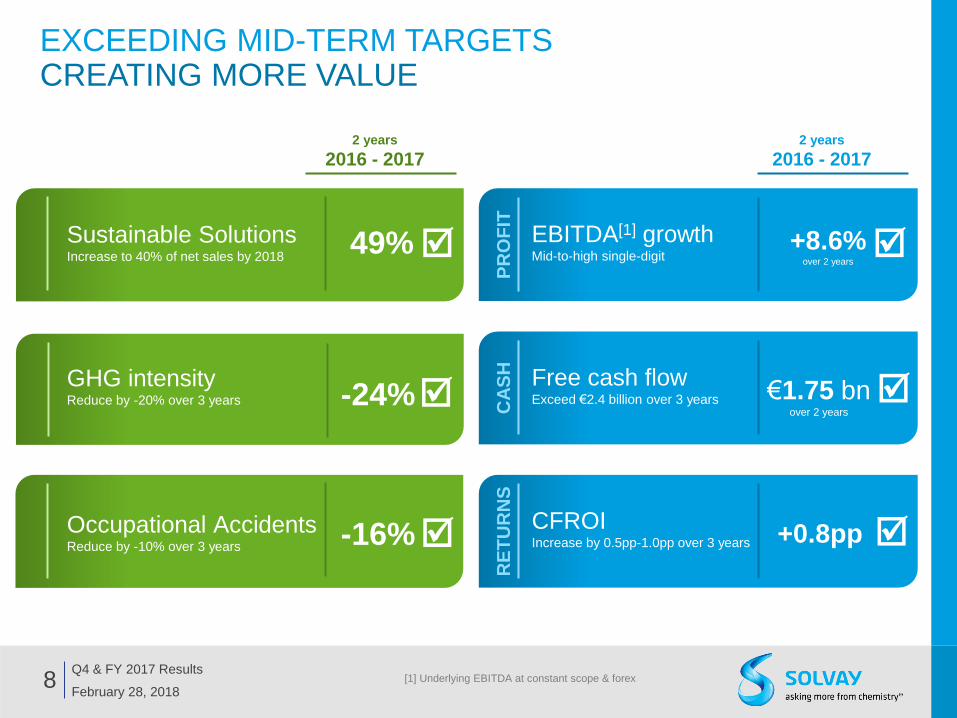
EXCEEDING MID-TERM TARGETS CREATING MORE VALUE
[1] Underlying EBITDA at constant scope & forex
CA
SH
R
ET
UR
NS
Free cash flow Exceed €2.4 billion over 3 years €1.75 bn
over 2 years
PR
OF
IT
EBITDA[1] growth Mid-to-high single-digit
+8.6% over 2 years
CFROI Increase by 0.5pp-1.0pp over 3 years
2 years
2016 - 2017
+0.8pp Occupational Accidents Reduce by -10% over 3 years
GHG intensity Reduce by -20% over 3 years -24%
Sustainable Solutions Increase to 40% of net sales by 2018
-16%
2 years
2016 - 2017
49%

OVERVIEW
• Executing our plan
• Financial highlights
• Priorities and outlook
• Annexes
February 28, 2018 9 Q4 & FY 2017 Results

Volume growth offset adverse
forex; strong demand in
automotive and smart devices;
Modest growth of composites
for aeronautics
Continued strong volumes and
excellence partly offset higher
energy costs in soda ash
Volumes driven by recovery in
the North American shale oil &
gas fully offset adverse forex
Slightly higher due to project
costs; operational excellence
offsetting fixed cost inflation
underlying
EBITDA
FY 2017
10
RESILIENT MULTI-SPECIALTY PORTFOLIO VOLUME-DRIVEN GROWTH ACROSS ALL SEGMENTS
ADVANCED
FORMULATIONS
ADVANCED
MATERIALS
PERFORMANCE
CHEMICALS
February 28, 2018
Q4 & FY 2017 Results
margin
26% 27%
FY 2016 FY 2017
margin
28% 27%
FY 2016 FY 2017
margin
18% 18%
FY 2016 FY 2017
Corporate & Business Services included in € 616 m EBITDA
and is excluded from the pie chart as the contribution is negative
CORPORATE &
BUSINESS SERVICES
FY 2016 FY 2017
49% 21%
30%
€2,230m
484 524
+8.1%
(237) (244)
-2.8% 718 749
+4.3%
1,110 1,202
+8.2%

11
HIGHER SALES DRIVEN BY VOLUME & MIX
February 28, 2018
Q4 & FY 2017 Results
Volume growth
Volume growth in all four segments
Good demand from end markets including
automotive, industrial & agro
Foreign exchange
Negative impact mainly from US dollar;
Other currency impacts from Chinese yuan,
British pound & Japanese yen
Net sales in € million
FY 2016
Scope -0.7%
Conversion forex -1.2%
Volume & mix +7.9%
Price -0.1%
FY 2017
9,569 (71) (116)
754 (11) 10,125
+5.8% Scope
Small negative impact following the sale of
polyolefin cross-linkable compounds and
formulated resins

12
RECORD EBITDA MARGIN SUSTAINED DRIVEN BY VOLUME GROWTH
February 28, 2018
Q4 & FY 2017 Results
Net pricing Higher raw material costs in
Advanced Formulations and lower
average prices in Performance
Chemicals
+0.3pp 22% margin
22% margin
Underlying EBITDA in € million
Fixed costs Higher fixed costs related to
volume growth
FY 2016
Scope -0.9%
Conversion forex -1.1%
Volume & mix +16%
Net pricing (2.2)%
Fixed costs -6.5%
Others (including
equity earnings)
+2.4%
FY 2017
2,075 (19) (22)
327 (45) (135) 50 2,230
+7.5%
Volume & mix Growth across all business
segments

13
UNDERLYING NET INCOME REFLECTS SIGNIFICANT INCREASE IN OPERATING PROFIT
February 28, 2018
Q4 & FY 2017 Results
Underlying profit (Solvay share) up 11%
Higher EBIT growth versus prior year
Lower underlying tax rate due to change in
geographical mix
[1] Adjustments are made to IFRS figures to obtain underlying figures. This presentation reconstructs
the IFRS from the underlying and therefore the adjustment are presented with the opposite sign.
Underlying P&L
in € m FY 2017 FY 2016 % yoy
Net sales 10,125 9,569 +6%
EBITDA 2,230 2,075 +7%
EBITDA margin 22% 22% -
Depreciation & amortization (704) (672) -5%
EBIT 1,527 1,403 +9%
EBIT margin 15% 15% -
Net financial charges (394) (464) +15%
Income taxes (299) (272) -10%
Tax rate (ytd) 28% 30% -3pp
Discontinued operations 159 240 -34%
Non-controlling interests (-) (54) (61) +11%
Profit, Solvay share 939 846 +11%

(191) (161)
(193) (159)
(202)
(153)
(252)
(243)
(839)
(716)
2016 2017
-15%
Q4
Q3
Q2
Q1
IMPROVEMENT IN CASH CONVERSION DRIVEN BY LOWER CAPEX AND HIGHER EBITDA
14
Free cash flow
Sustainable improvement
Profit growth
Improved cash conversion
February 28, 2018
Q4 & FY 2017 Results
Capex in € million
New production in 2017
PVDF for batteries in China (Specialty Polymers)
High-purity H2O2 in Italy (Special Chem)
Silica plant in South Korea
Composites/Resins in Germany
HPPO in Saudi Arabia (Peroxides)
PEEK in the US (Specialty Polymers)

15 February 28, 2018
Q4 & FY 2017 Results
Free cash flow of €871 million
Profit growth
Capex €716m, 15% lower versus last year
Working capital discipline maintained
[1] Underlying net debt reclassifies hybrid perpetual bonds (considered as equity under IFRS) as debt
Underlying net debt [1] evolution in € million
FOCUS ON CASH MAINTAINED €1.2 BILLION REDUCTION IN NET DEBT
M&A inflow
Net proceeds related to recent divestments
(Vinythai, Acetow and other smaller
operations)
Free cash flow €871m
vs €876m in FY 2016
December 31, 2016
Underlying EBITDA
Capex
Changes in working capital needs:
industrial -140
non-industrial -20
Taxes Changes in provisions
& other operating cash flow
Free cash flow from
discontinued operations Acquisitions
& divestments
Financing payments:
Net interests -255
Perpetual hybrid bond
coupons -111
Dividends: non-controlling
interests -39
Solvay -357
Other changes
in net debt
December 31, 2017
(6,556) +2,230
-716 -160 -199
-373 +89 +875
-367
-396 +227 (5,346)
IFRS net debt (3,146)
Perpetual hybrid bonds (2,200)
Perpetual hybrid bonds (2,200)
IFRS net debt (4,356)

16 February 28, 2018
Q4 & FY 2017 Results
EFFICIENT CAPITAL STRUCTURE DELEVERAGING CONTINUES
[1] Underlying debt includes perpetual hybrid bonds (considered as equity under IFRS)
[2] Net debt / underlying EBITDA of last 12 months
Underlying debt [1]
evolution in € billion
at weighted average interest rate
EUR perpetual
hybrid bonds
USD bonds
EU bonds
& major debt
Other debt
Cash
Underlying
31/12/2016 31/12/2017
Net debt[1] € 6.6 bn € 5.3 bn
Leverage[2] 2.6x 2.2x Baa2 BBB
Redeemed or
Repurchased
-26%
-41%
Pro forma impact from
Polyamide divestment
Underlying net debt €4.2 bn
Underlying leverage 1.9x

OVERVIEW
• Executing our plan
• Financial highlights
• Priorities and outlook
• Annexes
17 February 28, 2018
Q4 & FY 2017 Results
18
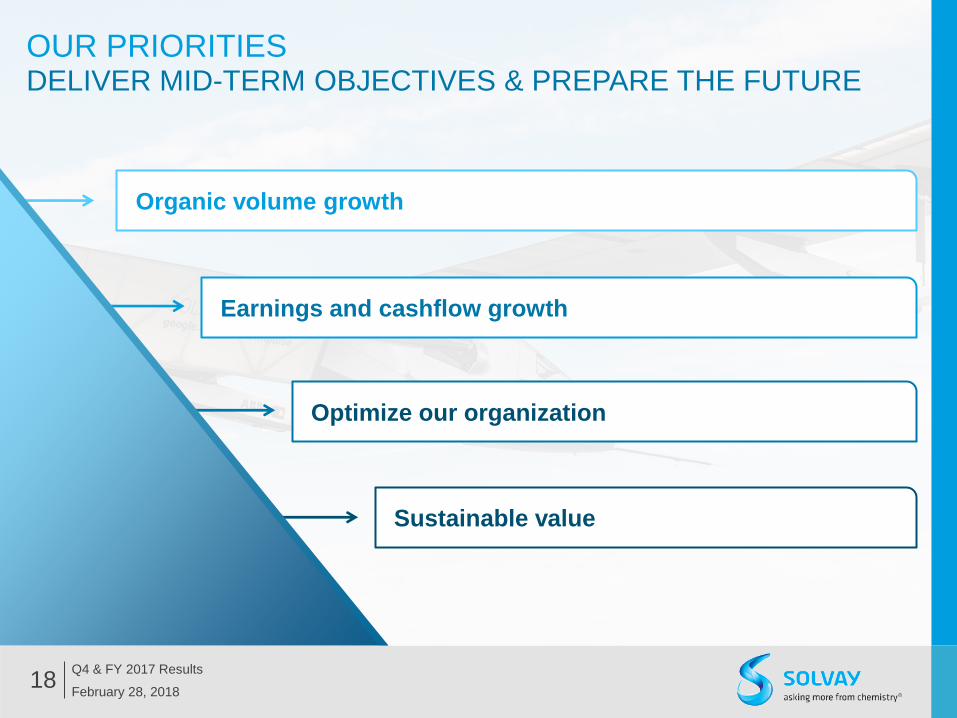
OUR PRIORITIES DELIVER MID-TERM OBJECTIVES & PREPARE THE FUTURE
Organic volume growth
Earnings and cashflow growth
Optimize our organization
Sustainable value
Q4 & FY 2017 Results
February 28, 2018

Free cash flow[2] to exceed 2017
level of €782 million
19
OUTLOOK FULL YEAR 2018
February 28, 2018
Underlying EBITDA to grow
5% to 7% organically [1]
Q4 & FY 2017 Results [1] At constant scope and relative to average 2017 forex levels
[2] Free cash flow from continuing operations

INVESTOR RELATIONS CONTACTS
20
Kimberly Stewart
+32 2 264 3694
Jodi Allen
+1 609 860 4608
Geoffroy Raskin
+32 2 264 1540
Bisser Alexandrov
+32 2 264 3687
NEXT EVENTS
February 28, 2018
Q4 & FY 2017 Results
May 23,
2018
July 31,
2018
Q2 & H1 2018
results
Final dividend
payment
November 8,
2018
Q3 2018
results
May 3,
2018
Q1 2018
results
May 8,
2018
Annual general
meeting
ANNEXES
• Additional FY 2017 financial data
• Q4 2017 financial data
• General information
• Other financial considerations for 2018
21 February 28, 2018
Q4 & FY 2017 Results

ADVANCED MATERIALS FY 2017
22 February 28, 2018
Q4 & FY 2017 Results
margin
Net sales (in € million) EBITDA (in € millon)
1,110 1,202
26% 27%
FY 2016 FY 2017
+8.2%
46%
24% 20%
€4,370m
Specialty Polymers Composite Materials
Special Chem
Specialty Polymers
sales up +5%
Higher volume growth but
offset adverse forex effects
Strong demand in automotive
& batteries, smart devices
recovered well
Small negative scope effect
due to a small divestment
Composite Materials
sales down -3%
Stable volumes with
aeronautics offset by
industrial applications
F-35 ramp-up and growth in
single-aisles, equipped with
LEAP engine, more than
compensated for the wide-
bodies decline
Special Chem
sales up +0.3%
Higher volumes and good
pricing on strong electronics
and insulation demand
Contribution from recent
capacity expansions
Silica
sales down -3%
Volume growth in Europe
and Asia
But adverse price
developments through the
year
FY 2016
Scope -1.0%
Conversion forex -1.7%
Volume & mix +4.6%
Price -0.6%
FY 2017
4,313 -41 -74 +199 -27 4,370
+1.3%

ADVANCED FORMULATIONS FY 2017
23 February 28, 2018
Q4 & FY 2017 Results
margin
Net sales (in € million) EBITDA (in € million)
FY 2016
Scope -0.5%
Conversion forex -1.7%
Volume & mix +13%
Price +0.5%
FY 2017
2,668 -14 -44 +342 +14 2,966
+11%
484 524
18% 18%
FY 2016 FY 2017
+8.1%
65%
22%
€2,966m
Advanced FormulationsNovecareTechnology Solutions
Novecare
sales up +16%
• Recovery in North American shale oil &
gas activity
• Gradual improvement in the product mix
throughout the year
• Moderate demand growth in agro,
coatings and industrial applications
Technology Solutions
sales up +1%
• Slightly higher but tampered by scope
effects following a small divestment
• Mining volumes rose only mildly due to
production outages at some
customers’ copper mines,
• Strong demand for phosphine
specialties
Aroma Performance
sales up +5%
• Higher sales as the new vanillin plant
in China has been ramping up
• Competitive price pressure persist in
Asia

PERFORMANCE CHEMICALS FY 2017
24 February 28, 2018
Q4 & FY 2017 Results
margin
Net sales (in € million) EBITDA (in € million)
FY 2016
Scope -0.6%
Conversion forex
+0.1%
Volume & mix +7.6%
Price +0.1%
FY 2017
2,581 -16 +2 +196 +3 2,766
+7.2%
718 749
28% 27%
FY 2016 FY 2017
+4.3%
Soda Ash & Derivatives
sales up +4%
Higher soda ash volumes
bound to the seaborne
market
Albeit slightly lower prices
Bicarbonate sales were
stronger, supported by the
ramp-up of the new plant in
Thailand
Peroxides
sales up +11%
Contribution from the
HPPO plant in Saudi
Arabia
The new Chinese plant
ramp-up offset lower sales
in the bulk and specialties
markets
Coatis
sales up +18%
Price increase and modest
volume growth lent support
Signs of recovery in the
domestic Latin American
market
Functional Polymers
sales down -4%
Activity benefitted from
signs of recovery on the
domestic Latin American
market
Negative scope effect
following a small
divestment
59%
22%
15%
4%
€2,766m
Soda Ash & Derivatives Peroxides
Coatis Functional Polymers

CORPORATE & BUSINESS SERVICES FY 2017
25 February 28, 2018
Q4 & FY 2017 Results
EBITDA (in € million)
(237) (244)
FY 2016 FY 2017
-2.8%
Key figures(in € million) FY 2017 FY 2016 % yoy
Net sales 23 7 n.m.
Energy Services - 4 n.m.
Other Corporate & Business Services 23 3 n.m.
EBITDA (244) (237) -
Energy Services 21 4 n.m.
Other Corporate & Business Services (264) (241) -
Underlying
Energy Services
EBITDA of €21 million versus €4 million in 2016 supported
by some favorable market opportunities in the third quarter
Benefitted from renewable energy projects restructuring in
2016
Other Corporate & Business Services
• €(23) million higher than in 2016 due to higher project
costs through the year.
• Fixed costs inflation offset by operational excellence

26
DEBT PROFILE BALANCED MATURITIES ALLOWING FLEXIBILITY
[1] Major debt only, excluding cost of currency swaps
[2] At first call date
Major debt [1] December 31, 2016 December 31, 2017
Face
value
Average
maturity
Average
cost
Face
value
Average
maturity
Average
cost
EUR bonds 2,750 4.3 1.97% 1,632 5.5 2.67%
EUR perpetual hybrid bonds [2] 2,200 5.1 5.07% 2,200 4.1 5.07%
USD bonds 2,212 [3] 6.5 4.03% 1,634 [4] 5.7 3.88%
Total major debt 7,162 5.2 3.55% 5,465 5.0 4.00%
in € m in years in € m in years
February 28, 2018
Q4 & FY 2017 Results
€1,000 @Euribor
+82bp
€382 @4.63%
€750 @1.63%
€500 @2.75%
€700 @4.20%
€500 @5.12%
€500 @5.43%
€500 @5.87%
$800 @3.40%
$800 @4.45%
$196 @3.50%
$163 @3.95%
$82 @8.95%
€118 @4.63%
$204 @3.50%
$87 @3.95%
2017 2018 2019 2020 2021 2022 2023 2024 2025 2026 2027
Major debt in million
Repaid in
December 2017
Repaid
in July 2017
Repaid in
October 2017
[3] USD 2,332 m
[4] USD 1,960 m

2.7
(5.3)
Net pension liabilities
(2.6)
Assets Liabilities
27
NET PENSION LIABILITIES [1] DOWN ON CASH CONTRIBUTION AND SCOPE EFFECT
[1] Continuing operations only
[2] Average discount rate on post employment benefit related liabilities applicable to high quality corporate bonds
in EUR, GBP and USD zones
Net pension liabilities (31/12/2017) in € billion
All presented figures are for continuing operations only
Euro-zone
70%
United Kingdom
16%
Discount rate evolution [2]
February 28, 2018
Q4 & FY 2017 Results
Other
2%
United States
12%
Pensions (31/12/2017)
in € billion
Currency
December
31,
2017
December
31,
2016
% since year
start
Average 2.4% 2.6% (0.3)%
EUR 1.5% 1.5% -
GBP 2.5% 2.8% (0.2)%
USD 3.5% 4.0% (0.5)%
Cash contribution from continuing operations at € (193) m
over the year
Due to US cash contribution increase
Versus € (172) m in 2016
Net pension liabilities decreased by € 0.3 bn over the year
Pension liabilities improved € 0.4 bn to € (5.3) bn following
mainly currency translation gain and polyamide divestment
Pension assets down € 0.1 bn to € 2.7 at year end

ANNEXES
• Additional FY 2017 financial data
• Q4 2017 financial data
• General information
• Other financial considerations for 2018
28 February 28, 2018
Q4 & FY 2017 Results

29
HIGHER SALES DRIVEN BY VOLUME & MIX
February 28, 2018
Q4 & FY 2017 Results
Volume growth
Volume growth in all business segments
Good demand from end markets including
automotive, smart devices, oil & gas
Foreign exchange
Negative impact mainly from the US dollar
Net sales in € million
Scope
Negative impact following the sale of
polyolefin cross-linkable compounds and
formulated resins
Q4 2016
Scope -0.9% Conversion
forex -4.8%
Volume & mix +7.7%
Price -
Q4 2017
2,431 (22) (116) 188 (1) 2,480
+2.0%

30
RECORD EBITDA MARGIN SUSTAINED DRIVEN BY VOLUME
February 28, 2018
Q4 & FY 2017 Results
Pricing power Higher raw material costs in
Advanced Formulations and higher
energy costs Performance Chemicals
negatively impacted margin
+0.1pp 20% margin
20% margin
Volume & mix Growth across all business segments
Underlying EBITDA in € m
Q4 2016
Scope -1.2% Conversion
forex -4.9%
Volume & mix +17%
Net pricing (5.3)%
Fixed costs -3.7%
Others (including
equity earnings)
+1.2%
Q4 2017
480 (6) (23)
80 (25) (18) 6 494
+2.8%
Fixed costs Higher fixed costs related to volumes
growth

Continued strong demand in
automotive and smart
devices; Composites for
aero stable
Maintained solid recovery in
North American oil & gas
ADVANCED
FORMULATIONS
ADVANCED
MATERIALS
margin
24% 25%
Q4 2016 Q4 2017
margin
18% 18%
Q4 2016 Q4 2017
259 260
+0.4%
124 138
+11%
Soda ash
volumes up,
but margins affected by
higher energy costs
Largely stable;
Continued cost discipline
offsetting inflation
PERFORMANCE
CHEMICALS
margin
26% 25%
Q4 2016 Q4 2017
170 170
+0.4%
CORPORATE &
BUSINESS SERVICES
(72) (74)
-2.3%
Q4 2016 Q4 2017
underlying
EBITDA
Q4 2017
31
RESILIENT MULTI-SPECIALTY PORTFOLIO VOLUME-DRIVEN GROWTH ACROSS EACH OPERATING SEGMENT
February 28, 2018 Q4 & FY 2017 Results Corporate & Business Services included in € 616 m EBITDA
and is excluded from the pie chart as the contribution is negative
46% 24%
30%
€494m

ADVANCED MATERIALS Q4 2017
32
Specialty Polymers
sales down -1%
Higher volumes offset by
adverse conversion forex
Continued demand in
automotive, smart devices
and food packaging
Small negative scope effect
due to a minor divestment
Composite Materials
sales down -5%
Stronger aeronautics
volumes driven by the F-35
ramp-up
Single-aisles & LEAP
engine growth offset wide-
bodies decrease
Lower volumes in industrial
composites
Special Chem
sales down -1%
Higher volumes on strong
electronics demand
Contribution from recent
capacity expansions
Silica
sales down -7%
Stable volumes
Energy-efficient tires
demand stable
But prices were lower
February 28, 2018
Q4 & FY 2017 Results
margin
Net sales (in € million) EBITDA (in € million)
259 260
24% 25%
Q4 2016 Q4 2017
+0.4%
Q4 2016
Scope -1.6% Conversion
forex -5.1%
Volume & mix +5.3%
Price -1.2%
Q4 2017
1,076 -18 -54 +57 -13 1,047
-2.7%
45%
24% 21%
€1,047m
Specialty Polymers Composite Materials
Special Chem

ADVANCED FORMULATIONS Q4 2017
33
Novecare
sales up +10%
• Stronger volumes thanks to higher
North American shale oil & gas activity
• Supportive coatings and industrial
applications volumes albeit at a lower
level
Technology Solutions
sales up +3%
• Recovery in demand from copper
and aluminum mining (highest level
since 2015)
• Specialty phosphines supported by
electronics applications
Aroma Performance
sales down -7%
• Stable volumes on high-end vanillin
ingredients
• But decrease on lower-grade
performance solutions
February 28, 2018
Q4 & FY 2017 Results
margin
Net sales (in € million) EBITDA (in € millon)
64%
23%
€747m
Advanced FormulationsNovecareTechnology Solutions
Q4 2016
Scope -0.5% Conversion
forex -5.3%
Volume & mix +10%
Price +1.2%
Q4 2017
708 -4 -38 +72 +9 747
+5.5%
124 138
18% 18%
Q4 2016 Q4 2017
+11%

PERFORMANCE CHEMICALS Q4 2017
34
Soda Ash & Derivatives
sales up +1%
Good volumes on sustained
demand, namely from the
seaborne market
Prices though were slightly
lower
Bicarbonate grew albeit at a
slower pace
Peroxides
sales up +10%
Stronger volumes
reflecting ramp-up of the
HPPO plant in Saudi
Arabia
Coatis
sales up +15%
Volumes supported by
signs of recovery on the
domestic Latin American
market and decreased
import pressure
Higher pricing for both
phenols and solvents
February 28, 2018
Q4 & FY 2017 Results
margin
Net sales (in € millon) EBITDA (in € million)
Q4 2016
Scope -0.1%
Conversion forex -3.7%
Volume & mix +8.4%
Price +0.6%
Q4 2017
645 - -24 +54 +4 679
+5.2%
170 170
26% 25%
Q4 2016 Q4 2017
+0.4%
Functional Polymers
sales up +3%
Activity benefitted from
signs of recovery on the
domestic Latin American
market
58%
22% 16%
4% €679m
Soda Ash & Derivatives Peroxides
Coatis Functional Polymers
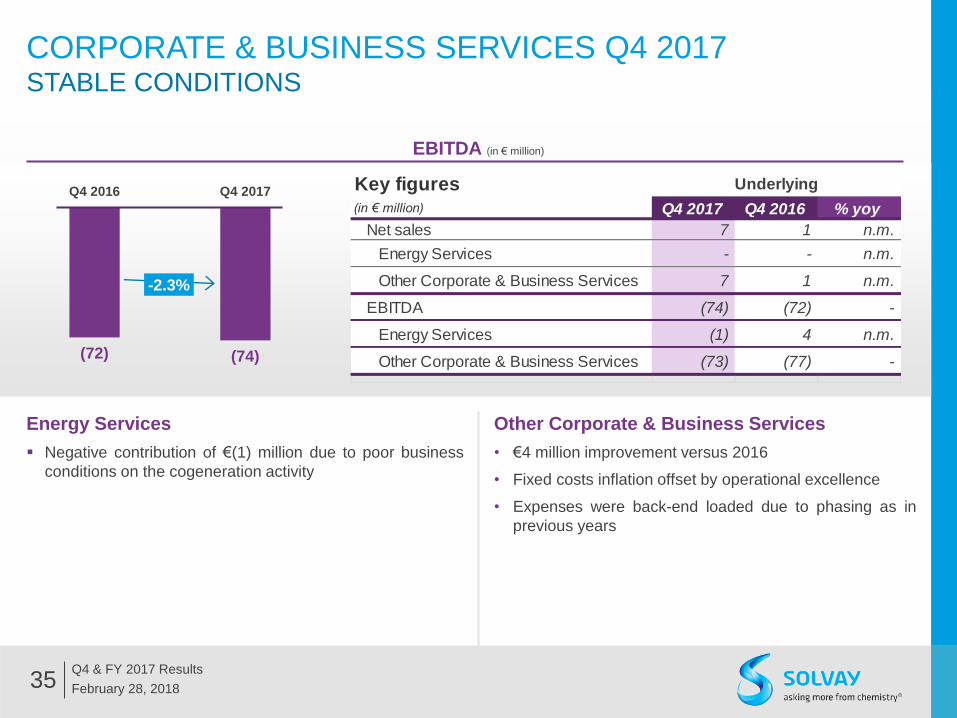
CORPORATE & BUSINESS SERVICES Q4 2017 STABLE CONDITIONS
35
Energy Services
Negative contribution of €(1) million due to poor business
conditions on the cogeneration activity
Other Corporate & Business Services
• €4 million improvement versus 2016
• Fixed costs inflation offset by operational excellence
• Expenses were back-end loaded due to phasing as in
previous years
February 28, 2018
Q4 & FY 2017 Results
EBITDA (in € million)
Key figures(in € million) Q4 2017 Q4 2016 % yoy
Net sales 7 1 n.m.
Energy Services - - n.m.
Other Corporate & Business Services 7 1 n.m.
EBITDA (74) (72) -
Energy Services (1) 4 n.m.
Other Corporate & Business Services (73) (77) -
Underlying
(72) (74)
Q4 2016 Q4 2017
-2.3%

36
UNDERLYING NET INCOME REFLECTING HIGHER OPERATING PROFIT
February 28, 2018
Q4 & FY 2017 Results
Underlying profit (Solvay share) down 21%
Higher EBIT growth versus prior year
Lower underlying tax rate due to change in
geographical mix
[1] Adjustments are made to IFRS figures to obtain underlying figures. This presentation reconstructs
the IFRS from the underlying and therefore the adjustment are presented with the opposite sign.
in € m Q4 2017 Q4 2016 % yoy
Net sales 2,480 2,431 +2%
EBITDA 494 480 +3%
EBITDA margin 20% 20% -
Depreciation & amortization (187) (184) -2%
EBIT 307 296 +4%
EBIT margin 12% 12% -
Net financial charges (90) (109) +17%
Income taxes (60) (50) -20%
Tax rate (ytd) 28% 30% -3pp
Discontinued operations 2 66 n.m.
Non-controlling interests (-) (14) (21) +34%
Profit, Solvay share 145 183 -21%
Underlying P&L

vs €412m in Q4 2016
37 February 28, 2018
Q4 & FY 2017 Results
Higher Free cash flow at €388m
Profit growth
Lower capex
Working capital discipline maintained
[1] Underlying net debt reclassifies hybrid perpetual bonds (considered as equity under IFRS) as debt
Underlying net debt [1] evolution in € m
FOCUS ON CASH MAINTAINED REDUCTION IN NET DEBT
M&A outflow
Related to recent small
acquisitions and price & cost
adjustments on ongoing
divestments
September 30, 2017
Underlying EBITDA
Capex Changes in working capital needs:
industrial +149
non-industrial +20
Taxes Changes in provisions
& other operating cash flow
Free cash flow from
discontinued operations
Acquisitions &
divestments
Financing payments:
Net interests -111
Perpetual hybrid bond
coupons -27
Dividends: non-controlling
interests
Other changes
in net debt
December 31, 2017
(5,538) +494 -243 +169 -26 -58 +52 -53 -139 -35 +31 (5,346)
IFRS net debt (3,146)
Perpetual hybrid bonds (2,200)
Perpetual hybrid bonds (2,200)
IFRS net debt (3,338)
Free cash flow € 388 m

ANNEXES
• Additional Q4 & FY 2017 financial data
• Q4 2017 financial data
• General information
• Other financial considerations for 2017
38 February 28, 2018
Q4 & FY 2017 Results

February 28, 2018
Q4 & FY 2017 Results 39
WE ARE A WORLD LEADER
IN THE CHEMICAL INDUSTRY
~24,500 employees
61 countries
124 Industrial sites
21 Major R&I sites
€10.1bn
net sales
€2.2bn
underlying EBITDA
[1] Applicable to ~90% of portfolio
22% EBITDA margin
Top 3 Market position [1]
1 2
3
2017

STRONG DELIVERY IN 2017
40
RESILIENT CASH
CONTRIBUTOR GROWTH ENGINES
February 28, 2018
Q4 & FY 2017 Results
#
#
Global market position in main markets addressed
Regional market position in main markets addressed
Market positions:
Customized specialty
formulations for surface
chemistry & liquid behavior,
maximizing yield & efficiency
& minimizing
eco-impact
ADVANCED
FORMULATIONS
Technology Solutions
Novecare
Aroma Performance
#1
#1
#1
Leading positions
in chemical intermediates
through scale & technology,
developing applications &
industrial innovation for
optimized costs
PERFORMANCE
CHEMICALS
Soda Ash & Derivatives
Peroxides
#1
Coatis #1
#1
Functional Polymers #1
Providing solutions for
sustainable mobility,
lightweighting,
C02 and energy
efficiency
ADVANCED
MATERIALS
Silica
Specialty Polymers
Composite Materials
#1
Special Chem
#2
#1
#1
Underlying
EBITDA
2017
49% 21%
30%
Net sales €10,125 m €4,370 m €2,966 m €2,766 m
Underlying EBITDA €2,230 m €1,202 m €524 m €749 m
EBITDA growth +7.5% +8.2% +8.1% +4.3%
EBITDA margin 22% 27% 18% 27%
CFROI 6.9% 10.3% 6.7% 8.4%

ANNEXES
• Additional Q4 & FY 2017 financial data
• Q4 2017 financial data
• General information
• Other financial considerations for
2018
41 February 28, 2018
Q4 & FY 2017 Results

42
FINANCIAL CONSIDERATIONS FOR 2018
Divestments having led to restatements in 2017
• Polyamide planned to be sold to BASF, expected to be
completed in the second half of 2018
Scope effects
Depreciation/Amortization & Capex
D&A expected at ~€(700)m, in line with 2017
• Excludes PPA amortization
PPA amortization of ~€(240)m
• Includes PPA impacts from Rhodia, Cytec and other
smaller acquisitions (e.g. Chemlogics, Ryton)
Capital expenditure from continuing operations expected at
~€(700)m
February 28, 2018
Q4 & FY 2017 Results
Immediate impact on conversion exposure
Deferred transactional impact due to hedging
(6-12 month rolling basis)
Mainly linked to USD. Sensitivity in 2018:
• ~€120 m underlying EBITDA per (0.10) $/€
• ~2/3 conversion & ~1/3% transactional
Other forex exposures
• CNY, BRL, JPY, RUB, KRW, THB
Evolution of main currencies Solvay is exposed to:
Forex sensitivity
/€ USD GBP JPY BRL RUB CNY KRW THB
2016 1.107 0.819 120 3.86 74.14 7.35 1284 39.04
2017 1.130 0.877 127 3.61 65.94 7.63 1277 38.30
(d)evaluation FC in % 2% 7% 5% -7% -11% 4% -1% -2%
Underlying tax rate (adjusted for PPA and other factors)
expected at ~26%
Tax rate
Underlying net financial charges expected at ~€(350)m,
excluding foreign exchange fluctuations impact
Underlying net cost of borrowings at expected at
~€(150)m
Coupons from perpetual hybrid bonds expected at
~€(112)m (considered as dividend & equity under IFRS)
• €(84)m in Q2 and €(27)m in Q4
• Average cost: 5.07%
Non cash recurring discounting provisions expected
at ~€(80)m
Net cash financing payments at ~€(250)m
Net debt sensitivity of ~€140m, and net financial
charges of ~€5m
P&L and cash flow elements

SOLVAY’S ADR PROGRAM CONVENIENCE OF INVESTING IN AMERICAN DEPOSITARY RECEIPTS (ADRS) THROUGH A SPONSORED LEVEL 1 PROGRAM
ADR Symbol SOLVY
Platform OTC
CUSIP 834437303
DR ISIN US834437305
Underlying ISIN BE0003470755
SEDOL BD87R68
Depositary bank Citi
ADR ratio 1 ORD : 10 ADR
Clear and settle according to US
standards
Convenience of stock quotes and
dividend payments in US dollars
Purchase in the same way as other US
stocks via a US broker
Cost effective means of building an
international portfolio
43 February 28, 2018
Q4 & FY 2017 Results
Benefits of ADRs ADRs Details
For questions about creating Solvay ADRs, please contact Citi
New York London
Michael O’Leary Mike Woods
[email protected] [email protected]
Tel: +1 212 723 4483 Tel: +44 20 7500 2030


![Looking back and looking forward[1]](https://img.pdfslide.us/doc/110x75/5559ad0dd8b42aa4288b511b/looking-back-and-looking-forward1.jpg)


