Embed Size (px)
Citation preview

Fourth Quarter and Full-Year 2017
FOURTH QUARTER AND FULL-YEAR 2017 RESULTSFebruary 23, 2018

Fourth Quarter and Full-Year 20172
FORWARD LOOKING STATEMENTS AND NON-GAAP FINANCIAL MEASURES
This presentation contains forward-looking statements based on current expectations, including statements regarding our earnings guidance andfinancial outlook and goals. These forward-looking statements are often identified by words such as “estimate,” “predict,” “may,” “believe,” “plan,”“expect,” “require,” “intend,” “assume,” “project” and similar words. Because actual results may differ materially from expectations, we caution younot to place undue reliance on these statements. A number of factors could cause future results to differ materially from historical results, or fromoutcomes currently expected or sought by Pinnacle West or APS. These factors include, but are not limited to: our ability to manage capitalexpenditures and operations and maintenance costs while maintaining high reliability and customer service levels; variations in demand forelectricity, including those due to weather seasonality, the general economy, customer and sales growth (or decline), and the effects of energyconservation measures and distributed generation; power plant and transmission system performance and outages; competition in retail andwholesale power markets; regulatory and judicial decisions, developments and proceedings; new legislation, ballet initiatives and regulation,including those relating to environmental requirements, regulatory policy, nuclear plant operations and potential deregulation of retail electricmarkets; fuel and water supply availability; our ability to achieve timely and adequate rate recovery of our costs, including returns on and of debtand equity capital investments; our ability to meet renewable energy and energy efficiency mandates and recover related costs; risks inherent in theoperation of nuclear facilities, including spent fuel disposal uncertainty; current and future economic conditions in Arizona, including in real estatemarkets; the development of new technologies which may affect electric sales or delivery; the cost of debt and equity capital and the ability toaccess capital markets when required; environmental, economic and other concerns surrounding coal-fired generation, including regulation ofgreenhouse gas emissions; volatile fuel and purchased power costs; the investment performance of the assets of our nuclear decommissioning trust,pension, and other postretirement benefit plans and the resulting impact on future funding requirements; the liquidity of wholesale power marketsand the use of derivative contracts in our business; potential shortfalls in insurance coverage; new accounting requirements or new interpretationsof existing requirements; generation, transmission and distribution facility and system conditions and operating costs; the ability to meet theanticipated future need for additional generation and associated transmission facilities in our region; the willingness or ability of our counterparties,power plant participants and power plant land owners to meet contractual or other obligations or extend the rights for continued power plantoperations; and restrictions on dividends or other provisions in our credit agreements and ACC orders. These and other factors are discussed in RiskFactors described in Part I, Item 1A of the Pinnacle West/APS Annual Report on Form 10-K for the fiscal year ended December 31, 2017, which youshould review carefully before placing any reliance on our financial statements, disclosures or earnings outlook. Neither Pinnacle West nor APSassumes any obligation to update these statements, even if our internal estimates change, except as required by law.
In this presentation, references to net income and earnings per share (EPS) refer to amounts attributable to common shareholders.
We present “electricity gross margin” per diluted share of common stock. Gross margin refers to operating revenues less fuel and purchased powerexpenses. Gross margin is a “non-GAAP financial measure,” as defined in accordance with SEC rules. The appendix contains a reconciliation of thisnon-GAAP financial measure to the referenced revenue and expense line items on our Consolidated Statements of Income, which are the mostdirectly comparable financial measures calculated and presented in accordance with generally accepted accounting principles in the United States ofAmerica (GAAP). We view gross margin as an important performance measure of the core profitability of our operations, and is used by ourmanagement in analyzing the operations of our business. We believe that investors benefit from having access to the same financial measures thatmanagement uses.

Fourth Quarter and Full-Year 20173
CONSOLIDATED EPS COMPARISON2017 VS. 2016
$0.19
$0.47
2017 2016
4th QuarterGAAP Net Income
$4.35 $3.95
2017 2016
Full-YearGAAP Net Income

Fourth Quarter and Full-Year 20174
Adjusted O&M(1)
$(0.27)
EPS VARIANCES4TH QUARTER 2017 VS. 4TH QUARTER 2016
4Q 2016 4Q 2017
$0.47
$0.19
D&A$(0.13)
Other, net$(0.04)
Other Taxes
$(0.06)
Adjusted Gross Margin(1)
$0.29
Effective TaxRate
$(0.07)Gross Margin
Rate Increase $ 0.17
Sales / Usage $ 0.05
LFCR $ -
Transmission $ 0.06
Weather $ (0.03)
Other $ 0.04
(1) Excludes costs and offsetting operating revenues associated with renewable energy and demand side management programs.
See non-GAAP reconciliation in Appendix.

Fourth Quarter and Full-Year 20175
EPS VARIANCESFULL YEAR 2017 VS. 2016
(1) Excludes costs and offsetting operating revenues associated with renewable energy and demand side management programs.
See non-GAAP reconciliation in Appendix.
Adjusted Gross Margin(1)
$0.85
Adjusted O&M(1)
$(0.03)D&A
$(0.27)
Other, net$(0.03)
Interest, net of AFUDC$(0.02)
$3.95
$4.35
2016 2017
Other Taxes
$(0.10)
Gross Margin
Rate Increase $ 0.30
Sales / Usage $ 0.13
LFCR $ 0.08
Transmission $ 0.23
Weather $ 0.03
Other $ 0.08

Fourth Quarter and Full-Year 20176
0.0%
1.0%
2.0%
3.0%
4.0%
5.0%
Jan-12 Jan-13 Jan-14 Jan-15 Jan-16 Jan-17
U.S. Phoenix
ECONOMIC INDICATORS
Arizona and Metro Phoenix remain attractive places to live and do business
E
Year over Year Employment Growth1
Above-average job growth in tourism, health care, manufacturing, financial services, and construction
Maricopa County ranked #1 in U.S. for population growth in 2016- U.S. Census Bureau March 2017
Scottsdale ranked best place in the U.S. to find a new job in 2017; 4 other valley cities ranked in Top 20- WalletHub January 2017
2017 housing construction at highest level since 2007
Vacancy rates in office and retail space have fallen to pre-recessionary levels
0
10,000
20,000
30,000
40,000
'07 '08 '09 '10 '11 '12 '13 '14 '15 '16 '17 '18
Single Family Multifamily Projected
Single Family & Multifamily Housing PermitsMaricopa County
Arizona population surpassed 7 million in 2017
1 Employment data is based on CPS as of December 2017
Arizona #1 state in the country in 2017 for in-bound moves- North American Moving Services January 2018

Fourth Quarter and Full-Year 20177
EPS GUIDANCEAS OF FEBRUARY 23, 2018
2017 EPS 2018 Guidance
Raising 2018 Guidance Range 1
$4.35
$4.35 - $4.55 + Rate increase*
+ Adjustment mechanisms, primarily Transmission Cost Adjustor (TCA) and Lost Fixed Cost Recovery (LFCR)
+ Selective Catalytic Reduction (SCR) and Ocotillo deferrals*
+ Modest sales growth
– Higher D&A due to plant additions and rates*
– Higher O&M, primarily planned fossil outages
– Higher Taxes Other Than Income Taxes, primarily higher property taxes*
– Higher Interest
Key Drivers 2017 - 2018
1 Prior 2018 EPS Guidance: $4.25 - $4.45* 2017 Rate Review Order specific items.See key factors and assumptions in appendix.

Fourth Quarter and Full-Year 2017
APPENDIX

Fourth Quarter and Full-Year 20179
2018 EPS GUIDANCE Key Factors & Assumptions as of February 23, 2018
2018
Electricity gross margin* (operating revenues, net of fuel and purchased power expenses) $2.47 - $2.52 billion
• Retail customer growth about 1.5–2.5%
• Weather-normalized retail electricity sales volume about 0.5-1.5% higher compared to prior year
• Assumes normal weather
Operating and maintenance (O&M)* $860 – $880 million
Other operating expenses (depreciation and amortization, Four Corners SCRs and Ocotillo deferrals, taxes other than income taxes, and other miscellaneous expenses) $790 – $810 million
Interest expense, net of allowance for borrowed and equity funds used during construction (Total AFUDC $65 million) $180 – $190 million
Net income attributable to noncontrolling interests $20 million
Effective tax rate 18%
Average diluted common shares outstanding ~113 million
EPS Guidance $4.35 - $4.55
* Excludes O&M of $85 million, and offsetting revenues, associated with renewable energy and demand side management programs.
Fourth Quarter and Full-Year 201710
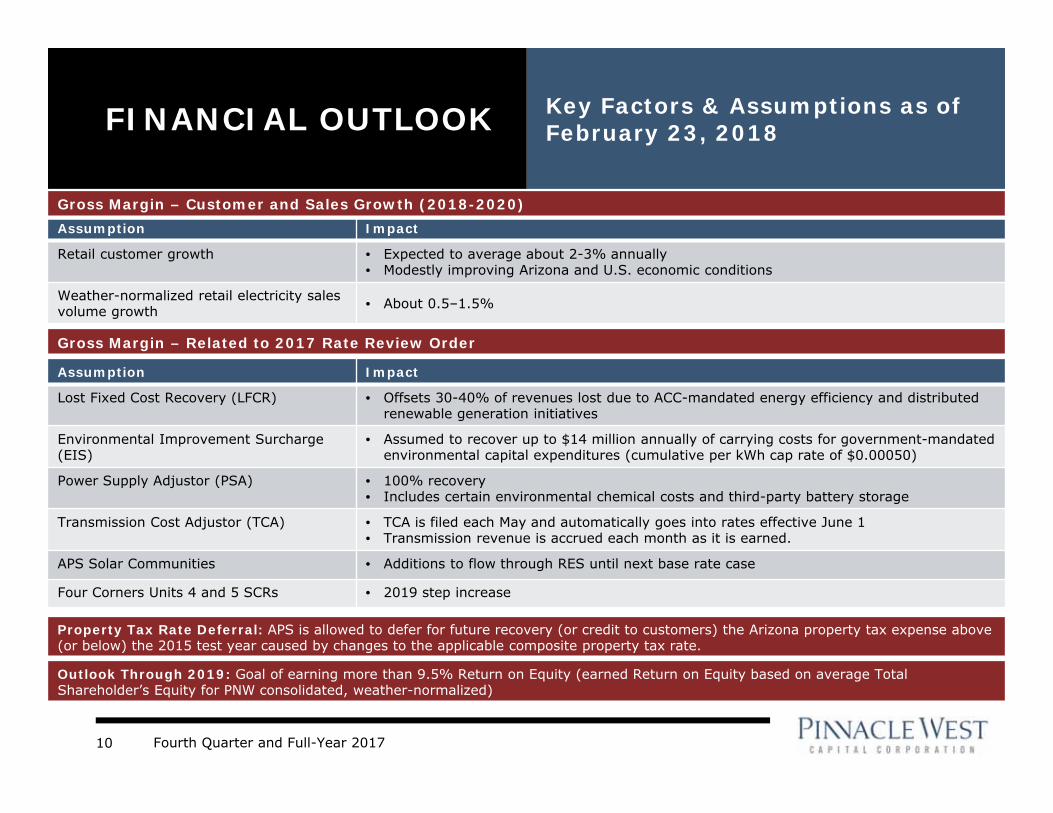
FINANCIAL OUTLOOK Key Factors & Assumptions as of February 23, 2018
Assumption Impact
Retail customer growth • Expected to average about 2-3% annually• Modestly improving Arizona and U.S. economic conditions
Weather-normalized retail electricity sales volume growth • About 0.5–1.5%
Assumption Impact
Lost Fixed Cost Recovery (LFCR) • Offsets 30-40% of revenues lost due to ACC-mandated energy efficiency and distributed renewable generation initiatives
Environmental Improvement Surcharge (EIS)
• Assumed to recover up to $14 million annually of carrying costs for government-mandated environmental capital expenditures (cumulative per kWh cap rate of $0.00050)
Power Supply Adjustor (PSA) • 100% recovery• Includes certain environmental chemical costs and third-party battery storage
Transmission Cost Adjustor (TCA) • TCA is filed each May and automatically goes into rates effective June 1• Transmission revenue is accrued each month as it is earned.
APS Solar Communities • Additions to flow through RES until next base rate case
Four Corners Units 4 and 5 SCRs • 2019 step increase
Property Tax Rate Deferral: APS is allowed to defer for future recovery (or credit to customers) the Arizona property tax expense above (or below) the 2015 test year caused by changes to the applicable composite property tax rate.
Gross Margin – Customer and Sales Growth (2018-2020)
Gross Margin – Related to 2017 Rate Review Order
Outlook Through 2019: Goal of earning more than 9.5% Return on Equity (earned Return on Equity based on average Total Shareholder’s Equity for PNW consolidated, weather-normalized)

Fourth Quarter and Full-Year 201711
TAX REFORMTax Cuts and Jobs Act provides benefits to both our customers and shareholders
Regulatory Steps− Received ACC approval of $119M annual rate
reduction reflecting lower corporate tax rate through the Tax Expense Adjustor Mechanism (TEAM)
− Second filing under the TEAM expected later in 2018 to return excess deferred income taxes to customers
− FERC guidance on the rate reduction for transmission customers expected in 2018
Key Impacts
Recap of Excess Deferred Taxes($ millions)
As of December 31,
2017
Total Regulated Excess Deferred Taxes $1,140
Depreciation Related Excess Deferred Taxes (to be returned over the life of property)
$1,020 - $1,040
Non-Depreciation Related Excess Deferred Taxes $100 - $120
2017 Tax Reform Impacts ($ millions)
Income Tax
Expense
RegulatoryLiability
Revaluation of Regulated Deferred Taxes (includes gross up) $1,520
Revaluation of Non-Regulated Deferred Taxes $9
Total PNW Impacts $9 $1,520
Rate Base Growth− Higher incremental rate base of $150 million per
year in 2018 and 2019
Continued Interest Deductibility − Majority of Pinnacle West debt likely allocable to
regulated operations and excluded from any limitation
Cash Taxes− Minimal cash tax payments through 2018
due to existing $85M in tax credit carryforwards

Fourth Quarter and Full-Year 201712
$218 $282 $241 $198
$235 $120
$9
$193 $91
$22 $46
$3
$16
$24 $17
$174
$148
$215 $180
$419
$444 $541 $617
$99
$80 $101 $153
2017 2018 2019 2020
APS CAPITAL EXPENDITURES
Capital expenditures are funded primarily through internally generated cash flow
($ Millions)
$1,341
$1,181
Other
Distribution
Transmission
Renewable Generation
Environmental(1)
Traditional Generation
Projected
$1,153
New Gas Generation(2)
• The chart does not include capital expenditures related to 4CA’s 7% interest in the Four Corners Power Plant Units 4 and 5 of $29 million in 2017, $15 million in 2018, $7 million in 2019 and $6 million in 2020.
• 2018 – 2020 as disclosed in 2017 Form 10-K.(1) Includes Selective Catalytic Reduction controls at Four Corners with in-service dates of Q4 2017 (Unit 5) and Q1 2018 (Unit 4)(2) Ocotillo Modernization Project: 2 units scheduled for completion in Q4 2018, 3 units scheduled for completion in Q1 2019
$1,211

Fourth Quarter and Full-Year 201713
RATE BASEAPS’s revenues come from a regulated retail rate base and meaningful transmission business
$6.8
$9.1
$1.4
$1.8
2016 2017 2018 2019 2020
APS Rate Base GrowthYear-End
ACC FERC
Total Approved Rate Base
Projected
ACC FERC
Rate Effective Date 8/19/2017 6/1/2017
Test Year Ended 12/31/20151 12/31/2016
Rate Base $6.8B $1.4B
Equity Layer 55.8% 55%
Allowed ROE 10.0% 10.75%
1 Adjusted to include post test-year plant in service through 12/31/2016
83%
17%
Generation & Distribution Transmission
Rate base $ in billions, rounded
Rate Base Guidance:6-7% Average Annual Growth Rate

Fourth Quarter and Full-Year 201714
OPERATIONS & MAINTENANCE
Goal is to keep O&M per kWh flat, adjusted for planned outages
751 753 734 756 770 785 - 795
37 5238
72 6375 - 85$788 $805
$772$828 $833
$860 - $880
2013 2014 2015 2016 2017 2018E*
PNW Consolidated ex RES/DSM** Planned Fleet Outages
* 2018 excludes impacts related to the adoption of the new accounting standard regarding the presentation of pension and postretirement benefit costs. See Notes 2 and 7 in the 2017 Form 10-K for additional information.** Excludes RES/DSM of $137 million in 2013, $103 million in 2014, $96 million in 2015, $83 million in 2016, $91 million in 2017 and $85 million in 2018E.
($ Millions)

Fourth Quarter and Full-Year 201715
Palo Verde Generating Station− Palo Verde will continue to have two refueling outages each year (18 months cycles for each of
the three units)
− APS’s share of the annual planned outage expense at Palo Verde has been between $18 - $22 million per year since 2013
− Equipment testing, inspections, and plant modifications are performed during the outages that cannot be done while the unit is online
− Outage duration and cost are driven by scope of planned work as well as emergent work identified during the outage
Gas/Oil Plants− No planned cycles; major maintenance outages are based on run hours and/or the number of
starts and overall plant condition
− Increasing levels of solar generation, participation in Energy Imbalance Market, and low gas prices have resulted in increased starts
Coal Plants− Major maintenance outage cycles are typically between 6 to 8 years
PLANNED OUTAGE CYCLES
The length of time between outages varies from plant to plant

Fourth Quarter and Full-Year 201716
Credit Ratings (1)
• A- or equivalent ratings or better at S&P, Moody’s and Fitch
2017 Major Financing Activities
• $250 million re-opening in March of APS’s outstanding 4.35% senior unsecured notes due November 2045
• $300 million 10-year 2.95% APS senior unsecured notes issued in September
• $300 million 3-year 2.25% PNW senior unsecured notes issued in November
2018 Major Financing Activities
• Currently expect up to $600 million of long-term debt issuance at APS
(1) We are disclosing credit ratings to enhance understanding of our sources of liquidity and the effects of our ratings on our costs of funds.
BALANCE SHEET STRENGTH
$82
$600
$250
$300
$-
$100
$200
$300
$400
$500
$600
2018 2019 2020
APS PNW
($Millions)
Long-Term Debt Maturity Schedule

Fourth Quarter and Full-Year 201717
2017 RATE REVIEW ORDER*EFFECTIVE AUGUST 19, 2017
Key Financial Proposals – Base Rate ChangesAnnualized Base Rate Revenue Changes ($ millions)
Non-fuel, Non-depreciation Base Rate Increase $ 87.2
Decrease fuel and Purchased Power over Base Rates (53.6)
Increase due to Changes in Depreciation Schedules 61.0
Total Base Rate Increase $ 94.6
Key Financial AssumptionsAllowed Return on Equity 10.0%
Capital Structure
Long-term debt 44.2%
Common equity 55.8%
Base Fuel Rate (¢/kWh) 3.0168
Post-test year plant period 12 months
*The ACC’s decision is subject to appeals.

Fourth Quarter and Full-Year 201718
Key Proposals – Revenue Requirement
Four Corners • Cost deferral order from in-service dates to incorporation of SCRs in rates using a step-increase no later than January 1, 2019
Ocotillo Modernization Project • Cost deferral order from in-service dates to effective date in next rate case
Power Supply Adjustor (PSA) • Modified to include certain environmental chemical costs and third-party battery storage
Property Tax Deferral • Defer for future recovery the Arizona property tax expense above or below the test year rate
Key Proposals – Rate Design
Lost Fixed Cost Recovery (LFCR)
• Modified to be applied as a capacity (demand) charge per kW for customer with a demand rate and as a kWh charge for customers with a two-part rate without demand
Environmental Improvement Surcharge (EIS)
• Increased cumulative per kWh cap rate from $0.00016 to a new rate of $0.00050 and include a balancing account
Time-of-Use Rates (TOU)
• Modified on-peak period for residential, and extra small through large general service to3:00 pm – 8:00 pm weekdays
• After September 1, 2018, a new TOU rate will be the standard rate for all new customers (except small use)
Distributed Generation• New DG customers eligible for TOU rate with Grid Access Charge or Demand rates• Resource Comparison Proxy (RCP) for exported energy of $0.129/kWh in year one
APS Solar Communities• New program for utility-owned solar distributed generation, recoverable through the Renewable
Energy Adjustment Clause (RES), to be no less than $10 million per year, and not more than $15 million per year
Other Considerations
Rate Case Moratorium • No new general rate case application before June 1, 2019 (3-year stay-out)
Self-Build Moratorium• APS will not pursue any new self-build generation (with exceptions) having an in-service date prior
to January 1, 2022 (extended to December 31, 2027 for combined-cycle generating units) unless expressly authorized by the ACC
2017 RATE REVIEW ORDER*EFFECTIVE AUGUST 19, 2017
*The ACC’s decision is subject to appeals.

Fourth Quarter and Full-Year 201719
OCOTILLO MODERNIZATION PROJECT ANDFOUR CORNERS SCRs
Ocotillo Modernization Project Four Corners SCRs
In-Service DatesUnits 6, 7 – Fall 2018
Units 3, 4 and 5 – Spring 2019
Unit 5 – Late 2017
Unit 4 – Spring 2018
Total Cost (APS) $500 million $400 million
Estimated Cost Deferral $45 million (through 2019) $30 million (through 2018)
Accounting Deferral
− Cost deferral from date of commercial operation to the effective date of rates in next rate case
− Includes depreciation, O&M, property taxes, and capital carrying charge1
− Cost deferral from time of installation to incorporation of the SCR costs in rates using a step increase beginning in 2019
− Includes depreciation, O&M, property taxes, and capital carrying charge1
• Included in the 2017 Rate Review Order*, APS has been granted Accounting Deferral Orders for two large generation-related capital investments
– Ocotillo Modernization Project: Retiring two aging, steam-based, natural gas units, and replacing with 5 new, fast-ramping, combustion turbine units
– Four Corners Power Plant: Installing Selective Catalytic Reduction (SCR) equipment to comply with Federal environmental standards
1 APS will calculate the capital carrying charge using the 5.13% embedded cost of debt established in the 2017 Rate Review Order.
*The ACC’s decision is subject to appeals.

Fourth Quarter and Full-Year 201720
FOUR CORNERS SCR RATE RIDER
APS will file for a rate increase in April 2018
1 Estimate as of December 31, 20172 Based on 2017 Rate Review Order
Financial Cost of Capital Bill Impact
• Consistent with prior disclosed estimates
• 7.85% Return on Rate Base2
– Weighted Average Cost of Capital (WACC)
• Rate rider applied as a percentage of base rates for all applicable customers
• $390 million1 direct costs vs. $400 million2
contemplated in APS’s recent rate case
• 5.13% Return on Deferral2
– Embedded Cost of Debt • ~$65 million revenue
requirement
• $40 million1 in indirect costs (overhead, AFUDC)
• 5% Depreciation Rate – 20 year useful life
(2038-depreciation study)
• ~2% bill impact
• 5 Year Deferral Amortization
Key Components of APS’s Anticipated Request

Fourth Quarter and Full-Year 201721
• Funded status of the pension plan finished 2017 at 95%, up 7% from YE 2016.
• The pension plan continues to employ a liability driven investment strategy in order to reduce volatility in the plan’s funded status.
PENSION & OTHER POST RETIREMENT BENEFITS (“OPEB”)
88% 88%
95%
YE 2015 YE 2016 YE 2017
Pension Funded Status(1)
Expense(2) 2017A 2018E(3)
Pension(1) $21 $8
OPEB $(18) $(13)
Contributions 2017A 2018E 2019E 2020E
Pension $100 Up to $250
OPEB $0.4 $0.0 $0.0 $0.0
Expense Assumptions 2017 2018
Discount Rate: Pension 4.08% 3.65%
Expected Long-Term Return on Plan Assets: Pension 6.55% 6.05%
(1) Excludes supplemental excess benefit retirement plan calculated on a PBO basis.(2) Excludes amounts capitalized or billed to electric generating plant joint owners.(3) Excludes impacts related to the adoption of the new accounting standard regarding the presentation of pension and postretirement
benefit costs. See Notes 2 and 7 in the 2017 Form 10-K for additional information.
Data as of February 23, 2018
($ in millions)

Fourth Quarter and Full-Year 201722
484680
832715
1157 11581349
1141
10021189
1077 1168
1153
759
12671001
12911413 1364
2033
16031443
128314341463
15781843
1971
2495
3817
2210
3591
328554
648 705995
0
500
1,000
1,500
2,000
2,500
3,000
3,500
4,000
Jan Feb Mar Apr May Jun Jul Aug Sep Oct Nov Dec
2015 Applications 2016 Applications 2017 Applications 2018 Applications
* Monthly data equals applications received minus cancelled applications. As of January 31, 2018, approximately 74,000 residential grid-tied solar photovoltaic (PV) systems have been installed in APS’s service territory, totaling approximately 581 MWdc of installed capacity. Excludes APS Solar Partner Program residential PV systems.Note: www.arizonagoessolar.org logs total residential application volume, including cancellations. Solar water heaters can also be found on the site, but are not included in the chart above.
RESIDENTIAL PV APPLICATIONS* 10 18 22
44 51 5774
133150
2
2009 2012 2014 2016 2018
Residential DG (MWdc) Annual Additions
YTD

Fourth Quarter and Full-Year 201723
(4)
10
(13)
4 2
12
(10)
(2)
$(15)
$(10)
$(5)
$0
$5
$10
$15
Q1 Q2 Q3 Q4 Q1 Q2 Q3 Q4
GROSS MARGIN EFFECTS OF WEATHERVARIANCES VS. NORMAL
Pretax Millions
All periods recalculated to current 10-year rolling average (2005-2014)
2016
$(3) Million
2017
$2 Million

Fourth Quarter and Full-Year 201724
84 7 6 5 2
1219
1215
1813 12 15
16
10
$0
$10
$20
$30
$40
Q1 Q2 Q3 Q4 Q1 Q2 Q3 Q4
Renewable Energy Demand Side Management
RENEWABLE ENERGY AND DEMAND SIDE MANAGEMENT EXPENSES*
* Renewable energy and demand side management expenses are offset by adjustment mechanisms.
Pretax Millions
2016
$83 Million
2017
$91 Million

Fourth Quarter and Full-Year 201725
2018 KEY DATES
Other Key Dates Q1 Q2 Q3 Q4
Arizona State Legislature In session Jan 8 – End of Q2
Elections Aug 28: Primary Nov 6: General
ACC Key Dates / Docket # Q1 Q2 Q3 Q4
Key Recurring Regulatory Filings
Lost Fixed Cost RecoveryE-01345A-11-0224 File Feb 15 Implement
May 1
Transmission Cost AdjustorE-01345A-11-0224
File May 15 Implement Jun 1
2019 DSM/EE Implementation PlanTBD
2018 DSM DecisionExpected March 2018 Jun 1: File 2019 Plan Decision expected by
end of 2018
2019 RES Implementation PlanTBD
2018 RES Decision Expected March 2018 Jul 1: File 2019 Plan Decision expected by
end of 2018
APS Rate Review/Four Corners SCR Step IncreaseE-01345A-16-0036
Feb: Customer Transition Begins
May 1: File Year Two RCP Export Rate
Apr: File Four Corners SCR Request
Sep 1: Year Two RCP Export Rate
Implemented
Resource Planning and ProcurementE-00000V-15-0094
Decision expected in March 2018
Workshops begin forAPS 2020 IRP
Review and Modification of Current Net Metering RulesRE-00000A-17-0260
Staff Draft Rules Expected Q2
Modification of the Federal Tax Reform Rate AdjustmentAU-00000A-17-0379
Jan 9: APS TEAM filingJan 31:Workshop
Arizona Energy Modernization PlanE-00000Q-16-0289

Fourth Quarter and Full-Year 201726
NON-GAAP MEASURE RECONCILIATION
$ millions pretax, except per share amounts 2017 2016
Operating revenues* 760$ 739$
Fuel and purchased power expenses* (204) (243)
Gross margin 556 496 0.33$ Adjustments:
Renewable energy and demandside management programs (31) (25) (0.04)
Adjusted gross margin 525$ 471$ 0.29$
Operations and maintenance* (266)$ (208)$ (0.32)$ Adjustments:
Renewable energy and demandside management programs (29) (19) 0.05
Adjusted operations and maintenance (237)$ (189)$ (0.27)$
* Line items from Consolidated Statements of Income
Three Months EndedDecember 31, EPS
Impact

Fourth Quarter and Full-Year 201727
NON-GAAP MEASURE RECONCILIATION
$ millions pretax, except per share amounts 2017 2016
Operating revenues* 3,565$ 3,499$
Fuel and purchased power expenses* (981) (1,076)
Gross margin 2,584 2,423 0.89$ Adjustments:
Renewable energy and demandside management programs (112) (105) (0.04)
Adjusted gross margin 2,472$ 2,318$ 0.85$
Operations and maintenance* (924)$ (911)$ (0.07)$ Adjustments:
Renewable energy and demandside management programs (91) (83) 0.04
Adjusted operations and maintenance (833)$ (828)$ (0.03)$
* Line items from Consolidated Statements of Income
Twelve Months EndedDecember 31, EPS
Impact

Fourth Quarter and Full-Year 201728
NON-GAAP MEASURE RECONCILIATION
$ millions pretax
Operating revenues* 3,645$ - 3,705$
Fuel and purchased power expenses* (1,090) - (1,100)
Gross margin 2,555 - 2,605 Adjustments:
Renewable energy and demandside management programs (85) - (85)
Adjusted gross margin 2,470$ - 2,520$
Operations and maintenance* 945$ - 965$ Adjustments:
Renewable energy and demandside management programs (85) - (85)
Adjusted operations and maintenance 860$ - 880$
* Line items from Consolidated Statements of Income
2018 Guidance

Fourth Quarter and Full-Year 201729
CONSOLIDATED STATISTICS
2017 2016 Incr (Decr) 2017 2016 Incr (Decr)
ELECTRIC OPERATING REVENUES (Dollars in Millions)
Retail Residential 353$ 332$ 21 1,792$ 1,730$ 62$ Business 370 362 8 1,615 1,605 10 Total Retail 723 694 29 3,407 3,335 72
Sales for Resale (Wholesale) 18 30 (12) 80 95 (15) Transmission for Others 11 7 4 46 28 18 Other Miscellaneous Services 5 6 (1) 21 32 (11)
Total Electric Operating Revenues 757$ 737$ 20 3,554$ 3,490$ 64$
ELECTRIC SALES (GWH)
Retail Residential 2,552 2,671 (119) 13,207 13,195 12 Business 3,390 3,460 (70) 14,811 14,827 (16) Total Retail 5,942 6,131 (189) 28,018 28,022 (4)
Sales for Resale (Wholesale) 597 1,045 (448) 2,875 3,767 (892) Total Electric Sales 6,539 7,176 (637) 30,893 31,789 (896)
RETAIL SALES (GWH) - WEATHER NORMALIZED
Residential 2,631 2,653 (22) 13,278 13,321 (43) Business 3,353 3,440 (87) 14,727 14,772 (45) Total Retail Sales 5,984 6,093 (108) 28,005 28,093 (88)
Retail sales (GWH) (% over prior year) (1.8)% (0.3)%
AVERAGE ELECTRIC CUSTOMERS
Retail Customers Residential 1,086,642 1,066,711 19,931 1,080,665 1,061,814 18,851 Business 134,843 132,173 2,670 133,961 131,697 2,264 Total Retail 1,221,485 1,198,884 22,601 1,214,626 1,193,511 21,115
Wholesale Customers 35 46 (11) 40 46 (6) Total Customers 1,221,520 1,198,930 22,590 1,214,666 1,193,557 21,109
Total Customer Growth (% over prior year) 1.9% 1.8%
RETAIL USAGE - WEATHER NORMALIZED (KWh/Average Customer)
Residential 2,421 2,487 (66) 12,287 12,545 (258) Business 24,868 26,026 (1,158) 109,934 112,166 (2,232)
3 Months Ended December 31, 12 Months Ended December 31,
Numbers may not foot due to rounding.

Fourth Quarter and Full-Year 201730
CONSOLIDATED STATISTICS
2017 2016 Incr (Decr) 2017 2016 Incr (Decr)
WEATHER INDICATORS - RESIDENTIAL
ActualCooling Degree-Days 52 57 (5) 1,776 1,720 56 Heating Degree-Days 203 282 (79) 642 679 (37) Average Humidity 22% 29% (7)% 24% 27% (3)%10-Year Averages (2005 - 2014)Cooling Degree-Days 44 44 - 1,766 1,766 - Heating Degree-Days 344 344 - 836 836 - Average Humidity 28% 28% - 25% 25% -
ENERGY SOURCES (GWH)
Generation Production Nuclear 2,264 2,276 (12) 9,411 9,384 27 Coal 1,506 2,376 (870) 7,140 6,687 453 Gas, Oil and Other 2,234 1,508 726 7,916 8,270 (354) Renewables 121 93 28 567 501 66 Total Generation Production 6,125 6,252 (127) 25,034 24,842 192
Purchased Power - - Conventional 414 753 (339) 5,061 5,737 (676) Resales 137 188 (51) 770 1,027 (257) Renewables 430 431 (1) 1,897 1,828 69 Total Purchased Power 981 1,372 (390) 7,728 8,592 (864) Total Energy Sources 7,106 7,624 (518) 32,762 33,433 (672)
POWER PLANT PERFORMANCE
Capacity Factors - OwnedNuclear 90% 90% - 94% 93% 1%Coal 41% 64% (23)% 49% 46% 3%Gas, Oil and Other 32% 22% 10% 28% 30% (2)%Solar 24% 22% 2% 28% 30% (2)%System Average 44% 46% (2)% 46% 46% -
3 Months Ended December 31, 12 Months Ended December 31,
Numbers may not foot due to rounding.