Embed Size (px)
Citation preview
You should consider the Fund's investment objectives, risks, and charges and expenses carefully before you invest. The Prospectus details the Fund's objective and policies and other matters of interest to a prospective investor. Please read the Prospectus carefully before investing. The Prospectus may be obtained by visiting the website at www.fpa.com, by calling toll-free, 1-800-982-4372, or by contacting the Fund in writing. Average Annual Total Returns (%)*
As of Date: 12/31/2020 QTD YTD 1 Year 3 Years 5 Years 10 Years
FPA Queens Road Small Cap Value Fund – Investor Class
24.75 13.62 13.62 8.75 9.49 8.14
Russell 2000 Value TR USD Index 33.36 4.63 4.63 3.72 9.65 8.66
The FPA Queens Road Small Cap Value Fund (“Fund”) commenced operations on June 13, 2002. Fund performance shown is for the Investor Class shares (QRSVX). * Prior to November 1, 2020, the performance shown reflects the historical performance of the Fund when Bragg Financial Advisors, Inc. ("BFA") served as investment adviser of the Fund. Effective November 1, 2020, FPA became the investment adviser of the Fund and BFA transitioned to serving as the sub-adviser. BFA continues to be responsible for the day-to-day management of the Fund, subject to FPA's oversight. No changes to the Fund's principal investment strategies were made in connection with these changes in management of the Fund, and Steve Scruggs, CFA, Director of Research and Senior Portfolio Manager for BFA, continues to serve as the portfolio manager for the Fund. From inception of the Fund to December 31, 2004, BFA and its affiliates voluntarily absorbed certain expenses of the Fund and voluntarily waived its management fee. Had BFA not done this, returns would have been lower during that period. Effective January 1, 2005 through October 31, 2020, BFA charged a single unitary management fee and contractually agreed to pay all operating expenses of the Fund except for brokerage, taxes, interest, litigation expenses, and other extraordinary expenses. The Fund's Total Annual Operating Expenses before reimbursement is 1.16%. Effective November 1, 2020, First Pacific Advisors, LP (the "Adviser" or "FPA"), the Fund's investment adviser, has contractually agreed to reimburse the Fund for operating expenses in excess of 1.04% of average net assets of the Fund, excluding interest, taxes, brokerage fees and commissions payable by the Fund in connection with the purchase or sale of portfolio securities, fees and expenses of other funds in which the Fund invests, and extraordinary expenses, including litigation expenses not incurred in the Fund’s ordinary course of business, until December 11, 2023. These fee waivers and expense reimbursements are subject to possible recoupment by the Adviser from the Fund in future years (within the three years from the date when the amount is waived or reimbursed) if such recoupment can be achieved within the lesser of the foregoing expense limits or the then-current expense limits. This agreement may be terminated only by the Fund’s Board of Trustees, upon written notice to the Adviser. Periods greater than one year are annualized. Fund performance is shown net of all fees and expenses. Fund performance is calculated on a total return basis which includes reinvestment of all distributions. Fund performance does not reflect the deduction of taxes that a shareholder would pay on Fund distributions or the redemption of Fund shares, which would lower these figures. Past performance is no guarantee, nor is it indicative, of future results. Current performance may be higher or lower than the performance shown. This data represents past performance and investors should understand that investment returns and principal values fluctuate, so that when you redeem your investment it may be worth more or less than its original cost. Current month-end performance data, which may be lower or higher than the performance data quoted, may be obtained at www.fpa.com or by calling toll-free, 1-800-982-4372. Please see important disclosures at the end of the commentary.
FPA Queens Road Small Cap Value Fund
Fourth Quarter 2020 Commentary
“The investor’s chief problem— and even his worst enemy—is likely to be himself.”
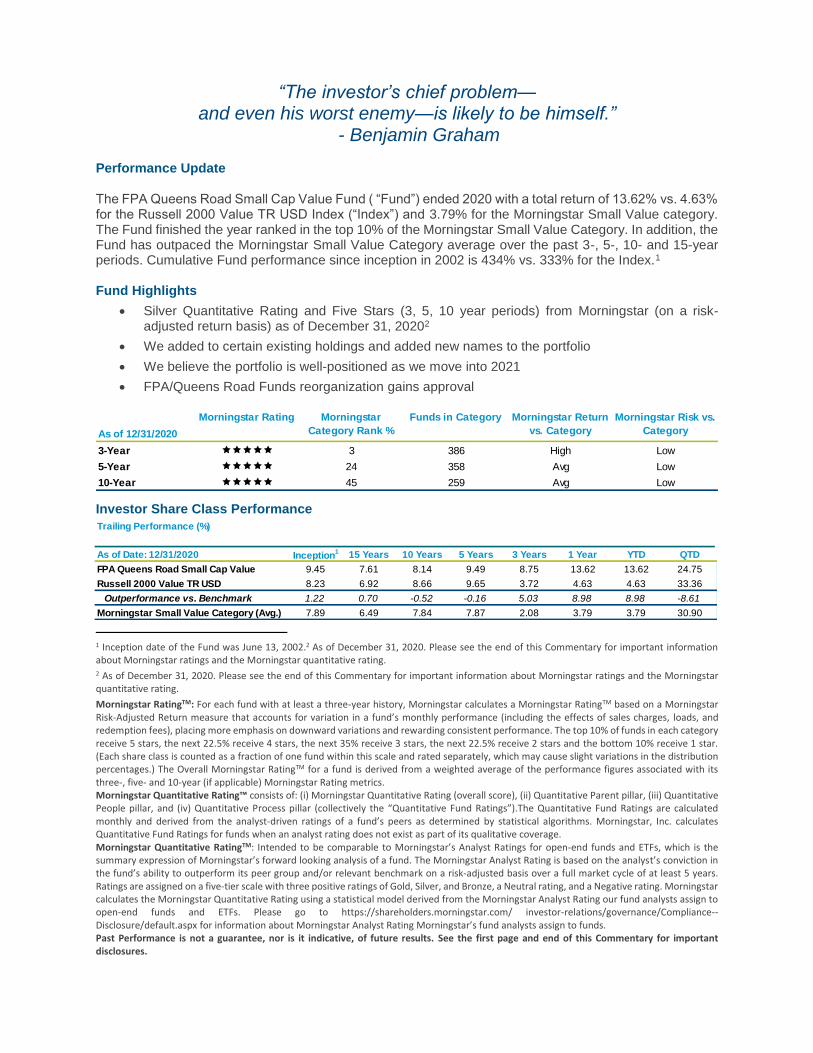
- Benjamin Graham Performance Update The FPA Queens Road Small Cap Value Fund ( “Fund”) ended 2020 with a total return of 13.62% vs. 4.63% for the Russell 2000 Value TR USD Index (“Index”) and 3.79% for the Morningstar Small Value category. The Fund finished the year ranked in the top 10% of the Morningstar Small Value Category. In addition, the Fund has outpaced the Morningstar Small Value Category average over the past 3-, 5-, 10- and 15-year periods. Cumulative Fund performance since inception in 2002 is 434% vs. 333% for the Index.1 Fund Highlights
Silver Quantitative Rating and Five Stars (3, 5, 10 year periods) from Morningstar (on a risk-adjusted return basis) as of December 31, 20202
We added to certain existing holdings and added new names to the portfolio
We believe the portfolio is well-positioned as we move into 2021
FPA/Queens Road Funds reorganization gains approval
Investor Share Class Performance
1 Inception date of the Fund was June 13, 2002.2 As of December 31, 2020. Please see the end of this Commentary for important information about Morningstar ratings and the Morningstar quantitative rating. 2 As of December 31, 2020. Please see the end of this Commentary for important information about Morningstar ratings and the Morningstar quantitative rating.
Morningstar RatingTM: For each fund with at least a three-year history, Morningstar calculates a Morningstar RatingTM based on a Morningstar Risk-Adjusted Return measure that accounts for variation in a fund’s monthly performance (including the effects of sales charges, loads, and redemption fees), placing more emphasis on downward variations and rewarding consistent performance. The top 10% of funds in each category receive 5 stars, the next 22.5% receive 4 stars, the next 35% receive 3 stars, the next 22.5% receive 2 stars and the bottom 10% receive 1 star. (Each share class is counted as a fraction of one fund within this scale and rated separately, which may cause slight variations in the distribution percentages.) The Overall Morningstar RatingTM for a fund is derived from a weighted average of the performance figures associated with its three-, five- and 10-year (if applicable) Morningstar Rating metrics. Morningstar Quantitative Rating™ consists of: (i) Morningstar Quantitative Rating (overall score), (ii) Quantitative Parent pillar, (iii) Quantitative People pillar, and (iv) Quantitative Process pillar (collectively the “Quantitative Fund Ratings”).The Quantitative Fund Ratings are calculated monthly and derived from the analyst-driven ratings of a fund’s peers as determined by statistical algorithms. Morningstar, Inc. calculates Quantitative Fund Ratings for funds when an analyst rating does not exist as part of its qualitative coverage. Morningstar Quantitative RatingTM: Intended to be comparable to Morningstar’s Analyst Ratings for open-end funds and ETFs, which is the summary expression of Morningstar’s forward looking analysis of a fund. The Morningstar Analyst Rating is based on the analyst’s conviction in the fund’s ability to outperform its peer group and/or relevant benchmark on a risk-adjusted basis over a full market cycle of at least 5 years. Ratings are assigned on a five-tier scale with three positive ratings of Gold, Silver, and Bronze, a Neutral rating, and a Negative rating. Morningstar calculates the Morningstar Quantitative Rating using a statistical model derived from the Morningstar Analyst Rating our fund analysts assign to open-end funds and ETFs. Please go to https://shareholders.morningstar.com/ investor-relations/governance/Compliance--Disclosure/default.aspx for information about Morningstar Analyst Rating Morningstar’s fund analysts assign to funds. Past Performance is not a guarantee, nor is it indicative, of future results. See the first page and end of this Commentary for important disclosures.
As of Date: 12/31/2020 Inception1 15 Years 10 Years 5 Years 3 Years 1 Year YTD QTD
FPA Queens Road Small Cap Value 9.45 7.61 8.14 9.49 8.75 13.62 13.62 24.75
Russell 2000 Value TR USD 8.23 6.92 8.66 9.65 3.72 4.63 4.63 33.36
Outperformance vs. Benchmark 1.22 0.70 -0.52 -0.16 5.03 8.98 8.98 -8.61
Morningstar Small Value Category (Avg.) 7.89 6.49 7.84 7.87 2.08 3.79 3.79 30.90
Trailing Performance (%)
As of 12/31/2020
Morningstar Rating Morningstar
Category Rank %
Funds in Category Morningstar Return
vs. Category
Morningstar Risk vs.
Category
3-Year 3 386 High Low
5-Year 24 358 Avg Low
10-Year 45 259 Avg Low
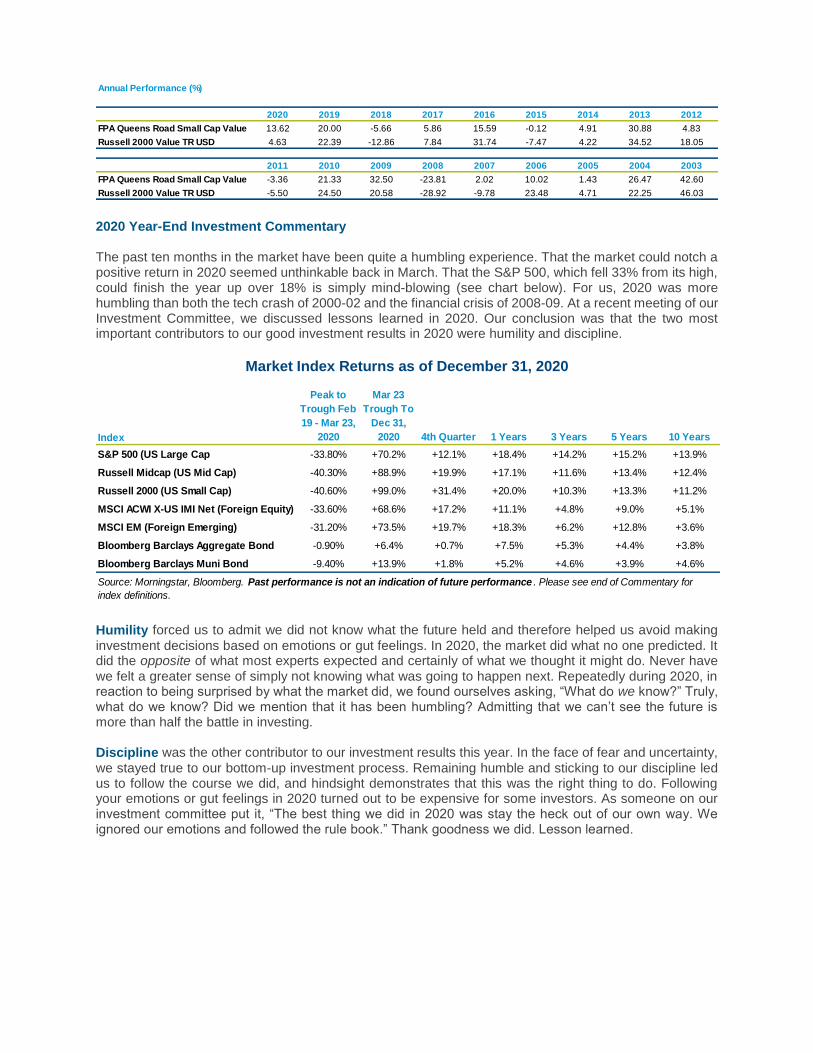
2020 Year-End Investment Commentary The past ten months in the market have been quite a humbling experience. That the market could notch a positive return in 2020 seemed unthinkable back in March. That the S&P 500, which fell 33% from its high, could finish the year up over 18% is simply mind-blowing (see chart below). For us, 2020 was more humbling than both the tech crash of 2000-02 and the financial crisis of 2008-09. At a recent meeting of our Investment Committee, we discussed lessons learned in 2020. Our conclusion was that the two most important contributors to our good investment results in 2020 were humility and discipline.
Market Index Returns as of December 31, 2020
Humility forced us to admit we did not know what the future held and therefore helped us avoid making
investment decisions based on emotions or gut feelings. In 2020, the market did what no one predicted. It did the opposite of what most experts expected and certainly of what we thought it might do. Never have we felt a greater sense of simply not knowing what was going to happen next. Repeatedly during 2020, in reaction to being surprised by what the market did, we found ourselves asking, “What do we know?” Truly, what do we know? Did we mention that it has been humbling? Admitting that we can’t see the future is more than half the battle in investing. Discipline was the other contributor to our investment results this year. In the face of fear and uncertainty,
we stayed true to our bottom-up investment process. Remaining humble and sticking to our discipline led us to follow the course we did, and hindsight demonstrates that this was the right thing to do. Following your emotions or gut feelings in 2020 turned out to be expensive for some investors. As someone on our investment committee put it, “The best thing we did in 2020 was stay the heck out of our own way. We ignored our emotions and followed the rule book.” Thank goodness we did. Lesson learned.
Index
Peak to
Trough Feb
19 - Mar 23,
2020
Mar 23
Trough To
Dec 31,
2020 4th Quarter 1 Years 3 Years 5 Years 10 Years
S&P 500 (US Large Cap -33.80% +70.2% +12.1% +18.4% +14.2% +15.2% +13.9%
Russell Midcap (US Mid Cap) -40.30% +88.9% +19.9% +17.1% +11.6% +13.4% +12.4%
Russell 2000 (US Small Cap) -40.60% +99.0% +31.4% +20.0% +10.3% +13.3% +11.2%
MSCI ACWI X-US IMI Net (Foreign Equity) -33.60% +68.6% +17.2% +11.1% +4.8% +9.0% +5.1%
MSCI EM (Foreign Emerging) -31.20% +73.5% +19.7% +18.3% +6.2% +12.8% +3.6%
Bloomberg Barclays Aggregate Bond -0.90% +6.4% +0.7% +7.5% +5.3% +4.4% +3.8%
Bloomberg Barclays Muni Bond -9.40% +13.9% +1.8% +5.2% +4.6% +3.9% +4.6%
Source: Morningstar, Bloomberg. Past performance is not an indication of future performance . Please see end of Commentary for
index definitions.
2020 2019 2018 2017 2016 2015 2014 2013 2012
FPA Queens Road Small Cap Value 13.62 20.00 -5.66 5.86 15.59 -0.12 4.91 30.88 4.83
Russell 2000 Value TR USD 4.63 22.39 -12.86 7.84 31.74 -7.47 4.22 34.52 18.05
2011 2010 2009 2008 2007 2006 2005 2004 2003
FPA Queens Road Small Cap Value -3.36 21.33 32.50 -23.81 2.02 10.02 1.43 26.47 42.60
Russell 2000 Value TR USD -5.50 24.50 20.58 -28.92 -9.78 23.48 4.71 22.25 46.03
Annual Performance (%)
Investment Process. There are several factors that allowed the Fund to generate returns in excess of its
peers and benchmarks during this period. First and foremost is the disciplined four-step value process that we have implemented since inception in 2002. Our process looks at both quantitative and qualitative aspects of a company.
o On the quantitative side, we look for companies that have solid balance sheets, strong cash flow
and serviceable levels of debt that aren’t reliant on the capital markets. We then look at valuation by normalizing operating margins over a full market cycle to arrive at our estimate of intrinsic value. Instead of looking at just the most recent data, we look at operating margins over a full market cycle. We want to buy good companies with a margin of safety.3
o On the qualitative side, we study the management and the markets in which the companies
compete. We want to see managements that can lay out a strategy and execute it. We look for companies with clear and honest communication, and managements that are willing to take measured risks but are also able to admit mistakes. Finally, we want to make sure the companies we own are growing and are competing in industries that have favorable economics and aren’t overly competitive.
Shareholder Expectations. Generally, we expect to perform alongside, ahead or behind our peers in
different types of markets.
o Market advancing, but volatility is prevalent: We expect the Fund will provide above-average to
average performance compared with the Fund’s benchmark and peer group.4
o Market declining: We expect to help protect capital better than the Fund’s benchmark and peer
group.
o Market advancing on speculation/momentum: We expect the Fund will likely trail its benchmark
and peer group.
o Over a full market cycle: We expect the Fund to achieve greater returns than the Fund’s benchmark and peer group while assuming less risk.
The past year provided a wild ride that included all three types of markets. The Fund performed as expected during each.
o During the massive declines of the first quarter, the Fund performed ahead of its peer group and benchmark, with returns in Q1 2020 of -21.84% vs. -35.66% for the Index, and -36.97% for the peer group.
o As the markets quickly recovered in the second quarter, the Fund lagged the Index by 5.29% and its peer group by 8.75%, followed by relatively even performance in the third quarter (i.e., 2.57% (Fund) vs 2.56% (Index) vs 2.92% (peer group).
o As markets raced ahead in the fourth quarter, the Fund rose 24.75% vs. 33.36% for the Index, and 30.85% for the peer group.
This pattern of relative underperformance and outperformance has been consistent since we started the Fund in 2002. Portfolio Activity & Attribution.5 Due to elevated market valuations at the start of 2020, we had about
20% of the portfolio in cash as we went into the spring sell-off. We put about half of our cash to work buying
3 Margin of safety is when a security is purchased at a discount to the portfolio manager’s estimate of its intrinsic value. Buy ing a security with a margin of safety is designed to seek to protect against permanent capital loss in the case of an unexpected event or analytical mistake. Determining a company’s “true” worth or intrinsic value is highly subjective. There is no guarantee that the methods used to evaluate intrinsic value will be accurate or precise or that an investment made with a margin of safety will not decline in price. 4 The Fund’s peer group is the Morningstar Small Value Category. The Fund’s benchmark is the Russell 2000 Value TR USD Index. 5 References to individual securities or sectors in this section should not be construed as a recommendation by the Fund, the portfolio managers, the adviser, the sub-adviser, or the distributor to purchase or sell such securities or invest in such sectors, and any information provided is not a sufficient basis upon which to make an investment decision. The information provided does not reflect all positions purchased, sold or recommended by the adviser or sub-adviser during the quarter. It should not be assumed that an investment in the securities listed was or will be profitable. These securities/sectors may not be in the Fund at the time you receive
some new positions and adding to several existing positions at more attractive prices. In hindsight, we should have put every nickel to work, but valuations during the sell-off did not fall to anywhere close to the bargain basement prices that we saw back in 2009. During 2020, new positions added to the portfolio included G-III Apparel Group (which owns or licenses brands DKNY, Cole Haan, Andrew Marc), and apparel company PVH (which owns brands Tommy Hilfiger, Calvin Klein, IZOD). We also purchased infrastructure company MasTec. We did some light trimming of a
few holdings as prices soared in the fourth quarter and repositioned the cash into existing holdings at more attractive prices. At year-end, the Fund’s cash allocation was back to around 20%. Positions eliminated during 2020 included two of the Fund’s long-time holdings that were acquired by other firms during 2020. We had owned wire and cable company Anixter International Inc., since 2016. They merged with Wesco International, Inc, in June 2020. Technology distribution company Tech Data Corporation was purchased by Apollo Global Management in June 2020
The Fund’s holdings that contributed to performance during 2020 included Owens & Minor, Livent, and Darling Ingredients. Owens & Minor is a distributor and manufacturer of medical products and has reaped the benefits of its 2018 acquisition of Halyward Health’s infection prevention business in 2020. Strength in this segment in 2020 offset the relative flatness in the company’s other business segments. We believe the infection prevention segment will continue its growth, and that the company’s other segments will recover during 2021. Livent is a pure-play lithium producer. The lithium industry has been struggling with low prices for several years, causing some producers to cut back on planned production expansion. As the low-cost producer, Livent has continued its planned production increase (albeit at a slower rate). This market dynamic, as well as the expected higher demand for lithium for use in electric vehicles and energy storage, keeps us interested in maintaining a position in this name. Darling Ingredients manufactures and sells feed, food, and fuel from recycled animal products. The fuel segment has been the company’s brightest spot through its Diamond Green Renewable Diesel partnership with Valero Energy Corporation, which produces low-emission sulfur from reclaimed animal fats. In addition, the partnership is continuing work on a new renewable diesel plant which will expand production from 250 million barrels per year to 650 million barrels per year.22 The Fund’s holdings that detracted from performance in 2020 included South Jersey Industries, New Jersey Resources, and American National Group. South Jersey Industries and New Jersey Resources are two of the Fund’s long-term utilities holdings. While we believe the regulatory utility environment in New Jersey remains favorable, the recent negative shift in population growth in the state weighed on these two companies in a year when utilities overall were flat. The 110-year-old insurance company, American National Group, has a long track record of modest but consistent growth. The
company is well capitalized and paying a healthy 3.4% dividend, so we remain confident given the current valuation. With regards to sector weightings, the Fund’s overweight versus the Index to technology stocks and an underweight to energy stocks contributed to performance. We wish we could say we saw the pandemic coming and predicted the work-from-home boom for tech and the bust for oil and gas, but we’re just not that smart. Any overweighting or underweighting of sectors is purely based on our bottom-up approach and where we are finding value in individual companies. Technology companies are most often labeled as growth stocks, and certainly some are priced at astronomical valuations. However, we have found some attractive valuations in this sector and have had an overweight in technology for a number of years. We typically do not own energy stocks since their share prices are largely driven by the price of oil, regardless of how well or poorly the companies are managed. Our underweighted position in the healthcare sector and our overweighted position in utilities versus the Index detracted from overall portfolio performance.
this report. The information provided does not reflect all positions or sectors purchased, sold or recommended by FPA during the quarter. The portfolio holdings as of the most recent quarter-end may be obtained at www.fpa.com. The portfolio holdings and corresponding weights as of December 31, 2020 are provided at the end of this Commentary.
Past performance is no guarantee, nor is it indicative, of future results. 22 As of December 31, 2020. Source: Bloomberg, Factset
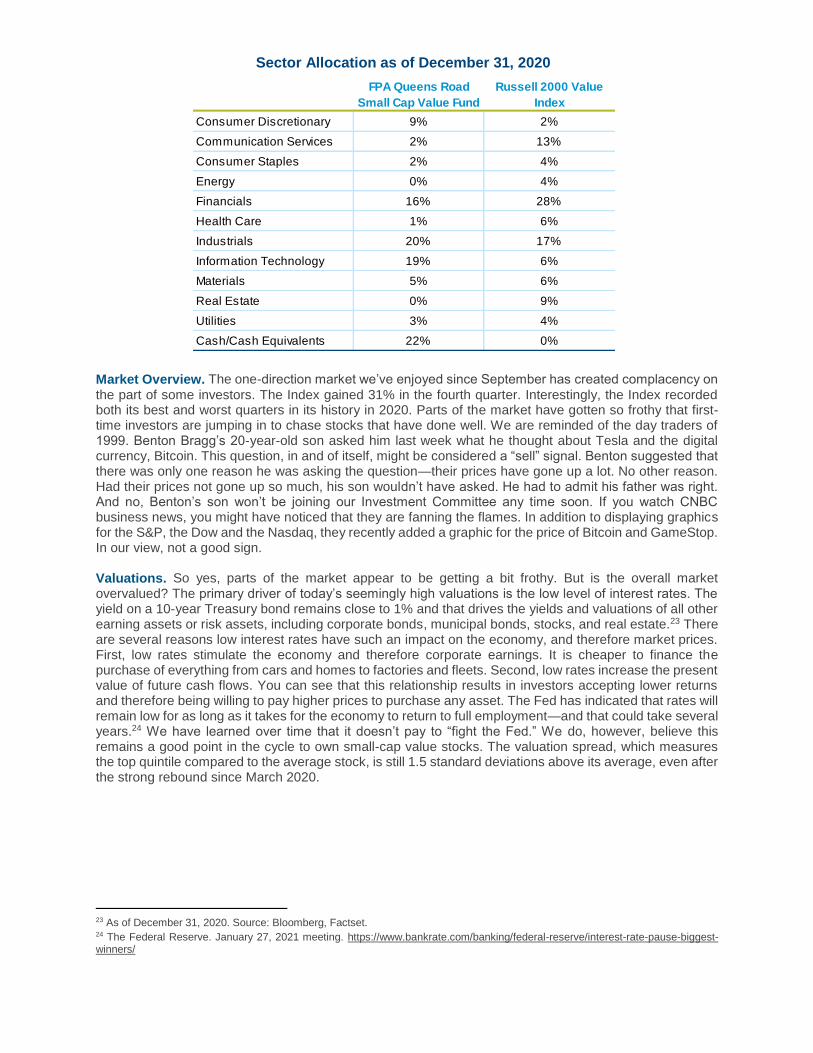
Market Overview. The one-direction market we’ve enjoyed since September has created complacency on
the part of some investors. The Index gained 31% in the fourth quarter. Interestingly, the Index recorded both its best and worst quarters in its history in 2020. Parts of the market have gotten so frothy that first-time investors are jumping in to chase stocks that have done well. We are reminded of the day traders of 1999. Benton Bragg’s 20-year-old son asked him last week what he thought about Tesla and the digital currency, Bitcoin. This question, in and of itself, might be considered a “sell” signal. Benton suggested that there was only one reason he was asking the question—their prices have gone up a lot. No other reason. Had their prices not gone up so much, his son wouldn’t have asked. He had to admit his father was right. And no, Benton’s son won’t be joining our Investment Committee any time soon. If you watch CNBC business news, you might have noticed that they are fanning the flames. In addition to displaying graphics for the S&P, the Dow and the Nasdaq, they recently added a graphic for the price of Bitcoin and GameStop. In our view, not a good sign. Valuations. So yes, parts of the market appear to be getting a bit frothy. But is the overall market overvalued? The primary driver of today’s seemingly high valuations is the low level of interest rates. The yield on a 10-year Treasury bond remains close to 1% and that drives the yields and valuations of all other earning assets or risk assets, including corporate bonds, municipal bonds, stocks, and real estate.23 There are several reasons low interest rates have such an impact on the economy, and therefore market prices. First, low rates stimulate the economy and therefore corporate earnings. It is cheaper to finance the purchase of everything from cars and homes to factories and fleets. Second, low rates increase the present value of future cash flows. You can see that this relationship results in investors accepting lower returns and therefore being willing to pay higher prices to purchase any asset. The Fed has indicated that rates will remain low for as long as it takes for the economy to return to full employment—and that could take several years.24 We have learned over time that it doesn’t pay to “fight the Fed.” We do, however, believe this remains a good point in the cycle to own small-cap value stocks. The valuation spread, which measures the top quintile compared to the average stock, is still 1.5 standard deviations above its average, even after the strong rebound since March 2020.
23 As of December 31, 2020. Source: Bloomberg, Factset. 24 The Federal Reserve. January 27, 2021 meeting. https://www.bankrate.com/banking/federal-reserve/interest-rate-pause-biggest-winners/
FPA Queens Road
Small Cap Value Fund
Russell 2000 Value
Index
Consumer Discretionary 9% 2%
Communication Services 2% 13%
Consumer Staples 2% 4%
Energy 0% 4%
Financials 16% 28%
Health Care 1% 6%
Industrials 20% 17%
Information Technology 19% 6%
Materials 5% 6%
Real Estate 0% 9%
Utilities 3% 4%
Cash/Cash Equivalents 22% 0%
Sector Allocation as of December 31, 2020
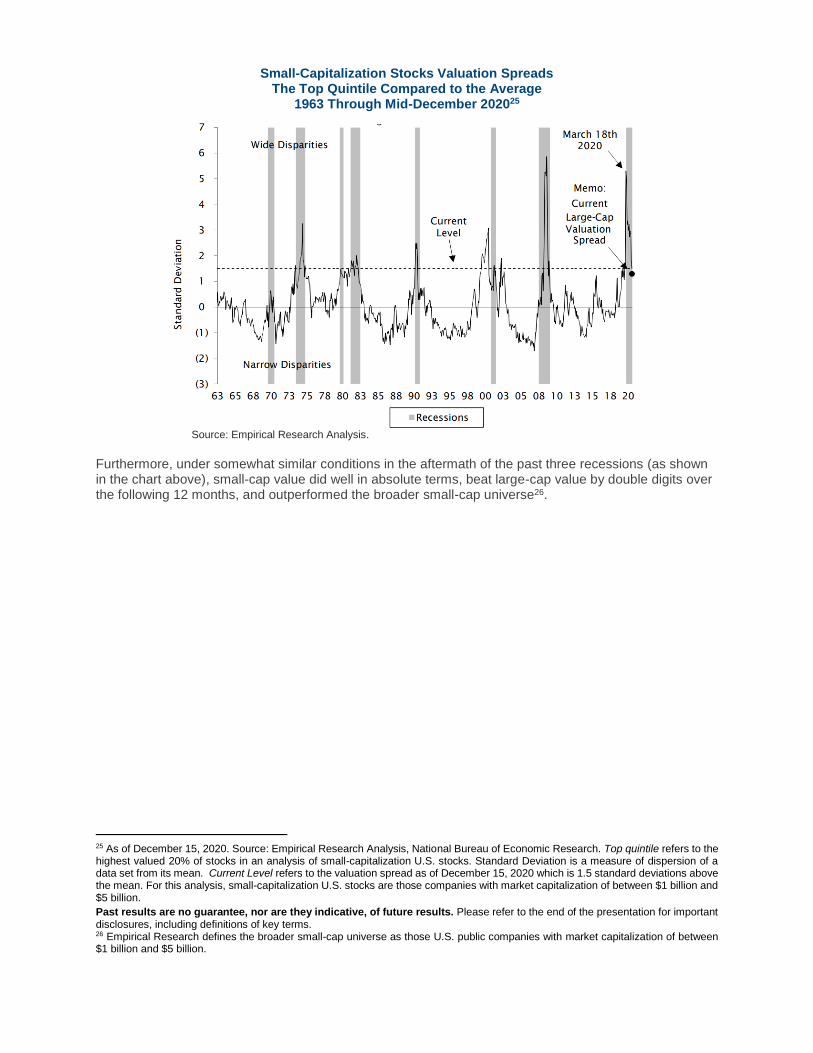
Small-Capitalization Stocks Valuation Spreads The Top Quintile Compared to the Average
1963 Through Mid-December 202025
Source: Empirical Research Analysis. Furthermore, under somewhat similar conditions in the aftermath of the past three recessions (as shown in the chart above), small-cap value did well in absolute terms, beat large-cap value by double digits over the following 12 months, and outperformed the broader small-cap universe26.
25 As of December 15, 2020. Source: Empirical Research Analysis, National Bureau of Economic Research. Top quintile refers to the highest valued 20% of stocks in an analysis of small-capitalization U.S. stocks. Standard Deviation is a measure of dispersion of a data set from its mean. Current Level refers to the valuation spread as of December 15, 2020 which is 1.5 standard deviations above the mean. For this analysis, small-capitalization U.S. stocks are those companies with market capitalization of between $1 billion and $5 billion.
Past results are no guarantee, nor are they indicative, of future results. Please refer to the end of the presentation for important disclosures, including definitions of key terms. 26 Empirical Research defines the broader small-cap universe as those U.S. public companies with market capitalization of between $1 billion and $5 billion.
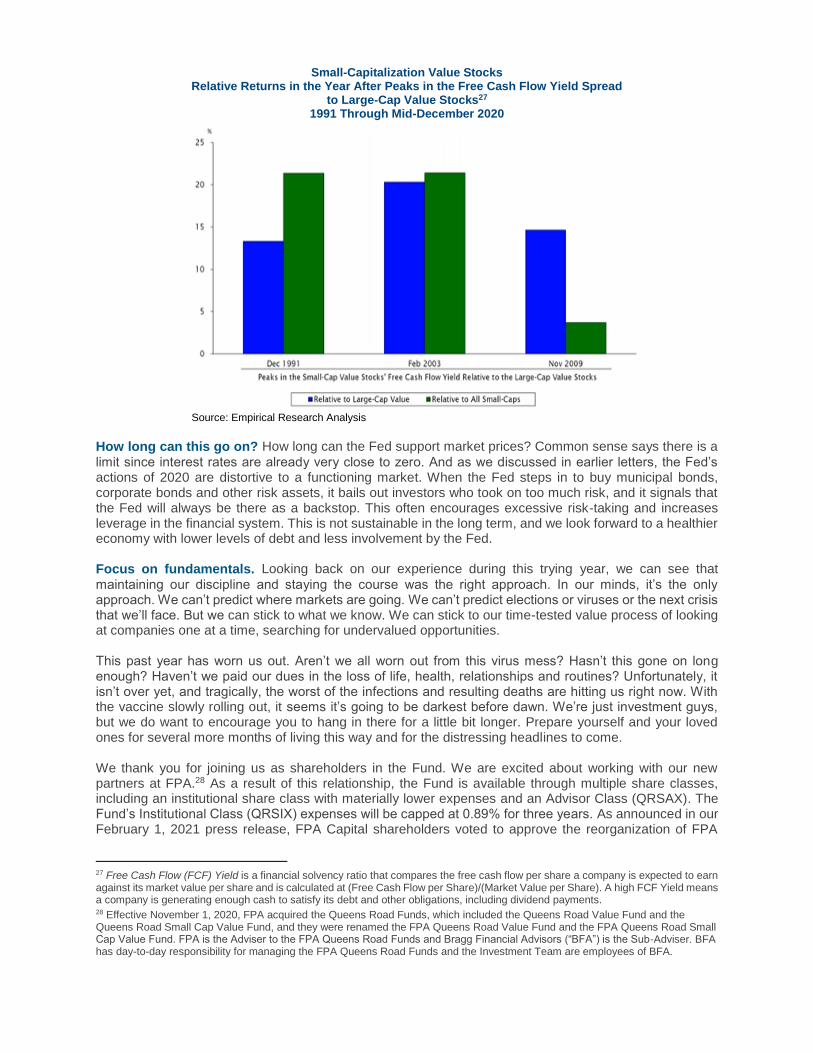
Small-Capitalization Value Stocks Relative Returns in the Year After Peaks in the Free Cash Flow Yield Spread
to Large-Cap Value Stocks27 1991 Through Mid-December 2020
Source: Empirical Research Analysis
How long can this go on? How long can the Fed support market prices? Common sense says there is a
limit since interest rates are already very close to zero. And as we discussed in earlier letters, the Fed’s actions of 2020 are distortive to a functioning market. When the Fed steps in to buy municipal bonds, corporate bonds and other risk assets, it bails out investors who took on too much risk, and it signals that the Fed will always be there as a backstop. This often encourages excessive risk-taking and increases leverage in the financial system. This is not sustainable in the long term, and we look forward to a healthier economy with lower levels of debt and less involvement by the Fed. Focus on fundamentals. Looking back on our experience during this trying year, we can see that
maintaining our discipline and staying the course was the right approach. In our minds, it’s the only approach. We can’t predict where markets are going. We can’t predict elections or viruses or the next crisis that we’ll face. But we can stick to what we know. We can stick to our time-tested value process of looking at companies one at a time, searching for undervalued opportunities. This past year has worn us out. Aren’t we all worn out from this virus mess? Hasn’t this gone on long enough? Haven’t we paid our dues in the loss of life, health, relationships and routines? Unfortunately, it isn’t over yet, and tragically, the worst of the infections and resulting deaths are hitting us right now. With the vaccine slowly rolling out, it seems it’s going to be darkest before dawn. We’re just investment guys, but we do want to encourage you to hang in there for a little bit longer. Prepare yourself and your loved ones for several more months of living this way and for the distressing headlines to come. We thank you for joining us as shareholders in the Fund. We are excited about working with our new partners at FPA.28 As a result of this relationship, the Fund is available through multiple share classes, including an institutional share class with materially lower expenses and an Advisor Class (QRSAX). The Fund’s Institutional Class (QRSIX) expenses will be capped at 0.89% for three years. As announced in our February 1, 2021 press release, FPA Capital shareholders voted to approve the reorganization of FPA
27 Free Cash Flow (FCF) Yield is a financial solvency ratio that compares the free cash flow per share a company is expected to earn against its market value per share and is calculated at (Free Cash Flow per Share)/(Market Value per Share). A high FCF Yield means a company is generating enough cash to satisfy its debt and other obligations, including dividend payments. 28 Effective November 1, 2020, FPA acquired the Queens Road Funds, which included the Queens Road Value Fund and the Queens Road Small Cap Value Fund, and they were renamed the FPA Queens Road Value Fund and the FPA Queens Road Small Cap Value Fund. FPA is the Adviser to the FPA Queens Road Funds and Bragg Financial Advisors (“BFA”) is the Sub-Adviser. BFA has day-to-day responsibility for managing the FPA Queens Road Funds and the Investment Team are employees of BFA.
Capital Fund into the FPA Queens Road Small Cap Value Fund. For more information about the reorganization please see the press release at www.fpa.com, or here. Please contact us whenever you have questions about the portfolio. We look forward to brighter days ahead in the new year. Steven H. Scruggs, CFA Portfolio Manager Benton S. Bragg, CFP, CFA Analyst Matt DeVries, CFA Analyst Important Disclosures This commentary is for informational and discussion purposes only and does not constitute, and should not be construed as, an offer or solicitation for the purchase or sale with respect to any securities, products or services discussed, and neither does it provide investment advice. Any such offer or solicitation shall only be made pursuant to the FPA Queens Road Small Cap Value Fund’s (“Fund”) Prospectus, which supersedes the information contained herein in its entirety. This presentation does not constitute an investment management agreement or offering circular. Effective November 1, 2020, as approved by the shareholders of each series of Bragg Capital Trust ("Bragg Trust"), including the Fund: (i) FPA became the investment adviser to the Fund; and (ii) Bragg Financial Advisors, Inc. ("BFA“ or “Sub-Adviser”), the former investment adviser to the Fund, transitioned to serving as the sub-adviser to the Fund pursuant to a subadvisory agreement by and among FPA, BFA and the Bragg Trust. BFA continues to be responsible for the day-to-day management of the Fund, subject to FPA's oversight; and (iii) each of the current Trustees of the Fund were elected by shareholders of the Bragg Trust to serve as the Board of Trustees of the Bragg Trust, replacing the previous Board of Trustees of the Bragg Trust in its entirety. No changes to the Fund's principal investment strategies were made in connection with these changes in management of the Fund, and Steve Scruggs, CFA, Director of Research and Senior Portfolio Manager for BFA, continues to serve as the portfolio manager for the Fund. Past performance is no guarantee of future results and current performance may be higher or lower than the performance shown. This data represents past performance and investors should understand that investment returns and principal values fluctuate, so that when you redeem your investment it may be worth more or less than its original cost. There can be no assurance that the Fund will meet any of its objectives. Current month-end performance data, which may be lower or higher than the performance data quoted, may be obtained by calling toll-free, 1-888-353-0261. You should consider the Fund's investment objectives, risks, and charges and expenses carefully before you invest. The Prospectus details the Fund's objective and policies and other matters of interest to a prospective investor. Please read the Prospectus carefully before investing. The Prospectus may be obtained by visiting the website at www.fpa.com, by calling toll-free, 1-800-982-4372, or by contacting the Fund in writing. As of the most recent prospectus, the Fund's Total Annual Operating Expenses before reimbursement is 1.16% (Investor Class), 1.11% (Advisor Class), and 1.06% (Institutional Class). As of the most recent prospectus, First Pacific Advisors, LP, the Fund’s Adviser, has contractually agreed to waive its management fees and to make payments to limit Fund expenses, until December 11, 2023 so that the total annual operating expenses (excluding interest, taxes, brokerage fees and commissions payable by the Fund in connection with the purchase or sale of portfolio securities, fees and expenses of other funds in

which the Fund invests, and extraordinary expenses, including litigation expenses not incurred in the Fund’s ordinary course of business) of the Fund do not exceed 1.04%, 0.99% and 0.89%, for Investor Class, Advisor Class, and Institutional Class shares, respectively. These fee waivers and expense reimbursements are subject to possible recoupment by the adviser from the Fund in future years (within the three years from the date when the amount is waived or reimbursed) if such recoupment can be achieved within the lesser of the foregoing expense limits or the then-current expense limits. The expense limit agreement may be terminated only by the Fund’s Board of Trustees, upon written notice to the adviser. The statements contained herein reflect the opinions and views of the portfolio managers as of the date written, is subject to change without notice, and may be forward-looking and/or based on current expectations, projections, and/or information currently available. Such information may not be accurate over the long-term. These views may differ from other portfolio managers and analysts of the firm as a whole, and are not intended to be a forecast of future events, a guarantee of future results or investment advice. Portfolio composition will change due to ongoing management of the Fund. References to individual securities or sectors should not be construed as a recommendation by the Fund, the portfolio managers, the Adviser, or the distributor to purchase or sell such securities or invest in such sectors, and any information provided is not a sufficient basis upon which to make an investment decision. It should not be assumed that future investments will be profitable or will equal the performance of the security or sector examples discussed. The portfolio holdings as of the most recent quarter-end may be obtained at www.fpa.com. Future events or results may vary significantly from those expressed and are subject to change at any time in response to changing circumstances and industry developments. The information and data contained herein has been prepared from sources believed reliable, but the accuracy and completeness of the information cannot be guaranteed and is not a complete summary or statement of all available data. The information contained herein is not complete, may change, and is subject to, and is qualified in its entirety by, the more complete disclosures, risk factors, and other information contained in the Fund’s Prospectus and Statement of Additional Information. The information is furnished as of the date shown. No representation is made with respect to its completeness or timeliness. The information is not intended to be, nor shall it be construed as, investment advice or a recommendation of any kind. Certain statements contained in this presentation may be forward-looking and/or based on current expectations, projections, and information currently available to the Adviser and/or Sub-Adviser, and can be identified by the use of forward-looking terminology such as “may,” “will,” “should,” “expect,” “anticipate,” “target,” “intend,” “continue” or “believe,” or the negatives thereof or other variations thereon or comparable terminology. Actual events or results may differ from materially those we anticipate, or the actual performance of any investments described herein may differ from those reflected or contemplated in such forward-looking statements, due to various risks and uncertainties. We cannot assure future results and disclaim any obligation to update or alter any forward-looking statements, whether as a result of new information, future events, or otherwise. Such statements may or may not be accurate over the long-term. Statistical data or references thereto were taken from sources which we deem to be reliable, but their accuracy cannot be guaranteed. The reader is advised that Adviser’s and Sub-Adviser’s investment strategy includes active management of its client portfolios with corresponding changes in allocations from one period of time to the next. Therefore, any data with respect to investment allocations as of a given date is of limited use and may not be reflective of the Adviser’s or Sub-Adviser’s more general views with respect to proper geographic, instrument and /or sector allocations. The data is presented for indicative purposes only and, as a result, may not be relied upon for any purposes whatsoever. NO INVESTMENT DECISIONS SHOULD BE BASED IN ANY MANNER ON THE INFORMATION AND OPINIONS SET FORTH IN THIS PRESENTATION. YOU SHOULD VERIFY ALL CLAIMS, DO YOUR OWN DUE DILIGENCE AND/OR SEEK ADVICE FROM YOUR OWN PROFESSIONAL ADVISOR(S) AND CONSIDER THE INVESTMENT OBJECTIVES AND RISKS AND YOUR OWN NEEDS AND GOALS BEFORE INVESTING IN ANY SECURITIES MENTIONED. AN INVESTMENT IN ANY SECURITY
MENTIONED DOES NOT GUARANTEE A POSITIVE RETURN AS SECURITIES ARE SUBJECT TO MARKET RISKS, INCLUDING THE POTENTIAL LOSS OF PRINCIPAL. Fund performance presented is calculated on a total return basis, which includes the reinvestment of all income, plus realized and unrealized gains/losses, if applicable. Unless otherwise indicated, performance results are presented on a net of fees basis and reflect the deduction of, among other things: management fees, brokerage commissions, operating and administrative expenses, and accrued performance fee/allocation, if applicable. From inception of the Fund to December 31, 2004, BFA and it affiliates voluntarily absorbed certain expenses of the Fund and voluntarily waived its management fee. Had BFA not done this, returns would have been lower during that period. Effective January 1, 2005 through October 31, 2020, BFA charged a single unitary management fee and contractually agreed to pay all operating expenses of the Fund except for brokerage, taxes, interest, litigation expenses, and other extraordinary expenses. The information provided in this presentation is based upon data existing as of the date(s) of the report and has not been audited or reviewed. While we believe the information to be accurate, it is subject in all respects to adjustments that may be made after proper review and reconciliation. Investments, including mutual fund investments, carry risks and investors may lose principal value. Capital markets are volatile and can decline significantly in response to adverse issuer, political, regulatory, market, or economic developments. Small and mid-cap stocks involve greater risks and they can fluctuate in price more than larger company stocks. Short-selling involves increased risks and transaction costs. You risk paying more for a security than you received from its sale. Groups of stocks, such as value and growth, go in and out of favor which may cause certain funds to underperform other equity funds. The value of an individual security can be more volatile than the market as a whole and can perform differently than the value of the market as a whole. Small Capitalization Companies: The Fund primarily invests in equity securities (common stocks, preferred stocks and convertible securities) of small-capitalization U.S. companies, defined as those with market capitalization, at the time of purchase, of $5 billion or less. Investing in small companies involves special risks including, but not limited to, the following: smaller companies typically have more risk and their company stock prices are more volatile than that of large companies; their securities may be less liquid and may be thinly traded which makes it more difficult to dispose of them at prevailing market prices; these companies may be more adversely affected by poor economic or market conditions; they may have limited product lines, limited access to financial resources, and may be dependent on a limited management group; and small cap stocks may fluctuate independently of large cap stocks. All investment decisions are made at the discretion of the Portfolio Manager, in accordance with the then current Prospectus. Comparison to any index is for illustrative purposes only. The prices of securities held by the Fund may decline in response to certain events taking place around the world, including those directly involving the companies whose securities are owned by the Fund. Securities in the Fund’s portfolio may underperform due to inflation (or expectations for inflation), interest rates, global demand for particular products or resources, natural disasters, pandemics, epidemics, terrorism, regulatory events and governmental or quasi-governmental actions. There is a risk that you may lose money by investing in the Fund. Value style investing presents the risk that the holdings or securities may never reach their full market value because the market fails to recognize what the portfolio management team considers the true business value or because the portfolio management team has misjudged those values. In addition, value style investing may fall out of favor and underperform growth or other styles of investing during given periods. Please refer to the Fund's Prospectus for a complete overview of the primary risks associated with the Fund. The FPA Funds are distributed by UMB Distribution Services, LLC, 235 W. Galena Street, Milwaukee, WI, 53212.
Index / Benchmark / Category Definitions Indices are unmanaged and index returns do not reflect transactions costs (e.g., commissions), investment management fees or other fees and expenses that would reduce performance for an investor. It is not possible to invest directly in an index. Indices have limitations when used for comparative purposes because they may have volatility, credit, or other material characteristics that are different from the referenced fund. For example, the referenced fund may hold underlying securities that are not included in any index used for comparative purposes and FPA/BFA makes no representation that the referenced fund is comparable to any such index in composition or element of risk involved. Any comparisons herein of the investment performance of a referenced fund to an index are qualified as follows: (i) the volatility of such index may be materially different from that of the referenced fund; (ii) such index may employ different investment guidelines and criteria than the referenced fund and, therefore, holdings in such fund may differ significantly from holdings of the securities that comprise such index; and (iii) the performance of such index may not necessarily have been selected to represent an appropriate index to compare to the performance of the referenced fund, but rather, is disclosed to allow for comparison of the referenced fund’s performance (or the performance of the assets held by such fund) to that of a well-known index. Indexes should not be relied upon as a fully accurate measure of comparison. No representation is made as to the risk profile of any index relative to the risk profile of the referenced fund. The Bloomberg Barclays Municipal Bond Index is a broad market performance benchmark for the tax-exempt bond market, the bonds included in this index must have a minimum credit rating of at least Baa. The Bloomberg Barclays U.S. Aggregate Bond Index measures the performance of the U.S. investment grade bond market. The index invests in a wide spectrum of public, investment-grade, taxable, fixed income securities in the United States – including government, corporate, and international dollar-denominated bonds, as well as mortgage-backed as asset-backed securities, all with maturities of more than one year. The Morgan Stanley Capital International All Country World Index Ex-U.S. (MSCI ACWI Ex-U.S.) Index is a market-capitalization-weighted index maintained by Morgan Stanley Capital International (MSCI). It is designed to provide a broad measure of stock performance throughout the world, with the exception of U.S.-based companies. The MSCI ACWI Ex-U.S. includes both developed and emerging markets. The MSCI ACWI ex USA Investable Market Index (IMI) captures large, mid and small cap representation across 22 of 23 Developed Markets (DM) countries (excluding the United States) and 27 Emerging Markets (EM) countries*. With 6,582 constituents, the index covers approximately 99% of the global equity opportunity set outside the US. The MSCI Emerging Markets (EM) Index stands for Morgan Stanley Capital International (MSCI), and is an index used to measure equity market performance in global emerging markets. It is just one index created by MSCI, which has been constructing and maintaining them since the late 1960s. The Russell Midcap Index is a market capitalization-weighted index comprised of 800 publicly traded U.S. companies with market caps of between $2 and $10 billion. The Russell 2000 Index is an index measuring the performance of approximately 2,000 smallest-cap American companies in the Russell 3000 Index, which is made up of 3,000 of the largest U.S. stocks. It is a market-cap weighted index. The Russell 2000 Value TR USD Index is a subset of the Russell 2000 Index, and tracks the stocks of small domestic companies, based on total market capitalization. The Russell 2000 Value Index represents those stocks of the Russell 2000 with lower price-to-book ratios and lower relative forecasted growth rates. A total return index computes the index value based on capital gains plus cash payments such as dividends and interest. The S&P 500 Index or the Standard & Poor's 500 Index is a market-capitalization-weighted index of 500 of the largest publicly traded companies in the U.S.
Morningstar Categories and Ratings Morningstar Small Value Category portfolios invest in small U.S. companies with valuations and growth rates below other small-cap peers. Stocks in the bottom 10% of the capitalization of the U.S. equity market are defined as small cap. Value is defined based on low valuations (low price ratios and high dividend yields) and slow growth (low growth rates for earnings, sales, book value, and cash flow). As of 12/31/2020, there were 1,003 funds in the category. Morningstar Return Rating is an annualized measure of a fund’s load-adjusted excess return relative to the return of the 90-day Treasury Bill over a three-, five-, or ten-year period. This is a component of the Morningstar Risk-Adjusted Return. This is derived directly from Morningstar Return. In each Morningstar Category, the top 10% of investments earn a High rating, the next 22.5% Above Average, the middle 35% Average, the next 22.5% Below Average, and the bottom 10% Low. Investments with less than three years of performance history are not rated. Morningstar Risk Rating is a proprietary Morningstar data point. An assessment of the variations in a fund’s monthly returns, with an emphasis on downside variations, in comparison to similar funds. In each Morningstar Category, the 10% of funds with the lowest measured risk are described as Low Risk, the next 22.5% Below Average, the middle 35% Average, the next 22.5% Above Average, and the top 10% High. Morningstar Risk is measured for up to three time periods (three, five, and 10 years). These separate measures are then weighted and averaged to produce an overall measure for the fund. Funds with less than three years of performance history are not rated. Quantitative Parent pillar: Intended to be comparable to Morningstar’s Parent pillar scores, which provides Morningstar’s analyst opinion on the stewardship quality of a firm. Morningstar calculates the Quantitative Parent pillar using an algorithm designed to predict the Parent Pillar score our fund analysts would assign to the fund. The quantitative pillar rating is expressed in both a rating and a numerical value as High (5), Above Average (4), Average (3), Below Average (2), Low (1). Quantitative People pillar: Intended to be comparable to Morningstar’s People pillar scores, which provides Morningstar’s analyst opinion on the fund manager’s talent, tenure, and resources. Morningstar calculates the Quantitative People pillar using an algorithm designed to predict the People pillar score our fund analysts would assign to the fund. The quantitative pillar rating is expressed in both a rating and a numerical value as High (5), Above Average (4), Average (3), Below Average (2), Low (1). Quantitative Process Pillar: Intended to be comparable to Morningstar’s Process pillar scores, which provides Morningstar’s analyst opinion on the fund’s strategy and whether the management has a competitive advantage enabling it to execute the process and consistently over time. Morningstar calculates the Quantitative Process pillar using an algorithm designed to predict the Process pillar score our fund analysts would assign to the fund. The quantitative pillar rating is expressed in both a rating and a numerical value as High (5), Above Average (4), Average (3), Below Average (2), and Low (1). Morningstar Quantitative Ratings have not been made available to the issuer of the security prior to publication. Risk Warning: The quantitative fund ratings are not statements of fact. Morningstar does not guarantee the completeness or accuracy of the assumptions or models used in determining the quantitative fund ratings. In addition, there is the risk that the return target will not be met due to such things as unforeseen changes in changes in management, technology, economic development, interest rate development, operating and/or material costs, competitive pressure, supervisory law, exchange rate, and tax rate. For investments in foreign markets there are further risks, generally based on exchange rate changes or changes in political and social conditions. A change in the fundamental factors underlying the quantitative fund ratings can mean that the recommendation is subsequently no longer accurate. For more information about Morningstar’s quantitative methodology, please visit: https://shareholders.morningstar.com/investor-relations/governance/Compliance--Disclosure/ default.aspx. ©2021 Morningstar, Inc. All Rights Reserved. The information contained herein: (1) is proprietary to Morningstar and/or its content providers; (2) may not be copied or distributed; and (3) is not warranted by

Morningstar to be accurate, complete or timely. Neither Morningstar nor its content providers are responsible for any damages or losses arising from any use of this information. Past performance is no guarantee, nor is it indicative, of future results.