Embed Size (px)
Citation preview

Fourth quarter 2019Presentation
1

Cautionary note
Certain statements included in this announcement contain forward-looking information, including, without limitation, information relating to (a) forecasts, projections and estimates, (b) statements of Hydro management concerning plans, objectives and strategies, such as planned expansions, investments, divestments, curtailments or other projects, (c) targeted production volumes and costs, capacities or rates, start-up costs, cost reductions and profit objectives, (d) various expectations about future developments in Hydro’s markets, particularly prices, supply and demand and competition, (e) results of operations, (f) margins, (g) growth rates, (h) risk management, and (i) qualified statements such as “expected”, “scheduled”, “targeted”, “planned”, “proposed”, “intended” or similar.
Although we believe that the expectations reflected in such forward-looking statements are reasonable, these forward-looking statements are based on a number of assumptions and forecasts that, by their nature, involve risk and uncertainty. Various factors could cause our actual results to differ materially from those projected in a forward-looking statement or affect the extent to which a particular projection is realized. Factors that could cause these differences include, but are not limited to: our continued ability to reposition and restructure our upstream and downstream businesses; changes in availability and cost of energy and raw materials; global supply and demand for aluminium and aluminiumproducts; world economic growth, including rates of inflation and industrial production; changes in the relative value of currencies and the value of commodity contracts; trends in Hydro’s key markets and competition; and legislative, regulatory and political factors.
No assurance can be given that such expectations will prove to have been correct. Hydro disclaims any obligation to update or revise any forward-looking statements, whether as a result of new information, future events or otherwise.
2

Fourth quarter results 2019
Firm response in weak markets
Hilde Merete Aasheim, President and CEO

Fourth quarter highlights
• Underlying EBIT of NOK 560 million
• Challenging markets weighing on results
• BNOK 1 in improvement program delivered in 2019, above target of BNOK 0.5
• Cash release in 2019• Net operating capital release of BNOK 5.6• Capex 9.6 BNOK, reduced from 10.5 BNOK guidance
• Increasing sales of low-carbon products
• Proposed dividend for 2019 of NOK 1.25 per share*
* Pending approval from the AGM on May 11, 2020

Macroeconomic uncertainty affects our marketsClimate policies and Green Deal create opportunities for Hydro

Extruded Solutions sales volumeGrowth in %
(16%)(15%)
6%
(16%)(14%)
Lower Extruded Solutions sales in 2019
6
Q4 2019 vs Q4 2018
-11%
-8%
3%
-13%
-9%
Extrusion Europe
BuildingSystems
PrecisionTubing
Extrusion North
America
2019 vs 2018
Challenging markets continuing into 2020
Extruded Solutions volume decline in 2019 • Declining market demand• Cyber attack impact
Extrusion market outlook 2020
• Declining trend in 2019 expected to continue into 2020 on overall economic uncertainty
• European market affected by weak automotive and transportation markets, low industrial activity in general
• North American market heavily affected by negative development in truck & trailer
• Limited visibility going forwardExtrudedSolutions
Extrusion Europe
BuildingSystems
PrecisionTubing
Extrusion North
America
ExtrudedSolutions

Rolled Products sales volumeGrowth in %
(7%)
17%
(14%)
(6%) (7%)
(1%)
Stable Rolled Products total sales in 2019
7* Include Body-in-White sales growth of 12% 2019 vs 2018
Q4 2019 vs Q4 2018
8% 7%
-15%
-4%-1%
0%
2019 vs 2018
Portfolio shift towards higher-margin segments
Stable Rolled Products volumes in 2019
• Strategic growth in automotive and beverage can supported by market substitution
• General engineering, foil and litho down on soft demand and higher competition from China
Rolling market outlook 2020
• Overall flat development expected for 2020 in Europe amid economic uncertainty
• Automotive light-weighting continues to drive demand, but negatively affected by current economic environment
• Solid growth rates in packaging, driven by beverage can substitution
• Continued soft demand for general engineering, foil and litho
Automotive* LithoFoilCan GeneralEngineering
Total Automotive LithoFoilCan GeneralEngineering
Total

Surplus expected for 2020 amid higher Chinese production growth and largely balanced market outside China
Source: CRU, Hydro analysis%: Growth from 2019 to 2020
Estimated primary market balance 2020(‘000t)
World ex. China 2020(mill t.)
0
500
1 000
1 500
2 000
China World ex. China Global
~28.6 – 28.9~28.2 – 28.7 Production
Demand
2-3 %
~37.0 – 37.7
~36.3 – 37.1ProductionDemand
1-3 %
4-6 %China 2020(mill t.)
(-1) - 1 %
8
2020 global demand growth expected at 0 - 2%

Improvement program ahead of target Realizing BNOK 1 in improvements, ahead of BNOK 0.5 BNOK target for 2019
* Excludes negative effects of cyber attack for Extruded Solutions .~10-11 BNOK in capex required to meet the improvement targets
20212019* 2022
0,9
2020
0,4
2,7
2023 Total
0,5
7,3
2,7
1,7
1,0
4,6
ImprovementsReversal of curtailment
Planned improvementsIn NOK billion
20212019* 20222020
2,2
Total2023
1,0
7,3
0,9
1,7
1,0
0,4
2,7
4,6
ImprovementsReversal of curtailment
Improvement status end-2019In NOK billion
9
Improvements by business areaIn NOK billion
2,7
1,6
1,0
0,9
0,2
0,9
B&APMES
EnergyStaff functions and centralized initiatives
RP
7.3 BNOK
2023

Cash release ahead of target
• 2019 capex BNOK 0.9 below Investor Day estimate
• Capex optimization – moving majority out in time, while evaluating further capex reduction measures
• Net operating capital release of BNOK 5.6 in 2019, above targetedBNOK ~4
• Inventories reduced across all business areas
• Seasonal increase in net operating capital expected in Q1
10
BNOK 5.6 cash release from net operating capital in 2019
0
2
4
6
8
10
12
Investor Day 2019 A2019 Investor Day 2020 E2020
Capital expenditure in BNOKNOC book value in BNOK
0
5
10
15
20
25
30
Dec 2017 Dec 2018 Dec 2019
Capex optimization

Bauxite & Alumina improvements ahead of schedule on faster than planned Alunorte ramp-up
0123456
Q119 Q219 Q319 Q419
11
Implied alumina cost at pre-curtailment levels
90%83%
59%52%
Successful ramp-up at Alunorte, 9th pressfilter in operationIn million mt
XX% Capacity utilization
Q4 2017 Q4 2018 Q3 2019 Q4 2019
• Implied alumina cost mainly stable in Q419 vs Q319
• Increased production, reduced alumina sourcing costs and positive currency effects from weakening BRL vs USD, offset by increased costs, including Paragominas power outage
Implied alumina cost and marginUSD/mt
18.7 % 22.9 % 17.3 % 16.0 % LME% 3)
398 463 310 281 Price 2)
409 253 255
Implied EBITDA cost per mt 1) EBITDA margin per mt
54
2657133
265
1) Realized alumina price minus underlying EBITDA for B&A, per mt alumina sales2) Realized alumina price3) Realized alumina price as % of three-month LME price
B&A2.72023
Ramp up continues, high focus on cash• Alunorte plan to produce at 90-95% of nameplate in 2020• Large investments postponed and further capex reduction measures
evaluated• 2019 net operating capital release of BNOK 0.9

Implied costs return to pre-curtailment levels
Primary Metal improves operations, while taking action in challenging markets and preserving cash
Q4 2017 Q4 2018 Q3 2019 Q4 2019
• Implied primary cost down in Q419 vs Q319 on reduced raw material costs, mainly alumina
All-in implied primary cost and marginUSD/mt
2 092 2 041 1 784 1 754 LME 5)
2 351 2 403 2 089 2 011 All-in 4)
2 000
All-in Implied EBITDA cost per mt2) LME Implied EBITDA cost per mt3)
1 775
1 525
2 350
50
250
All-in EBITDA margin per mt
1 900
1 600
175
1) Primary Metal and Metal Markets2) Realized all-in aluminium price less underlying EBITDA margin, incl Qatalum, per mt aluminium sold. 3) Realized LME aluminium price less underlying EBITDA margin, incl Qatalum, per mt primary aluminiumproduced 4) Realized LME plus realized premiums, including Qatalum
5) Realized LME, including QatalumImplied primary cost and margin rounded to nearest USD 25
500
1 575
1 850
92
93
94
95
Q4 2017 Q1 2018 Q2 2018 Q3 2018 Q4 2018 Q1 2019 Q2 2019 Q3 2019 Q4 2019
Operational parameters improving through 2019
Responding to challenging markets, high focus on cash
Current efficiency Norwegian primary smelters, in %
• Reduced casthouse production • 20% curtailment of Slovalco• 2019 net operating capital release of BNOK 2.81)
PM
1.6 2023
12

Improvement activities at full speed in Rolled Products
13
Operational efficiency Organisational efficiency Commercial excellence
Rolled Products improvements per year and categoryIn MNOK
0
100
200
300
400
500
600
700
800
900
20222019 2020 2021 2023 Total
RP
0.9 2023
Improvement initiatives • Restructuring of Grevenbroich well on its way
• One foil line closed, additional foil line to close during 2020
• Executing on manning reductions – ~25% signed• Significant pipeline of procurement initiatives, maturing to
implementation, with first savings confirmed• Targeting metal cost improvements through increased recycling
and UBC improvements delivered in 2019• Shifting volumes from foil and litho to more attractive market
segments, such as automotive and can
Cash release • 2019 net operating capital release of BNOK 0.6
Strategic review ongoing
Strategic review continues

Extruded Solutions delivering improvements through restructuring and cost improvements
14
Improvement initiatives • 2019 actions to optimize and streamline portfolio:
• Full plant closures in Redditch (UK), Rotherham (UK), Pinto (Spain), Belton (US), Kalamazoo (US)
• Warehouse closures in Wakefield (UK), Lodz (Poland), Bangalore (India)• Office closure in Dusseldorf (Germany)• Considerable simplification and demanning in Tewkesbury (UK), Drunen
(Netherlands), Szekesfehervar (Hungary), Tønder (Denmark), Vetlanda (Sweden), Itu (Brazil), Tubarao (Brazil), Utinga (Brazil), Kuppam (India)
• Divestment of operations in Santa Oliva (Spain), Ho Chi Minh JV (Vietnam), Chisineu Cris (Romania)
• 2020 impact of initiatives above estimated to MNOK ~300, supporting ongoing BNOK 1.0 improvement target
• Additional restructuring and cost reduction initiatives under way
Cash release • 2019 net operating capital release of BNOK 2.1• Total sales proceeds from 2019 divestments of MNOK ~300
ES
1.0 2023

Proposing dividend of NOK 1.25* per share for 2019
15
• Aiming for competitive shareholder returns and dividend yield compared to alternative investments in peers
• Reflects a robust financial situation, taking into account a demanding year for the company and the volatility in the aluminium industry
• Average five-year payout ratio** of ~68%• Dividend policy 40% payout ratio of reported net income over
the cycle with 1.25 NOK/share considered as floor
• Represents payout of ~NOK 2.6 billion
* Pending approval from the AGM on May 11, 2020** Dividend paid divided by net income from continuing operations attributable to equity holders, including proposed 2019 dividend*** Dividend yield defined as dividend per share/share price year end, latest available data (2019 if reported, otherwise 2018).Peer group includes (in alphabetical order): Upstream: Alcoa, Century, Chalco, Hindalco, Rusal. Downstream: Alcoa, Amag, Constellium, KaiserSource: Nasdaq IR Insight
0,4
2,5
Hydro
3,8
0,0
3,8
0,0
0,6
0,0 0,0 0,0
Aluminium peer group dividend yield***, %
Downstream peers Upstream peers

Sustainability dashboard 2019
Safety Social responsibility Biodiversity Climate
Certifying sustainability
Greener products Recycling
TRI rate 3.0FY 2019
Ambition: Zero fatalities and injury free environment
2030 target: Empowering 500,000 people
with education and skills
2018 2030
On track2019
Target: 1 to 1 rehabilitation of available mined areas
Target of 30% reduction in CO2 emissions by
2030 launched
27 plants ASI certified, covers entire value chain
10 000 mt CIRCAL produced
FY 2019
Combined 2020/21 target: 65,000 mt
Recycled 175 000* mtpost consumer scrap
FY 2019
* Primary Metal and Rolled Products. Extruded Solutions estimate of post-consumer scrap is ~170 000 mt
Ambition: Grow in recycling
Profitability & Sustainability
16

Growing demand for Hydro’s greener products in building facades
17
60 Hydro CIRCAL projects landed in one year
0
5
10
15
20
25
30
35
40
45
2019 2020E 2021E
Sales targets for Hydro CIRCALIn thousand mt
Ticon, Norway Les Gavottes, France

Financial update
Pål Kildemo, Executive Vice President and CFO
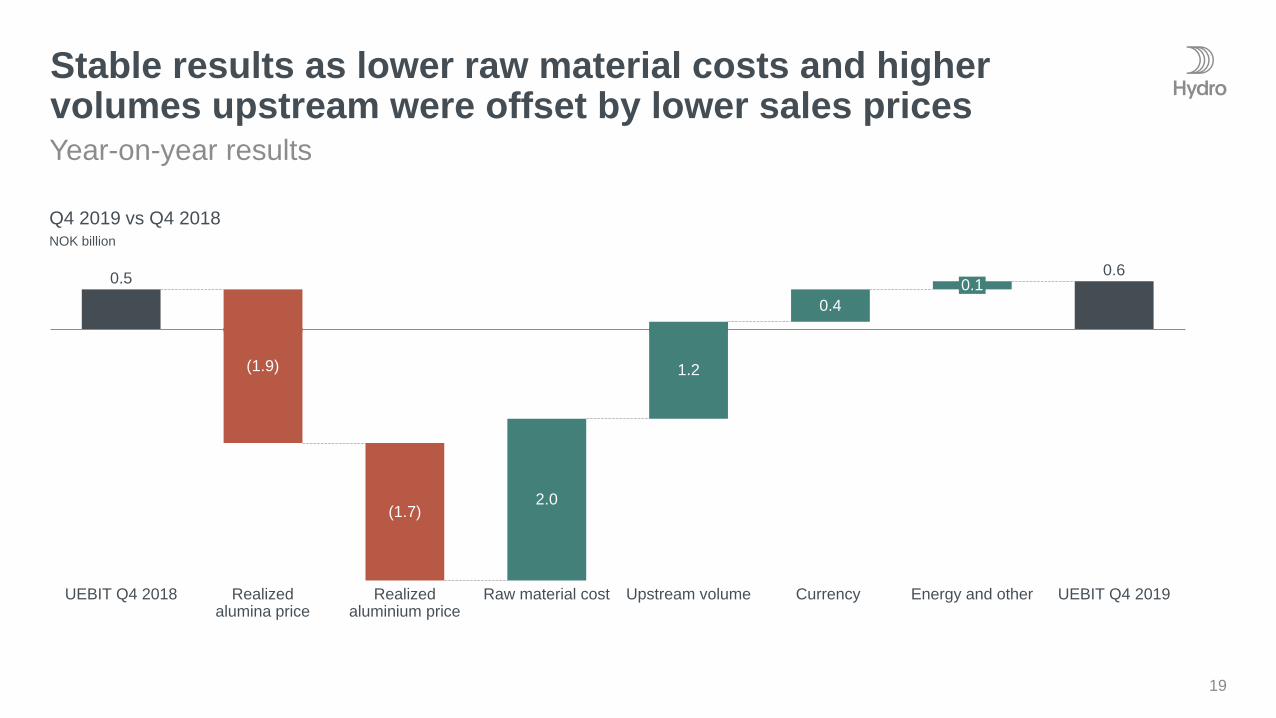
Stable results as lower raw material costs and higher volumes upstream were offset by lower sales pricesYear-on-year results
Q4 2019 vs Q4 2018NOK billion
0.5 0.6
(1.7)
0.4
2.0
UEBIT Q4 2018 Realized aluminium price
(1.9)
Raw material costRealized alumina price
1.2
Upstream volume Currency UEBIT Q4 2019
0.1
Energy and other
19

Results down on lower realized prices and weak downstream resultsQuarter-on-quarter results
Q4 2019 vs Q3 2019NOK billion
1.4
0.6
0.3
0.2
(0.4)
UEBIT Q4 2019UEBIT Q3 2019 Realized alumina priceRealized aluminium price
(0.3)(0.6)
Upstream costs Downstream results Other
20

21
9.1
2.42.0
0.70.6 0.5
0.53.4
CurrencyRaw material costs
Other2018 UEBIT Aluminium and alumina sales prices
10.0
2.4
Energy volumes UEBIT 2019 ex improvements
Improvement program ex reversal of curtailment
Reversal of curtailment
UEBIT 2019 incl improvements
Results down as improvements are offset by lower realized pricesYear 2019 vs year 2018
Underlying EBIT 2019 vs 2018NOK billion
1 BNOK in realized improvements

Key financials
NOK million Q4 2019 Q4 2018 Q3 2019 Year 2019 Year 2018
Revenue 35 490 38 386 37 517 149 766 159 377
Underlying EBIT
Items excluded from underlying EBIT
Reported EBIT
560
959
(399)
534
356
178
1 366
1 144
222
3 359
2 860
499
9 069
547
8 522
Reported EBITDA 2 617 1 854 2 430 9 878 15 796
Underlying EBITDA 2 792 2 210 3 479 11 832 16 344
Financial income (expense)
Income (loss) before tax
231
(168)
(721)
(543)
(1 628)
(1 407)
(2 055)
(1 556)
(2 060)
6 462
Income taxes (497) (207) 16 (813) (2 139)
Net income (loss) (665) (750) (1 390) (2 370) 4 323
Underlying net income (loss) (303) (175) 606 708 5 819
Reported EPS, NOK
Underlying EPS, NOK
(0.23)
(0.12)
(0.34)
(0.06)
(0.62)
0.33
(0.88)
0.52
2.08
2.75
22

Excluded a loss of NOK~1 billion from Underlying EBITImpairment charges, rationalization and closure costs
NOK million Q4 2019 Q4 2018 Q3 2019 Year 2019 Year 2018
Underlying EBIT 560 534 1 366 3 359 9 069
Unrealized derivative effects on LME related contracts
Unrealized derivative effects on power and raw material contracts
Metal effect, Rolled Products
Significant rationalization charges and closure costs
Impairment charges
Alunorte agreements – provisions
Transaction related effects
Pension
Other effects
(1)
(8)
23
(78)
(783)
-
14
-
(125)
(22)
82
(93)
(79)
-
-
-
(40)
(203)
120
46
(123)
(1 206)
(95)
(30)
-
62
82
(91)
99
(370)
(1 484)
(906)
(80)
(21)
62
(68)
(39)
260
73
(79)
-
(519)
-
(40)
(203)
Reported EBIT (399) 178 222 499 8 522
23
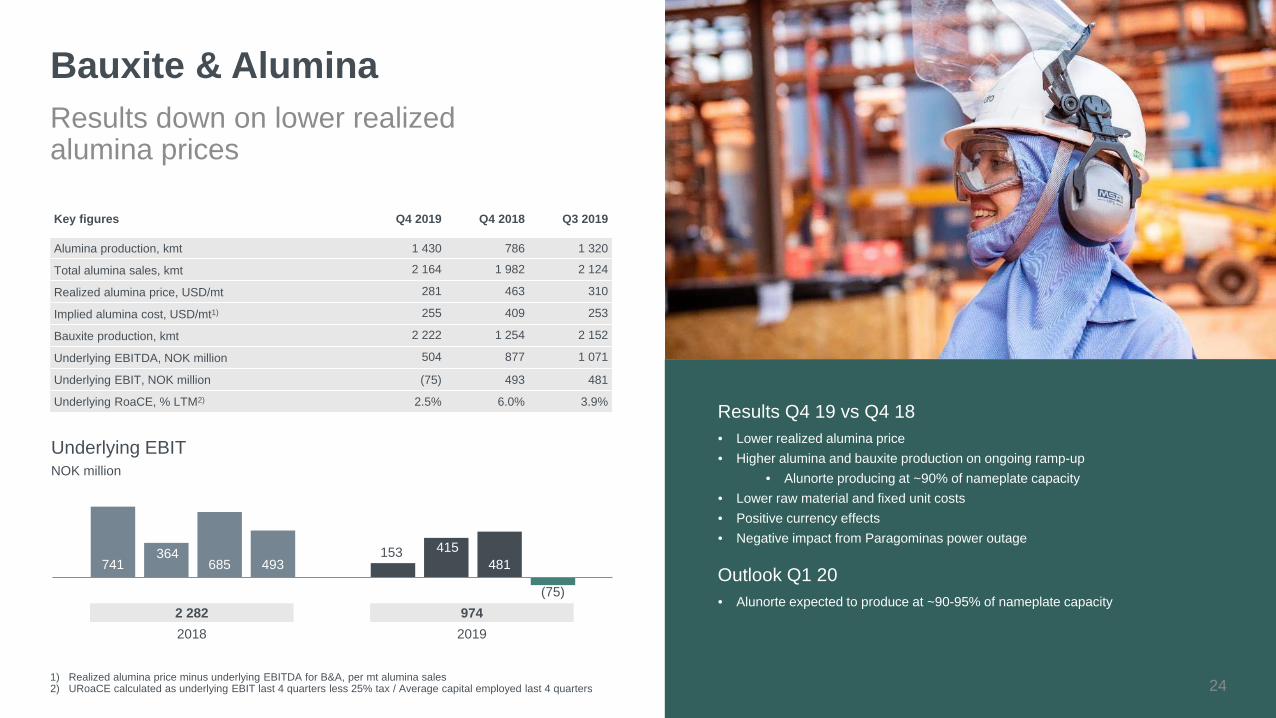
9742 282
Bauxite & AluminaResults down on lower realized alumina prices
Key figures Q4 2019 Q4 2018 Q3 2019
Alumina production, kmt 1 430 786 1 320
Total alumina sales, kmt 2 164 1 982 2 124
Realized alumina price, USD/mt 281 463 310
Implied alumina cost, USD/mt1) 255 409 253
Bauxite production, kmt 2 222 1 254 2 152
Underlying EBITDA, NOK million 504 877 1 071
Underlying EBIT, NOK million (75) 493 481
Underlying RoaCE, % LTM2) 2.5% 6.0% 3.9% Results Q4 19 vs Q4 18• Lower realized alumina price• Higher alumina and bauxite production on ongoing ramp-up
• Alunorte producing at ~90% of nameplate capacity• Lower raw material and fixed unit costs • Positive currency effects• Negative impact from Paragominas power outage
Outlook Q1 20• Alunorte expected to produce at ~90-95% of nameplate capacity
741153364 415
685 481493
(75)
20192018
NOK millionUnderlying EBIT
1) Realized alumina price minus underlying EBITDA for B&A, per mt alumina sales2) URoaCE calculated as underlying EBIT last 4 quarters less 25% tax / Average capital employed last 4 quarters 24

NOK millionUnderlying EBIT
823
(771)
755
(604)
861
(39)(677)
155
Key figures Q4 2019 Q4 2018 Q3 2019
Primary aluminium production, kmt 545 490 522
Total sales, kmt 529 503 537
Realized LME price, USD/mt 1 754 2 041 1 784
Realized LME price, NOK/mt 15 913 17 038 15 732
Realized premium, USD/mt 257 362 305
Implied all-in primary cost, USD/mt 1) 1 775 2 350 1 900
Underlying EBITDA, NOK million 812 (176) 550
Underlying EBIT, NOK million 155 (677) (39)
Underlying RoaCE, % LTM2) (2.6)% 4.7% (4.5)%
Primary MetalResults up on lower raw material costs
1) Realized all-in aluminium price minus underlying EBITDA margin, including Qatalum, per mt aluminium sold. Including Qatalum volumes.
2) URoaCE calculated as underlying EBIT last 4 quarters less 25% tax / Average capital employed last 4 quarters3) Bookings as per 31.12.2019
Results Q4 19 vs Q4 18• Lower raw material costs• Lower realized LME price and premium • Higher sales volumes on completed Albras ramp-up • Positive currency effects
Outlook Q1 20• ~ 50% of primary production for Q1 priced at USD ~1 750 per mt 3)
• ~ 55% of premiums affecting Q1 booked at USD ~260 per mt 3)
- Q1 realized premium expected in the range of USD 200-250 per mt• Raw material costs trending downwards• Slovalco partially curtailed• Husnes restart commencing as planned in H1 2020
(1 259)1 76220192018
25

NOK millionUnderlying EBIT
178 190237 299
(3)
362275 132
Metal MarketsResults down on lower results from remelters and negative currency effects
1) Includes external and internal sales from primary casthouse operations, remelters and third-party metal sources.2) URoaCE calculated as underlying EBIT last 4 quarters less 25% tax / Average capital employed last 4 quarters
Results Q4 19 vs Q4 18• Weaker results from remelters on lower volumes and margins • Currency and inventory valuation effects negative NOK (52) million in Q4 19 vs
positive NOK 58 million in Q4 18
Outlook Q1 20• Softening market conditions for remelters• Volatile trading and currency effects
98368620192018
Key figures Q4 2019 Q4 2018 Q3 2019
Remelt production, kmt 121 135 125
Metal products sales, kmt 1) 648 682 662
Underlying EBITDA, NOK million 167 301 395
Underlying EBIT excl currency and inventory valuation effects, NOK million
184 217 338
Underlying EBIT, NOK million 132 275 362
Underlying RoaCE, % LTM2) 27.3% 19.4% 28.8%
26

NOK millionUnderlying EBIT
232 138212 7582166
(113)
34
Rolled ProductsResults up on lower raw material costs in Neuss smelter
Results Q4 19 vs Q4 18• Stable results from the rolling mills• Improved results from Neuss smelter on lower raw material costs
Outlook Q1 20• Continued market demand weakness • Neuss results driven by all-in metal and raw material price development
41341320192018
Key figures Q4 2019 Q4 2018 Q3 2019
External sales volumes, kmt 219 220 245
Underlying EBITDA, NOK million 308 133 430
Underlying EBIT, NOK million 34 (113) 166
Underlying RoaCE, % LTM1) 2.4% 2.3% 1.5%
1) URoaCE calculated as underlying EBIT last 4 quarters less 25% tax / Average capital employed last 4 quarters 27

Key figures Q4 2019 Q4 2018 Q3 2019
External sales volumes, kmt 272 318 316
Underlying EBITDA, NOK million 655 645 1 099
Underlying EBIT, NOK million 85 202 559
Underlying RoaCE, % LTM1) 5.7% 7.2% 5.9%
NOK millionUnderlying EBIT
734 593957 772497 55920285
Extruded SolutionsResults down on 14% lower volumesCyber insurance compensation of 187 MNOK
Results Q4 19 vs Q4 18• 187 MNOK in cyber insurance compensation• 14% lower volumes due to weaker market demand • Higher margins driven by value-over-volume strategy
Outlook Q1 20• Declining market demand in Europe and North America• Q1 19 affected by the cyber attack
2 0092 39020192018
1) URoaCE calculated as underlying EBIT last 4 quarters less 25% tax / Average capital employed last 4 quarters 28

Key figures Q4 2019 Q4 2018 Q3 2019
Power production, GWh 2 332 2 822 2 273
Net spot sales, GWh 520 1 166 582
Southwest Norway spot price (NO2), NOK/MWh 392 455 328
Underlying EBITDA, NOK million 365 566 319
Underlying EBIT, NOK million 296 500 254
Underlying RoaCE, % LTM1) 12.9%2) 18.8% 21,3%
NOK millionUnderlying EBIT
278 517417 176652 254500 296
EnergyResults down on lower volumes and prices
Results Q4 19 vs Q4 18• Significantly lower volumes• Lower power prices• Positive commercial contribution
Outlook Q1 20• Volume and price uncertainty• Average NO2 power price 244 NOK/MWh in January
1 2431 84620192018
1) URoaCE calculated as underlying EBIT last 4 quarters less 70% tax/ Average capital employed last 4 quarters2) 80% tax rate applied for full year 2019 29
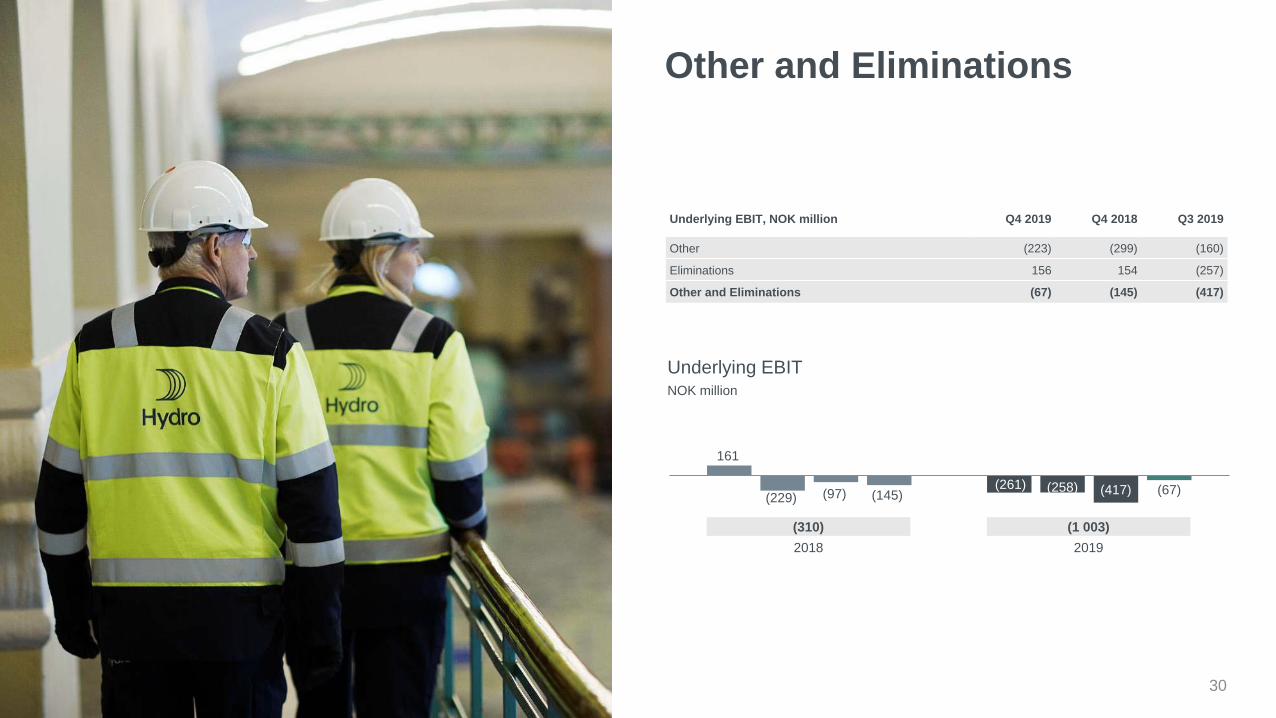
Other and Eliminations
Underlying EBIT, NOK million Q4 2019 Q4 2018 Q3 2019
Other (223) (299) (160)
Eliminations 156 154 (257)
Other and Eliminations (67) (145) (417)
NOK millionUnderlying EBIT
161
(261)(229)
(258)(97) (417)(145) (67)
20192018(1 003)(310)
30

Net debt 2.7 BNOK down in Q4 2019Further NOC release and reduced investments
NOK billion
Net cash flow from operationsNOK 5.7 billion
(14.5)
(11.8)
(2.9)
Underlying EBITDA Taxes and other
3.3
End Q3 2019
2.8
Operating capital
(0.4)
Net investments End Q4 2019
31

Net debt stable in 2019 Significant net operating capital release
NOK billion
Net cash flow from operationsNOK 12.6 billion
(8.7)
(11.8)
(3.1)
5.6
(2.6)
(0.8)
11.8
End Q4 2018 Shareholder dividends
Operating capitalUnderlying EBITDA
(4.9)
Taxes and other Other
(9.1)
Net investments End Q4 2019(11.7)
32
IFRS16 Leases

Adjusted net debt down in Q4
1
Lower net debt, net pension liability and netdebt in Qatalum
1) “Other adjustments” include, e.g., asset retirement obligations, cash and short-term investments in Industriforsikring2) Restated with implementation of IFRS16 - Leases
NOK billionDec 31,
2019Sep 30,
2019Jun 30,
2019Dec 31,
20182)
Cash and cash equivalentsShort-term investmentsShort-term debtLong-term debt
12.31.0
(6.2)(18.9)
10.60.9
(6.1)(20.0)
10.61.1
(8.2)(18.6)
6.01.0
(9.4)(9.3)
Net cash/(debt) (11.8) (14.5) (15.1) (11.7)
Net pension liability at fair value, net of expected tax benefitOther adjustments1)
(8.6)
(5.1)
(10.3)
(4.8)
(8.8)
(4.0)
(8.8)
(4.0)
Adjusted net debt ex. EAI (25.4) (29.6) (27.9) (24.5)
Net debt in EAI (4.7) (5.4) (5.4) (5.6)
Adjusted net debt incl. EAI (30.1) (35.0) (33.3) (30.1)

Capex9.6 BNOK
Capital returnsURoaCE
1.3%2)
Capital return dashboard 2019
1) Graph excludes (6.8) BNOK in capital employed in Other & Elimination2) URoaCE Hydro (Annual definition) calculated as underlying EBIT last 4 quarters less Income tax expense adjusted for tax on financial items/ Average capital employed last 4 quarters. 3) Funds from operation LTM/Average LTM adjusted net debt4) Free cash flow – operating cash flow less investing cash fllow excl. sales/purchases of short-term investments5) Pending approval from the AGM on May 11, 2020
Hydro targets URoaCE above 10% over the cycle
Balance sheetFFO/aND
27%3)
Improvement program
1.0 BNOKNet operating capital
5.6 BNOK release
27 %
33 %
11 %
25 %
2 %
1 %Bauxite & Alumina
Metal Markets
Extruded Solutions
Primary Metal
Rolled Products
Energy
~96 BNOK
Capital employed1)
Free cash flow
3.4 BNOK4)
10% target over the cycle >40% target over the cycle
34
2019 estimate ~10.5 BNOK2023 target 7.3 BNOK2019 target 0.5 BNOK
Target 12 NOC days reduction (~ 4 BNOK) from end-2018 to end-2020
Shareholder payout
1.25 NOK/share5)
68% average 5-yr payout ratio
40% payout ratio over the cycle1.25 NOK/share dividend floor
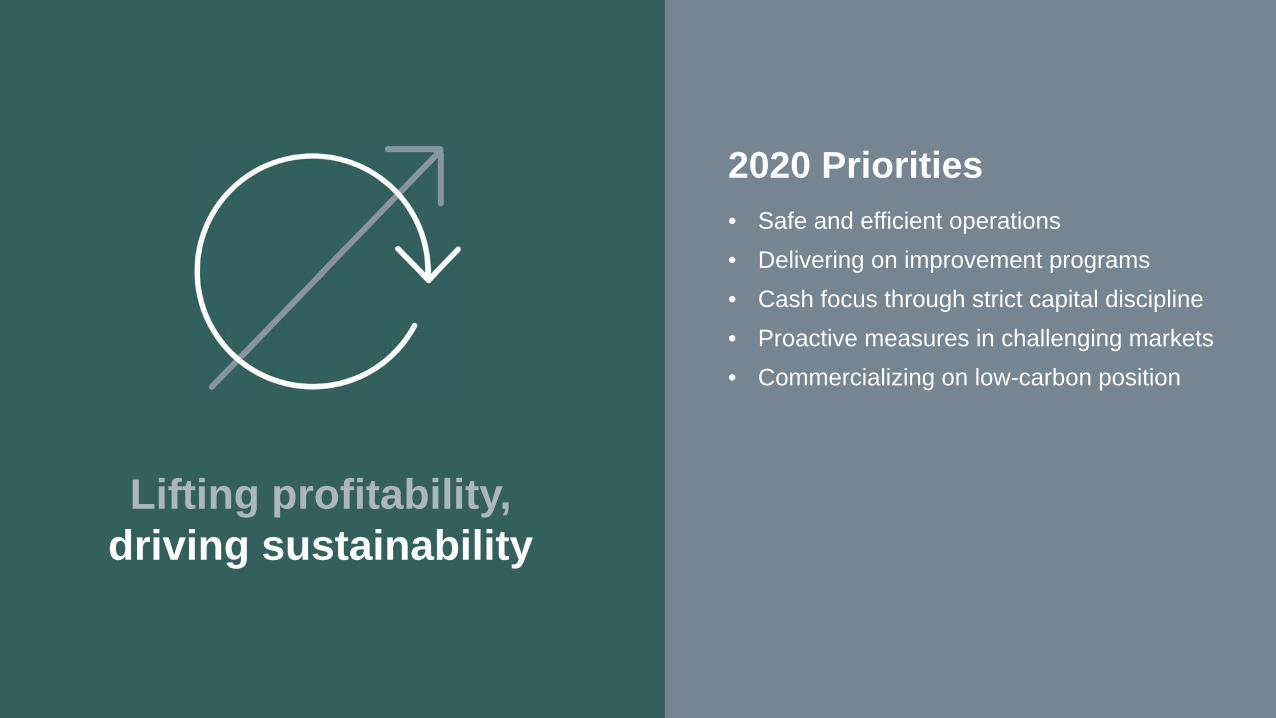
2020 Priorities • Safe and efficient operations• Delivering on improvement programs• Cash focus through strict capital discipline• Proactive measures in challenging markets • Commercializing on low-carbon position
Lifting profitability, driving sustainability

Additional information

Driving long-term shareholder value
1) Moody’s revised Hydro’s credit rating outlook from stable to negative on March 28, 20192) Compared to CMD 2018
Financial ambitions and targets
Improvementambitions6.4 BNOK
on EBIT by 2023
Net operating capital release
Reduce by 12 NOC daysby end-2020 vs end-2018
Capexoptimization
~1 BNOK reductionin sustaining capex
in 2019-202)
Rolled Products restructuring
0.9 BNOK on EBIT by 2023
Liftingcash flows
towards2023
Clear principles for capital allocation • Capital allocation in line with strategic
priorities and return requirements by business area
• Competitive and affordable sustainingcapex
• Strict prioritization, continuous reviewand reallocation
Robust shareholder payout• 40% payout ratio of Net Income over
the cycle
• Dividend floor of 1.25 NOK/share
• Supplementary share buybacks or extraordinary dividends
Financial strengthand flexibility• Maintain investment grade credit rating
• Curently BBB (S&P), Baa2 (Moody’s1))
• Balance sheet ratio targets over the cycle:• Funds from operations to adjusted net
debt > 40%• Adjusted net debt to equity < 55%
• Strong liquidity
Roadmap to profitability targets• URoaCE > 10% over the cycle for Hydro
group
• URoaCE> CoC for business areas over the cycle
• Differentiated return requirements by and within business areas
37

Clear principles for capital allocation
Evaluate funds available for allocationProjected funds from operations in several market scenarios
Strong balance sheetDividend commitments to shareholders
Excess cash flow
Key considerations affecting growth capital availability
Net operating capital Extraordinary dividends Share buybacks
Portfolio review and divestments
Strategy
PlanningExecution
Review
Sustaining capexLicense to operate (HSE, CSR, compliance)
External and internal benchmarkingAffordability
Organic and inorganic growthAligned with strategic priorities for each business area
Stringent return requirements by and within business areaOther criteria - risk, market outlook, historical profitability, sustainability impact
38

Shareholder and financial policy
• Aiming for competitive shareholder returns and dividend yield compared to alternative investments in peers
• Dividend policy• Average ordinary payout ratio: 40% of reported net income over the cycle• 1.25 NOK/share to be considered as a floor, as of Q4 2016• Share buybacks and extraordinary dividends as supplement in periods with strong
financials and outlook• 2019 dividend 1.25 NOK/share 1)
• Five-year average ordinary pay-out ratio 2015-2019 of ~68% 1)
• Maintain investment-grade credit rating• Currently: BBB stable (S&P) & Baa2 negative 2)(Moody’s) • Competitive access to capital is important for Hydro’s business model (counterparty risk
and partnerships)
• Financial ratios over the business cycle• Funds from operations to adjusted net debt > 40%• Adjusted net debt to equity < 55%
• Strong liquidity• NOK 12.3 billion in cash and cash equivalents, end-Q4 2019• USD 1.6 billion in multi-currency revolving credit facility maturing in 2025
• Hedging strategy• Fluctuating with the market: primarily exposed to LME and USD• Volatility mitigated by strong balance sheet• Strengthening relative position to ensure competitiveness
• Diversified business• Upstream cyclicality balanced with more stable earnings downstream• Exposed to different markets and cycles
• Bauxite & Alumina• Currency exposure, mainly USD and BRL• Exposed to LME and Platts alumina index prices
• Primary Metal• Operational LME hedging - one-month forward sales• Currency exposure, mainly USD, NOK and BRL
• Metal Markets, Rolled Products• Operational LME and currency hedging to secure margin
• Flexibility to hedge LME or currency in certain cases
39
Hedging policy
1) Pending approval from the AGM on May 11, 2020 2) Moody’s revised Hydro’s credit rating outlook from stable to negative on March 28, 2019

Funds from operations / Adjusted net debt
Maintaining a solid balance sheet and investment-grade credit rating
401) 2015 and 2019 FFO/aND ratio has been restated due to changes in definition. 2) 2018 ratios restated for the IFRS16 Leases effectExtruded Solutions reflected as 50% equity accounted investment Q1-Q3 2017 and fully consolidated in Q4 2017
Adjusted net debt Adjusted net debt / Equity BNOK
32 %
11 %
24 %19 % 22 %
26 %20 %
14 %
26 %33 % 36 %
20152014 20162009 2010 2011 20132012 20182017 2019
<55%
1 %
118 %
42 % 39 % 33 %42 %
84 %95 %
68 %
44 %27 %
2009 20132010 20162011 20142012 2015 2017 2018 2019
>40
1)
(15.1)
(14.5)
(11.8)
(4.0)
(4.8)
(5.1)
(5.4)
(5.4)
(4.7)
(8.8)
(10.3)
(8.6)
Jun 30, 2019
Sep 30, 2019
Dec 31, 2019
(33.3)
(35.0)
(30.1)
Debt in EAINet debtOther adjustments Net pension liability
2)
2)
1)

Project pipeline to be based on updated capitalallocation framework and strategic priorities
41*Excluding the Pis/Cofins adjustments in Brazil in 2018. Including the adjustment, 2018 capex amounted to BNOK 7.0 Capex including Extruded SolutionsGrowth and return-seeking capex guidance only includes capex necessary for delivering on targeted improvement ambitions
NOK billion
Majority of sustaining capex allocated upstream
5.7 6.2 6.2
2018
5.7 5.8
2015 2016 2017 2019
6.5-7.0
8.8
2020E
~7.0
2021-2023E
7.27.9 7.8*
9.6~9.5-10 ~9.5-10
Karmøy technology pilot (net of ENOVA support)Growth projects and incremental growthSustaining capex
Main sustaining projects• Alunorte robustness• Pipeline replacement in B&A• Smelter relining and asset integrity in PM• Paragominas new mine area (from 2022)
Main growth and return-seeking projects• Husnes restart and upgrade• Automation, process control and
efficiency in PM• Selected customer-driven growth in ES• Energy wind and battery storage• Fuel switch project in B&A

310 300
(230) (270) (130) (130) (30)
Fuel oil PitchCaustic soda
Standard ingot
premium1)
Realized PAX
Pet coke Coal
Significant exposure to commodity and currency fluctuations
• Annual sensitivities based on normal annual business volumes (incl. 100% production at Alunorte, Paragominas and Albras) and Q419 realized prices as a starting point LME USD 1 750 per mt, standard ingot premium 140 USD/mt, PAX 285 USD/mt, fuel oil USD 510 per mt, petroleum coke USD 255 per mt, pitch 650 USD/t, caustic soda USD 270 per mt, coal USD 50 per mt, USD/NOK 9.07, BRL/NOK 2.21, EUR/NOK 10.09
• Aluminium price sensitivity is net of aluminium price indexed costs and excluding unrealized effectsrelated to operational hedging
• BRL sensitivity calculated on a long-term basis with fuel oil assumed in USD. In the short-term, fuel oilis BRL-denominated
• Excludes effects of priced contracts in currencies different from underlying currency exposure(transaction exposure)
• Currency sensitivity on financial items includes effects from intercompany positions• 2020 Platts alumina index (PAX) exposure used• U NI sensitivity calculated as U EBIT sensitivity after 30% tax
421) Europe duty paid
Other commodity prices, sensitivity +10% 1)
Aluminium price sensitivity +10% Currency sensitivities +10%NOK million
NOK million
Sustainable effect:
3 660 2 560
Underlying Net IncomeUEBIT
NOK million USD BRL EUR
UEBIT 3 280 (1 100) (220)
One-off reevaluation effect:
Financial items (60) 830 (3 570)3)

NOK million USD BRL EUR
UEBIT 860 (710) -
Bauxite & Alumina sensitivities
43Annual sensitivities based on normal annual business volumes (incl. 100% production at Alunorte, Paragominas and Albras) and Q419 realized prices as a starting point LME USD 1 750 per mt, standard ingot premium 140 USD/mt, PAX 285 USD/mt, fuel oil USD 510 per mt, petroleum coke USD 255 per mt, pitch 650 USD/t, caustic soda USD 270 per mt, coal USD 50 per mt, USD/NOK 9.07, BRL/NOK 2.21, EUR/NOK 10.09 BRL sensitivity calculated on a long-term basis with fuel oil assumed in USD. In the short-term, fuel oil is BRL-denominated. 2020 Platts alumina index (PAX) exposure used
Annual sensitivities on underlying EBIT if +10% in priceNOK million
Currency sensitivities +10%
90
1 280
(270) (130)(30)
Caustic soda CoalFuel oilRealized PAXAluminium
Revenue impact• ~14% of 3-month LME price per tonne alumina with one month lag• Realized alumina price lags PAX by one month
Cost impact
Bauxite• ~2.45 tonnes bauxite per tonne alumina• Pricing partly LME-linked
Caustic soda• ~0.1 tonnes per tonne alumina• Prices based on IHS Chemical, pricing mainly monthly per shipment
Energy• ~0.12 tonnes coal per tonne alumina, Platts prices, one year volume contracts, weekly per
shipment pricing• ~0.11 tonnes heavy fuel oil per tonne alumina, prices set by ANP/Petrobras in Brazil, weekly
pricing (ANP) or anytime (Petrobras)• Increased use of coal as energy source in Alunorte

NOK million USD BRL EUR
UEBIT 2 100 (390) (290)
Primary Metal sensitivities
44Annual sensitivities based on normal annual business volumes (incl. 100% production at Alunorte, Paragominas and Albras) and Q419 realized prices as a starting point LME USD 1 750 per mt, standard ingot premium 140 USD/mt, PAX 285 USD/mt, fuel oil USD 510 per mt, petroleum coke USD 255 per mt, pitch 650 USD/t, caustic soda USD 270 per mt, coal USD 50 per mt, USD/NOK 9.07, BRL/NOK 2.21, EUR/NOK 10.09
Annual sensitivities on underlying EBIT if +10% in priceNOK million
Currency sensitivities +10%
3 320
290
(900)(220) (120)
Pet coke PitchRealized PAXStandard ingot premium
Aluminium
Revenue impact
• Realized price lags LME spot by ~1-2 months • Realized premium lags market premium by ~2-3 months
Cost impact
Alumina• ~1.9 tonnes per tonne aluminium• ~14.5% of 3-month LME price per tonne alumina, increasing volumes priced on Platts index• ~ 2-3 months lag
Carbon• ~0.40 tonnes petroleum coke per tonne aluminium, Pace Jacobs Consultancy, 2-3 year
volume contracts, quarterly or half yearly pricing• ~0.08 tonnes pitch per tonne aluminium, CRU, 2-3 year volume contracts, quarterly pricing
Power• 13.9 MWh per tonne aluminium• Long-term power contracts with indexations

Items excluded from underlying results - 2019
NOK million (+=loss/()=gain) Q1 2019 Q2 2019 Q3 2019 Q4 2019 Year 2019Alunorte agreements - provision Bauxite & Alumina 35 14 30 - 80Impairment charges Bauxite & Alumina - - - 145 145Total impact Bauxite & Alumina 35 14 30 145 225Unrealized derivative effects on LME related contracts Primary Metal 122 (15) (27) 10 90Unrealized effects on power contracts Primary Metal 27 (35) (42) 33 (17)Impairment charges Primary Metal - - - 506 506Total impact Primary Metal 149 (50) (69) 549 579Unrealized derivative effects on LME related contracts Metal Markets 222 (62) (19) 94 235Total impact Metal Markets 222 (62) (19) 94 235Unrealized derivative effects on LME related contracts Rolled Products (77) 60 (24) (41) (82)Metal effect Rolled Products 267 3 123 (23) 370Significant rationalization charges and closure costs Rolled Products - - 1 145 (57) 1 088Other effects Rolled Products - - (99) - (99)Total impact Rolled Products 191 63 1 145 (120) 1 277Unrealized derivative effects on LME related contracts Extruded Solutions (77) 27 (44) (70) (163)Impairment charges Extruded Solutions - 28 95 132 255Significant rationalization charges and closure costs Extruded Solutions - 200 61 135 396Pension Extruded Solutions - - (62) - (62)Transaction related effects Extruded Solutions - 35 - (14) 21Other effects Extruded Solutions 26 - 59 125 209Total impact Extruded Solutions (51) 289 109 308 656Unrealized derivative effects on power contracts Energy 6 2 1 (15) (6)Other effects Energy - - (42) - (42)Total impact Energy 6 2 (41) (15) (48)Unrealized derivative effects on power contracts Other and eliminations (21) (39) (5) (10) (75)Unrealized derivative effects on LME related contracts Other and eliminations 10 1 (7) 7 11Total impact Other and eliminations (11) (39) (12) (2) (64)Items excluded from underlying EBIT Hydro 539 219 1 144 959 2 860Net foreign exchange (gain)/loss Hydro (208) 451 1 403 (442) 1 204Items excluded from underlying income (loss) before tax Hydro 331 670 2 547 517 4 064Calculated income tax effect Hydro (83) (198) (550) (154) (986)Items excluded from underlying net income (loss) Hydro 248 472 1 996 362 3 078

Items excluded from underlying results - 2018
NOK million (+=loss/()=gain) Q1 2018 Q2 2018 Q3 2018 Q4 2018 Year 2018Alunorte agreements - provision Bauxite & Alumina - - 519 - 519Total impact Bauxite & Alumina - - 519 - 519Unrealized derivative effects on LME related contracts Primary Metal (114) (41) 101 (89) (143)Unrealized effects on power contracts Primary Metal 20 20 (194) (64) (218)Total impact Primary Metal (94) (21) (93) (153) (361)Unrealized derivative effects on LME related contracts Metal Markets (128) (32) 104 (144) (200)Total impact Metal Markets (128) (32) 104 (144) (200)Unrealized derivative effects on LME related contracts Rolled Products 108 (82) 11 74 111Metal effect Rolled Products 47 (60) (153) 93 (73)Significant rationalization charges and closure costs Rolled Products - - - 39 39Total impact Rolled Products 154 (142) (141) 206 77Unrealized derivative effects on LME related contracts Extruded Solutions 47 (151) 211 192 299Significant rationalization charges and closure costs Extruded Solutions - - - 40 40Pension Extruded Solutions - - - 40 40Other effects Extruded Solutions - - - 237 237Total impact Extruded Solutions 47 (151) 211 509 616Unrealized derivative effects on power contracts Energy - - - (7) (7)Total impact Energy - - - (7) (7)Unrealized derivative effects on power contracts Other and eliminations (107) 72 11 (11) (36)Unrealized derivative effects on LME related contracts Other and eliminations (26) 1 8 (11) (27)Other effects Other and eliminations - - - (34) (34)Total impact Other and eliminations (134) 73 19 (56) (97)Items excluded from underlying EBIT Hydro (155) (274) 620 356 547Net foreign exchange (gain)/loss Hydro 333 306 257 408 1 303Items excluded from underlying income (loss) before tax Hydro 178 32 877 764 1 851Calculated income tax effect Hydro (54) (8) (105) (188) (355)Items excluded from underlying net income (loss) Hydro 125 24 772 575 1 495
46

Underlying EBIT
Underlying EBITDA
Operating segment information
47Extruded Solutions reflected as 50% equity accounted investment Q1 2017-Q3 2017 and fully consolidated in Q4 2017
NOK million Q1 2017 Q2 2017 Q3 2017 Q4 2017 Q1 2018 Q2 2018 Q3 2018 Q4 2018 Q1 2019 Q2 2019 Q3 2019 Q4 2019 Year 2017 Year 2018 Year 2019
Bauxite & Alumina 756 662 413 1 872 741 364 685 493 153 415 481 (75) 3 704 2 282 974
Primary Metal 900 1 486 1 298 1 377 823 755 861 (677) (771) (604) (39) 155 5 061 1 762 (1 259)
Metal Markets 24 244 91 185 178 237 (3) 275 190 299 362 132 544 686 983
Rolled Products 106 84 95 95 232 212 82 (113) 138 75 166 34 380 413 413
Extruded Solutions 281 329 209 284 734 957 497 202 593 772 559 85 1 103 2 390 2 009
Energy 423 284 368 457 278 417 652 500 517 176 254 296 1 531 1 846 1 243
Other and Eliminations (207) (159) (28) (715) 161 (229) (97) (145) (261) (258) (417) (67) (1 108) (310) (1 003)
Total 2 284 2 930 2 446 3 555 3 147 2 713 2 676 534 559 875 1 366 560 11 215 9 069 3 359
NOK million Q1 2017 Q2 2017 Q3 2017 Q4 2017 Q1 2018 Q2 2018 Q3 2018 Q4 2018 Q1 2019 Q2 2019 Q3 2019 Q4 2019 Year 2017 Year 2018 Year 2019
Bauxite & Alumina 1 334 1 248 1 057 2 551 1 370 937 1 193 877 758 1 004 1 071 504 6 190 4 377 3 337
Primary Metal 1 392 1 991 1 795 1 900 1 349 1 309 1 424 (176) (180) (27) 550 812 7 078 3 906 1 155
Metal Markets 47 268 114 209 201 262 22 301 219 328 395 167 638 786 1 110
Rolled Products 307 297 312 325 456 438 314 133 384 326 430 308 1 240 1 340 1 448
Extruded Solutions 281 329 209 728 1 155 1 383 931 645 1 099 1 279 1 099 655 1 547 4 114 4 132
Energy 476 337 424 519 339 479 716 566 583 242 319 365 1 757 2 100 1 509
Other and Eliminations (200) (151) (21) (708) 169 (223) (90) (135) (231) (224) (385) (19) (1 081) (280) (859)
Total 3 637 4 319 3 889 5 524 5 038 4 586 4 510 2 210 2 633 2 928 3 479 2 792 17 369 16 344 11 832

NOK million Q1 2017 Q2 2017 Q3 2017 Q4 2017 Q1 2018 Q2 2018 Q3 2018 Q4 2018 Q1 2019 Q2 2019 Q3 2019 Q4 2019 Year 2017 Year 2018 Year 2019
Bauxite & Alumina 756 662 413 1 872 741 364 166 493 118 401 450 (221) 3 704 1 763 749
Primary Metal 797 1 538 1 282 1 112 917 776 954 (524) (919) (554) 30 (394) 4 729 2 123 (1 838)
Metal Markets (13) 282 59 158 305 270 (107) 419 (31) 361 381 38 485 886 748
Rolled Products 450 84 (22) - 78 353 223 (319) (53) 12 (978) 155 512 336 (865)
Extruded Solutions 313 273 215 1 722 687 1 109 286 (307) 644 483 449 (223) 2 522 1 774 1 353
Energy 423 284 368 457 278 417 652 507 510 174 295 312 1 531 1 853 1 291
Other and Eliminations (316) (176) 7 (810) 295 (303) (117) (89) (249) (220) (405) (65) (1 295) (214) (939)
Total 2 410 2 946 2 323 4 511 3 301 2 986 2 057 178 20 656 222 (399) 12 189 8 522 499
NOK million Q1 2017 Q2 2017 Q3 2017 Q4 2017 Q1 2018 Q2 2018 Q3 2018 Q4 2018 Q1 2019 Q2 2019 Q3 2019 Q4 2019 Year 2017 Year 2018 Year 2019
Bauxite & Alumina 1 334 1 248 1 057 2 551 1 370 937 674 877 724 989 1 040 504 6 190 3 858 3 258
Primary Metal 1 289 2 043 1 779 1 635 1 443 1 330 1 517 (23) (328) 23 619 769 6 747 4 267 1 081
Metal Markets 9 306 82 182 329 295 (82) 445 (2) 390 414 73 579 986 875
Rolled Products 651 296 196 230 302 580 455 (73) 194 263 (715) 429 1 372 1 263 170
Extruded Solutions 313 273 215 2 166 1 108 1 534 720 136 1 150 1 017 1 085 479 2 966 3 498 3 731
Energy 476 337 424 519 339 479 716 573 576 240 361 380 1 757 2 107 1 558
Other and Eliminations (310) (168) 13 (803) 302 (296) (110) (80) (219) (186) (373) (17) (1 268) (183) (795)
Total 3 762 4 335 3 766 6 481 5 193 4 860 3 890 1 854 2 094 2 737 2 430 2 617 18 344 15 796 9 878
Operating segment information
48Extruded Solutions reflected as 50% equity accounted investment Q1 2017-Q3 2017 and fully consolidated in Q4 2017
EBIT
EBITDA

Operating segment information
49
Total revenue
External revenue
NOK million Q1 2017 Q2 2017 Q3 2017 Q4 2017 Q1 2018 Q2 2018 Q3 2018 Q4 2018 Q1 2019 Q2 2019 Q3 2019 Q4 2019 Year 2017 Year 2018 Year 2019
Bauxite & Alumina 5 911 5 858 5 612 8 040 6 309 6 877 6 749 8 613 4 866 5 745 6 211 5 983 25 421 28 548 22 805
Primary Metal 8 641 9 575 8 958 9 291 10 170 10 083 9 984 9 196 9 023 8 937 8 718 8 497 36 466 39 434 35 175
Metal Markets 12 149 13 604 11 862 12 991 13 898 14 205 13 230 12 903 12 959 13 301 12 326 11 866 50 606 54 237 50 452
Rolled Products 6 277 6 569 6 435 6 434 6 797 7 145 6 791 6 223 6 844 6 623 6 672 6 192 25 715 26 955 26 331
Extruded Solutions 14 153 15 911 16 980 15 976 15 218 16 013 17 270 15 233 13 835 14 153 64 085 62 351
Energy 1 955 1 750 1 831 2 169 1 762 2 163 2 488 2 267 2 261 1 815 1 990 2 155 7 705 8 681 8 221
Other and Eliminations (11 906) (12 765) (11 900) (14 276) (14 877) (16 198) (15 452) (16 034) (14 382) (14 515) (13 633) (13 039) (50 847) (62 562) (55 569)
Total 23 026 24 591 22 799 38 803 39 971 41 254 39 766 38 386 37 583 39 176 37 517 35 490 109 220 159 377 149 766
NOK million Q1 2017 Q2 2017 Q3 2017 Q4 2017 Q1 2018 Q2 2018 Q3 2018 Q4 2018 Q1 2019 Q2 2019 Q3 2019 Q4 2019 Year 2017 Year 2018 Year 2019
Bauxite & Alumina 3 382 3 417 3 293 5 095 3 509 3 640 3 016 4 232 2 370 2 692 3 684 3 509 15 188 14 396 12 255
Primary Metal 1 700 1 944 1 865 2 068 2 018 1 993 2 312 1 505 1 390 1 457 1 642 1 651 7 578 7 829 6 141
Metal Markets 11 094 12 080 10 675 10 414 10 901 10 905 10 575 10 121 10 139 10 577 9 742 9 706 44 264 42 502 40 164
Rolled Products 6 153 6 629 6 380 6 375 6 870 7 011 6 773 6 287 6 777 6 654 6 639 6 109 25 538 26 940 26 179
Extruded Solutions 14 083 15 932 16 877 15 934 15 280 15 924 17 271 15 214 13 801 14 083 64 023 62 211
Energy 687 514 582 767 738 823 1 151 961 983 519 594 712 2 550 3 673 2 808
Other and Eliminations 9 6 3 - 4 6 5 (1) - 5 1 2 18 14 8
Total 23 026 24 591 22 799 38 803 39 971 41 254 39 766 38 386 37 583 39 176 37 517 35 490 109 220 159 377 149 766

Operating segment information
50Extruded Solutions reflected as 50% equity accounted investment Q1 2017-Q3 2017 and fully consolidated in Q4 2017
Internal revenue
Share of profit /(loss) in equity accounted investments
NOK million Q1 2017 Q2 2017 Q3 2017 Q4 2017 Q1 2018 Q2 2018 Q3 2018 Q4 2018 Q1 2019 Q2 2019 Q3 2019 Q4 2019 Year 2017 Year 2018 Year 2019
Bauxite & Alumina 2 528 2 441 2 320 2 944 2 800 3 237 3 733 4 381 2 496 3 052 2 527 2 474 10 234 14 152 10 550
Primary Metal 6 941 7 631 7 093 7 223 8 152 8 090 7 672 7 691 7 633 7 480 7 075 6 846 28 888 31 605 29 035
Metal Markets 1 054 1 523 1 187 2 577 2 997 3 301 2 656 2 781 2 820 2 724 2 584 2 160 6 341 11 735 10 287
Rolled Products 124 (61) 55 59 (72) 134 18 (64) 66 (31) 33 83 178 15 152
Extruded Solutions 70 (21) 103 42 (62) 89 (1) 18 34 70 61 140
Energy 1 267 1 236 1 249 1 403 1 024 1 340 1 337 1 306 1 278 1 296 1 397 1 444 5 155 5 007 5 414
Other and Eliminations (11 915) (12 772) (11 903) (14 276) (14 881) (16 204) (15 457) (16 033) (14 382) (14 520) (13 634) (13 040) (50 865) (62 576) (55 577)
Total - - - - - - - - - - - - - - -
NOK million Q1 2017 Q2 2017 Q3 2017 Q4 2017 Q1 2018 Q2 2018 Q3 2018 Q4 2018 Q1 2019 Q2 2019 Q3 2019 Q4 2019 Year 2017 Year 2018 Year 2019
Bauxite & Alumina - - - - - - - - - - - - - - -
Primary Metal 98 231 159 258 210 280 238 (5) 32 24 150 65 745 722 270
Metal Markets - - - - - - - - - - - - - - -
Rolled Products - - - - - - - - - - - - - - -
Extruded Solutions 313 273 215 12 17 11 14 10 12 5 - - 812 53 18
Energy - - - (7) (10) (11) (4) (11) (9) (9) (4) (7) (7) (35) (29)
Other and Eliminations (1) (13) (3) (7) 3 5 (20) 35 (32) 27 (23) 10 (24) 24 (18)
Total 409 491 371 256 221 286 229 30 3 47 123 68 1 527 765 241

Operating segment information
511) RoaCE at business area level is calculated using 25% tax rate (30% tax rate applied for years prior to 2017). For Energy, 70% tax rate is used for 2018, 65% for 2017, 60% for 2016 and 55% for prior years. 2018 RoaCE has been restated due to the change in definition. 2) Extruded Solutions reflected as 50% equity accounted investment Q1-Q3 2017 and fully consolidated from Q4 2017
Return on average capital employed 1) (RoaCE)
Capital employed – upstream focus
NOK million Dec 31, 2019
Bauxite & Alumina 27 794Primary Metal 33 326Metal Markets 2 464Rolled Products 11 742Extruded Solutions 25 660Energy 1 495Other and Eliminations (6 824)
Total 95 841
Reported RoaCE Underlying RoaCE
2019 2018 2017 2016 2015 2014 2013 2019 2018 2017 2016 2015 2014 2013
Bauxite & Alumina 1.9% 4.6% 8.5% 2.7 % 5.3 % (0.1) % (2.5) % 2.5% 6.0% 8.5% 2.8 % 5.3 % (0.1) % (2.2) %
Primary Metal (3,9%) 5.6% 11.8% 5.2 % 10.7 % 10.4 % 2.3 % (2.6%) 4.7% 12.6% 5.2 % 11.0 % 10.4 % 3.9 %
Metal Markets 20,7% 25.1% 18.6% 19.6 % 5.4 % 21.9 % 22.3 % 27.3% 19.4% 20.9% 15.9 % 11.4 % 19.4 % 19.9 %
Rolled Products (5,0%) 1.9% 3.2% 6.2 % 1.1 % 8.6 % 0.7 % 2.4% 2.3% 2.4% 4.6 % 7.8 % 5.3 % 5.2 %
Extruded Solutions 2) 3,8% 5.3% 13.4% 5.7% 7.2% 6.6%
Energy 14,7% 19.4% 17.5% 18.1 % 17.2 % 17.4 % 36.1 % 12.8% 19.3% 17.5% 18.1 % 17.3 % 17.4 % 36.1 %
Hydro Group (0,9%) 6.0% 11.2% 6.5 % 7.5 % 4.9 % 1.1 % 1.3% 6.6% 9.6% 5.1 % 9.2 % 5.2 % 2.3 %
Graph excludes BNOK (6.8) in capital employed in Other and Eliminations
Bauxite & Alumina 27%
Primary Metal33%
Metal Markets2%
Rolled Products11%
Extruded Solutions 25%
Energy 1%
NOK million Q1 2017 Q2 2017 Q3 2017 Q4 2017 Q1 2018 Q2 2018 Q3 2018 Q4 2018 Q1 2019 Q2 2019 Q3 2019 Q4 2019 Year 2017 Year 2018 Year 2019
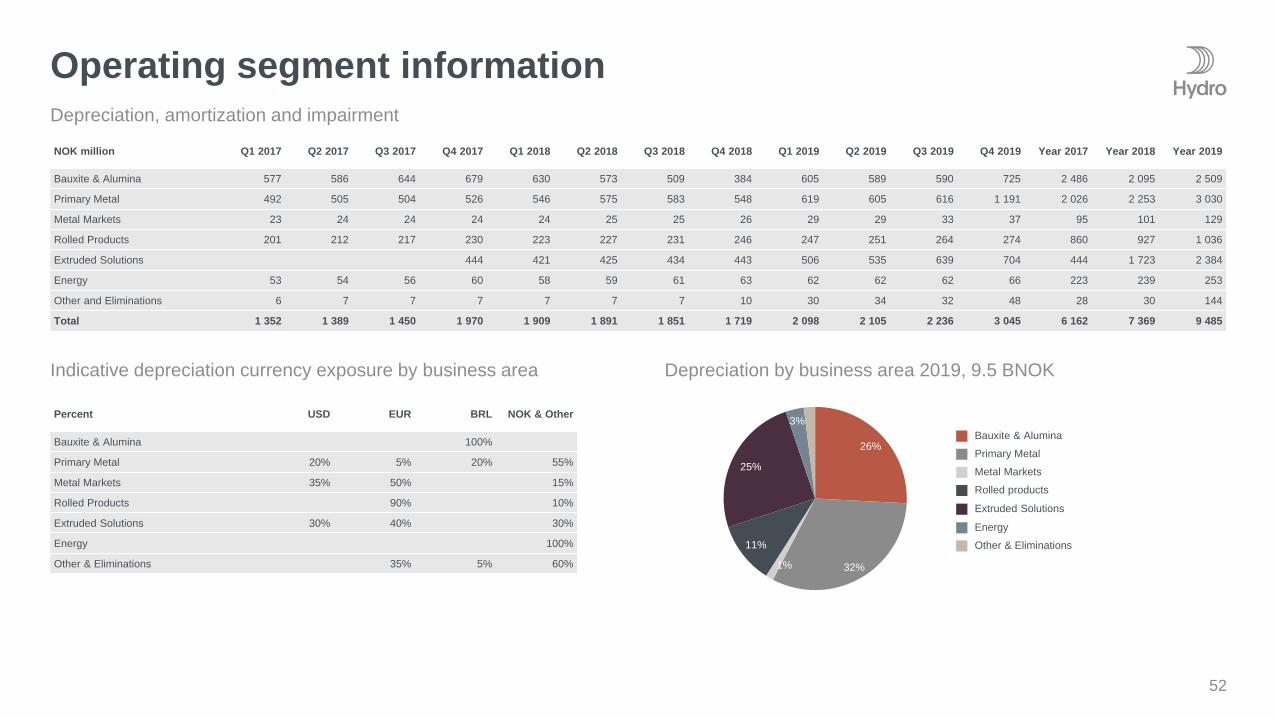
Bauxite & Alumina 577 586 644 679 630 573 509 384 605 589 590 725 2 486 2 095 2 509
Primary Metal 492 505 504 526 546 575 583 548 619 605 616 1 191 2 026 2 253 3 030
Metal Markets 23 24 24 24 24 25 25 26 29 29 33 37 95 101 129
Rolled Products 201 212 217 230 223 227 231 246 247 251 264 274 860 927 1 036
Extruded Solutions 444 421 425 434 443 506 535 639 704 444 1 723 2 384
Energy 53 54 56 60 58 59 61 63 62 62 62 66 223 239 253
Other and Eliminations 6 7 7 7 7 7 7 10 30 34 32 48 28 30 144
Total 1 352 1 389 1 450 1 970 1 909 1 891 1 851 1 719 2 098 2 105 2 236 3 045 6 162 7 369 9 485
Operating segment information
52
Depreciation, amortization and impairment
Indicative depreciation currency exposure by business area Depreciation by business area 2019, 9.5 BNOK
Percent USD EUR BRL NOK & Other
Bauxite & Alumina 100%
Primary Metal 20% 5% 20% 55%
Metal Markets 35% 50% 15%
Rolled Products 90% 10%
Extruded Solutions 30% 40% 30%
Energy 100%
Other & Eliminations 35% 5% 60%
Other & Eliminations
Rolled products
Energy
Bauxite & Alumina
Primary Metal
Metal Markets
Extruded Solutions
26%
32%1%
11%
25%
3%
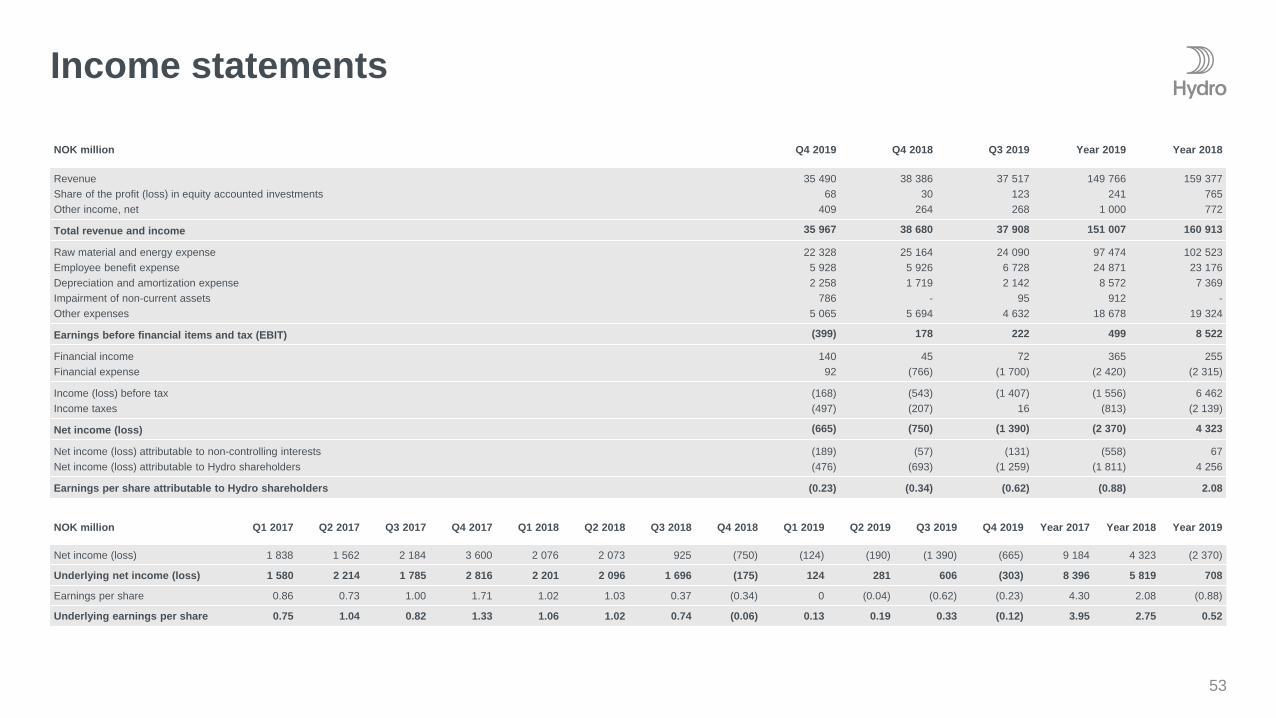
Income statements
53
NOK million Q1 2017 Q2 2017 Q3 2017 Q4 2017 Q1 2018 Q2 2018 Q3 2018 Q4 2018 Q1 2019 Q2 2019 Q3 2019 Q4 2019 Year 2017 Year 2018 Year 2019
Net income (loss) 1 838 1 562 2 184 3 600 2 076 2 073 925 (750) (124) (190) (1 390) (665) 9 184 4 323 (2 370)
Underlying net income (loss) 1 580 2 214 1 785 2 816 2 201 2 096 1 696 (175) 124 281 606 (303) 8 396 5 819 708
Earnings per share 0.86 0.73 1.00 1.71 1.02 1.03 0.37 (0.34) 0 (0.04) (0.62) (0.23) 4.30 2.08 (0.88)
Underlying earnings per share 0.75 1.04 0.82 1.33 1.06 1.02 0.74 (0.06) 0.13 0.19 0.33 (0.12) 3.95 2.75 0.52
NOK million Q4 2019 Q4 2018 Q3 2019 Year 2019 Year 2018
RevenueShare of the profit (loss) in equity accounted investmentsOther income, net
35 49068
409
38 38630
264
37 517123268
149 766241
1 000
159 377765772
Total revenue and income 35 967 38 680 37 908 151 007 160 913
Raw material and energy expenseEmployee benefit expenseDepreciation and amortization expenseImpairment of non-current assetsOther expenses
22 3285 9282 258
7865 065
25 1645 9261 719
-5 694
24 0906 7282 142
954 632
97 47424 871
8 572912
18 678
102 52323 176
7 369-
19 324
Earnings before financial items and tax (EBIT) (399) 178 222 499 8 522
Financial incomeFinancial expense
14092
45(766)
72(1 700)
365(2 420)
255(2 315)
Income (loss) before taxIncome taxes
(168)(497)
(543)(207)
(1 407)16
(1 556)(813)
6 462(2 139)
Net income (loss) (665) (750) (1 390) (2 370) 4 323
Net income (loss) attributable to non-controlling interestsNet income (loss) attributable to Hydro shareholders
(189)(476)
(57)(693)
(131)(1 259)
(558)(1 811)
674 256
Earnings per share attributable to Hydro shareholders (0.23) (0.34) (0.62) (0.88) 2.08

Balance sheet
541) Restated
NOK million Dec 31, 2019 Sep 30, 2019 Jun 30, 2019 Mar 31, 2019 Dec 31 20181) Sep 30 2018 Jun 30 2018 Mar 31 2018
Cash and cash equivalentsShort-term investmentsAccounts receivableInventoriesOther current assets
12 286969
18 95920 816
635
10 581929
23 00721 679
700
10 5901 090
23 18622 718
471
6 0991 274
23 54225 004
349
5 995975
20 74426 483
801
6 8461 176
21 72723 916
738
5 6821 136
23 44222 337
978
9 3711 031
22 78520 626
818
Property, plant and equipmentIntangible assetsInvestments accounted for using the equity methodPrepaid pensionOther non-current assets
74 24311 50111 501
6 6766 815
74 02511 69511 809
5 7216 877
73 19311 48510 936
5 9867 322
72 88211 13311 349
5 8547 157
74 36911 44311 570
5 1627 385
66 25110 69511 094
6 8575 962
66 68311 66011 140
6 3225 780
69 94512 13310 551
5 9335 588
Total assets 164 401 167 025 166 978 164 644 164 928 155 261 155 159 158 781
Bank-loans and other interest-bearing short-term debtTrade and other payablesOther current liabilities
6 15718 692
4 842
6 07419 716
4 095
8 17721 014
3 688
8 91322 146
4 674
9 37320 381
6 062
6 60719 906
5 897
4 96921 351
4 976
5 26920 621
4 852
Long-term debtProvisionsPension liabilitiesDeferred tax liabilitiesOther non-current liabilities
18 8586 515
17 0993 1325 025
19 9856 283
17 8792 9115 435
18 6205 577
16 6463 1234 536
10 5595 673
15 9813 0524 252
9 3425 588
15 6483 0314 746
7 8865 358
14 4163 9523 756
9 3775 532
14 6653 4563 673
8 7465 652
14 9113 5224 084
Equity attributable to Hydro shareholdersNon-controlling interests
79 9324 148
80 2754 371
81 1434 452
84 6924 703
85 8204 936
83 0124 472
82 6764 486
86 2334 891
Total liabilities and equity 164 401 167 025 166 978 164 644 164 928 155 261 155 159 158 781
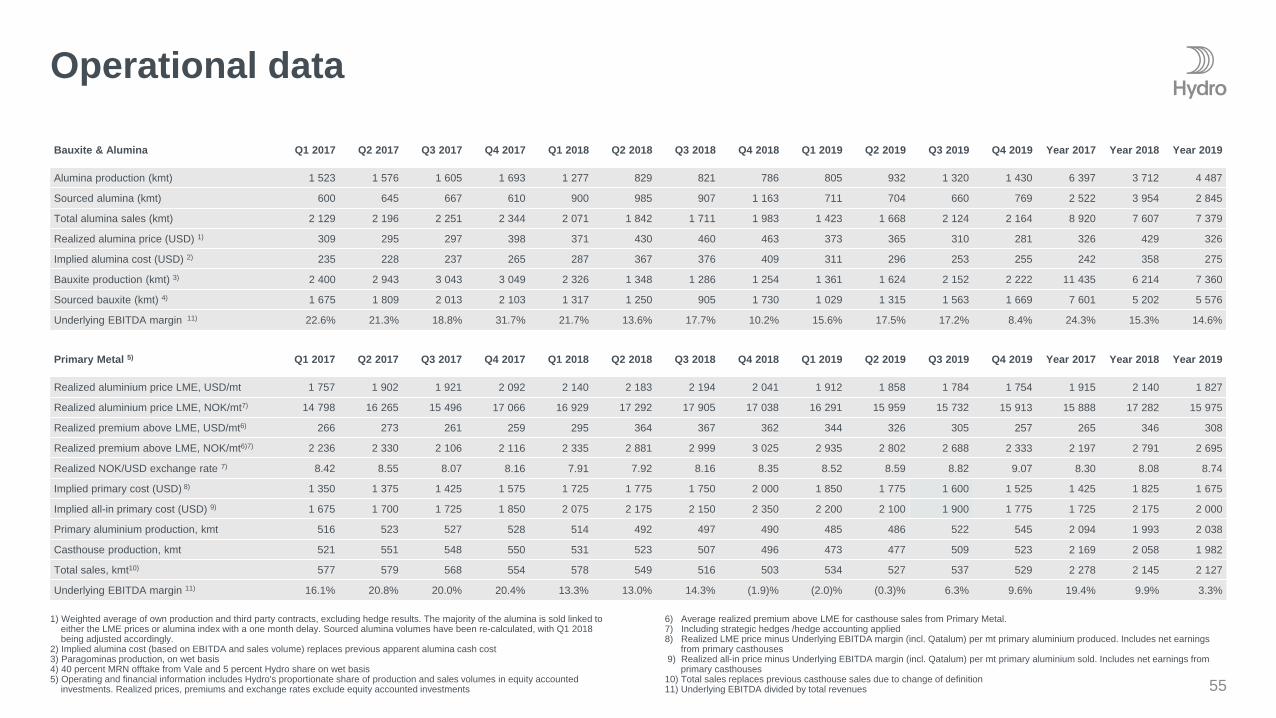
Operational data
55
1) Weighted average of own production and third party contracts, excluding hedge results. The majority of the alumina is sold linked to either the LME prices or alumina index with a one month delay. Sourced alumina volumes have been re-calculated, with Q1 2018being adjusted accordingly.
2) Implied alumina cost (based on EBITDA and sales volume) replaces previous apparent alumina cash cost3) Paragominas production, on wet basis4) 40 percent MRN offtake from Vale and 5 percent Hydro share on wet basis5) Operating and financial information includes Hydro's proportionate share of production and sales volumes in equity accounted
investments. Realized prices, premiums and exchange rates exclude equity accounted investments
6) Average realized premium above LME for casthouse sales from Primary Metal. 7) Including strategic hedges /hedge accounting applied8) Realized LME price minus Underlying EBITDA margin (incl. Qatalum) per mt primary aluminium produced. Includes net earnings
from primary casthouses9) Realized all-in price minus Underlying EBITDA margin (incl. Qatalum) per mt primary aluminium sold. Includes net earnings from
primary casthouses10) Total sales replaces previous casthouse sales due to change of definition11) Underlying EBITDA divided by total revenues
Bauxite & Alumina Q1 2017 Q2 2017 Q3 2017 Q4 2017 Q1 2018 Q2 2018 Q3 2018 Q4 2018 Q1 2019 Q2 2019 Q3 2019 Q4 2019 Year 2017 Year 2018 Year 2019
Alumina production (kmt) 1 523 1 576 1 605 1 693 1 277 829 821 786 805 932 1 320 1 430 6 397 3 712 4 487
Sourced alumina (kmt) 600 645 667 610 900 985 907 1 163 711 704 660 769 2 522 3 954 2 845
Total alumina sales (kmt) 2 129 2 196 2 251 2 344 2 071 1 842 1 711 1 983 1 423 1 668 2 124 2 164 8 920 7 607 7 379
Realized alumina price (USD) 1) 309 295 297 398 371 430 460 463 373 365 310 281 326 429 326
Implied alumina cost (USD) 2) 235 228 237 265 287 367 376 409 311 296 253 255 242 358 275
Bauxite production (kmt) 3) 2 400 2 943 3 043 3 049 2 326 1 348 1 286 1 254 1 361 1 624 2 152 2 222 11 435 6 214 7 360
Sourced bauxite (kmt) 4) 1 675 1 809 2 013 2 103 1 317 1 250 905 1 730 1 029 1 315 1 563 1 669 7 601 5 202 5 576
Underlying EBITDA margin 11) 22.6% 21.3% 18.8% 31.7% 21.7% 13.6% 17.7% 10.2% 15.6% 17.5% 17.2% 8.4% 24.3% 15.3% 14.6%
Primary Metal 5) Q1 2017 Q2 2017 Q3 2017 Q4 2017 Q1 2018 Q2 2018 Q3 2018 Q4 2018 Q1 2019 Q2 2019 Q3 2019 Q4 2019 Year 2017 Year 2018 Year 2019
Realized aluminium price LME, USD/mt 1 757 1 902 1 921 2 092 2 140 2 183 2 194 2 041 1 912 1 858 1 784 1 754 1 915 2 140 1 827
Realized aluminium price LME, NOK/mt7) 14 798 16 265 15 496 17 066 16 929 17 292 17 905 17 038 16 291 15 959 15 732 15 913 15 888 17 282 15 975
Realized premium above LME, USD/mt6) 266 273 261 259 295 364 367 362 344 326 305 257 265 346 308
Realized premium above LME, NOK/mt6)7) 2 236 2 330 2 106 2 116 2 335 2 881 2 999 3 025 2 935 2 802 2 688 2 333 2 197 2 791 2 695
Realized NOK/USD exchange rate 7) 8.42 8.55 8.07 8.16 7.91 7.92 8.16 8.35 8.52 8.59 8.82 9.07 8.30 8.08 8.74
Implied primary cost (USD) 8) 1 350 1 375 1 425 1 575 1 725 1 775 1 750 2 000 1 850 1 775 1 600 1 525 1 425 1 825 1 675
Implied all-in primary cost (USD) 9) 1 675 1 700 1 725 1 850 2 075 2 175 2 150 2 350 2 200 2 100 1 900 1 775 1 725 2 175 2 000
Primary aluminium production, kmt 516 523 527 528 514 492 497 490 485 486 522 545 2 094 1 993 2 038
Casthouse production, kmt 521 551 548 550 531 523 507 496 473 477 509 523 2 169 2 058 1 982
Total sales, kmt10) 577 579 568 554 578 549 516 503 534 527 537 529 2 278 2 145 2 127
Underlying EBITDA margin 11) 16.1% 20.8% 20.0% 20.4% 13.3% 13.0% 14.3% (1.9)% (2.0)% (0.3)% 6.3% 9.6% 19.4% 9.9% 3.3%

Operational data
561) Includes external and internal sales from primary casthouse operations, remelters and third party Metal sources 2) Underlying EBITDA divided by total revenues3) FY 2017 and historical operational data based on pro forma figures
Metal Markets Q1 2017 Q2 2017 Q3 2017 Q4 2017 Q1 2018 Q2 2018 Q3 2018 Q4 2018 Q1 2019 Q2 2019 Q3 2019 Q4 2019 Year 2017 Year 2018 Year 2019
Remelt production (1 000 mt) 143 152 136 137 150 153 126 135 131 139 125 121 568 563 516
Third-party Metal Products sales (1 000 mt) 79 80 74 86 70 77 83 73 70 83 82 82 319 304 317
Metal Products sales excl. ingot trading (1 000 mt) 1) 735 759 707 720 745 746 685 682 683 707 662 648 2 921 2 859 2 700
Hereof external sales excl. ingot trading (1 000 mt) 672 675 639 589 580 563 543 532 539 556 517 536 2 575 2 217 2 149
External revenue (NOK million) 11 094 12 080 10 675 10 414 10 901 10 905 10 575 10 121 10 139 10 577 9 742 9 706 44 264 42 502 40 164
Rolled Products Q1 2017 Q2 2017 Q3 2017 Q4 2017 Q1 2018 Q2 2018 Q3 2018 Q4 2018 Q1 2019 Q2 2019 Q3 2019 Q4 2019 Year 2017 Year 2018 Year 2019
Rolled Products external shipments (1 000 mt) 241 239 236 224 245 251 235 220 246 242 245 219 940 951 952
Rolled Products – Underlying EBIT per mt, NOK 442 351 400 424 949 844 349 (512) 560 309 678 156 404 435 434
Underlying EBITDA margin 2) 4.9% 4.5% 4.8% 5.0% 6.7% 6.1% 4.6% 2.1% 5.6% 4.9% 6.4% 5.0% 4.8 % 5.0% 5.5%
Energy Q1 2017 Q2 2017 Q3 2017 Q4 2017 Q1 2018 Q2 2018 Q3 2018 Q4 2018 Q1 2019 Q2 2019 Q3 2019 Q4 2019 Year 2017 Year 2018 Year 2019
Power production, GWh 2 869 2 369 2 509 3 089 2 433 2 550 2 888 2 822 2 553 1 993 2 273 2 332 10 835 10 693 9 150
Net spot sales, GWh 1 409 996 1 168 1 633 763 961 1 315 1 166 770 289 582 520 5 206 4 204 2 161
Nordic spot electricity price, NOK/MWh 280 257 266 294 372 373 484 460 457 346 342 390 274 423 384
Southern Norway spot electricity price (NO2), NOK/MWh
278 252 258 287 361 369 475 455 468 360 328 392 269 415 387
Underlying EBITDA margin 2) 24.4% 19.3% 23.1% 23.9 % 19.2% 22.2% 28.8% 24.9% 25.8% 13.4% 16.0% 16.9% 22.8% 24.2% 18.4%
Extruded Solutions3) Q1 2017 Q2 2017 Q3 2017 Q4 2017 Q1 2018 Q2 2018 Q3 2018 Q4 2018 Q1 2019 Q2 2019 Q3 2019 Q4 2019 Year 2017 Year 2018 Year 2019
Extruded Solutions external shipments (1 000 mt) 355 359 339 318 362 373 343 318 333 348 316 272 1 372 1 396 1 269
Extruded Solutions – Pro-forma underlying EBIT per mt, NOK
1 973 2 328 1 505 893 2 028 2 566 1 449 635 1 781 2 219 1 769 311 1 699 1 712 1 583
Underlying EBITDA margin 2) 7.7% 8.2% 6.5% 5.2% 7.3% 8.1% 5.8% 4.2% 6.9% 7.4% 7.2% 4.7% 6.9% 6.4% 6.6%
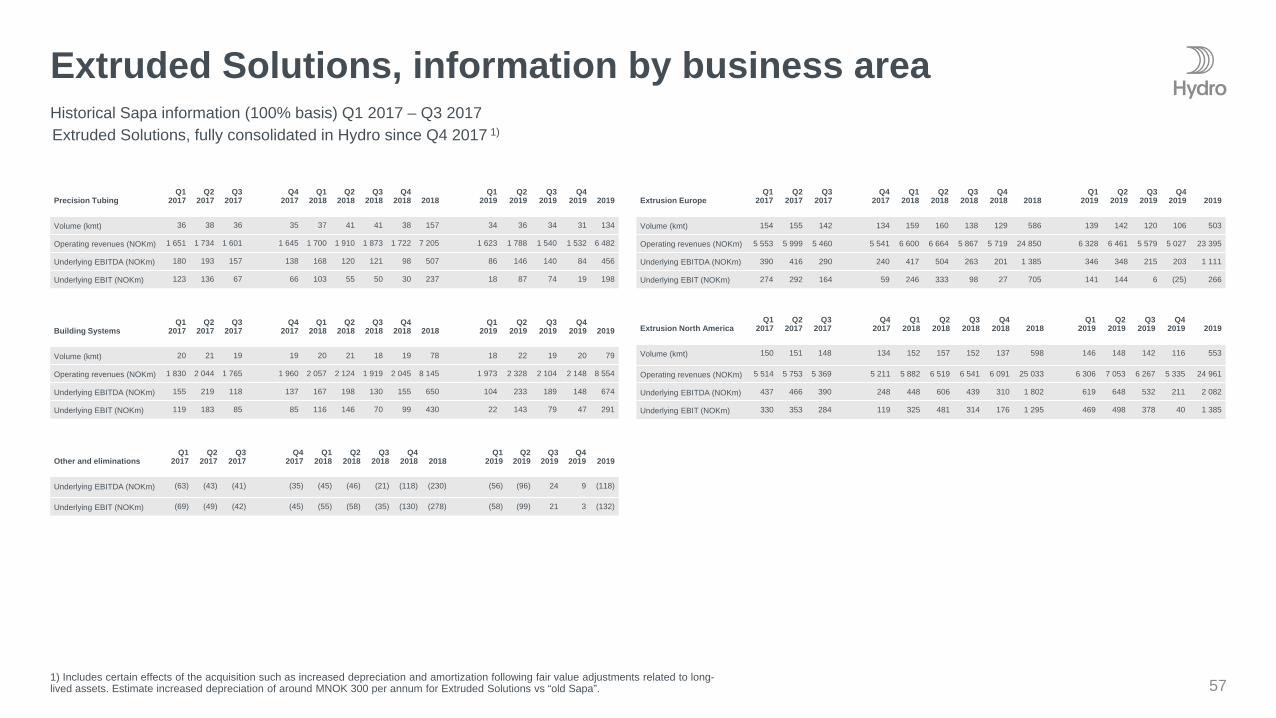
Extruded Solutions, information by business area
571) Includes certain effects of the acquisition such as increased depreciation and amortization following fair value adjustments related to long-lived assets. Estimate increased depreciation of around MNOK 300 per annum for Extruded Solutions vs “old Sapa”.
Historical Sapa information (100% basis) Q1 2017 – Q3 2017Extruded Solutions, fully consolidated in Hydro since Q4 2017 1)
Precision TubingQ1
2017Q2
2017Q3
2017Q4
2017Q1
2018Q2
2018Q3
2018Q4
2018 2018Q1
2019Q2
2019Q3
2019Q4
2019 2019
Volume (kmt) 36 38 36 35 37 41 41 38 157 34 36 34 31 134
Operating revenues (NOKm) 1 651 1 734 1 601 1 645 1 700 1 910 1 873 1 722 7 205 1 623 1 788 1 540 1 532 6 482
Underlying EBITDA (NOKm) 180 193 157 138 168 120 121 98 507 86 146 140 84 456
Underlying EBIT (NOKm) 123 136 67 66 103 55 50 30 237 18 87 74 19 198
Building SystemsQ1
2017Q2
2017Q3
2017Q4
2017Q1
2018Q2
2018Q3
2018Q4
2018 2018Q1
2019Q2
2019Q3
2019Q4
2019 2019
Volume (kmt) 20 21 19 19 20 21 18 19 78 18 22 19 20 79
Operating revenues (NOKm) 1 830 2 044 1 765 1 960 2 057 2 124 1 919 2 045 8 145 1 973 2 328 2 104 2 148 8 554
Underlying EBITDA (NOKm) 155 219 118 137 167 198 130 155 650 104 233 189 148 674
Underlying EBIT (NOKm) 119 183 85 85 116 146 70 99 430 22 143 79 47 291
Extrusion EuropeQ1
2017Q2
2017Q3
2017Q4
2017Q1
2018Q2
2018Q3
2018Q4
2018 2018Q1
2019Q2
2019Q3
2019Q4
2019 2019
Volume (kmt) 154 155 142 134 159 160 138 129 586 139 142 120 106 503
Operating revenues (NOKm) 5 553 5 999 5 460 5 541 6 600 6 664 5 867 5 719 24 850 6 328 6 461 5 579 5 027 23 395
Underlying EBITDA (NOKm) 390 416 290 240 417 504 263 201 1 385 346 348 215 203 1 111
Underlying EBIT (NOKm) 274 292 164 59 246 333 98 27 705 141 144 6 (25) 266
Extrusion North AmericaQ1
2017Q2
2017Q3
2017Q4
2017Q1
2018Q2
2018Q3
2018Q4
2018 2018Q1
2019Q2
2019Q3
2019Q4
2019 2019
Volume (kmt) 150 151 148 134 152 157 152 137 598 146 148 142 116 553
Operating revenues (NOKm) 5 514 5 753 5 369 5 211 5 882 6 519 6 541 6 091 25 033 6 306 7 053 6 267 5 335 24 961
Underlying EBITDA (NOKm) 437 466 390 248 448 606 439 310 1 802 619 648 532 211 2 082
Underlying EBIT (NOKm) 330 353 284 119 325 481 314 176 1 295 469 498 378 40 1 385
Other and eliminationsQ1
2017Q2
2017Q3
2017Q4
2017Q1
2018Q2
2018Q3
2018Q4
2018 2018Q1
2019Q2
2019Q3
2019Q4
2019 2019
Underlying EBITDA (NOKm) (63) (43) (41) (35) (45) (46) (21) (118) (230) (56) (96) 24 9 (118)
Underlying EBIT (NOKm) (69) (49) (42) (45) (55) (58) (35) (130) (278) (58) (99) 21 3 (132)

Investor Relations in Hydro
58
Next eventsFirst quarter resultsApril 29, 2020
For more information seewww.hydro.com/ir
Stian HasleHead of Investor Relations
t: +47 97736022e: [email protected]
Aud Helen HalvorsenInvestor Relations Assistant
t: +47 95182741e: [email protected]
Olena LepikhinaInvestor Relations Officer
t: +47 96853035e: [email protected]