Embed Size (px)
Citation preview

1Eureka Presentation
FOURTH QUARTER
2018 REPORT

2Eureka Presentation
This is the fourth quarter report of State Trading Organization plc. for the year 2018.
In compiling this report, STO has made its best efforts to adhere to the Listing Rules, the Corporate Governance Code of Capital Market Development Authority
and the Continuous Disclosure Obligation of Issuers Regulation 2010.
This report includes events for the period from 01st October 2018 to 31st December 2018.
Report was published on 30th January 2019.
Reporting Principles
Fourth Quar ter Repor t

3Eureka Presentation
KEY FACTS

4Eureka Presentation
Easy Fill Thinadhoo
opened
07 June 2018
Annual General
Meeting 2017
30 May 2018
Received CSR
Campaign of the year
award by Corporate
Maldives
22 February 2018
This Year So Far
Fourth Quar ter Repor t
Inaugurated STO
Electronics
03 February 2018
STO Hiyaa foundation
laid
27 February 2018
Maiden Voyage of MT
Alimas
28 February 2018
2 Landing crafts introduced
to fleet
03 July 2018
STO Hiyaa Housing
scheme Launched
9 July 2018
STO Express
opened
10 July 2018
Hulhumale’ Batching
plant inaugrated
01 July 2018
Campaign against
single-use plastic
12 December 2018
Celebrated 54th
Anniversary
20 December 2018

5Eureka Presentation
Financial Highlights
Fourth Quar ter Repor t
OPERATING PROFIT
MVR
119m
EPSNET PROFIT AFTER TAX
Q1/2018 – 2,224m
Q2/2018 – 2,215m
Q3/2018 – 2,398m
REVENUE
MVR
2,566mQ1/2018 – 88m
Q2/2018 – 93m
Q3/2018 – 81m
MVR
66mQ1/2018 – 47m
Q2/2018 – 47m
Q3/2018 – 47m
MVR
58Q1/2018 – 41
Q2/2018 – 42
Q3/2018 – 42

6Eureka Presentation
Human Resources
Fourth Quar ter Repor t
GENDER
35% F, 65% M
LOCAL/FOREIGN EMPLOYEES
Q1/2018 – 2,076
Q2/2018 – 2,113
Q3/2018 – 2,157
EMPLOYEES
2,164Q1/2018 F– 36%, M-64%
Q2/2018 F– 35%, M-65%
Q3/2018 F– 35%, M-65%
82% LOCAL
18% FOREIGN
Q1/2018 83% Local, 17% Foreign
Q2/2018 83% Local, 17% Foreign
Q3/2018 82% Local, 18% Foreign
* F – Female, M – Male’
*

7Eureka Presentation
STO inaugurated a campaign against single-
use plastic in the Company. As such all staff
were given reusable water bottles to use at
office.
12th December 2018
Campaign against single-use plastic
3STO celebrated 54 successful
years of service.
20th December 2018
54th Anniversary4STO participated in the Saafu Raaje cleaning
day activities organized by Ministry of
Environment.
08th December 2018
Saaf Raaje cleaning day2
Events of this Quarter
Fourth Quar ter Repor t
Danone products were introduced
to the market by STO Supermart,
including Aptamil Infant Milk and
Protinex Mama.
02nd October 2018
Introduced DannoneProducts
1
8Eureka Presentation
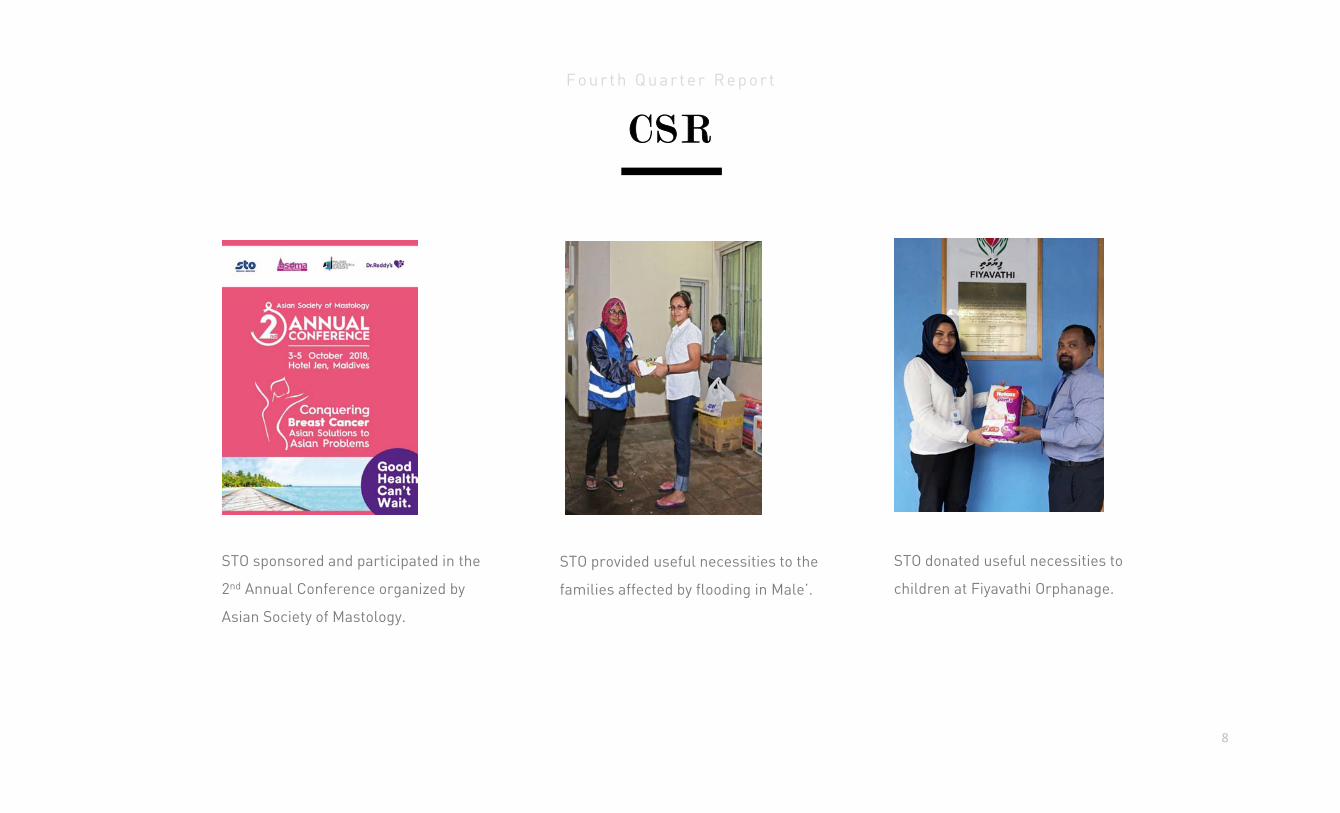
STO donated useful necessities to
children at Fiyavathi Orphanage.
CSR
Fourth Quar ter Repor t
STO sponsored and participated in the
2nd Annual Conference organized by
Asian Society of Mastology.
STO provided useful necessities to the
families affected by flooding in Male’.

9Eureka Presentation
Q1/2018 – MVR350
Q2/2018 – MVR390
Q3/2018 – MVR429
LOWEST TRADE PRICE
300M V R
Q1/2018 – MVR390
Q2/2018 – MVR420
Q3/2018 – MVR429
LAST TRADE PRICE
400M V R
Q1/2018 – MVR373
Q2/2018 – MVR416
Q3/2018 – MVR431
WATP
302M V R
Q1/2018 – MVR500
Q2/2018 – MVR430
Q3/2018 – MVR450
HIGHEST TRADE PRICE
429M V R
Share Performance
Fourth Quar ter Repor t
Q2/18
Q1/18
Q4/17
Q3/17
Q2/17
Q1/17
Q2/18
Q1/18
Q4/17
Q3/17
Q2/17
Q1/17
Q3/18
Q3/18
Q2/18
Q1/18
Q4/17
Q3/17
Q2/17
Q1/17
Q3/18
Q2/18
Q1/18
Q4/17
Q3/17
Q2/17
Q1/17
Q3/18
Q4/18
Q4/18
Q4/18
Q4/18

10Eureka Presentation
Q1/2018 – MVR440
Q2/2018 – MVR473
Q3/2018 – MVR483
(All amounts in million MVR)
MARKET CAPITALIZATION
451M V R
Q1/2018 – 13%
Q2/2018 – 13%
Q3/2018 – 13%
*
DIVIDEND YIELD
14%
Q1/2018 – 9
Q2/2018 – 10
Q3/2018 – 10
PRICE EARNING RATIO
7
Q1/2018 – MVR41
Q2/2018 – MVR42
Q3/2018 – MVR42
EPS
58M V R
Share Performance
Fourth Quar ter Repor t
* Dividend yield has been calculated based on dividend value of MVR55.00, approved by the shareholders at 2017 Annual General Meeting.
Cont.….
Q2/18
Q1/18
Q4/17
Q3/17
Q2/17
Q1/17
Q3/18
Q2/18
Q1/18
Q4/17
Q3/17
Q2/17
Q1/17
Q3/18
Q2/18
Q1/18
Q4/17
Q3/17
Q2/17
Q1/17
Q3/18
Q2/18
Q1/18
Q4/17
Q3/17
Q2/17
Q1/17
Q3/18
Q4/18
Q4/18
Q4/18
Q4/18

11Eureka Presentation
BOARDACTIVITIES

12Eureka Presentation
Non-Executive, Independent Director
Chairperson of CG CommitteeMember of NR and A&R Committee
Appointed on 30th May 2018
Non-Executive, Independent Director
Chairperson of NR CommitteeMember of CG Committee and A&R Committee
Appointed on 21st August 2014
Chief Financial Officer
Executive DirectorAppointed to Board on 28th March 2016
Former Chief Executive Officer and Managing Director
Appointed to Board on 25th December 2013Appointed as CEO/MD on 09th March 2015
Resigned on 15th November 2018
Hussain Salim MohamedFormer Chairman
Non-Executive, Independent DirectorAppointed on 06th December 2016
Resigned on 21st January 2019
Aishath Rafiyya
Ahmed Shaheer
Mariyam Zaahiya
Mohamed Mihad
Amir Mansoor Aishath Fazeena
Board of Directors
Fourth Quar ter Repor t
Non-Executive, Independent Director
Chairman of A&R CommitteeAppointed on 07th May 2012
Non-Executive, Independent Director
Member of CG Committee and A&R Committee23rd January 2018
* NR – Nomination and Remuneration Committee, CG – Corporate Governance and Compliance Committee, A&R – Audit and Risk Committee
Chief Executive Officer and Managing Director
Appointed on 30th November 2018
Husen Amru Mohamed Rashad
13Eureka Presentation
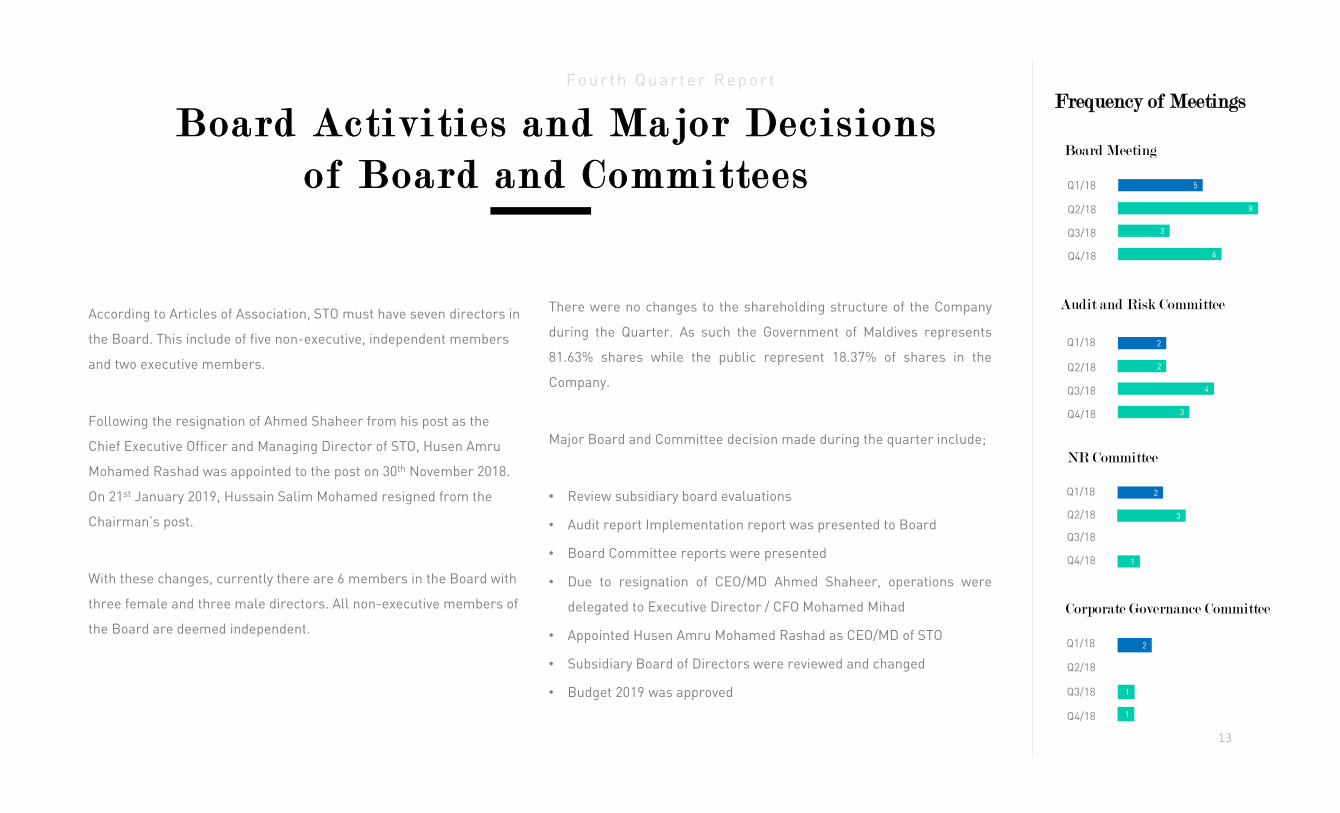
According to Articles of Association, STO must have seven directors in
the Board. This include of five non-executive, independent members
and two executive members.
Following the resignation of Ahmed Shaheer from his post as the
Chief Executive Officer and Managing Director of STO, Husen Amru
Mohamed Rashad was appointed to the post on 30th November 2018.
On 21st January 2019, Hussain Salim Mohamed resigned from the
Chairman’s post.
With these changes, currently there are 6 members in the Board with
three female and three male directors. All non-executive members of
the Board are deemed independent.
Board Activities and Major Decisions of Board and Committees
Fourth Quar ter Repor t
Board Meeting
Q3/18
Q2/18
Frequency of Meetings
Audit and Risk Committee
NR Committee
Corporate Governance Committee
6Q4/18
3
8
5Q1/18
Q3/18
Q2/18
3Q4/18
4
2
2Q1/18
Q3/18
Q2/18
1Q4/18
3
2Q1/18
Q3/18
Q2/18
1Q4/18
2Q1/18
1
There were no changes to the shareholding structure of the Company
during the Quarter. As such the Government of Maldives represents
81.63% shares while the public represent 18.37% of shares in the
Company.
Major Board and Committee decision made during the quarter include;
• Review subsidiary board evaluations
• Audit report Implementation report was presented to Board
• Board Committee reports were presented
• Due to resignation of CEO/MD Ahmed Shaheer, operations were
delegated to Executive Director / CFO Mohamed Mihad
• Appointed Husen Amru Mohamed Rashad as CEO/MD of STO
• Subsidiary Board of Directors were reviewed and changed
• Budget 2019 was approved

14Eureka Presentation
STO’s Board of Directors and Management strongly support the principles of good corporate
governance and are committed to embed such principles into the operations and management of
STO and its Group.
STO believes that the governance arrangements adopted by the STO Group are reflective of a high
performing, well governed organization. These arrangements enable the Board and Management to make
well informed decisions, provide appropriate accountability and transparency, and establish the proper
culture and behaviors. STO also believes that leading governance practices is essential for the long term
sustainability of our businesses.
The Board regularly reviews the Company’s corporate governance framework, policies and practices to
ensure at a minimum that they meet the expectations of our shareholders and evolve in line with the
Corporate Governance Code of Capital Market Development Authority and our own internal processes and
practices.
Compliance
Fourth Quar ter Repor t
Compliance to Corporate Governance
Reporting Compliance
This report has been prepared in compliance with
the Capital Market Development Authority
Minimum Quarterly Reporting Requirements for
Listed Companies.

15Eureka Presentation
FINANCIALS

16Eureka Presentation
Q4/2018 Q3/2018 Q2/2018 Q1/2018
Revenue 2,566,007,286 2,398,303,260 2,215,151,304 2,224,652,636
Cost of Sales (2,224,178,842) (2,105,366,290) (1,919,987,488) (1,955,569,185)
Gross Profit 341,828,444 292,936,970 295,163,816 269,083,451
Other Operating Income 19,942,867 3,942,669 11,860,456 8,684,006
361,771,311 296,879,639 307,024,271 277,767,458
Selling and Marketing Costs (73,942,208) (71,194,387) (54,549,966) (48,194,401)
Administrative Costs (168,836,144) (144,252,209) (157,924,279) (140,843,115)
Other Operating Expenses (343,874) (174,696) (1,132,152) (800,507)
Operating Profit 118,649,086 81,258,347 93,417,874 87,929,435
Finance Costs (30,621,054) (25,271,395) (38,172,963) (30,640,618)
Profit Before Tax 88,028,032 55,986,952 55,244,911 57,288,817
Business Profit Tax Expense (22,456,819) (8,921,960) (7,965,619) (10,671,604)
Profit After Tax 65,571,213 47,064,992 47,279,292 46,617,213
Attributable to
Equity Holders of the Parent 65,571,213 47,064,992 47,279,292 46,617,213
Non-Controlling Interest
Earnings per share Attributable to Equity holders of the Parent 58.19 41.76 41.95 41.37
Income Statement
Fourth Quar ter Repor t
17Eureka Presentation
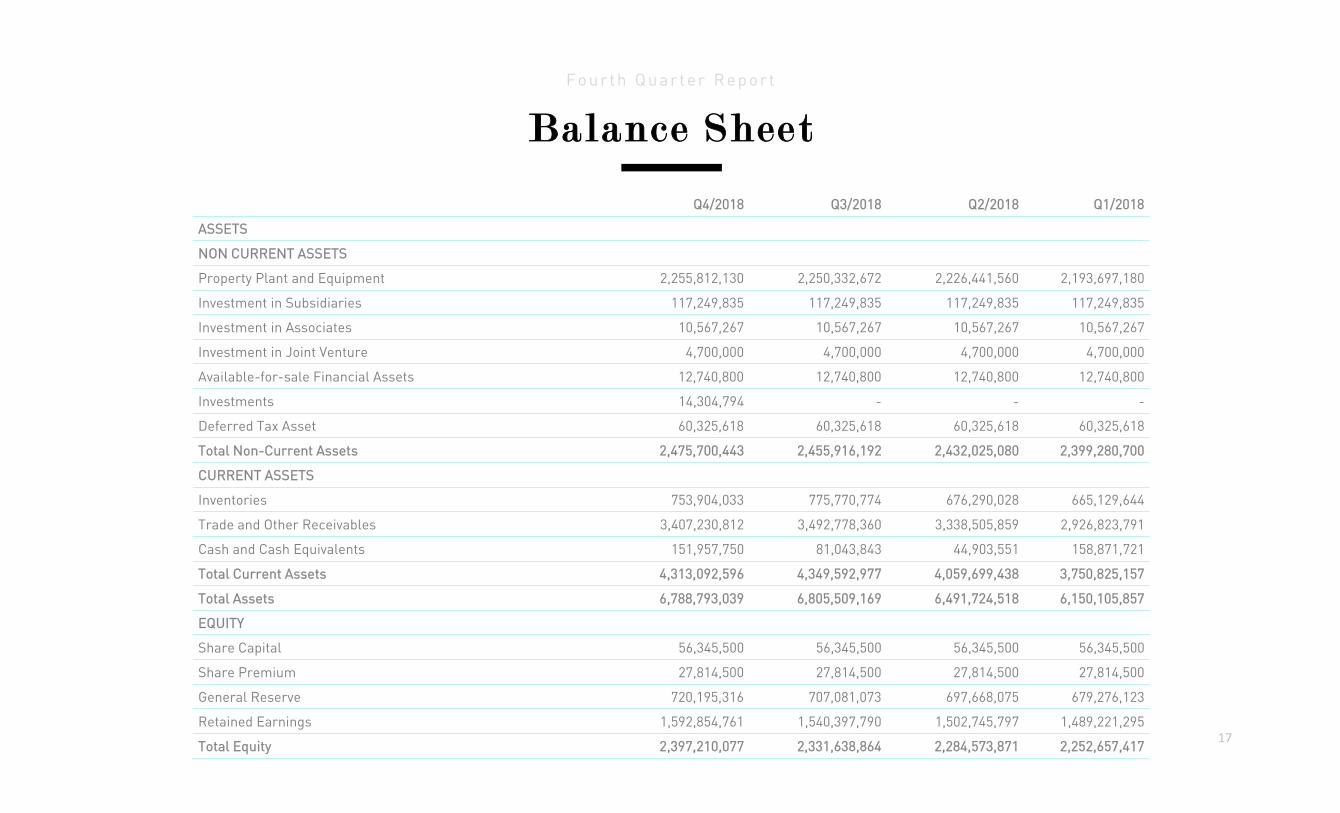
Q4/2018 Q3/2018 Q2/2018 Q1/2018
ASSETS
NON CURRENT ASSETS
Property Plant and Equipment 2,255,812,130 2,250,332,672 2,226,441,560 2,193,697,180
Investment in Subsidiaries 117,249,835 117,249,835 117,249,835 117,249,835
Investment in Associates 10,567,267 10,567,267 10,567,267 10,567,267
Investment in Joint Venture 4,700,000 4,700,000 4,700,000 4,700,000
Available-for-sale Financial Assets 12,740,800 12,740,800 12,740,800 12,740,800
Investments 14,304,794 - - -
Deferred Tax Asset 60,325,618 60,325,618 60,325,618 60,325,618
Total Non-Current Assets 2,475,700,443 2,455,916,192 2,432,025,080 2,399,280,700
CURRENT ASSETS
Inventories 753,904,033 775,770,774 676,290,028 665,129,644
Trade and Other Receivables 3,407,230,812 3,492,778,360 3,338,505,859 2,926,823,791
Cash and Cash Equivalents 151,957,750 81,043,843 44,903,551 158,871,721
Total Current Assets 4,313,092,596 4,349,592,977 4,059,699,438 3,750,825,157
Total Assets 6,788,793,039 6,805,509,169 6,491,724,518 6,150,105,857
EQUITY
Share Capital 56,345,500 56,345,500 56,345,500 56,345,500
Share Premium 27,814,500 27,814,500 27,814,500 27,814,500
General Reserve 720,195,316 707,081,073 697,668,075 679,276,123
Retained Earnings 1,592,854,761 1,540,397,790 1,502,745,797 1,489,221,295
Total Equity 2,397,210,077 2,331,638,864 2,284,573,871 2,252,657,417
Balance Sheet
Fourth Quar ter Repor t

18Eureka Presentation
Balance Sheet
Fourth Quar ter Repor t
LIABILITIES Q4/2018 Q3/2018 Q2/2018 Q1/2018
LIABILITIES
NON-CURRENT LIABILITIES
Loans and Borrowings 382,018,413 366,694,915 402,669,715 490,047,705
Current Liabilities
Current Tax Liabilities 27,845,069 10,895,678 15,867,825 13,082,671
Trade and Other Payables 2,456,973,185 2,387,179,740 2,242,830,339 2,558,260,749
Borrowings 1,524,746,294 1,709,099,971 1,545,782,767 836,057,314
Total Current Liabilities 4,009,564,549 4,107,175,390 3,804,480,932 3,407,400,735
Total Liabilities 4,391,582,962 4,473,870,305 4,207,150,646 3,897,448,440
Total Equity and Liabilities 6,788,793,039 6,805,509,169 6,491,724,518 6,150,105,857
Cont.….
Mohamed MihadChief Financial Officer / Executive Director
Husen Amru Mohamed RashadChief Executive Officer and Managing Director

19Eureka Presentation
Cash flow Statement
Fourth Quar ter Repor t
Q4/2018 Q3/2018 Q2/2018 Q1/2018
Profit before business profit tax 88,028,032 55,986,952 55,244,911 57,288,817
Adjustments for:
- Depreciation & amortization 31,753,521 26,170,536 23,767,359 22,405,721
- Interest income (1,360,833) (1,362,874) (1,450,359) (1,413,242)
- Interest expense 40,641,277 46,271,208 52,147,302 32,396,508
- Dividend income (10,009,967) (20,099,866) (13,000,000)
- Provision for impairment of receivables 14,747,568 12,192,968 4,997,264 5,372,735
- Receivables written off 3,466.2 -
- Provision for slow and non moving inventories 498,045 (2,356,260) (3,551,942) (715,928)
- Profit on disposal of property, plant and equipment 15,425 9,706,472 19,072 96,982
Changes in working capital:
- Inventories 21,368,695 (97,124,485) (103,319,748) 96,427,234
- trade and other receivables 56,495,186 (166,465,469) (116,881,328) (305,174,205)
- Trade and other payables 70,067,144 144,891,580 (333,885,595) (34,007,973)
312,244,094 7,810,761 (435,909,598) (127,323,352)
Cash flows from operating activities
Interest paid (40,641,277) (46,271,208) (52,147,302) (32,396,508)
Business profit tax paid (5,507,428) (13,894,107) (15,852,069)
Net cash generated from / (used in) operating activities 266,095,389 (52,354,554) (488,056,899) (175,571,929)

20Eureka Presentation
Cash flow Statement
Fourth Quar ter Repor t
LIABILITIES Q4/2018 Q3/2018 Q2/2018 Q1/2018
Cash flows from investing activities
Purchases of property, plant and equipment - net (37,248,404) (59,768,120) (35,234,387) (43,799,126)
Loan repayments received from related parties
Interest received 1,360,833 1,362,874 1,450,359 1,413,242
Dividends received 10,009,967 20,099,866 13,000,000
Net cash generated from / (used in) investing activities (25,877,604) (38,305,380) (20,784,028) (42,385,884)
Cash flows from financing activities
Net proceeds from / (repayment of) borrowings (296,164,628) 127,342,405 357,996,736 264,350,727
Dividends paid to shareholders (273,699) (542,179) (9,344,605) (172,287)
Net cash generated from / (used in) financing activities (296,438,327) 126,800,226 348,652,131 264,178,440
Net increase / (decrease) in cash and cash equivalents (56,220,542) 36,140,292 (160,188,797) 46,220,627
Cash, cash equivalents and bank overdrafts at beginning of the quarter 208,178,292 44,903,551 205,092,348 158,871,721
Cash, cash equivalents and bank overdrafts at end of the quarter 151,957,750 81,043,843 44,903,551 205,092,348
Cont.….
21Eureka Presentation
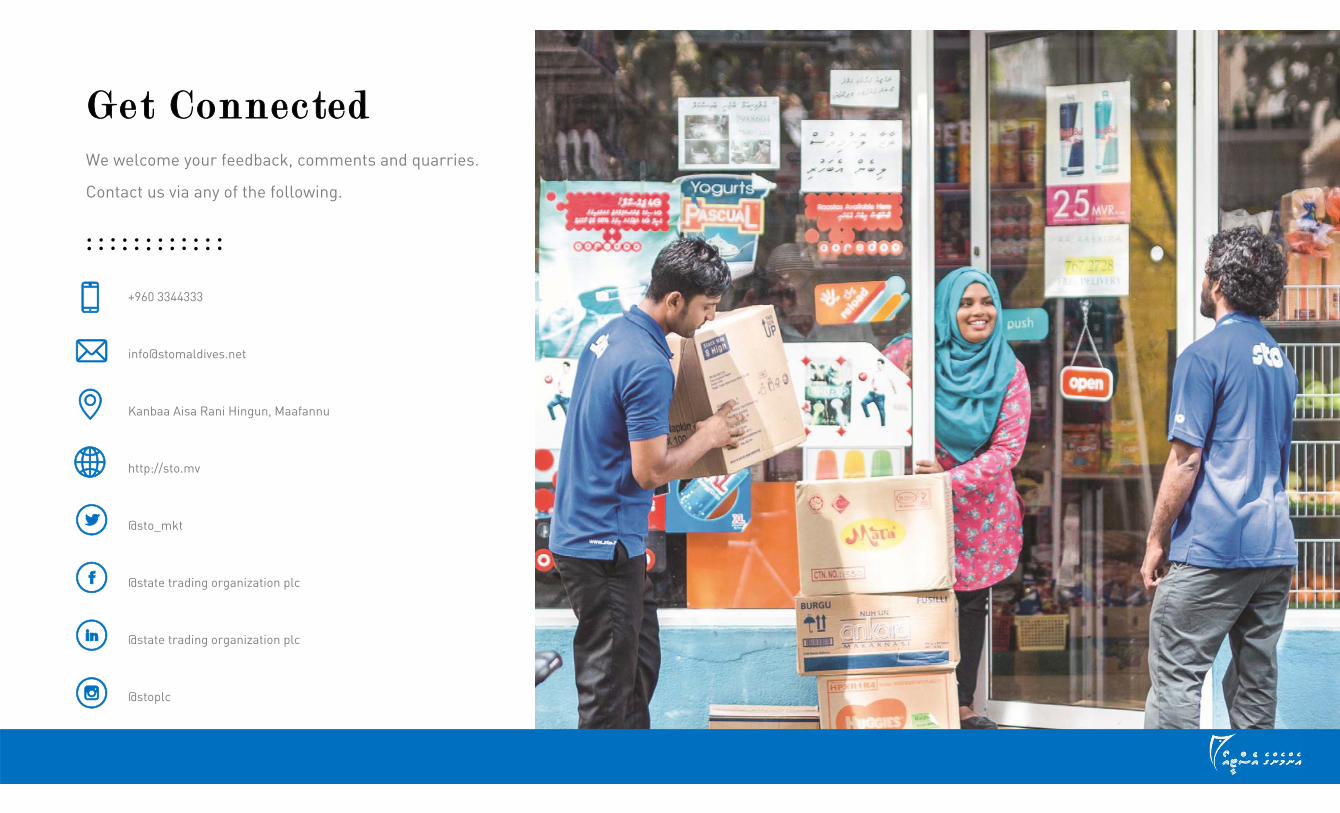
http://sto.mv
Kanbaa Aisa Rani Hingun, Maafannu
+960 3344333
@stoplc
@state trading organization plc
@state trading organization plc
@sto_mkt
Get ConnectedWe welcome your feedback, comments and quarries.
Contact us via any of the following.