Embed Size (px)
Citation preview

Fourth Quarter 2016 Earnings Call
February 22, 2017SUPPLEMENTAL INFORMATION
2
The information contained in this presentation includes certain estimates, projections and other forward-lookinginformation that reflect HealthSouth’s current outlook, views and plans with respect to future events, including legislativeand regulatory developments, strategy, capital expenditures, acquisition and other development activities, cybersecurity, dividend strategies, repurchases of securities, effective tax rates, financial performance, financial assumptions,business model, balance sheet and cash flow plans, and shareholder value-enhancing transactions. These estimates,projections and other forward-looking information are based on assumptions HealthSouth believes, as of the datehereof, are reasonable. Inevitably, there will be differences between such estimates and actual events or results, andthose differences may be material.
There can be no assurance any estimates, projections or forward-looking information will be realized.
All such estimates, projections and forward-looking information speak only as of the date hereof. HealthSouthundertakes no duty to publicly update or revise the information contained herein.
You are cautioned not to place undue reliance on the estimates, projections and other forward-looking information inthis presentation as they are based on current expectations and general assumptions and are subject to various risks,uncertainties and other factors, including those set forth in the Form 10-K for the year ended December 31, 2016, whenfiled, and in other documents HealthSouth previously filed with the SEC, many of which are beyond HealthSouth’scontrol, that may cause actual events or results to differ materially from the views, beliefs and estimates expressedherein.
Note Regarding Presentation of Non-GAAP Financial MeasuresThe following presentation includes certain “non-GAAP financial measures” as defined in Regulation G under theSecurities Exchange Act of 1934, including Adjusted EBITDA, leverage ratios, adjusted earnings per share, andadjusted free cash flow. Schedules are attached that reconcile the non-GAAP financial measures included in thefollowing presentation to the most directly comparable financial measures calculated and presented in accordance withGenerally Accepted Accounting Principles in the United States. HealthSouth’s Form 8-K, dated February 21, 2017, towhich the following supplemental information is attached as Exhibit 99.2, provides further explanation and disclosureregarding HealthSouth’s use of non-GAAP financial measures and should be read in conjunction with this supplementalinformation.
Forward-Looking Statements
3
Table of ContentsQ4 2016 Summary................................................................................................................................................. 4-5IRF-Home Health Clinical Collaboration ................................................................................................................ 6Inpatient Rehabilitation Segment ........................................................................................................................... 7-8Home Health & Hospice Segment ......................................................................................................................... 9-10Earnings per Share ................................................................................................................................................ 11-12Adjusted Free Cash Flow....................................................................................................................................... 13Guidance................................................................................................................................................................ 14-15Adjusted Free Cash Flow and Tax Assumptions.................................................................................................... 16Free Cash Flow Priorities....................................................................................................................................... 17
AppendixMap of Locations.................................................................................................................................................... 19Pre-Payment Claims Denials - Inpatient Rehabilitation Segment.......................................................................... 20Expansion Activity .................................................................................................................................................. 21Business Outlook ................................................................................................................................................... 22-24Debt Schedule and Maturity Profile ....................................................................................................................... 25-26New-Store/Same-Store IRF Growth ...................................................................................................................... 27Payment Sources (Percent of Revenues).............................................................................................................. 28Inpatient Rehabilitation Operational and Labor Metrics ......................................................................................... 29Home Health & Hospice Operational Metrics ........................................................................................................ 30Common Stock Warrants ....................................................................................................................................... 31Share Information .................................................................................................................................................. 32Segment Operating Results................................................................................................................................... 33-34Reconciliations to GAAP........................................................................................................................................ 35-43End Notes .............................................................................................................................................................. 44-45
4
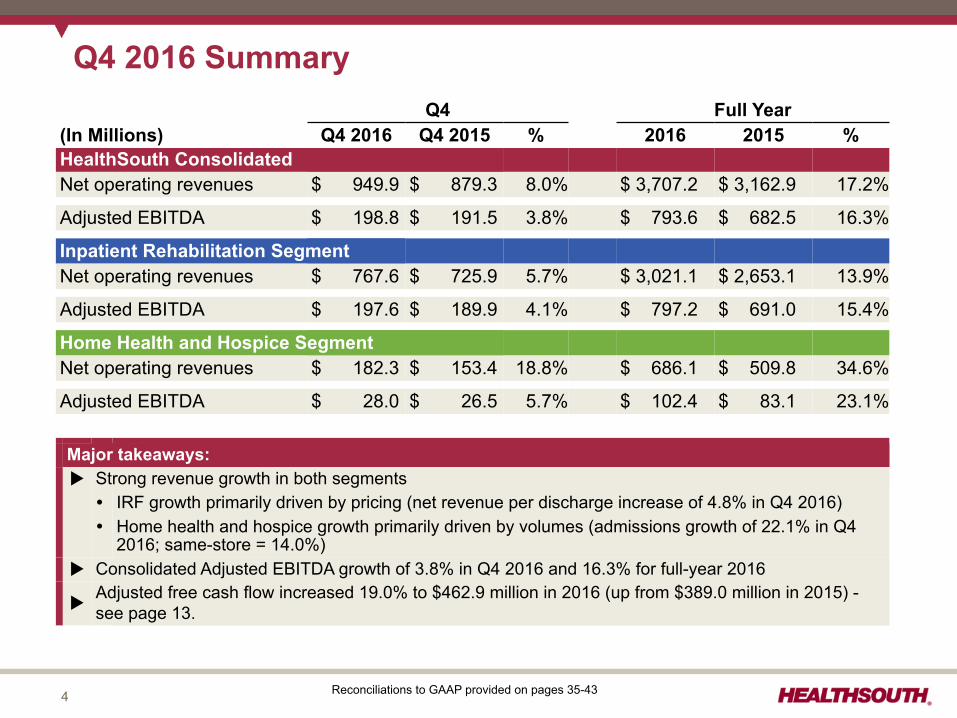
Q4 2016 SummaryQ4 Full Year
(In Millions) Q4 2016 Q4 2015 % 2016 2015 %HealthSouth ConsolidatedNet operating revenues $ 949.9 $ 879.3 8.0% $ 3,707.2 $ 3,162.9 17.2%
Adjusted EBITDA $ 198.8 $ 191.5 3.8% $ 793.6 $ 682.5 16.3%
Inpatient Rehabilitation SegmentNet operating revenues $ 767.6 $ 725.9 5.7% $ 3,021.1 $ 2,653.1 13.9%
Adjusted EBITDA $ 197.6 $ 189.9 4.1% $ 797.2 $ 691.0 15.4%
Home Health and Hospice SegmentNet operating revenues $ 182.3 $ 153.4 18.8% $ 686.1 $ 509.8 34.6%
Adjusted EBITDA $ 28.0 $ 26.5 5.7% $ 102.4 $ 83.1 23.1%
Major takeaways:u Strong revenue growth in both segments� IRF growth primarily driven by pricing (net revenue per discharge increase of 4.8% in Q4 2016)� Home health and hospice growth primarily driven by volumes (admissions growth of 22.1% in Q4
2016; same-store = 14.0%)u Consolidated Adjusted EBITDA growth of 3.8% in Q4 2016 and 16.3% for full-year 2016
uAdjusted free cash flow increased 19.0% to $462.9 million in 2016 (up from $389.0 million in 2015) -see page 13.
Reconciliations to GAAP provided on pages 35-43
5
Q4 2016 Summary (cont.) u Balance Sheet� Leverage ratio of 3.8x at year end; funded debt reduced by ~$155 million during full-year 2016
u Sold Pediatric Home Health Assets� Non-strategic assets� Pre-tax gain of ~$3 million� Tax expense of ~$6 million due to limited tax basis in assets sold� Represented ~$2 million of Adjusted EBITDA in 2016
u Expansion Activity (see page 21)� Opened 50-bed hospital in Modesto, CA� 10 IRF development projects underway (6 are joint ventures)� Expanded existing hospitals by 13 beds� Acquired four home health agencies — Springfield, VA; Laramie, WY; Cheyenne, WY; and Sarasota, FL
— and opened a de novo home health agency in Georgetown, TX� Acquired one hospice location in Wheat Ridge, CO and opened one de novo hospice location in
Nashville, TNu Shareholder Distributions� Repurchased 1.1 million shares of common stock for $41.5 million in Q4 2016 (full-year 2016
repurchases of 1.7 million shares for $64.1 million)� Paid quarterly cash dividend of $0.24 per share in October 2016� Declared a $0.24 per share quarterly cash dividend in October 2016 which was paid in January 2017
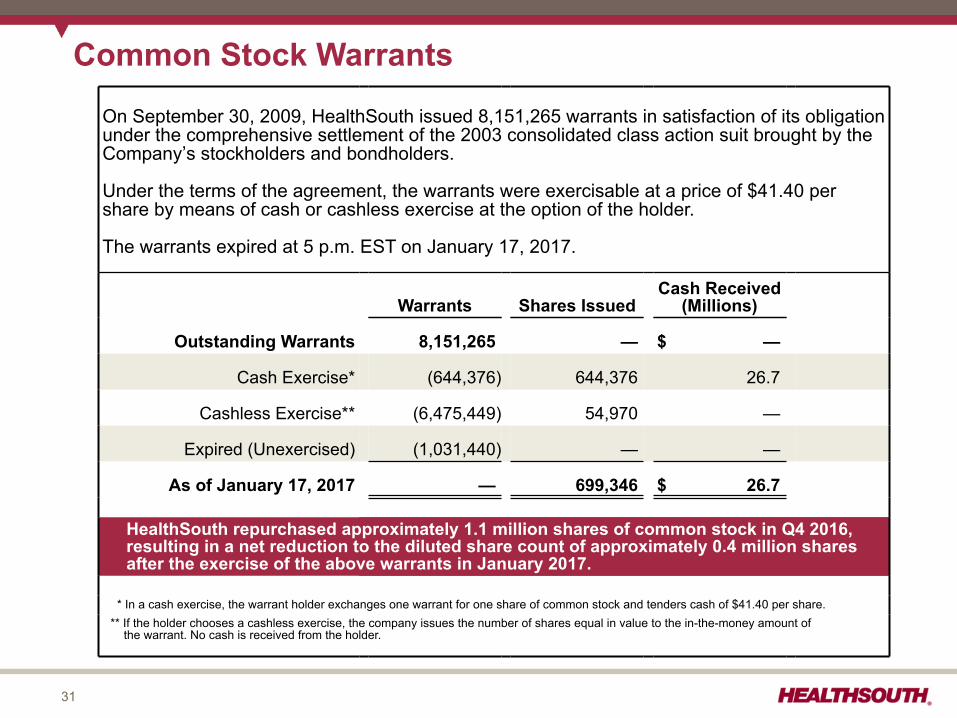
u Expiration of Warrants in January 2017 (see page 31)� Issued a total of 699,346 new common sharesü 644,376 warrants exercised on a cash basis; received cash proceeds of $26.7 millionü 6,475,449 warrants exercised on a cashless basis; resulted in issuance of 54,970 common shares
� 1,031,440 warrants expired unexercised
6
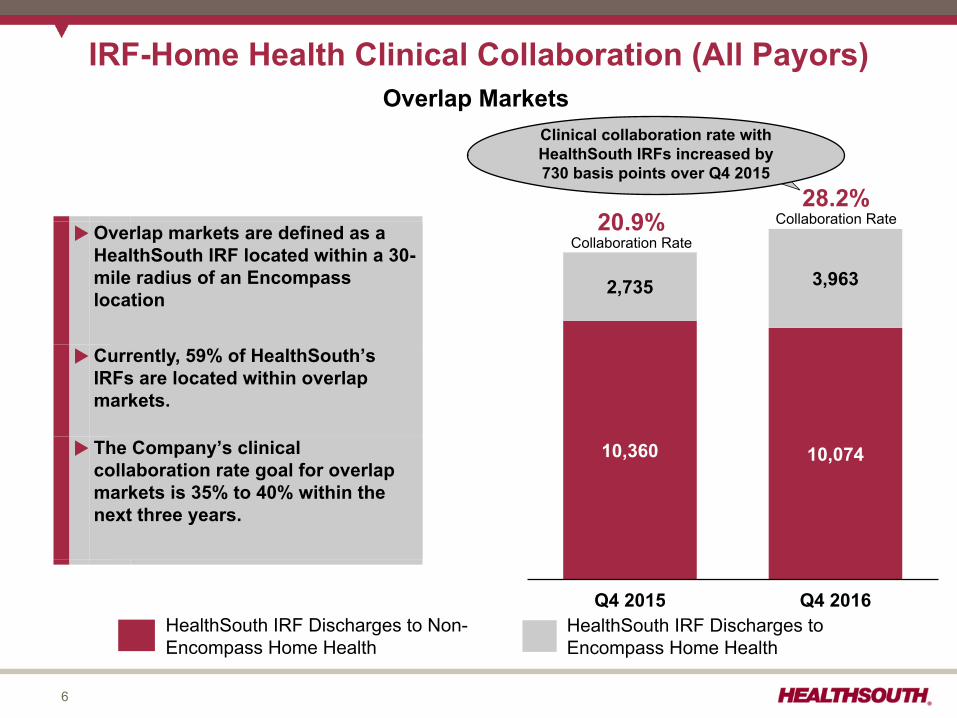
IRF-Home Health Clinical Collaboration (All Payors)
Q4 2015 Q4 2016
10,360 10,074
2,735 3,963
20.9%Collaboration Rate
28.2%Collaboration Rate
HealthSouth IRF Discharges to Non-Encompass Home Health
HealthSouth IRF Discharges toEncompass Home Health
Clinical collaboration rate withHealthSouth IRFs increased by730 basis points over Q4 2015
uOverlap markets are defined as aHealthSouth IRF located within a 30-mile radius of an Encompasslocation
uCurrently, 59% of HealthSouth’sIRFs are located within overlapmarkets.
u The Company’s clinicalcollaboration rate goal for overlapmarkets is 35% to 40% within thenext three years.
Overlap Markets
7
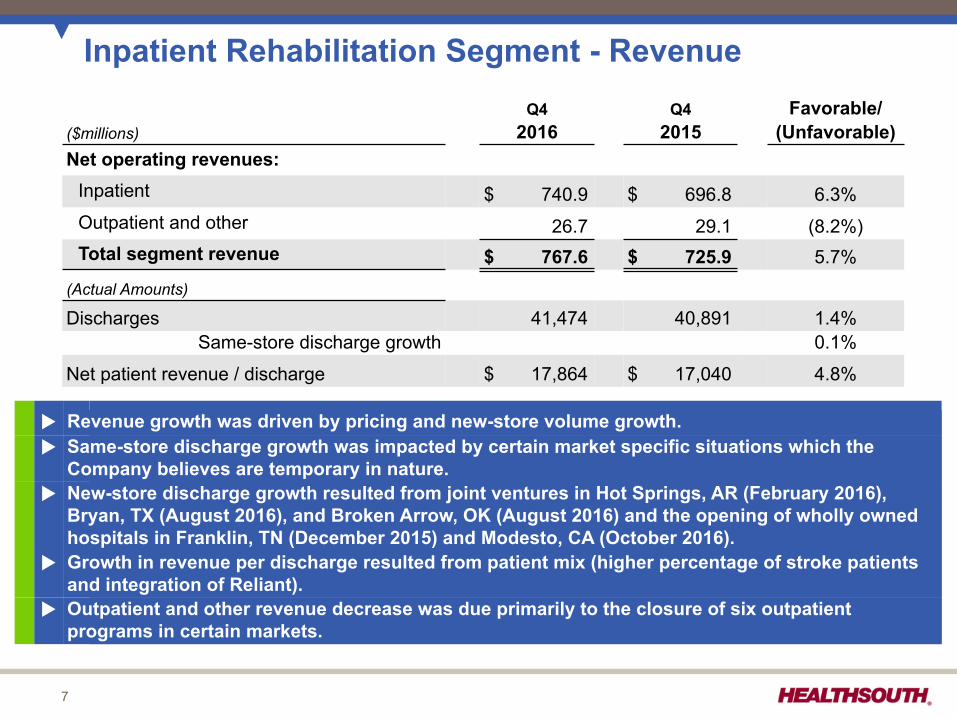
Inpatient Rehabilitation Segment - RevenueQ4 Q4 Favorable/
($millions) 2016 2015 (Unfavorable)Net operating revenues:
Inpatient $ 740.9 $ 696.8 6.3%Outpatient and other 26.7 29.1 (8.2%)Total segment revenue $ 767.6 $ 725.9 5.7%
(Actual Amounts)
Discharges 41,474 40,891 1.4%Same-store discharge growth 0.1%
Net patient revenue / discharge $ 17,864 $ 17,040 4.8%
u Revenue growth was driven by pricing and new-store volume growth.u Same-store discharge growth was impacted by certain market specific situations which the
Company believes are temporary in nature.u New-store discharge growth resulted from joint ventures in Hot Springs, AR (February 2016),
Bryan, TX (August 2016), and Broken Arrow, OK (August 2016) and the opening of wholly ownedhospitals in Franklin, TN (December 2015) and Modesto, CA (October 2016).
u Growth in revenue per discharge resulted from patient mix (higher percentage of stroke patientsand integration of Reliant).
u Outpatient and other revenue decrease was due primarily to the closure of six outpatientprograms in certain markets.
8
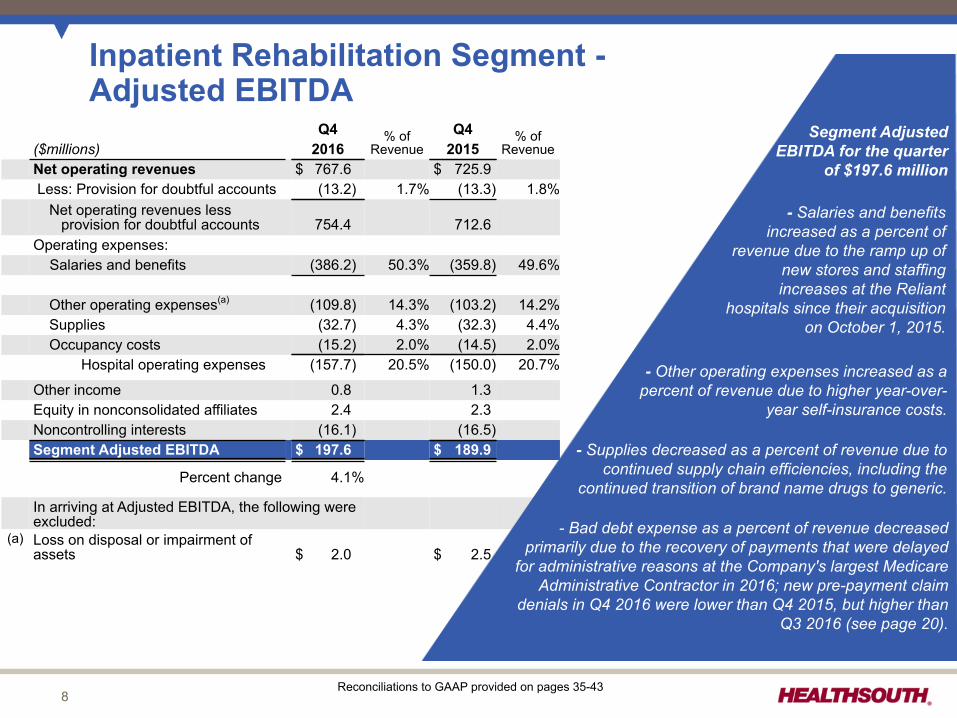
Inpatient Rehabilitation Segment -Adjusted EBITDA
Q4 % ofRevenue
Q4 % ofRevenue($millions) 2016 2015
Net operating revenues $ 767.6 $ 725.9 Less: Provision for doubtful accounts (13.2) 1.7% (13.3) 1.8%
Net operating revenues lessprovision for doubtful accounts 754.4 712.6
Operating expenses: Salaries and benefits (386.2) 50.3% (359.8) 49.6%
Other operating expenses(a) (109.8) 14.3% (103.2) 14.2%Supplies (32.7) 4.3% (32.3) 4.4%Occupancy costs (15.2) 2.0% (14.5) 2.0%
Hospital operating expenses (157.7) 20.5% (150.0) 20.7%
Other income 0.8 1.3Equity in nonconsolidated affiliates 2.4 2.3Noncontrolling interests (16.1) (16.5)Segment Adjusted EBITDA $ 197.6 $ 189.9
Percent change 4.1%
In arriving at Adjusted EBITDA, the following wereexcluded:
(a) Loss on disposal or impairment ofassets $ 2.0 $ 2.5
Segment AdjustedEBITDA for the quarter
of $197.6 million
- Salaries and benefitsincreased as a percent of
revenue due to the ramp up ofnew stores and staffingincreases at the Reliant
hospitals since their acquisitionon October 1, 2015.
- Other operating expenses increased as apercent of revenue due to higher year-over-
year self-insurance costs.
- Bad debt expense as a percent of revenue decreasedprimarily due to the recovery of payments that were delayed
for administrative reasons at the Company's largest MedicareAdministrative Contractor in 2016; new pre-payment claim
denials in Q4 2016 were lower than Q4 2015, but higher thanQ3 2016 (see page 20).
Reconciliations to GAAP provided on pages 35-43
- Supplies decreased as a percent of revenue due tocontinued supply chain efficiencies, including the
continued transition of brand name drugs to generic.
9
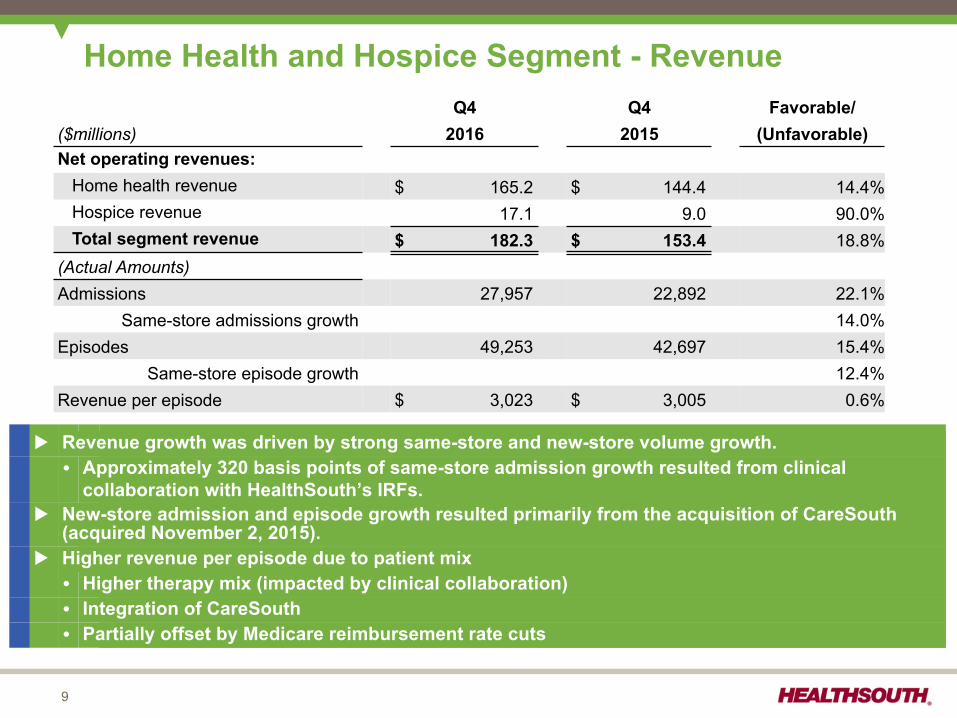
Home Health and Hospice Segment - RevenueQ4 Q4 Favorable/
($millions) 2016 2015 (Unfavorable)Net operating revenues: Home health revenue $ 165.2 $ 144.4 14.4% Hospice revenue 17.1 9.0 90.0% Total segment revenue $ 182.3 $ 153.4 18.8%(Actual Amounts)Admissions 27,957 22,892 22.1%
Same-store admissions growth 14.0%Episodes 49,253 42,697 15.4%
Same-store episode growth 12.4%Revenue per episode $ 3,023 $ 3,005 0.6%
u Revenue growth was driven by strong same-store and new-store volume growth.� Approximately 320 basis points of same-store admission growth resulted from clinical
collaboration with HealthSouth’s IRFs.u New-store admission and episode growth resulted primarily from the acquisition of CareSouth
(acquired November 2, 2015).u Higher revenue per episode due to patient mix� Higher therapy mix (impacted by clinical collaboration)� Integration of CareSouth� Partially offset by Medicare reimbursement rate cuts
10
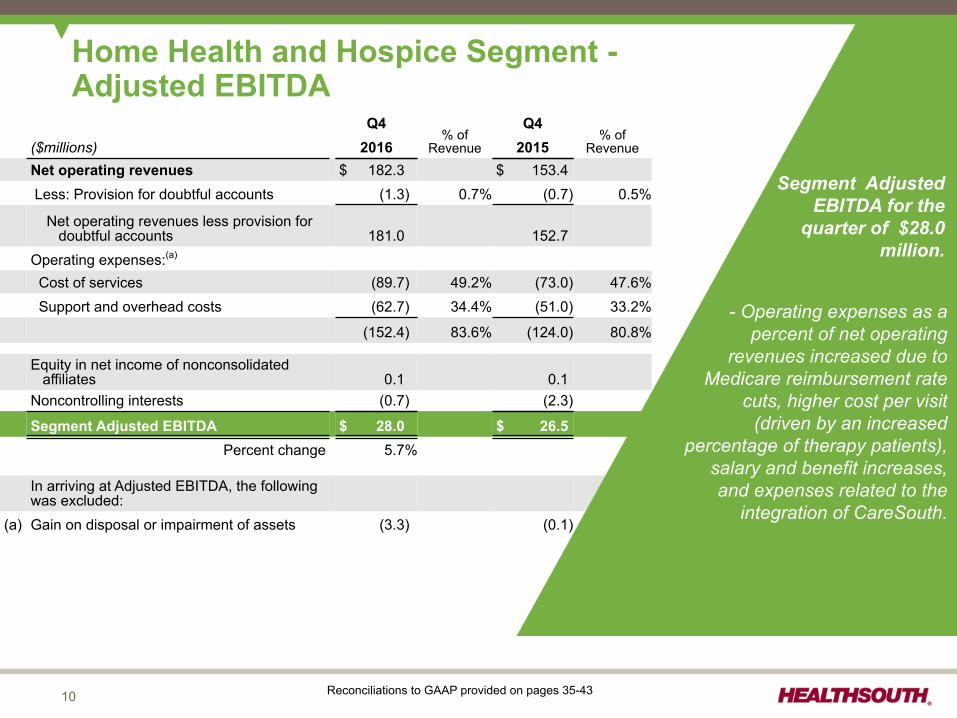
Q4% of
Revenue
Q4% of
Revenue($millions) 2016 2015Net operating revenues $ 182.3 $ 153.4 Less: Provision for doubtful accounts (1.3) 0.7% (0.7) 0.5%
Net operating revenues less provision fordoubtful accounts 181.0 152.7
Operating expenses:(a)
Cost of services (89.7) 49.2% (73.0) 47.6% Support and overhead costs (62.7) 34.4% (51.0) 33.2%
(152.4) 83.6% (124.0) 80.8%
Equity in net income of nonconsolidatedaffiliates 0.1 0.1
Noncontrolling interests (0.7) (2.3)
Segment Adjusted EBITDA $ 28.0 $ 26.5Percent change 5.7%
In arriving at Adjusted EBITDA, the followingwas excluded:
(a) Gain on disposal or impairment of assets (3.3) (0.1)
Home Health and Hospice Segment -Adjusted EBITDA
Segment AdjustedEBITDA for the
quarter of $28.0million.
- Operating expenses as apercent of net operating
revenues increased due toMedicare reimbursement rate
cuts, higher cost per visit(driven by an increased
percentage of therapy patients),salary and benefit increases,and expenses related to the
integration of CareSouth.
* Reconciliation to GAAP provided on pages 29-31
Reconciliations to GAAP provided on pages 35-43
11
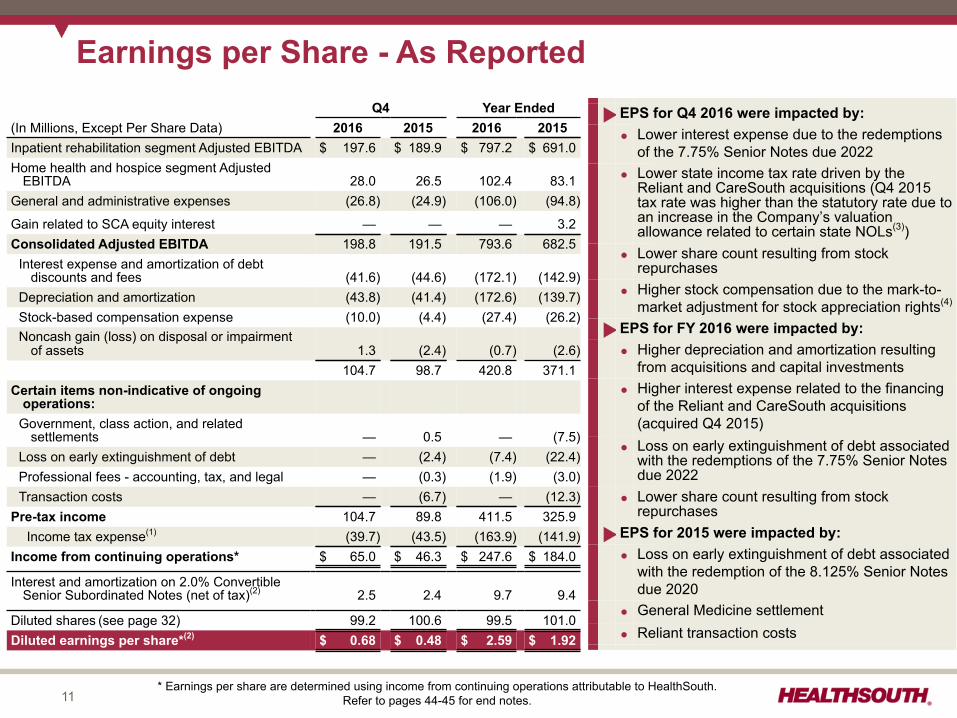
Earnings per Share - As ReportedQ4 Year Ended
(In Millions, Except Per Share Data) 2016 2015 2016 2015Inpatient rehabilitation segment Adjusted EBITDA $ 197.6 $ 189.9 $ 797.2 $ 691.0Home health and hospice segment Adjusted
EBITDA 28.0 26.5 102.4 83.1General and administrative expenses (26.8) (24.9) (106.0) (94.8)
Gain related to SCA equity interest — — — 3.2Consolidated Adjusted EBITDA 198.8 191.5 793.6 682.5
Interest expense and amortization of debtdiscounts and fees (41.6) (44.6) (172.1) (142.9)
Depreciation and amortization (43.8) (41.4) (172.6) (139.7)Stock-based compensation expense (10.0) (4.4) (27.4) (26.2)Noncash gain (loss) on disposal or impairment
of assets 1.3 (2.4) (0.7) (2.6)104.7 98.7 420.8 371.1
Certain items non-indicative of ongoingoperations:
Government, class action, and relatedsettlements — 0.5 — (7.5)
Loss on early extinguishment of debt — (2.4) (7.4) (22.4)Professional fees - accounting, tax, and legal — (0.3) (1.9) (3.0)Transaction costs — (6.7) — (12.3)
Pre-tax income 104.7 89.8 411.5 325.9Income tax expense(1) (39.7) (43.5) (163.9) (141.9)
Income from continuing operations* $ 65.0 $ 46.3 $ 247.6 $ 184.0
Interest and amortization on 2.0% ConvertibleSenior Subordinated Notes (net of tax)(2) 2.5 2.4 9.7 9.4
Diluted shares (see page 32) 99.2 100.6 99.5 101.0Diluted earnings per share*(2) $ 0.68 $ 0.48 $ 2.59 $ 1.92
uEPS for Q4 2016 were impacted by:� Lower interest expense due to the redemptions
of the 7.75% Senior Notes due 2022
� Lower state income tax rate driven by theReliant and CareSouth acquisitions (Q4 2015tax rate was higher than the statutory rate due toan increase in the Company’s valuationallowance related to certain state NOLs(3))
� Lower share count resulting from stockrepurchases
� Higher stock compensation due to the mark-to-market adjustment for stock appreciation rights(4)
uEPS for FY 2016 were impacted by:� Higher depreciation and amortization resulting
from acquisitions and capital investments
� Higher interest expense related to the financingof the Reliant and CareSouth acquisitions(acquired Q4 2015)
� Loss on early extinguishment of debt associatedwith the redemptions of the 7.75% Senior Notesdue 2022
� Lower share count resulting from stockrepurchases
uEPS for 2015 were impacted by:� Loss on early extinguishment of debt associated
with the redemption of the 8.125% Senior Notesdue 2020
� General Medicine settlement
� Reliant transaction costs
* Earnings per share are determined using income from continuing operations attributable to HealthSouth.Refer to pages 44-45 for end notes.
12
Q4 Full Year2016 2015 2016 2015
Earnings per share, as reported $ 0.68 $ 0.48 $ 2.59 $ 1.92Adjustments, net of tax:
Government, class action, and related settlements — — — 0.04
Professional fees — accounting, tax, and legal — — 0.01 0.02
Mark-to-market adjustment for stock appreciation rights(4) 0.02 — 0.01 0.01
Income tax valuation allowance and other tax adjustments (0.01) 0.05 (0.01) 0.05
Transaction costs — 0.05 — 0.08
Loss on early extinguishment of debt — 0.01 0.04 0.13
Sale of pediatric home health assets and hospital 0.03 — 0.02 —
Adjusted earnings per share* $ 0.72 $ 0.59 $ 2.67 $ 2.24
Adjusted Earnings per Share(5)
* Adjusted EPS may not sum due to rounding. See complete calculations of adjusted earnings per share on pages 40-43.Refer to pages 44-45 for end notes.
Adjusted earnings per share removes from the GAAP earnings per share calculation theimpact of items the Company believes are non-indicative of its ongoing operations.
13
Adjusted Free CashFlow FY 2015
AdjustedEBITDA
Working Capitaland Other
Cash InterestExpense
Cash TaxPayments,
Net of Refunds
MaintenanceCapital Expenditures
PreferredDividends
Adjusted Free CashFlow FY 2016
$389.0
$111.1 $33.0
($29.8) ($22.4) ($21.1)
$3.1
$462.9
2016 Adjusted Free Cash Flow(6)
Reconciliations to GAAP provided on pages 35-43Refer to pages 44-45 for end notes.
u Adjusted free cash flow in 2016 grew 19.0% as a result of increased Adjusted EBITDA and favorableworking capital changes.ü Working capital changes were mainly attributable to the recovery of payments that were delayed for
administrative reasons at the Company’s largest MAC and the timing of payroll-related liabilities.ü Cash interest expense increased due to the financing of the Reliant and CareSouth acquisitions.ü Cash tax payments increased due to the exhaustion of the federal NOL and the tax impact of the
gain on the sale of the home health pediatric assets.ü Increased maintenance capital expenditures resulted from growth in the IRF segment, an enhanced
hospital maintenance program, and refurbishments at larger hospitals.
14Refer to pages 44-45 for end notes.
Guidance
Adjusted EBITDA(7)
Adjusted Earnings per Sharefrom Continuing OperationsAttributable to HealthSouth(5)
Net Operating Revenues Net Operating Revenues
$3,850 million to $3,950 million
Adjusted EBITDA(7)
$800 million to $820 million
Adjusted Earnings per Sharefrom Continuing OperationsAttributable to HealthSouth(5)
$2.61 to $2.73
$3,707.2 million
$793.6 million
$2.67
2017Guidance
2016Actuals
15
Guidance Considerations
Inpatient Rehabilitation
u Estimated 1.9% increase in Medicarepricing for Q1 through Q3; ~1.0% for Q4(see page 23)
u Salary increase of ~3.0% (see page 24)
u 2016 included the benefit of a retroactiveindirect medical education (“IME”)adjustment of ~$4 million at the formerReliant hospital in Woburn, MA.
u Bad debt expense of 1.8% to 2.0% of netoperating revenues
Home Health and Hospice
u Estimated 3.6%, or ~$21 million, netMedicare pricing reduction for CY 2017(see page 23)
u Salary increase of ~3.0% (see page 24)u Estimated incremental cost of $1.0
million to $1.5 million for the pre-claimreview demonstration scheduled to beginin Florida on April 1, 2017
u Inclusive of home health and hospiceacquisitions in 2017 (see page 17)
u Sale of pediatric home health assets inQ4 2016; Pediatrics generated ~$2 millionof Adjusted EBITDA in 2016
Consolidatedu Diluted share count of ~100 million sharesu Tax rate of approximately 40%
16
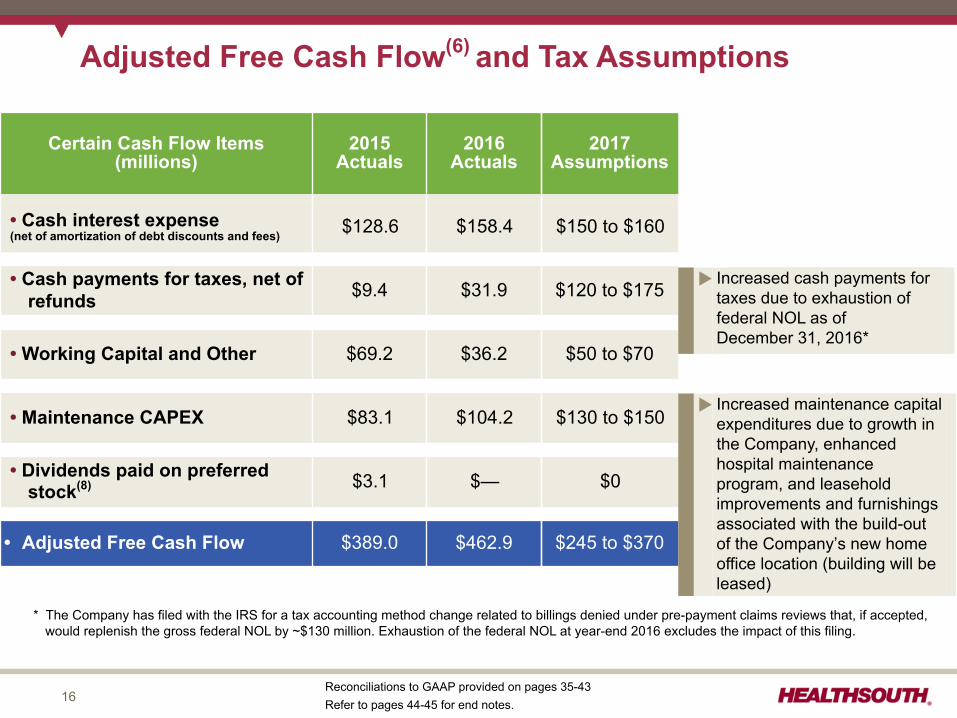
Adjusted Free Cash Flow(6) and Tax Assumptions
Certain Cash Flow Items(millions)
2015Actuals
2016Actuals
2017Assumptions
• Cash interest expense(net of amortization of debt discounts and fees) $128.6 $158.4 $150 to $160
• Cash payments for taxes, net ofrefunds $9.4 $31.9 $120 to $175
• Working Capital and Other $69.2 $36.2 $50 to $70
• Maintenance CAPEX $83.1 $104.2 $130 to $150
• Dividends paid on preferredstock(8) $3.1 $— $0
• Adjusted Free Cash Flow $389.0 $462.9 $245 to $370
Reconciliations to GAAP provided on pages 35-43Refer to pages 44-45 for end notes.
* The Company has filed with the IRS for a tax accounting method change related to billings denied under pre-payment claims reviews that, if accepted,would replenish the gross federal NOL by ~$130 million. Exhaustion of the federal NOL at year-end 2016 excludes the impact of this filing.
u Increased cash payments fortaxes due to exhaustion offederal NOL as of December 31, 2016*
u Increased maintenance capitalexpenditures due to growth inthe Company, enhancedhospital maintenanceprogram, and leaseholdimprovements and furnishingsassociated with the build-outof the Company’s new homeoffice location (building will beleased)
17Note: 2015 amount for debt borrowings included ~$208 million related to the Reliant hospitals' capital lease obligations.
See the debt schedule on page 25. Refer to pages 44-45 for end notes.
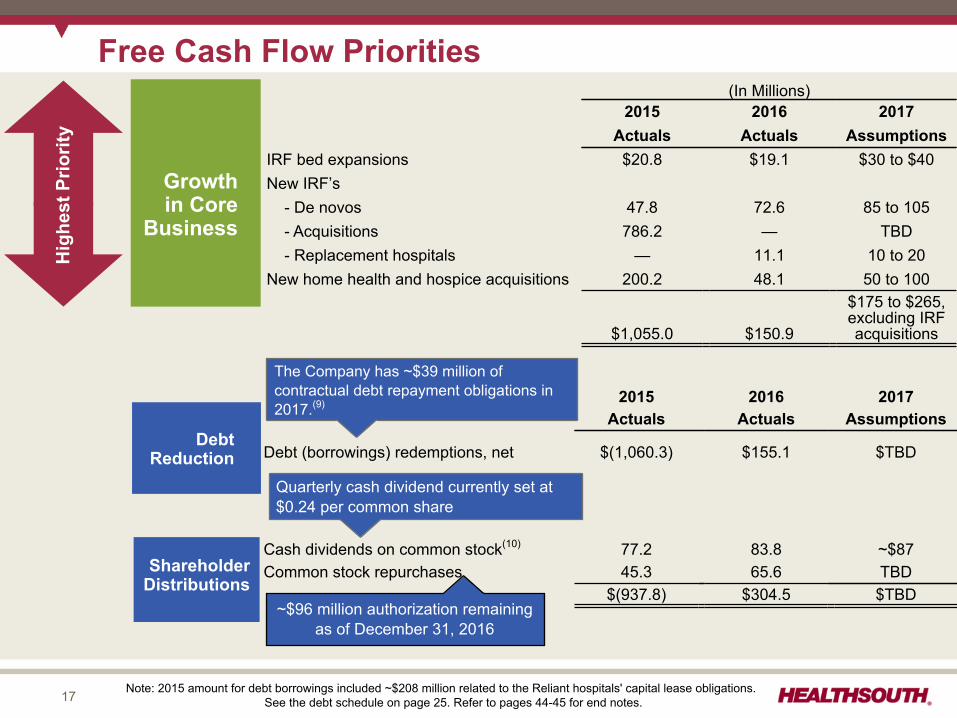
Free Cash Flow Priorities(In Millions)
2015 2016 2017Actuals Actuals Assumptions
IRF bed expansions $20.8 $19.1 $30 to $40New IRF’s - De novos 47.8 72.6 85 to 105 - Acquisitions 786.2 — TBD - Replacement hospitals — 11.1 10 to 20New home health and hospice acquisitions 200.2 48.1 50 to 100
$1,055.0 $150.9
$175 to $265,excluding IRFacquisitions
2015 2016 2017Actuals Actuals Assumptions
Debt (borrowings) redemptions, net $(1,060.3) $155.1 $TBD
Cash dividends on common stock(10) 77.2 83.8 ~$87Common stock repurchases 45.3 65.6 TBD
$(937.8) $304.5 $TBD
ShareholderDistributions
Growthin Core
Business
Debt Reduction
Hig
hest
Prio
rity
The Company has ~$39 million ofcontractual debt repayment obligations in2017.(9)
~$96 million authorization remainingas of December 31, 2016
Quarterly cash dividend currently set at$0.24 per common share
Appendix
19
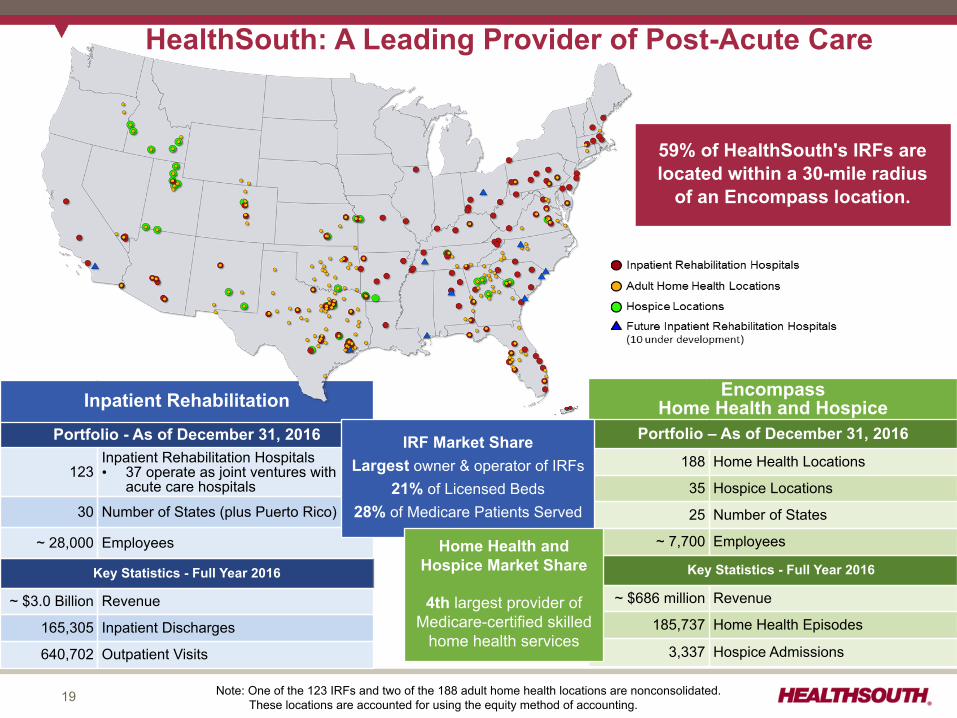
HealthSouth: A Leading Provider of Post-Acute Care
59% of HealthSouth's IRFs arelocated within a 30-mile radius
of an Encompass location.
Inpatient Rehabilitation
Portfolio - As of December 31, 2016
123Inpatient Rehabilitation Hospitals• 37 operate as joint ventures with
acute care hospitals
30 Number of States (plus Puerto Rico)
~ 28,000 Employees
Key Statistics - Full Year 2016
~ $3.0 Billion Revenue
165,305 Inpatient Discharges
640,702 Outpatient Visits
Note: One of the 123 IRFs and two of the 188 adult home health locations are nonconsolidated. These locations are accounted for using the equity method of accounting.
Encompass Home Health and Hospice
Portfolio – As of December 31, 2016188 Home Health Locations
35 Hospice Locations
25 Number of States
~ 7,700 Employees
Key Statistics - Full Year 2016
~ $686 million Revenue
185,737 Home Health Episodes
3,337 Hospice Admissions
IRF Market ShareLargest owner & operator of IRFs
21% of Licensed Beds28% of Medicare Patients Served
Home Health andHospice Market Share
4th largest provider ofMedicare-certified skilled
home health services
20
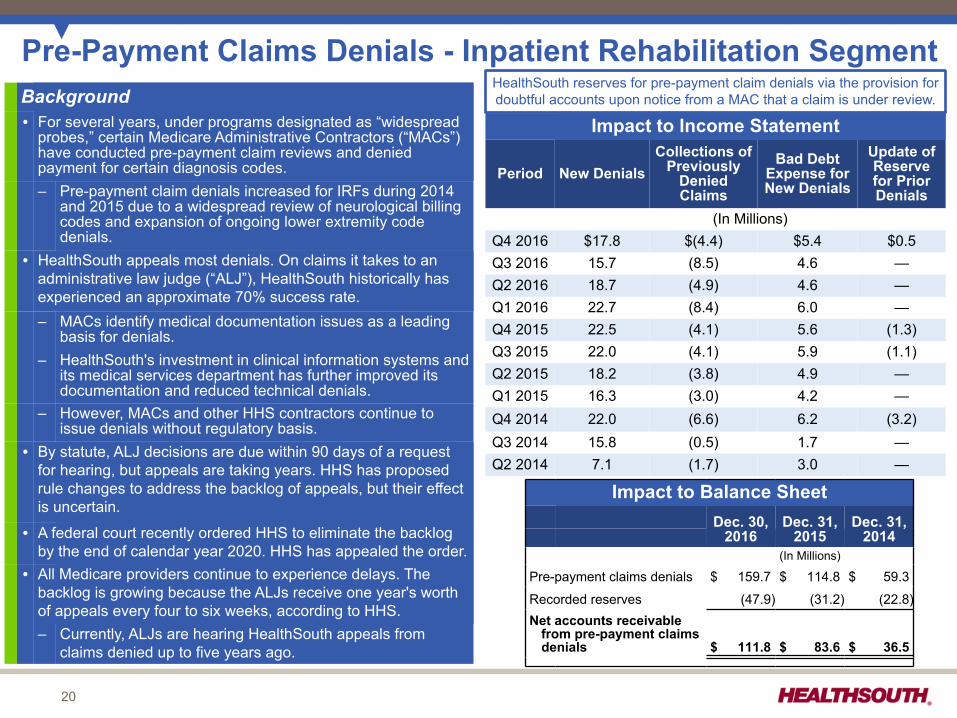
Pre-Payment Claims Denials - Inpatient Rehabilitation Segment
Impact to Income Statement
Period New DenialsCollections of
PreviouslyDeniedClaims
Bad DebtExpense forNew Denials
Update ofReservefor PriorDenials
(In Millions)Q4 2016 $17.8 $(4.4) $5.4 $0.5Q3 2016 15.7 (8.5) 4.6 —Q2 2016 18.7 (4.9) 4.6 —Q1 2016 22.7 (8.4) 6.0 —Q4 2015 22.5 (4.1) 5.6 (1.3)Q3 2015 22.0 (4.1) 5.9 (1.1)Q2 2015 18.2 (3.8) 4.9 —Q1 2015 16.3 (3.0) 4.2 —Q4 2014 22.0 (6.6) 6.2 (3.2)Q3 2014 15.8 (0.5) 1.7 —Q2 2014 7.1 (1.7) 3.0 —
Impact to Balance SheetDec. 30,
2016Dec. 31,
2015Dec. 31,
2014(In Millions)
Pre-payment claims denials $ 159.7 $ 114.8 $ 59.3
Recorded reserves (47.9) (31.2) (22.8)Net accounts receivable
from pre-payment claimsdenials $ 111.8 $ 83.6 $ 36.5
Background� For several years, under programs designated as “widespread
probes,” certain Medicare Administrative Contractors (“MACs”)have conducted pre-payment claim reviews and deniedpayment for certain diagnosis codes.– Pre-payment claim denials increased for IRFs during 2014
and 2015 due to a widespread review of neurological billingcodes and expansion of ongoing lower extremity codedenials.
� HealthSouth appeals most denials. On claims it takes to anadministrative law judge (“ALJ”), HealthSouth historically hasexperienced an approximate 70% success rate.– MACs identify medical documentation issues as a leading
basis for denials.– HealthSouth's investment in clinical information systems and
its medical services department has further improved itsdocumentation and reduced technical denials.
– However, MACs and other HHS contractors continue toissue denials without regulatory basis.
� By statute, ALJ decisions are due within 90 days of a requestfor hearing, but appeals are taking years. HHS has proposedrule changes to address the backlog of appeals, but their effectis uncertain.
� A federal court recently ordered HHS to eliminate the backlogby the end of calendar year 2020. HHS has appealed the order.
� All Medicare providers continue to experience delays. Thebacklog is growing because the ALJs receive one year's worthof appeals every four to six weeks, according to HHS.– Currently, ALJs are hearing HealthSouth appeals from
claims denied up to five years ago.
HealthSouth reserves for pre-payment claim denials via the provision fordoubtful accounts upon notice from a MAC that a claim is under review.
21
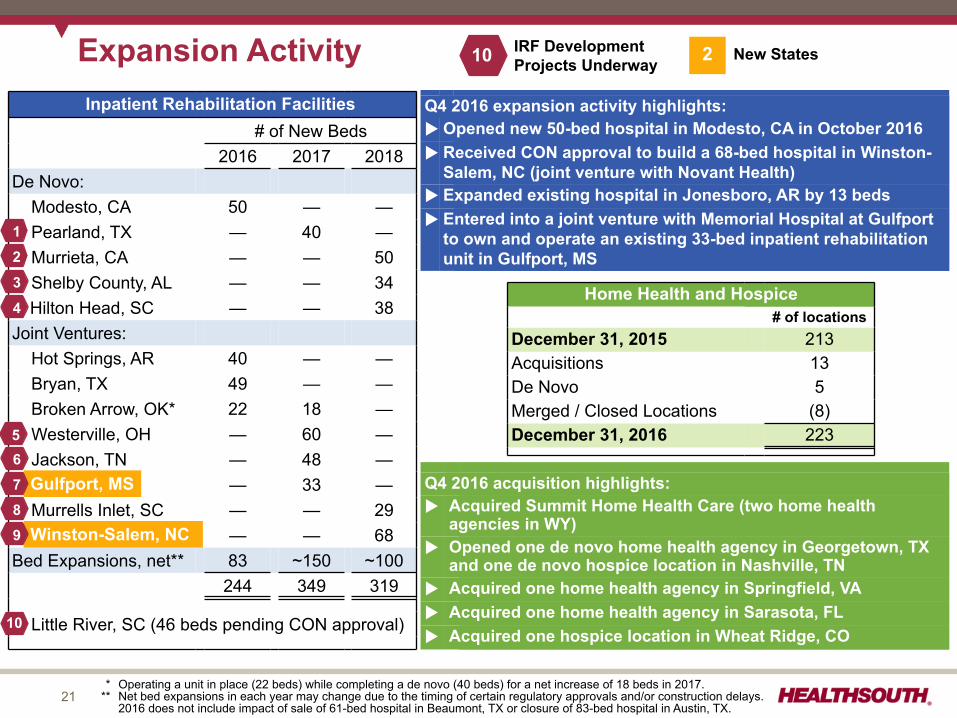
Expansion ActivityInpatient Rehabilitation Facilities
# of New Beds2016 2017 2018
De Novo: Modesto, CA 50 — — Pearland, TX — 40 — Murrieta, CA — — 50 Shelby County, AL — — 34
Hilton Head, SC — — 38Joint Ventures: Hot Springs, AR 40 — — Bryan, TX 49 — — Broken Arrow, OK* 22 18 — Westerville, OH — 60 — Jackson, TN — 48 —
Gulfport, MS — 33 — Murrells Inlet, SC — — 29
Winston-Salem, NC — — 68Bed Expansions, net** 83 ~150 ~100
244 349 319
Little River, SC (46 beds pending CON approval)
***
Operating a unit in place (22 beds) while completing a de novo (40 beds) for a net increase of 18 beds in 2017.Net bed expansions in each year may change due to the timing of certain regulatory approvals and/or construction delays.2016 does not include impact of sale of 61-bed hospital in Beaumont, TX or closure of 83-bed hospital in Austin, TX.
Q4 2016 acquisition highlights:u Acquired Summit Home Health Care (two home health
agencies in WY)u Opened one de novo home health agency in Georgetown, TX
and one de novo hospice location in Nashville, TNu Acquired one home health agency in Springfield, VAu Acquired one home health agency in Sarasota, FLu Acquired one hospice location in Wheat Ridge, CO
Q4 2016 expansion activity highlights:u Opened new 50-bed hospital in Modesto, CA in October 2016u Received CON approval to build a 68-bed hospital in Winston-
Salem, NC (joint venture with Novant Health)u Expanded existing hospital in Jonesboro, AR by 13 bedsu Entered into a joint venture with Memorial Hospital at Gulfport
to own and operate an existing 33-bed inpatient rehabilitationunit in Gulfport, MS2
3
4
56
10 IRF DevelopmentProjects Underway 2 New States
89
Home Health and Hospice# of locations
December 31, 2015 213Acquisitions 13De Novo 5Merged / Closed Locations (8)December 31, 2016 223
1
Gulfport, MS7
Winston-Salem, NC
10
9
22
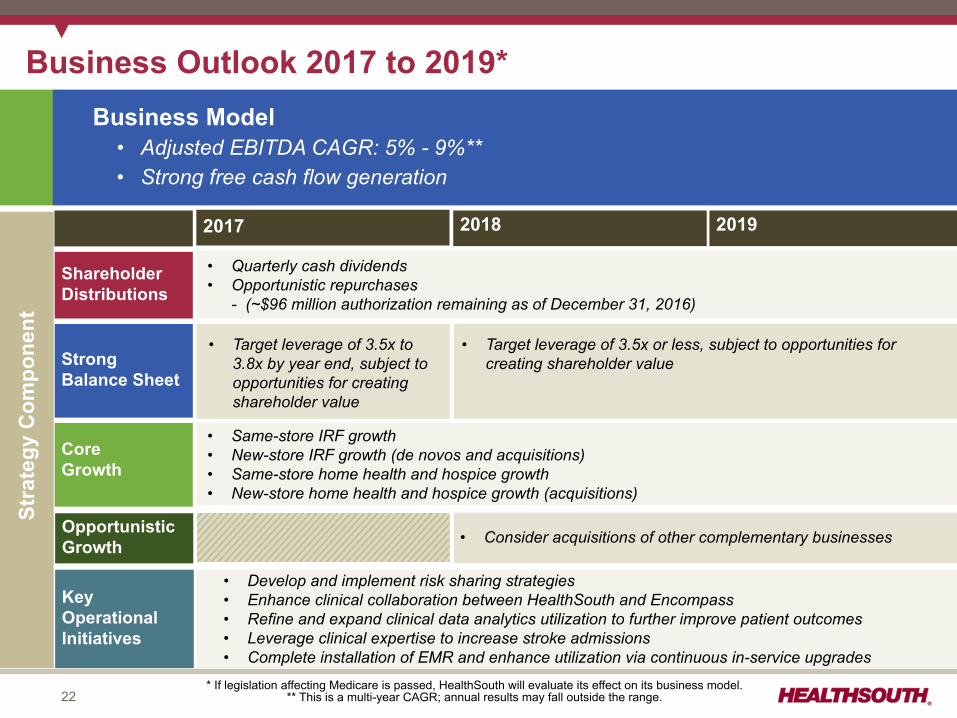
• Same-store IRF growth• New-store IRF growth (de novos and acquisitions)• Same-store home health and hospice growth• New-store home health and hospice growth (acquisitions)
CoreGrowth
StrongBalance Sheet
Key OperationalInitiatives
ShareholderDistributions
OpportunisticGrowth
Business Outlook 2017 to 2019*
2017 2018 2019
Business Model• Adjusted EBITDA CAGR: 5% - 9%** • Strong free cash flow generation
• Quarterly cash dividends• Opportunistic repurchases
- (~$96 million authorization remaining as of December 31, 2016)
• Develop and implement risk sharing strategies• Enhance clinical collaboration between HealthSouth and Encompass• Refine and expand clinical data analytics utilization to further improve patient outcomes• Leverage clinical expertise to increase stroke admissions• Complete installation of EMR and enhance utilization via continuous in-service upgrades
• Target leverage of 3.5x to3.8x by year end, subject toopportunities for creatingshareholder value
Stra
tegy
Com
pone
nt
• Consider acquisitions of other complementary businesses
• Target leverage of 3.5x or less, subject to opportunities forcreating shareholder value
* If legislation affecting Medicare is passed, HealthSouth will evaluate its effect on its business model.** This is a multi-year CAGR; annual results may fall outside the range.
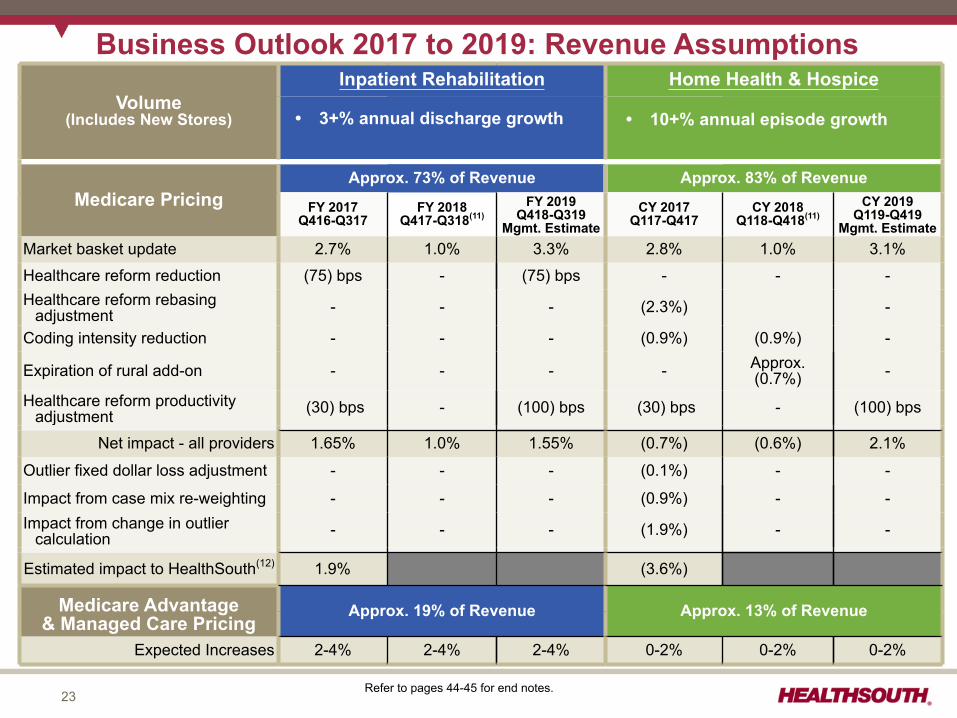
23
• 10% to15% annual episodegrowth
• Includes $35-$40 million per annum in agency acquisitions
Volume(Includes New Stores)
Inpatient Rehabilitation Home Health & Hospice
Medicare PricingApprox. 73% of Revenue Approx. 83% of Revenue
FY 2017Q416-Q317
FY 2018Q417-Q318(11)
FY 2019Q418-Q319
Mgmt. EstimateCY 2017
Q117-Q417CY 2018
Q118-Q418(11)CY 2019
Q119-Q419Mgmt. Estimate
Market basket update 2.7% 1.0% 3.3% 2.8% 1.0% 3.1%
Healthcare reform reduction (75) bps - (75) bps - - -Healthcare reform rebasing
adjustment - - - (2.3%) -
Coding intensity reduction - - - (0.9%) (0.9%) -
Expiration of rural add-on - - - - Approx.(0.7%) -
Healthcare reform productivityadjustment (30) bps - (100) bps (30) bps - (100) bps
Net impact - all providers 1.65% 1.0% 1.55% (0.7%) (0.6%) 2.1%
Outlier fixed dollar loss adjustment - - - (0.1%) - -
Impact from case mix re-weighting - - - (0.9%) - -Impact from change in outlier
calculation - - - (1.9%) - -
Estimated impact to HealthSouth(12) 1.9% (3.6%)
Medicare Advantage & Managed Care Pricing
Approx. 19% of Revenue Approx. 13% of Revenue
Expected Increases 2-4% 2-4% 2-4% 0-2% 0-2% 0-2%
Business Outlook 2017 to 2019: Revenue Assumptions
• 3+% annual discharge growth • 10+% annual episode growth
Refer to pages 44-45 for end notes.
24
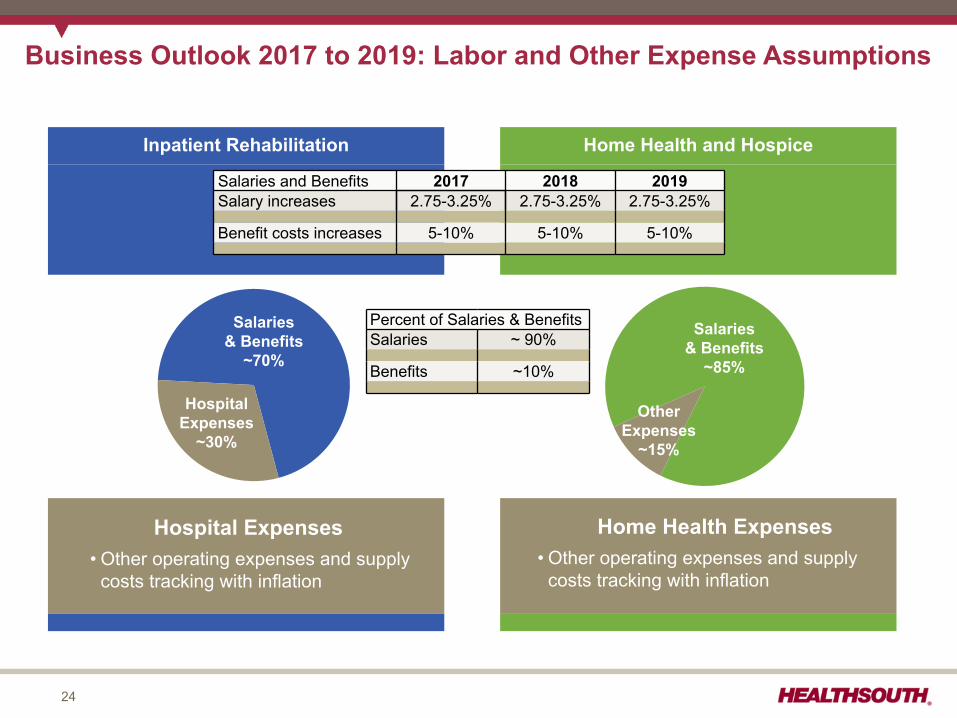
Inpatient Rehabilitation Home Health and Hospice
Business Outlook 2017 to 2019: Labor and Other Expense Assumptions
Salaries & Benefits
~70%
HospitalExpenses
~30%
Salaries and Benefits 2017 2018 2019Salary increases 2.75-3.25% 2.75-3.25% 2.75-3.25%
Benefit costs increases 5-10% 5-10% 5-10%
Hospital Expenses• Other operating expenses and supply
costs tracking with inflation
Salaries & Benefits
~85%
OtherExpenses
~15%
Home Health Expenses• Other operating expenses and supply
costs tracking with inflation
Percent of Salaries & BenefitsSalaries ~ 90%
Benefits ~10%
25
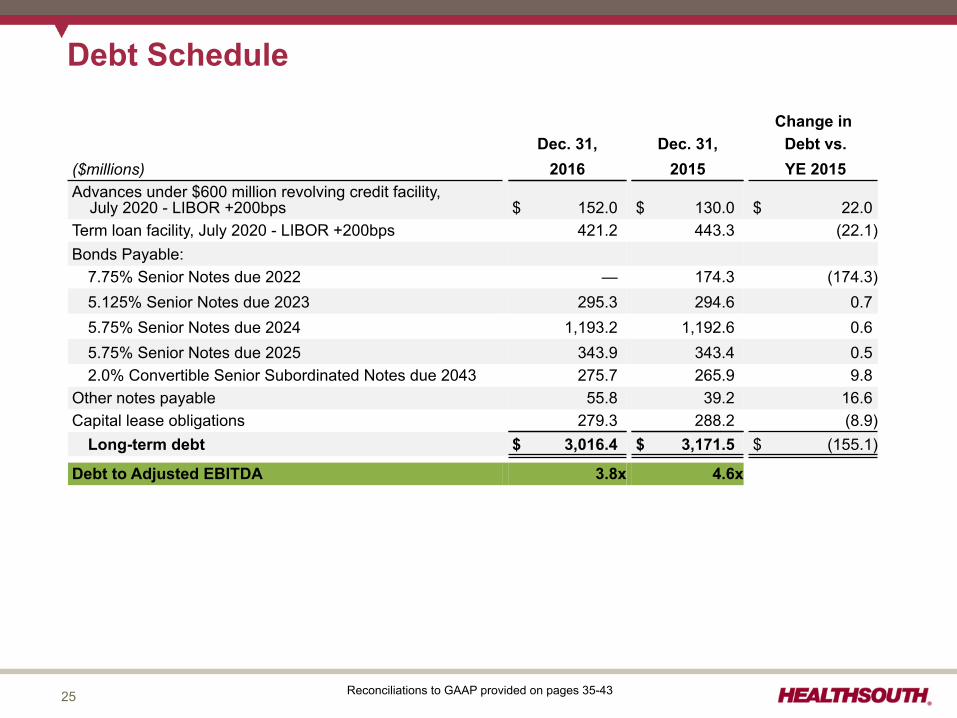
Debt Schedule
Change inDec. 31, Dec. 31, Debt vs.
($millions) 2016 2015 YE 2015Advances under $600 million revolving credit facility, July 2020 - LIBOR +200bps $ 152.0 $ 130.0 $ 22.0Term loan facility, July 2020 - LIBOR +200bps 421.2 443.3 (22.1)Bonds Payable:
7.75% Senior Notes due 2022 — 174.3 (174.3)5.125% Senior Notes due 2023 295.3 294.6 0.75.75% Senior Notes due 2024 1,193.2 1,192.6 0.65.75% Senior Notes due 2025 343.9 343.4 0.52.0% Convertible Senior Subordinated Notes due 2043 275.7 265.9 9.8
Other notes payable 55.8 39.2 16.6Capital lease obligations 279.3 288.2 (8.9)
Long-term debt $ 3,016.4 $ 3,171.5 $ (155.1)
Debt to Adjusted EBITDA 3.8x 4.6x
Reconciliations to GAAP provided on pages 35-43
26
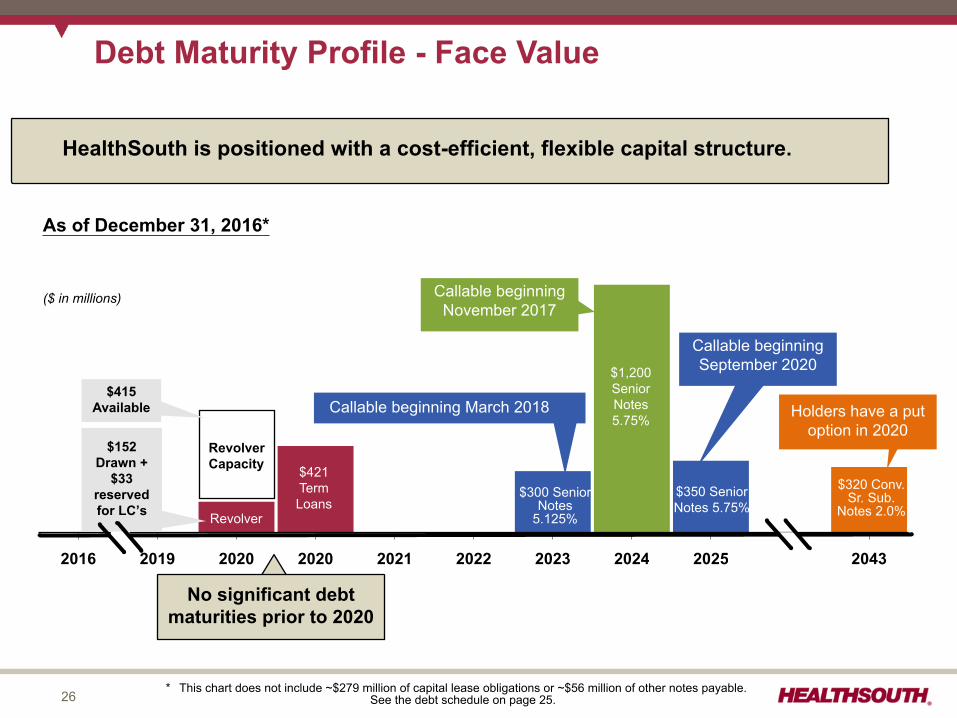
2016 2019 2020 2020 2021 2022 2023 2024 2025 2043
$350 SeniorNotes 5.75%
$1,200SeniorNotes5.75%
$320 Conv.Sr. Sub.
Notes 2.0%$300 Senior
Notes5.125%
$152Drawn +
$33reservedfor LC’s
Holders have a putoption in 2020
As of December 31, 2016*
Debt Maturity Profile - Face Value
($ in millions)
$415Available
Callable beginningNovember 2017
HealthSouth is positioned with a cost-efficient, flexible capital structure.
Callable beginning March 2018
Revolver
RevolverCapacity $421
TermLoans
Callable beginningSeptember 2020
* This chart does not include ~$279 million of capital lease obligations or ~$56 million of other notes payable.See the debt schedule on page 25.
No significant debtmaturities prior to 2020
27
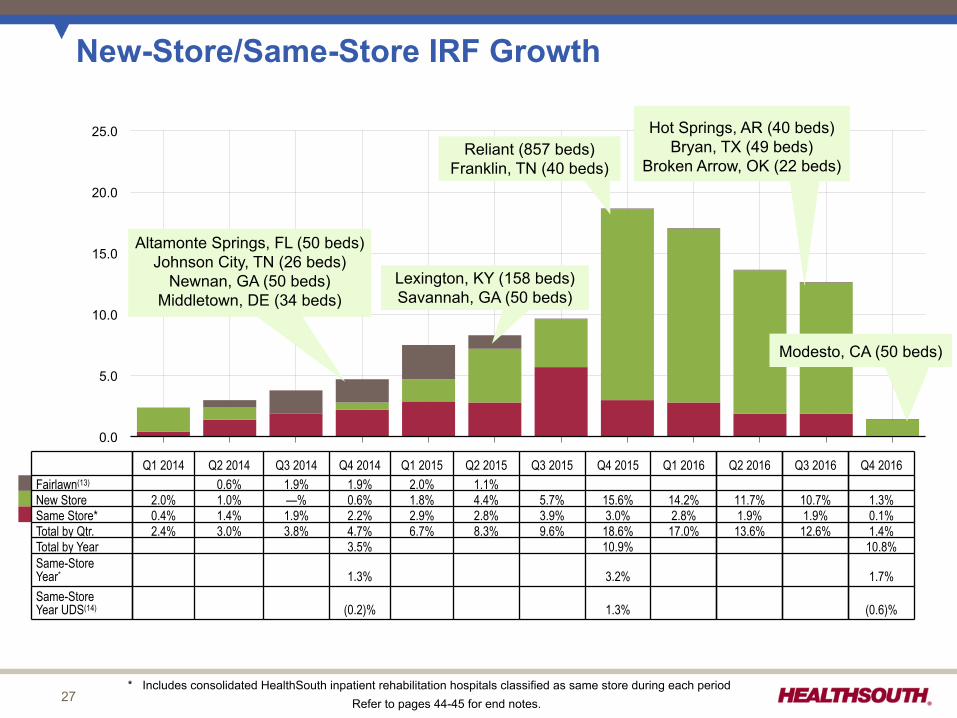
25.0
20.0
15.0
10.0
5.0
0.0
Q1 2014 Q2 2014 Q3 2014 Q4 2014 Q1 2015 Q2 2015 Q3 2015 Q4 2015 Q1 2016 Q2 2016 Q3 2016 Q4 2016
New-Store/Same-Store IRF Growth
Q1 2014 Q2 2014 Q3 2014 Q4 2014 Q1 2015 Q2 2015 Q3 2015 Q4 2015 Q1 2016 Q2 2016 Q3 2016 Q4 2016Fairlawn(13) 0.6% 1.9% 1.9% 2.0% 1.1%New Store 2.0% 1.0% —% 0.6% 1.8% 4.4% 5.7% 15.6% 14.2% 11.7% 10.7% 1.3%Same Store* 0.4% 1.4% 1.9% 2.2% 2.9% 2.8% 3.9% 3.0% 2.8% 1.9% 1.9% 0.1%Total by Qtr. 2.4% 3.0% 3.8% 4.7% 6.7% 8.3% 9.6% 18.6% 17.0% 13.6% 12.6% 1.4%Total by Year 3.5% 10.9% 10.8%Same-StoreYear* 1.3% 3.2% 1.7%Same-StoreYear UDS(14) (0.2)% 1.3% (0.6)%
Altamonte Springs, FL (50 beds)Johnson City, TN (26 beds)
Newnan, GA (50 beds)Middletown, DE (34 beds)
Reliant (857 beds)Franklin, TN (40 beds)
Lexington, KY (158 beds)Savannah, GA (50 beds)
Hot Springs, AR (40 beds)Bryan, TX (49 beds)
Broken Arrow, OK (22 beds)
* Includes consolidated HealthSouth inpatient rehabilitation hospitals classified as same store during each periodRefer to pages 44-45 for end notes.
Modesto, CA (50 beds)
28
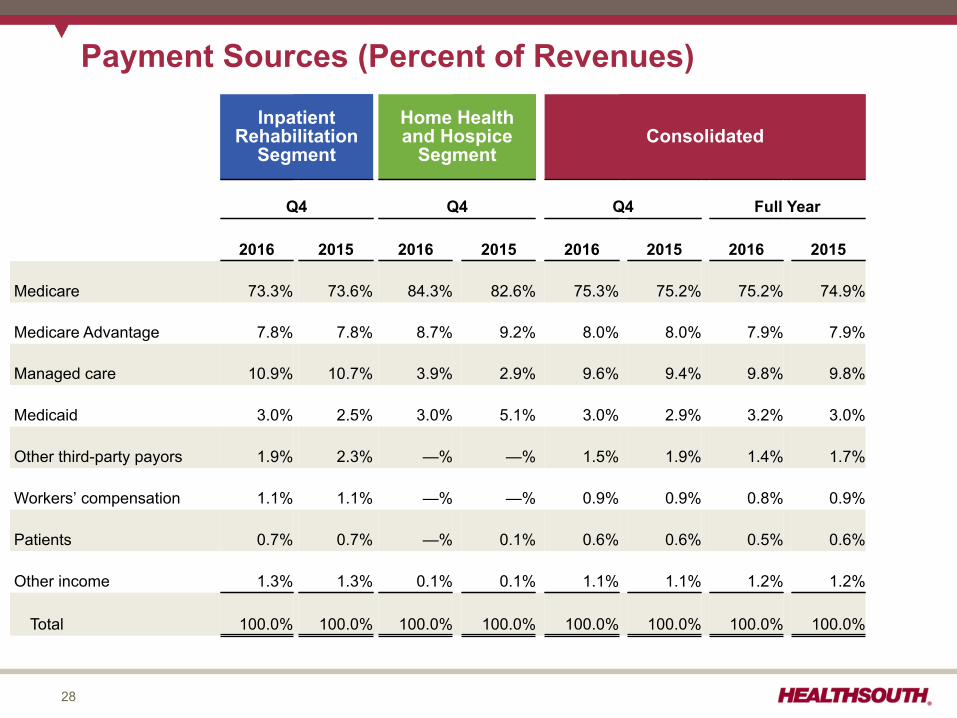
Payment Sources (Percent of Revenues)
InpatientRehabilitation
Segment
Home Healthand Hospice
SegmentConsolidated
Q4 Q4 Q4 Full Year
2016 2015 2016 2015 2016 2015 2016 2015
Medicare 73.3% 73.6% 84.3% 82.6% 75.3% 75.2% 75.2% 74.9%
Medicare Advantage 7.8% 7.8% 8.7% 9.2% 8.0% 8.0% 7.9% 7.9%
Managed care 10.9% 10.7% 3.9% 2.9% 9.6% 9.4% 9.8% 9.8%
Medicaid 3.0% 2.5% 3.0% 5.1% 3.0% 2.9% 3.2% 3.0%
Other third-party payors 1.9% 2.3% —% —% 1.5% 1.9% 1.4% 1.7%
Workers’ compensation 1.1% 1.1% —% —% 0.9% 0.9% 0.8% 0.9%
Patients 0.7% 0.7% —% 0.1% 0.6% 0.6% 0.5% 0.6%
Other income 1.3% 1.3% 0.1% 0.1% 1.1% 1.1% 1.2% 1.2%
Total 100.0% 100.0% 100.0% 100.0% 100.0% 100.0% 100.0% 100.0%
29
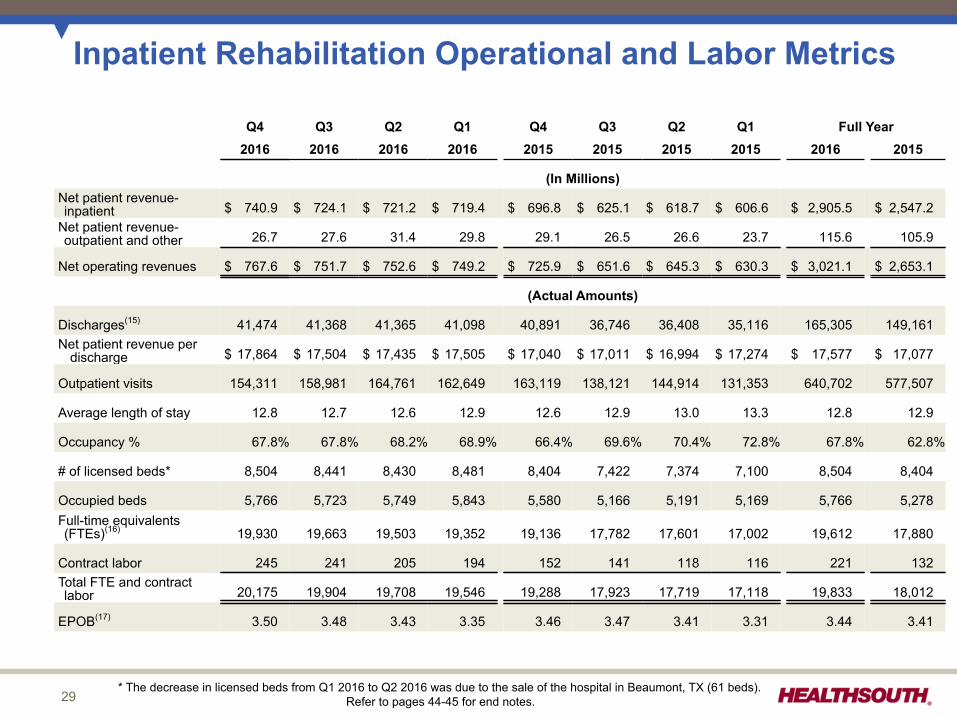
Inpatient Rehabilitation Operational and Labor Metrics
Q4 Q3 Q2 Q1 Q4 Q3 Q2 Q1 Full Year2016 2016 2016 2016 2015 2015 2015 2015 2016 2015
(In Millions)Net patient revenue-inpatient $ 740.9 $ 724.1 $ 721.2 $ 719.4 $ 696.8 $ 625.1 $ 618.7 $ 606.6 $ 2,905.5 $ 2,547.2
Net patient revenue-outpatient and other 26.7 27.6 31.4 29.8 29.1 26.5 26.6 23.7 115.6 105.9
Net operating revenues $ 767.6 $ 751.7 $ 752.6 $ 749.2 $ 725.9 $ 651.6 $ 645.3 $ 630.3 $ 3,021.1 $ 2,653.1
(Actual Amounts)
Discharges(15) 41,474 41,368 41,365 41,098 40,891 36,746 36,408 35,116 165,305 149,161Net patient revenue per
discharge $ 17,864 $ 17,504 $ 17,435 $ 17,505 $ 17,040 $ 17,011 $ 16,994 $ 17,274 $ 17,577 $ 17,077
Outpatient visits 154,311 158,981 164,761 162,649 163,119 138,121 144,914 131,353 640,702 577,507
Average length of stay 12.8 12.7 12.6 12.9 12.6 12.9 13.0 13.3 12.8 12.9
Occupancy % 67.8% 67.8% 68.2% 68.9% 66.4% 69.6% 70.4% 72.8% 67.8% 62.8%
# of licensed beds* 8,504 8,441 8,430 8,481 8,404 7,422 7,374 7,100 8,504 8,404
Occupied beds 5,766 5,723 5,749 5,843 5,580 5,166 5,191 5,169 5,766 5,278Full-time equivalents(FTEs)(16) 19,930 19,663 19,503 19,352 19,136 17,782 17,601 17,002 19,612 17,880
Contract labor 245 241 205 194 152 141 118 116 221 132Total FTE and contractlabor 20,175 19,904 19,708 19,546 19,288 17,923 17,719 17,118 19,833 18,012
EPOB(17) 3.50 3.48 3.43 3.35 3.46 3.47 3.41 3.31 3.44 3.41
* The decrease in licensed beds from Q1 2016 to Q2 2016 was due to the sale of the hospital in Beaumont, TX (61 beds).Refer to pages 44-45 for end notes.
30
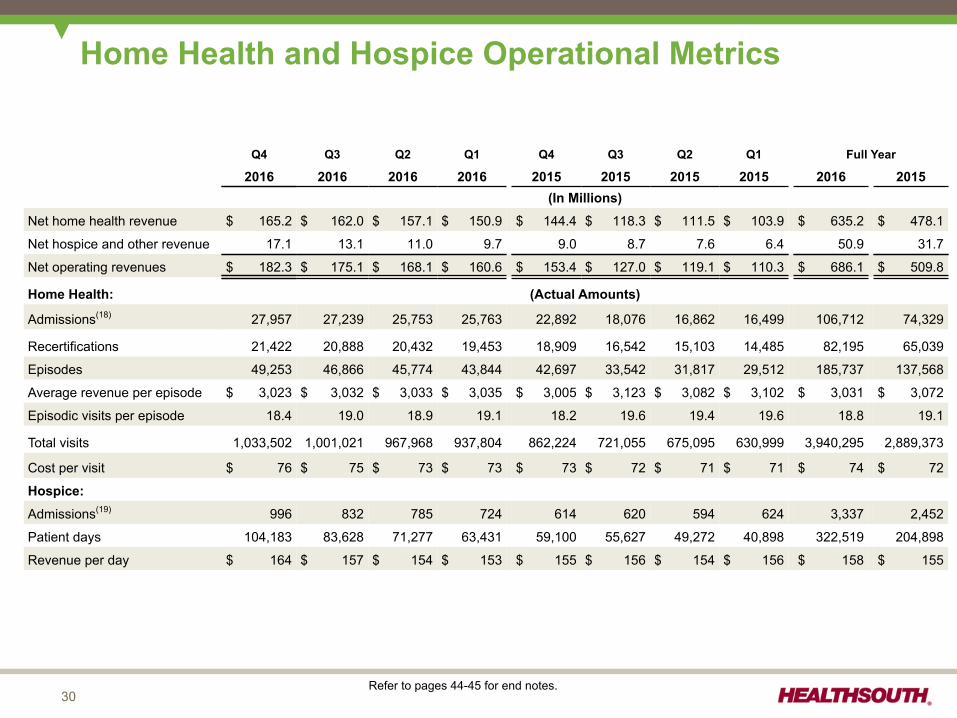
Home Health and Hospice Operational Metrics
Q4 Q3 Q2 Q1 Q4 Q3 Q2 Q1 Full Year
2016 2016 2016 2016 2015 2015 2015 2015 2016 2015(In Millions)
Net home health revenue $ 165.2 $ 162.0 $ 157.1 $ 150.9 $ 144.4 $ 118.3 $ 111.5 $ 103.9 $ 635.2 $ 478.1
Net hospice and other revenue 17.1 13.1 11.0 9.7 9.0 8.7 7.6 6.4 50.9 31.7
Net operating revenues $ 182.3 $ 175.1 $ 168.1 $ 160.6 $ 153.4 $ 127.0 $ 119.1 $ 110.3 $ 686.1 $ 509.8
Home Health: (Actual Amounts)
Admissions(18) 27,957 27,239 25,753 25,763 22,892 18,076 16,862 16,499 106,712 74,329
Recertifications 21,422 20,888 20,432 19,453 18,909 16,542 15,103 14,485 82,195 65,039
Episodes 49,253 46,866 45,774 43,844 42,697 33,542 31,817 29,512 185,737 137,568
Average revenue per episode $ 3,023 $ 3,032 $ 3,033 $ 3,035 $ 3,005 $ 3,123 $ 3,082 $ 3,102 $ 3,031 $ 3,072
Episodic visits per episode 18.4 19.0 18.9 19.1 18.2 19.6 19.4 19.6 18.8 19.1
Total visits 1,033,502 1,001,021 967,968 937,804 862,224 721,055 675,095 630,999 3,940,295 2,889,373
Cost per visit $ 76 $ 75 $ 73 $ 73 $ 73 $ 72 $ 71 $ 71 $ 74 $ 72
Hospice:Admissions(19) 996 832 785 724 614 620 594 624 3,337 2,452
Patient days 104,183 83,628 71,277 63,431 59,100 55,627 49,272 40,898 322,519 204,898
Revenue per day $ 164 $ 157 $ 154 $ 153 $ 155 $ 156 $ 154 $ 156 $ 158 $ 155
Refer to pages 44-45 for end notes.
31
Common Stock Warrants
On September 30, 2009, HealthSouth issued 8,151,265 warrants in satisfaction of its obligationunder the comprehensive settlement of the 2003 consolidated class action suit brought by theCompany’s stockholders and bondholders.
Under the terms of the agreement, the warrants were exercisable at a price of $41.40 pershare by means of cash or cashless exercise at the option of the holder.
The warrants expired at 5 p.m. EST on January 17, 2017.
Warrants Shares IssuedCash Received
(Millions)
Outstanding Warrants 8,151,265 — $ —
Cash Exercise* (644,376) 644,376 26.7
Cashless Exercise** (6,475,449) 54,970 —
Expired (Unexercised) (1,031,440) — —
As of January 17, 2017 — 699,346 $ 26.7
HealthSouth repurchased approximately 1.1 million shares of common stock in Q4 2016,resulting in a net reduction to the diluted share count of approximately 0.4 million sharesafter the exercise of the above warrants in January 2017.
* In a cash exercise, the warrant holder exchanges one warrant for one share of common stock and tenders cash of $41.40 per share.** If the holder chooses a cashless exercise, the company issues the number of shares equal in value to the in-the-money amount of the warrant. No cash is received from the holder.
32
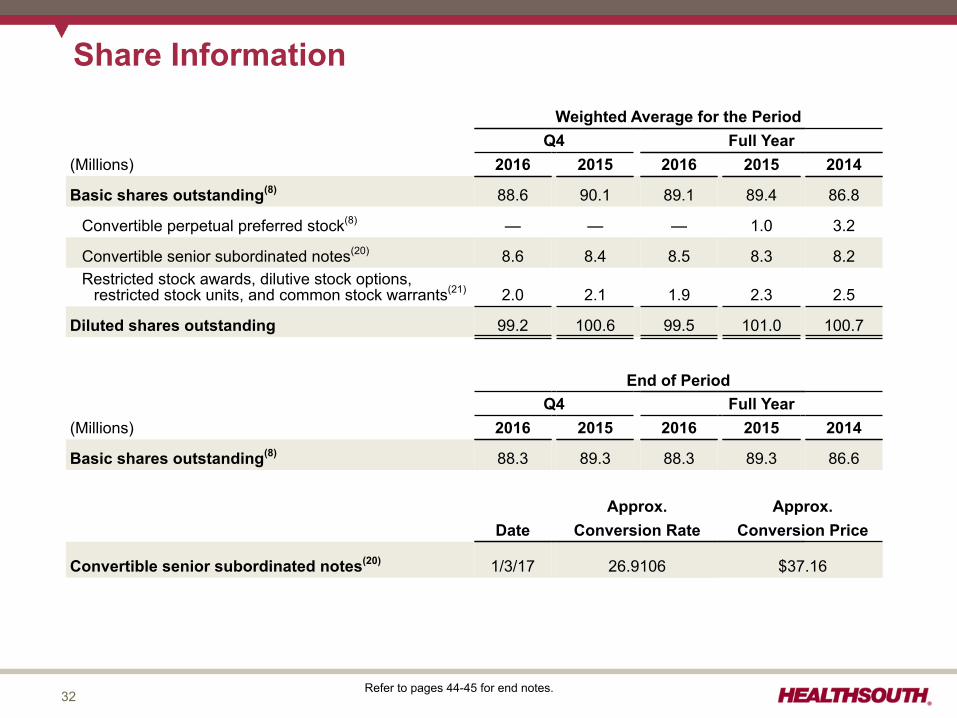
Share Information
Weighted Average for the PeriodQ4 Full Year
(Millions) 2016 2015 2016 2015 2014
Basic shares outstanding(8) 88.6 90.1 89.1 89.4 86.8
Convertible perpetual preferred stock(8) — — — 1.0 3.2
Convertible senior subordinated notes(20) 8.6 8.4 8.5 8.3 8.2Restricted stock awards, dilutive stock options,
restricted stock units, and common stock warrants(21) 2.0 2.1 1.9 2.3 2.5
Diluted shares outstanding 99.2 100.6 99.5 101.0 100.7
End of PeriodQ4 Full Year
(Millions) 2016 2015 2016 2015 2014
Basic shares outstanding(8) 88.3 89.3 88.3 89.3 86.6
Approx. Approx.Date Conversion Rate Conversion Price
Convertible senior subordinated notes(20) 1/3/17 26.9106 $37.16
Refer to pages 44-45 for end notes.
33
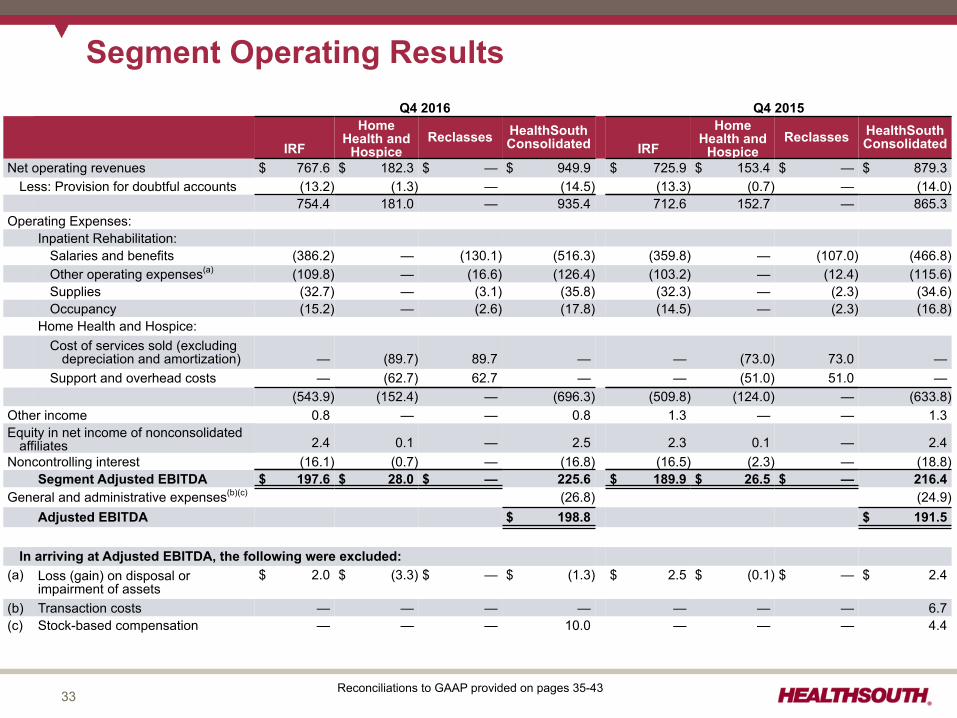
Segment Operating ResultsQ4 2016 Q4 2015
IRF
HomeHealth and
HospiceReclasses HealthSouth
Consolidated IRF
HomeHealth and
HospiceReclasses HealthSouth
Consolidated
Net operating revenues $ 767.6 $ 182.3 $ — $ 949.9 $ 725.9 $ 153.4 $ — $ 879.3Less: Provision for doubtful accounts (13.2) (1.3) — (14.5) (13.3) (0.7) — (14.0)
754.4 181.0 — 935.4 712.6 152.7 — 865.3Operating Expenses:
Inpatient Rehabilitation:Salaries and benefits (386.2) — (130.1) (516.3) (359.8) — (107.0) (466.8)Other operating expenses(a) (109.8) — (16.6) (126.4) (103.2) — (12.4) (115.6)Supplies (32.7) — (3.1) (35.8) (32.3) — (2.3) (34.6)Occupancy (15.2) — (2.6) (17.8) (14.5) — (2.3) (16.8)
Home Health and Hospice:Cost of services sold (excluding
depreciation and amortization) — (89.7) 89.7 — — (73.0) 73.0 —Support and overhead costs — (62.7) 62.7 — — (51.0) 51.0 —
(543.9) (152.4) — (696.3) (509.8) (124.0) — (633.8)Other income 0.8 — — 0.8 1.3 — — 1.3Equity in net income of nonconsolidated
affiliates 2.4 0.1 — 2.5 2.3 0.1 — 2.4Noncontrolling interest (16.1) (0.7) — (16.8) (16.5) (2.3) — (18.8)
Segment Adjusted EBITDA $ 197.6 $ 28.0 $ — 225.6 $ 189.9 $ 26.5 $ — 216.4General and administrative expenses(b)(c) (26.8) (24.9)
Adjusted EBITDA $ 198.8 $ 191.5
In arriving at Adjusted EBITDA, the following were excluded:(a) Loss (gain) on disposal or
impairment of assets$ 2.0 $ (3.3) $ — $ (1.3) $ 2.5 $ (0.1) $ — $ 2.4
(b) Transaction costs — — — — — — — 6.7(c) Stock-based compensation — — — 10.0 — — — 4.4
Reconciliations to GAAP provided on pages 35-43
34
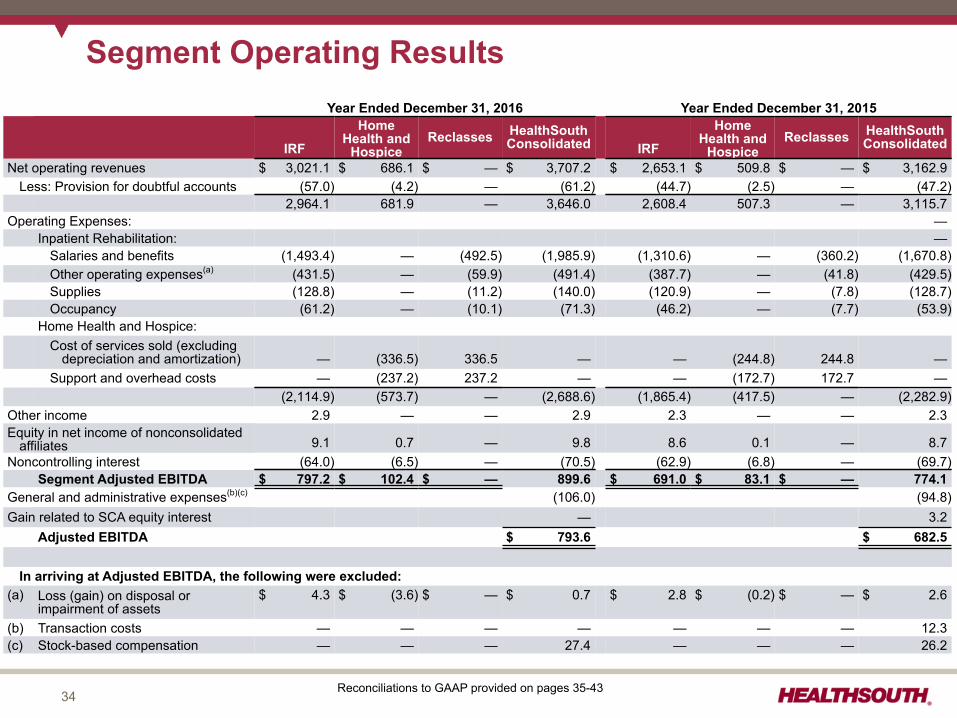
Segment Operating ResultsYear Ended December 31, 2016 Year Ended December 31, 2015
IRF
HomeHealth and
HospiceReclasses HealthSouth
Consolidated IRF
HomeHealth and
HospiceReclasses HealthSouth
Consolidated
Net operating revenues $ 3,021.1 $ 686.1 $ — $ 3,707.2 $ 2,653.1 $ 509.8 $ — $ 3,162.9Less: Provision for doubtful accounts (57.0) (4.2) — (61.2) (44.7) (2.5) — (47.2)
2,964.1 681.9 — 3,646.0 2,608.4 507.3 — 3,115.7Operating Expenses: —
Inpatient Rehabilitation: —Salaries and benefits (1,493.4) — (492.5) (1,985.9) (1,310.6) — (360.2) (1,670.8)Other operating expenses(a) (431.5) — (59.9) (491.4) (387.7) — (41.8) (429.5)Supplies (128.8) — (11.2) (140.0) (120.9) — (7.8) (128.7)Occupancy (61.2) — (10.1) (71.3) (46.2) — (7.7) (53.9)
Home Health and Hospice:Cost of services sold (excluding
depreciation and amortization) — (336.5) 336.5 — — (244.8) 244.8 —Support and overhead costs — (237.2) 237.2 — — (172.7) 172.7 —
(2,114.9) (573.7) — (2,688.6) (1,865.4) (417.5) — (2,282.9)Other income 2.9 — — 2.9 2.3 — — 2.3Equity in net income of nonconsolidated
affiliates 9.1 0.7 — 9.8 8.6 0.1 — 8.7Noncontrolling interest (64.0) (6.5) — (70.5) (62.9) (6.8) — (69.7)
Segment Adjusted EBITDA $ 797.2 $ 102.4 $ — 899.6 $ 691.0 $ 83.1 $ — 774.1General and administrative expenses(b)(c) (106.0) (94.8)Gain related to SCA equity interest — 3.2
Adjusted EBITDA $ 793.6 $ 682.5
In arriving at Adjusted EBITDA, the following were excluded:(a) Loss (gain) on disposal or
impairment of assets$ 4.3 $ (3.6) $ — $ 0.7 $ 2.8 $ (0.2) $ — $ 2.6
(b) Transaction costs — — — — — — — 12.3(c) Stock-based compensation — — — 27.4 — — — 26.2
Reconciliations to GAAP provided on pages 35-43
35
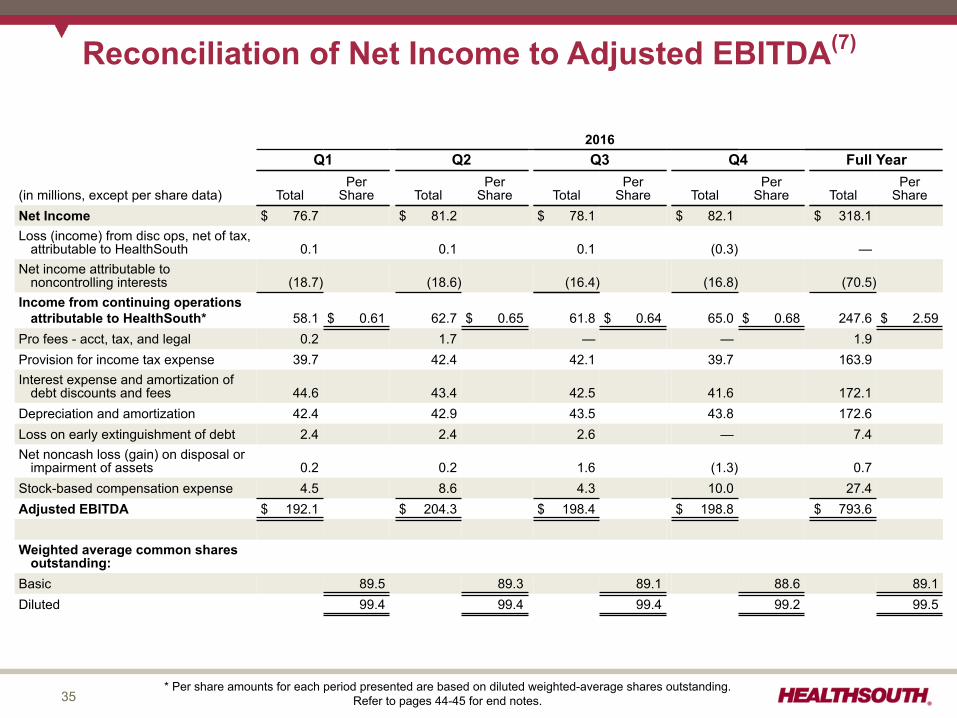
Reconciliation of Net Income to Adjusted EBITDA(7)
2016Q1 Q2 Q3 Q4 Full Year
(in millions, except per share data) TotalPer
Share TotalPer
Share TotalPer
Share TotalPer
Share TotalPer
ShareNet Income $ 76.7 $ 81.2 $ 78.1 $ 82.1 $ 318.1Loss (income) from disc ops, net of tax,
attributable to HealthSouth 0.1 0.1 0.1 (0.3) —Net income attributable to
noncontrolling interests (18.7) (18.6) (16.4) (16.8) (70.5)Income from continuing operations
attributable to HealthSouth* 58.1 $ 0.61 62.7 $ 0.65 61.8 $ 0.64 65.0 $ 0.68 247.6 $ 2.59Pro fees - acct, tax, and legal 0.2 1.7 — — 1.9Provision for income tax expense 39.7 42.4 42.1 39.7 163.9Interest expense and amortization of
debt discounts and fees 44.6 43.4 42.5 41.6 172.1Depreciation and amortization 42.4 42.9 43.5 43.8 172.6Loss on early extinguishment of debt 2.4 2.4 2.6 — 7.4Net noncash loss (gain) on disposal or
impairment of assets 0.2 0.2 1.6 (1.3) 0.7Stock-based compensation expense 4.5 8.6 4.3 10.0 27.4Adjusted EBITDA $ 192.1 $ 204.3 $ 198.4 $ 198.8 $ 793.6
Weighted average common sharesoutstanding:
Basic 89.5 89.3 89.1 88.6 89.1Diluted 99.4 99.4 99.4 99.2 99.5
* Per share amounts for each period presented are based on diluted weighted-average shares outstanding.Refer to pages 44-45 for end notes.
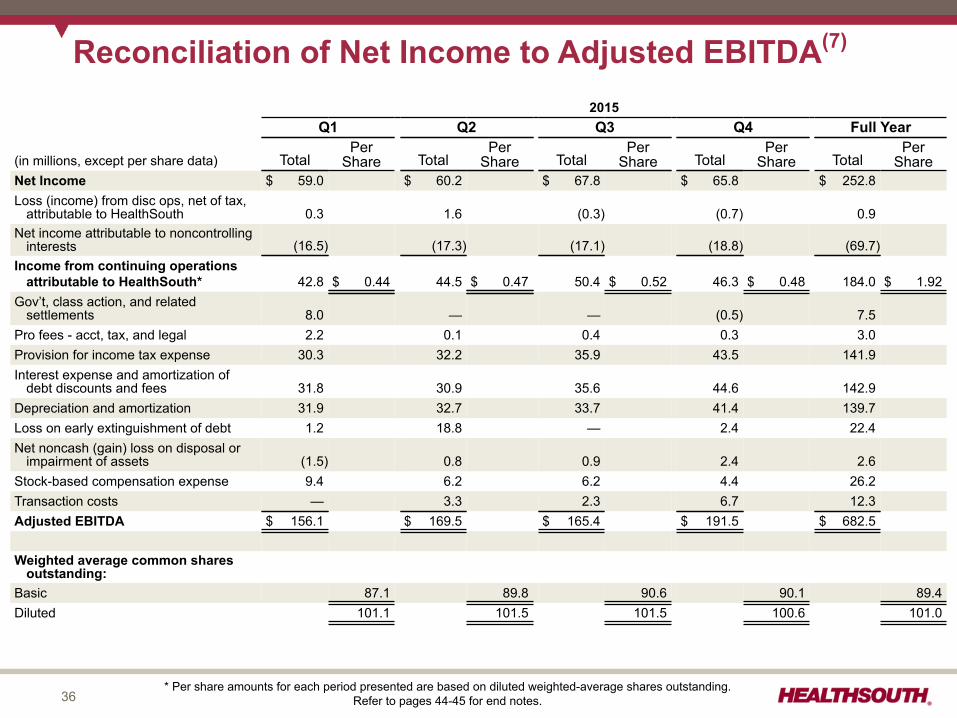
36
Reconciliation of Net Income to Adjusted EBITDA(7)
2015Q1 Q2 Q3 Q4 Full Year
(in millions, except per share data) TotalPer
Share TotalPer
Share TotalPer
Share TotalPer
Share TotalPer
ShareNet Income $ 59.0 $ 60.2 $ 67.8 $ 65.8 $ 252.8Loss (income) from disc ops, net of tax,
attributable to HealthSouth 0.3 1.6 (0.3) (0.7) 0.9Net income attributable to noncontrolling
interests (16.5) (17.3) (17.1) (18.8) (69.7)Income from continuing operations
attributable to HealthSouth* 42.8 $ 0.44 44.5 $ 0.47 50.4 $ 0.52 46.3 $ 0.48 184.0 $ 1.92Gov’t, class action, and related
settlements 8.0 — — (0.5) 7.5Pro fees - acct, tax, and legal 2.2 0.1 0.4 0.3 3.0Provision for income tax expense 30.3 32.2 35.9 43.5 141.9Interest expense and amortization of
debt discounts and fees 31.8 30.9 35.6 44.6 142.9Depreciation and amortization 31.9 32.7 33.7 41.4 139.7Loss on early extinguishment of debt 1.2 18.8 — 2.4 22.4Net noncash (gain) loss on disposal or
impairment of assets (1.5) 0.8 0.9 2.4 2.6Stock-based compensation expense 9.4 6.2 6.2 4.4 26.2Transaction costs — 3.3 2.3 6.7 12.3Adjusted EBITDA $ 156.1 $ 169.5 $ 165.4 $ 191.5 $ 682.5
Weighted average common sharesoutstanding:
Basic 87.1 89.8 90.6 90.1 89.4Diluted 101.1 101.5 101.5 100.6 101.0
* Per share amounts for each period presented are based on diluted weighted-average shares outstanding.Refer to pages 44-45 for end notes.
37
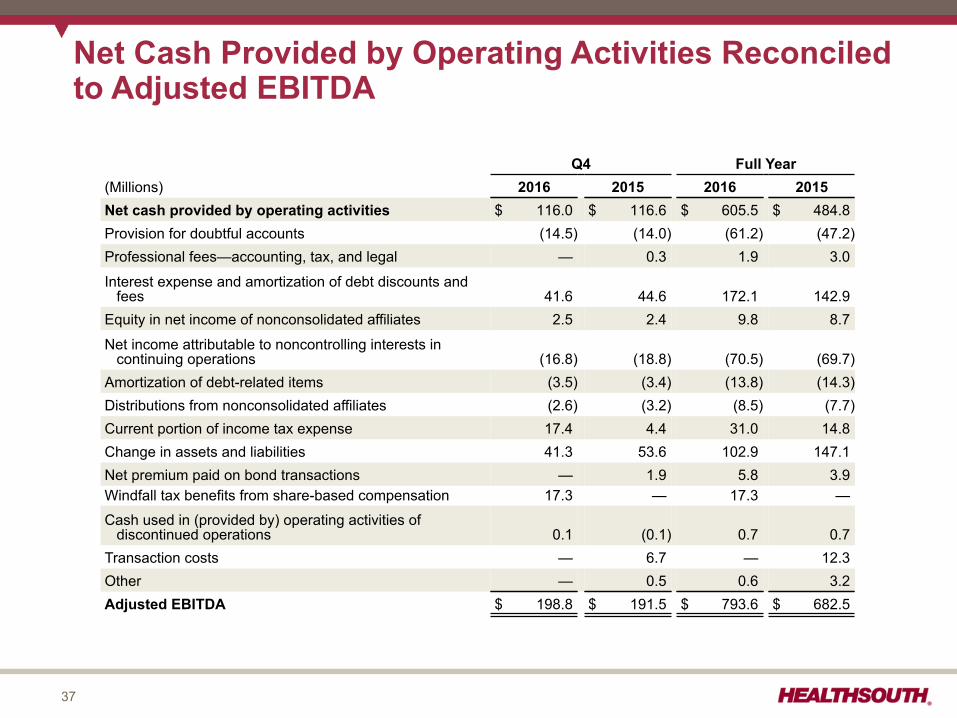
Net Cash Provided by Operating Activities Reconciledto Adjusted EBITDA
Q4 Full Year(Millions) 2016 2015 2016 2015Net cash provided by operating activities $ 116.0 $ 116.6 $ 605.5 $ 484.8Provision for doubtful accounts (14.5) (14.0) (61.2) (47.2)Professional fees—accounting, tax, and legal — 0.3 1.9 3.0
Interest expense and amortization of debt discounts andfees 41.6 44.6 172.1 142.9
Equity in net income of nonconsolidated affiliates 2.5 2.4 9.8 8.7
Net income attributable to noncontrolling interests incontinuing operations (16.8) (18.8) (70.5) (69.7)
Amortization of debt-related items (3.5) (3.4) (13.8) (14.3)Distributions from nonconsolidated affiliates (2.6) (3.2) (8.5) (7.7)Current portion of income tax expense 17.4 4.4 31.0 14.8Change in assets and liabilities 41.3 53.6 102.9 147.1Net premium paid on bond transactions — 1.9 5.8 3.9Windfall tax benefits from share-based compensation 17.3 — 17.3 —
Cash used in (provided by) operating activities ofdiscontinued operations 0.1 (0.1) 0.7 0.7
Transaction costs — 6.7 — 12.3Other — 0.5 0.6 3.2Adjusted EBITDA $ 198.8 $ 191.5 $ 793.6 $ 682.5
38
Reconciliation of Segment Adjusted EBITDA to Incomefrom Continuing Operations Before Income Tax Expense
Three Months Ended Year Ended
December 31, December 31,
2016 2015 2016 2015In Millions
Total segment Adjusted EBITDA $ 225.6 $ 216.4 $ 899.6 $ 774.1
General and administrative expenses (36.8) (36.0) (133.4) (133.3)
Depreciation and amortization (43.8) (41.4) (172.6) (139.7)
Gain (loss) on disposal or impairment of assets 1.3 (2.4) (0.7) (2.6)
Government, class action, and related settlements — 0.5 — (7.5)
Professional fees - accounting, tax, and legal — (0.3) (1.9) (3.0)
Loss on early extinguishment of debt — (2.4) (7.4) (22.4)
Interest expense and amortization of debt discounts and fees (41.6) (44.6) (172.1) (142.9)
Net income attributable to noncontrolling interests 16.8 18.8 70.5 69.7
Gain related to SCA equity interest — — — 3.2 Income from continuing operations before income tax
expense $ 121.5 $ 108.6 $ 482.0 $ 395.6
39
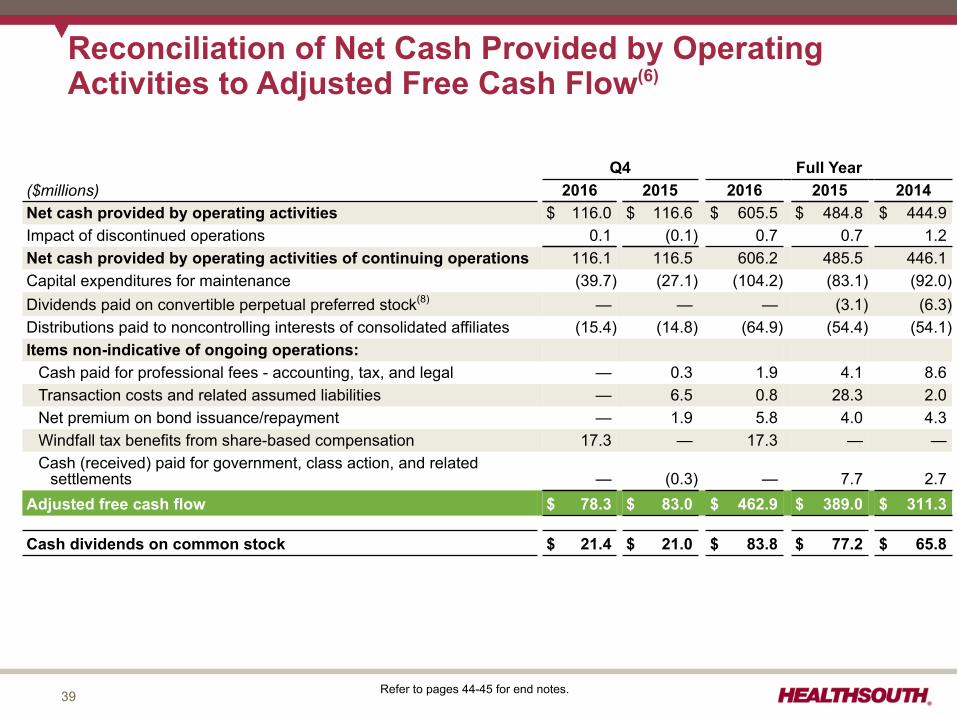
Reconciliation of Net Cash Provided by OperatingActivities to Adjusted Free Cash Flow(6)
Q4 Full Year($millions) 2016 2015 2016 2015 2014Net cash provided by operating activities $ 116.0 $ 116.6 $ 605.5 $ 484.8 $ 444.9Impact of discontinued operations 0.1 (0.1) 0.7 0.7 1.2Net cash provided by operating activities of continuing operations 116.1 116.5 606.2 485.5 446.1Capital expenditures for maintenance (39.7) (27.1) (104.2) (83.1) (92.0)Dividends paid on convertible perpetual preferred stock(8) — — — (3.1) (6.3)Distributions paid to noncontrolling interests of consolidated affiliates (15.4) (14.8) (64.9) (54.4) (54.1)Items non-indicative of ongoing operations:
Cash paid for professional fees - accounting, tax, and legal — 0.3 1.9 4.1 8.6Transaction costs and related assumed liabilities — 6.5 0.8 28.3 2.0Net premium on bond issuance/repayment — 1.9 5.8 4.0 4.3Windfall tax benefits from share-based compensation 17.3 — 17.3 — —Cash (received) paid for government, class action, and related
settlements — (0.3) — 7.7 2.7Adjusted free cash flow $ 78.3 $ 83.0 $ 462.9 $ 389.0 $ 311.3
Cash dividends on common stock $ 21.4 $ 21.0 $ 83.8 $ 77.2 $ 65.8
Refer to pages 44-45 for end notes.
40
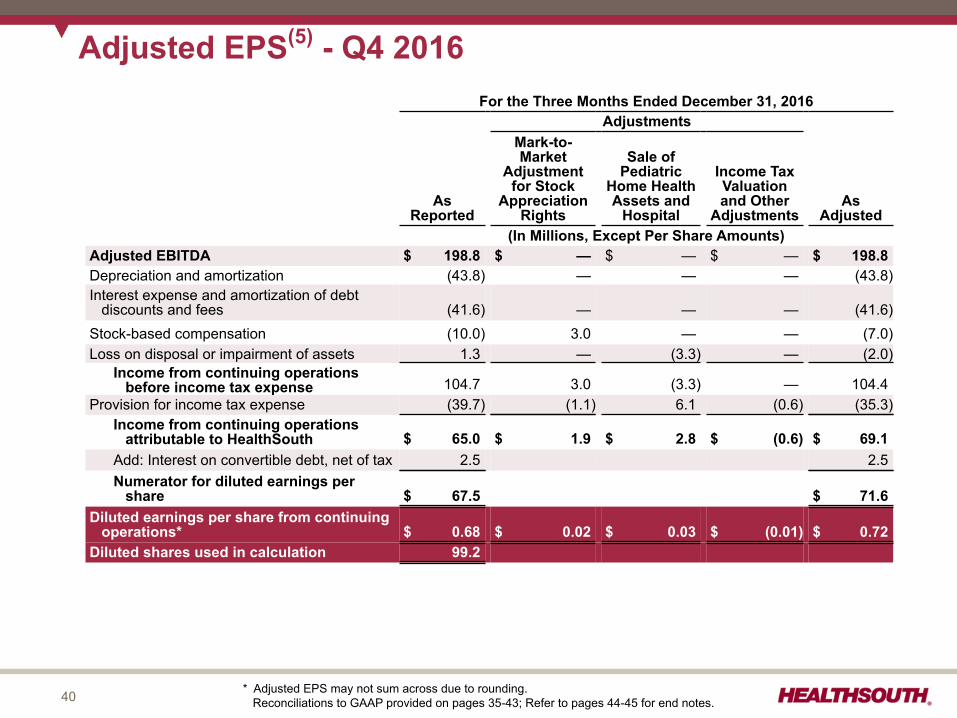
For the Three Months Ended December 31, 2016Adjustments
AsReported
Mark-to-Market
Adjustmentfor Stock
AppreciationRights
Sale ofPediatric
Home HealthAssets and
Hospital
Income TaxValuationand Other
AdjustmentsAs
Adjusted(In Millions, Except Per Share Amounts)
Adjusted EBITDA $ 198.8 $ — $ — $ — $ 198.8Depreciation and amortization (43.8) — — — (43.8)Interest expense and amortization of debt
discounts and fees (41.6) — — — (41.6)Stock-based compensation (10.0) 3.0 — — (7.0)Loss on disposal or impairment of assets 1.3 — (3.3) — (2.0)
Income from continuing operationsbefore income tax expense 104.7 3.0 (3.3) — 104.4
Provision for income tax expense (39.7) (1.1) 6.1 (0.6) (35.3)Income from continuing operations
attributable to HealthSouth $ 65.0 $ 1.9 $ 2.8 $ (0.6) $ 69.1Add: Interest on convertible debt, net of tax 2.5 2.5Numerator for diluted earnings per
share $ 67.5 $ 71.6Diluted earnings per share from continuing
operations* $ 0.68 $ 0.02 $ 0.03 $ (0.01) $ 0.72Diluted shares used in calculation 99.2
Adjusted EPS(5) - Q4 2016
* Adjusted EPS may not sum across due to rounding. Reconciliations to GAAP provided on pages 35-43; Refer to pages 44-45 for end notes.
41
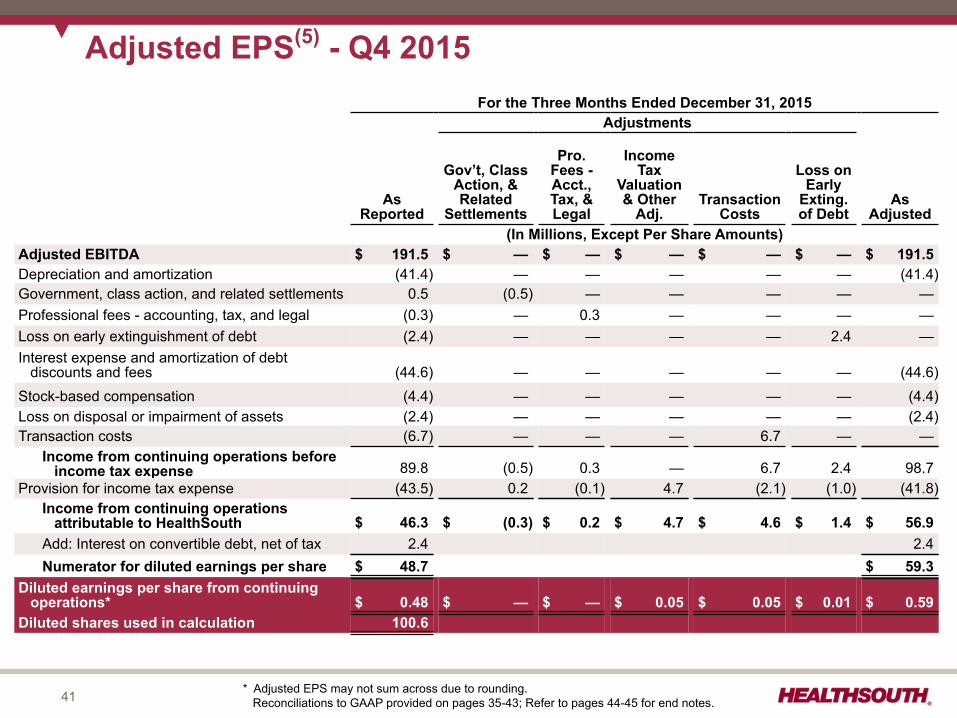
For the Three Months Ended December 31, 2015Adjustments
AsReported
Gov’t, ClassAction, &Related
Settlements
Pro.Fees -Acct.,Tax, &Legal
IncomeTax
Valuation& Other
Adj.Transaction
Costs
Loss onEarly
Exting.of Debt
AsAdjusted
(In Millions, Except Per Share Amounts)Adjusted EBITDA $ 191.5 $ — $ — $ — $ — $ — $ 191.5Depreciation and amortization (41.4) — — — — — (41.4)Government, class action, and related settlements 0.5 (0.5) — — — — —Professional fees - accounting, tax, and legal (0.3) — 0.3 — — — —Loss on early extinguishment of debt (2.4) — — — — 2.4 —Interest expense and amortization of debt
discounts and fees (44.6) — — — — — (44.6)Stock-based compensation (4.4) — — — — — (4.4)Loss on disposal or impairment of assets (2.4) — — — — — (2.4)Transaction costs (6.7) — — — 6.7 — —
Income from continuing operations beforeincome tax expense 89.8 (0.5) 0.3 — 6.7 2.4 98.7
Provision for income tax expense (43.5) 0.2 (0.1) 4.7 (2.1) (1.0) (41.8)Income from continuing operations
attributable to HealthSouth $ 46.3 $ (0.3) $ 0.2 $ 4.7 $ 4.6 $ 1.4 $ 56.9Add: Interest on convertible debt, net of tax 2.4 2.4Numerator for diluted earnings per share $ 48.7 $ 59.3
Diluted earnings per share from continuingoperations* $ 0.48 $ — $ — $ 0.05 $ 0.05 $ 0.01 $ 0.59
Diluted shares used in calculation 100.6
Adjusted EPS(5) - Q4 2015
* Adjusted EPS may not sum across due to rounding. Reconciliations to GAAP provided on pages 35-43; Refer to pages 44-45 for end notes.
42
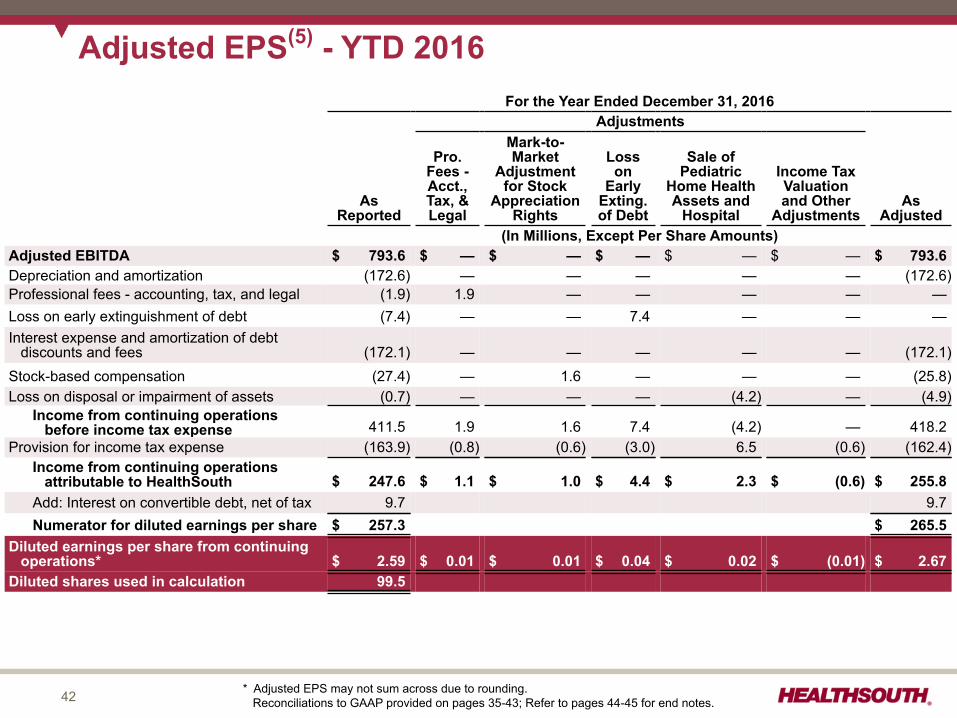
For the Year Ended December 31, 2016Adjustments
AsReported
Pro.Fees -Acct.,Tax, &Legal
Mark-to-Market
Adjustmentfor Stock
AppreciationRights
Losson
EarlyExting.of Debt
Sale ofPediatric
Home HealthAssets and
Hospital
Income TaxValuationand Other
AdjustmentsAs
Adjusted(In Millions, Except Per Share Amounts)
Adjusted EBITDA $ 793.6 $ — $ — $ — $ — $ — $ 793.6Depreciation and amortization (172.6) — — — — — (172.6)Professional fees - accounting, tax, and legal (1.9) 1.9 — — — — —Loss on early extinguishment of debt (7.4) — — 7.4 — — —Interest expense and amortization of debt
discounts and fees (172.1) — — — — — (172.1)Stock-based compensation (27.4) — 1.6 — — — (25.8)Loss on disposal or impairment of assets (0.7) — — — (4.2) — (4.9)
Income from continuing operationsbefore income tax expense 411.5 1.9 1.6 7.4 (4.2) — 418.2
Provision for income tax expense (163.9) (0.8) (0.6) (3.0) 6.5 (0.6) (162.4)Income from continuing operations
attributable to HealthSouth $ 247.6 $ 1.1 $ 1.0 $ 4.4 $ 2.3 $ (0.6) $ 255.8Add: Interest on convertible debt, net of tax 9.7 9.7Numerator for diluted earnings per share $ 257.3 $ 265.5
Diluted earnings per share from continuingoperations* $ 2.59 $ 0.01 $ 0.01 $ 0.04 $ 0.02 $ (0.01) $ 2.67
Diluted shares used in calculation 99.5
Adjusted EPS(5) - YTD 2016
* Adjusted EPS may not sum across due to rounding. Reconciliations to GAAP provided on pages 35-43; Refer to pages 44-45 for end notes.
43
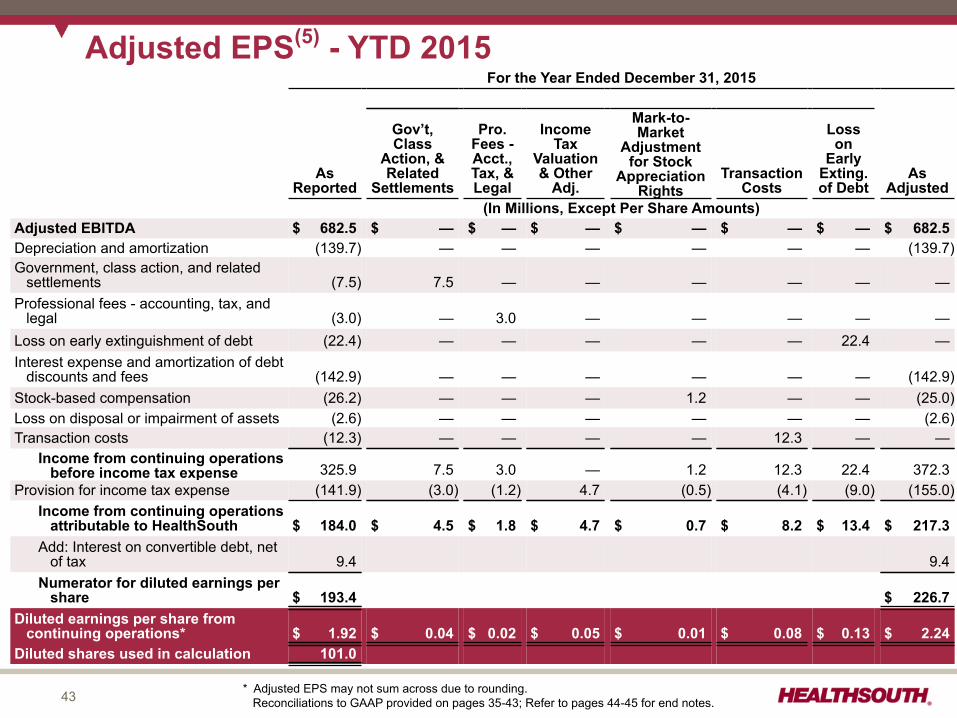
For the Year Ended December 31, 2015
AsReported
Gov’t,Class
Action, &Related
Settlements
Pro.Fees -Acct.,Tax, &Legal
IncomeTax
Valuation& Other
Adj.
Mark-to-Market
Adjustmentfor Stock
AppreciationRights
TransactionCosts
Losson
EarlyExting.of Debt
AsAdjusted
(In Millions, Except Per Share Amounts)Adjusted EBITDA $ 682.5 $ — $ — $ — $ — $ — $ — $ 682.5Depreciation and amortization (139.7) — — — — — — (139.7)Government, class action, and related
settlements (7.5) 7.5 — — — — — —Professional fees - accounting, tax, and
legal (3.0) — 3.0 — — — — —Loss on early extinguishment of debt (22.4) — — — — — 22.4 —Interest expense and amortization of debt
discounts and fees (142.9) — — — — — — (142.9)Stock-based compensation (26.2) — — — 1.2 — — (25.0)Loss on disposal or impairment of assets (2.6) — — — — — — (2.6)Transaction costs (12.3) — — — — 12.3 — —
Income from continuing operationsbefore income tax expense 325.9 7.5 3.0 — 1.2 12.3 22.4 372.3
Provision for income tax expense (141.9) (3.0) (1.2) 4.7 (0.5) (4.1) (9.0) (155.0)Income from continuing operations
attributable to HealthSouth $ 184.0 $ 4.5 $ 1.8 $ 4.7 $ 0.7 $ 8.2 $ 13.4 $ 217.3Add: Interest on convertible debt, net
of tax 9.4 9.4Numerator for diluted earnings per
share $ 193.4 $ 226.7Diluted earnings per share from
continuing operations* $ 1.92 $ 0.04 $ 0.02 $ 0.05 $ 0.01 $ 0.08 $ 0.13 $ 2.24Diluted shares used in calculation 101.0
Adjusted EPS(5) - YTD 2015
* Adjusted EPS may not sum across due to rounding. Reconciliations to GAAP provided on pages 35-43; Refer to pages 44-45 for end notes.
44
End Notes(1) Current income tax expense was $17.4 million and $4.4 million for Q4 2016 and Q4 2015, respectively. Current income tax expense was $31.0 million and $14.8
million for the year ended December 31, 2016 and 2015, respectively.(2) The interest and amortization related to the convertible senior subordinated notes must be added to income from continuing operations when calculating diluted
earnings per share because the debt is assumed to have been converted and the applicable shares are included in the diluted share count.(3) The increase in the Company’s income tax valuation allowance in 2015 related primarily to changes to its state apportionment percentages resulting from
its acquisitions of Encompass, Reliant, and CareSouth as well as changes to its forecast of earnings in each jurisdiction.(4) In connection with the Encompass acquisition, the Company granted stock appreciation rights based on the common stock of HealthSouth Home Health Holdings,
Inc. to certain members of Encompass management. The fair value of Holdings’ common stock is determined using the product of the trailing 12-month specifiedperformance measure for Holdings and a specified median market EBITDA multiple based on a basket of public home health companies. The fair value of thesestock appreciation rights will vary from period to period based on Encompass’ performance and the change in the multiple of the basket of public home healthcompanies.
(5) HealthSouth is providing adjusted earnings per share from continuing operations attributable to HealthSouth (“adjusted earnings per share”), which is a non-GAAPmeasure. The Company believes the presentation of adjusted earnings per share provides useful additional information to investors because it provides bettercomparability of ongoing performance to prior periods given that it excludes the impact of government, class action, and related settlements, professional fees -accounting, tax, and legal, mark-to-market adjustments for stock appreciation rights, gains or losses related to hedging instruments, loss on early extinguishmentof debt, adjustments to its income tax provision (such as valuation allowance adjustments and settlements of income tax claims), items related to corporate andfacility restructurings, and certain other items deemed to be non-indicative of ongoing operations. It is reasonable to expect that one or more of these excludeditems will occur in future periods, but the amounts recognized can vary significantly from period to period and may not directly relate to the Company's ongoingoperations. Accordingly, they can complicate comparisons of the Company's results of operations across periods and comparisons of the Company's results tothose of other healthcare companies. Adjusted earnings per share should not be considered as a measure of financial performance under generally acceptedaccounting principles in the United States as the items excluded from it are significant components in understanding and assessing financial performance.Because adjusted earnings per share is not a measurement determined in accordance with GAAP and is thus susceptible to varying calculations, it may not becomparable as presented to other similarly titled measures of other companies.*
(6) Definition of adjusted free cash flow, which is a non-GAAP measure, is net cash provided by operating activities of continuing operations minus capitalexpenditures for maintenance, dividends paid on preferred stock, distributions to noncontrolling interests, and certain other items deemed to be non-indicative ofongoing operations. Common stock dividends are not included in the calculation of adjusted free cash flow.
(7) Adjusted EBITDA is a non-GAAP financial measure. The Company’s leverage ratio (total consolidated debt to Adjusted EBITDA for the trailing four quarters) is,likewise, a non-GAAP measure. Management and some members of the investment community utilize Adjusted EBITDA as a financial measure and the leverageratio as a liquidity measure on an ongoing basis. These measures are not recognized in accordance with GAAP and should not be viewed as an alternative toGAAP measures of performance or liquidity. In evaluating Adjusted EBITDA, the reader should be aware that in the future HealthSouth may incur expenses similarto the adjustments set forth.
(8) In March 2006, the Company completed the sale 400,000 shares of its 6.5% Series A Convertible Perpetual Preferred Stock. In Q4 2013, the Companyexchanged $320 million of newly issued 2.0% Convertible Senior Subordinated Notes due 2043 for 257,110 shares of its outstanding preferred stock. In April2015, the Company exercised its rights to force conversion of all outstanding shares of its preferred stock. On the conversion date, each outstanding share ofpreferred stock was converted into 33.9905 shares of common stock, resulting in the issuance of 3,271,415 shares of common stock.
(9) The contractual debt repayment obligations in 2017 includes ~$15 million of capital lease payments and ~$1 million of other notes payable.(10) On July 16, 2015, the board of directors approved a $0.02 per share, or 9.5%, increase to the quarterly cash dividend on the Company’s common stock, bringing
the quarterly cash dividend to $0.23 per common share. On July 21, 2016, the board of directors approved a $0.01 per share, or 4.3%, increase to the quarterlycash dividend on the Company’s common stock, bringing the quarterly cash dividend to $0.24 per common share.
(11) The Medicare Access and CHIP Reauthorization Act of 2015 mandated a market basket update of +1.0% in 2018 for post-acute providers including rehabilitationhospitals as well as home health and hospice agencies.
* Reconciliations to GAAP provided on pages 35-43.
45
End Notes, con’t.(12) The Company estimates the expected impact of each rule utilizing, among other things, the acuity of its patients over the 8-month (home health segment) to 12-
month (inpatient rehabilitation segment) period prior to each rule’s release and incorporates other adjustments included in each rule. These estimates are prior tothe impact of sequestration.
(13) HealthSouth acquired an additional 30% equity interest in Fairlawn Rehabilitation Hospital in Worcester, MA from its joint venture partner. This transactionincreased HealthSouth’s ownership interest from 50% to 80% and resulted in a change in accounting for this hospital from the equity method to a consolidatedentity effective June 1, 2014.
(14) Data provided by Uniform Data System for Medical Rehabilitation, a division of UB Foundation Activities, Inc., a data gathering and analysis organization for therehabilitation industry; represents ~70% of industry, including HealthSouth sites
(15) Represents discharges from 122 consolidated hospitals in Q4 2016; 121 consolidated hospitals in Q3 2016; 120 consolidated hospitals in Q2 2016; 121consolidated hospitals in Q1 2016; 120 consolidated hospitals in Q4 2015; 108 consolidated hospitals in Q3 2015 and Q2 2015; and 106 consolidated hospitals inQ1 2015
(16) Excludes approximately 420 full-time equivalents in the 2016 periods and approximately 400 full-time equivalents in the 2015 periods presented who areconsidered part of corporate overhead with their salaries and benefits included in general and administrative expenses in the Company’s consolidated statementsof operations. Full-time equivalents included in the table represent HealthSouth employees who participate in or support the operations of the Company’s hospitals.
(17) Employees per occupied bed, or “EPOB,” is calculated by dividing the number of full-time equivalents, including an estimate of full-time equivalents from theutilization of contract labor, by the number of occupied beds during each period. The number of occupied beds is determined by multiplying the number of licensedbeds by the Company’s occupancy percentage.
(18) Represents home health admissions from 186 consolidated locations in Q4 2016; 188 consolidated locations in Q3 2016; 187 consolidated locations in Q2 2016;184 consolidated locations in Q1 2016 and Q4 2015; 141 consolidated locations in Q3 2015; 139 consolidated locations in Q2 2015; and 143 consolidatedlocations in Q1 2015
(19) Represents hospice admissions from 35 locations in Q4 2016; 33 locations in Q3 2016; 29 locations in Q2 2016; 27 locations in Q1 2016 and Q4 2015; 23locations in Q3 2015; and 21 locations in Q2 2015 and Q1 2015.
(20) In November 2013, the Company closed separate, privately negotiated exchanges in which it issued $320 million of 2.0% Convertible Senior Subordinated Notesdue 2043 in exchange for 257,110 shares of its 6.5% Series A Convertible Perpetual Preferred Stock. The Company recorded ~$249 million as debt and ~$71million as equity. The convertible notes are convertible, at the option of the holders, at any time on or prior to the close of business on the business day immediatelypreceding December 1, 2043 into shares of the Company’s common stock and is subject to customary antidilution adjustments. The Company has the right toredeem the convertible notes before December 1, 2018 if the volume weighted-average price of the Company’s common stock is at least 120% of the conversionprice ($44.59) of the convertible notes for a specified period. On or after December 1, 2018, the Company may, at its option, redeem all or any part of theconvertible notes. In either case, the redemption price will be equal to 100% of the principal amount of the convertible notes to be redeemed, plus accrued andunpaid interest.
(21) The agreement to settle the Company’s class action securities litigation received final court approval in January 2007. The 5.0 million shares of common stock andwarrants to purchase ~8.2 million shares of common stock at a strike price of $41.40 (expired January 17, 2017) related to this settlement were issued onSeptember 30, 2009. The 5.0 million common shares are included in the basic outstanding shares. The warrants were not included in the diluted share count priorto 2015 because the strike price had historically been above the market price. In Q4 2016, full-year 2016, Q4 2015, full-year 2014, and full-year 2013, zero sharesrelated to the warrants were included in the diluted share count due to antidilution based on the stock price. In full-year 2015, 80,814 shares related to the warrantswere included in the diluted share count using the treasury stock method. See also page 31.