Embed Size (px)
Citation preview

Fourth Meeting of the Working Group on the Trans-Asian Railway Network
Increasing rail share: Leveraging multimodal hubs
RAGHU DAYAL Asian Institute of Transport Development
Bangkok 23-24 November 2015
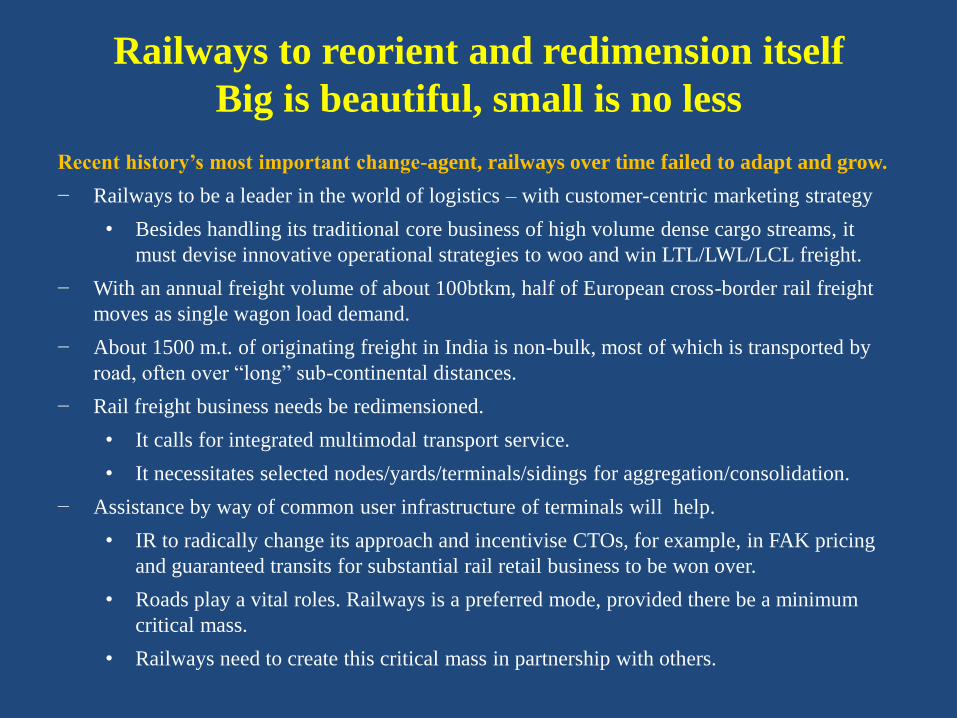
Recent history’s most important change-agent, railways over time failed to adapt and grow.
− Railways to be a leader in the world of logistics – with customer-centric marketing strategy
• Besides handling its traditional core business of high volume dense cargo streams, it
must devise innovative operational strategies to woo and win LTL/LWL/LCL freight.
− With an annual freight volume of about 100btkm, half of European cross-border rail freight
moves as single wagon load demand.
− About 1500 m.t. of originating freight in India is non-bulk, most of which is transported by
road, often over “long” sub-continental distances.
− Rail freight business needs be redimensioned.
• It calls for integrated multimodal transport service.
• It necessitates selected nodes/yards/terminals/sidings for aggregation/consolidation.
− Assistance by way of common user infrastructure of terminals will help.
• IR to radically change its approach and incentivise CTOs, for example, in FAK pricing
and guaranteed transits for substantial rail retail business to be won over.
• Roads play a vital roles. Railways is a preferred mode, provided there be a minimum
critical mass.
• Railways need to create this critical mass in partnership with others.
Railways to reorient and redimension itself
Big is beautiful, small is no less

Increasing the rail share
− Take the truncated ASPA region – South Asia and South-east Asia
− Rail share in respective national freight market keeps falling. For example:
• India now has less than one-third share
• Bangladesh 7%
• Myanmar 30%
• Thailand 5%
• Vietnam 2%
− There is little connectivity between South Asian and South-east Asian rail networks.
− Rail infrastructure in most countries is in dire need of resuscitation.
− No purposeful economic corridor can materialize without a vibrant transport corridor.
− Instead of intending to plan full corridor(s), it may be pragmatic to work along restrictive geographic areas, to begin with.
− Some ambitious rail connectivity projects have been envisaged – e.g., Singapore-Kunming Rail Link (SKRL)
• A multimodal corridor has also been contemplated– to link Bengaluru and Chennai to Dawei, Laem Chabang and Saigon port.
• Another corridor between Kolkata and Saigon port.

Some examples – firstly, in South Asia
In Bangladesh, BR carries just about 10-12% of all containers
handled at Chittagong port all to and from Dhaka ICD.
− There is capacity crunch on the rail corridor
− There is also need for augmentation of inland container
terminal facilities.
− Containers from India for Bangladesh are routed via
Mumbai to Singapore, to Chittagong, to Dhaka.
– If moved on all rail route, within operational
restrictions, the box for Bangladesh will save at
least 1/3rd of the transit time and more than half the
haulage and handling costs.
− Intermodal transit of goods over land route would be
cheaper by 35%, faster by 70%.
Traffic from/to Birgunj TCD in Nepal
− Notwithstanding the share of rail-carried containers
between gateway Kolkata port in India and ICD at
Birgunj in Nepal being over 60% of all export– import
containers on the corridor, there remains a scope to
maximize the rail share
− Two aspects need attention: one; overall transit time
including dwell time at the gateway and, second, pricing.
Share of rail-borne containers in and out of ports in
India has steadily fallen – from a level of 32% of the
total containers handled at Indian ports in 2000-2001 to
15% in 2014-15.
A 10% share or more is only in respect of containers at
Pipava, Mundra, JNP and Visakhapatnam, all other
ports recording less than 10%.
Containers handled at all Central Government ports in 2014-15: 7,960m
Containers handled by private sector at state ports: 3.53m

Thailand
• The Lat Krabang ICD located about 27km east of Bangkok and 118km north of Laem Chabang port, has been handling increasing volumes.
• Although primarily designed with an emphasis on rail-based transport, road share outstrips the rail.
• The rail share is just about one-fourth of the traffic.
The Malaysia – Thailand bridge
• KTMB operates a landbridge service in collaboration with SRT for cross border containers by rail between Malaysia and Thailand.
• Throughput on the corridor steadily improved until a few years ago, where after some operational problems started taking a toll.
Then, some examples in Southeast Asia

Poised for a transformation
− DFC-W enabling DSCT operation on flat rail cars under overhead electric wires is designed to embody state-of-the-art new technological and operational features.
− Container trains running between JN port near Mumbai and ICDs in the hinterland will carry 400 TEU each against 90 TEU hitherto.
− The hub-and-spoke system would come to life.
• The rail infrastructure inside the port is being redesigned and the layout revamped for formation and handling of long and heavy container trains expeditiously and efficiently.
• For inland locations in the hinterland, the operational plan envisages the development of three intermediate load centres along the rail corridor to serve as nodes for hub-and-spoke operations.
• The long liner trains will be re-formed at these intermediate depots, which will deal also with streams coming from/going to important feeder points.
• A node between Mumbai and Vadodara may deal with traffic from/to ports of Hazira and Dehej, etc. Another with the stream from/to ports of Mundra and Pipava, etc. Still another in Punjab for traffic from/to Ludhiana and other centres in the region.
− These intermediate load centres will receive and dispatch container trains of conventional size from/to various ICDs/CFSs in the respective zones.
− These nodes will handle both EXIM and domestic cargo, providing integrated logistics services end-to-end – in close cooperation with associate road operators and other agencies.
− Some important customers with pan-India presence including major FMCG companies have already been extended such integrated logistics services.
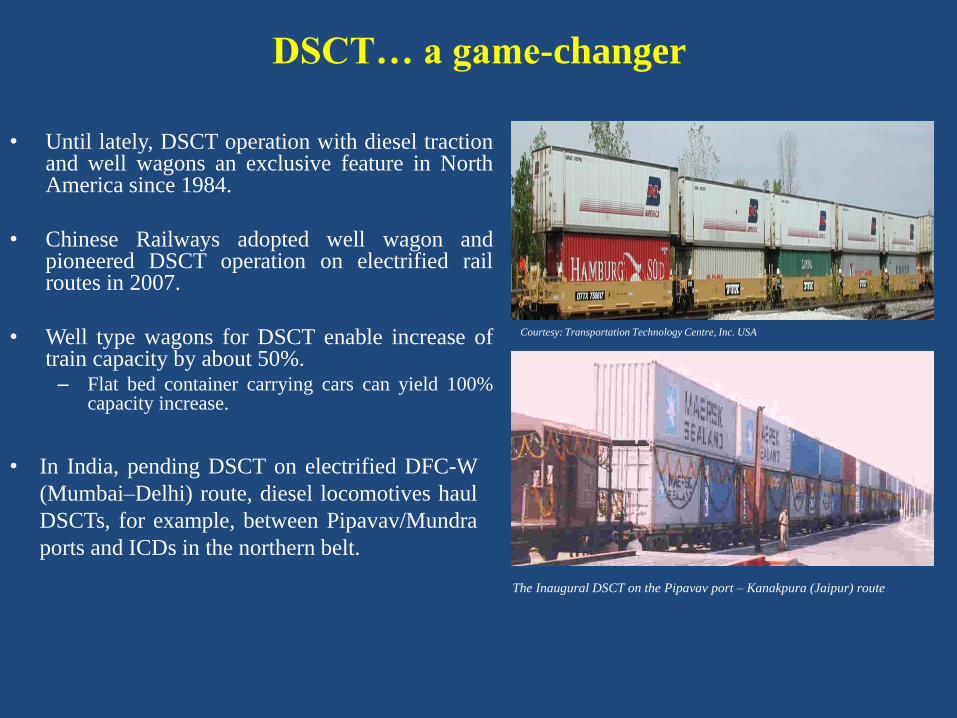
DSCT… a game-changer
• Until lately, DSCT operation with diesel traction and well wagons an exclusive feature in North America since 1984.
• Chinese Railways adopted well wagon and pioneered DSCT operation on electrified rail routes in 2007.
• Well type wagons for DSCT enable increase of train capacity by about 50%. – Flat bed container carrying cars can yield 100%
capacity increase.
• In India, pending DSCT on electrified DFC-W
(Mumbai–Delhi) route, diesel locomotives haul
DSCTs, for example, between Pipavav/Mundra
ports and ICDs in the northern belt.
The Inaugural DSCT on the Pipavav port – Kanakpura (Jaipur) route
Courtesy: Transportation Technology Centre, Inc. USA

• The DFC along the western corridor will traverse six of India’s states: NCT, Uttar Pradesh, Haryana, Rajasthan, Gujarat and Maharashtra, which together constitute 39% of India’s total population, contribute 60% of its exports, and more than 43% of national income.
• DFC–W envisages to serve, as a catalyst for the US$90 billion Delhi Mumbai Industrial Corridor (DMIC).
Industrial clusters- economic hubs
– NCT a major manufacturing and trading hub as well as a consumption centre
– Manesar-Bawal another cluster with great potential of large container volumes
• DMIC- related NCT and Manesar-Bawal region estimated to generate annual container volumes of over 4m TEU by 2020
One hundred smart cities are planned to be developed by GoI in the first instance.
Some of these cities will come up along the DMIC.
Leveraging vast growth potential

Multimodal logistics parks to
re-define freight mobility
• Following the complexity of modern freight distribution, and increased focus on intermodal integrated logistics, transport development has been shifting inland (Theo Nottebom and Jean-Paul Rodrigue).
• Inland terminals are now evolving into logistics parks. With a clustering of logistics sites in the vicinity, several of the inland terminals have witnessed logistics polarization and the creation of logistics zones.
• Indian Railways has planned a string of logistics parks, besides substantially revamping the existing freight depots.
• CONCOR too has on the anvil an array of 15 logistics parks to be established.
• Each of these integrated terminals will serve, besides as a full fledged ICD, as warehousing for value adding services, for domestic as well as international cargo, also for bulk freight, including silos for cement and grain, etc. and reefers.

Projected major commodities on
DFC-W: NTKM: million
Source: DFCCIL
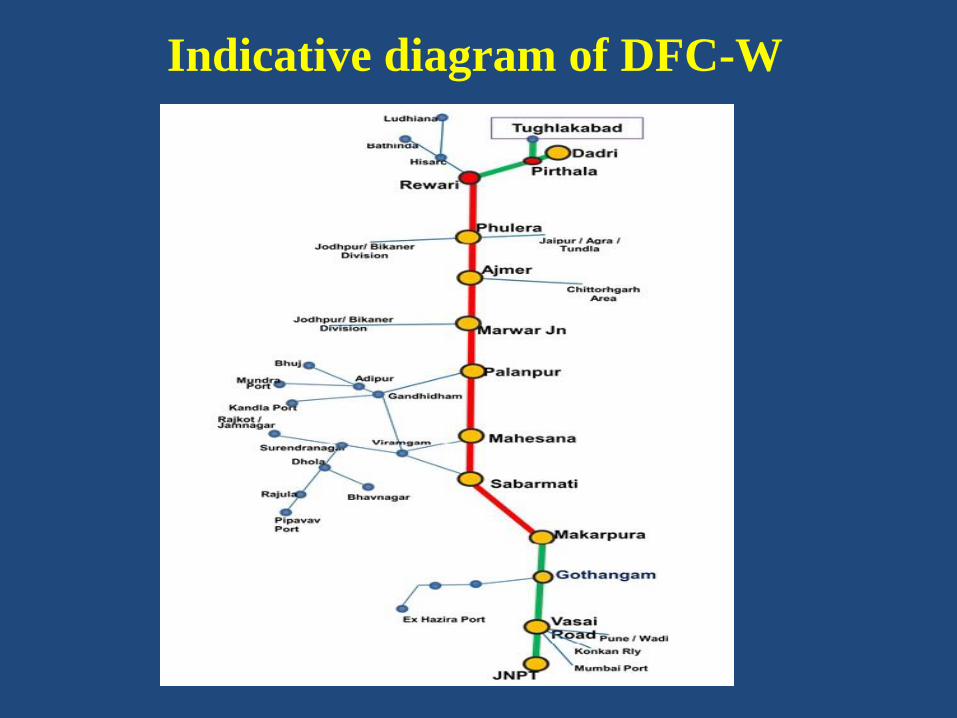
Indicative diagram of DFC-W

Forecasted Traffic (Trains) - Western DFC – UP Direction
SECTIONS 2016-17* 2021-22 2031-32 2035-36
Cont. Others Total Cont. Others Total Cont. Others Total Cont. Others Total
Dadri-Rewari 37.89 6.05 43.94 41.28 8 49.28 53.23 16.21 69.44 56.46 19.55 76.01
Delhi-Rewari 3.97 6.76 10.73 5.28 5.92 11.2 9.58 8.06 17.64 10.93 9.59 20.52
Hisar-Rewari 8.09 5.7 13.79 10.2 5.12 15.32 15.68 7.56 23.24 22.16 9.06 31.22
Rewari-Phulera 49.94 29.52 79.46 57.15 38.04 95.19 78.49 61.34 139.83 89.54 72.48 162.02
Phulera-Ajmer 53.44 30.12 83.56 63.46 38.57 102.03 89.1 62.21 151.31 101.49 73.58 175.07
Ajmer-Marwar 53.32 30.11 83.43 64.86 38.56 103.42 89.52 62.2 151.72 102.02 73.56 175.58
Marwar-Palanpur 54.66 28.66 83.32 66.29 37.42 103.71 92.77 60.49 153.26 105.97 71.53 177.5
Palanpur-Mahesana 41.85 17.88 59.73 49.98 25.06 75.04 66.89 40.5 107.39 74.92 48.22 123.14
Mahesana-Sabarmati 32.46 13.96 46.42 38.5 20.78 59.28 60.06 33.27 93.33 67.22 39.54 106.76
Sabarmati-Vadodara 36.05 12.25 48.3 47.16 17.95 65.11 62.59 30.01 92.6 69.88 35.57 105.45
Vadodara-Gothangam 38.57 14.65 53.22 50.65 19.67 70.32 69.09 32.51 101.6 78.2 38.53 116.73
Gothamgam-Vasai Rd 36.19 14.66 50.85 47.07 19.39 66.46 62.24 31.71 93.95 72.61 37.69 110.3
Jasai-JN Port 32.34 7.17 39.51 35.84 11.6 47.44 40.28 15.9 56.18 45.12 18.56 63.68
* Traffic in 2016-17 is based on 22.9 T axle load and single-stack container trains.
Forecasted Traffic (Trains) - Western DFC – Down Direction
SECTIONS 2016-17* 2021-22 2031-32 2035-36
Cont. Others Total Cont. Others Total Cont. Others Total Cont. Others Total
JN Port-Jasai 32.65 7.32 39.97 35.89 11.75 47.64 40.71 16.29 57 45.15 21.48 66.63
Vasai Rd-Gothangam 37.75 14.42 52.17 46.85 20.11 66.96 62.81 32.29 95.1 73.92 38.9 112.82
Gothangam-Vadodara 40.48 14.79 55.27 51.38 20.16 71.54 71.08 32.69 103.77 81.17 39.21 120.38
Vadodara -Sabarmati 38.28 13.6 51.88 46.73 19.05 65.78 63.41 31.14 94.55 72.6 37.42 110.02
Sabarmati -Mahesana 37.66 18.76 56.42 44.93 23.85 68.78 59.46 37.08 96.54 67.83 43.72 111.55
Mahesana- Palanpur 41.15 23.96 65.11 49.96 29.17 79.13 66.83 45.9 112.73 75.71 54.35 130.06
Palanpur- Marwar 55.27 36.51 91.78 66.69 44.65 111.34 93.03 70.54 163.57 107.55 83.42 190.97
Marwar - Ajmer 54.54 38.24 92.78 65.03 45.67 110.7 89.68 72.2 161.88 103.79 85.05 188.84
Ajmer - Phulera 54.19 42.35 96.54 64.39 48.8 113.19 88.42 77.19 165.61 102.15 90.56 192.71
Phulera-Rewari 50.71 34.51 85.22 58.04 41.64 99.68 78.66 66.49 145.15 89.91 78.13 168.04
Rewari - Hisar 8.29 6.58 14.87 10.9 5.93 16.83 16.23 8.85 25.08 23.06 10.49 33.55
Rewari-Delhi 4.4 7.9 12.3 6.1 6.2 12.3 10.26 8.92 19.18 11.64 10.28 21.92
Rewari-Dadri 38.02 8.38 46.4 41.04 8.9 49.94 52.17 19.62 71.79 55.21 23.58 78.79
* Traffic in 2016-17 is based on 22.9 t axle load and single-stack container trains.

Thank you


![[2012] NZSC Trans 8 - Homepage — Courts of New … · [2012] NZSC Trans 8 ... M S Hinde for the Third and Fourth Respondents ... 25 the Iraqi Airway Corporation and that perjured](https://img.pdfslide.us/doc/110x75/5b957dd609d3f2ea5c8c175c/2012-nzsc-trans-8-homepage-courts-of-new-2012-nzsc-trans-8-m-s.jpg)