Embed Size (px)
Citation preview

Fourier Transform Ion Cyclotron Resonance
Mass Spectrometry (FT-ICR-MS)
The first steps along the way to FT-
ICR-MS date back to the 1930s,
when Ernest Lawrence, at the
University of California - Berkeley,
developed the theory of cyclotron
resonance, i.e. the acceleration of
charged particles inside a
cyclotron, that had been invented
by himself in 1924.
Other milestones in the FT-ICR-MS history are:
1950, Sommer et al., incorporation of ICR principle into a mass
spectrometer, the Omegatron
1978, Comisarow and Marshall, adaptation of Fourier Transform
methods to ICR spectrometry and development of the first FT-MS
instrument

ICR cell
The heart of a FT-ICR-MS instrumentation is the ICR cell, an ion trap
located within a spatially uniform, static magnetic field of intensity B.
Two geometries have been commonly explored for ICR cells, cubic and
cylindrical open-ended :
The arrow indicates the direction and verse of the magnetic field. Ions
can enter the ICR cells either through a hole in a cube face or through
one of the open surfaces in the cylindrical cell.
The cubic ICR cell
actually derives from
the spatial arrangement
of six metal square
plates, that can be
divided into three
groups:
trapping plates: perpendicular to the magnetic field; one of them has
a hole to allow ion injection into the cell;
excitation plates: parallel to the B vector plane and normal to the
trapping plates; a RF Voltage is applied to these plate during ICR
operation;
detector plates: normal to the other plate couples; they collect the
time dependent signal from which a mass spectrum is subsequently
obtained.

In the cylindrical ICR cell:
the trapping plates
correspond to the two metal
cylinders at the ends;
the excitation and detector
plates are four identical
cylindrical sectors, arranged
into the center section in an
alternate configuration:
The shape and dimension of
the cylindrical cell make it
more suitable to fit into the
bore of a superconducting
magnet, while the cubic cell is
better matched with the
narrow gap between the pole
caps of an electromagnet.
trapping plates
excitation plate
detection plate

When entering the ICR cell, if no
electric field is applied, an ion is
subjected only to the Lorentz
force due to the magnetic field:
Cyclotronic ion motion
The force is a vector normal both to the magnetic field (pointing
downwards in the figure) and to the ion velocity vector, thus the ion moves
along a circular trajectory.
Actually, the same phenomenon
occurs on any charged particle,
including electrons, as shown in the
picture on the right, referred to the
motion of electrons in a gas-filled
bulb put in a magnetic field. The
electron trajectory is visible due to
gas excitation:
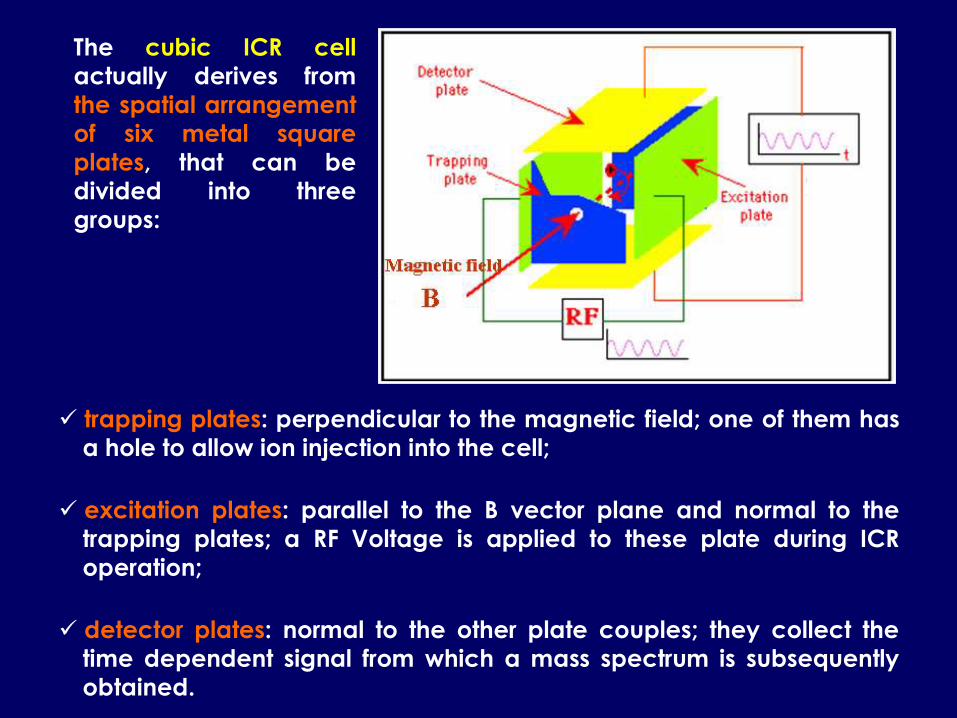
If no external perturbation occurs the cyclotronic motion is periodic and
characterized by a cyclotron frequency, depending on B and on the
m/z ratio.
Since the Lorentz and the centrifugal force related to the cyclotronic
motion are equal, the following equation can be written (after renaming
the charge as z):
since the angular velocity wc (rad/s) can be expressed as v/r, the
following equation can also be obtained:
Finally, the cyclotron frequency
can be easily calculated:

The m/z ratio of an ion can be
then measured if the frequency
of its cyclotronic motion and the
magnetic field module are
known:
A peculiarity of the above
relationship is that the value
obtained for the m/z ratio of an
ion is not influenced by its initial
velocity, a unique feature of
ICR-MS.
Ion kinetic energy spreading
cannot influence mass
resolution in this case; this
explains why ICR-MS can reach
ultra-high resolving powers (up
to R = 1000000).

For a given m/z ratio the radius of the cyclotron orbit dipends linearly on
the ion velocity or on the square root of kinetic energy.
zBmvr zBmEr 2
The relationships between radius, m/z ratio and velocity or kinetic energy
(E) can be then easily obtained:
If an ion in equilibrium with the
surrounding environment at a
temperature of T Kelvin is
considered, kinetic energy E can be
expressed as kT, where k is the
Boltzmann constant. Then:
298 Kelvin

Trapping motion
Trapping motion is triggered by the application of a small symmetrical
positive (negative) voltage to the trapping plates (that are
perpendicular to the magnetic field), leading to the storage of positive
(negative) ions within the ICR cell:
Ions undergo simple harmonic oscillation between the trapping plates
along the magnetic field axis.
Potential well
x
y z
B

Magnetron motion
The combination of the magnetic and electric fields creates a three-
dimensional ion trap, allowing ions to be stored in the ICR cell for
seconds, minutes or even hours, i.e. times many orders of magnitude
longer than typical residence times in most other mass spectrometers.
Although it would seem that the magnetic and electric fields operate
indipendently, their combination introduces a third fundamental ion
motion in the ICR cell, the magnetron motion.
In order to understand magnetron motion,
the actual electric potential in the cell
has to be considered. Indeed, while the
trapping plates are subjected to the
trapping potential, Vt, the detection and
excitation plates are grounded:
The potential at the center of the cell is
then given by the equation:
x
y z
Vt

If a section of the ICR cell, normal to the z axis, is considered, the plot
of the electric potential in the corresponding x-y plane is:
The potential surface is radially repulsive, thus the electric field drives
ions away from the center of the analyzed cell, although it keeps them
close to the central x-y section.
x
y z
B

While being pushed outwards in
a x-y plane, an ion is subject to
the Lorentz force, due to the
magnetic field.
Indeed, any radial ion motion
(continuous red vector) can be
divided into two components,
along x and y directions (dotted
vectors), that are normal (not
parallel) to the magnetic field.
x
y z
B
The resulting effect is the magnetron
motion: a precession of the cyclotron
motion of an ion around the center of
the cell.
The reported simulation refers to the
following parameters:
4.4 cm cubic cell, m/z = 500,
Vt = 3 V, B = 1 Tesla

The magnetron radius (red) of an ion
(in the figure it is purposely
emphasized with respect to the
cyclotronic motion radius, the blue
one) depends on its initial
displacement from the z axis when
the ion itself is injected or created in
the ICR cell.
The magnetron motion frequency is a function of
the trapping potential, V, the distance, a, between
the trapping plates and the geometry of the ICR
cell ( = 1.39 for a cubic cell):
The magnetron frequency is usually in the order of 1-100 Hz, thus much
lower than the cyclotron one. Moreover, it is independent on the m/z
ratio.

Since ion oscillate along the z axis
as a result of the trapping potential,
three motions are present
contemporarily in a ICR cell and
can be schematically represented
by the following picture:
The combination of the
three motions leads to a
very complex trajectory
for each ion population:

Effect of collisions on magnetron motion
When ions are detected the pressure inside a ICR cell is about 10-9 Torr or
lower, so that collisions do not occur frequently.
However, during some FT-MS experiments the pressure needs to be
raised, sometimes by several orders of magnitude.
Ion-neutral collisions cause a
decrease in ion kinetic
energy/velocity.
The cyclotron radius (rc = mv/zB) is
then rapidly reduced;
contemporarily, ions drift towards
the cell edge and are finally
neutralized by hitting the plates
(collisionally mediated radial
diffusion):P = 0.01 Torr

Events sequence in a FT-ICR-MS measurement
Differently from most other mass spectrometers, in a FT-ICR-MS instrument
mass analysis and ion detection (sometimes even ionization) occur in the
same space (the ICR cell) but at different times.
A typical experimental sequence consists in four main events:
Quench: the cell is emptied of any ions deriving from previous
experiments by applying antisymmetric voltages to the trapping plates. In
a few ms the ions are ejected axially.
Ionize: ionization may occur inside the ICR cell (i.e. by electron
ionization). Alternatively, ions generated outside the cell can be guided
into the cell through electrostatic or RF ion gates.

Ion excitation / detection
Excitation and detection of ions in a ICR cell are strictly related, the former
being mandatory for the latter to be performed.
Ions in the trap are excited by
applying a sinusoidal voltage to the
excitation plates: when their
cyclotron frequency nc is in
resonance with the exciting field
frequency they absorb energy and
spiral outwards into a larger cyclotron
orbit:
Ions having the same m/z ratio will be excited coherently, a fundamental
step for their detection.

When a population of isobaric
positive (negative) ions passes
coherently near a detection plate
of the ICR cell, due to cyclotronic
motion, electrons are attracted
(repelled) by the plate.
An alternate current, known as image current, is generated into the
external circuit connecting the detection plates and then amplified,
digitized and stored for subsequent computer processing.
Its frequency is given by nc-nm, thus it is nearly equal to the cyclotronic
frequency (since the magnetronic frequency is much lower).
The measurement of the image current frequency can be performed with
extreme precision, thus giving FT-ICR-MS the highest accuracy currently
achievable in m/z measurements.
Moreover, ion detection is completely not destructive, an almost unique
feature between mass analyzers (although some experiments show that
image currents could be registered also in quadrupolar traps).

Broad-band excitation/detection
Ions with different m/z ratios can be detected simultaneously by FT-ICR-
MS if a broad-band excitation is performed.
In this case a frequency synthesizer is programmed to sweep over
frequencies from 10 kHz to 1 MHz in a 1 ms period:
each ionic population with a specific m/z ratio is subjected to resonance
at a characteristic cyclotron frequency and the image current becomes
a composite of sinusoids of different frequencies and amplitudes.
The Fourier transform of the
time transient provides
frequency components
and then the distribution of
m/z ratios (by applying a
calibration formula
derived from the cyclotron
frequency equation):

The image current transient and the multi-charge mass spectrum
obtained by FT-ICR-MS for ubiquitin (8500 Da) are shown in the
following picture:

Note that the RP is
proportional to the
magnetic field B.
The length of T can be
limited by collisions
between ions and neutrals,
with loss of coherence.
At 10-10 Torr pressures
transients of 60 s can be
achieved and R > 106 can
be reached.
Resolution in FT-ICR-MS
The maximum resolving power (RP)
achievable by FT-ICR-MS is expressed by
the equation:
where T is the duration of the time transient.
R = 90,000
R = 12,000
4

An astonishing example of the extreme resolving power achievable
by FT-ICR-MS is shown in the following spectrum:
It is a detailed view of the m/z interval related to nominal mass 35 u,
where the signals due to a positive and a negative 35Cl ion were
detected by alternatively acquiring, storing and transforming the
corresponding image current transients.
The m/z difference between the two peaks is related to the mass shift
due to the two additional electrons in 35Cl-, i.e. 0.00109 u.

MS/MS measurements with FT-ICR-MS
A typical MS/MS experimental sequence with FT-ICR-MS can be
described as follows:
In this case, after ionization, a mass selection stage is required to
isolate a specific precursor ion: a suitable excitation pulse with
appropriate frequencies and amplitudes is applied to the cell to
remove unwanted ions.

A very efficient approach to mass selection is the so called Stored
Waveform Inverse Fourier Transform (SWIFT), developed by Marshall
and his coworkers in the mid 1980s.
The stages of SWIFT are:
elaboration of the desired
excitation spectrum
calculation of the excitation
waveform by Inverse Fourier
Transform (IFT)
application of the waveform to
the ICR cell
In the reported example, also the
precursor ion is excited, but with
half energy, so that its isolation
and fragmentation occur
contemporarily.

Quadrupolar excitation and axialization in FT-ICR-MS
In the 1990s it was
demonstrated that cyclotron
(continuous line) and
magnetron (dashed line)
motions can be periodically
interconverted if an ion is
excited at its cyclotron
frequency by a potential
having quadrupolar simmetry:
L. Schweikhard, A.G. Marshall, J. Am. Soc. Mass Spectr., 1993, 4, 433-452

As cyclotron motion is much faster than magnetron one, exposing a
precursor ion to quadrupolar excitation in the presence of a relatively
high gas pressure (up to 10-5 Torr) will result in a more significant
dampening of the cyclotron motion.
The final effect is ion relaxation to the center of its orbit, a process usually
known as axialization.

When axialization is accomplished on a specific ion the other ones will
be subject to typical radial diffusion and will be finally ejected.
Precursor ions are then selected and several ions can be isolated in the
same experiment if a composite or a SWIFT waveform is applied for the
quadrupolar excitation.
Further applications of axialization are:
thermalization of excited state ions by quadrupolar excitation when
they are placed near the cell center;
signal-to-noise enhancing by repeated detection of the same set of
ions: in this case quadrupolar excitation is used to return ions to the
center after a dipolar excitation/detection stage.
Repeating the procedure several times and averaging the image
current transients thus obtained leads to a significant increase of
sensitivity. Attomoles (10-18 moles) sensitivities have been reported for
MALDI-FT-ICR-MS adopting this approach.

After selection, translational excitation of the precursor ion is
accomplished by enlarging its cyclotron radius and thus increasing its
kinetic energy E, since r = (E2m)1/2/zB.
As an example, a mono-charged ion with m/z 1000, excited to a 2 cm
radius orbit, at B = 7 Tesla, will acquire a kinetic energy of 950 eV.
Translational excitation
After precursor ion selection and excitation an inert gas is admitted into
the ICR cell through a pulsed valve. Ion-atoms (or molecules) collisions
occur and product ions are generated by collisional activated
dissociation (CAD).
The main drawback of this procedure is that product ions are generated
far from the center cell, which limits the efficiency and resolution for the
MS/MS experiment.
Collisional activated dissociation (CAD)

Linear Ion Trap – FT-ICR-MS hybrid system
The MS/MS, MSn capabilities of linear ion trap have been coupled to the
extreme mass resolution of a ICR cell to obtain a powerful mass
spectrometer (LTQ-FT Ultra from Thermo Electron):
HPLC
ECD: Electron Capture Dissociation
IRMPD: InfraRed Multi Photon Dissociation

The main figures of merit of this LIT-ICR instrument are:
mass range: 50-4000 u
resolution: 100000 at m/z 400 at 1 s/scan; > 750000 at m/z 400 at
slower scan repetition rates (ICR operated in broadband mode)
mass accuracy: < 1.2 ppm RMS error, with external calibration; < 1
ppm RMS error with internal calibration
sensitivity: sub femtomoles (10-15 moles) – attomoles (10-18) for
peptides
dynamic range: > 4000

Another very important feature is the possibility of double detection,
that can be performed even in a parallel approach:
In the first part of the experiment, a pre-scan is performed with the LIT,
then ions are partly injected in the ICR trap for high accuracy/resolution
MS scan. The remaining ions are subject to parallel MS/MS acquisitions
in the LIT.

An example of LIT-ICR power: distinction between almost isobaric
compounds (two mutant peptides).