Embed Size (px)
Citation preview
Federal Reserve Bank of St. Louis REVIEW January/February 2013 51
Four Stories of Quantitative Easing
Brett W. Fawley and Christopher J. Neely
C entral banks typically conduct monetary policy through control of short-term nominalinterest rates that can potentially affect the economy through a variety of channels.Because inflation expectations do not immediately react one for one to changes in nomi-
nal interest rates, central banks can also control real interest rates, at least over the short tomedium term. The typical assumption is that monetary policy changes real (inflation-adjusted)short-term rates to influence economic decisions through their effect on other asset prices.That is, real interest rates will change asset prices in such a way as to change the willingness ofbanks to lend, firms to invest, or individuals to consume or invest in housing. Thus, a changein short-term real interest rates potentially influences the level of output and employment.
Because people can always hold currency instead of depositing it in a bank, short-termnominal interest rates cannot go (much) below zero, which limits the effectiveness of conven-tional monetary policy.1 Concerns about the consequences of the zero bound for interest ratesdate at least to Keynes (1936), and many observers have believed that central banks are helplesswhen short-term rates are near the zero bound. Many others, however, have argued that centralbanks can influence prices and output even when short-term rates are near their zero floor byincreasing liquidity, particularly by purchasing long-term assets. For example, Mishkin (1996)
This article describes the circumstances of and motivations for the quantitative easing programs of theFederal Reserve, Bank of England, European Central Bank, and Bank of Japan during the recent financialcrisis and recovery. The programs initially attempted to alleviate financial market distress, but this pur-pose soon broadened to include achieving inflation targets, stimulating the real economy, and contain-ing the European sovereign debt crisis. The European Central Bank and Bank of Japan focused theirprograms on direct lending to banks—reflecting the bank-centric structure of their financial systems—while the Federal Reserve and the Bank of England expanded their respective monetary bases by pur-chasing bonds. (JEL E51, E58, E61, G12)
Federal Reserve Bank of St. Louis Review, January/February 2013, 95(1), pp. 51-88.
Brett W. Fawley is a senior research associate and Christopher J. Neely is an assistant vice president and economist at the Federal Reserve Bankof St. Louis.
© 2013, The Federal Reserve Bank of St. Louis. The views expressed in this article are those of the author(s) and do not necessarily reflect theviews of the Federal Reserve System, the Board of Governors, or the regional Federal Reserve Banks. Articles may be reprinted, reproduced,published, distributed, displayed, and transmitted in their entirety if copyright notice, author name(s), and full citation are included. Abstracts,synopses, and other derivative works may be made only with prior written permission of the Federal Reserve Bank of St. Louis.
characterizes the view that monetary policy can do nothing to stimulate the economy onceshort-term nominal interest rates approach zero as “demonstrably false.”
Recent events have twice tested this claim: first in the early 2000s in Japan and then afterthe 2007-09 financial crisis in the United States, United Kingdom, Japan, and the euro area. Withshort rates approaching the zero lower bound in late 2008/early 2009, the Federal Reserve, theBank of Japan (BOJ), the Bank of England (BOE), and the European Central Bank (ECB) beganto pursue less conventional monetary policies—including forms of quantitative easing (QE)—to stimulate economic growth. QE policies are those that unusually increase the monetary base,including asset purchases and lending programs. Programs designed to improve credit condi-tions—that is, credit easing—are a special case of QE if they also increase the monetary base.
Academics have already conducted substantial research on recent QE programs. Stroebeland Taylor (2009), Kohn (2009), Meyer and Bomfim (2010), and Gagnon et al. (2011a,b), forexample, study the Fed’s 2008-09 QE programs. Gagnon et al.’s (2011a,b) announcement studyfinds that large-scale asset purchase (LSAP) announcements reduced U.S. long-term yields.Joyce et al. (2011) find that the BOE’s QE program had bond yield effects quantitatively similarto those reported by Gagnon et al. (2011a,b) for the U.S. program. Hamilton and Wu (2011)indirectly calculate the effects of the Fed’s 2008-09 QE programs with a term structure model.Neely (2012) evaluates the effect of the Fed’s 2008-09 QE on international long bond yields andexchange rates, showing that the effects are consistent with a simple portfolio balance modeland long-run purchasing power parity.
Despite this profusion of research on asset purchase programs and QE more generally, therehas been little attempt to describe and compare QE programs across central banks.2 This articlefills that gap by describing and comparing the QE and related maturity extension programs ofthe BOJ, the BOE, the Fed, and the ECB. We emphasize, however, that although we draw somelimited conclusions about the immediate effects of the programs on financial markets, we donot evaluate the efficacy of the QE programs on the broader economies, as that would requirecounterfactual models and empirical work well beyond the scope of this article.
The details of the QE programs varied across central banks and depended on the particularstructures of their respective economies and the specific motivations for each of the QE actions.For example, this article details the circumstances under which the ECB and BOJ generouslylent money to banks to inject reserves into their bank-centric economies, but the Fed and BOEinjected reserves into the U.S. and U.K. economies by purchasing bonds. One topic on whichthis article does not shed light is the extent to which the QE and related programs might havebeen coordinated; there is no significant public information on the extent of international coor-dination, if any.
The QE programs in response to the financial crisis differ radically from temporary increasesin the monetary base that are occasionally used to provide liquidity for short periods, such ascentral banks did for Y2K or short-term emergency last-resort lending. Instead, this article dis-cusses the recent episodes in which central banks used QE to stimulate the economy, perhapsby facilitating the functioning of particular financial markets.
The next section discusses potential monetary transmission mechanisms at the zero lowerbound, how the mechanisms provide a role for QE, and how they explain the choices involved
Fawley and Neely
52 January/February 2013 Federal Reserve Bank of St. Louis REVIEW

in QE programs. We then discuss the relationship between QE and credit easing and describethe Fed, BOJ, BOE, and ECB motivations and programs in the context of a timeline. This is fol-lowed by summaries of the amounts and types of asset purchases and our conclusion.
MONETARY TRANSMISSION MECHANISMS AT THE ZERO LOWERBOUND
Central banks ordinarily conduct monetary policy by buying and selling short-term debtsecurities to target short-term nominal interest rates. These purchases and sales of assets changeboth short-term interest rates and the monetary base (the quantity of currency and bank reservesin the economy). For example, a central bank can expand the monetary base in two essentiallyequivalent ways: by buying bonds from the public or by lending money to the public. Buyingbonds reduces the public’s bond holdings and increases the amount of currency and bankreserves in the economy. This conventional monetary policy can potentially stimulate the econ-omy through two types of channels: asset price channels (including interest rates) and creditchannels.
By purchasing short-term securities, expanding the monetary base, and lowering short-termreal interest rates, central banks can affect a variety of asset prices, including exchange rates andstock prices. The changes in asset prices can affect economic decisions. Higher stock prices candirectly stimulate consumption and business investment by increasing consumer wealth andmaking the issuance of new stock more lucrative. A lower foreign exchange value of the domesticcurrency makes domestic goods more competitive with foreign goods. Lower interest ratesencourage borrowing for consumption and investment.
Credit channels require asset price changes to work but they also exploit the fact that easiermonetary policy can reduce the effect of certain financial frictions—adverse selection and moralhazard—that hinder borrowing.3 These problems are especially pervasive during difficult eco-nomic times. One example of how economic conditions influence lending through these frictionsis that expectations of low profitability can discourage potentially creditworthy borrowers fromseeking to borrow at all, but they will not discourage fraudulent borrowers who have no intentionof repaying the loan. Thus, the pool of firms and individuals seeking loans will become heavilyweighted toward fraudulent borrowers and banks—knowing this—will become increasinglyreluctant to make loans. By lowering interest rates and raising stock prices, expansionary mone-tary policy can improve the balance sheets of firms and consumers, reducing problems of adverseselection and moral hazard.
However, purchasing short-term securities cannot lower interest rates when they are at zero;therefore, increasing the monetary base is not—by itself—considered an effective stimulus.Because money and bonds become close substitutes, the public can simply choose to hold cen-tral bank injections of money as currency “under the mattress,” which prevents the additionalmoney from stimulating economic activity. Such a situation is called a liquidity trap and canmotivate central banks to focus on specific markets and/or interest rates rather than simplyexpanding the quantity of money.4
In the face of near-zero short-term rates, central banks have recently turned to unconven-tional policies, which often dramatically increase their monetary bases, to alleviate financial
Fawley and Neely
Federal Reserve Bank of St. Louis REVIEW January/February 2013 53
distress or stimulate their economies. Some of these unconventional policies involve direct lend-ing to specific, distressed short-term credit markets, whereas others involve purchases of long-term assets that are intended to reduce real, long-term interest rates.
To understand how monetary policy can potentially affect long-term interest rates, it is usefulto decompose the n-year real yield on a bond as follows:
where yt,t+n is the expected real yield at time t on an n-year bond, y–t,t+n is the average expectedovernight rate over the next n years at time t, TPt,n is the term premium on an n-year bond attime t, and Etpn is the expected average rate of inflation over the next n years at time t. Long-termreal yields can decline in any of three ways: (i) Expected inflation can increase, (ii) the expectedpolicy rate path can fall, and (iii) the term premium can fall.
What sort of monetary policy would change expected inflation, the expected path of shortrates, and/or the term premium? First, a central bank can commit to zero interest rates beyondthe period that their reaction function would normally call for, what Eggertsson (2006) refers toas “committing to be irresponsible.”5 Such a strategy—often termed “signaling”—is time incon-sistent, however: The central bank will want to renege on its commitment and return to its nor-mal policy when conditions improve. The second and third methods—outright asset purchasesand bank lending (QE)—can help resolve the apparent time inconsistency of a commitment toan announced policy rate path by changing the central bank’s incentives through its balancesheet. A central bank that purchases a sizable quantity of long bonds when long rates are lowwill see the value of its bond portfolio decline if long rates rise.6 Similarly, the value of long-termloans will decline as long-term rates rise.
Despite concerns about time consistency, recent policy has incorporated strategies thatattempt to commit to a path: The Fed, for example, used five variations of “extended period”language to restrain expectations of policy rate hikes, eventually suggesting that it would main-tain its low policy rate until at least mid-2015. On December 12, 2012, the FOMC linked therate hikes to economic conditions rather than a fixed date. Specifically, the FOMC announcedthat it expected low rates to be appropriate as long as the unemployment rate was above 6.5 per-cent, medium-term inflation forecasts stayed below 2.5 percent, and long-run inflation expec-tations remained anchored.7
Central banks can also lower long-term real rates by reducing term premia through assetpurchases. This method relies on the portfolio balance channel, which assumes frictions—typi-cally preferred habitat/market segmentation—that (i) preclude perfect arbitrage between longand expected short rates and (ii) permit changes in the maturity composition of nominal govern-ment debt to affect asset prices. That is, a central bank’s purchase of a quantity of a certain typeof risk (i.e., duration) will cause investors to demand less compensation to hold the remainingamount of that type of risk and term premia will fall. Thus, signaling and portfolio balancechannels allow asset purchases to lower long real rates and thereby stimulate the economythrough the aforementioned asset price and credit channels (Mishkin, 1996).
yt ,t+n = yt ,t+n +TPt ,n !Et!n ,
Fawley and Neely
54 January/February 2013 Federal Reserve Bank of St. Louis REVIEW
QUANTITATIVE EASING VERSUS CREDIT EASING This section differentiates credit easing from pure QE. Credit easing policies are intended
to reduce specific interest rates/restore market function, while QE describes any policy thatunusually increases the magnitude of central bank liabilities—currency and bank reserves—particularly at the zero bound. Credit easing can entail QE but it specifically targets certainmarkets and/or interest rates. Federal Reserve Chairman Ben Bernanke termed the Fed’s LSAPs“credit easing” because the Fed sought to improve the functioning of long-term bond marketsand decrease long-term interest rates rather than simply increase the monetary base. In the samespeech, the Chairman stated that “in a pure QE regime, the focus of policy is the quantity of bankreserves, which are liabilities of the central bank; the composition of loans and securities on theasset side of the central bank’s balance sheet is incidental” (Bernanke, 2009). ECB executiveboard member Lorenzo Bini Smaghi describes QE similarly: “When the central bank decides toexpand the size of its balance sheet, it has to choose which assets to buy. In theory, it could pur-chase any asset from anybody” (Bini Smaghi, 2009).
Both the BOJ in the early 2000s and the BOE in the recent episode explicitly described theirobjectives as expanding bank reserves—that is, QE—rather than easing credit market conditions.The BOE described its policy in this manner even though its purchases of medium- and long-term gilts would tend to reduce the corresponding interest rates.8 The ECB and BOJ have recentlyinitiated lending programs that could also be considered “pure” QE in the sense that they targetedreserves and typically accepted a wide range of assets as collateral.
PROGRAM DESCRIPTIONS AND MOTIVATIONSThis article focuses on the QE programs in response to the subprime crisis, but the BOJ
created a precursor to such programs in 2001 in response to an extended period of very sluggisheconomic conditions. On March 19, 2001, the BOJ changed its main operating target from theuncollateralized overnight call rate to the outstanding balance of “current accounts” (i.e., thequantity of bank reserves). The BOJ announced that it was increasing the target for bank reservesfrom ¥4 trillion to ¥5 trillion, which was expected to drive the overnight call rate from 0.15 per-cent to zero.
By 2004, the BOJ had incrementally increased the target for bank reserves to ¥30 trillion to¥35 trillion while simultaneously purchasing public and private debt and communicating theconditions necessary for exiting the zero interest rate policy (ZIRP). On March 9, 2006, the BOJended its official QE regime when it reinstated the uncollateralized overnight call rate as themain policy instrument (setting the target at 0 percent).
The Japanese experience provides few firm conclusions as to the potential for QE as a policyinstrument. Ito and Mishkin (2006) argue that the BOJ managed market expectations very poorlyfrom 1998 to 2003, compromising any potential for success. Central banks would soon haveanother opportunity to employ QE to battle very difficult economic conditions.
Initial Post-Lehman Brothers Responses (September 2008–November 2009)
By late 2008, the delayed indirect effects of the housing price bubble collapse of 2006 hadleft financial markets dysfunctional, output falling, and short-term rates close to zero. Figure 1
Fawley and Neely
Federal Reserve Bank of St. Louis REVIEW January/February 2013 55
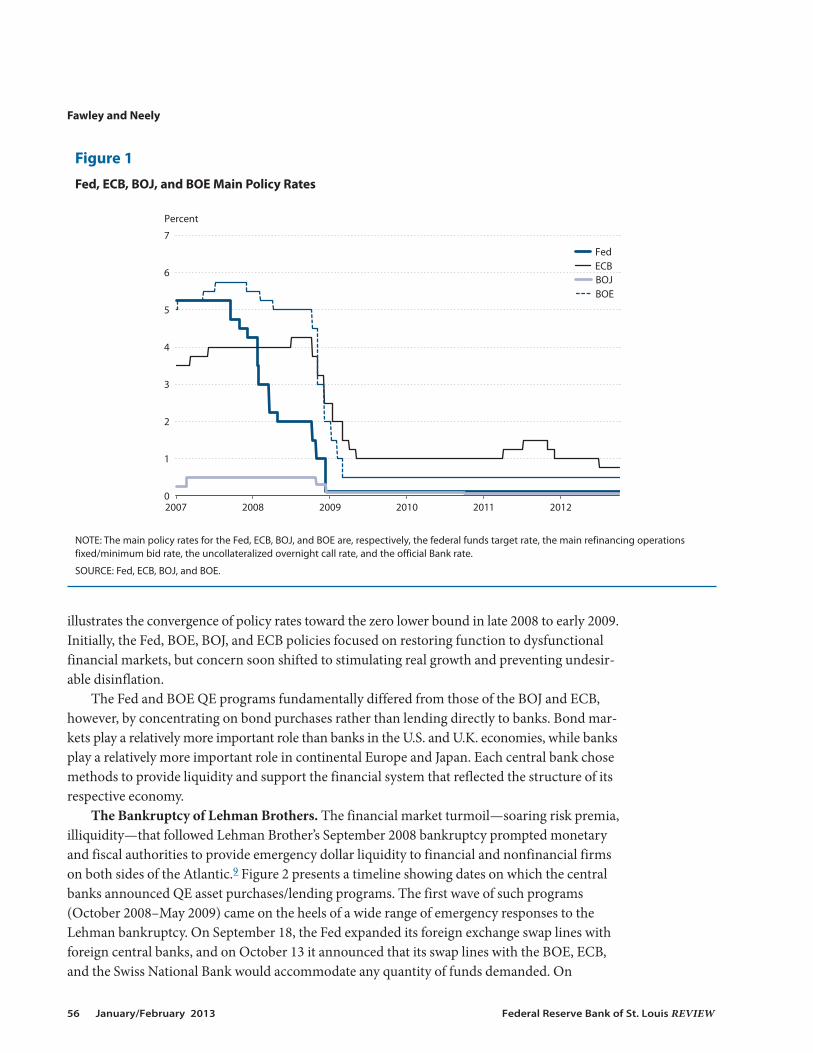
illustrates the convergence of policy rates toward the zero lower bound in late 2008 to early 2009.Initially, the Fed, BOE, BOJ, and ECB policies focused on restoring function to dysfunctionalfinancial markets, but concern soon shifted to stimulating real growth and preventing undesir-able disinflation.
The Fed and BOE QE programs fundamentally differed from those of the BOJ and ECB,however, by concentrating on bond purchases rather than lending directly to banks. Bond mar-kets play a relatively more important role than banks in the U.S. and U.K. economies, while banksplay a relatively more important role in continental Europe and Japan. Each central bank chosemethods to provide liquidity and support the financial system that reflected the structure of itsrespective economy.
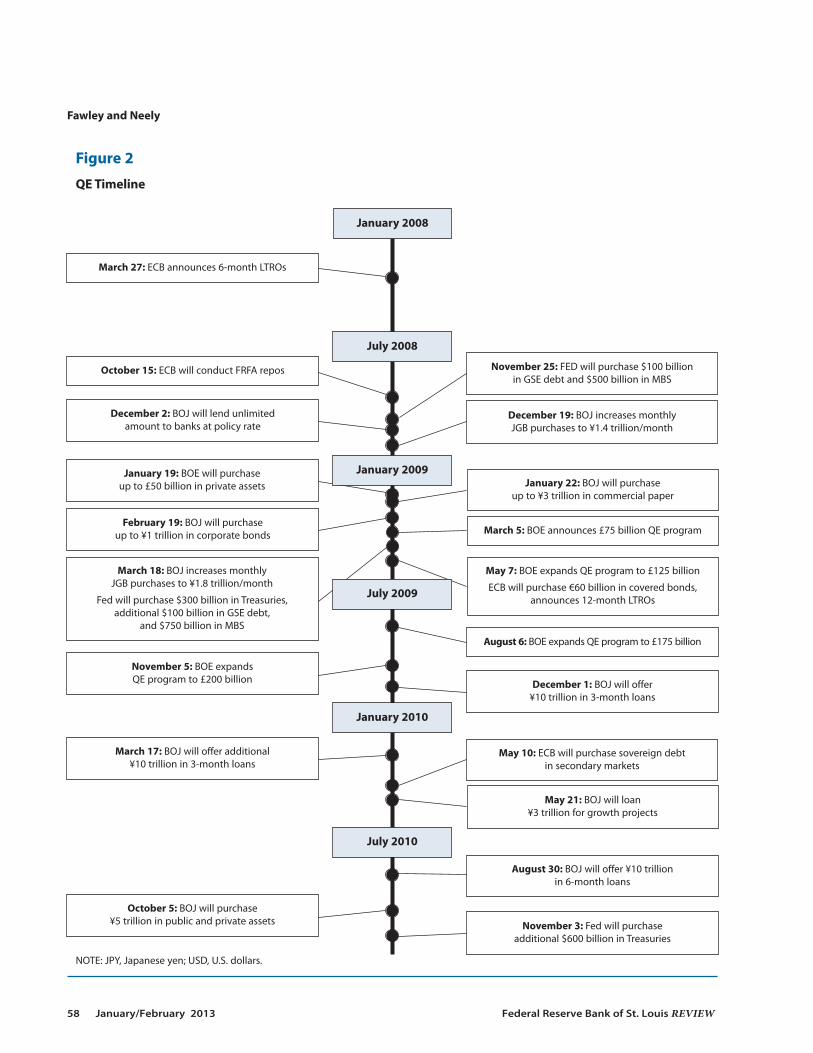
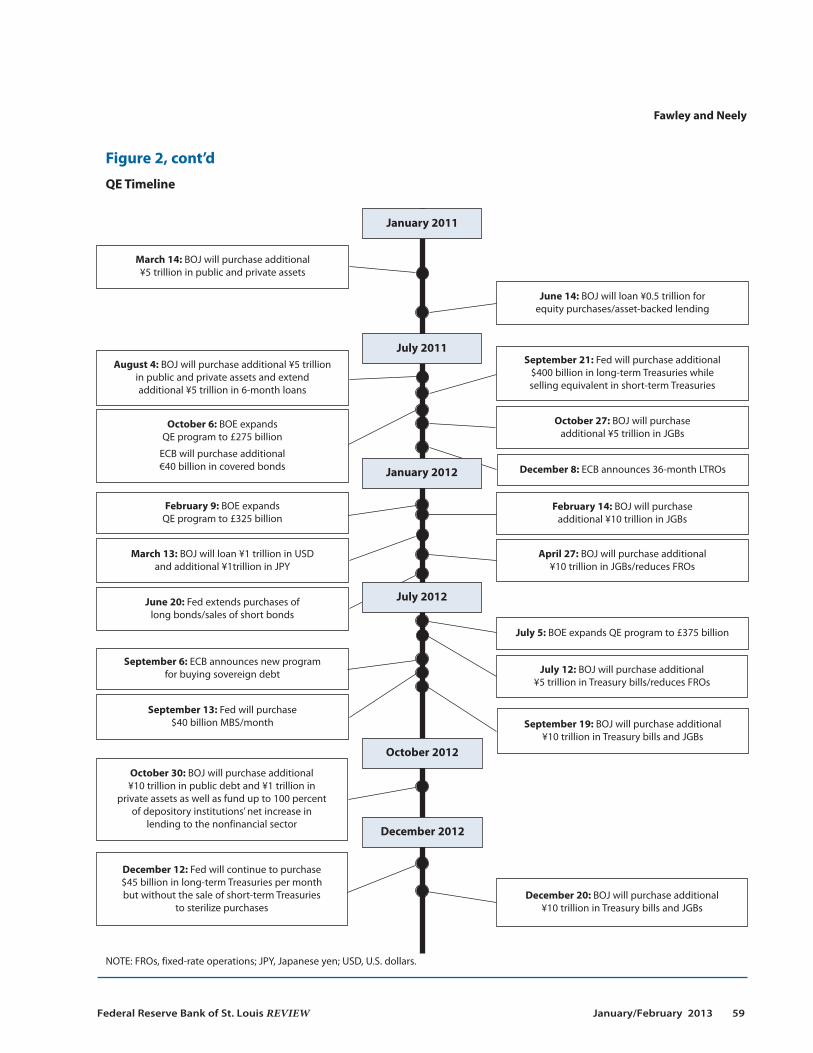
The Bankruptcy of Lehman Brothers. The financial market turmoil—soaring risk premia,illiquidity—that followed Lehman Brother’s September 2008 bankruptcy prompted monetaryand fiscal authorities to provide emergency dollar liquidity to financial and nonfinancial firmson both sides of the Atlantic.9 Figure 2 presents a timeline showing dates on which the centralbanks announced QE asset purchases/lending programs. The first wave of such programs(October 2008–May 2009) came on the heels of a wide range of emergency responses to theLehman bankruptcy. On September 18, the Fed expanded its foreign exchange swap lines withforeign central banks, and on October 13 it announced that its swap lines with the BOE, ECB,and the Swiss National Bank would accommodate any quantity of funds demanded. On
Fawley and Neely
56 January/February 2013 Federal Reserve Bank of St. Louis REVIEW
0
1
2
3
4
5
6
7
2007 2008 2009 2010 2011 2012
Fed ECB BOJ BOE
Percent
Figure 1
Fed, ECB, BOJ, and BOE Main Policy Rates
NOTE: The main policy rates for the Fed, ECB, BOJ, and BOE are, respectively, the federal funds target rate, the main refinancing operationsfixed/minimum bid rate, the uncollateralized overnight call rate, and the official Bank rate.
SOURCE: Fed, ECB, BOJ, and BOE.
September 19, the U.S. Treasury guaranteed money market mutual fund (MMMF) deposits andthe Fed created the Asset-Backed Commercial Paper (ABCP) Money Market Mutual FundLiquidity Facility, which lent money to banks for the purpose of purchasing high-quality ABCP.10
On October 7, the Fed created the Commercial Paper Funding Facility (CPFF) to directly pur-chase high-quality commercial paper. The ECB announced on September 29, 2008, that on thatday it would begin a 1-month “special term refinancing operation…to improve the overall liq-uidity position of the euro area banking system.” Although the Fed previously had responded tothe financial crisis (e.g., implementing the Term Auction Facility), these actions were the firstunsterilized policy actions—that is, the first Fed actions that were allowed to unusually expandthe monetary base (see the boxed insert).
The ECB’s Fixed-Rate Tender, Full-Allotment Programs. The 3-month Euribor/overnightindexed swap (OIS) spread widened as financial conditions deteriorated. On October 10, 2008,the spread hit an all-time high of 198 basis points, which reflected the sharp rise in perceivedcounterparty risk.11 The ECB responded to these widening spreads on October 15, 2008, withits first measure of QE: The ECB announced it would lend as much as banks wanted at a fixed-rate tender—provided the banks had collateral—while also expanding the list of eligible collateral.These fixed-rate tender, full-allotment (FRFA) operations reversed the ECB’s conventional policyof offering a fixed allotment of funds at rates determined by the bidding process.12
The ECB implemented the FRFA liquidity provision through its usual lending procedures.In normal times, the ECB’s primary policy instrument is refinancing operations, direct lendingto banks against eligible collateral at two maturities. Main refinancing operations (MROs) havea period of two weeks and longer-term refinancing operations (LTROs) have a period of threemonths.13 In the usual MROs and LTROs, the ECB predetermines the amount of funding avail-able and auctions those funds by price. Under the new policy, the ECB filled all MRO and LTRO
Fawley and Neely
Federal Reserve Bank of St. Louis REVIEW January/February 2013 57
Abbreviations Used
ABCP Asset-Backed Commercial Paper GSFF Growth-Supporting Funding Facility
APF Asset Purchase Facility JGBs Japanese government bonds
APP Asset Purchase Program J-REITs Japanese real estate investment trusts
BOE Bank of England LSAP large-scale asset purchase
BOJ Bank of Japan LTROs longer-term refinancing operations
CBPP covered bond purchase program MBS mortgage-backed securities
CFI corporate finance instruments MMMF money market mutual fund
CPFF Commercial Paper Funding Facility MROs main refinancing operations
ECB European Central Bank OIS overnight indexed swap
ETFs exchange-traded funds OMTs outright monetary transactions
FOMC Federal Open Market Committee QE quantitative easing
FRFA fixed-rate, full-allotment SBLF Stimulating Bank Lending Facility
FROs fixed-rate operations SFSOs special-funds-supplying operations
GDP gross domestic product SMP Securities Markets Programme
GSE government-sponsored enterprise ZIRP zero interest rate policy
Fawley and Neely
58 January/February 2013 Federal Reserve Bank of St. Louis REVIEW
Figure 2
QE Timeline
NOTE: JPY, Japanese yen; USD, U.S. dollars.
March 27: ECB announces 6-month LTROs
October 15: ECB will conduct FRFA repos November 25: FED will purchase $100 billion in GSE debt and $500 billion in MBS
December 2: BOJ will lend unlimited amount to banks at policy rate
December 19: BOJ increases monthly JGB purchases to ¥1.4 trillion/month
January 19: BOE will purchase up to £50 billion in private assets
December 1: BOJ will offer ¥10 trillion in 3-month loans
August 6: BOE expands QE program to £175 billion
November 5: BOE expands QE program to £200 billion
May 7: BOE expands QE program to £125 billion
ECB will purchase €60 billion in covered bonds,announces 12-month LTROs
March 18: BOJ increases monthly JGB purchases to ¥1.8 trillion/month
Fed will purchase $300 billion in Treasuries, additional $100 billion in GSE debt,
and $750 billion in MBS
March 5: BOE announces £75 billion QE program
January 22: BOJ will purchase up to ¥3 trillion in commercial paper
February 19: BOJ will purchase up to ¥1 trillion in corporate bonds
October 5: BOJ will purchase ¥5 trillion in public and private assets
May 21: BOJ will loan ¥3 trillion for growth projects
March 17: BOJ will offer additional ¥10 trillion in 3-month loans
November 3: Fed will purchase additional $600 billion in Treasuries
August 30: BOJ will offer ¥10 trillion in 6-month loans
May 10: ECB will purchase sovereign debt in secondary markets
January 2008
July 2008
January 2010
July 2010
January 2009
July 2009
Fawley and Neely
Federal Reserve Bank of St. Louis REVIEW January/February 2013 59
Figure 2, cont’d
QE Timeline
NOTE: FROs, fixed-rate operations; JPY, Japanese yen; USD, U.S. dollars.
March 14: BOJ will purchase additional ¥5 trillion in public and private assets
June 14: BOJ will loan ¥0.5 trillion for equity purchases/asset-backed lending
August 4: BOJ will purchase additional ¥5 trillionin public and private assets and extend additional ¥5 trillion in 6-month loans
September 21: Fed will purchase additional$400 billion in long-term Treasuries while selling equivalent in short-term Treasuries
October 6: BOE expands QE program to £275 billion
ECB will purchase additional €40 billion in covered bonds
October 27: BOJ will purchase additional ¥5 trillion in JGBs
July 5: BOE expands QE program to £375 billion
April 27: BOJ will purchase additional ¥10 trillion in JGBs/reduces FROs
June 20: Fed extends purchases of long bonds/sales of short bonds
March 13: BOJ will loan ¥1 trillion in USD and additional ¥1trillion in JPY
February 14: BOJ will purchase additional ¥10 trillion in JGBs
February 9: BOE expands QE program to £325 billion
December 8: ECB announces 36-month LTROs
September 13: Fed will purchase $40 billion MBS/month
July 12: BOJ will purchase additional ¥5 trillion in Treasury bills/reduces FROs
September 19: BOJ will purchase additional ¥10 trillion in Treasury bills and JGBs
September 6: ECB announces new program for buying sovereign debt
January 2011
July 2011
July 2012
January 2012
October 2012
December 2012
October 30: BOJ will purchase additional ¥10 trillion in public debt and ¥1 trillion in
private assets as well as fund up to 100 percentof depository institutions’ net increase in
lending to the nonfinancial sector
December 12: Fed will continue to purchase $45 billion in long-term Treasuries per month but without the sale of short-term Treasuries
to sterilize purchasesDecember 20: BOJ will purchase additional
¥10 trillion in Treasury bills and JGBs
loan requests at the ECB’s primary policy rate, the main refinancing rate. From October 2008 toMay 2009, the ECB cut this rate from 4.25 percent to 1 percent.14
Bini Smaghi (2009) calls the FRFA liquidity policy “endogenous credit easing” becausebanks’ demand for liquidity at the fixed-rate tender determines liquidity. Figure 3B shows thespike in lending under MROs and LTROs following the availability of unlimited funds at thefixed rate in October 2008.
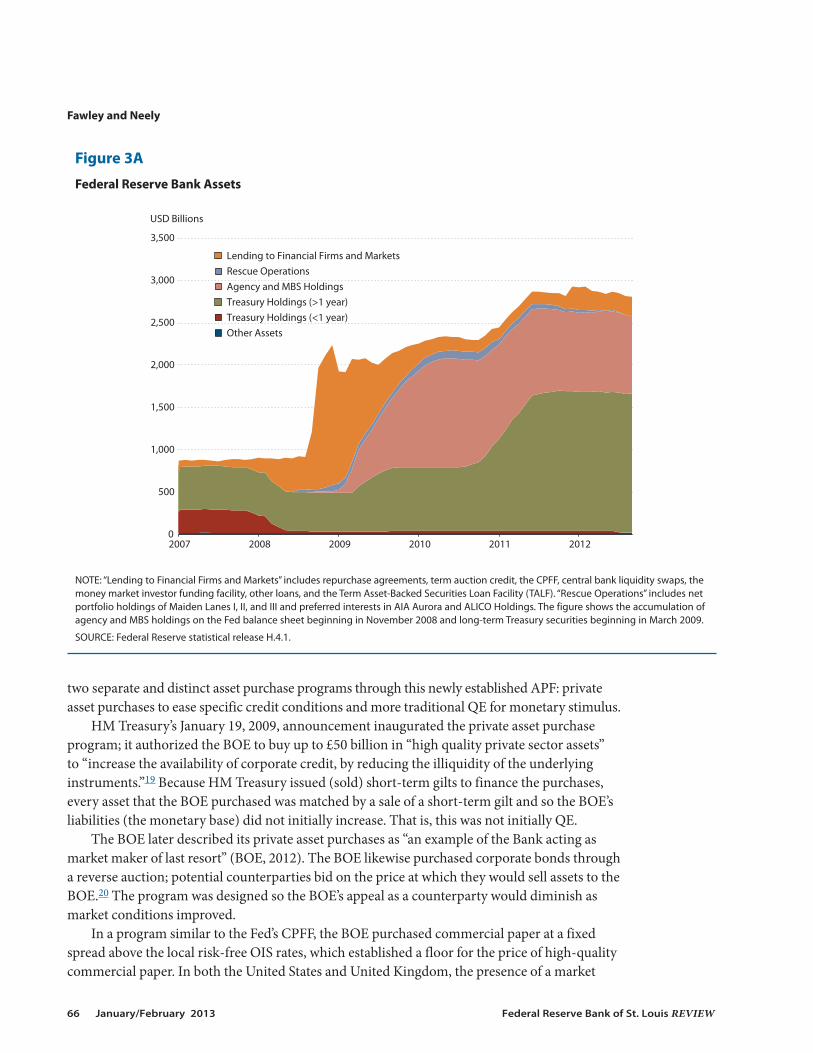
The Fed’s QE1 Programs. While the ECB expanded bank lending operations, the FederalReserve pursued outright asset purchases. On November 25, 2008, the Federal Reserve announcedplans to purchase $100 billion in government-sponsored enterprise (GSE) debt and $500 billionin mortgage-backed securities (MBS) issued by those GSEs (Table 1A).15 On March 18, 2009,the Fed announced additional purchases of $100 billion in GSE debt, $750 billion in MBS, and$300 billion in long-term Treasury securities. Figure 3A illustrates the accumulation of agencyand MBS holdings on the Fed balance sheet beginning in November 2008 and long-termTreasuries beginning in March 2009. Figure 4 reveals that these purchases roughly doubled thesize of the U.S. monetary base.
The Fed’s November 2008 and March 2009 asset purchase programs—commonly called“QE1”—were designed to support the entire economy but they naturally prioritized housingcredit markets, which had been especially hard hit by the 2006-08 fall in U.S. real estate prices,sales, and construction. Housing GSE debt and MBS accounted for more than 80 percent of theassets purchased by the Federal Reserve in its first round of QE, or LSAPs; these assets weredirectly linked to housing market credit.16 The Federal Open Market Committee (FOMC) statedthat the goal of the initial LSAPs was to “reduce the cost and increase the availability of creditfor the purchase of houses, which in turn should support housing markets and foster improvedconditions in financial markets more generally.”17 Gagnon et al. (2011a) report that the November2008 and March 2009 purchases lowered long-term real U.S. interest rates through their effecton term premia. These purchases substantially increased excess bank reserves.
The Bank of Japan’s Special-Funds-Supplying Operations. Following closely on the heelsof the Fed’s November 25 asset purchase release, the BOJ announced on December 2, 2008, thatit would lend unlimited amounts to banks at near-zero rates through special-funds-supplyingoperations (SFSOs), which were much like the ECB’s lending operations. The SFSOs offered3-month loans to banks at the uncollateralized overnight call rate, which was then at 0.3 percent.The only limit on the size of the loans from the BOJ to banks was the amount of available collat-eral (commercial paper and corporate debt). The SFSOs, like the ECB’s FRFA repurchase agree-ment (repo) auctions, constituted QE because they increased the monetary base. On December19, 2008, the BOJ followed this action by lowering the overnight call rate to 0.1 percent andannouncing an increase in outright purchases of Japanese government bonds (JGBs) and a newprogram to purchase corporate financial instruments.18 BOJ assets did not increase sharply inDecember 2008 (see Figure 3D), though the BOJ’s balance sheet did begin to expand after thispoint.
The Bank of England’s Programs. After some initial reluctance to engage in credit easingor QE, U.K. authorities announced plans to purchase assets for these purposes in January andMarch 2009. On January 19, 2009, Her Majesty’s (HM) Treasury announced the establishmentof the Asset Purchase Facility (APF), which was to be operated by the BOE. The BOE conducted
Fawley and Neely
60 January/February 2013 Federal Reserve Bank of St. Louis REVIEW

Fawley and Neely
Federal Reserve Bank of St. Louis REVIEW January/February 2013 61
Table 1A
Important Announcem
ents by the Federal Reserve
Date
Program
Event
Brief description
Interest rate news
11/2
5/20
08Q
E1FO
MC
stat
emen
tLS
APs
ann
ounc
ed: F
ed w
ill p
urch
ase
$100
bill
ion
in G
SE d
ebt a
nd $
500
billi
on
in M
BS.
12/1
/200
8Q
E1Be
rnan
ke s
peec
hFi
rst s
ugge
stio
n of
ext
endi
ng Q
E to
Tre
asur
ies.
12/1
6/20
08Q
E1FO
MC
stat
emen
tFi
rst s
ugge
stio
n of
ext
endi
ng Q
E to
Tre
asur
ies
by F
OM
C.Th
e Fe
d cu
ts th
e fe
dera
l fun
ds
rate
from
1%
to 0
.00-
0.25
%;
expe
cts
low
rate
s “fo
r som
e tim
e.”1/
28/2
009
QE1
FOM
C st
atem
ent
Fed
stan
ds re
ady
to e
xpan
d Q
E an
d bu
y Tr
easu
ries.
3/18
/200
9Q
E1FO
MC
stat
emen
tLS
APs
exp
ande
d: F
ed w
ill p
urch
ase
$300
bill
ion
in lo
ng-t
erm
Tre
asur
ies
and
Fed
expe
cts
low
rate
s fo
r an
add
ition
al $
750
and
$100
bill
ion
in M
BS a
nd G
SE d
ebt,
resp
ectiv
ely.
“an
exte
nded
per
iod.
”8/
12/2
009
QE1
FOM
C st
atem
ent
LSA
Ps s
low
ed: A
ll pu
rcha
ses
will
fini
sh b
y th
e en
d of
Oct
ober
, not
mid
-Sep
tem
ber.
9/23
/200
9Q
E1FO
MC
stat
emen
tLS
APs
slo
wed
: Age
ncy
debt
and
MBS
pur
chas
es w
ill fi
nish
at t
he e
nd o
f 201
0:Q
1.11
/4/2
009
QE1
FOM
C st
atem
ent
LSA
Ps d
owns
ized
: Age
ncy
debt
pur
chas
es w
ill fi
nish
at $
175
billi
on.
8/10
/201
0Q
E1FO
MC
stat
emen
tBa
lanc
e sh
eet m
aint
aine
d: T
he F
ed w
ill re
inve
st p
rinci
pal p
aym
ents
from
LSA
Ps
in T
reas
urie
s.8/
27/2
010
QE2
Bern
anke
spe
ech
Bern
anke
sug
gest
s ro
le fo
r add
ition
al Q
E “s
houl
d fu
rthe
r act
ion
prov
e ne
cess
ary.”
9/21
/201
0Q
E2FO
MC
stat
emen
tFO
MC
emph
asiz
es lo
w in
flatio
n, w
hich
“is
likel
y to
rem
ain
subd
ued
for s
ome
time
befo
re ri
sing
to le
vels
the
Com
mitt
ee c
onsi
ders
con
sist
ent w
ith it
s m
anda
te.”
10/1
2/20
10Q
E2FO
MC
min
utes
rele
ased
FOM
C m
embe
rs’ “s
ense
” is
that
“[ad
ditio
nal]
acco
mm
odat
ion
may
be
appr
opria
te
befo
re lo
ng.”
10/1
5/20
10Q
E2Be
rnan
ke s
peec
hBe
rnan
ke re
itera
tes
that
Fed
sta
nds
read
y to
furt
her e
ase
polic
y.11
/3/2
010
QE2
FOM
C st
atem
ent
QE2
ann
ounc
ed: F
ed w
ill p
urch
ase
$600
bill
ion
in T
reas
urie
s.6/
22/2
011
QE2
FOM
C st
atem
ent
QE2
fini
shes
: Tre
asur
y pu
rcha
ses
will
wra
p up
at t
he e
nd o
f mon
th, a
s sc
hedu
led;
pr
inci
pal p
aym
ents
will
con
tinue
to b
e re
inve
sted
.9/
21/2
011
Mat
urity
Ext
ensi
on
FOM
C st
atem
ent
Mat
urity
Ext
ensi
on P
rogr
am (“
Ope
ratio
n Tw
ist”
) ann
ounc
ed: T
he F
ed w
ill p
urch
ase
Prog
ram
$400
bill
ion
of T
reas
urie
s w
ith re
mai
ning
mat
uriti
es o
f 6 to
30
year
s an
d se
ll an
eq
ual a
mou
nt w
ith re
mai
ning
mat
uriti
es o
f 3 y
ears
or l
ess;
MBS
and
age
ncy
debt
pr
inci
pal p
aym
ents
will
no
long
er b
e re
inve
sted
in T
reas
urie
s, bu
t ins
tead
in M
BS.
6/20
/201
2M
atur
ity E
xten
sion
FO
MC
stat
emen
tM
atur
ity E
xten
sion
Pro
gram
ext
ende
d: T
he F
ed w
ill c
ontin
ue to
pur
chas
e lo
ng-t
erm
Pr
ogra
mse
curit
ies
and
sell
shor
t-te
rm s
ecur
ities
thro
ugh
the
end
of 2
012.
Pur
chas
es/s
ales
w
ill c
ontin
ue a
t the
cur
rent
pac
e, a
bout
$45
bill
ion/
mon
th.
8/22
/201
2Q
E3FO
MC
min
utes
rele
ased
FOM
C m
embe
rs “j
udge
d th
at a
dditi
onal
mon
etar
y ac
com
mod
atio
n w
ould
like
ly
be w
arra
nted
fairl
y so
on…
”9/
13/2
012
QE3
FOM
C st
atem
ent
QE3
ann
ounc
ed: T
he F
ed w
ill p
urch
ase
$40
billi
on o
f MBS
per
mon
th a
s lo
ng
Fed
expe
cts
low
rate
s “at
as “t
he o
utlo
ok fo
r the
labo
r mar
ket d
oes
not i
mpr
ove
subs
tant
ially
…in
the
leas
t thr
ough
mid
-201
5.”
cont
ext o
f pric
e st
abili
ty.”
12/1
2/20
12Q
E3FO
MC
stat
emen
tQ
E3 e
xpan
ded:
The
Fed
will
con
tinue
to p
urch
ase
$45
billi
on o
f lon
g-te
rm
The
Fed
expe
cts
low
rate
s to
Trea
surie
s pe
r mon
th b
ut w
ill n
o lo
nger
ste
riliz
e pu
rcha
ses
thro
ugh
the
sale
be a
ppro
pria
te w
hile
une
m-
of s
hort
-ter
m T
reas
urie
s.pl
oym
ent i
s ab
ove
6.5
perc
ent
and
infla
tion
is fo
reca
sted
be
low
2.5
per
cent
.
NO
TE: T
he a
ppen
dix
prov
ides
URL
s fo
r the
offi
cial
pol
icy
stat
emen
ts in
clud
ed in
Tab
les
1A-1
D a
nd th
ose
disc
usse
d in
the
text
.
Fawley and Neely
62 January/February 2013 Federal Reserve Bank of St. Louis REVIEW
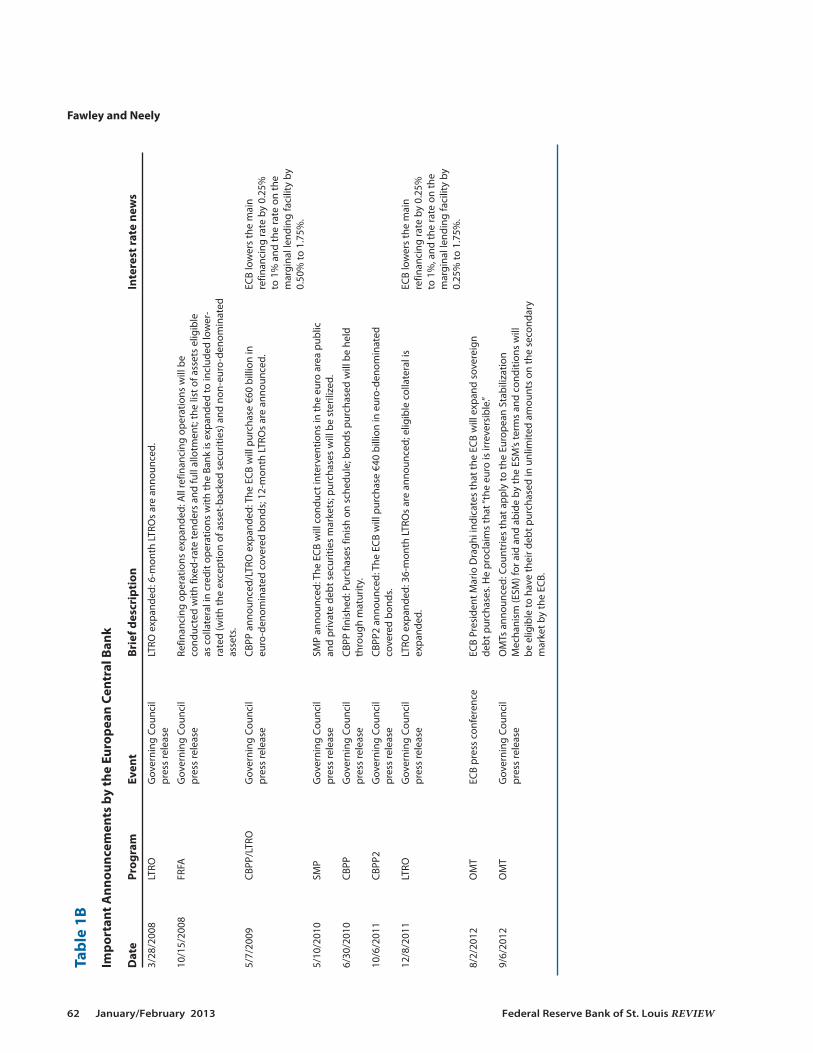
Table 1B
Important Announcem
ents by the European Central Bank
Date
Program
Event
Brief description
Interest rate news
3/28
/200
8LT
ROG
over
ning
Cou
ncil
LTRO
exp
ande
d: 6
-mon
th L
TRO
s ar
e an
noun
ced.
pres
s re
leas
e
10/1
5/20
08FR
FAG
over
ning
Cou
ncil
Refin
anci
ng o
pera
tions
exp
ande
d: A
ll re
finan
cing
ope
ratio
ns w
ill b
e pr
ess
rele
ase
cond
ucte
d w
ith fi
xed-
rate
tend
ers
and
full
allo
tmen
t; th
e lis
t of a
sset
s el
igib
le
as c
olla
tera
l in
cred
it op
erat
ions
with
the
Bank
is e
xpan
ded
to in
clud
ed lo
wer
-ra
ted
(with
the
exce
ptio
n of
ass
et-b
acke
d se
curit
ies)
and
non
-eur
o-de
nom
inat
edas
sets
.
5/7/
2009
CBPP
/LTR
OG
over
ning
Cou
ncil
CBPP
ann
ounc
ed/L
TRO
exp
ande
d: T
he E
CB w
ill p
urch
ase
€60
billi
on in
EC
B lo
wer
s th
e m
ain
pres
s re
leas
eeu
ro-d
enom
inat
ed c
over
ed b
onds
; 12-
mon
th L
TRO
s ar
e an
noun
ced.
re
finan
cing
rate
by
0.25
%
to 1
% a
nd th
e ra
te o
n th
e m
argi
nal l
endi
ng fa
cilit
y by
0.
50%
to 1
.75%
.
5/10
/201
0SM
PG
over
ning
Cou
ncil
SMP
anno
unce
d: T
he E
CB w
ill c
ondu
ct in
terv
entio
ns in
the
euro
are
a pu
blic
pr
ess
rele
ase
and
priv
ate
debt
sec
uriti
es m
arke
ts; p
urch
ases
will
be
ster
ilize
d.
6/30
/201
0CB
PPG
over
ning
Cou
ncil
CBPP
fini
shed
: Pur
chas
es fi
nish
on
sche
dule
; bon
ds p
urch
ased
will
be
held
pr
ess
rele
ase
thro
ugh
mat
urity
.
10/6
/201
1CB
PP2
Gov
erni
ng C
ounc
il CB
PP2
anno
unce
d: T
he E
CB w
ill p
urch
ase
€40
billi
on in
eur
o-de
nom
inat
ed
pres
s re
leas
eco
vere
d bo
nds.
12/8
/201
1LT
ROG
over
ning
Cou
ncil
LTRO
exp
ande
d: 3
6-m
onth
LTR
Os
are
anno
unce
d; e
ligib
le c
olla
tera
l is
ECB
low
ers
the
mai
n pr
ess
rele
ase
expa
nded
.re
finan
cing
rate
by
0.25
%
to 1
%, a
nd th
e ra
te o
n th
e m
argi
nal l
endi
ng fa
cilit
y by
0.
25%
to 1
.75%
.
8/2/
2012
OM
TEC
B pr
ess
conf
eren
ceEC
B Pr
esid
ent M
ario
Dra
ghi i
ndic
ates
that
the
ECB
will
exp
and
sove
reig
n de
bt p
urch
ases
. He
proc
laim
s th
at “t
he e
uro
is ir
reve
rsib
le.”
9/6/
2012
OM
TG
over
ning
Cou
ncil
OM
Ts a
nnou
nced
: Cou
ntrie
s th
at a
pply
to th
e Eu
rope
an S
tabi
lizat
ion
pres
s re
leas
eM
echa
nism
(ESM
) for
aid
and
abi
de b
y th
e ES
M’s
term
s an
d co
nditi
ons
will
be
elig
ible
to h
ave
thei
r deb
t pur
chas
ed in
unl
imite
d am
ount
s on
the
seco
ndar
y m
arke
t by
the
ECB.
Fawley and Neely
Federal Reserve Bank of St. Louis REVIEW January/February 2013 63
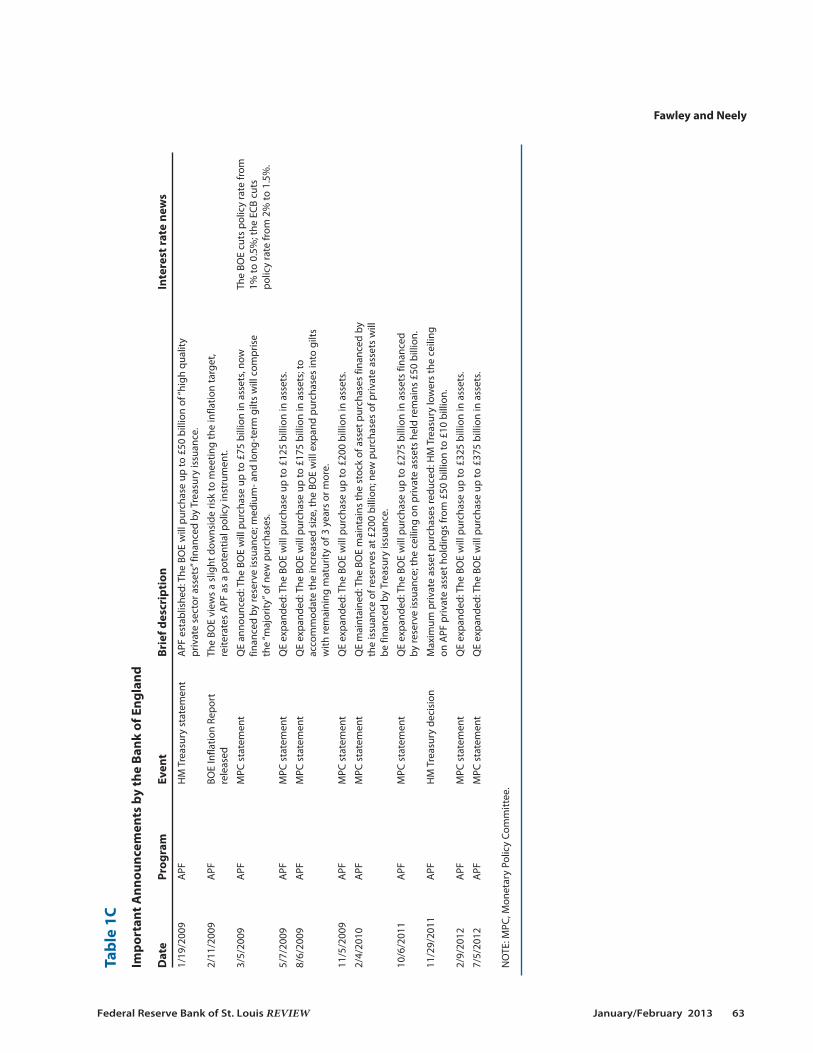
Table 1C
Important Announcem
ents by the Bank of England
Date
Program
Event
Brief description
Interest rate news
1/19
/200
9A
PFH
M T
reas
ury
stat
emen
tA
PF e
stab
lishe
d: T
he B
OE
will
pur
chas
e up
to £
50 b
illio
n of
“hig
h qu
ality
pr
ivat
e se
ctor
ass
ets”
fina
nced
by
Trea
sury
issu
ance
.
2/11
/200
9A
PFBO
E In
flatio
n Re
port
Th
e BO
E vi
ews
a sl
ight
dow
nsid
e ris
k to
mee
ting
the
infla
tion
targ
et,
rele
ased
reite
rate
s A
PF a
s a
pote
ntia
l pol
icy
inst
rum
ent.
3/5/
2009
APF
MPC
sta
tem
ent
QE
anno
unce
d: T
he B
OE
will
pur
chas
e up
to £
75 b
illio
n in
ass
ets,
now
Th
e BO
E cu
ts p
olic
y ra
te fr
om
finan
ced
by re
serv
e is
suan
ce; m
ediu
m- a
nd lo
ng-t
erm
gilt
s w
ill c
ompr
ise
1% to
0.5
%; t
he E
CB c
uts
the
“maj
ority
” of n
ew p
urch
ases
.po
licy
rate
from
2%
to 1
.5%
.
5/7/
2009
APF
MPC
sta
tem
ent
QE
expa
nded
: The
BO
E w
ill p
urch
ase
up to
£12
5 bi
llion
in a
sset
s.
8/6/
2009
APF
MPC
sta
tem
ent
QE
expa
nded
: The
BO
E w
ill p
urch
ase
up to
£17
5 bi
llion
in a
sset
s; to
ac
com
mod
ate
the
incr
ease
d si
ze, t
he B
OE
will
exp
and
purc
hase
s in
to g
ilts
with
rem
aini
ng m
atur
ity o
f 3 y
ears
or m
ore.
11/5
/200
9A
PFM
PC s
tate
men
tQ
E ex
pand
ed: T
he B
OE
will
pur
chas
e up
to £
200
billi
on in
ass
ets.
2/4/
2010
APF
MPC
sta
tem
ent
QE
mai
ntai
ned:
The
BO
E m
aint
ains
the
stoc
k of
ass
et p
urch
ases
fina
nced
by
the
issu
ance
of r
eser
ves
at £
200
billi
on; n
ew p
urch
ases
of p
rivat
e as
sets
will
be
fina
nced
by
Trea
sury
issu
ance
.
10/6
/201
1A
PFM
PC s
tate
men
tQ
E ex
pand
ed: T
he B
OE
will
pur
chas
e up
to £
275
billi
on in
ass
ets
finan
ced
by re
serv
e is
suan
ce; t
he c
eilin
g on
priv
ate
asse
ts h
eld
rem
ains
£50
bill
ion.
11/2
9/20
11A
PFH
M T
reas
ury
deci
sion
Max
imum
priv
ate
asse
t pur
chas
es re
duce
d: H
M T
reas
ury
low
ers
the
ceili
ngon
APF
priv
ate
asse
t hol
ding
s fr
om £
50 b
illio
n to
£10
bill
ion.
2/9/
2012
APF
MPC
sta
tem
ent
QE
expa
nded
: The
BO
E w
ill p
urch
ase
up to
£32
5 bi
llion
in a
sset
s.
7/5/
2012
APF
MPC
sta
tem
ent
QE
expa
nded
: The
BO
E w
ill p
urch
ase
up to
£37
5 bi
llion
in a
sset
s.
NO
TE: M
PC, M
onet
ary
Polic
y Co
mm
ittee
.
Fawley and Neely
64 January/February 2013 Federal Reserve Bank of St. Louis REVIEW
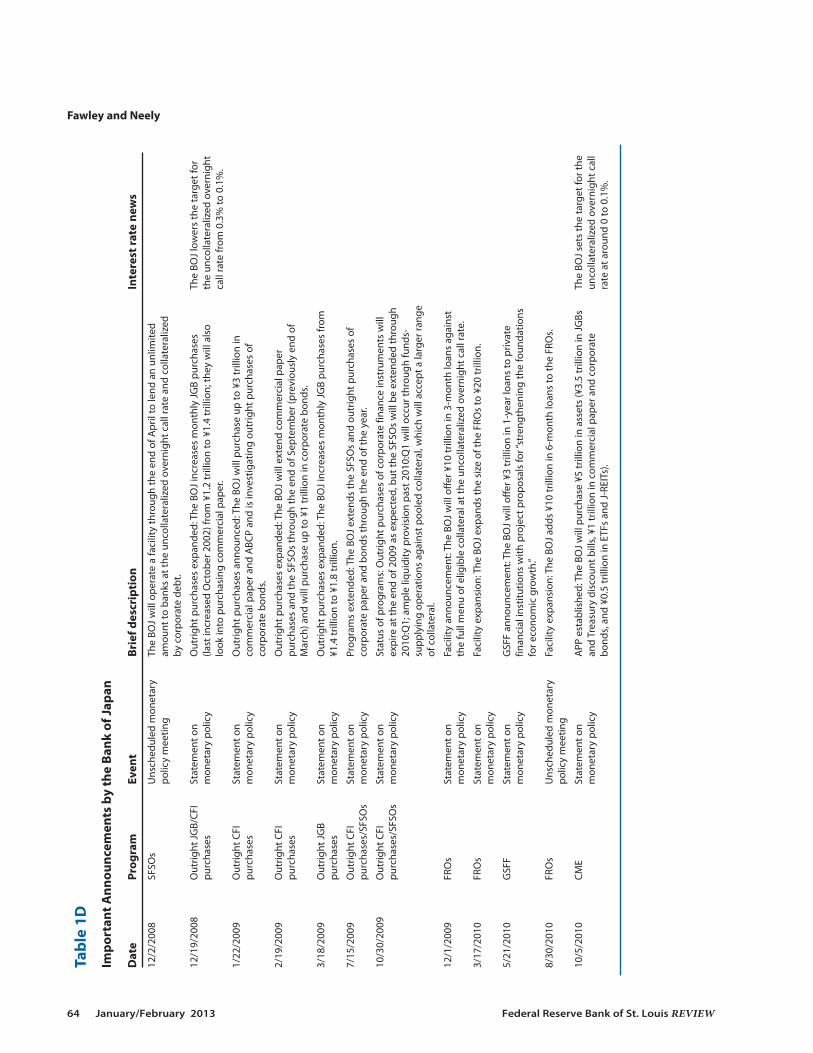
Table 1D
Important Announcem
ents by the Bank of Japan
Date
Program
Event
Brief description
Interest rate news
12/2
/200
8SF
SOs
Uns
ched
uled
mon
etar
y Th
e BO
J w
ill o
pera
te a
faci
lity
thro
ugh
the
end
of A
pril
to le
nd a
n un
limite
d po
licy
mee
ting
amou
nt to
ban
ks a
t the
unc
olla
tera
lized
ove
rnig
ht c
all r
ate
and
colla
tera
lized
by
cor
pora
te d
ebt.
12/1
9/20
08O
utrig
ht J
GB/
CFI
Stat
emen
t on
Out
right
pur
chas
es e
xpan
ded:
The
BO
J in
crea
ses
mon
thly
JG
B pu
rcha
ses
The
BOJ
low
ers
the
targ
et fo
r pu
rcha
ses
mon
etar
y po
licy
(last
incr
ease
d O
ctob
er 2
002)
from
¥1.
2 tr
illio
n to
¥1.
4 tr
illio
n; th
ey w
ill a
lso
the
unco
llate
raliz
ed o
vern
ight
lo
ok in
to p
urch
asin
g co
mm
erci
al p
aper
.ca
ll ra
te fr
om 0
.3%
to 0
.1%
.
1/22
/200
9O
utrig
ht C
FI
Stat
emen
t on
Out
right
pur
chas
es a
nnou
nced
: The
BO
J w
ill p
urch
ase
up to
¥3
trill
ion
in
purc
hase
sm
onet
ary
polic
yco
mm
erci
al p
aper
and
ABC
P an
d is
inve
stig
atin
g ou
trig
ht p
urch
ases
of
corp
orat
e bo
nds.
2/19
/200
9O
utrig
ht C
FI
Stat
emen
t on
Out
right
pur
chas
es e
xpan
ded:
The
BO
J w
ill e
xten
d co
mm
erci
al p
aper
purc
hase
sm
onet
ary
polic
ypu
rcha
ses
and
the
SFSO
s th
roug
h th
e en
d of
Sep
tem
ber (
prev
ious
ly e
nd o
f M
arch
) and
will
pur
chas
e up
to ¥
1 tr
illio
n in
cor
pora
te b
onds
.
3/18
/200
9O
utrig
ht J
GB
Stat
emen
t on
Out
right
pur
chas
es e
xpan
ded:
The
BO
J in
crea
ses
mon
thly
JG
B pu
rcha
ses
from
pu
rcha
ses
mon
etar
y po
licy
¥1.4
trill
ion
to ¥
1.8
trill
ion.
7/15
/200
9O
utrig
ht C
FI
Stat
emen
t on
Prog
ram
s ex
tend
ed: T
he B
OJ
exte
nds
the
SFSO
s an
d ou
trig
ht p
urch
ases
of
purc
hase
s/SF
SOs
mon
etar
y po
licy
corp
orat
e pa
per a
nd b
onds
thro
ugh
the
end
of th
e ye
ar.
10/3
0/20
09O
utrig
ht C
FI
Stat
emen
t on
Stat
us o
f pro
gram
s: O
utrig
ht p
urch
ases
of c
orpo
rate
fina
nce
inst
rum
ents
will
pu
rcha
ses/
SFSO
sm
onet
ary
polic
yex
pire
at t
he e
nd o
f 200
9 as
exp
ecte
d, b
ut th
e SF
SOs
will
be
exte
nded
thro
ugh
2010
:Q1;
am
ple
liqui
dity
pro
visi
on p
ast 2
010:
Q1
will
occ
ur th
roug
h fu
nds-
supp
lyin
g op
erat
ions
aga
inst
poo
led
colla
tera
l, w
hich
will
acc
ept a
larg
er ra
nge
of c
olla
tera
l.
12/1
/200
9FR
Os
Stat
emen
t on
Faci
lity
anno
unce
men
t: Th
e BO
J w
ill o
ffer ¥
10 tr
illio
n in
3-m
onth
loan
s ag
ains
t m
onet
ary
polic
yth
e fu
ll m
enu
of e
ligib
le c
olla
tera
l at t
he u
ncol
late
raliz
ed o
vern
ight
cal
l rat
e.
3/17
/201
0FR
Os
Stat
emen
t on
Faci
lity
expa
nsio
n: T
he B
OJ
expa
nds
the
size
of t
he F
ROs
to ¥
20 tr
illio
n.m
onet
ary
polic
y
5/21
/201
0G
SFF
Stat
emen
t on
GSF
F an
noun
cem
ent:
The
BOJ
will
offe
r ¥3
trill
ion
in 1
-yea
r loa
ns to
priv
ate
mon
etar
y po
licy
finan
cial
inst
itutio
ns w
ith p
roje
ct p
ropo
sals
for “
stre
ngth
enin
g th
e fo
unda
tions
fo
r eco
nom
ic g
row
th.”
8/30
/201
0FR
Os
Uns
ched
uled
mon
etar
y Fa
cilit
y ex
pans
ion:
The
BO
J ad
ds ¥
10 tr
illio
n in
6-m
onth
loan
s to
the
FRO
s.po
licy
mee
ting
10/5
/201
0CM
ESt
atem
ent o
n A
PP e
stab
lishe
d: T
he B
OJ
will
pur
chas
e ¥5
trill
ion
in a
sset
s (¥
3.5
trill
ion
in J
GBs
Th
e BO
J se
ts th
e ta
rget
for t
he
mon
etar
y po
licy
and
Trea
sury
dis
coun
t bill
s, ¥1
trill
ion
in c
omm
erci
al p
aper
and
cor
pora
te
unco
llate
raliz
ed o
vern
ight
cal
l bo
nds,
and
¥0.5
trill
ion
in E
TFs
and
J-RE
ITs)
. ra
te a
t aro
und
0 to
0.1
%.

Fawley and Neely
Federal Reserve Bank of St. Louis REVIEW January/February 2013 65
Table 1D, cont’d
Important Announcem
ents by the Bank of Japan
Date
Program
Event
Brief description
Interest rate news
3/14
/201
1CM
ESt
atem
ent o
n A
PP e
xpan
ded:
The
BO
J w
ill p
urch
ase
an a
dditi
onal
¥5
trill
ion
in a
sset
s m
onet
ary
polic
y(¥
0.5
trill
ion
in J
GBs
, ¥1
trill
ion
in T
reas
ury
disc
ount
bill
s, ¥1
.5 tr
illio
n in
co
mm
erci
al p
aper
, ¥1.
5 tr
illio
n in
cor
pora
te b
onds
, ¥0.
45 tr
illio
n in
ETF
s, an
d ¥0
.05
trill
ion
in J
-REI
Ts).
6/14
/201
1G
SFF
Stat
emen
t on
GSF
F ex
pand
ed: T
he B
OJ
mak
es a
vaila
ble
anot
her ¥
0.5
trill
ion
in lo
ans
to
mon
etar
y po
licy
priv
ate
finan
cial
inst
itutio
ns fo
r the
pur
pose
of i
nves
ting
in e
quity
and
ex
tend
ing
asse
t-ba
sed
loan
s.
8/4/
2011
CME
Stat
emen
t on
APP
/FRO
s ex
pand
ed: T
he B
OJ
will
pur
chas
e an
add
ition
al ¥
5 tr
illio
n in
ass
ets
mon
etar
y po
licy
(¥2
trill
ion
in J
GBs
, ¥1.
5 tr
illio
n in
Tre
asur
y di
scou
nt b
ills,
¥0.1
trill
ion
in
com
mer
cial
pap
er, ¥
0.9
trill
ion
in c
orpo
rate
bon
ds, ¥
0.5
trill
ion
in E
TFs,
and
¥0.0
1 tr
illio
n in
J-R
EITs
); 6-
mon
th c
olla
tera
lized
loan
s th
roug
h th
e FR
Os
are
expa
nded
by
¥5 tr
illio
n.
10/2
7/20
11CM
ESt
atem
ent o
n A
PP e
xpan
ded:
The
BO
J w
ill p
urch
ase
an a
dditi
onal
¥5
trill
ion
in J
GBs
.m
onet
ary
polic
y
2/14
/201
2CM
ESt
atem
ent o
n A
PP e
xpan
ded:
The
BO
J w
ill p
urch
ase
an a
dditi
onal
¥10
trill
ion
in J
GBs
.m
onet
ary
polic
y
3/13
/201
2G
SFF
Stat
emen
t on
GSF
F ex
pand
ed: T
he B
OJ
mak
es a
vaila
ble
anot
her ¥
2 tr
illio
n in
loan
s to
priv
ate
mon
etar
y po
licy
finan
cial
inst
itutio
ns, i
nclu
ding
¥1
trill
ion
in U
.S.-d
olla
r-de
nom
inat
ed lo
ans
and
¥0.5
trill
ion
in s
mal
ler-
size
d (¥
1 m
illio
n-¥1
0 m
illio
n) lo
ans.
4/27
/201
2CM
ESt
atem
ent o
n A
PP e
xpan
ded/
FRO
s re
duce
d: T
he B
OJ
will
pur
chas
e an
add
ition
al ¥
10 tr
illio
n m
onet
ary
polic
yin
JG
Bs, ¥
0.2
trill
ion
in E
TFs,
and
¥0.0
1 in
J-R
EITs
. The
BoJ
als
o re
duce
s th
e av
aila
bilit
y of
6-m
onth
FRO
loan
s by
¥5
trill
ion.
7/12
/201
2CM
ESt
atem
ent o
n A
PP e
xpan
ded/
FRO
s re
duce
d: T
he B
OJ
will
pur
chas
e an
add
ition
al ¥
5 tr
illio
n in
m
onet
ary
polic
yTr
easu
ry d
isco
unt b
ills
and
redu
ces
the
avai
labi
lity
of F
RO lo
ans
by ¥
5 tr
illio
n.
9/19
/201
2CM
ESt
atem
ent o
n A
PP e
xpan
ded:
The
BO
J w
ill p
urch
ase
an a
dditi
onal
¥5
trill
ion
in J
GBs
and
m
onet
ary
polic
y¥5
trill
ion
in T
reas
ury
disc
ount
bill
s.
10/3
0/20
12CM
E/SB
LFSt
atem
ent o
nA
PP e
xpan
ded/
SBLF
ann
ounc
ed: T
he B
OJ
will
pur
chas
e an
add
ition
al ¥
5 tr
illio
n m
onet
ary
polic
yin
JG
Bs, ¥
5 tr
illio
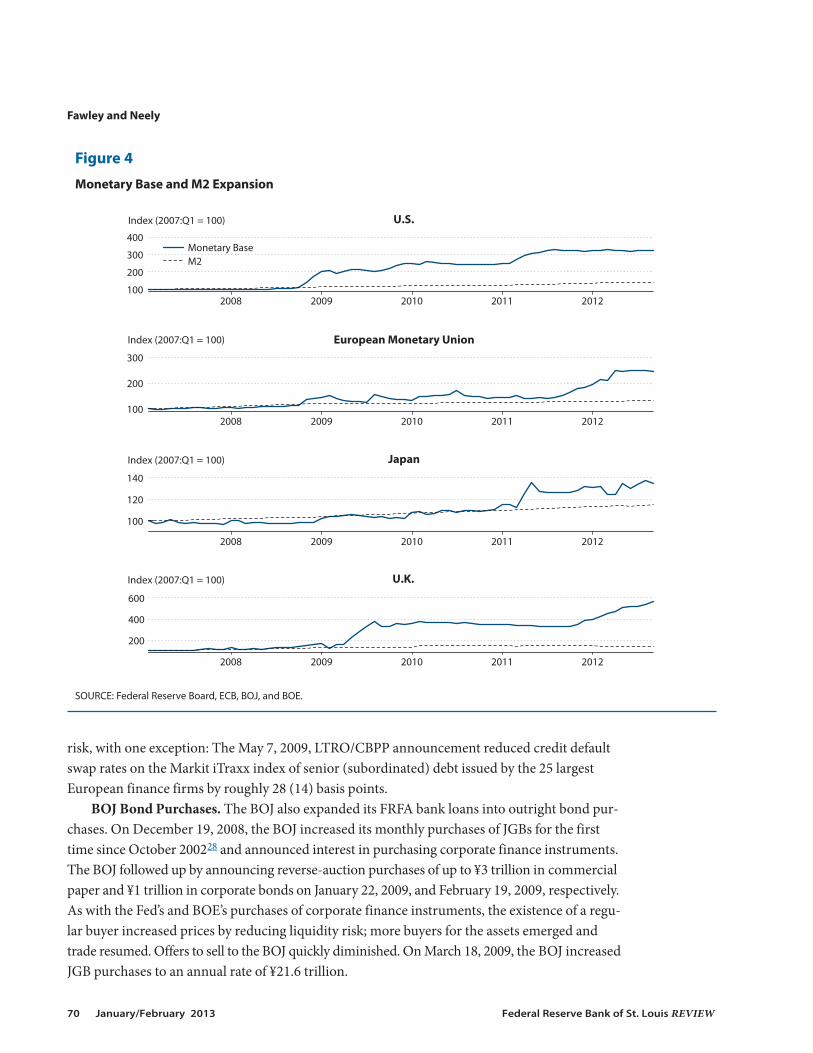
n in
Tre
asur
y di
scou
nt b
ills,
¥0.1
trill
ion
in c
omm
erci
al p
aper
, ¥0
.3 tr
illio
n in
cor
pora
te b
onds
, ¥0.
5 tr
illio
n in
ETF
s, an
d ¥0
.01
trill
ion
in J
-REI
Ts.
Thro
ugh
the
SBLF
it w
ill fu
nd u
p to
100
per
cent
of d
epos
itory
inst
itutio
ns’ n
et
incr
ease
in le
ndin
g to
the
nonf
inan
cial
sec
tor.
12/2
0/20
12CM
ESt
atem
ent o
nA
PP e
xpan
ded:
The
BO
J w
ill p
urch
ase
an a
dditi
onal
¥5
trill
ion
JGBs
and
¥5
trill
ion
mon
etar
y po
licy
in T
reas
ury
disc
ount
bill
s.
NO
TE: C
FI, c
orpo
rate
fina
nce
inst
rum
ents
(cor
pora
te b
onds
plu
s co
mm
erci
al p
aper
); CM
E, c
ompr
ehen
sive
mon
etar
y ea
sing
.
two separate and distinct asset purchase programs through this newly established APF: privateasset purchases to ease specific credit conditions and more traditional QE for monetary stimulus.
HM Treasury’s January 19, 2009, announcement inaugurated the private asset purchaseprogram; it authorized the BOE to buy up to £50 billion in “high quality private sector assets” to “increase the availability of corporate credit, by reducing the illiquidity of the underlyinginstruments.”19 Because HM Treasury issued (sold) short-term gilts to finance the purchases,every asset that the BOE purchased was matched by a sale of a short-term gilt and so the BOE’sliabilities (the monetary base) did not initially increase. That is, this was not initially QE.
The BOE later described its private asset purchases as “an example of the Bank acting asmarket maker of last resort” (BOE, 2012). The BOE likewise purchased corporate bonds througha reverse auction; potential counterparties bid on the price at which they would sell assets to theBOE.20 The program was designed so the BOE’s appeal as a counterparty would diminish asmarket conditions improved.
In a program similar to the Fed’s CPFF, the BOE purchased commercial paper at a fixedspread above the local risk-free OIS rates, which established a floor for the price of high-qualitycommercial paper. In both the United States and United Kingdom, the presence of a market
Fawley and Neely
66 January/February 2013 Federal Reserve Bank of St. Louis REVIEW
0
500
1,000
1,500
2,000
2,500
3,000
3,500
2007 2008 2009 2010 2011 2012
USD Billions
Lending to Financial Firms and Markets Rescue Operations Agency and MBS Holdings Treasury Holdings (>1 year) Treasury Holdings (<1 year) Other Assets
Figure 3A
Federal Reserve Bank Assets
NOTE: “Lending to Financial Firms and Markets” includes repurchase agreements, term auction credit, the CPFF, central bank liquidity swaps, themoney market investor funding facility, other loans, and the Term Asset-Backed Securities Loan Facility (TALF). “Rescue Operations” includes netportfolio holdings of Maiden Lanes I, II, and III and preferred interests in AIA Aurora and ALICO Holdings. The figure shows the accumulation ofagency and MBS holdings on the Fed balance sheet beginning in November 2008 and long-term Treasury securities beginning in March 2009.
SOURCE: Federal Reserve statistical release H.4.1.
maker of last resort quickly restored market functioning and the price floor established by thepurchase programs did not bind for long. Ultimately, neither the Fed nor the BOE purchasedlarge quantities of private assets. The BOE’s private asset holdings peaked in 2009:Q2 at less than£3 billion, or 6 percent of the £50 billion ceiling announced in January 2009.21
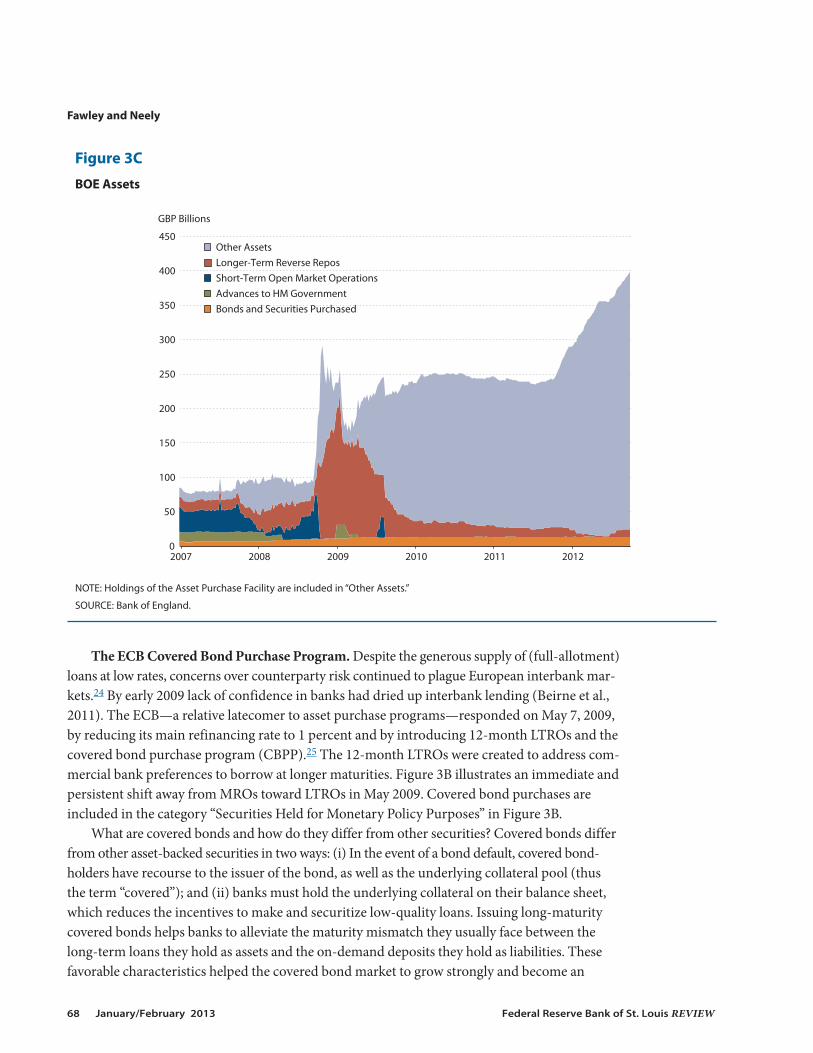
On March 5, 2009, the BOE announced that the APF would administer an explicit QE pro-gram that targeted a £75 billion increase in the monetary base, which in later announcements(through November) would expand to £200 billion. The BOE’s Red Book states, “[T]he objectiveof Quantitative Easing is to boost the money supply through large-scale asset purchases and, indoing so, to bring about a level of nominal demand consistent with meeting the inflation targetin the medium term” (BOE, 2012, p. 10).22 The BOE directed QE purchases toward the deepand liquid markets in medium- and long-term gilts. To increase the monetary base, the BOEfinanced all new APF purchases by issuing money (central bank reserves) rather than issuinggilts. The short-term gilts issued to finance earlier purchases were allowed to mature withoutrenewal, and by the end of 2009:Q2 bank reserves backed all assets held in the APF.23 Figure 4shows that the BOE’s QE program almost quadrupled the U.K. monetary base within a fewmonths as bond purchases replaced longer-term reverse repos.
Fawley and Neely
Federal Reserve Bank of St. Louis REVIEW January/February 2013 67
0
500
1,000
1,500
2,000
2,500
3,000
3,500
2006 2007 2008 2009 2010 2011 2012
EUR Billions
Securities Held for Monetary Policy Purposes
LTROs
Other Assets
General Government Debt
Other Securities
MROs
Claims on Euro Area Residents Denominated in Foreign Currency
Claims on Non-Euro Area Residents
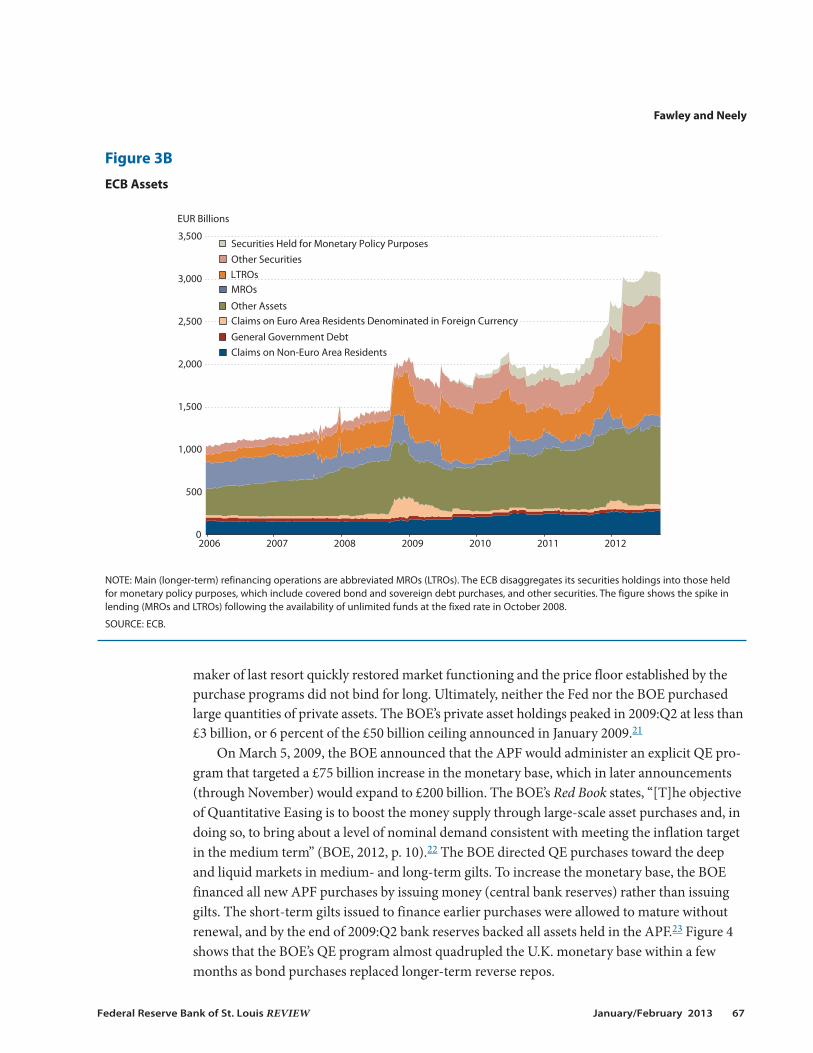
Figure 3B
ECB Assets
NOTE: Main (longer-term) refinancing operations are abbreviated MROs (LTROs). The ECB disaggregates its securities holdings into those heldfor monetary policy purposes, which include covered bond and sovereign debt purchases, and other securities. The figure shows the spike inlending (MROs and LTROs) following the availability of unlimited funds at the fixed rate in October 2008.
SOURCE: ECB.
The ECB Covered Bond Purchase Program. Despite the generous supply of (full-allotment)loans at low rates, concerns over counterparty risk continued to plague European interbank mar-kets.24 By early 2009 lack of confidence in banks had dried up interbank lending (Beirne et al.,2011). The ECB—a relative latecomer to asset purchase programs—responded on May 7, 2009,by reducing its main refinancing rate to 1 percent and by introducing 12-month LTROs and thecovered bond purchase program (CBPP).25 The 12-month LTROs were created to address com-mercial bank preferences to borrow at longer maturities. Figure 3B illustrates an immediate andpersistent shift away from MROs toward LTROs in May 2009. Covered bond purchases areincluded in the category “Securities Held for Monetary Policy Purposes” in Figure 3B.
What are covered bonds and how do they differ from other securities? Covered bonds differfrom other asset-backed securities in two ways: (i) In the event of a bond default, covered bond-holders have recourse to the issuer of the bond, as well as the underlying collateral pool (thusthe term “covered”); and (ii) banks must hold the underlying collateral on their balance sheet,which reduces the incentives to make and securitize low-quality loans. Issuing long-maturitycovered bonds helps banks to alleviate the maturity mismatch they usually face between thelong-term loans they hold as assets and the on-demand deposits they hold as liabilities. Thesefavorable characteristics helped the covered bond market to grow strongly and become an
Fawley and Neely
68 January/February 2013 Federal Reserve Bank of St. Louis REVIEW
0
50
100
150
200
250
300
350
400
450
2007 2008 2009 2010 2011 2012
GBP Billions
Other AssetsLonger-Term Reverse ReposShort-Term Open Market OperationsAdvances to HM GovernmentBonds and Securities Purchased
Figure 3C
BOE Assets
NOTE: Holdings of the Asset Purchase Facility are included in “Other Assets.”
SOURCE: Bank of England.
important source of funding for European banks: from €1.5 trillion in 2003 to €2.4 trillion by theend of 2008 (Beirne et al., 2011).
Although the covered bond market functioned well throughout most of the financial crisis,the Lehman Brothers bankruptcy in September 2008 seriously impaired even this market. Inresponse, on May 7, 2009, the ECB committed to purchase €60 billion in covered bonds, orroughly 2.5 percent of the outstanding bonds. Jean-Claude Trichet, then president of the ECB,adamantly maintained that the program was not QE and would not expand the ECB’s balancesheet. Rather, Trichet stated that he expected “automatic sterilization” as the covered bond pur-chases would commensurately reduce demand for the elastically supplied LTROs. Trichet justi-fied the program in terms of credit easing: “[T]he idea is to revive the market, which has beenvery heavily affected, and all that goes with this revival, including the spreads and the depth andthe liquidity of the market.”26
The results of the CBPP and LTRO expansion were mixed. The €60 billion in ECB purchasesstimulated €150 billion in issuance, though much of the new issuance represented a switch fromuncovered bond to covered bond issuance.27 ECB LTRO announcements failed to reduce credit
Fawley and Neely
Federal Reserve Bank of St. Louis REVIEW January/February 2013 69
0
20
40
60
80
100
120
140
160
180
200
2001 2002 2003 2004 2005 2006 2007 2008 2009 2010 2011 2012
JPY Trillions ZIRP Bill Purchases
Receivables Under Resale Agreements
Government Bonds
Foreign Currency Assets
Funds-Supplying Operations Against Pooled Collateral
Private Assets
Government Bills
Other Assets
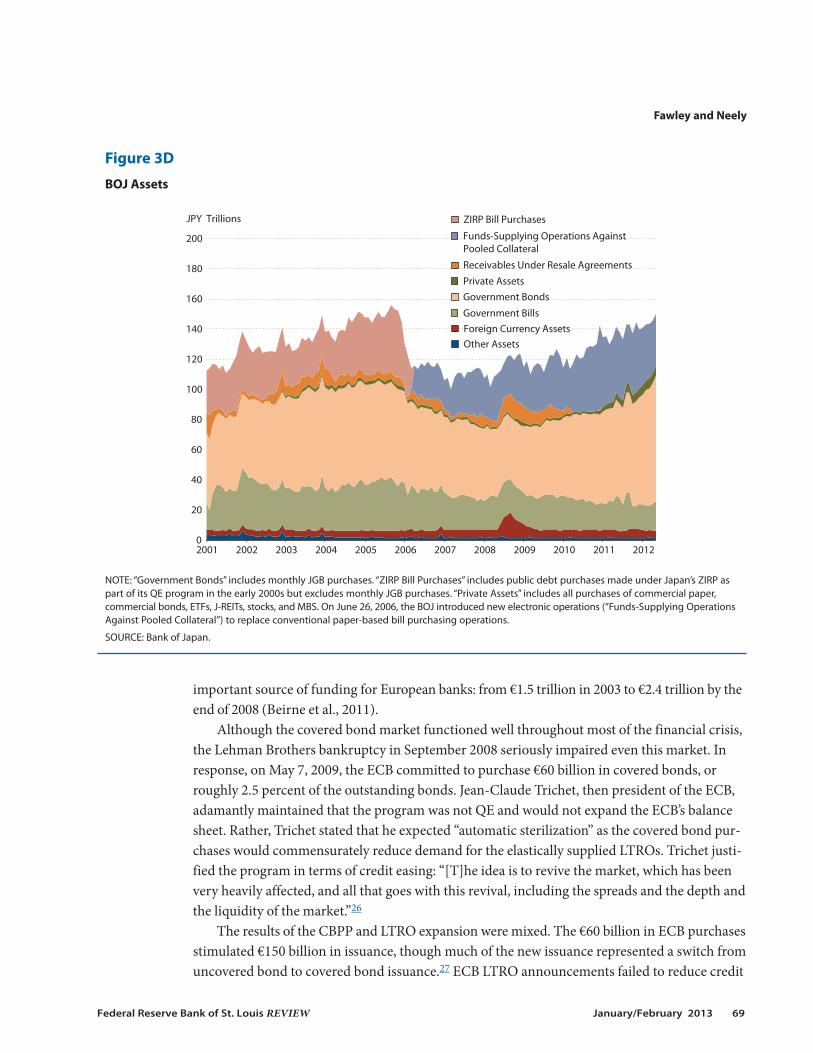
Figure 3D
BOJ Assets
NOTE: “Government Bonds” includes monthly JGB purchases. “ZIRP Bill Purchases” includes public debt purchases made under Japan’s ZIRP aspart of its QE program in the early 2000s but excludes monthly JGB purchases. “Private Assets” includes all purchases of commercial paper,commercial bonds, ETFs, J-REITs, stocks, and MBS. On June 26, 2006, the BOJ introduced new electronic operations (“Funds-Supplying OperationsAgainst Pooled Collateral”) to replace conventional paper-based bill purchasing operations.
SOURCE: Bank of Japan.
risk, with one exception: The May 7, 2009, LTRO/CBPP announcement reduced credit defaultswap rates on the Markit iTraxx index of senior (subordinated) debt issued by the 25 largestEuropean finance firms by roughly 28 (14) basis points.
BOJ Bond Purchases. The BOJ also expanded its FRFA bank loans into outright bond pur-chases. On December 19, 2008, the BOJ increased its monthly purchases of JGBs for the firsttime since October 200228 and announced interest in purchasing corporate finance instruments.The BOJ followed up by announcing reverse-auction purchases of up to ¥3 trillion in commercialpaper and ¥1 trillion in corporate bonds on January 22, 2009, and February 19, 2009, respectively.As with the Fed’s and BOE’s purchases of corporate finance instruments, the existence of a regu-lar buyer increased prices by reducing liquidity risk; more buyers for the assets emerged andtrade resumed. Offers to sell to the BOJ quickly diminished. On March 18, 2009, the BOJ increasedJGB purchases to an annual rate of ¥21.6 trillion.
Fawley and Neely
70 January/February 2013 Federal Reserve Bank of St. Louis REVIEW
2008 2009 2010 2011 2012100
200
300
400
Index (2007:Q1 = 100) U.S.
Monetary BaseM2
2008 2009 2010 2011 2012100
200
300
Index (2007:Q1 = 100) European Monetary Union
2008 2009 2010 2011 2012
100
120
140
Index (2007:Q1 = 100) Japan
2008 2009 2010 2011 2012
200
400
600
Index (2007:Q1 = 100) U.K.
Figure 4
Monetary Base and M2 Expansion
SOURCE: Federal Reserve Board, ECB, BOJ, and BOE.
Summary. Although all four central banks announced outright asset purchases from thefall of 2008 through the spring of 2009, the Fed and BOE targeted large amounts of assets topurchase, but the ECB and BOJ chose to ease their monetary policy stance primarily by elasti-cally supplying loans. Their outright asset purchases were generally small and targeted specificassets. The ECB’s and BOJ’s use of bank loans, rather than bond purchases, to expand the mone-tary base reflects both the desire to specifically support their banking sectors, hit hard by thefinancial crisis, and the relatively greater importance of banks, as opposed to bond markets, inEurope and Japan. At the end of 2007, the U.S. (European) stock of outstanding bank loans tothe private sector totaled 63 percent (145 percent) of gross domestic product (GDP). By contrast,outstanding debt securities in the United States (Europe) accounted for 168 percent (81 percent)of GDP (Bini Smaghi, 2009).
One should note that elastic loan provision and bond purchase programs could affect assetprices differently: Bernanke (2002), for example, argues that low-cost loans will reduce risk pre-mia and illiquidity in all assets that are eligible collateral, but public bond purchases will influenceonly the risk-free component of interest rates.
Intermission (December 2009–July 2010)
During the December 2009–July 2010 period, market conditions improved and the initialphase of the U.S. and U.K. QE programs announced in the fall of 2008 and spring of 2009 wounddown, finishing by the end of 2010:Q1. At the same time, the BOJ and ECB backed off fromelastically supplying liquidity. The European sovereign debt crisis, however, would soon promptthe ECB to resume asset purchase operations during this period.
The BOJ Ends SFSOs. On December 1, 2009, the BOJ announced fixed-rate operations(FROs) intended to replace the SFSOs—elastic provisioning of liquidity—set to expire at theend of 2010:Q1. FROs differed from SFSOs in that the loan quantities were fixed in the former,though a broader class of assets was eligible as collateral. The FROs were originally set at ¥10trillion in 3-month maturities and expanded to ¥20 trillion in March 2010 as the SFSOs ended.An additional ¥10 trillion was allocated to 6-month maturities on August 30, 2010.
The BOJ Opens the Growth-Supporting Funding Facility. On April 30, 2010, the BOJannounced that it was investigating possible ways to foster growth by providing funds directlyto private financial institutions. The BOJ released a preliminary framework for the Growth-Supporting Funding Facility (GSFF) on May 21, 2010, and full details of the facility on June 15,2010. Eligible FRO counterparties could submit proposals for investment or lending projectsthat would “support strengthening the foundations for economic growth.”29 Accepted proposalsreceived 1-year loans, which through rollovers could be extended to a maximum of 4 years. TheBOJ capped the quantity of loans at ¥3 trillion and fixed the interest rate to the prevailing policyrate at origination.
The ECB Announces the Securities Markets Programme. In May 2010, the escalatingsovereign debt crisis disrupted European financial markets (De Pooter, Martin, and Pruitt, 2012).On May 10, 2010, the ECB announced the Securities Markets Programme (SMP), which allowedthe ECB to purchase government debt in the secondary market.30 The ECB did not acknowledgeany intent to support the sovereign debt issuance of its member countries. Rather, it explainedits motives for the SMP program as follows: “to ensure depth and liquidity in those market seg-
Fawley and Neely
Federal Reserve Bank of St. Louis REVIEW January/February 2013 71
ments which are dysfunctional. The objective of this program is to address the malfunctioningof securities markets and restore an appropriate monetary policy transmission mechanism.”31
The SMP differed in several important dimensions from other asset purchase programs.First, the scope and size of the interventions were to be determined on an as-needed basis. Pur -chases were not preannounced but markets were left to infer whether the European MonetaryUnion was buying bonds until the following Tuesday when the ECB’s balance sheet was released(De Pooter, Martin, and Pruitt, 2012).32 Second, the ECB announced that the asset purchaseswould be sterilized to “ensure that the monetary policy stance [would] not be affected.” For thispurpose, the ECB would conduct “specific operations…to re-absorb the liquidity injectedthrough the Securities Markets Programme.”33 Indeed, Figure 4 shows that the EuropeanMonetary Union monetary base did not increase from July 2010 to July 2011. Therefore, theSMP does not fall under the usual definition of QE.
The SMP purchases appear to have helped hold down yields on euro debt. In particular,observers credited ECB purchases with reducing yields on Spanish and Italian debt in August2011.34 As of December 7, 2012, the ECB held €208.5 billion in euro area periphery sovereigndebt accumulated under the SMP.
Given that the SMP purchases were sterilized and directed at markets whose functioningwas unimpeded, except for concerns about the fundamental value of the assets, some wouldargue that the SMP amounted to credit rationing but not monetary policy.35
It is worth noting that the financial crisis, sovereign debt crisis, and banking problems inEurope are intimately linked. The financial crisis created a recession that reduced tax revenuesand growth and raised social spending, thus significantly exacerbating existing budget problemsand increasing the risk associated with European debt. Because banks traditionally hold sub-stantial quantities of sovereign debt, riskier sovereign debt compromised the solvency of privatebanks and exacerbated information asymmetry in interbank markets. At the same time, the factthat governments insured bank deposits meant that bank failures would inevitably increasesovereign debt.
QE Resumes (August 2010–Present)
The Fed Pursues QE2. Serious financial market disorder had receded by the second half of2010, but real activity remained sluggish. In particular, Figure 5 illustrates that the United Statesfaced a worrisome disinflationary trend as U.S. consumer price index inflation dipped toward 1percent. On August 10, 2010, the Fed announced that it would maintain the size of its balancesheet by reinvesting the principal payments on LSAP assets into Treasuries. The FOMC alsobegan to signal that it was considering further asset purchases: In a speech on August 27, 2010,Chairman Bernanke suggested that the Fed could purchase more assets, should conditions war-rant. The September 21, 2010, FOMC statement reiterated the concern that inflation was “likelyto remain subdued for some time before rising to levels the Committee considers consistentwith its mandate.” Having signaled its intentions, the FOMC finally announced on November 3,2010, that it would purchase an additional $600 billion in U.S. Treasuries to “promote a strongerpace of economic recovery and to help ensure that inflation, over time, is at levels consistentwith its mandate.”36
Fawley and Neely
72 January/February 2013 Federal Reserve Bank of St. Louis REVIEW
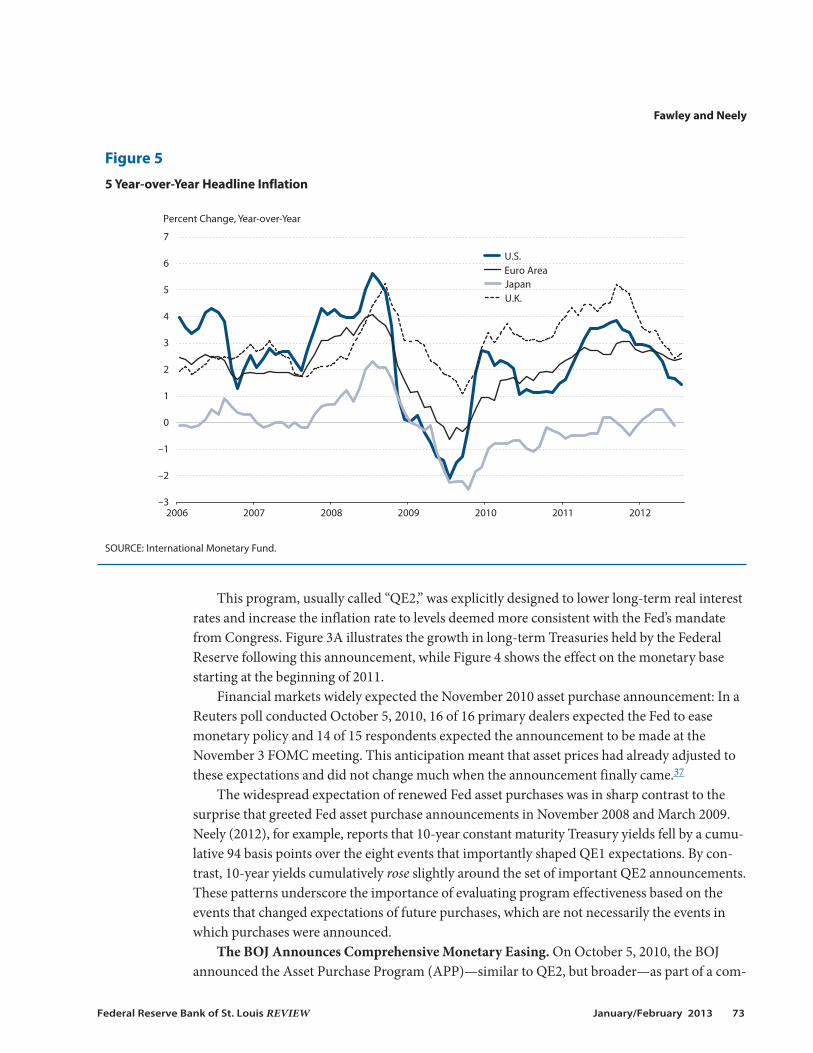
This program, usually called “QE2,” was explicitly designed to lower long-term real interestrates and increase the inflation rate to levels deemed more consistent with the Fed’s mandatefrom Congress. Figure 3A illustrates the growth in long-term Treasuries held by the FederalReserve following this announcement, while Figure 4 shows the effect on the monetary basestarting at the beginning of 2011.
Financial markets widely expected the November 2010 asset purchase announcement: In aReuters poll conducted October 5, 2010, 16 of 16 primary dealers expected the Fed to easemonetary policy and 14 of 15 respondents expected the announcement to be made at theNovember 3 FOMC meeting. This anticipation meant that asset prices had already adjusted tothese expectations and did not change much when the announcement finally came.37
The widespread expectation of renewed Fed asset purchases was in sharp contrast to thesurprise that greeted Fed asset purchase announcements in November 2008 and March 2009.Neely (2012), for example, reports that 10-year constant maturity Treasury yields fell by a cumu-lative 94 basis points over the eight events that importantly shaped QE1 expectations. By con-trast, 10-year yields cumulatively rose slightly around the set of important QE2 announcements.These patterns underscore the importance of evaluating program effectiveness based on theevents that changed expectations of future purchases, which are not necessarily the events inwhich purchases were announced.
The BOJ Announces Comprehensive Monetary Easing. On October 5, 2010, the BOJannounced the Asset Purchase Program (APP)—similar to QE2, but broader—as part of a com-
Fawley and Neely
Federal Reserve Bank of St. Louis REVIEW January/February 2013 73
–3
–2
–1
0
1
2
3
4
5
6
7
2006 2007 2008 2009 2010 2011 2012
Percent Change, Year-over-Year
U.S. Euro AreaJapanU.K.
Figure 5
5 Year-over-Year Headline Inflation
SOURCE: International Monetary Fund.
prehensive monetary easing policy. Comprehensive monetary easing consisted of three measures:(i) lowering the target for the uncollateralized overnight call rate from 0.10 percent to 0-0.10percent, (ii) clarifying the conditions for exiting the ZIRP, and (iii) establishing the APP. TheAPP included plans to purchase a wide array of assets, including short- and long-term govern-ment securities, commercial paper, corporate bonds, exchange-traded funds (ETFs), andJapanese real estate investment trusts (J-REITs).38 The BOJ purchased a range of private assets—rather than just public debt—to reduce the spread between private and (already very low) sov-ereign debt yields. The BOJ stated that the goal of its purchases was to “encourage the decline inlonger-term interest rates and various risk premia to further enhance monetary easing.”39 TheBOJ’s targeting of private risk premia contrasted with the Fed’s QE2 focus on long-term Treasuriesto affect term premia.40 The third panel of Figure 4 shows the monetary consequence of the APPas the rise in the monetary base in late 2010–early 2011.
The BOJ initially set the size of the APP at ¥35 trillion, which included the existing ¥30 tril-lion in FRO loans plus ¥5 trillion in new asset purchases. In 2011, the BOJ increased the size ofasset purchases by a total of ¥15 trillion. On August 4, 2011, it added an additional ¥5 trillion in6-month loans through FROs.
The BOJ Expands the GSFF. On June 14, 2011, the BOJ extended the GSFF to include anadditional ¥500 billion credit line for investments in equity and asset-based lending. The loanshad a 2-year maturity but could be rolled over only once.
The Fed Twists Again. The late summer of 2011 brought renewed fears of recession in theUnited States and financial stress indexes spiked. In response, the Fed announced a third roundof long-term Treasury purchases, officially termed the Maturity Extension Program andReinvestment Policy, on September 21, 2011. The program was nicknamed “Operation Twist”because the Fed sold $400 billion in short-term assets while purchasing $400 billion in long-termassets, which was intended to reduce long-term interest rates relative to short-term interest rates,thus “twisting” the yield curve. Operation Twist did not expand the monetary base because thelong-term asset purchases were funded by short-term asset sales rather than money creation. Atthe same meeting, the FOMC also announced it would begin reinvesting maturing MBS andagency debt in MBS rather than Treasuries.41
Central banks have tried similar programs before. The Federal Reserve famously attemptedto influence the long end of the yield curve in a previous Operation Twist in the early 1960s.Modigliani and Sutch (1966) found that this earlier attempt to bring down long rates was, at best,moderately successful, probably because the purchases were insufficiently large and offset bynew Treasury issuance (Blinder, 2000).
The ECB Extends LTROs/CBPP. The European sovereign debt crisis continued to disruptEuropean and U.S. markets in the fall of 2011. In response, on October 6, 2011, the ECBannounced a second round of the CBPP and additional 12-month LTROs to provide bankfunding. On December 8, 2011, the ECB announced auctions of 36-month LTROs. Figure 3Billustrates the increase in LTRO lending and covered bond purchases, while Figure 4 revealstheir effect on the European Monetary Union monetary base.
Buiter and Rahbari (2012) speculate that the 36-month LTROs announced in December2011 were not intended to merely provide liquidity, as was their stated purpose, but instead toinexpensively fund the purchase of sovereign debt while permitting the ECB to adhere to its
Fawley and Neely
74 January/February 2013 Federal Reserve Bank of St. Louis REVIEW
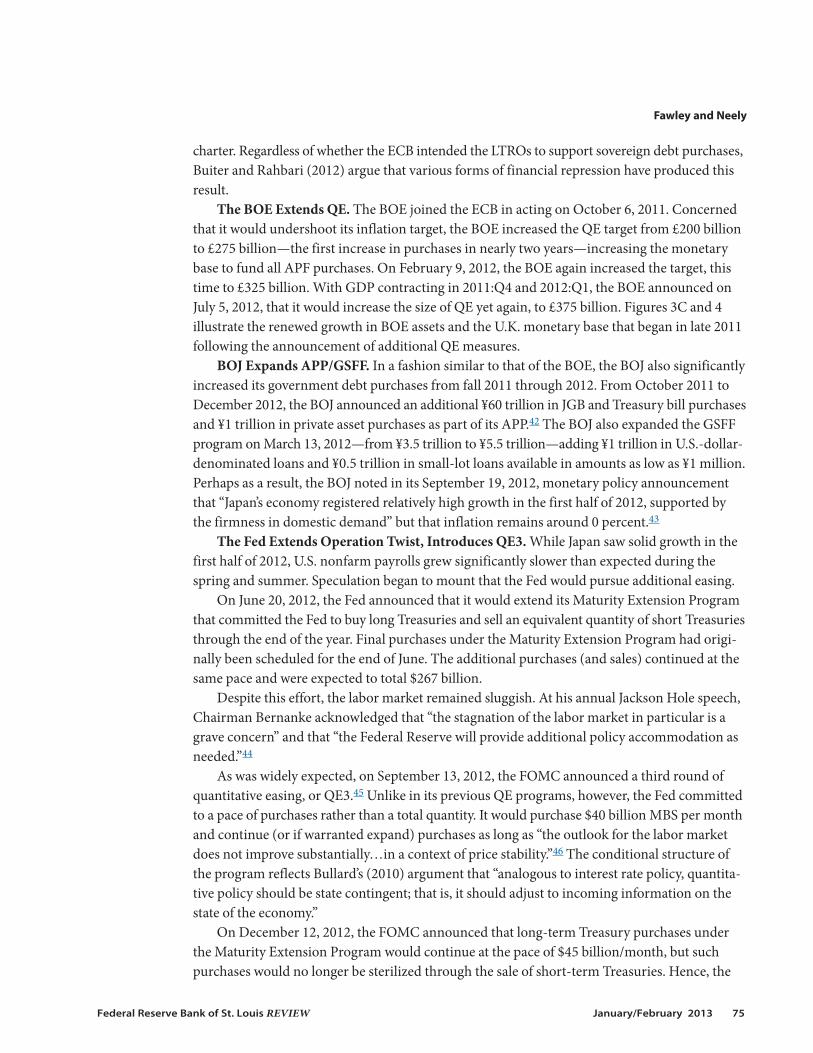
charter. Regardless of whether the ECB intended the LTROs to support sovereign debt purchases,Buiter and Rahbari (2012) argue that various forms of financial repression have produced thisresult.
The BOE Extends QE. The BOE joined the ECB in acting on October 6, 2011. Concernedthat it would undershoot its inflation target, the BOE increased the QE target from £200 billionto £275 billion—the first increase in purchases in nearly two years—increasing the monetarybase to fund all APF purchases. On February 9, 2012, the BOE again increased the target, thistime to £325 billion. With GDP contracting in 2011:Q4 and 2012:Q1, the BOE announced onJuly 5, 2012, that it would increase the size of QE yet again, to £375 billion. Figures 3C and 4illustrate the renewed growth in BOE assets and the U.K. monetary base that began in late 2011following the announcement of additional QE measures.
BOJ Expands APP/GSFF. In a fashion similar to that of the BOE, the BOJ also significantlyincreased its government debt purchases from fall 2011 through 2012. From October 2011 toDecember 2012, the BOJ announced an additional ¥60 trillion in JGB and Treasury bill purchasesand ¥1 trillion in private asset purchases as part of its APP.42 The BOJ also expanded the GSFFprogram on March 13, 2012—from ¥3.5 trillion to ¥5.5 trillion—adding ¥1 trillion in U.S.-dollar-denominated loans and ¥0.5 trillion in small-lot loans available in amounts as low as ¥1 million.Perhaps as a result, the BOJ noted in its September 19, 2012, monetary policy announcementthat “Japan’s economy registered relatively high growth in the first half of 2012, supported bythe firmness in domestic demand” but that inflation remains around 0 percent.43
The Fed Extends Operation Twist, Introduces QE3. While Japan saw solid growth in thefirst half of 2012, U.S. nonfarm payrolls grew significantly slower than expected during thespring and summer. Speculation began to mount that the Fed would pursue additional easing.
On June 20, 2012, the Fed announced that it would extend its Maturity Extension Programthat committed the Fed to buy long Treasuries and sell an equivalent quantity of short Treasuriesthrough the end of the year. Final purchases under the Maturity Extension Program had origi-nally been scheduled for the end of June. The additional purchases (and sales) continued at thesame pace and were expected to total $267 billion.
Despite this effort, the labor market remained sluggish. At his annual Jackson Hole speech,Chairman Bernanke acknowledged that “the stagnation of the labor market in particular is agrave concern” and that “the Federal Reserve will provide additional policy accommodation asneeded.”44
As was widely expected, on September 13, 2012, the FOMC announced a third round ofquantitative easing, or QE3.45 Unlike in its previous QE programs, however, the Fed committedto a pace of purchases rather than a total quantity. It would purchase $40 billion MBS per monthand continue (or if warranted expand) purchases as long as “the outlook for the labor marketdoes not improve substantially…in a context of price stability.”46 The conditional structure ofthe program reflects Bullard’s (2010) argument that “analogous to interest rate policy, quantita-tive policy should be state contingent; that is, it should adjust to incoming information on thestate of the economy.”
On December 12, 2012, the FOMC announced that long-term Treasury purchases underthe Maturity Extension Program would continue at the pace of $45 billion/month, but suchpurchases would no longer be sterilized through the sale of short-term Treasuries. Hence, the
Fawley and Neely
Federal Reserve Bank of St. Louis REVIEW January/February 2013 75

purchases previously made under the auspices of the Maturity Extension Program would con-tinue, but with the additional effect of expanding the monetary base.
The ECB Replaces the SMP with Outright Monetary Transactions. The European sover-eign debt crisis continued into the summer of 2012, with the solvency of Spain and Italy and theviability of the euro coming into question. On August 2, 2012, ECB President Mario Draghiannounced that the ECB would expand its sovereign debt purchases and directly addressedconcerns over the euro: “The euro is irreversible.”47
On September 6, 2012, the ECB announced the operational details for a program of outrightmonetary transactions (OMTs) to replace the SMP.48 The OMT program allows the ECB to pur-chase euro area sovereign debt in the secondary market if the sovereign abides by the requiredconditions.49 This requirement potentially addresses a shortcoming of the SMP: the ECB’s lackof a mechanism for enforcing conditions for receiving support. As with the SMP transactions,the OMTs will be sterilized and will not affect the monetary base.
BOJ Reintroduces Unlimited Liquidity Provision. Despite relatively high growth in thefirst half of 2012, the Japanese economy once again contracted in the third quarter of 2012. OnOctober 30, 2012, the BOJ announced an additional ¥11 trillion in public and private asset pur-chases through the APP and that it was establishing a framework for the “Stimulating BankLending Facility” (SBLF). Through this facility, the BOJ offers to fund up to 100 percent ofdepository intuitions’ net increase in lending to the nonfinancial sector. The loans are availableat maturities of 1 to 3 years and can be rolled over to obtain a maximum duration of 4 years,with interest rates set equal to the target for the uncollateralized overnight call rate at the timeof loan disbursement (0.1 percent as of December 2012). The only limit on the size of the loansis the quantity of eligible collateral, and in its December 20, 2012, monetary policy statement theBOJ announced that based on current lending statistics, it expects to extend at least ¥15 trillionin loans through the SBLF. Together, the SBLF and GSFF comprise what the BOJ calls the “LoanSupport Program.”50
On December 16, 2012, Japan elected Shinzo Abe as its next prime minister. Abe campaignedon a platform of monetary policy accommodation to counteract deflationary conditions andadvocates a 2 percent inflation target for the BOJ rather than the current 1 percent target. Thenew political regime has caused many to speculate that the BOJ’s independence is at risk (e.g.,Kihara, 2012).
Summary. In summary, from 2008 through 2012, three central banks (the BOE, BOJ, andECB) purchased assets with private credit risk exposure, removing such risk from the public’sbalance sheet.51 Three central banks (the Fed, BOJ, and BOE) attempted to use asset purchasesto stimulate the economy through traditional interest rate channels by purchasing long-termassets, reducing the amount of duration held by the public and thus lowering long-term realinterest rates. All four central banks used asset purchases to improve the functioning of specificmarkets.
ASSET PURCHASE PROGRAM SIZE AND BREAKDOWNThis section describes and compares the sizes and composition of the asset purchase pro-
grams for the four central banks. Table 2 summarizes the size of asset purchase programs relative
Fawley and Neely
76 January/February 2013 Federal Reserve Bank of St. Louis REVIEW

Fawley and Neely
Federal Reserve Bank of St. Louis REVIEW January/February 2013 77
Table 2
Asset Purchase Program Size
Peak size Peak size 2008 GDP Share of Central bank Program Assets purchased (billion NC) (billion USD) (billion NC) economy (%)
Fed QE1 GSE agency debt $175 $14,292 1.2
MBS $1,250 8.7
Treasuries $300 2.1
QE2 Treasuries $600 4.2
Maturity Extension Treasuries $667 4.7Program
QE3 MBS $160 1.1
Treasuries $0* 0.0
BOE APF Gilts £375 $590 £1,441 26.0
Commercial paper £1.97 $3.10 0.1
Corporate bonds £1.6 $2.52 0.1
ECB CBPP Covered bonds €60 $81 € 9,219 0.7
SMP Euro area sovereign debt €220 $297 2.4
CBPP2 Covered bonds €40 $54 0.4
BOJ Outright purchases JGBs ¥106,800 $1,253 ¥501,209 21.3
Commercial paper ¥3,000 $35 0.6
Corporate bonds ¥1,000 $12 0.2
APP JGBs ¥44,000 $516 8.8
Treasury discount bills ¥24,500 $287 4.9
Commercial paper ¥2,200 $26 0.4
Corporate bonds ¥3,200 $38 0.6
ETFs ¥2,100 $25 0.4
J-REITs ¥130 $2 0.0
Fed total $3,152 $3,152 22.1
BOE total £379 $596 26.3
ECB total €320 $432 3.5
BOJ total ¥186,930 $2,193 37.3
NOTE: NC, national currency. Values in local currencies are converted to dollars using the average exchange rate with the dollar from January2009 through November 2012. The Fed’s monthly QE3 purchases and the BOJ’s monthly outright JGB purchases, which are both open ended,are aggregated through December 2012. *QE3 Treasury purchases were not announced until December 12, 2012, but will be made in 2013 at apace of $45 billion per month.
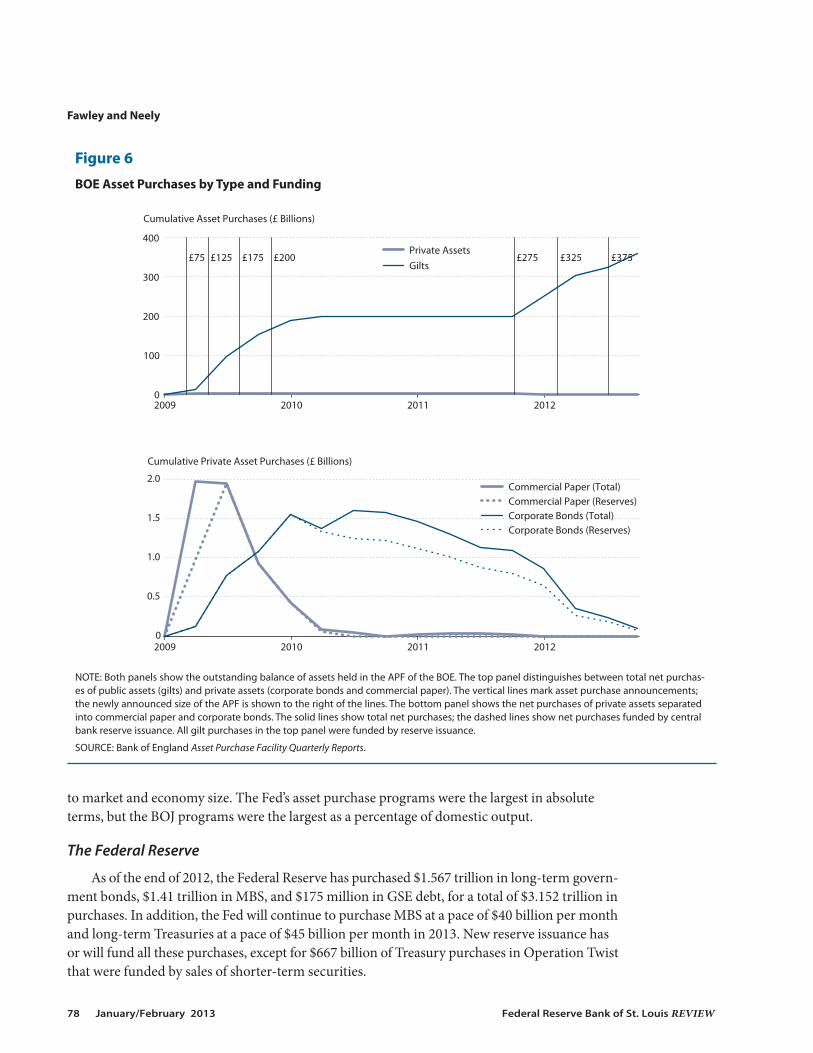
to market and economy size. The Fed’s asset purchase programs were the largest in absoluteterms, but the BOJ programs were the largest as a percentage of domestic output.
The Federal Reserve
As of the end of 2012, the Federal Reserve has purchased $1.567 trillion in long-term govern-ment bonds, $1.41 trillion in MBS, and $175 million in GSE debt, for a total of $3.152 trillion inpurchases. In addition, the Fed will continue to purchase MBS at a pace of $40 billion per monthand long-term Treasuries at a pace of $45 billion per month in 2013. New reserve issuance hasor will fund all these purchases, except for $667 billion of Treasury purchases in Operation Twistthat were funded by sales of shorter-term securities.
Fawley and Neely
78 January/February 2013 Federal Reserve Bank of St. Louis REVIEW
2009 2010 2011 20120
100
200
300
400
Cumulative Asset Purchases (£ Billions)
£75 £125 £175 £200 £275 £325 £375
Private AssetsGilts
2009 2010 2011 20120
0.5
1.0
1.5
2.0
Cumulative Private Asset Purchases (£ Billions)
Commercial Paper (Total)Commercial Paper (Reserves)Corporate Bonds (Total)Corporate Bonds (Reserves)
Figure 6
BOE Asset Purchases by Type and Funding
NOTE: Both panels show the outstanding balance of assets held in the APF of the BOE. The top panel distinguishes between total net purchas-es of public assets (gilts) and private assets (corporate bonds and commercial paper). The vertical lines mark asset purchase announcements;the newly announced size of the APF is shown to the right of the lines. The bottom panel shows the net purchases of private assets separatedinto commercial paper and corporate bonds. The solid lines show total net purchases; the dashed lines show net purchases funded by centralbank reserve issuance. All gilt purchases in the top panel were funded by reserve issuance.
SOURCE: Bank of England Asset Purchase Facility Quarterly Reports.

The U.S. purchases can be separated into four distinct programs: QE1 ($1.725 trillion,announcements 2008-09), QE2 ($600 billion, announcement 2010), Operation Twist ($667 bil-lion, announcement 2011 and extension 2012), and QE3 ($85 billion per month, announcements2012). Since the initial purchases, the Federal Reserve has maintained the size of its balancesheet by reinvesting principal payments from maturing assets. Originally, all maturing assetswere reinvested in Treasuries, but the FOMC later decided to reinvest maturing MBS and GSEdebt in MBS.52 Despite the approximate tripling of the monetary base (see Figure 4), the broadermonetary aggregates have increased at healthy but normal rates because banks have chosen togreatly increase their desired levels of excess reserves.
The Bank of England
BOE QE asset purchase announcements can be categorized into two distinct episodes. Inthe first episode, the BOE initially announced a ceiling of £75 billion in purchases on March 5,2009, and then raised that ceiling to £200 billion by November 2009. On August 6, 2009, theBOE announced it would expand purchases into gilts with remaining maturities of 3 to 5 yearsand 25-plus years to accommodate the increased size of the purchases. On February 4, 2010, thefirst stage of purchases ended and the BOE announced that Treasury issuance, not money cre-
Fawley and Neely
Federal Reserve Bank of St. Louis REVIEW January/February 2013 79
–50
0
50
100
150
200
250
Jan Mar May Jul Sep Nov Jan Mar May Jul Sep Nov Jan Mar2010 21021102
–5
0
5
10
15
20
25
ECB SMP Weekly Purchases (EUR Billions) EUR Billions
Cumulative Purchases
Weekly Amount Purchased
Figure 7
ECB Sovereign Debt Purchases
SOURCE: This figure is reproduced with permission from Figure 1 in De Pooter, Martin, and Pruitt (2012) and constructed from the ECB balancesheet, which is published at a weekly frequency (see www.ecb.int/press/pr/wfs/2012/html/index.en.html).
ation, would fund any new purchases, including any private asset purchases. The second stageof purchases began on October 6, 2011, when the BOE raised the asset purchase ceiling to £275billion and announced that monetary expansion would again fund new purchases. The BOEexpanded the APF again on February 9, 2012, and July 5, 2012, setting the ceiling at £325 and£375 billion, respectively.
In addition to the ceiling of £375 billion in assets financed by reserve issuance, the BOE isauthorized to purchase up to £10 billion in private assets financed by Treasury issuance.53 As thebottom panel of Figure 6 reveals, the BOE has never held more than £3 billion in private assets—total commercial paper plus total corporate bonds—at quarter’s end. The top panel of Figure 6shows that gilt purchases accounted for almost all of the BOE’s balance sheet expansion. At theclose of 2012:Q3, the BOE held £360 billion in gilts and only £100 million in corporate bonds.
The Bank of Japan
The BOJ has purchased or made plans to purchase almost ¥187 trillion in total assets overthe January 2009–December 2012 period. Close to 40 percent of this quantity, however, is alegacy from the BOJ’s QE policies in the early 2000s. The BOJ began purchasing JGBs (govern-ment bonds with maturities of 2 to 40 years) outright in the 1990s, and these monthly purchasesreached ¥1.2 trillion in 2002. Figure 3D shows that when the BOJ exited from QE in March 9,2006, it reduced its balance sheet by letting short-term assets (ZIRP bills) mature without replace-ment. The BOJ kept purchasing JGBs at a pace of ¥1.2 trillion per month, and the size of JGBholdings on the BOJ’s balance sheet declined only gradually.54 As of December 1, 2008, the BOJwas already purchasing ¥1.2 trillion in JGBs per month under its previous policy. With no changesto this pace, the BOJ would have purchased ¥72 trillion in JGBs from January 2008–December2012 (60 months ¥ ¥1.2 trillion per month).
Since January 2009, the BOJ has purchased or made plans to purchase ¥115 trillion in assets.Additional monthly JGB purchases, in excess of the ¥72 trillion in JGBs that would have beenpurchased at the ¥1.2 trillion per month pace, total ¥34.8 trillion over the January 2008–December 2012 period.55 The purchases of corporate financing instruments were much smaller,accounting for ¥4 trillion in purchases, of which ¥3 trillion was for commercial paper and ¥1trillion for corporate bonds.
The APP, announced in October 2010 and subsequently expanded on nine occasions,accounts for the remaining ¥76 trillion in asset purchases. Of the ¥76 trillion in assets that theBOJ cumulatively plans to purchase under the APP, ¥44 trillion is in JGB, ¥24.5 trillion inJapanese Treasury discount bills, ¥3.2 trillion in corporate bonds, ¥2.2 trillion in commercialpaper, ¥2.1 trillion in ETFs, and ¥0.13 trillion in J-REITs.56 Note, though, that the asset purchaseswere announced in nine increments of ¥5 trillion to ¥11 trillion with varying asset composition.Since August 4, 2011, the BOJ has increased JGB and Treasury discount bill purchases by a totalof ¥60 trillion and private asset purchases by only ¥1.21 trillion. As of December 2012, the BOJintends to complete its announced APP purchases by the end of 2013.57
The European Central Bank
The two ECB CBPPs have been comparatively modest in total size, though they representlarger purchases of private assets than any other central bank. The ECB announced the purchase
Fawley and Neely
80 January/February 2013 Federal Reserve Bank of St. Louis REVIEW
of €60 billion in euro-denominated covered bonds in 2009 and €40 billion in similar purchasesin 2011, for a total of €100 billion. The ECB never announced a target for sovereign debt pur-chases under the SMP, but the bank’s balance sheet implies that these purchases cumulativelysum to around €220 billion at their peak. Figure 7 shows that the bulk of these purchases weremade during two episodes: (i) the spring/summer of 2010 (with a focus on Greek, Irish, andPortuguese debt) and (ii) the summer to fall of 2011 (with a focus on Italian, Spanish, Portuguese,and Irish debt and no purchases of Greek debt).58 The total ECB asset purchases—includingsovereign debt purchases—total roughly €320 billion. As mentioned previously, most of thesepurchases have been sterilized, reversing their effects on the monetary base. The path of theEuropean Monetary Union’s monetary base reflects extensions of the LTRO program.
CONCLUSIONCentral banks responded to the 2007-09 financial crisis with a series of policies that included
emergency liquidity programs and reduction of their traditional short-term policy rates to nearzero. Financial markets were still troubled, however; real output was declining or growing onlysluggishly and inflation threatened to fall below central banks’ desired levels. In response, thecentral banks of Japan, the United Kingdom, the United States, and the euro area respondedwith policies that greatly expanded their monetary bases, policies that are commonly called QE.These QE policies were potentially important to the extent that they allowed central banks torespond effectively to economic conditions—to ease credit conditions and provide liquidity—even with short-term interest rates near the zero bound.
The proliferating research on the effects of QE generally indicates that it had the desiredeffects on asset prices but the effects on the broader economy are much more difficult to discernbecause it is not possible to know with any certainty how economic conditions would haveevolved without these policies in place. Despite the abundance of research on QE policies, therehas been little description and international comparison of the policies of the four central banksthat engaged in QE. This article has described those episodes of QE and compared policiesacross central banks.
The QE programs of these four major central banks initially attempted to reduce financialmarket distress, but they were soon used for a variety of purposes, including hitting inflationtargets, stimulating the real economy, and containing the European sovereign debt crisis. Centralbanks with more bank-centric economies—the BOJ and ECB—responded with loans to thebanking system, while those where bond markets are relatively more dominant—the Fed andBOE—responded with greater quantities of bond purchases.
A remarkable consistency among the monetary expansion policies of all four central banksis that while all measures led to sharp increases in the monetary base, none led to sharp increasesin broader monetary aggregates (see Figure 4). The broader aggregates did not increase becausebanks voluntarily held the increased monetary base as bank reserves—safe, liquid assets in highdemand during periods of economic uncertainty.
As of December 2012, interest rates are at or near historic lows in the major economies. Asthe effects of the housing bubble and financial crisis wane, however, interest rates will rise andmonetary policy will eventually readjust to normal conditions. Although Fed purchases of spe-
Fawley and Neely
Federal Reserve Bank of St. Louis REVIEW January/February 2013 81

Fawley and Neely
82 January/February 2013 Federal Reserve Bank of St. Louis REVIEW
cific non-Treasury securities will probably be reserved for unusual market dysfunction, it remainsto be seen whether “normal” U.S. or foreign monetary policies will incorporate elements of thecrisis policies, such as purchases of long-term assets. Given the emerging consensus in favor oftransparent and predictable policy (Poole and Rasche, 2000), it seems likely there will be pressureto incorporate such strategies in conditional policy rules if they are to be used (Bullard, 2010).
NOTES1 The fact that it is costly to store and protect large amounts of currency means that short-term rates can become
slightly negative in some circumstances. Nevertheless, zero is a reasonable approximation on the lower bound forinterest rates.
2 Anderson, Gascon, and Liu (2010) survey a large cross section of central banks that have doubled their monetarybase, but their work reflects only the first wave of the recent QE programs.
3 In the context of borrowing and lending, “adverse selection” is the tendency of individuals and firms with bad creditto be more likely to seek loans from banks; and “moral hazard” is the tendency of borrowers to engage in risky activi-ties that will make it less likely that they will repay their loans. Both adverse selection and moral hazard are problemsbecause of the existence of “asymmetric information,” which means that borrowers know things about their ability torepay that lenders do not.
4 In 2008 Congress granted the Federal Reserve the authority to begin paying interest on banks’ excess reserves toimprove the New York Fed’s ability to manage the funds target and remove an implicit tax on holding reserves. Thisaction did help to blur the distinction between money and bonds. The Federal Reserve could, however, increase thedistinction between money and bonds by reducing or eliminating interest on excess reserves or even charging feesfor excess reserves.
5 Eggertsson and Woodford’s (2003) model implies that a central bank should keep interest rates at the zero boundeven after activity recovers to compensate for the fact that interest rates could not go below zero. This is subtly dif-ferent from a commitment to be irresponsible.
6 There is a potential downside to a commitment to low interest rates through asset purchases. The public might loseconfidence in the central bank’s ability to reverse asset purchases, which could unmoor inflation expectations (see,e.g., Anderson, Gascon, and Liu, 2010). An alternative is to purchase a carefully chosen portfolio of interest rate deriv-atives that would lose value if short-term interest rates increased faster than a time path announced by the centralbank (see, e.g., Krippner and Thornton, 2012). Such a portfolio would be self-liquidating over time and profitable forthe central bank if it kept its promise.
7 See the 12/16/2008, 3/18/2009, 8/09/2011, 1/25/2012, 9/13/2012, and 12/12/2012 FOMC statements for the evolu-tion of this language. Tables A1 through A4 in the appendix provide URLs for the referenced policy statements andannouncements for the Federal Reserve, European Central Bank, Bank of England, and Bank of Japan.
8 “Gilt” is a common name for U.K. government debt securities and alludes to the gilded (golden) edge of the paperbonds.
9 Baba, McCauley, and Ramaswamy (2009) detail these programs. Anderson and Mullineux (2009) describe some ofthe crisis response programs enacted by the BOE.
10 MMMFs take funds from investors and use those funds to purchase short-term fixed income securities such as U.S.Treasury bills, short-term commercial paper, and certificates of deposit. The bankruptcy of Lehman Brothersincreased risk premia substantially, driving interest rates higher and making markets illiquid. To avoid losses, MMMFinvestors began withdrawing their money from the funds.
11 European OIS contracts are indexed to the Euro OverNight Index Average (EONIA), or the average uncollateralizedrate that banks lend to each other overnight. Swap contracts are subject to very little counterparty risk because par-ticipants swap only the difference in interest payments between the agreed fixed rate and the geometric average ofthe indexed floating rate; there is no exchange of principal. In contrast, Euribor rates are quoted on fixed term loansbetween banks.
12 See www.ecb.int/home/glossary/html/glossf.en.html for the full definition of “fixed rate tender” andwww.ecb.int/ecb/educational/facts/monpol/html/mp_010.en.html for “fixed-rate, full-allotment liquidity provision.”
13 The ECB announced the first 6-month LTRO in March 2008; see the 3/28/2008 ECB press release (Table A2).
14 In contrast to the Fed, BOJ, and BOE, the ECB’s main policy rate is a 2-week rate, not an overnight rate. As in theUnited States, the overnight interbank rate in Europe has generally trended below 50 basis points since May 2009.
15 The GSEs include Fannie Mae, Freddie Mac, Ginnie Mae, and the Federal Home Loan Banks.
16 The Federal Reserve has referred to its purchase programs as LSAPs, but the generic term QE is more common in thefinancial press.
17 See the 11/25/2008 FOMC press release (Table A1). The purchases did not increase the exposure of U.S. taxpayers tothese bonds, however, as the government had explicitly guaranteed all debts and liabilities of the GSEs earlier thatfall, making the GSE debt and MBS close substitutes for long-term Treasury securities.
18 JGBs are bonds with 2 to 40 years remaining until maturity (seewww.mof.go.jp/english/jgbs/debt_management/guide.htm).
19 See the 1/19/2009 HM Treasury statement (Table A3).
20 A reverse auction purchases items from low bidders rather than selling them to the highest bidder. HM Treasuryindemnified the credit risk assumed by the BOE in purchasing private assets.
21 As the result of improved market conditions, the BOE ended the Commercial Paper Facility on November 15, 2011(as it had announced it would one year earlier). The BOE continues to operate facilities for purchasing corporatebonds and secured commercial paper (www.bankofengland.co.uk/publications/Pages/news/2010/088.aspx).
22 HM Treasury recognized immediately that the APF could be used in part as a monetary policy instrument: “[T]he programme also provides a framework for the Monetary Policy Committee [MPC] of the Bank of England to use assetpurchases for monetary policy purposes should the MPC conclude that this would be a useful additional tool formeeting the inflation target.” See the 1/19/2009 HM Treasury Statement (Table A3).
23 See the Asset Purchase Facility Quarterly Report 2009 Q2 for a breakdown of assets held by method of financing(www.bankofengland.co.uk/publications/Pages/other/markets/apf/quarterlyreport.aspx).
24 Danielsson and de Vries (2008) assert that “extreme information asymmetry” with respect to banks’ balance sheethealth, not simply lack of liquidity, plagued interbank markets. They note that even a completely nationalized bank,Fortis in the Netherlands, had very limited access to interbank markets and that spreads between secured and unse-cured lending indicated a market expectation that 1 in 20 of the big banks would fail.
25 The maximum maturity of LTROs was first expanded from 3 to 6 months on March 28, 2008.
26 See the 5/7/2009 ECB press conference transcript (Table A2).
27 Many governments had issued formal guarantee programs to ensure demand for uncovered bonds.
28 The BOJ had a preexisting bond purchase program established in the 1990s.
29 See the 6/15/2010 BOJ “Statement on Monetary Policy”(www.boj.or.jp/en/announcements/release_2010/k100615.pdf).
30 Article 123.1 of the Consolidated Version of the Treaty on the Functioning of the European Union prohibits the ECBfrom extending credit to the governments of its member states or directly purchasing sovereign debt in primarymarkets. See www.ecb.int/ecb/legal/pdf/fxac08115enc_002.pdf for the full treaty.
31 See the 5/10/2010 ECB press release (Table A2).
32 See www.ecb.int/press/pr/wfs/2012/html/index.en.html.
33 See the 5/10/2010 ECB press release (Table A2).
34 See Minder (2011). Figure 2 in De Pooter, Martin, and Pruitt (2012) shows heavy purchases of Italian and Spanishbonds in the second half of 2012.
35 In this context, a central bank might be accused of rationing credit if it directs loans or bond purchases to specificindustries or types of economic activity, rather than supplying loans on the basis of risk-adjusted price or purchasingriskless government bonds.
36 See the 11/3/2010 FOMC statement (Table A1).
Fawley and Neely
Federal Reserve Bank of St. Louis REVIEW January/February 2013 83
37 On August 27, 2010, the date of Chairman Bernanke’s speech, the 10-year constant maturity Treasury yield was 2.66percent. The day after the Reuters poll, October 6, 2010, the 10-year constant maturity yield hit 2.41 percent, its low-est value since January 2009 and ultimately its lowest value of the year. By November 3, 2010, the day of the FOMC’sQE2 announcement, the yield had returned to 2.67 percent and at the close of the year the yield had reached 3.30percent.
38 The purchase of ETFs and J-REITs was conditional upon receiving approval pursuant to the Bank of Japan Act.
39 See the 10/5/2010 BOJ press release (Table A4).
40 Term premia are the excess yields that bond purchasers receive to hold long-term bonds rather than a series ofshort-term bonds. Risk premia are the excess yields on bonds that are perceived to have a greater risk of default.
41 This announcement had a significant effect on the MBS market. For example, in the first half of 2012 the Fed pur-chased close to 40 percent of the MBS issued by Fannie Mae and Freddy Mac and backed by 30-year conventionalmortgages (Chandra and Strand, 2012).
42 The BOJ simultaneously reduced the availability of FRO loans by ¥10 trillion.
43 See the 9/19/2012 BOJ press release (Table A4).
44 See Bernanke (2012).
45 At the July 31–August 1 FOMC meeting, “many members judged that additional monetary accommodation wouldlikely be warranted fairly soon unless incoming information pointed to a substantial and sustainable strengtheningin the pace of the economic recovery”; www.federalreserve.gov/monetarypolicy/files/fomcminutes20120801.pdf.
46 See the 9/13/2012 FOMC statement (Table A1).
47 See the introductory statement to the ECB’s press conference(www.ecb.int/press/pressconf/2012/html/is120802.en.html).
48 Existing securities purchased under the SMP will be held to maturity.
49 Through OMTs, the ECB will buy the debt of only those countries that have accepted aid from the EuropeanStabilization Mechanism (ESM) and abided by its conditions. The ESM is a self-insurance fund capitalized by the euroarea sovereigns and authorized to buy member sovereign debt on the primary market, conditional on the country’sacceptance of a structural reform package.
50 Based on current lending statistics, the BOJ expects to extend at least ¥50 trillion in loans through the SBLF. OnDecember 16, 2012, Japan elected Shinzo Abe as its next prime minister. Abe campaigned on a platform of mone-tary policy accommodation to counteract deflationary conditions and advocates a 2 percent inflation target for theBOJ rather than the current 1 percent target. The new political regime has caused many to speculate that the BOJ’sindependence is at risk (e.g., Kihara, 2012).
51 Of course, the assets and liabilities of the government/central bank are ultimately assets and liabilities of taxpayers.But when central banks purchase private risk, the risk no longer affects marginal decisions of private agents.
52 See 8/10/2010 and 9/21/2011 FOMC statements (Table A1).
53 In a letter to Mervyn King, governor of the BOE, on November 29, 2011, George Osborne, chancellor of theExchequer, lowered the ceiling on private asset purchases from £50 billion to £10 billion (Table A3). In total, HMTreasury indemnifies up to £385 billion in purchases through the APF, but no more than £10 billion in private assetsand £375 billion in purchases funded by reserve issuance.
54 Note that on June 26, 2006, the BOJ introduced new electronic operations called “funds-supplying operationsagainst pooled collateral” to replace conventional paper-based bill purchasing operations.
55 The BOJ expanded monthly JGB purchases first from ¥1.2 trillion per month to ¥1.4 trillion per month in December2008 and then from ¥1.4 trillion per month to ¥1.8 trillion per month in March 2009; the ¥34.8 trillion total equals 3months ¥ ¥0.2 trillion per month + 57 months ¥ ¥0.6 trillion per month. We measure the cumulative size of BOJ assetpurchases in this subsection exclusively from purchases that have been made and are yet to be made but have aclearly defined (i.e., finite) size; we do not include anticipated monthly JGB purchases, which are set to continueindefinitely at a pace of ¥21.6 trillion per year.
56 See the 12/20/2012 BOJ release on the “Enhancement of Monetary Easing” (Table A4).
57 See the 12/20/2012 BOJ release for information about the pace of purchases (Table A4).
58 See Figures 1 and 2 in De Pooter, Martin, and Pruitt (2012).
Fawley and Neely
84 January/February 2013 Federal Reserve Bank of St. Louis REVIEW

REFERENCESAnderson, Richard G. and Mullineux, Andrew W. “British Banking in Crisis.” Federal Reserve Bank of St. Louis Economic
Synopses, 2009, No. 16, April 3, 2009; http://research.stlouisfed.org/publications/es/09/ES0916.pdf.
Anderson, Richard G.; Gascon, Charles S. and Liu, Yang. “Doubling Your Monetary Base and Surviving: SomeInternational Experience.” Federal Reserve Bank of St. Louis Review, November/December 2010, 92(6), pp. 481-505;http://research.stlouisfed.org/publications/review/10/11/Anderson.pdf.
Baba, Naohiko; McCauley, Robert N. and Ramaswamy, Srichander. “U.S. Dollar Money Market Funds and non-U.S.Banks.” BIS Quarterly Review, March 2009, pp. 65-81.
Bank of England. “The Framework for the Bank of England’s Operations in the Sterling Money Markets” [The RedBook]. Updated June 2012; www.bankofengland.co.uk/markets/Documents/money/publications/redbookjune2012.pdf.
Beirne, John; Dalitz, Lars; Ejsing, Jacob; Grothe, Magdalena; Manganelli, Simone; Monar, Fernando; Sahel, Benjamin;Sušec, Matjaž; Tapking, Jens and Vong, Tana. “The Impact of the Eurosystem’s Covered Bond Purchase Programmeon the Primary and Secondary Markets.” ECB Occasional Paper Series No. 122, European Central Bank, January2011; www.ecb.int/pub/pdf/scpops/ecbocp122.pdf.
Bernanke, Ben S. “Deflation: Making Sure ‘It’ Doesn’t Happen Here.” Speech at the National Economists Club,Washington, DC, November 21, 2002; www.federalreserve.gov/boarddocs/speeches/2002/20021121/default.htm.
Bernanke, Ben S. “The Crisis and the Policy Response.” Speech at the Stamp Lecture, London School of Economics,London, England, January 13, 2009; www.federalreserve.gov/newsevents/speech/bernanke20090113a.htm.
Bernanke, Ben S. “Monetary Policy Since the Onset of the Crisis.” Presented at a symposium sponsored by the FederalReserve Bank of Kansas City, “The Changing Policy Landscape,” Jackson Hole, Wyoming, August 31, 2012; www.federalreserve.gov/newsevents/speech/bernanke20120831a.htm
Bini Smaghi, Lorenzo. “Conventional and Unconventional Monetary Policy.” Keynote speech at the InternationalCenter for Monetary and Banking Studies, Geneva, Switzerland, April 28, 2009;www.bis.org/review/r090429e.pdf?frames=0.
Blinder, Alan S. “Monetary Policy at the Zero Lower Bound: Balancing the Risks.” Journal of Money, Credit, and Banking,November 2000, 32(4 Part 2), pp. 1093-99.
Buiter, Willem H. and Rahbari, Ebrahim. “The ECB as Lender of Last Resort for Sovereigns in the Euro Area.” CEPRDiscussion Paper No. 8974, Centre for Economic Policy Research, May 2012; http://willembuiter.com/lolr.pdf.
Bullard, James. “Three Lessons for Monetary Policy from the Panic of 2008.” Federal Reserve Bank of St. Louis Review,May/June 2010, 92(3), pp. 155-63; http://research.stlouisfed.org/publications/review/10/05/Bullard.pdf.
Chandra, Lokesh and Strand, Nicholas. “Fed Agency MBS Purchases as of October 3, 2012.” Barclays SecuritisationResearch, October 4, 2012.
Danielsson, Jon and de Vries, Casper. “Money Market on Strike.” Economists’ Forum (blog), Financial Times, November 9,2008; blogs.ft.com/economistsforum/2008/11/money-market-on-strike/#axzz291ASfhQv.
De Pooter, Michiel; Martin, Robert F. and Pruitt, Seth. “A European Twist: The Efficacy of the Securities MarketsProgramme.” Unpublished manuscript, Federal Reserve Board of Governors, March 2012.
Eggertsson, Gauti B. “The Deflation Bias and Committing to Being Irresponsible.” Journal of Money, Credit, and Banking,March 2006, 38(2), pp. 283-321.
Eggertsson, Gauti B. and Woodford, Michael. “The Zero Bound on Interest Rates and Optimal Monetary Policy.”Brookings Papers on Economic Activity, 2003, 1, pp. 139-211.
Gagnon, Joseph; Raskin, Matthew; Remache, Julie and Sack, Brian. “Large-Scale Asset Purchases by the FederalReserve: Did They Work?” Federal Reserve Bank of New York Economic Policy Review, May 2011a, 17(1), pp. 41-59;www.newyorkfed.org/research/epr/11v17n1/1105gagn.pdf.
Gagnon, Joseph; Raskin, Matthew; Remache, Julie and Sack, Brian. “The Financial Market Effects of the FederalReserve’s Large-Scale Asset Purchases.” International Journal of Central Banking, March 2011b, 7(1), pp. 3-43.
Hamilton, James D. and Wu, Jing C. “The Effectiveness of Alternative Monetary Policy Tools in a Zero Lower BoundEnvironment.” NBER Working Paper 16956, National Bureau of Economic Research, April 2011;www.nber.org/papers/w16956.pdf?new_window=1.
Fawley and Neely
Federal Reserve Bank of St. Louis REVIEW January/February 2013 85

Ito, Takatoshi and Mishkin, Frederic S. “Two Decades of Japanese Monetary Policy and the Deflation Problem,” inTakatoshi Ito and Andrew Rose, eds., Monetary Policy under Very Low Inflation in the Pacific Rim. National Bureau ofEconomic Research–East Asia Seminar on Economics, September 2006. Volume 15. Chicago: University of ChicagoPress, 2006, pp. 131-93.
Joyce, Michael A.S.; Lasaosa, Ana; Stevens, Ibrahim and Tong, Matthew. “The Financial Market Impact of QuantitativeEasing in the United Kingdom.” International Journal of Central Banking, September 2011, 7(3), pp. 113-61.
Keynes, John Maynard. General Theory of Employment, Interest and Money. London: McMillan and Company, 1936.
Kihara, Leika. “Under Pressure from Abe, Bank of Japan Boosts Stimulus Again.” Reuters, December 20, 2012;www.reuters.com/article/2012/12/20/us-japan-economy-idUSBRE8BJ05520121220.
Kohn, Donald L. “Monetary Policy Research and the Financial Crisis: Strengths and Shortcomings.” Speech at theFederal Reserve Conference on Key Developments in Monetary Policy, Washington DC, October 9, 2009; www.federalreserve.gov/newsevents/speech/kohn20091009a.htm.
Krippner, Leo and Thornton, Daniel T. “A Proposal for Improving Forward Guidance.” Federal Reserve Bank of St. LouisEconomic Synopses, 2012, No. 27, September 28, 2012; http://research.stlouisfed.org/publications/es/12/ES_27_2012-09-28.pdf.
Meyer, Laurence H. and Bomfim, Antulio N. “Quantifying the Effects of Fed Asset Purchases on Treasury Yields.”Macroeconomic Advisers Monetary Policy Insights: Fixed Income Focus, June 17, 2010.
Minder, Raphael. “Spanish and Italian Bond Yields Drop on E.C.B. Buying.” New York Times, August 9, 2011;www.nytimes.com/2011/08/10/business/global/spanish-and-italian-bond-yields-drop-on-ecb-buying.html?_r=0.
Mishkin, Frederic S. “The Channels of Monetary Transmission: Lessons for Monetary Policy.” NBER Working Paper No. 5464, National Bureau of Economic Research, February 1996; www.nber.org/papers/w5464.pdf?new_window=1.
Neely, Christopher J. “The Large-Scale Asset Purchases Had Large International Effects.” Federal Reserve Bank of St. LouisWorking Paper No. 2010-018D, July 2010, revised April 2012; http://research.stlouisfed.org/wp/2010/2010-018.pdf.
Modigliani, Franco and Sutch, Richard. “Innovations in Interest Rate Policy.” American Economic Review, March 1966,56(1-2), pp. 178-97.
Poole, William and Rasche, Robert. “Perfecting the Market’s Knowledge of Monetary Policy.” Journal of FinancialServices Research, 2000, 18(2-3), pp. 255-98.
Stroebel, Johannes C. and Taylor, John B. “Estimated Impact of the Fed’s Mortgage-Backed Securities PurchaseProgram.” NBER Working Paper No. 15626, National Bureau of Economic Research, December 2009;www.nber.org/papers/w15626.pdf?new_window=1.
Fawley and Neely
86 January/February 2013 Federal Reserve Bank of St. Louis REVIEW
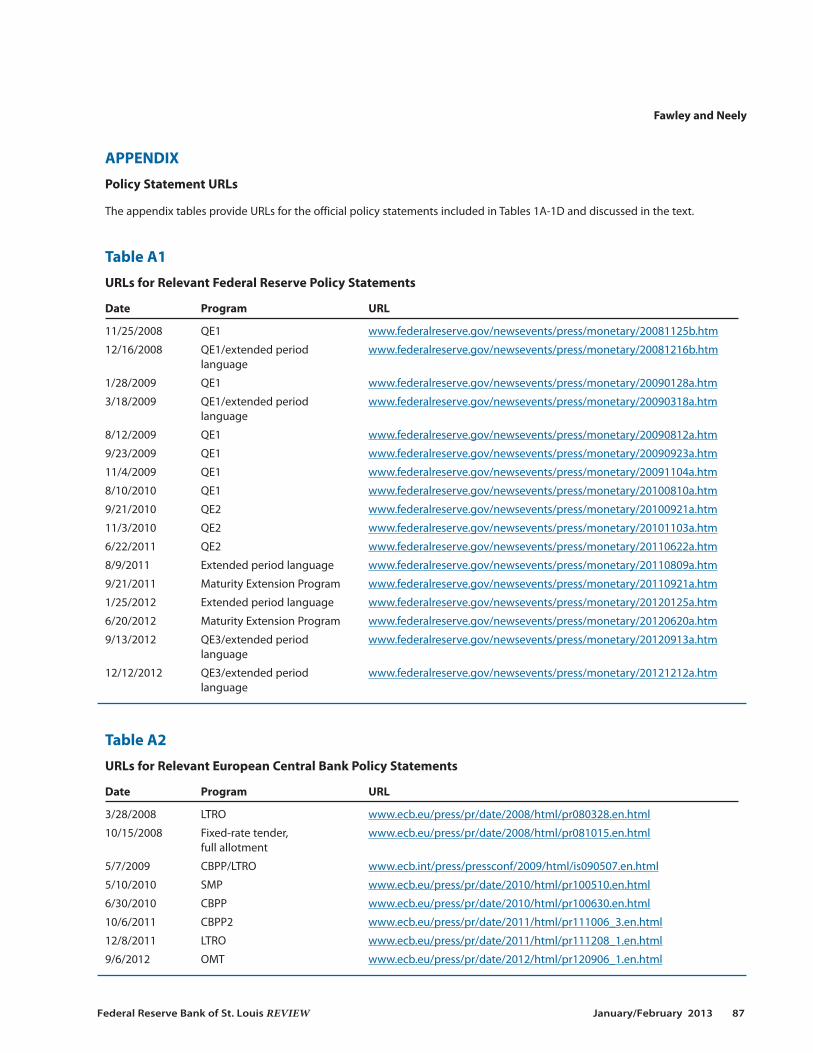
Fawley and Neely
Federal Reserve Bank of St. Louis REVIEW January/February 2013 87
APPENDIX
Policy Statement URLs
The appendix tables provide URLs for the official policy statements included in Tables 1A-1D and discussed in the text.
Table A1
URLs for Relevant Federal Reserve Policy Statements
Date Program URL
11/25/2008 QE1 www.federalreserve.gov/newsevents/press/monetary/20081125b.htm
12/16/2008 QE1/extended period www.federalreserve.gov/newsevents/press/monetary/20081216b.htmlanguage
1/28/2009 QE1 www.federalreserve.gov/newsevents/press/monetary/20090128a.htm
3/18/2009 QE1/extended period www.federalreserve.gov/newsevents/press/monetary/20090318a.htmlanguage
8/12/2009 QE1 www.federalreserve.gov/newsevents/press/monetary/20090812a.htm
9/23/2009 QE1 www.federalreserve.gov/newsevents/press/monetary/20090923a.htm
11/4/2009 QE1 www.federalreserve.gov/newsevents/press/monetary/20091104a.htm
8/10/2010 QE1 www.federalreserve.gov/newsevents/press/monetary/20100810a.htm
9/21/2010 QE2 www.federalreserve.gov/newsevents/press/monetary/20100921a.htm
11/3/2010 QE2 www.federalreserve.gov/newsevents/press/monetary/20101103a.htm
6/22/2011 QE2 www.federalreserve.gov/newsevents/press/monetary/20110622a.htm
8/9/2011 Extended period language www.federalreserve.gov/newsevents/press/monetary/20110809a.htm
9/21/2011 Maturity Extension Program www.federalreserve.gov/newsevents/press/monetary/20110921a.htm
1/25/2012 Extended period language www.federalreserve.gov/newsevents/press/monetary/20120125a.htm
6/20/2012 Maturity Extension Program www.federalreserve.gov/newsevents/press/monetary/20120620a.htm
9/13/2012 QE3/extended period www.federalreserve.gov/newsevents/press/monetary/20120913a.htmlanguage
12/12/2012 QE3/extended period www.federalreserve.gov/newsevents/press/monetary/20121212a.htmlanguage
Table A2
URLs for Relevant European Central Bank Policy Statements
Date Program URL
3/28/2008 LTRO www.ecb.eu/press/pr/date/2008/html/pr080328.en.html
10/15/2008 Fixed-rate tender, www.ecb.eu/press/pr/date/2008/html/pr081015.en.htmlfull allotment
5/7/2009 CBPP/LTRO www.ecb.int/press/pressconf/2009/html/is090507.en.html
5/10/2010 SMP www.ecb.eu/press/pr/date/2010/html/pr100510.en.html
6/30/2010 CBPP www.ecb.eu/press/pr/date/2010/html/pr100630.en.html
10/6/2011 CBPP2 www.ecb.eu/press/pr/date/2011/html/pr111006_3.en.html
12/8/2011 LTRO www.ecb.eu/press/pr/date/2011/html/pr111208_1.en.html
9/6/2012 OMT www.ecb.eu/press/pr/date/2012/html/pr120906_1.en.html
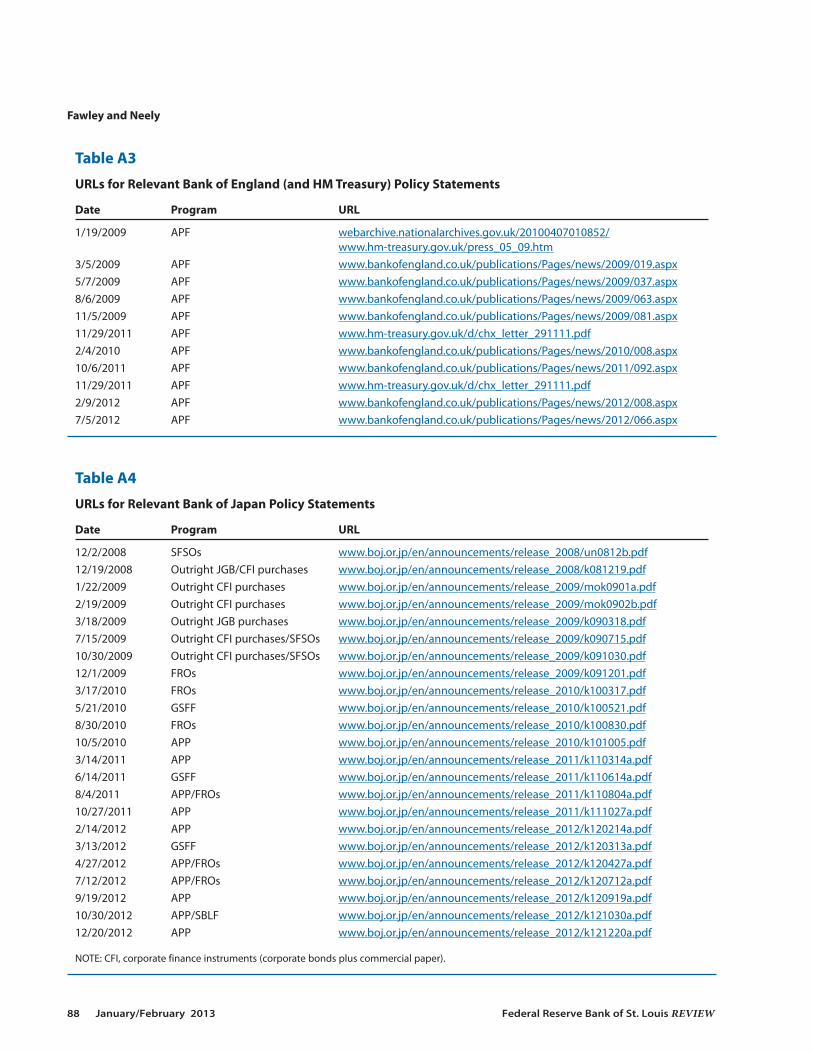
Fawley and Neely
88 January/February 2013 Federal Reserve Bank of St. Louis REVIEW
Table A3
URLs for Relevant Bank of England (and HM Treasury) Policy Statements
Date Program URL
1/19/2009 APF webarchive.nationalarchives.gov.uk/20100407010852/www.hm-treasury.gov.uk/press_05_09.htm
3/5/2009 APF www.bankofengland.co.uk/publications/Pages/news/2009/019.aspx5/7/2009 APF www.bankofengland.co.uk/publications/Pages/news/2009/037.aspx8/6/2009 APF www.bankofengland.co.uk/publications/Pages/news/2009/063.aspx11/5/2009 APF www.bankofengland.co.uk/publications/Pages/news/2009/081.aspx11/29/2011 APF www.hm-treasury.gov.uk/d/chx_letter_291111.pdf2/4/2010 APF www.bankofengland.co.uk/publications/Pages/news/2010/008.aspx10/6/2011 APF www.bankofengland.co.uk/publications/Pages/news/2011/092.aspx11/29/2011 APF www.hm-treasury.gov.uk/d/chx_letter_291111.pdf2/9/2012 APF www.bankofengland.co.uk/publications/Pages/news/2012/008.aspx7/5/2012 APF www.bankofengland.co.uk/publications/Pages/news/2012/066.aspx
Table A4
URLs for Relevant Bank of Japan Policy Statements
Date Program URL
12/2/2008 SFSOs www.boj.or.jp/en/announcements/release_2008/un0812b.pdf12/19/2008 Outright JGB/CFI purchases www.boj.or.jp/en/announcements/release_2008/k081219.pdf1/22/2009 Outright CFI purchases www.boj.or.jp/en/announcements/release_2009/mok0901a.pdf2/19/2009 Outright CFI purchases www.boj.or.jp/en/announcements/release_2009/mok0902b.pdf3/18/2009 Outright JGB purchases www.boj.or.jp/en/announcements/release_2009/k090318.pdf7/15/2009 Outright CFI purchases/SFSOs www.boj.or.jp/en/announcements/release_2009/k090715.pdf10/30/2009 Outright CFI purchases/SFSOs www.boj.or.jp/en/announcements/release_2009/k091030.pdf12/1/2009 FROs www.boj.or.jp/en/announcements/release_2009/k091201.pdf3/17/2010 FROs www.boj.or.jp/en/announcements/release_2010/k100317.pdf5/21/2010 GSFF www.boj.or.jp/en/announcements/release_2010/k100521.pdf8/30/2010 FROs www.boj.or.jp/en/announcements/release_2010/k100830.pdf10/5/2010 APP www.boj.or.jp/en/announcements/release_2010/k101005.pdf3/14/2011 APP www.boj.or.jp/en/announcements/release_2011/k110314a.pdf6/14/2011 GSFF www.boj.or.jp/en/announcements/release_2011/k110614a.pdf8/4/2011 APP/FROs www.boj.or.jp/en/announcements/release_2011/k110804a.pdf10/27/2011 APP www.boj.or.jp/en/announcements/release_2011/k111027a.pdf2/14/2012 APP www.boj.or.jp/en/announcements/release_2012/k120214a.pdf3/13/2012 GSFF www.boj.or.jp/en/announcements/release_2012/k120313a.pdf4/27/2012 APP/FROs www.boj.or.jp/en/announcements/release_2012/k120427a.pdf7/12/2012 APP/FROs www.boj.or.jp/en/announcements/release_2012/k120712a.pdf9/19/2012 APP www.boj.or.jp/en/announcements/release_2012/k120919a.pdf10/30/2012 APP/SBLF www.boj.or.jp/en/announcements/release_2012/k121030a.pdf12/20/2012 APP www.boj.or.jp/en/announcements/release_2012/k121220a.pdf
NOTE: CFI, corporate finance instruments (corporate bonds plus commercial paper).