Embed Size (px)
Citation preview
MONITORING SECTION
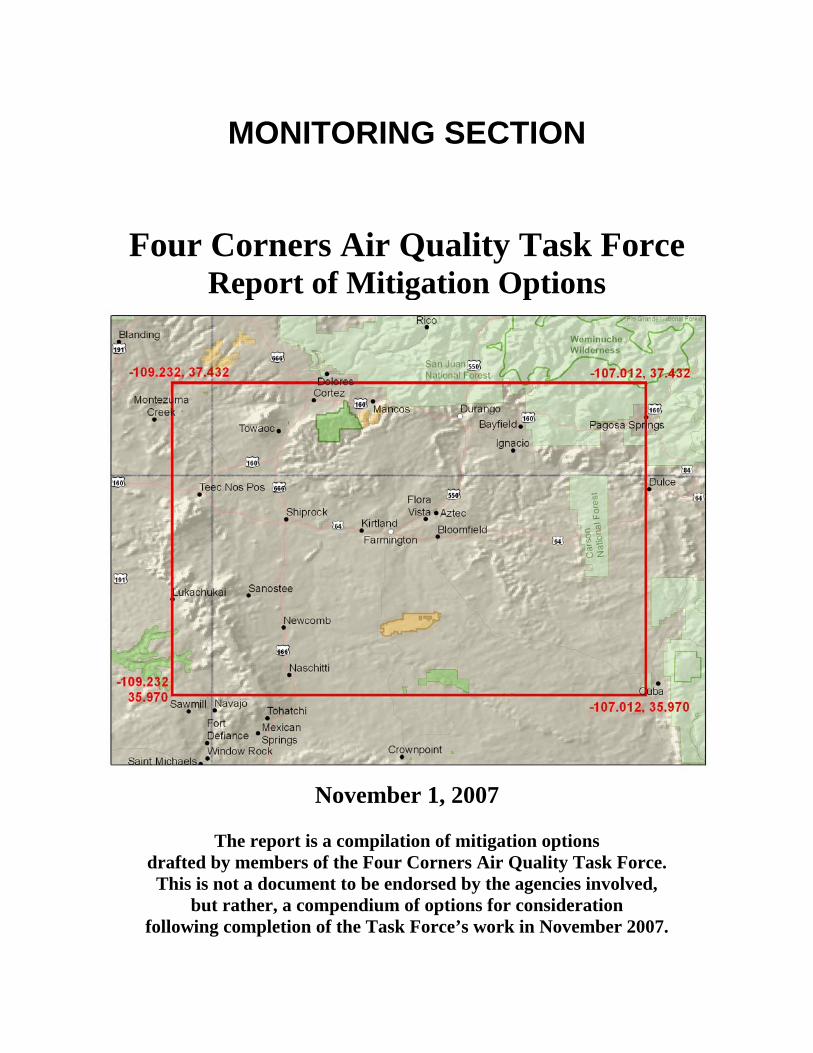
Four Corners Air Quality Task Force Report of Mitigation Options
November 1, 2007
The report is a compilation of mitigation options
drafted by members of the Four Corners Air Quality Task Force. This is not a document to be endorsed by the agencies involved,
but rather, a compendium of options for consideration following completion of the Task Force’s work in November 2007.
Monitoring 11/01/07
i
Monitoring Section Table of Contents
Preface....................................................................................................................................................... 1 EXISTING MONITORING NETWORKS............................................................................................... 3
Monitoring Matrix Narrative.............................................................................................................. 3 Monitoring Site General Information................................................................................................. 7 Criteria Pollutant Sites ..................................................................................................................... 12 Meteorological Sites ........................................................................................................................ 13 Deposition Sites ............................................................................................................................... 15
DATA ANALYSIS AND RECOMMENDATIONS.............................................................................. 16 Meteorology and Wind Roses.......................................................................................................... 16 Ozone and Precursor Gases.............................................................................................................. 29 Carbon Monoxide, Particulates and Other Common Pollutants ...................................................... 44 Uranium, Radionuclides and Radon ................................................................................................ 55 Mercury............................................................................................................................................ 58 Atmospheric Deposition of Nitrogen and Sulfur Compounds ......................................................... 66 Visibility .......................................................................................................................................... 75 Interim Emissions Recommendations for Ammonia Monitoring .................................................... 86
RESOLUTIONS...................................................................................................................................... 88 BUDGETS/FUNDING AND PROJECTED COSTS ........................................................................... 101 SUMMARY OF SUGGESTIONS/PRIORITIES ................................................................................. 106
Introduction.................................................................................................................................... 106 Analysis and Interpretation of Existing Data ................................................................................. 108
RESPONSES TO MONITORING COMMENTS ................................................................................ 116 AAppppeennddiicceess ..............................................................................................................................................................................EErrrroorr!! BBooookkmmaarrkk nnoott ddeeffiinneedd..
Acronyms ................................................................................................ Error! Bookmark not defined. Definitions............................................................................................... Error! Bookmark not defined. Table of Mitigation Options Not Written................................................ Error! Bookmark not defined. General Public Comments....................................................................... Error! Bookmark not defined.

Monitoring 11/01/07
1
MONITORING: PREFACE Overview The charter for the Monitoring Workgroup was as follows:
“The monitoring workgroup will review information provided on existing monitoring networks, and then identify data gaps and options for additional monitoring in cooperation with the other work groups. A gap analysis and trends analysis will be the basis for identifying options for additional monitoring. The monitoring workgroup will identify potential funding sources and develop a holistic monitoring strategic plan for the region.”
Group Membership The Monitoring Group was quite diverse. Members included private citizens from the Durango-Cortez-Aztec area, National Park Service personnel, U. S. Forest Service personnel, the Director of Research and Education at Mountain Studies Institute, a University of Denver graduate student, Tribal air quality personnel (Southern Ute and Navajo Nation), a private consulting hydrologist, air quality staff from two state agencies (New Mexico and Colorado), and personnel from two EPA regions (VI and VIII), among others. Scope of Work The following scope of work, including “specific tasks” and “discussion” for the Monitoring Group, was established at the onset of the Task Force. Specific Tasks A. Identify existing monitoring networks located in the Four Corners study area. Review information
provided by these networks to identify data gaps. B. Conduct data analyses to determine pollutant trends within the Four Corners study area. C. Using the gap analysis and trend analysis, identify options for additional monitoring. D. Incorporate public input when developing a monitoring strategy. E. Identify potential funding sources for additional monitoring sites. F. Develop final monitoring strategies for the Four Corners study area. Discussion The work group examined the various agency monitoring networks to determine present monitor locations and types, and pollutants or parameters being measured. Using this evaluation the work group identified locations within the study area that lack adequate representation in terms of pollutant data. Available data from the monitoring networks were analyzed to establish pollutant trends. The method and extent of establishing additional monitoring capabilities was dictated by the results from the network studies and from the data analyses. Public input was also addressed during the consideration of potential monitoring site locations. Once it had been established where monitoring sites were needed and what pollutants or parameters were to be measured, the work group identified potential funding sources. Task 1 In identifying the existing monitoring networks located in the Four Corners study area, a matrix was developed. The matrix attempted to list all known air pollutant monitoring sites and meteorological monitoring sites within the study area. The type of site and the parameters measured at that site were listed in the matrix. The matrix was comprised of four spreadsheets; one having “site information”, one having the “criteria sites”, one having the “deposition sites”, and one having the “meteorological sites”.

Monitoring 11/01/07
2
Task 2 Data from agency databases were used to generate wind and pollution roses, and to generate graphs of pollutant trends. “Overlays” of pollution roses on both political boundary maps and on topographic maps have been produced. The trend graphs plot various pollutant concentrations since 1990. Task 3 Once the gap analysis and the data analyses had been conducted, the work group assessed the types of monitors required and optimal site locations in the Four Corners study area. Task 4 Because public sentiment and concern regarding air quality was of great importance to the Four Corners Air Quality Task Force, available public input was considered prior to any final suggestions of site location and type. Some of this input came from public citizens who are part of the task force. Task 5 To provide the public with some idea of what it takes to set up a new monitoring site, two spreadsheets were created to show both capital and operating costs of two different agency sites. The work group identified potential funding sources for additional monitoring sites. Task 6 A variety of monitoring strategies/suggestions were developed. These included ozone and ozone precursors, mercury, nitrate and sulfate, and visibility.

Monitoring - Existing Monitoring Networks 11/01/07
3
EXISTING MONITORING NETWORKS Monitoring Site Matrix Narrative The Four Corners Area Monitoring Site Matrix is an attempt to list all of the various air quality monitoring sites in the Four Corners area as well as the predominant meteorological monitoring sites. The following explanations refer to the major column headers of the various matrix pages. Monitoring Programs All of the air quality programs are represented in the matrix (some sites are under multiple programs) and are listed below. The following descriptions of the programs are from each program’s web site: ARM-FS: Air Resource Management, USDA Forest Service The Real-Time Images section features live images and current air quality conditions from USDA-FS monitoring locations throughout the United States. Digital images from Web-based cameras are updated every 15 to 60 minutes. Near real-time air quality data and meteorological data are also provided to distinguish natural from human-made causes of poor visibility, and to provide current air pollution levels to the public. CASTNET: Clean Air Status and Trends Network, EPA CASTNET provides atmospheric data on the dry deposition component of total acid deposition, ground-level ozone and other forms of atmospheric pollution. CASTNET is considered the nation's primary source for atmospheric data to estimate dry acidic deposition and to provide data on rural ozone levels. Used in conjunction with other national monitoring networks, CASTNET can help determine the effectiveness of national emission control programs. Each CASTNET dry deposition station measures: • weekly average atmospheric concentrations of sulfate, nitrate, ammonium, sulfur dioxide, and nitric
acid; • hourly concentrations of ambient ozone levels; and • meteorological conditions required for calculating dry deposition rates. CoAgMet: Colorado Agricultural Meteorological Network In the early 1990's, two groups on the Colorado State campus, the Plant Pathology extension specialists and USDA's Agricultural Research Service (ARS) Water Management Unit, discovered that they had a mutual interest in collecting localized weather data in irrigated agricultural area. Plant pathology used the data for prediction of disease outbreaks in high value crops such as onions and potatoes, and ARS used almost the same information to provide irrigation scheduling recommendations. To leverage their resources, these two formed an informal coalition, and invited others in the ag research community to provide input into the kinds and frequency of measurements that would be most useful to a broad spectrum of agricultural customers. A standardized set of instruments was selected, a standard datalogger program was developed, and a fledgling network of some eight stations was established in major irrigated areas of eastern Colorado. As interest grew and funds were made available, primarily from potential users, more stations were added. Initially, stations were located near established phone service to allow daily collection of data. Soon, cellular phone service began to become widely available, and the group determined that this methodology was a reliable and inexpensive method of data recovery. Commercial software was used to download data from the growing list of stations shortly after midnight to a USDA-ARS computer, from which it was

Monitoring - Existing Monitoring Networks 11/01/07
4
then distributed to interested users via answering machine, automated FAX and satellite downlink (Data Transmission Network). As the network grew, Colorado Climate Center at Colorado State became interested in these data, and subsequently took over the daily data collection and quality assessment. CCC added internet delivery and a wide range of data delivery options, and continues to improve the user interface in response to a growing interest in these data. IMPROVE: Interagency Monitoring of Protected Visual Environments Recognizing the importance of visual air quality, Congress included legislation in the 1977 Clean Air Act to prevent future and remedy existing visibility impairment in Class I areas. To aid the implementation of this legislation, the IMPROVE program was initiated in 1985. This program implemented an extensive long term monitoring program to establish the current visibility conditions, track changes in visibility and determine causal mechanism for the visibility impairment in the National Parks and Wilderness Areas. NADP/NTN: National Atmospheric Deposition Program, National Trends Network The National Atmospheric Deposition Program/National Trends Network (NADP/NTN) is a nationwide network of precipitation monitoring sites. The network is a cooperative effort between many different groups, including the State Agricultural Experiment Stations, U.S. Geological Survey, U.S. Department of Agriculture, and numerous other governmental and private entities. The NADP/NTN has grown from 22 stations at the end of 1978, our first year, to over 250 sites spanning the continental United States, Alaska, and Puerto Rico, and the Virgin Islands. The purpose of the network is to collect data on the chemistry of precipitation for monitoring of geographical and temporal long-term trends. The precipitation at each station is collected weekly according to strict clean-handling procedures. It is then sent to the Central Analytical Laboratory where it is analyzed for hydrogen (acidity as pH), sulfate, nitrate, ammonium, chloride, and base cations (such as calcium, magnesium, potassium and sodium). NADP/MDN: National Atmospheric Deposition Program, Mercury Deposition Network The Mercury Deposition Network (MDN), currently with over 90 sites, was formed in 1995 to collect weekly samples of precipitation which are analyzed by a prominent laboratory for total mercury. The objective of the MDN is to monitor the amount of mercury in precipitation on a regional basis; information crucial for researchers to understand what is happening to the nation's lakes and streams. NWS: National Weather Service Feb. 9, 2005 - The NOAA National Weather Service is celebrating its 135th anniversary amid a renewed commitment to preserve its history. On February 9, 1870, President Ulysses S. Grant signed a joint resolution of Congress authorizing the Secretary of War to establish a national weather service. Later that year, the first systematized, synchronous weather observations ever taken in the U.S. were made by "observer sergeants" of the Army Signal Service. Today, thousands of weather observations are made hourly and daily by government agencies, volunteer/citizen observers, ships, planes, automatic weather stations and earth-orbiting satellites. "Since the beginning, the mission of the National Weather Service to protect life and property has been and remains to be the top priority,” said Brig. Gen. David L. Johnson, U.S. Air Force (Ret.), director of NOAA’s National Weather Service. “Advances in research and technology through the decades have
Monitoring - Existing Monitoring Networks 11/01/07
5
allowed the NOAA National Weather Service to create an expanding observational and data collection network that tracks Earth’s changing systems." RAWS: Remote Automated Weather Stations There are nearly 2,200 interagency Remote Automated Weather Stations (RAWS) strategically located throughout the United States. These stations monitor the weather and provide weather data that assists land management agencies with a variety of projects such as monitoring air quality, rating fire danger, and providing information for research applications. SLAMS: State/Local Air Monitoring Stations These ambient air monitoring sites are designated by EPA as State/Local Air Monitoring Stations (SLAMS). Pollutants monitored are the criteria pollutants, and include ozone, particulate matter, carbon monoxide, lead, sulfur dioxide, and oxides of nitrogen. SPMS: Special Purpose Monitoring Stations Special Purpose Monitoring Stations provide for special studies needed by the State and local agencies to support State implementation plans and other air program activities. The SPMS are not permanently established and, can be adjusted easily to accommodate changing needs and priorities. The SPMS are used to supplement the fixed monitoring network as circumstances require and resources permit. If the data from SPMS are used for SIP purposes, they must meet all QA and methodology requirements for SLAMS monitoring. Tribal: Tribal Jurisdiction These sites are under tribal jurisdiction and are the tribal equivalent to SLAMS sites, monitoring the same criteria pollutants. Period of Record The period of record refers to how long a site has been in operation. In some cases, dates refer to monitoring of major parameters at a site. In the case of the NWS sites, the “start” dates are the dates when the NWS data was inserted into the MesoWest database which is maintained by the University of Utah’s Department of Meteorology. Distance From The distances listed refer to the distance from each monitoring site to two representative Four Corners cities; one in Colorado and one in New Mexico. The distances were obtained either from Argonne National Lab’s interactive Four Corners Aerometric Map or Google Maps. Other “site-to-city” distances can be determined by using either map. Criteria Pollutants EPA uses six "criteria pollutants" as indicators of air quality, and has established for each of them a maximum concentration above which adverse effects on human health may occur. Explanations of these pollutants can be found on EPA’s “Green Book” website, http://www.epa.gov/oar/oaqps/greenbk/o3co.html Meteorological These columns indicate what meteorological parameters are monitored at a given site. The parameters are: wind (usually speed and direction), temperature (usually 2-meter and 10-meter), delta T (the difference between 2-meter and 10-meter), solar radiation, relative humidity, and precipitation.

Monitoring - Existing Monitoring Networks 11/01/07
6
Deposition The parameters refer to those monitored by The National Atmospheric Deposition Program/National Trends Network (NADP/NTN). The passive ammonia sampling sites are also listed on the “Deposition” page. Key to Matrix Symbols The following explanation refers to the various symbols used within the matrix cells. h: Sampled and/or averaged hourly 1d/3d: Sampled once every three days 1d/6d: Sampled once every six days w: Sampled weekly 3w: Sampled every three weeks

Monitoring - Existing Monitoring Networks 11/01/07
7
Monitoring Site General Information
AQS / Other Period of Record Elevation Distance from: (Km) Site Program Address Code From To Latitude Longitude (meters) Farmington Durango
Substation SLAMS 16 mi. NW of Farmington, NM 35-045-1005 01/01/72 Present 36.7967 -108.4803 1643 24.2 73.9
Bloomfield SLAMS 162 Highway 550 ; Bloomfield, NM 35-045-0009 08/01/77 Present 36.7421 -107.9773 1618 19.4 59.8
Navajo Lake SLAMS 423 Highway 539 ; Navajo Lake, NM 35-045-0018 07/01/05 Present 36.8098 -107.6514 1950 49.3 56.4
Farmington SLAMS 724 W Animas ; Farmington, NM 35-045-0006 08/01/77 Present 36.7273 -108.2152 1643 0.0 66.7
S.Ute 3 - Bondad Tribal 7571 Highway 550 ; La Plata County, CO 08-067-7003 04/01/97 Present 37.1025 -107.8703 1920 50.5 19.3
S.Ute 1 - Ignacio Tribal County Road 517 ; La Plata County, CO 08-067-7001 06/01/82 Present 37.1389 -107.6317 1981 67.7 25.8
ARM-FS 08-067-9000 02/01/04 Present Shamrock Site
IMPROVE 8 mi. NE of Bayfield, CO
SHMI1 08/01/04 Present 37.3038 -107.4842 2351 90.3 34.3
CASTNET MEV405 01/10/95 Present IMPROVE MEVE 1 03/05/94 Present
SPMS 08-038-0101 07/23/06 Present NADP/NTN CO99 04/28/81 Present
Mesa Verde
NADP/MDN
Chapin Mesa, Mesa Verde Nat’l Park,
Montezuma County, CO
CO99 12/26/01 Present
37.1984 -108.4907 2165 57.1 54.3
Pagosa Springs – School SLAMS 309 Lewis St., Pagosa
Springs, CO 08-007-0001 08/01/75 Present 37.2681 -107.0211 2168 121.9 74.8
Durango – Courthouse SLAMS 1060 E. 2nd Ave., Durango, CO 08-067-1001 03/01/87 12/31/06 37.2739 -107.8786 1984 66.9 0.1
Durango – River City SLAMS 1235 Camino del Rio, Durango, CO 08-067-0004 09/01/85 Present 37.2769 -107.8806 1985 66.8 0.3
Durango – Tradewinds SLAMS 1455 S. Camino del Rio, Durango, CO 08-067-0009 10/30/03 04/06/05 37.2187 -107.8516 1973 63.1 3.9
Durango – Cutler SLAMS 177 Cutler Dr., Durango, CO 08-067-0010 10/30/03 04/30/06 37.3082 -107.8456 1992 70.9 4.3
Durango – Grandview SLAMS 56 Davidson Rd., Durango, CO 08-067-0011 07/01/04 12/31/06 37.2295 -107.8267 2044 67.6 6.8
Telluride SLAMS 333 W. Colorado Ave., Telluride, CO 08-113-0004 03/01/90 Present 37.9375 -107.8117 2694 140.6 76.3
Durango Mt. Resort Other Hwy. 550 & Purgatory Drive --- 10/11/02 Present 37.6314 -107.8076 2665 105.1 38.9
Wolf Creek Pass NADP/NTN Mineral County, CO CO91 05/26/92 Present 37.4686 -106.7903 3292 148.8 98.6

Monitoring - Existing Monitoring Networks 11/01/07
8
AQS / Other Period of Record Elevation Distance from: (Km) Site Program Address Code From To Latitude Longitude (meters) Farmington Durango
Molas Pass NADP/NTN San Juan County, CO CO96 07/29/86 Present 37.7514 -107.6853 3249 121.2 56.4 Weminuche IMPROVE 30 mi. N of Durango, CO WEMI1 03/02/88 Present 37.6594 -107.7999 2750 110.6 44.0 San Pedro Parks IMPROVE 6 mi E of Cuba, NM SAPE1 08/15/00 Present 36.0139 -106.8447 2935 133.6 160.4
Fort Defiance Tribal Rte. 12 N, Bldg. F-004-051, Fort Defiance, AZ 04-001-1234 01/01/99 Present 35.7460 -109.0717 2090 135.4 200.4
Shiprock Dine College Tribal Dine College, GIS Lab, Shiprock, NM 35-045-1233 01/01/03 Present 36.8071 -108.6952 1525 45.0 141.1
CASTNET CAN407 01/24/95 Present NADP/NTN UT09 11/11/97 Present Canyonlands NP IMPROVE
"Island of the Sky" Visitor's Center,
Canyonlands Nat'l Park, San Juan County, UT CANY1 03/02/88 Present
38.4580 -109.821 1814 239.8 214.6
Arches NP IMPROVE 14 mi N of Moab, UT ARCH1 03/02/88 05/16/92 38.7833 -109.5830 1722 253.6 217.2
Moab #6 SLAMS 168 West 400 North, Moab, UT 49-019-0006 10/21/93 6/30/03 38.5795 -109.5540
CASTNET PET427 ? Present IMPROVE PEFO1 03/02/88 Present Petrified Forest NP
(Old) SPMS
1 mi. N of park HQ 04-001-0012 10/27/86 04/16/92
35.0772 -109.7697 1766 262.9 329.2
Petrified Forest NP (New) SPMS SW Entrance;
off Rte. 180 04-017-0119 01/01/88 Present 34.8230 -109.8919 1723 265.5 331.5
Rainbow Forest NP NADP/NTN Apache County, AZ AZ97 12/03/02 Present 35.0013 -109.0128 1707 207.5 274.1 Alamosa NADP/NTN Alamosa county, CO CO00 04/22/80 Present 37.4414 -105.8653 2298 221.0 177.6
Great Sand Dunes NP IMPROVE Monument HQ, Saguache County, CO GRSA1 05/04/88 Present 37.7249 -105.5185 2498 258.0 207.1
Big Horn RAWS Conejos County, CO BHRC2 05/13/93 Present 37.0208 -106.2011 2637 175 147 Sand Dunes RAWS Alamosa County, CO SDNC2 06/02/04 Present 37.7267 -105.5108 2537 254 210 Lujan RAWS Saguache County, CO LUJC2 09/13/94 Present 38.2544 -106.5678 3400 214 155 Needle Creek RAWS Saguache County, CO NCKC2 09/05/02 Present 38.3894 -106.5308 2741 227 168 Huntsman Mesa RAWS Gunnison County, CO HMEC2 05/22/91 Present 38.3319 -107.0889 2865 195 135 McClure Pass RAWS Gunnison County, CO MPRC2 06/11/85 Present 39.1267 -107.2842 2761 264 205 Taylor Park RAWS Gunnison County, CO TAPC2 10/27/87 Present 38.9086 -106.6028 3200 268 210 PSF2 Salida 555 RAWS Chaffee County, CO SIDC2 05/01/97 Present 38.7856 -105.9569 2932 291 229 Red Deer RAWS Chaffee County, CO RDKC2 05/01/83 Present 38.8272 -106.2117 2660 280 218 Jay RAWS Delta County, CO JAYC2 07/09/84 Present 38.8456 -107.7386 1890 227 168 Blue Park RAWS Mineral County, CO BLPC2 04/24/90 Present 37.7931 -106.7786 3179 167 109 Black Canyon RAWS Montrose County, CO LPRC2 06/04/97 Present 38.5428 -107.6869 2609 195 132

Monitoring - Existing Monitoring Networks 11/01/07
9
AQS / Other Period of Record Elevation Distance from: (Km) Site Program Address Code From To Latitude Longitude (meters) Farmington Durango
Carpenter Ridge RAWS Montrose County, CO CPTC2 12/17/98 Present 38.4594 -109.0469 2465 195 160 Cottonwood Basin RAWS Montrose County, CO CMEC2 05/23/91 Present 38.5731 -108.2778 2201 194 140 Nucla RAWS Montrose County, CO NUCC2 05/21/98 Present 38.2333 -108.5617 1786 162 116 Sanborn Park RAWS Montrose County, CO SPKC2 01/29/85 Present 38.1922 -108.2169 2417 153 101 Salter RAWS Dolores County, CO SAWC2 05/30/85 Present 37.6511 -108.5369 2500 101 67 Devil Mtn. RAWS Archuleta County, CO DYKC2 07/27/89 Present 37.2269 -107.3053 2274 92 50 Sandoval Mesa RAWS Archuleta County, CO SDVC2 07/15/99 Present 37.0994 -107.3028 2588 86 53 Big Bear Park RAWS La Plata County, CO BBRC2 08/26/05 Present 37.4961 -107.7294 3170 90 28 Mesa Mtn. RAWS La Plata County, CO MMRC2 11/17/93 Present 37.0564 -107.7086 2249 54 25 SJF1 Durango 555 RAWS La Plata County, CO DUFC2 06/01/96 Present 37.3517 -107.9000 2502 72 9 Chapin RAWS Montezuma County, CO CHAC2 09/07/99 Present 37.1994 -108.4892 2172 55 51 Mockingbird RAWS Montezuma County, CO MOKC2 08/24/05 Present 37.4744 -108.8842 1957 99 87 Morefield RAWS Montezuma County, CO MRFC2 11/12/99 Present 37.2972 -108.4128 2383 61 45 Albino Canyon RAWS San Juan County, NM CWRN5 09/27/83 Present 36.9769 -107.6283 2182 55 35 Washington Pass RAWS San Juan County, NM WPSN5 11/19/03 Present 36.0781 -108.8575 2856 86 147 Coyote RAWS Rio Arriba County, NM COYN5 08/07/96 Present 36.0667 -106.6472 2682 149 161 Deadman Peak RAWS Rio Arriba County, NM DPKN5 05/23/00 Present 36.4231 -107.7719 2575 46 129 Dulce #2 RAWS Rio Arriba County, NM DLCN5 07/07/05 Present 36.9350 -107.0000 2070 107 79 Jarita Mesa RAWS Rio Arriba County, NM JARN5 04/15/02 Present 36.5558 -106.1031 2683 183 168 Stone Lake RAWS Rio Arriba County, NM STLN5 07/07/05 Present 36.7314 -106.8647 2268 115 103 Zuni Buttes RAWS McKinley County, NM ZNRN5 04/04/06 Present 35.1392 -108.9414 2039 172 236 Alb Portable #2 RAWS McKinley County, NM TSO43 11/18/03 Present 35.5264 -107.3211 2481 138 182 Bryson Canyon RAWS Grand County, UT BCRU1 09/03/87 Present 39.2789 -109.2211 1621 283 241 Big Indian Valle RAWS San Juan County, UT BIVU1 09/02/87 Present 38.2244 -109.2783 2121 182 153 Kane Gulch RAWS San Juan County, UT KAGU1 06/20/91 Present 37.5247 -109.8931 1981 165 174 North Long Point RAWS San Juan County, UT NLPU1 08/13/97 Present 37.8547 -109.8389 2646 182 175 Piney Hill RAWS Apache County, AZ QPHA3 11/19/03 Present 35.7611 -109.1675 2469 126 187 Cortez CoAgMet 9 mi. SW of Cortez, CO CTZ01 04/24/91 Present 37.2248 -108.6730 1833 67 67 Dove Creek CoAgMet 4 mi. NW of Dove Creek DVC01 10/28/92 Present 37.7265 -108.9540 2010 123 104 Towaoc CoAgMet Ute Mtn Ute Farm TWC01 06/30/98 Present 37.1891 -108.9350 1621 78 88
Yellow Jacket CoAgMet 2.5 mi. NW of Yellow Jacket YJK01 05/19/91 Present 37.5289 -108.7240 2103 94 77
Yucca House CoAgMet Yucca House National YUC01 01/01/02 Present 37.2478 -108.6870 1821 69 67

Monitoring - Existing Monitoring Networks 11/01/07
10
AQS / Other Period of Record Elevation Distance from: (Km) Site Program Address Code From To Latitude Longitude (meters) Farmington Durango
Monument Cortez-Montezuma County Airport NWS 3 mi. SW of Cortez, CO KCEZ 01/01/97 Present 37.3064 -108.6256 1803 71 7
Cottonwood Pass NWS SW of Buena Vista, CO K7BM 11/17/04 Present 38.7825 -106.2181 2995 280 215 Durango-La Plata County Airport NWS 1000 Airport Road;
Durango, CO KDRO 01/01/97 Present 37.1431 -107.7597 2038 60 0
Gunnison-Crested Butte Regional Airport NWS 519 W Rio Grande;
Gunnison, CO KGUC 01/01/97 Present 38.5333 -106.9333 2340 221 156
Montrose Regional Airport NWS 2100 Airport Road ;
Montrose, CO KMTJ 01/01/97 Present 38.5050 -107.8975 1755 189 128
Pagosa Springs, Wolf Creek Pass NWS NE of Pagosa Springs,
CO KCPW 11/11/03 Present 37.4514 -106.8003 3584 145 95
Saguache Municipal Airport NWS 2 mi. NW of Saguache,
CO 04V 11/17/04 Present 38.0972 -106.1686 2385 227 171
Salida Mountain, Monarch Pass NWS W of Salida, CO KMYP 09/10/03 Present 38.4844 -106.3169 3667 249 185
Telluride Regional Airport NWS 1500 Last Dollar Road ;
Telluride, CO KTEX 02/05/97 Present 37.9539 -107.9086 2767 135 72
Farmington, Four Corners Regional Airport
NWS 800 Municipal Drive ; Farmington, NM KFMN 01/01/97 Present 36.7436 -108.2292 1677 0 63
Grants-Milan Municipal Airport NWS 3 mi. NW of Grants, NM KGNT 04/11/97 Present 35.1653 -107.9022 1988 160 214
Gallup Municipal Airport NWS 2111 W Hwy 66 ; Gallup,
NM KGUP 01/01/97 Present 35.5111 -108.7894 1973 133 194
Window Rock Airport NWS 1 mi. S of Window Rock AZ KRQE 11/14/99 Present 35.6500 -109.0667 2055 131 190
Moab, Canyonlands Field NWS 18 mi. NW of Moab, UT KCNY 01/01/97 Present 38.7600 -109.7447 1388 249 224
ARM-FS : Air Resource Management, USDA Forest Service CASTNET : Clean Air Status and Trends Network, EPA CoAgMet : Colorado Agricultural Meteorological Network IMPROVE : Interagency Monitoring of Protected Visual Environments NADP/NTN : National Atmospheric Deposition Program, National Trends Network NADP/MDN : National Atmospheric Deposition Program, Mercury Deposition Network NWS : National Weather Service RAWS : Remote Automated Weather Stations SLAMS : State/Local Air Monitoring Stations SPMS : Special Purpose Monitoring Stations

Monitoring - Existing Monitoring Networks 11/01/07
11
Tribal : Tribal Jurisdiction

Monitoring - Existing Monitoring Networks 11/01/07
12
Criteria Pollutant Sites
Criteria Pollutants
Site Program
O3 SO2
CO NOx
NO
NO2 PM10
PM2.5
Substation SLAMS h h h h h Bloomfield SLAMS h h h h h Navajo Lake SLAMS h h h h h Farmington SLAMS 1d/6d 1d/3d
S.Ute 3 - Bondad Tribal h h h h ended 9/30/06
S.Ute 1 - Ignacio Tribal h h h h h ended 9/30/06
ARM-FS h h h h Shamrock Site IMPROVE 1d/3d 1d/3d 1d/3d 1d/3d CASTNET h h h 1d/3d IMPROVE 1d/3d 1d/3d 1d/3d
SPMS NADP/NTN
Mesa Verde
ADP/MDN
Pagosa Springs – School SLAMS 1d/1d 1d/3d
end 12/06
Durango – Courthouse SLAMS 1d/3d end 12/06
Durango- River City SLAMS 1d/3d
Durango – Tradewinds SLAMS 1d/6d end 3/05
Durango – Cutler SLAMS 1d/6d end 4/06
Durango - Grandview SLAMS 1d/3d end 12/06
Telluride SLAMS 1d/3d 1d/3d
end 12/06
Durango Mt. Resort Other h Weminuche IMPROVE 1d/3d 1d/3d San Pedro Parks IMPROVE 1d/3d 1d/3d Fort Defiance Tribal 1d/6d Shiprock Dine College Tribal 1d/6d
CASTNET h h h NADP/NTN Canyonlands NP IMPROVE 1d/3d 1d/3d 1d/3d 1d/3d
Arches NP IMPROVE 1d/3d 1d/3d Moab #6 SLAMS 1d/6d
CASTNET h h h IMPROVE 1d/3d 1d/3d 1d/3d 1d/3d Petrified Forest NP (Old)
SPMS h Petrified Forest NP (New) SPMS h Great Sand Dunes NP IMPROVE 1d/3d 1d/3d
See Monitoring Site General Information table for abbreviations h : Sampled and/or averaged hourly 1d/1d : 24-hour sample taken every day 1d/3d : 24-hour sample taken every 3rd day 1d/6d : 24-hour sample taken every 6th day

Monitoring - Existing Monitoring Networks 11/01/07
13
Meteorological Sites
Site Program Win
d Tem
p Delta T Solar RH Preci
p Substation SLAMS h h h h Bloomfield SLAMS h h h h Navajo Lake SLAMS h h h h S.Ute 3 - Bondad Tribal h h h h h h S.Ute 1 - Ignacio Tribal h h h h h h
ARM-FS h h h h hShamrock Site
IMPROVE CASTNET h h h h hIMPROVE
SPMS NADP/NT Mesa Verde
NADP/MDN
Durango Mt. Resort Other h h h h h h Fort Defiance Tribal h h h h h Shiprock Dine College Tribal h h h h h
CASTNET h h h h hNADP/NT Canyonlands NP IMPROVE CASTNET h h h h hPetrified Forest NP (Old) IMPROVE
Petrified Forest NP (New) SPMS h h Big Horn RAWS h h h h h Sand Dunes RAWS h h h h h Lujan RAWS h h h h h Needle Creek RAWS h h h h h Huntsman Mesa RAWS h h h h h McClure Pass RAWS h h h h h Taylor Park RAWS h h h h h PSF2 Salida 555 RAWS h h h h h Red Deer RAWS h h h h h Jay RAWS h h h h h Blue Park RAWS h h h h h Black Canyon RAWS h h h h h Carpenter Ridge RAWS h h h h h Cottonwood Basin RAWS h h h h h Nucla RAWS h h h h h Sanborn Park RAWS h h h h h Salter RAWS h h h h h Devil Mtn. RAWS h h h h h Sandoval Mesa RAWS h h h h h Big Bear Park RAWS h h h h h Mesa Mtn. RAWS h h h h h

Monitoring - Existing Monitoring Networks 11/01/07
14
Site Program Win
d Tem
p Delta T Solar RH Preci
p SJF1 Durango 555 RAWS h h h h h Chapin RAWS h h h h h Mockingbird RAWS h h h h h Morefield RAWS h h h h h Albino Canyon RAWS h h h h h Washington Pass RAWS h h h h h Coyote RAWS h h h h h Deadman Peak RAWS h h h h h Dulce #2 RAWS h h h h h Jarita Mesa RAWS h h h h h Stone Lake RAWS h h h h h Zuni Buttes RAWS h h h h h Alb Portable #2 RAWS h h h h h Bryson Canyon RAWS h h h h h Big Indian Valle RAWS h h h h h Kane Gulch RAWS h h h h h North Long Point RAWS h h h h h Piney Hill RAWS h h h h h Cortez CoAgMet h h h h Dove Creek CoAgMet h h h h Towaoc CoAgMet h h h h Yellow Jacket CoAgMet h h h h Yucca House CoAgMet h h h h Cortez-Montezuma County Airport NWS h h h Cottonwood Pass NWS h h h Durango-La Plata County Airport NWS h h h Gunnison-Crested Butte Regional Airport NWS h h h Montrose Regional Airport NWS h h h Pagosa Springs, Wolf Creek Pass NWS h h h Saguache Municipal Airport NWS h h h Salida Mountain, Monarch Pass NWS h h h Telluride Regional Airport NWS h h h Farmington, Four Corners Regional Airport NWS h h h Grants-Milan Municipal Airport NWS h h h Gallup Municipal Airport NWS h h h Window Rock Airport NWS h h h Moab, Canyonlands Field NWS h h h
See Monitoring Site General Information table for abbreviations h: Sampled and/or averaged hourly

Monitoring - Existing Monitoring Networks 11/01/07
15
Deposition Sites
Deposition
Site Program
NH3
pH
SO4
NH4
NO3
Pb
HF
Hg
Ca, Mg, K, Na, Cl
Substation SLAMS 3w Navajo Lake SLAMS 3w S.Ute 3 - Bondad Tribal 3w
CASTNET IMPROVE
SPMS 3w NADP/NT w w w w w Mesa Verde
NADP/MDN w w
Wolf Creek Pass NADP/NT
N w w w w w
Molas Pass NADP/NT
N w w w w w CASTNET NADP/NT w w w w wCanyonlands NP IMPROVE
Rainbow Forest NP NADP/NT
N w w w w w
Alamosa NADP/NT
N w w w w w Farmington Airport OTHER 3w
See Monitoring Site General Information table for abbreviations w : Sampled weekly 3w : Sampled every 3 weeks

Monitoring - Data Analysis and Recommendations 11/01/07
16
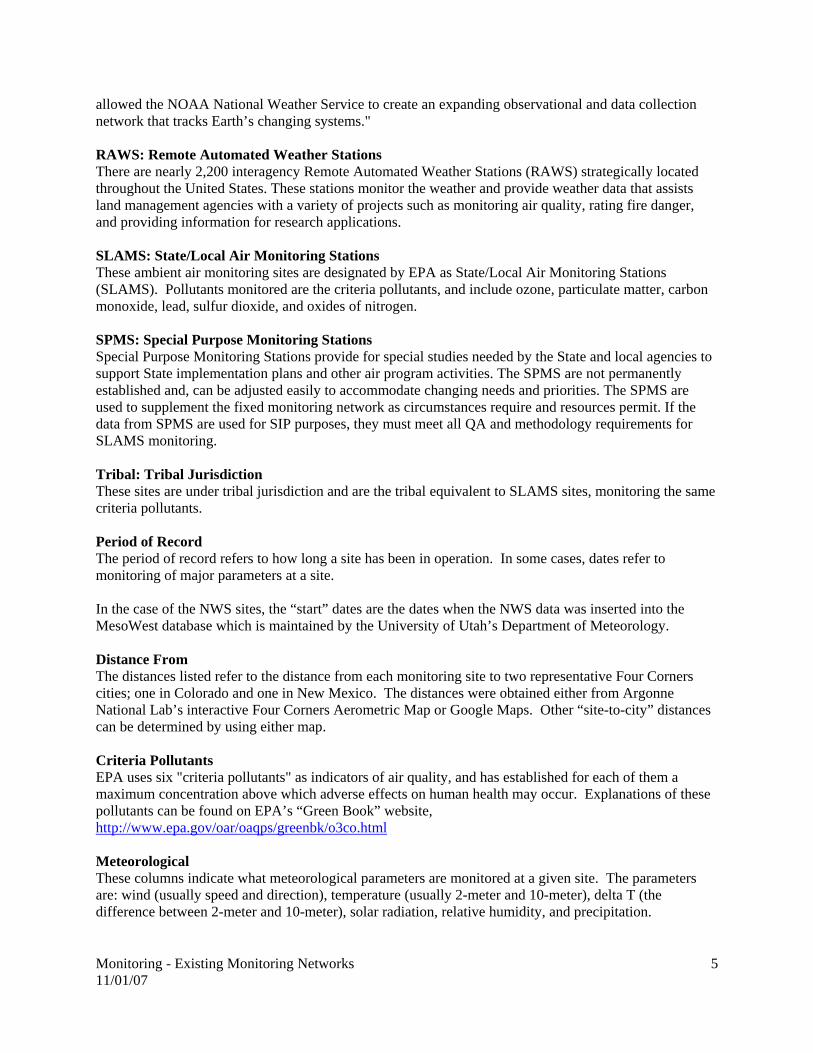
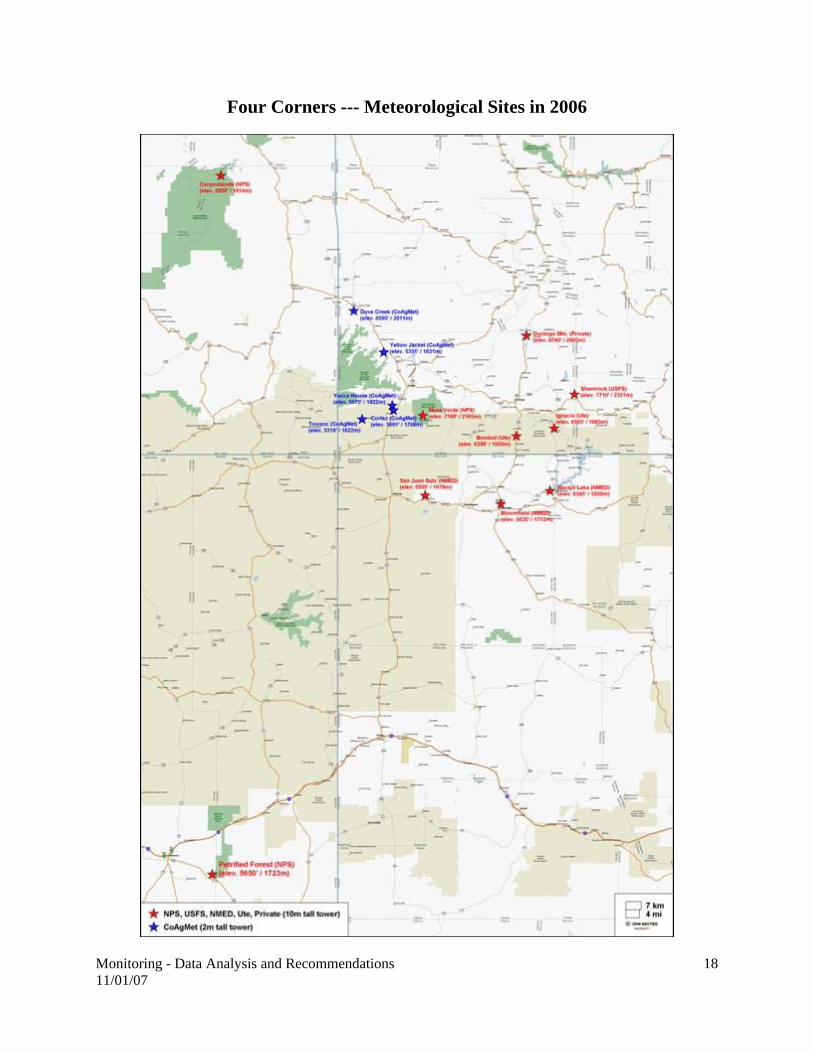
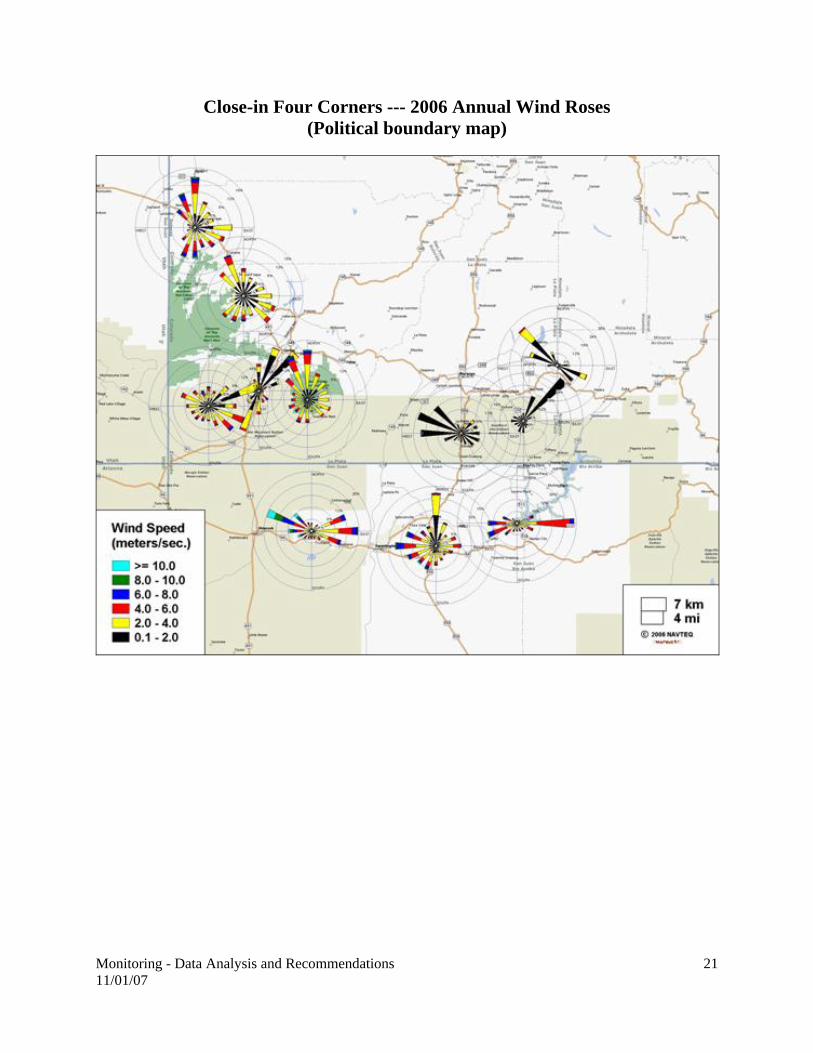
DATA ANALYSIS AND RECOMMENDATIONS Meteorology and Wind Roses Background: Rationale and Benefits: Meteorology is the science that deals with the study of the atmosphere and its phenomena, especially with weather and weather forecasting. Meteorological conditions are a driving force in many bad pollution events and situations. These include stagnation, inversions and blowing dust. There are a number of components to meteorology, including wind speed, wind direction, temperature, relative humidity, barometric pressure, solar radiation, precipitation and others. Modeling is performed with the various components as part of forecasting for weather conditions as well as for air pollution impacts. For air pollution, wind speed and wind direction are two of the more important components. These can determine how far pollution can be transported in a certain time period, if stagnation periods exist and what sources may have contributed to the air pollution. Wind roses are a simple visual way to depict wind speed strengths as a function of wind direction for a period of time. Wind roses are based on the direction that the wind is blowing from. Another way of visualizing a wind rose is to picture yourself standing in the center of the plot and facing into the wind. The wind direction is broken down in the 16 cardinal directions (i.e. N, NNE, NE, ENE, E, ESE, SE, SSE, S, etc). The wind speed is broken down into multiple ranges. The length of each arm of the wind rose represents the percentage of time the wind was blowing from that direction. The longer the arm, the greater percentage of time the wind is blowing from that direction. Since the occurrence of wind speeds of different ranges from a particular direction are stacked on the radius in order of increasing speeds, one must compare the length of each color to the distance between the percent circles to get the percent of time each range of wind speed occurred. The circles representing the percent of time can vary from rose to rose hence each rose must be checked for the values. Wind roses can be generated by a number of commercially available software programs. For this analysis, WRPLOT View from Lakes Environmental Software was employed.1 Existing meteorological data for the Four Corners region: Meteorological data are collected at a number of different locations in the Four Corners region. Sites include State and Tribal agencies, the National Weather Service (NWS), the U.S. Forest Service (USFS), the National Park Service (NPS), The Remote Automated Weather Stations (RAWS) network, the Colorado Agriculture Meteorological Network (CoAgMet) and other private groups. Data are available from varying sources, including the U.S. Environmental Protection Agency’s Air Quality System2, the CoAgMet website3, the New Mexico Environment Department website4, the NWS website5, the RAWS website6 and from direct contact. For wind roses, hourly data (or more frequent) are needed. Ten-meter tall towers are a general standard that is used, though not all networks are set up this way. Maps of the meteorological sites that were used in this analysis are presented below, both for the whole Four Corners region and for a core area. These sites are a limited subset of the total number of possible sites, as can be seen in the site matrix tables in a different section of this overall report. Wind roses were developed using hourly wind speed and wind direction data from 2006. Annual wind roses were developed as well at daytime (6:00 a.m. – 6:00 p.m.) and nighttime (6:00 p.m. – 6:00 a.m.). These wind roses were then overlaid on both political boundary maps and topographical maps (see annual/daytime/nighttime wind rose maps). In looking at the annual wind roses, it is evident that some sites are more influenced by local topography than others. An example is the Cortez CoAgMet site, which is located in the valley between Sleeping Ute

Monitoring - Data Analysis and Recommendations 11/01/07
17
Mountain and Mesa Verde and is subjected to definite channeling effects. Another example is the U.S. Forest Service Shamrock site, which is located on the side of a hogback ridge. It can also be seen that the strongest winds are generally from a more westerly direction than an easterly one. From the daytime wind roses, there are general westerly or northerly/southerly components to the winds. In comparison, the nighttime wind roses show more of general easterly to northerly components. These trends are expected based on prevailing regional wind patterns as well as more local convection heating and cooling patterns along with topography. These wind roses can be broken down even further, such as only for summer afternoon periods when ozone levels are expected to be highest (see summer afternoon wind rose maps). These wind roses show, in general, a predominant westerly to southwesterly component. As mentioned previously, some sites still exhibit wind patterns that are strongly influenced by local topography rather than more regional winds. However, these types of plots are useful in describing what may happen with air pollution flows during different periods of time. While not performed for this analysis, additional seasonal plots could be dome, such as for winter when inversions are more prevalent. Data Gaps: No significant data gaps exist for meteorological monitoring in the Four Corners region, with the exception of southwestern Utah and northeastern Arizona. Suggestions for Future Monitoring Work: No suggestions for additional monitoring of meteorological parameters are currently being proposed. Literature Cited: 1. Lakes Environmental Software. WRPLOT View. http://www.weblakes.com/lakewrpl.html. 2. U.S. Environmental Protection Agency. http://www.epa.gov/air/data/index.html. 3. Colorado State University. Colorado Agriculture Meteorological Network.
http://ccc.atmos.colostate.edu/~coagmet/. 4. New Mexico Environment Department. http://air.state.nm.us/. 5. National Weather Service. Automated Surface Observation System. http://www.nws.noaa.gov/asos/. 6. Western Regional Climate Center. Remote Automated Weather System.
http://www.raws.dri.edu/index.html.
Monitoring - Data Analysis and Recommendations 11/01/07
18
Four Corners --- Meteorological Sites in 2006

Monitoring - Data Analysis and Recommendations 11/01/07
19
Close-in Four Corners --- Meteorological Sites in 2006

Monitoring - Data Analysis and Recommendations 11/01/07
20
Four Corners --- 2006 Annual Wind Roses
Monitoring - Data Analysis and Recommendations 11/01/07
21
Close-in Four Corners --- 2006 Annual Wind Roses (Political boundary map)

Monitoring - Data Analysis and Recommendations 11/01/07
22
Close-in Four Corners --- 2006 Annual Wind Roses (Topographic map)

Monitoring - Data Analysis and Recommendations 11/01/07
23
Close-in Four Corners --- 2006 Daytime Wind Roses (Political boundary map)

Monitoring - Data Analysis and Recommendations 11/01/07
24
Close-in Four Corners --- 2006 Daytime Wind Roses (Topographic map)

Monitoring - Data Analysis and Recommendations 11/01/07
25
Close-in Four Corners --- 2006 Nighttime Wind Roses (Political boundary map)

Monitoring - Data Analysis and Recommendations 11/01/07
26
Close-in Four Corners --- 2006 Nighttime Wind Roses (Topographic map)

Monitoring - Data Analysis and Recommendations 11/01/07
27
Close-in Four Corners --- 2006 Summer Afternoon Wind Roses (Political boundary map)

Monitoring - Data Analysis and Recommendations 11/01/07
28
Close-in Four Corners --- 2006 Summer Afternoon Wind Roses (Topographic map)
Monitoring - Data Analysis and Recommendations 11/01/07
29
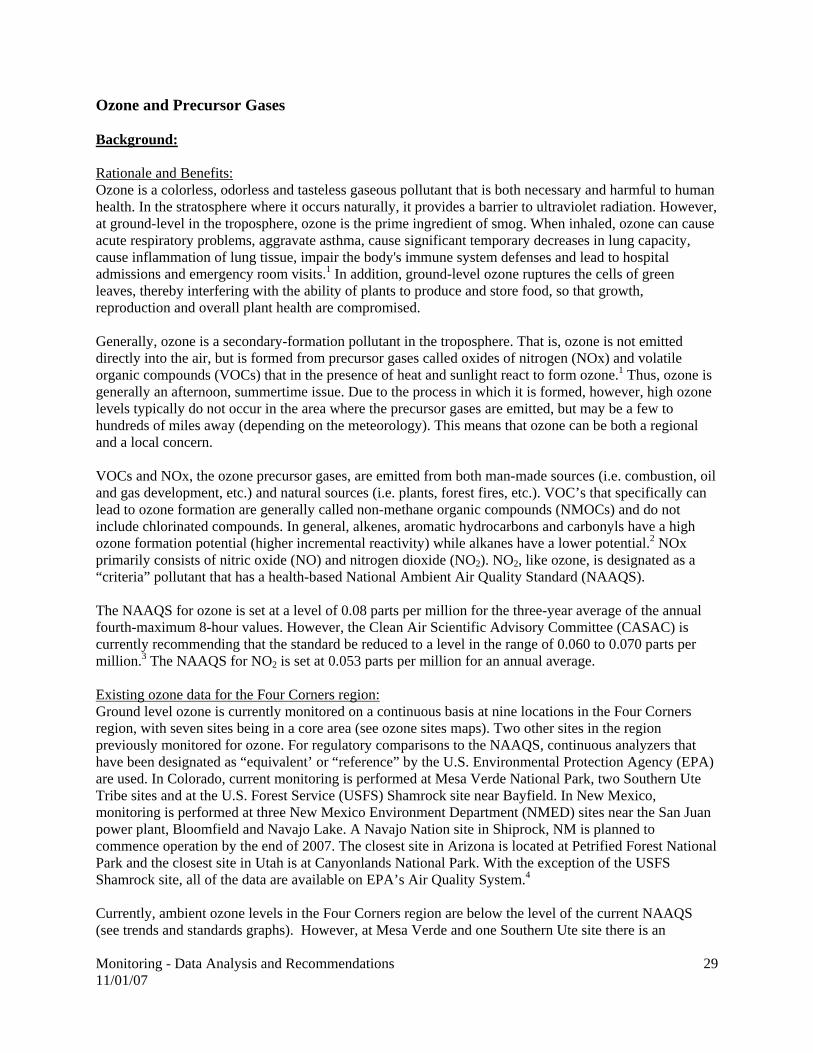
Ozone and Precursor Gases Background: Rationale and Benefits: Ozone is a colorless, odorless and tasteless gaseous pollutant that is both necessary and harmful to human health. In the stratosphere where it occurs naturally, it provides a barrier to ultraviolet radiation. However, at ground-level in the troposphere, ozone is the prime ingredient of smog. When inhaled, ozone can cause acute respiratory problems, aggravate asthma, cause significant temporary decreases in lung capacity, cause inflammation of lung tissue, impair the body's immune system defenses and lead to hospital admissions and emergency room visits.1 In addition, ground-level ozone ruptures the cells of green leaves, thereby interfering with the ability of plants to produce and store food, so that growth, reproduction and overall plant health are compromised. Generally, ozone is a secondary-formation pollutant in the troposphere. That is, ozone is not emitted directly into the air, but is formed from precursor gases called oxides of nitrogen (NOx) and volatile organic compounds (VOCs) that in the presence of heat and sunlight react to form ozone.1 Thus, ozone is generally an afternoon, summertime issue. Due to the process in which it is formed, however, high ozone levels typically do not occur in the area where the precursor gases are emitted, but may be a few to hundreds of miles away (depending on the meteorology). This means that ozone can be both a regional and a local concern. VOCs and NOx, the ozone precursor gases, are emitted from both man-made sources (i.e. combustion, oil and gas development, etc.) and natural sources (i.e. plants, forest fires, etc.). VOC’s that specifically can lead to ozone formation are generally called non-methane organic compounds (NMOCs) and do not include chlorinated compounds. In general, alkenes, aromatic hydrocarbons and carbonyls have a high ozone formation potential (higher incremental reactivity) while alkanes have a lower potential.2 NOx primarily consists of nitric oxide (NO) and nitrogen dioxide (NO2). NO2, like ozone, is designated as a “criteria” pollutant that has a health-based National Ambient Air Quality Standard (NAAQS). The NAAQS for ozone is set at a level of 0.08 parts per million for the three-year average of the annual fourth-maximum 8-hour values. However, the Clean Air Scientific Advisory Committee (CASAC) is currently recommending that the standard be reduced to a level in the range of 0.060 to 0.070 parts per million.3 The NAAQS for NO2 is set at 0.053 parts per million for an annual average. Existing ozone data for the Four Corners region: Ground level ozone is currently monitored on a continuous basis at nine locations in the Four Corners region, with seven sites being in a core area (see ozone sites maps). Two other sites in the region previously monitored for ozone. For regulatory comparisons to the NAAQS, continuous analyzers that have been designated as “equivalent’ or “reference” by the U.S. Environmental Protection Agency (EPA) are used. In Colorado, current monitoring is performed at Mesa Verde National Park, two Southern Ute Tribe sites and at the U.S. Forest Service (USFS) Shamrock site near Bayfield. In New Mexico, monitoring is performed at three New Mexico Environment Department (NMED) sites near the San Juan power plant, Bloomfield and Navajo Lake. A Navajo Nation site in Shiprock, NM is planned to commence operation by the end of 2007. The closest site in Arizona is located at Petrified Forest National Park and the closest site in Utah is at Canyonlands National Park. With the exception of the USFS Shamrock site, all of the data are available on EPA’s Air Quality System.4 Currently, ambient ozone levels in the Four Corners region are below the level of the current NAAQS (see trends and standards graphs). However, at Mesa Verde and one Southern Ute site there is an

Monitoring - Data Analysis and Recommendations 11/01/07
30
increasing trend, and the two newer sites (USFS, Navajo Lake) are recording higher levels. Many of the sites would be above the level of a reduced NAAQS, as proposed by CASAC. In addition, in 2003, EPA conducted a passive ozone monitoring study in the area as part of a Region 6 ozone gap study. Seven passive ozone monitoring sites were established in San Juan County in New Mexico.5 The data showed significantly high ozone concentrations in the western and northeastern areas of San Juan County, New Mexico, in addition to the high ozone concentrations already found in the north central area of the County.6
Pollutant roses were developed to help provide ideas on where ozone precursor sources may come from and where high ozone concentrations may be found. Pollutant roses, like wind roses, are a simple visual way to depict pollutant concentrations as a function of wind direction for a period of time. Pollutant roses are based on the direction that the wind is blowing from. Another way of visualizing a pollutant rose is to picture yourself standing in the center of the plot and facing into the wind. The wind direction is broken down in the 16 cardinal directions (i.e. N, NNE, NE, ENE, E, ESE, SE, SSE, S, etc). The pollutant concentration is broken down into multiple ranges. The length of each arm of the pollutant rose represents the percentage of time the wind was blowing from that direction. The longer the arm, the greater percentage of time the wind is blowing from that direction. Since the occurrence of pollutant concentrations of different ranges from a particular direction are stacked on the radius in order of increasing speeds, one must compare the length of each color to the distance between the percent circles to get the percent of time each range of pollutant concentration occurred. The circles representing the percent of time can vary from rose to rose hence each rose must be checked for the values. Pollutant roses can be generated by a number of commercially available software programs. For this analysis, WRPLOT View from Lakes Environmental Software was employed.8 With ozone typically having peak concentrations in the summer afternoons when sunlight is strongest, pollutant roses were developed accordingly and were placed on both political boundary and topographic base maps (see pollutant rose maps). As can be seen from these pollutant rose maps, ozone at the three southern core area sites in New Mexico and the Mesa Verde site in Colorado show predominantly westerly wind directions in this summer afternoon timeframe. This generally mirrors the predominant San Juan River drainage. The two Southern Ute Tribe sites and the Forest Service Shamrock site appear to be heavily influenced by local topography. Thus, based on these pollutant roses, it is likely that ozone concentrations could also be high further to the east and north of the New Mexico Navajo Lake site, further up the San Juan River and Piedra River drainages. While no monitoring exists to confirm or deny, winds could also flow up other drainages in summer afternoons, including the Dolores and Animas Rivers. For ozone precursor gases, NOx monitoring currently exists at six sites in the Four Corners region (see NO2 sites map), including two Southern Ute tribe sites and the USFS Shamrock site in Colorado, and three NMED sites. A Navajo Nation site in Shiprock, NM is scheduled to commence operation. Two other sites previously had NOx monitoring. NO2 levels have been fairly steady over the years at most sites, at a level well below the NAAQS (see NO2 trends graphs). At two sites in particular, San Juan Substation, NM and Bloomfield, NM, the NO2 levels do appear to be increasing over time. NO, unfortunately, has not been reported consistently as it is not designated a criteria pollutant. However, NO levels do appear to be increasing at both Southern Ute Tribe sites, Ignacio and Bondad (see NO trends graphs). These increases in NO and NO2 are of concern due to the potential for increased ozone formation and also indicates that there are increased combustion sources in the area, possibly due to oil and gas development and increased traffic. VOC baseline monitoring for San Juan County, New Mexico was conducted in 2004 and 2005 at three sites. One site was near Bloomfield, NM near some industrial sources, a second near the San Juan power plant and the third site was near Navajo Lake, in an oil and gas development area. Results showed that alkane concentrations dominated, especially ethane and propane.

Monitoring - Data Analysis and Recommendations 11/01/07
31
The biogenic compound isoprene and the highly reactive VOC compounds, ethylene and propylene, were not present in significant quantities.6,7
Data Gaps: While it would appear that there is a sufficient ozone monitoring network in the Four Corners region, some areas are lacking. Pollutant roses were developed to determine the directions from which ozone precursors are most likely to be transported by wind (see ozone pollutant roses). In general, for summer afternoon periods when ozone levels are expected to be highest, winds are generally from the west to southwest. Oil and gas development increased significantly after many of the current sites were installed. This development has provided a significant increase in both VOC and NOx precursor gas sources to the region. Ozone monitoring currently exists in the major oil and gas development areas, but little downwind ozone monitoring currently exists. VOCs are also a gap, as the short-term studies in 2004 and 2005 were located toward the southern edge of the oil and gas development area, or not in the development area at all. While emissions inventories can provide an estimate of total VOCs that may be released to the atmosphere, these are primarily based on predicted emissions, not on actual measurements. This is a concern as different VOCs have different ozone formation potentials and the oil and gas development has dramatically increased in the region since these studies. Suggestions for Future Monitoring Work: A. Install and operate two or three long-term continuous monitoring stations for ozone. One station
would be located upstream of Navajo Lake, in the San Juan River drainage toward Pagosa Springs, CO, or in the Piedra River drainage, toward Chimney Rock, CO. This area is toward the northeastern portion of the Four Corners region and is downwind of many VOC precursor gas sources from oil and gas development. The second station would be located to the north of Cortez. This area is in the north-central portion of the Four Corners region and is downwind of both an urban area and any precursor gas emissions that would funnel up between Sleeping Ute Mountain and Mesa Verde. If funding exists, a third site in Arizona on Navajo Nation land, in the southwest portion of the Four Corners area, is recommended. This site, possibly at Canyon de Chelly National Monument, would be to the west of a high ozone area as determined in the 2003 passive ozone study and would provide a good representation of regional ozone levels entering the Four Corners area. Each site, including shelter and instrumentation, would cost approximately $15,000 to $20,000 (total = $45,000 to $60,000). Annual operating costs (not including field personnel) would be approximately $1,500 per site (total = $3,000).
B. Perform an ozone saturation study using passive samplers across the entire Four Corners region to
determine areas of highest ozone concentration. This would help determine if existing or new continuous monitoring sites are located in appropriate areas or if continuous ozone monitors need to be added or moved. It is expected that at least 20 passive ozone sites over the four-state region would be needed. Running for 30 days during a summer, the approximate cost would be $22,000 (not including field personnel time).
(Note: In early July 2007, the Colorado legislature appropriated funding for passive ozone monitoring in Colorado. As a result, a short-term study was performed in three areas of Colorado at 50 locations. These areas included the north Front Range, central western and southwestern/Four Corners. For the southwestern area, 12 passive ozone sampling sites were operated from early August to early September 2007. While not a definitive study, funding is expected to be available in future years to perform more refined passive ozone monitoring.)
Monitoring - Data Analysis and Recommendations 11/01/07
32
C. Perform monitoring for VOCs (in particular NMOCs) and carbonyls in the oil and gas development areas to determine the actual constituents in the emissions from wellheads, leaks and tanks. This would help in determining the potential for ozone formation from these compounds. This suggestion also includes follow-up monitoring for VOCs, both in and near the oil and gas development area, to compare to the 2004 and 2005 baseline data from San Juan County, New Mexico. A minimum of four to five sites is recommended; two sites in the oil and gas development area, one background site and one or two follow-up sites. For a year of monitoring, every sixth day, the approximate cost (not including field personnel time) would be $45,000 per site (total = $180,000 to $225,000).
Literature Cited: A. U.S. Environmental Protection Agency. http://www.epa.gov/ttn/oarpg/naaqsfin/o3health.html. B. Carter, William. Development of Ozone Reactivity Scales for Volatile Organic Compounds. Journal
of the Air and Waste Management Association, vol. 44, p. 881-899. January 20, 1994. C. Henderson, Rogene. Clean Air Scientific Advisory Committee’s (CASAC) Peer Review of the
Agency’s 2nd Draft Ozone Staff Paper. EPA-CASAC-07-001. U.S. Environmental Protection Agency. October 24, 2006.
D. U.S. Environmental Protection Agency. http://www.epa.gov/air/data/index.html. E. Sather, Mark and Lister, Melody. Exploratory Data Analysis for the Filling Ozone Gaps in Regions
6/7 (FOGIR6/7) 2003 Study. U.S. EPA Region 6, Dallas, Texas. June 2, 2004. F. Sather, M.E. “Obtaining a Better Understanding of Ozone Air Pollution in the Four Corners Area via
Comprehensive Analyses of Ambient Air Monitoring Data”, Paper presented at the 98th Annual AWMA Conference and Exhibition, June 21-24, 2005, Minneapolis, Minnesota.
G. Sather, Mark, et. al. Update on Analysis of Ozone and Precursor (NOx and VOC) Monitoring Data in the Four Corners Area, and Passive Ammonia Monitoring Briefing. http://www.nmenv.state.nm.us/aqb/4C/Docs/fourcornersonva2.ppt. July 18, 2006.
H. Lakes Environmental Software. WRPLOT View. http://www.weblakes.com/lakewrpl.html.

Monitoring - Data Analysis and Recommendations 11/01/07
33
Four Corners --- Continuous Ozone Sites in 2006

Monitoring - Data Analysis and Recommendations 11/01/07
34
Close-in Four Corners --- Continuous Ozone Sites in 2006

Monitoring - Data Analysis and Recommendations 11/01/07
35
Four Corners --- Continuous Nitrogen Dioxide Sites in 2006

Monitoring - Data Analysis and Recommendations 11/01/07
36
Four Corners --- Ozone Trends (4th Maximum 8-Hour)
4-Corners --- Ozone --- 8-Hr. 4th Maximum
0.040
0.050
0.060
0.070
0.080
0.090
1990
1991
1992
1993
1994
1995
1996
1997
1998
1999
2000
2001
2002
2003
2004
2005
2006
Year
Part
s pe
r mill
ion
Bloomfield, NM Blanco-Navajo Res., NM San Juan Sub., NMCanyonlands, UT Petrified Forest (old), AZ Petrified Forest NP, AZ
Ozone --- Federal 8-Hr. 4th Max. Standard = 0.08 ppm
4-Corners --- Ozone --- 8-Hr. 4th Maximum
0.040
0.050
0.060
0.070
0.080
0.090
1990
1991
1992
1993
1994
1995
1996
1997
1998
1999
2000
2001
2002
2003
2004
2005
2006
Year
Part
s pe
r mill
ion
Ute-Ignacio, CO Ute-Red Mesa, CO Ute-Bondad, COMesa Verde, CO Shamrock Mine, CO
Ozone --- Federal 8-Hr. 4th Max. Standard = 0.08 ppm

Monitoring - Data Analysis and Recommendations 11/01/07
37

Monitoring - Data Analysis and Recommendations 11/01/07
38
Four Corners --- Ozone Standard (3-Year Avg. of 4th Max. 8-Hour)
Ozone --- 3-Year Avg. of 4th Max. 8-Hr.
0.0500.0550.0600.0650.0700.0750.0800.0850.090
1990
-199
2
1991
-199
3
1992
-199
4
1993
-199
5
1994
-199
6
1995
-199
7
1996
-199
8
1997
-199
9
1998
-200
0
1999
-200
1
2000
-200
2
2001
-200
3
2002
-200
4
2003
-200
5
2004
-200
6
3-Year Period
Part
s pe
r mill
ion
Ute-Ignacio, CO Ute-Red Mesa, CO Ute-Bondad, COMesa Verde, CO Shamrock Mine, CO
Federal 8-Hr. 4th Max. Standard = 0.08 ppm
Ozone --- 3-Year Avg. of 4th Max. 8-Hr.
0.0500.0550.0600.0650.0700.0750.0800.0850.090
1990
-199
2
1991
-199
3
1992
-199
4
1993
-199
5
1994
-199
6
1995
-199
7
1996
-199
8
1997
-199
9
1998
-200
0
1999
-200
1
2000
-200
2
2001
-200
3
2002
-200
4
2003
-200
5
2004
-200
6
3-Year Period
Part
s pe
r mill
ion
Bloomfield, NM Blanco-Navajo Res., NM San Juan Sub., NMCanyonlands, UT Petrified Forest (old), AZ Petrified Forest NP, AZ
Federal 8-Hr. 4th Max. Standard = 0.08 ppm

Monitoring - Data Analysis and Recommendations 11/01/07
39
Four Corners --- Nitrogen Dioxide Trends
4-Corners --- NO2 --- 1-Hr. Maximum
0.000
0.020
0.040
0.060
0.08019
90
1991
1992
1993
1994
1995
1996
1997
1998
1999
2000
2001
2002
2003
2004
2005
2006
Year
Part
s pe
r mill
ion
Ute-Ignacio, CO Ute-Red Mesa, CO Ute-Bondad, COShamrock Mine, CO Bloomfield, NM Kirtland, NMBlanco-Navajo Res., NM San Juan Sub., NM
4-Corners --- NO2 --- Annual Average
0.0000
0.0040
0.0080
0.0120
0.0160
0.0200
1990
1991
1992
1993
1994
1995
1996
1997
1998
1999
2000
2001
2002
2003
2004
2005
2006
Year
Part
s pe
r mill
ion
Ute-Ignacio, CO Ute-Red Mesa, CO Ute-Bondad, COShamrock Mine, CO Bloomfield, NM Kirtland, NMBlanco-Navajo Res., NM San Juan Sub., NM
NO2 --- Federal Annual Average Standard = 0.053 ppm

Monitoring - Data Analysis and Recommendations 11/01/07
40
Four Corners --- Nitric Oxide Trends
4-Corners --- NO --- 1-Hr. Maximum
0.000
0.100
0.200
0.300
0.400
1990
1991
1992
1993
1994
1995
1996
1997
1998
1999
2000
2001
2002
2003
2004
2005
2006
Year
Part
s pe
r mill
ion
Ute-Ignacio, CO Ute-Red Mesa, CO Ute-Bondad, COShamrock Mine, CO Bloomfield, NM Kirtland, NMBlanco-Navajo Res., NM San Juan Sub., NM
No Federal Standard
4-Corners --- NO --- Annual Average
0.0000
0.0030
0.0060
0.0090
0.0120
1990
1991
1992
1993
1994
1995
1996
1997
1998
1999
2000
2001
2002
2003
2004
2005
2006
Year
Part
s pe
r mill
ion
Ute-Ignacio, CO Ute-Red Mesa, CO Ute-Bondad, COShamrock Mine, CO Bloomfield, NM Kirtland, NMBlanco-Navajo Res., NM San Juan Sub., NM
No Federal Standard

Monitoring - Data Analysis and Recommendations 11/01/07
41
Overall Four Corners --- Summer Afternoon Ozone Pollution Roses (2006)

Monitoring - Data Analysis and Recommendations 11/01/07
42
Close-in Four Corners --- Summer Afternoon Ozone Pollution Roses (2006) (Political boundary map)

Monitoring - Data Analysis and Recommendations 11/01/07
43
Close-in Four Corners --- Summer Afternoon Ozone Pollution Roses (2006) (Topographic map)

Monitoring - Data Analysis and Recommendations 11/01/07
44
Carbon Monoxide, Particulates and Other Common Pollutants Background: Rationale and Benefits: Carbon monoxide, or CO, is a colorless, odorless gas that is formed when carbon in fuel is not burned completely. It is a component of motor vehicle exhaust, which contributes about 56 percent of all CO emissions nationwide. Other non-road engines and vehicles (such as construction equipment and boats) contribute about 22 percent of all CO emissions nationwide. Higher levels of CO generally occur in areas with heavy traffic congestion. In cities, 85 to 95 percent of all CO emissions may come from motor vehicle exhaust. Other sources of CO emissions include industrial processes (such as metals processing and chemical manufacturing), residential wood burning, and natural sources such as forest fires. Woodstoves, gas stoves, cigarette smoke, and unvented gas and kerosene space heaters are sources of CO indoors. The highest levels of CO in the outside air typically occur during the colder months of the year when inversion conditions are more frequent.1
Carbon monoxide can cause harmful health effects by reducing oxygen delivery to the body's organs (like the heart and brain) and tissues. This results in cardiovascular and/or central nervous system effects, such as chest pains, vision problems and reduced ability to work or exercise.1 The health-based National Ambient Air Quality Standard (NAAQS) for carbon monoxide is set at a level of 35 parts per million for a one-hour average and 9 parts per million for an eight-hour average.2 Particulates are broken into two categories for NAAQS: PM10, which is particulate matter that is 10-microns in diameter and smaller, and PM2.5, which is particulate matter 2.5 microns in diameter and smaller. Thus, PM2.5 is a subset of PM10. Particulates are an inhalable mixture of solid particles and liquid droplets found in the air. Some particles, such as dust, dirt, soot, or smoke, are large or dark enough to be seen with the naked eye. Others are so small, they can only be detected using an electron microscope. These particles come in many sizes and shapes and can be made up of hundreds of different chemicals. Some particles, known as primary particles are emitted directly from a source, such as construction sites, unpaved roads, fields, smokestacks or fires. Others form in complicated reactions in the atmosphere of chemicals such as sulfur dioxides and nitrogen oxides that are emitted from power plants, industries and automobiles. These particles, known as secondary particles, make up most of the fine particle pollution in the country.3 Particle pollution, especially fine particles, contains microscopic solids or liquid droplets that are so small that they can get deep into the lungs and cause serious health problems. Numerous scientific studies have linked particle pollution exposure to a variety of problems, including increased respiratory symptoms (such as irritation of the airways, coughing, or difficulty breathing), decreased lung function, aggravated asthma, development of chronic bronchitis, irregular heartbeat, nonfatal heart attacks and premature death in people with heart or lung disease.3 The health-based NAAQS for PM10 is set at a level of 150 micrograms per cubic meter for a 24-hour average. For PM2.5, the health-based NAAQS are set at levels of 35 micrograms per cubic meter for a 24-hour average and 15 micrograms per cubic meter for an annual average.2 Other common pollutants in the ambient air that are not covered in other option papers may include lead, carbon dioxide, organic compounds/hazardous air pollutants (HAPs), pesticides, and others. Of these, only lead has a health-based NAAQS, which is 1.5 micrograms per cubic meter for a calendar quarter average.2
Monitoring - Data Analysis and Recommendations 11/01/07
45
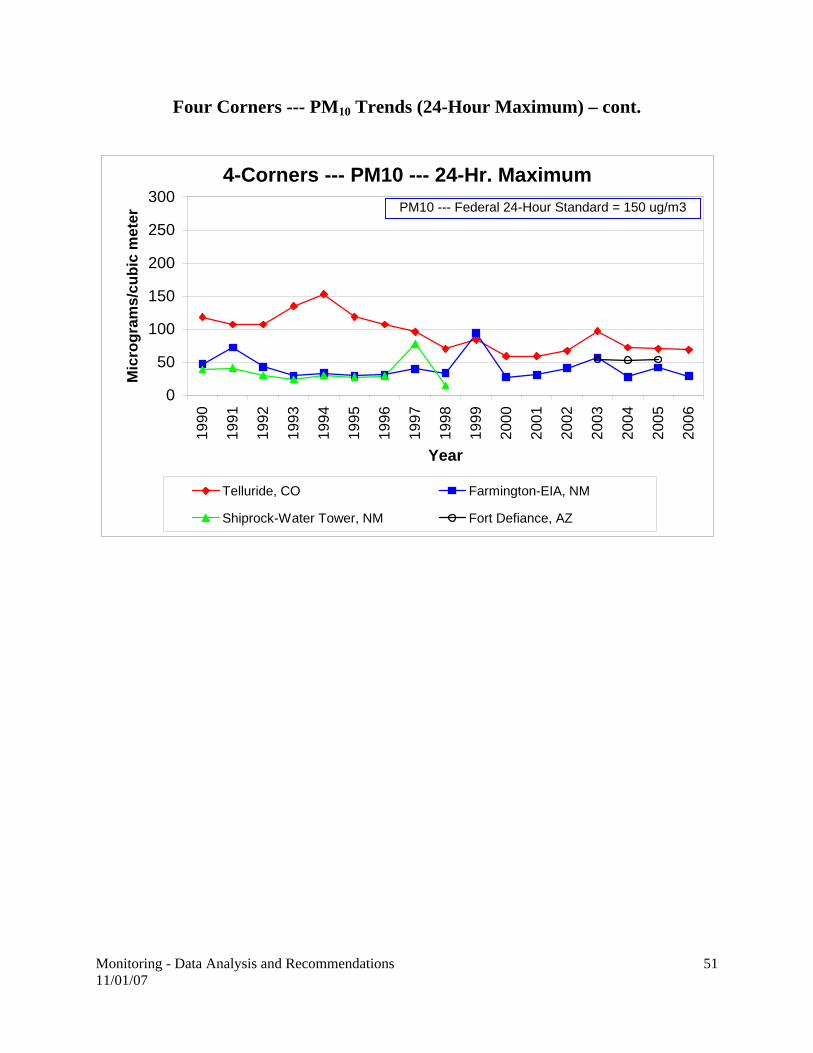
Lead is primarily emitted from metals processing or waste incinerator sources. Historically, leaded automobile fuels were the primary source.4 Lead is typically associated with neurological impairment. Carbon dioxide is emitted from a variety of natural and human-related sources. With implications as a greenhouse gas rather than health concerns, the largest man-made source of carbon dioxide, by far, is fossil fuel combustion.5 Organic compounds can be both toxic and non-toxic in nature. Toxic air pollutants, also known as hazardous air pollutants, are those pollutants that are known or suspected to cause cancer or other serious health effects, such as reproductive effects or birth defects, or adverse environmental effects. These compounds can come from a variety of sources, though primarily from industrial or mobile (i.e. motor vehicle) source. Thus, they are typically associated with urban areas.6 The U.S. Environmental Protection Agency currently lists 188 HAPs for which it would like to reduce atmospheric releases/emissions. While no ambient standards currently exist for these pollutants, workplace standards do exist for some of them. Pesticides are substances or mixture of substances intended for preventing, destroying, repelling, or mitigating any pest.7 While all regulated pesticides have been tested for health impacts to humans, exposures can and do occur from improper use. Existing data for the Four Corners region: Carbon monoxide in the ambient air is currently monitored on a continuous basis at only one site in the Four Corners region. This is at the Southern Ute Tribe’s Ignacio site in southern Colorado. Monitoring was performed at New Mexico’s Farmington site, but was discontinued in 2000. (See the CO site locations map.) All of the data are available on EPA’s Air Quality System.8 Ambient carbon monoxide levels in the Four Corners region are well below the level of the current NAAQS (see the CO trends and standards graph). Carbon monoxide levels nationwide are now very low due in large part to improved vehicle technology and emissions controls. PM10 in the ambient air is, historically, the most heavily monitored pollutant in the Four Corners region. (See the PM10 site locations map.) Most of the monitoring has been performed using filter-based “high-volume” samplers that collect 24-hour samples and most of the data are available on EPA’s Air Quality System.8 Ambient PM10 levels in the Four Corners region are well below the level of the current and former NAAQS (see the PM10 trends graphs). As a result, some of the monitors were shut down at the end of 2006. PM2.5 in the ambient air has also been monitored at a number of locations in Four Corners region. (See the PM2.5 site locations map.) Most of the monitoring has been performed using filter-based “low-volume” samplers that collect 24-hour samples and most of the data are available on EPA’s Air Quality System.8 Ambient PM2.5 levels in the Four Corners region are well below the levels of the current NAAQS for both the 24-hour average and annual averages (see the PM2.5 trends graphs). PM2.5 has also been monitored as part of the IMPROVE network. These data are not on EPA’s Air Quality System but may be obtained on the IMPROVE website.9 No monitoring for lead exists in the Four Corners region. Due to the introduction of unleaded gasoline in the 1970’s, ambient lead levels have decreased to levels that are near instrument detection levels. Likewise, no monitoring exists for other pollutants such as carbon dioxide, HAPs or pesticides. While carbon dioxide is a greenhouse gas and is emitted from combustion sources, it is not considered to be toxic at typical ambient concentrations. Thus, there has been no specific reason for monitoring and no standards exist. No standards currently exist for organic compounds, including HAPs (such as volatile and semi-volatile organic compounds) and pesticides. Much of the monitoring for these compounds has been performed in urban areas where concentrations are expected to be higher, particularly for the HAPs, and more people are at risk for exposure. Several pilot and trends studies are currently underway across the nation, but the cost is very high for routine monitoring. Volatile organic compound baseline monitoring for San Juan County, New Mexico was conducted in 2004 and 2005 at three sites by the U.S.

Monitoring - Data Analysis and Recommendations 11/01/07
46
Environmental Protection Agency (EPA) Region 6. This study was primarily for ozone precursor organic compounds rather than for overall HAPs.10,11
Data Gaps: Due to the very low levels of carbon monoxide, PM10 and PM2.5 at existing or former air monitoring sites and at other surrounding areas, there is not expected to be any areas of the Four Corners region that need additional monitoring of these threeo pollutants to demonstrate NAAQS compliance. While there has been no monitoring for lead in the Four Corners region, the low levels that are seen nationwide and the lack of sources in the area indicate that no monitoring is likely to be needed. There is no NAAQS for carbon dioxide, so on a health basis, no monitoring is needed. With organic compounds/HAPs and pesticides, there is little data for the area that exists. However, based on monitoring that is being performed nationwide in EPA’s National Air Toxics Trends Study, there are not expected be concentrations that are much different from other areas. Due to the expense of monitoring, other areas would probably suffice as a surrogate. In addition, there are no significant major sources of HAPs in the region to warrant ambient monitoring. As part of “Ozone and Precursor Gases” suggestions, volatile organic compound/non-methane organic compound monitoring is being recommended. Pesticides may be a health issue for the agricultural population. This would lead to specific investigations rather than ambient monitoring sites. Suggestions for Future Monitoring Work: No suggestions for additional monitoring of carbon monoxide, PM10, PM2.5 and other common pollutants are currently being proposed. Literature Cited: A. U.S. Environmental Protection Agency. http://www.epa.gov/air/urbanair/co/index.html. B. U.S. Environmental Protection Agency. http://epa.gov/air/criteria.html. C. U.S. Environmental Protection Agency. http://www.epa.gov/air/particlepollution/index.html. D. U.S. Environmental Protection Agency. http://www.epa.gov/air/urbanair/lead/index.html . E. U.S. Environmental Protection Agency. http://www.epa.gov/climatechange/emissions/co2.html. F. U.S. Environmental Protection Agency. http://www.epa.gov/ttn/atw/allabout.html. G. U.S. Environmental Protection Agency. http://www.epa.gov/pesticides/about/index.htm. H. U.S. Environmental Protection Agency. http://www.epa.gov/air/data/index.html. I. Interagency Monitoring of Protected Visual Environments.
http://vista.cira.colostate.edu/improve/Data/IMPROVE/improve_data.htm. J. Sather, M.E. “Obtaining a Better Understanding of Ozone Air Pollution in the Four Corners Area via
Comprehensive Analyses of Ambient Air Monitoring Data”, Paper presented at the 98th Annual AWMA Conference and Exhibition, June 21-24, 2005, Minneapolis, Minnesota.
K. Sather, Mark, et. al. Update on Analysis of Ozone and Precursor (NOx and VOC) Monitoring Data in the Four Corners Area, and Passive Ammonia Monitoring Briefing. http://www.nmenv.state.nm.us/aqb/4C/Docs/fourcornersonva2.ppt. July 18, 2006.

Monitoring - Data Analysis and Recommendations 11/01/07
47
Four Corners --- Continuous Carbon Monoxide Sites in 2006

Monitoring - Data Analysis and Recommendations 11/01/07
48
Four Corners --- Particulate Sites in 2006

Monitoring - Data Analysis and Recommendations 11/01/07
49
Four Corners --- Carbon Monoxide Trends (1-Hour and 8-Hour)
4-Corners --- Carbon Monoxide --- 1-Hr. and 8-Hr. Max.
0.0
2.0
4.0
6.0
8.0
10.0
12.019
90
1991
1992
1993
1994
1995
1996
1997
1998
1999
2000
2001
2002
2003
2004
2005
2006
Year
Part
s pe
r mill
ion
1-hour Maximum --- Ute-Ignacio, CO 1-Hour Maximum --- Farmington, NM
8-Hour Maximum --- Ute-Ignacio, CO 8-Hour Maximum --- Farmington, NM
Carbon Monoxide --- Federal 1-Hr. Standard = 35 ppmCarbon Monoxide --- Federal 8-Hr. Standard = 9 ppm

Monitoring - Data Analysis and Recommendations 11/01/07
50
Four Corners --- PM10 Trends (24-Hour Maximum)
4-Corners --- PM10 --- 24-Hr. Maximum
0
50
100
150
200
250
30019
90
1991
1992
1993
1994
1995
1996
1997
1998
1999
2000
2001
2002
2003
2004
2005
2006
Year
Mic
rogr
ams/
cubi
c m
eter
Pagosa Spgs.-School, CO Pagosa Spgs.-Municipal, CODurango-River City, CO Durango-Platform, CODurango-School, CO
PM10 --- Federal 24-Hour Standard = 150 ug/m3
4-Corners --- PM10 --- 24-Hr. Maximum
0
50
100
150
200
250
300
1990
1991
1992
1993
1994
1995
1996
1997
1998
1999
2000
2001
2002
2003
2004
2005
2006
Year
Mic
rogr
ams/
cubi
c m
eter
Durango-Tradewinds, CO Durango-Cutler, CODurango-Grandview, CO Durango-Courthouse, COUte-Ignacio, CO Ute-Bondad, CO
PM10 --- Federal 24-Hour Standard = 150 ug/m3
Monitoring - Data Analysis and Recommendations 11/01/07
51
Four Corners --- PM10 Trends (24-Hour Maximum) – cont.
4-Corners --- PM10 --- 24-Hr. Maximum
0
50
100
150
200
250
30019
90
1991
1992
1993
1994
1995
1996
1997
1998
1999
2000
2001
2002
2003
2004
2005
2006
Year
Mic
rogr
ams/
cubi
c m
eter
Telluride, CO Farmington-EIA, NM
Shiprock-Water Tower, NM Fort Defiance, AZ
PM10 --- Federal 24-Hour Standard = 150 ug/m3

Monitoring - Data Analysis and Recommendations 11/01/07
52
Four Corners --- PM10 Trends (Annual average)
4-Corners --- PM10 --- Annual Average
0.0
10.0
20.0
30.0
40.0
50.0
1990
1991
1992
1993
1994
1995
1996
1997
1998
1999
2000
2001
2002
2003
2004
2005
2006
Year
Mic
rogr
ams/
cubi
c m
eter
Pagosa Spgs.-School, CO Pagosa Spgs.-Municipal, CODurango-River City, CO Durango-Platform, CODurango-School, CO
PM10 --- Former Federal Annual Avg. Standard = 50 ug/m3
4-Corners --- PM10 --- Annual Average
0.0
10.0
20.0
30.0
40.0
50.0
1990
1991
1992
1993
1994
1995
1996
1997
1998
1999
2000
2001
2002
2003
2004
2005
2006
Year
Mic
rogr
ams/
cubi
c m
eter
Durango-Tradewinds, CO Durango-Cutler, CODurango-Grandview, CO Durango-Courthouse, COUte-Ignacio, CO Ute-Bondad, CO
PM10 --- Former Federal Annual Avg. Standard = 50 ug/m3

Monitoring - Data Analysis and Recommendations 11/01/07
53
Four Corners --- PM10 Trends (Annual average) – cont.
4-Corners --- PM10 --- Annual Average
0.0
10.0
20.0
30.0
40.0
50.0
1990
1991
1992
1993
1994
1995
1996
1997
1998
1999
2000
2001
2002
2003
2004
2005
2006
Year
Mic
rogr
ams/
cubi
c m
eter
Telluride, CO Farmington-EIA, NM
Shiprock-Water Tower, NM Fort Defiance, AZ
PM10 --- Former Federal Annual Avg. Standard = 50 ug/m3

Monitoring - Data Analysis and Recommendations 11/01/07
54
Four Corners --- PM2.5 Trends (24-Hour Maximum)
Four Corners --- PM2.5 Trends (Annual average)
4-Corners --- PM2.5 --- 24-Hr. Maximum
0.0
20.0
40.0
60.0
1999
2000
2001
2002
2003
2004
2005
2006
Year
Mic
rogr
ams/
cubi
c m
eter
Durango-Park School, CO Pagosa Spgs.-School, COPagosa Spgs.-Municipal, CO Telluride, COFarmington, NM Blanco-Navajo Res., NM
PM2.5 --- Federal 24-Hour Standard = 35 ug/m 3 (form er = 65 ug/m 3)
4-Corners --- PM2.5 --- Annual Average
0.00
2.00
4.00
6.00
8.00
10.00
1999
2000
2001
2002
2003
2004
2005
2006
Year
Mic
rogr
ams/
cubi
c m
eter
Durango-Park School, CO Pagosa Spgs.-School, COPagosa Spgs.-Municipal, CO Telluride, COFarmington, NM Blanco-Navajo Res., NM
PM2.5 --- Federal Annual Average Standard = 15 ug/m 3
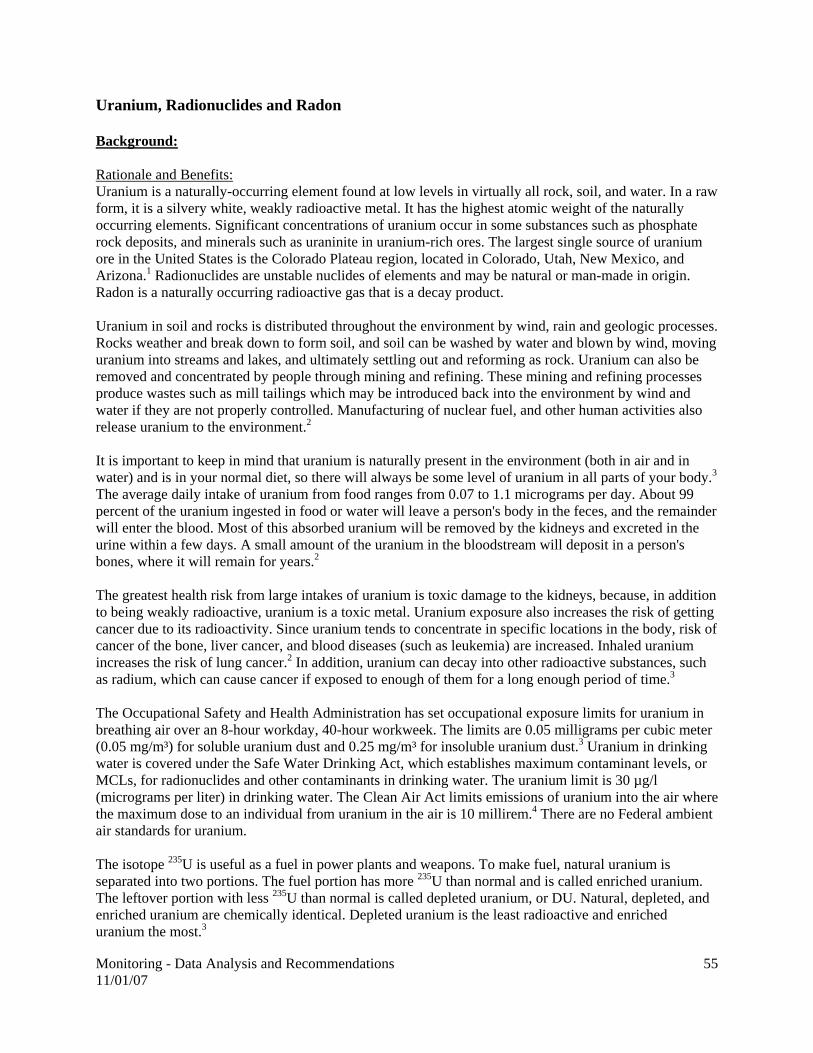
Monitoring - Data Analysis and Recommendations 11/01/07
55
Uranium, Radionuclides and Radon Background: Rationale and Benefits: Uranium is a naturally-occurring element found at low levels in virtually all rock, soil, and water. In a raw form, it is a silvery white, weakly radioactive metal. It has the highest atomic weight of the naturally occurring elements. Significant concentrations of uranium occur in some substances such as phosphate rock deposits, and minerals such as uraninite in uranium-rich ores. The largest single source of uranium ore in the United States is the Colorado Plateau region, located in Colorado, Utah, New Mexico, and Arizona.1 Radionuclides are unstable nuclides of elements and may be natural or man-made in origin. Radon is a naturally occurring radioactive gas that is a decay product. Uranium in soil and rocks is distributed throughout the environment by wind, rain and geologic processes. Rocks weather and break down to form soil, and soil can be washed by water and blown by wind, moving uranium into streams and lakes, and ultimately settling out and reforming as rock. Uranium can also be removed and concentrated by people through mining and refining. These mining and refining processes produce wastes such as mill tailings which may be introduced back into the environment by wind and water if they are not properly controlled. Manufacturing of nuclear fuel, and other human activities also release uranium to the environment.2 It is important to keep in mind that uranium is naturally present in the environment (both in air and in water) and is in your normal diet, so there will always be some level of uranium in all parts of your body.3 The average daily intake of uranium from food ranges from 0.07 to 1.1 micrograms per day. About 99 percent of the uranium ingested in food or water will leave a person's body in the feces, and the remainder will enter the blood. Most of this absorbed uranium will be removed by the kidneys and excreted in the urine within a few days. A small amount of the uranium in the bloodstream will deposit in a person's bones, where it will remain for years.2 The greatest health risk from large intakes of uranium is toxic damage to the kidneys, because, in addition to being weakly radioactive, uranium is a toxic metal. Uranium exposure also increases the risk of getting cancer due to its radioactivity. Since uranium tends to concentrate in specific locations in the body, risk of cancer of the bone, liver cancer, and blood diseases (such as leukemia) are increased. Inhaled uranium increases the risk of lung cancer.2 In addition, uranium can decay into other radioactive substances, such as radium, which can cause cancer if exposed to enough of them for a long enough period of time.3 The Occupational Safety and Health Administration has set occupational exposure limits for uranium in breathing air over an 8-hour workday, 40-hour workweek. The limits are 0.05 milligrams per cubic meter (0.05 mg/m³) for soluble uranium dust and 0.25 mg/m³ for insoluble uranium dust.3 Uranium in drinking water is covered under the Safe Water Drinking Act, which establishes maximum contaminant levels, or MCLs, for radionuclides and other contaminants in drinking water. The uranium limit is 30 µg/l (micrograms per liter) in drinking water. The Clean Air Act limits emissions of uranium into the air where the maximum dose to an individual from uranium in the air is 10 millirem.4 There are no Federal ambient air standards for uranium. The isotope 235U is useful as a fuel in power plants and weapons. To make fuel, natural uranium is separated into two portions. The fuel portion has more 235U than normal and is called enriched uranium. The leftover portion with less 235U than normal is called depleted uranium, or DU. Natural, depleted, and enriched uranium are chemically identical. Depleted uranium is the least radioactive and enriched uranium the most.3

Monitoring - Data Analysis and Recommendations 11/01/07
56
Due to concerns on foreign oil dependence and global warming, renewed interest is being shown in nuclear power generation. The Colorado Plateau, as noted above, has a high concentration of uranium ore. As a result, there is increasing interest in the area for both uranium mining and milling. Of particular concern are milling operations where the mill tailings are rich in the chemicals and radioactive materials that were not removed. In the milling process, the ore is crushed and sent through an extraction processes to concentrate the uranium into uranium-oxygen compounds called yellowcake. The remainder of the crushed rock, in a processing fluid slurry, is placed in a tailings pile.5 The most important radioactive component of uranium mill tailings is radium, which decays to produce radon. The radium in these tailings will not decay entirely for thousands of years. Other potentially hazardous substances in the tailings are selenium, molybdenum, uranium, and thorium.4 In the Four Corners area, there is currently one operating uranium mill, located near Blanding Utah. A mill has also been proposed near Naturita in western Colorado. Mining operations have also been proposed in San Miguel County in Colorado. This has led to concerns over potentially increased exposures to radionuclides, radon and contaminated dusts from both mills/tailings piles and mines. Immediate concerns would be to the general public in the immediate vicinity of these facilities/operations. However, there are also concerns over longer range air transport of radionuclides, radon and contaminated dusts for the region, especially as the number of these facilities/operations may increase significantly. Existing uranium data for the Four Corners region: Currently, little current ambient air monitoring data exists for uranium in the Four Corners region. Neither the States of Colorado nor Utah are currently performing any monitoring around uranium mining or milling operations. From historical mining and milling, total suspended particulate and radionuclide data exist from private monitoring. As part of National Emissions Standards for Hazardous Air Pollutant regulations (through the U.S. Environmental Protection Agency), monitoring is required to be performed to assess and limit emissions of radon and radionuclides from mines, mills and tailings.6 U.S. Nuclear Regulatory Commission guidelines call for both onsite and offsite particulate monitoring for radionuclides, radon monitoring and meteorological monitoring at uranium mills. This monitoring is required both prior to operation and during operation. Data Gaps: While little ambient air monitoring data exists for uranium mine and milling operations/facilities, emissions monitoring and modeling is required under National Emissions Standards for Hazardous Air Pollutant regulations. Ambient air monitoring is required under Nuclear Regulatory Commission guidelines. Based on this, it is expected that uranium, radionuclide and radon emissions from these facilities/operations is low and should pose no threat to the general public either locally or at a distance. However, as additional facilities become operational, the overall uranium, radionuclide and radon emissions in the Four Corners area will increase and may be significant. Recommendations: No recommendations for additional ambient air monitoring of uranium, radionuclides or radon are currently being proposed. However, as uranium mining and milling activities in the Four Corners region increase, this topic may need to be revisited. Literature Cited: 1. Wikipedia Free Encyclopedia. http://en.wikipedia.org/wiki/Uranium.

Monitoring - Data Analysis and Recommendations 11/01/07
57
2. U.S. Environmental Protection Agency. Radiation Information: Uranium. http://www.epa.gov/radiation/radionuclides/uranium.htm.
3. Agency for Toxic Substances and Disease Registry. ToxFAQS for Uranium. http://www.atsdr.cdc.gov/tfacts150.html.
4. U.S. Environmental Protection Agency. Uranium Mill Tailings. http://www.epa.gov/radiation/docs/radwaste/402-k-94-001-umt.htm.
5. U.S. Nuclear Regulatory Commission. Fact Sheet on Uranium Mill Tailings. August 2006. http://www.nrc.gov/reading-rm/doc-collections/fact-sheets/mill-tailings.html.
6. U.S. Environmental Protection Agency. Rad NESHAPs. http://www.epa.gov/radiation/neshaps/index.html.

Monitoring - Data Analysis and Recommendations 11/01/07
58
Mercury Background: Rationale and Benefits: Methyl mercury is a known neurotoxin affecting humans and wildlife. Coal-fired power plants are the number one source of mercury emissions in the United States1. The Four Corners already is home to several power plants that are large emitters of mercury and additional coal-powered plants are proposed for the region. Individuals and community groups in the Four Corners region have expressed great concern about mercury emissions in our region and the existing mercury fish consumption advisories in several reservoirs. Studies of mercury in air deposition, the environment and in sensitive human populations (such as pregnant women) are necessary to set a baseline for current levels and to detect future impacts of increased mercury emissions on these sensitive human populations and natural resources, including the Weminuche Wilderness and Mesa Verde National Park, which are both Federal Class I Areas. Existing mercury data for the Four Corners region: Total mercury in wet deposition has been monitored at Mesa Verde National Park since 2002 as part of the Mercury Deposition Network (MDN)(Figure 1)2. Results show mercury concentrations among the highest in the nation during certain years. Precipitation is relatively low, however, so mercury in wet deposition is moderate (Figure 3)2. Mercury concentrations have been measured in snowpack at a few sites in the San Juan Mountains by the USGS and moderate concentrations similar to the Colorado Front Range have been recorded3. Mercury concentrations in sport fish from several reservoirs have exceeded the 0.5 microg/g action level resulting in mercury fish consumption advisories for water bodies including McPhee, Narraguinnep, Todden, Navajo, Sanchez and Vallecito Reservoirs and segments of the San Juan River (Figure 4)4. Sediment core analysis for Narraguinnep Reservoir show that mercury fluxes increased by approximately a factor of two after about 19705. Finally, atmospheric deposition just to the surface of McPhee and Narraguinnep Reservoirs (i.e., not including air deposition to the rest of the watershed) is estimated to contribute 8.2% and 47.1% of total mercury load to these water bodies, respectively6. Data Gaps: Very little data exists for the Four Corners Region with which to assess current risks and trends over time for mercury in air deposition, ecosystems, and sensitive human populations. No data exists for mercury in deposition at high elevations. Wet deposition of mercury at Mesa Verde National Park may not portray the situation in the mountains where mercury may be deposited at higher concentrations and total amounts because of greater rates of precipitation and the process of cold condensation, which causes volatile compounds to migrate towards colder areas at high elevation and latitude7. No information about total mercury deposition from the atmosphere (i.e., including dry deposition) exists for low or high elevations in the Four Corners Region. Furthermore, analysis of sources of air deposition of mercury is lacking. Except for a handful of reservoirs, no information exists for incorporation of mercury into aquatic ecosystems and subsequent effects on food-webs. No systematic effort exists to document mercury impacts in a wide range of water bodies over space and time. Lastly, impacts of mercury exposure to human populations are unknown. Three new studies have begun or will begin in 2007, however. The Mountain Studies Institute (MSI) will measure total mercury in bulk atmospheric deposition (collector near NADP station at Molas Pass, 10, 659 ft. elevation), in lake zooplankton (invertebrates eaten by fish), and in lake sediment cores in the San Juan Mountains, a project funded by the U.S. EPA and USFS8. Dr. Richard Grossman is measuring mercury levels in hair collected from pregnant women in the Durango vicinity. Lastly, the Pine River Watershed Group (via the San Juan RC&D) recently was granted start-up funds from La Plata County to initiate event-based sampling of mercury in atmospheric deposition at Vallecito Reservoir and accompanying back-trajectory analyses to locate the source of these storm events.

Monitoring - Data Analysis and Recommendations 11/01/07
59
Suggestions for Future Monitoring Work: 1. Install and operate a long-term monitoring station for mercury in wet deposition for a location at high
elevation where precipitation amounts are greater than the site at Mesa Verde NP. Co-location of the collector with the NADP site at Molas Pass would provide data pertinent to Weminuche Wilderness and the headwaters of Vallecito Reservoir. This monitor would be part of the Mercury Deposition Network (MDN). Upgrading the NADP monitoring equipment at Molas Pass to include the MDN specifications would cost $5,000 to $6,000, while annual monitoring costs are $12,112 plus personnel as of September 2006.
2. Install and operate a long-term monitoring station for mercury in total deposition (wet and dry) for at
least one MDN station in the Four Corners Region. Speciated data will be collected and analyzed as is feasible. The MDN is currently developing this program and costs are anticipated at about $50,000 per year.
3. Support multi-year comprehensive mercury source apportionment study to investigate the impact of
local and regional coal combustion sources on atmospheric mercury deposition. This type of study would require additional deposition monitoring (i.e., suggestions 1 & 2 above). Speciated data will be collected and analyzed as is feasible. A mercury monitoring and source apportionment study was recently completed for eastern Ohio. (http://pubs.acs.org/cgi-bin/asap.cgi/esthag/asap/html/es060377q.html9). Costs TBD.
Support a study of mercury incorporation and cycling in aquatic ecosystem food-webs, including total and methyl mercury in the food-webs of lakes and wetlands. This option includes studies that determine which ecosystems currently have high levels of total and methyl mercury in food-web components, how mercury levels in ecosystems change over time, where the mercury is coming from, and what conditions are causing the mercury to become methylated (the toxic form of mercury that bio-accumulates in food-webs). This information would allow tracking of mercury risks over time and space and serves as the basis for predicting future impacts. Existing reservoir studies and the upcoming MSI investigation serve as a starting point to build a collaborative and systematic approach. Costs TBD. Support continued studies of mercury concentrations in sensitive human populations in the region to understand what exposure factors increase likelihood of unhealthy mercury levels in the body. Dr. Richard Grossman’s study serves as a starting point to continue this effort. Costs TBD. Form a multi-partner Mercury Advisory Committee that would work collaboratively to prioritize research and monitoring needs, develop funding mechanisms to sustain long-term mercury studies, and work to communicate study findings to decision-makers. The Committee would include technical experts and stakeholder representatives from States, local governments, land management agencies, watershed groups, the energy industry, etc. Literature Cited: 1. See http://www.epa.gov/mercury/about.htm. 2. National Atmospheric Deposition Program (NADP). Mercury Deposition Network
http://nadp.sws.uiuc.edu/mdn/. National Trends Network. http://nadp.sws.uiuc.edu/. 3. Campbell, D, G Ingersoll, A Mast and 7 Others. Atmospheric deposition and fate of mercury in high-
altitude watersheds in western North America. Presentation at the Western Mercury Workshop. Denver, CO. April 21, 2003.

Monitoring - Data Analysis and Recommendations 11/01/07
60
4. Colorado Department of Public Health and Environment website: http://www.cdphe.state.co.us/wq/FishCon/FishCon.html, http://www.cdphe.state.co.us/wq/FishCon/analyses/index.html.
a. New Mexico Environment Department website: http://www.nmenv.state.nm.us/swqb/advisories/GuidelinesFebruary2001-Mercury.pdf.
5. Gray, JE, DL Fey, CW Holmes, BK Lasorsa. 2005. Historical deposition and fluxes of mercury in Narraquinnep Reservoir, southwestern Colorado, USA. Applied Geochemistry 20: 207-220.
6. Colorado Department of Public Health (CDPHE). 2003. Total Maximum Daily Load for Mercury in McPhee and Narraguinnep Reservoirs, Colorado: Phase I. Water Quality Control Division. Denver, CO. http://www.epa.gov/waters/tmdldocs/Mcphee-NarraguinnepTMDLfinaldec.pdf.
7. Schindler, D. 1999. From acid rain to toxic snow. Ambio 28: 350-355 8. See http://www.mountainstudies.org/Research/airQuality.htm. 9. See http://pubs.acs.org/cgi-bin/asap.cgi/esthag/asap/html/es060377q.html

Monitoring - Data Analysis and Recommendations 11/01/07
61
Figures
Figure 1. Concentrations and wet deposition of mercury at Mesa Verde National Park, 2002-2006. Data are from the National Atmospheric Deposition Program, Mercury deposition Network.

Monitoring - Data Analysis and Recommendations 11/01/07
62
Figure 2. Volume-weighted mean concentrations of mercury in wet deposition at MDN monitoring
stations across the United States for 2003 (top) and 2004 (bottom). Mesa Verde National Park is circled.

Monitoring - Data Analysis and Recommendations 11/01/07
63
The years 2003 and 2004 represent “high” and “low” average annual concentrations for the Park’s short data record, 2002-2006.
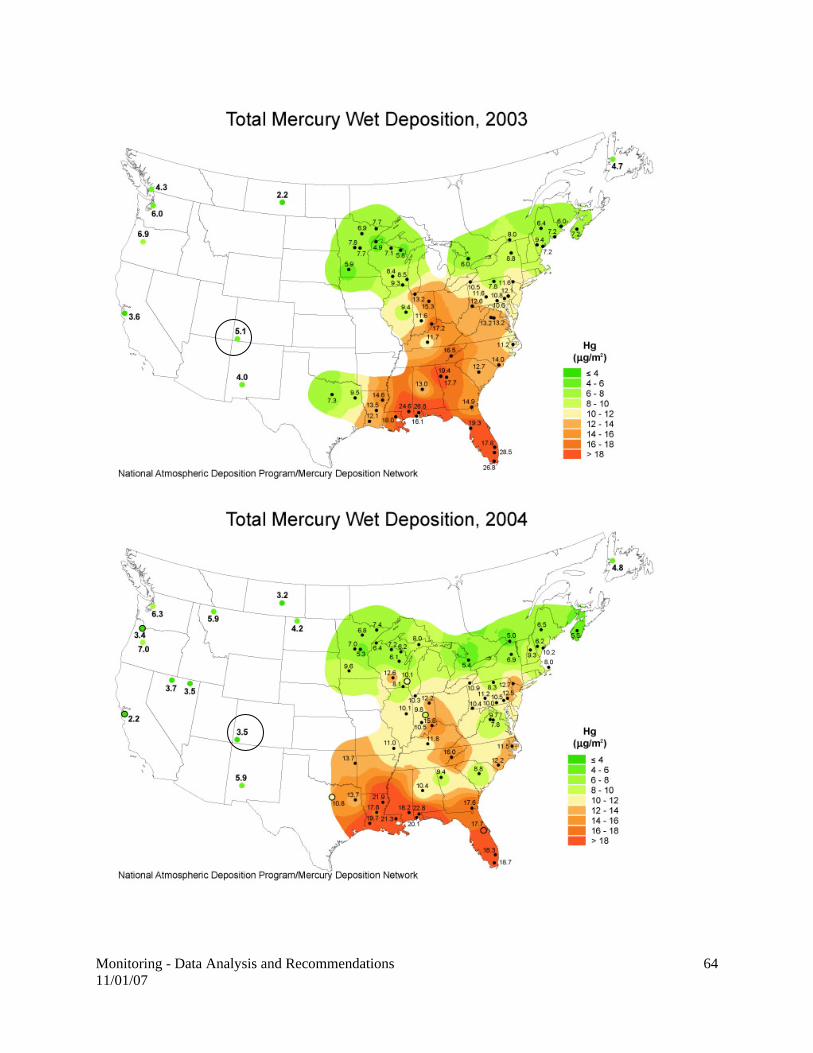
Monitoring - Data Analysis and Recommendations 11/01/07
64
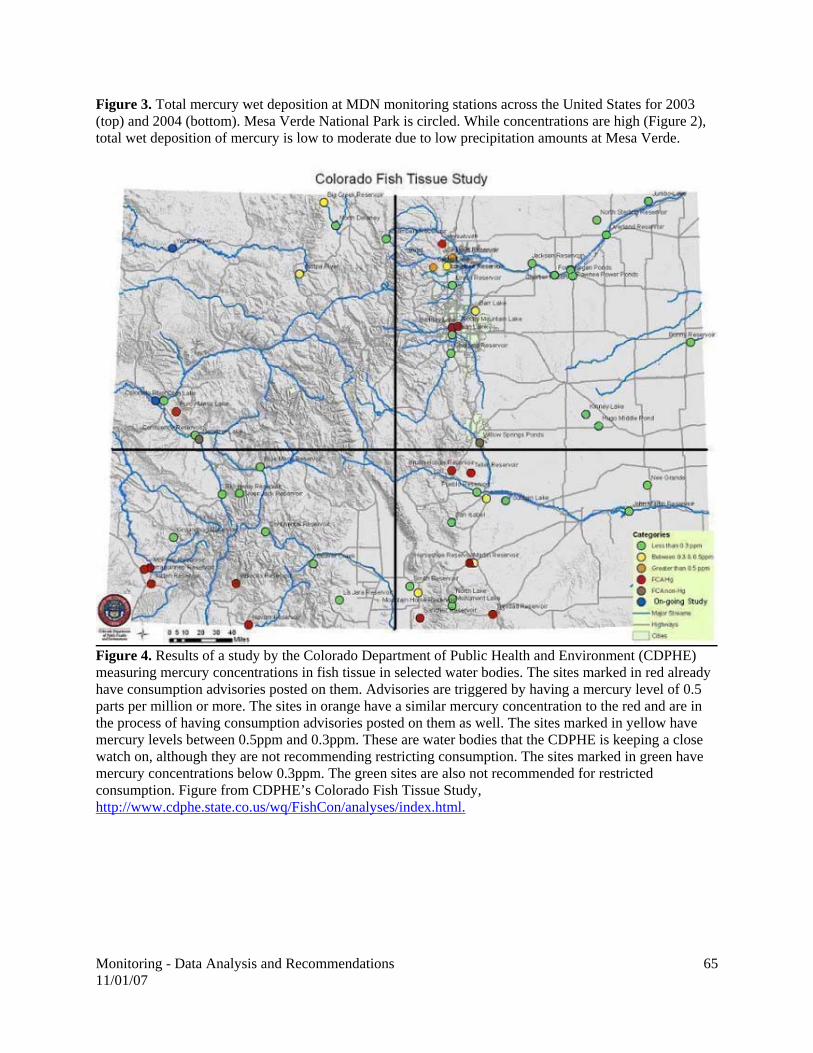
Monitoring - Data Analysis and Recommendations 11/01/07
65
Figure 3. Total mercury wet deposition at MDN monitoring stations across the United States for 2003 (top) and 2004 (bottom). Mesa Verde National Park is circled. While concentrations are high (Figure 2), total wet deposition of mercury is low to moderate due to low precipitation amounts at Mesa Verde.
Figure 4. Results of a study by the Colorado Department of Public Health and Environment (CDPHE) measuring mercury concentrations in fish tissue in selected water bodies. The sites marked in red already have consumption advisories posted on them. Advisories are triggered by having a mercury level of 0.5 parts per million or more. The sites in orange have a similar mercury concentration to the red and are in the process of having consumption advisories posted on them as well. The sites marked in yellow have mercury levels between 0.5ppm and 0.3ppm. These are water bodies that the CDPHE is keeping a close watch on, although they are not recommending restricting consumption. The sites marked in green have mercury concentrations below 0.3ppm. The green sites are also not recommended for restricted consumption. Figure from CDPHE’s Colorado Fish Tissue Study, http://www.cdphe.state.co.us/wq/FishCon/analyses/index.html.

Monitoring - Data Analysis and Recommendations 11/01/07
66
Atmospheric Deposition of Nitrogen and Sulfur Compounds Background: Rationale: Nitrogen (N) is an essential nutrient, but in elevated amounts it can cause harmful effects to ecosystems and human health. In areas with minimal human development, N in air deposition is a major contributor to N inputs to ecosystems, including surface waters. Air deposition includes wet deposition received with precipitation, but also includes dry deposition of gases and aerosols, through fall deposited under forest canopies, and condensation of cloud and fog. Atmospheric N mainly is deposited as nitrate, nitric acid, ammonium, and dissolved organic nitrogen. Key anthropogenic sources include nitrogen oxides (NOx) emitted from fossil fuel burning and ammonia volatized from fertilizer and animal wastes. NOx also will react with volatile organic compounds to form ozone (see ozone sub-chapter). Increased deposition of atmospheric N can result in high levels of nitrate in surface and ground water, shifts in species, decreased plant health, and eutrophication (i.e., fertilization) of otherwise naturally low-productivity ecosystems. Both N and sulfur (S) oxides can form “acid rain” and lead to acidification of surface and groundwater and soils. S oxides primarily are emitted to the atmosphere by burning of fossil fuels. Atmospheric deposition of S has decreased at many monitoring stations in the USA, especially in the eastern portion, since the implementation of the Clean Air Act Title IX Amendments. Despite a few locations with slight increases in S, amounts and concentrations of sulfate in wet deposition generally are low in the western USA. In contrast, concentrations of nitrate and ammonium in wet deposition have increased at some monitoring stations in the USA, including many in the western portion (Figures 1-3).1, 2 Harmful ecological effects of elevated N deposition have been documented in the western United States in regions downwind of emissions hotspots, including both high and low-elevation ecosystems3. These effects include high nitrate concentrations in streams and lakes, reduced clarity of lakes, altered and less diverse aquatic algal and terrestrial plant communities, loss of N from soils via leaching and gas flux, increased invasive species, changed forest carbon cycle and fuel accumulation, altered fire cycles, harm to threatened and endangered species, and contribution to regional haze and ozone formation3. In the Colorado Front Range, including the east side of Rocky Mountain National Park, harmful ecosystem effects attributed to increased N deposition specifically include: chronically elevated levels of nitrate in surface waters, altered types and abundances of aquatic algal species (diatoms), elevated levels of N in subalpine forest foliage, long-term accumulation and leaching of N from forest soils, and shifts in alpine plants from wildflowers to more grasses and sedges3,4,5. Hindcasting of deposition trends estimate that the harmful effects in the CO Front Range began when N in wet deposition increased above the 1.5 kg/ha/yr threshold6. An ecological critical load is the quantitative estimate of an exposure to one or more pollutants below which significant harmful effects on specified sensitive elements of the environment do not occur according to present knowledge7. Rocky Mountain National Park has adopted 1.5 kg/ha/yr of N in wet deposition as its ecological critical load8 and the Colorado Department of Public Health and Environment’s Air Pollution Control Division is now working to reduce N deposition loads to the Park9. Existing N & S deposition and ecological effects data for the Four Corners and San Juan Mountain region: Currently, monitoring stations for N, S, and H+ in wet deposition exist at Mesa Verde National Park (since 1981), Molas Pass (since 1986), and Wolf Creek Pass (since 1992) as part of the National Atmospheric Deposition Program (NADP)10. Dry deposition of N and S, which is especially important in arid regions (Fenn et al. 2003), has been monitored since 1995 at Mesa Verde NP as part of the Clean Air

Monitoring - Data Analysis and Recommendations 11/01/07
67
Status and Trends Network (CASTNet). Concentrations of airborne aerosols such as ammonium nitrate and ammonium sulfate are reported as part of the Interagency Monitoring of Protected Visual Environments (IMPROVE) program at Mesa Verde National Park and a site near Durango Mountain Resort (Weminuche Wilderness). Trends of sulfate concentrations in wet deposition show either a decrease over time or no change at monitoring stations in the vicinity of the Four Corners region. Conversely, trends of nitrate and ammonium concentrations in wet deposition appear to be stable or increasing (Figure 4)10,11. In general, N in wet deposition in the Four Corners and San Juan Mountain region currently is at or above the 1.5 kg/ha/yr ecological critical load discussed above for Rocky Mountain National Park. Dry deposition data from Mesa Verde NP indicate that, for the period 1997-2000, dry deposition contributed about half of the total inorganic nitrogen deposition and about one-third of the total sulfur deposition. The short data record is insufficient to detect trends over time for dry deposition. Model simulations of total wet plus dry deposition of N in the western United States indicate a possible hotspot for N deposition in SW Colorado (Figure 5)12. Inorganic water chemistry for Wilderness Lakes has been collected by the USDA-National Forest Service and US Geological Survey and over 15 years of data have accumulated for some lakes. While some of this data has been compared to high-elevation lake water chemistry in other regions of Colorado and Wyoming13, a full analysis has not been completed. Furthermore, the data are insufficient to detect potential changes to lake biology. Data Gaps: While data for N in wet deposition exist from multiple sites in the region, dry deposition is studied only at Mesa Verde National Park, which does not represent higher-elevations common near the Four corners region. Data concerning ecological effects of N deposition are very sparse for both high and low elevations and the limited data that do exist have not been analyzed adequately. No data exists for N and S deposition in the vicinity of emission sources. For example, no monitoring of N and S in wet or dry deposition occurs in NW New Mexico with the exception of Bandelier National Park. Suggestions for Future Monitoring Work: A. Continue monitoring for N, S and H+ in wet deposition via the NADP at the Molas Pass, Wolfe
Creek Pass and Mesa Verde National Park sites. Consider adding a site closer to emissions sources in NW New Mexico.
B. Initiate long-term monitoring / modeling of N and S in dry deposition via the Clean Air Status and
Trends Network (CASTNet) at a site such as Molas Pass, which is at higher elevation than the one existing site at Mesa Verde NP. Consider adding an additional site closer to emissions sources in NW New Mexico.
C. Complete a full analysis of existing Wilderness Lakes data, including spatial and temporal trends and
correlation of measurements with watershed or lake characteristics. D. Support a suite of ecological studies in order to measure potential harmful effects of N deposition on
natural resources across an elevation gradient. The studies should include an observational component aimed at documenting changing ambient conditions, but experimental manipulations should also be used to understand cause and effect relationships in addition to potential future responses. These studies should be modeled after those conducted in the Colorado Front Range, California, etc. (see Fenn et al. 2003)3.

Monitoring - Data Analysis and Recommendations 11/01/07
68
Literature Cited: 1. National Air Quality Chapter 7: Atmospheric deposition of sulfur and nitrogen compounds
http://www.epa.gov/airtrends/aqtrnd99/pdfs/Chapter7.pdf 2. Nilles, M. 2003. Status and Trends in Wet Deposition of Sulfur and Nitrogen in the United States.
Presented at the National Water Quality Assessment Liaison Committee Meeting, Washington D.C., November 2003). http://bqs.usgs.gov/acidrain/Deposition_trends.pdf
3. Fenn, ME, JS Baron, EB Allen, HM Reuth, KR Nydick and six others. 2003. Ecological effects of
nitrogen deposition in the western United States. BioScience 53:404-420. http://www.treesearch.fs.fed.us/pubs/24301
4. Baron JS, Rueth, HM, AM Wolfe, KR Nydick, EJ Allstott, JT Minear, B Moraska. 2000. Ecosystem
responses to nitrogen deposition in the Colorado Front Range. Ecosystems 3: 352-368. 5. See http://www.cdphe.state.co.us/ap/rmnp.html. 6. Baron, JS. 2006. Hindcasting nitrogen deposition to determine an ecological critical load. Ecological
Applications 16:433-439. http://www.esajournals.org/pdfserv/i1051-0761-016-02-0433.pdf; http://www.cdphe.state.co.us/ap/rmnp/RMNPjillbaronusgsJune1.pdf
7. Porter E, Blett T, Potter DU, Huber C. 2005. Protecting resources on Federal lands: Implications of
critical loads for atmospheric deposition of nitrogen and sulfur. Bioscience 55: 603-612. 8. See http://www.cdphe.state.co.us/ap/rmnp/rmnpCLLetter.pdf. 9. See http://www.cdphe.state.co.us/ap/rmnp.html. 10. National Atmospheric Deposition Program (NADP), http://nadp.sws.uiuc.edu/. 11. See http://bqs.usgs.gov/acidrain/Deposition_trends.pdf. 12. Fenn, ME, R Hauber, GS Tonnesen, JS Baron, S Grossman-Clarke, D Hope, DA Jaffe, S Copeland, L
Geiser, HM Reuth, and JO Sickman. 2003. Nitrogen emissions, deposition and monitoring in the Western United States. BioScience 53:391-403. http://www.treesearch.fs.fed.us/pubs/24302.
13. Musselman, RC and WL Slauson. 2004. Water chemistry of high elevation Colorado wilderness
lakes. Biogeochemistry 71: 387-414.
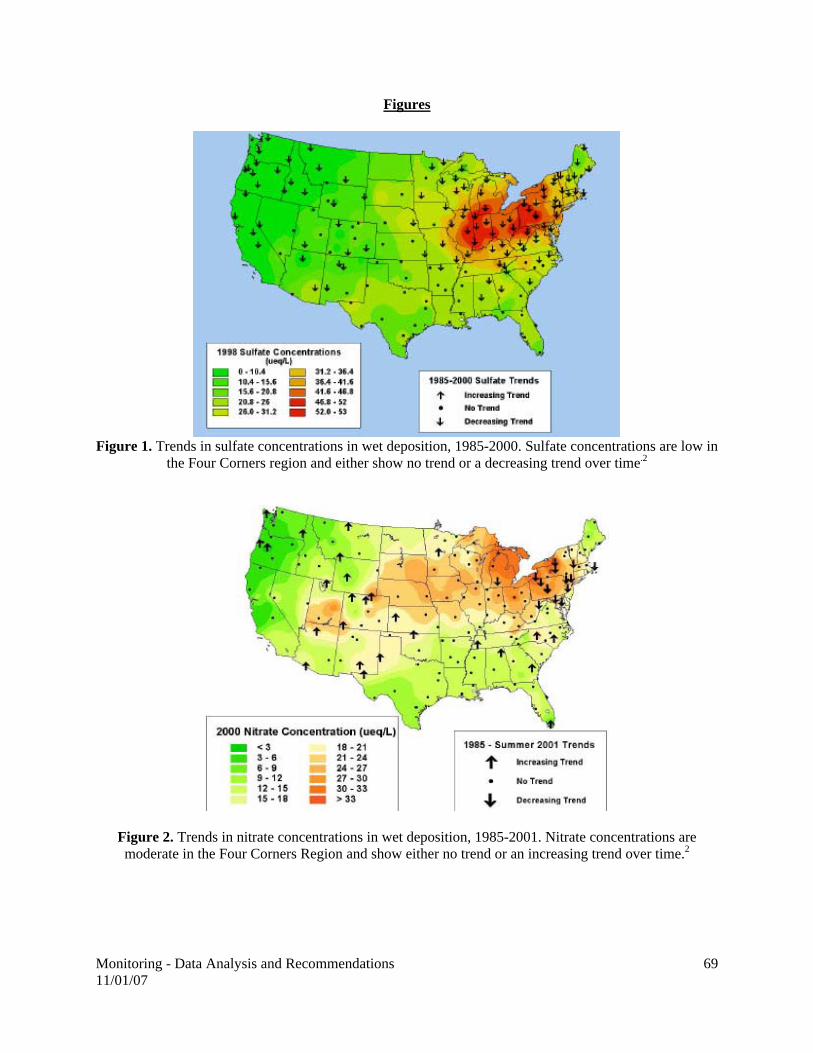
Monitoring - Data Analysis and Recommendations 11/01/07
69
Figures
Figure 1. Trends in sulfate concentrations in wet deposition, 1985-2000. Sulfate concentrations are low in
the Four Corners region and either show no trend or a decreasing trend over time.2
Figure 2. Trends in nitrate concentrations in wet deposition, 1985-2001. Nitrate concentrations are moderate in the Four Corners Region and show either no trend or an increasing trend over time.2

Monitoring - Data Analysis and Recommendations 11/01/07
70
Figure 3. Trends in ammonium concentrations in wet deposition, 1985-2001. Ammonium concentrations are low in the Four Corners Region but show an increasing trend over time.2
Figure 4. Model-simulated annual nitrogen deposition (kg/ha/yr) in the western United States in 1996 for (a) total wet and dry deposition of N from ammonia and ammonium, (b) total wet and dry deposition of N from nitric oxide, nitrogen dioxide, nitric acid, and nitrate, and (c) total N deposition calculated as the sum of (a) and (b).13

Monitoring - Data Analysis and Recommendations 11/01/07
71
0
0.5
1
1.5
2
2.5
3
3.5
4
4.5
1980 1985 1990 1995 2000 2005
Inor
gani
c N
(kg/
ha/y
r)
Mesa Verde
Molas Pass
Wolf Creek Pass
RMNP
3 per. Mov. Avg.(Mesa Verde)3 per. Mov. Avg.(Molas Pass)3 per. Mov. Avg.(RMNP)3 per. Mov. Avg.(Wolf Creek Pass)
0.4
0.6
0.8
1
1.2
1.4
1.6
1.8
2
2.2
2.4
1980 1985 1990 1995 2000 2005
SO4
(mg/
L)
4.5
4.6
4.7
4.8
4.9
5
5.1
5.2
5.3
5.4
5.5
1980 1985 1990 1995 2000 2005
Lab
pH
0.4
0.6
0.8
1
1.2
1.4
1.6
1980 1985 1990 1995 2000 2005
NO
3 (m
g/L)
0
0.05
0.1
0.15
0.2
0.25
0.3
1980 1985 1990 1995 2000 2005
NH
4 (m
g/L)
Figure 5. Annual averages of total inorganic nitrogen, pH, and sulfate nitrate, and ammonium concentrations in wet deposition from Mesa Verde National Park, Molas Pass, Wolf Creek Pass, and Rocky Mountain National Park (RMNP). Concentrations are precipitation volume-weighted means. Trend lines are 3 period moving averages and are not meant to indicate presence or absence of statistical trends. RMNP is included for comparison as a location where ecological effects of nitrogen deposition are documented.

Monitoring - Data Analysis and Recommendations 11/01/07
72
Additional figures for Mesa Verde National Park based on data from the National Atmospheric Deposition Program:

Monitoring - Data Analysis and Recommendations 11/01/07
73

Monitoring - Data Analysis and Recommendations 11/01/07
74

Monitoring - Data Analysis and Recommendations 11/01/07
75
Visibility I. Background Title 42 U.S.C. §§ 7491 and 7492 of the Clean Air Act established a national policy to study and protect visibility in Federal class I areas. It declares as a national goal “the prevention of any future, and the remedying of any existing, impairment of visibility in mandatory class I Federal areas which impairment results from manmade air pollution.”1 Of several mandatory class I areas Federal areas on the Colorado Plateau, Arches National Park, Canyonlands National Park, the Weminuche Wilderness, and Mesa Verde National Park lie within near or immediate proximity to the Four Corners Region. Several planning and monitoring authorities have evolved from this statutory requirement, two of which are able to directly address visibility concerns in the Four Corners region. The Interagency Monitoring of Protected Visual Environments (IMPROVE) program was initiated in 1985, and has implemented an extensive long term monitoring program in the National Parks and Wilderness Areas.2 Additionally, the Western Regional Air Partnership (WRAP) was formed in 1997 as the successor to the Grand Canyon Visibility Transport Commission, and promotes the implementation of recommendations that were made in the previous commission.3 Specifically, the WRAP partnership is implementing a regional planning process to improve visibility in all western Class I areas “by providing the technical and policy tools needed by states and tribes to implement the federal regional haze rule.”4
EPA issued the final Regional Haze Rule on April 22, 1999.5 “The rule requires the states, in coordination with the Environmental Protection Agency, the National Park Service, U.S. Fish and Wildlife Service, the U.S. Forest Service, and other interested parties, to develop and implement air quality protection plans to reduce the pollution that causes visibility impairment.”6 This regulation is also anticipated to have the additional benefits of improving visibility outside of class I areas, as well as ameliorating the health impacts associated with fine particulates (PM 2.5).7
II. What affects visibility and how is it monitored? The interaction between certain gasses, particulate matter, and the light that passes through the atmosphere yields the basic processes through which visibility is affected. Gasses and aerosols may scatter or block sunlight through diffraction, absorption, and refraction. When sunlight encounters gasses and aerosols, it scatters preferentially as a function of the size of the particles that it encounters.8 The relationship between particulate size and light is extremely important, as it ultimately accounts for changes in color and haze. Although the total mass of coarse particles (PM 10) in the atmosphere outnumbers the total mass of fine particles (PM 2.5), the finer particles “are the most responsible for scattering light” because they scatter light more efficiently, and because there are more of them.9 Consequently, the origin and transport of fine particles (PM 2.5) is of greatest concern when assessing visibility impacts.10
In the most general sense, visibility is the effect that various aerosol and lighting conditions have on the appearance of landscape features.11 While photography is the simplest method used to convey visibility impairment, it is difficult to garner quantitative information from photographs, digital pictures, or slides. Because some direct measurement of the atmosphere’s optical qualities is desired, most visibility programs include a measure of either atmospheric extinction or scattering.
The scattering coefficient is a measure of the ability of particles to scatter photons out of a beam of light, while the absorption coefficient is a measure of how many photons are absorbed. Each parameter is expressed as a number proportional to the amount of photons scattered or absorbed per distance. The sum of scattering and absorption is referred to as extinction or attenuation.12 (Emphasis added.)
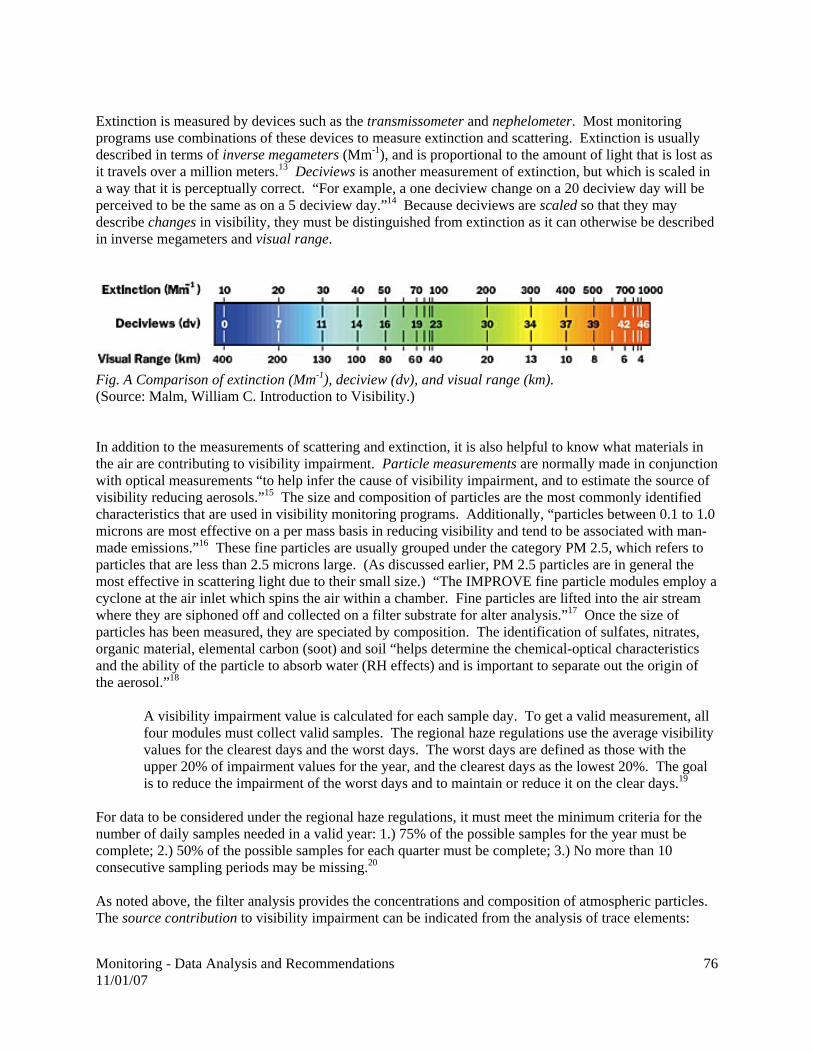
Monitoring - Data Analysis and Recommendations 11/01/07
76
Extinction is measured by devices such as the transmissometer and nephelometer. Most monitoring programs use combinations of these devices to measure extinction and scattering. Extinction is usually described in terms of inverse megameters (Mm-1), and is proportional to the amount of light that is lost as it travels over a million meters.13 Deciviews is another measurement of extinction, but which is scaled in a way that it is perceptually correct. “For example, a one deciview change on a 20 deciview day will be perceived to be the same as on a 5 deciview day.”14 Because deciviews are scaled so that they may describe changes in visibility, they must be distinguished from extinction as it can otherwise be described in inverse megameters and visual range.
Fig. A Comparison of extinction (Mm-1), deciview (dv), and visual range (km). (Source: Malm, William C. Introduction to Visibility.) In addition to the measurements of scattering and extinction, it is also helpful to know what materials in the air are contributing to visibility impairment. Particle measurements are normally made in conjunction with optical measurements “to help infer the cause of visibility impairment, and to estimate the source of visibility reducing aerosols.”15 The size and composition of particles are the most commonly identified characteristics that are used in visibility monitoring programs. Additionally, “particles between 0.1 to 1.0 microns are most effective on a per mass basis in reducing visibility and tend to be associated with man-made emissions.”16 These fine particles are usually grouped under the category PM 2.5, which refers to particles that are less than 2.5 microns large. (As discussed earlier, PM 2.5 particles are in general the most effective in scattering light due to their small size.) “The IMPROVE fine particle modules employ a cyclone at the air inlet which spins the air within a chamber. Fine particles are lifted into the air stream where they are siphoned off and collected on a filter substrate for alter analysis.”17 Once the size of particles has been measured, they are speciated by composition. The identification of sulfates, nitrates, organic material, elemental carbon (soot) and soil “helps determine the chemical-optical characteristics and the ability of the particle to absorb water (RH effects) and is important to separate out the origin of the aerosol.”18
A visibility impairment value is calculated for each sample day. To get a valid measurement, all four modules must collect valid samples. The regional haze regulations use the average visibility values for the clearest days and the worst days. The worst days are defined as those with the upper 20% of impairment values for the year, and the clearest days as the lowest 20%. The goal is to reduce the impairment of the worst days and to maintain or reduce it on the clear days.19
For data to be considered under the regional haze regulations, it must meet the minimum criteria for the number of daily samples needed in a valid year: 1.) 75% of the possible samples for the year must be complete; 2.) 50% of the possible samples for each quarter must be complete; 3.) No more than 10 consecutive sampling periods may be missing.20 As noted above, the filter analysis provides the concentrations and composition of atmospheric particles. The source contribution to visibility impairment can be indicated from the analysis of trace elements:

Monitoring - Data Analysis and Recommendations 11/01/07
77
vanadium/nickel » petroleum-based facilities, autos arsenic » copper smelters selenium » power plants crustal elements » soil dust (local, Saharan, Asian) potassium (nonsoil) » forest fires21
III. Visibility in the Four Corners Currently, there are four sites within the Four Corners region that monitor visibility: Mesa Verde National Park, the Weminuche Wilderness (near Purgatory,) the Shamrock Mine (southeast La Plata County,) and Canyonlands National Park. Of these four sites, only the Forest Service monitoring station at the Shamrock Mine records images, and is included in IMPROVE’s optical and scene monitoring network. Additionally, because the Canyonlands site lies on the margin of the Four Corners Region, and it is also located at a comparatively lower elevation north of the Blue Mountains, it may not serve as the best indicator of visibility trends in the Four Corners proper. Preliminary analysis of deciview trends at Mesa Verde, and also of visibility-impairing gasses and particulates as monitored at other sites, does not reveal a clear trend of how visibility might be changing in the Four Corners. This appraisal is not concomitant with the observations of many area residents. It may be indicative of monitoring gaps that exist in the Four Corners, and it has led to the perception by members of the Task Force Monitoring Group that a comprehensive, detailed analysis of all available data regarding visibility is greatly needed. Despite that ambiguity, however, there are a few details worth noting. In September of 2005, the Interim Emissions Workgroup of the Four Corners Air Quality Task Force recommended that an ambient monitoring program for gaseous ammonia be initiated in the Four Corners region. The purpose of this program is to set a current baseline of ambient gaseous ammonia concentrations in the Four Corners, that can be compared to monitored values in approximately 3-5 years after the implementation of NOx controls (e.g. NSCR) on oil and gas equipment. The use of NSCR may increase ammonia emissions in the area, but these emissions have not been quantified and may or may not significantly affect visibility. Ammonia at high enough concentrations can contribute to worsening visibility by forming PM 2.5 ammonium nitrates and ammonium sulfates. Additionally, the implementation of new SO2 controls at the San Juan Generating Station in 1999 has successfully reduced SO2 emissions in the area. Because of the high impact that SO2 can have upon visibility, that reduction has likely made a positive impact upon visibility conditions in the Four Corners. However, changes in monitoring conditions at San Juan Substation have not been limited to a decrease in SO2. Concurrently, it appears that NOx concentrations have risen, and now dominate over SO2:

Monitoring - Data Analysis and Recommendations 11/01/07
78
For the same time period, similar increases in NOx have been observed in Bloomfield, and it appears that NOx may be slowly increasing as a regional trend:
Many citizen’s accounts on deteriorating visibility in the Four Corners have centered upon wintertime episodes. The ways in which seasonal differences may impact visibility is very important. In the summertime, the “confining layer” of the atmosphere, which generally holds pollutants below a certain altitude, is much higher. Additionally, the extra heat associated with warmer seasons allows the atmosphere to move and mix more readily. The result is that, in the summertime, visibility-impairing pollutants can mix more easily, and dilute within in a greater vertical distance. Conversely, in the wintertime, that confining layer is usually much lower (thus the prevalence of wintertime inversions.) In colder seasons, the atmosphere does not move or mix as easily. Therefore, generally, wintertime pollutants are held closer to the ground level, and they cannot readily dilute into the upper atmosphere. Given this effect, the same level of regional emissions year-round will likely be more noticeable in the

Monitoring - Data Analysis and Recommendations 11/01/07
79
winter as layered haze. The addition of rising emissions levels will compound this effect in the wintertime.
Wintertime haze near Kline, Colorado. 12/05/2006. See also: A Resident’s Observation of Visibility, this section.
Excellent visibility, photo taken one mile west of previous photo. 10/21/2006.
The considerations outlined above reasonably lead to the hypothesis that citizens’ accounts of deteriorating visibility, as they are specific to wintertime episodes, may be partially caused by increasing NOx emissions. For an initial test of this hypothesis, we may review what NOx concentrations existed in the region at the time of the 12/05/2006 photograph:

Monitoring - Data Analysis and Recommendations 11/01/07
80
Elevated NOx concentrations existed at the San Juan Substation, with the most pronounced event occurring approximately 48 hours before the 12/05/2006 photograph.

Monitoring - Data Analysis and Recommendations 11/01/07
81
Elevated NOx concentrations existed at the Ignacio monitoring site approximately 24 hours after the 12/05/2006 photograph.

Monitoring - Data Analysis and Recommendations 11/01/07
82
Elevated NOx concentrations existed at the Navajo Lake monitoring site, with the most pronounced concentrations occurring on 12/05/2006.

Monitoring - Data Analysis and Recommendations 11/01/07
83
Elevated NOx concentrations existed at the Bloomfield monitoring site, with the most pronounced concentrations occurring within 24 hours of the 12/05/2006 photograph. It appears that NOx concentrations were a contributing factor behind the visibility impairment episode documented in the 12/05/2006 photograph. These preliminary observations raise a number of additional considerations. First, there exists a great value in the photographic documentation of visibility. These elevated NOx concentrations might not have been considered if one were to only examine particulate data over a given time period. Visual observations, although subjective, provide the first clue that will lead the inquisitor to examine specific episodes and time periods. The contemplation of criteria such as color, location, and the expanse of impairment episodes considers the regional nature of visibility impairment in a way that no site-specific particulate measurement can do. In a sense, visual accounts and photographic documentation is a top-down approach that reveals what data needs to be specifically considered, and where additional monitoring would be useful. Second, in the case of indeterminate deciview trends at Mesa Verde, the preceding discussion on photographic documentation obliges us to consider the monitoring site’s location. Mesa Verde is situated upon the uppermost reaches of the Four Corners Platform. This geologic plateau rises above the valleys and basins of the Four Corners region, and typifies the area’s rugged and varied topography. The monitoring site at Mesa Verde is located at roughly 7,200 feet above sea level, while most emissions in the region occur in the San Juan Basin to the south, at roughly 5,000 feet. (Likewise, most other emissions in the region are related to human activity, and occur in the other multiple valleys and basins

Monitoring - Data Analysis and Recommendations 11/01/07
84
that are topographically separated from the Park.) Given the occurrence of wintertime inversions and a lower confining atmospheric layer, it is entirely possible that what is observed as severe visibility impairment will not be recorded at Mesa Verde, because the monitoring site will be above the confining layer. The absence of photographic documentation coexistent with particulate measurements in the Park causes that data to be extrapolated from air quality within the Park itself, and it will not effectively consider what an observer might actually see as she looks across the region from that location. It is reasonable to assume that (wintertime) visibility impairment in the Four Corners is exacerbated by the area’s rugged topography, which often confines visibility impairment to within the region’s numerous basins and deep valleys. Additionally, that visibility monitoring in the Four Corners which is reliant on particulate measurements is located at higher elevations, and is not likely to record events related to low confining layers and atmospheric inversions. (I.e. Mesa Verde and the Weminuche.) These locations are, however, great vantage points from which visibility may be observed, but they forgo this opportunity because they do not include photographic documentation. Furthermore, Canyonlands National Park is not a good location to observe visibility as it relates to the Four Corners, because it is too distant from the region. (Both the path of emissions transport and line of sight from the Four Corners to Canyonlands is blocked by the higher elevations surrounding the Blue Mountains and Bear’s Ears.) That leaves only one site—the Shamrock Mine—from which visibility in the Four Corners Region can be satisfactorily observed and documented year-round. IV. Suggestions for Future Monitoring Work Air quality monitoring is a rather expensive operation, and so resources that might provide for saturation studies or additional permanent monitoring should be allocated in consideration of monitoring goals as a whole. However, it is still reasonable to advocate some additional monitoring of visibility, as most of the following suggestions could be incorporated into existing sites. Last, most visibility monitoring in the Four Corners is unevenly distributed (or restricted) to Class I areas. Therefore, visibility monitoring within these Class I areas is not conducive of a regional trends assessment, especially because they are based on a very few site-specific particulate measurements. Furthermore, the regional monitoring of visibility is desirable, because it can assist with the protection of Class I areas and EPA’s regional haze rule. Additionally, regional monitoring of visibility will better address the value that citizens place upon the vistas that exist outside of Class I areas, while recognizing how visibility impacts citizens’ perceptions of air quality as a whole. In sum, it is highly desirable that we consider how visibility monitoring in the Four Corners region can be perfected, with the intent of making a strong regional assessment. 1. It is suggested that the monitoring sites at Mesa Verde and in the Weminuche resume photographic
documentation.
2. Many previous studies of visibility in the Four Corners relate only to site-specific locations, and often conflict in their findings. A comprehensive assessment of historical data is needed, in order to determine regional trends or changes in visibility. Currently, it is very difficult not only to establish regional trend analyses, but also to compare them to historical baseline data.
3. Additional visibility monitoring should be established at locations in the region other than what exists
in Class I areas. This additional monitoring: 1. could be incorporated into existing monitoring sites; 2. should include photographic documentation;

Monitoring - Data Analysis and Recommendations 11/01/07
85
3. and, it should specifically consider how topographical variations impact the measurement of visibility.
4. The apparent contribution of NOx emissions to wintertime visibility impairment is recommended for
further study. V. Works Cited: 1. 42 U.S.C. § 7491 (a)(1). 2. http://vista.cira.colostate.edu/improve/ (access date 4/05/2007). 3. http://www.wrapair.org/facts/index.html (access date 4/05/2007). 4. Id. 5. http://vista.cira.colostate.edu/improve/Overview/hazeRegsOverview_files/v3_document.htm
(access date 4/05/2007). See also http://www.epa.gov/air/visibility/program.html. 6. http://www.epa.gov/air/visibility/program.html (access date 4/05/2007). 7. http://vista.cira.colostate.edu/improve/Overview/hazeRegsOverview_files/v3_document.htm 8. (access date 4/05/2007). 9. Malm, William C. 1999. Introduction to Visibility. Cooperative Institute for Research in the
Atmosphere (CIRA). Fort Collins, Colorado. P. 8. 10. Id. at 9. 11. Id. 12. Id. at 27. 13. Id. 14. Id. at 35. 15. Id. 16. Id. at 28. 17. Id. at 28, 29. 18. IMPROVE 2007 Calendar. 19. Malm at 29. 20. IMPROVE 2007 Calendar. 21. Id. 22. Id. The complete photographic record prepared by Erich Fowler is available by contacting Mark Jones at [email protected]. This is a very large file (over 100 MB).

Monitoring - Data Analysis and Recommendations 11/01/07
86
Mitigation Option: Interim Emissions Recommendations for Ammonia Monitoring I. Description of the mitigation option The following mitigation option paper is one of three that were written based on interim recommendations that were developed prior to the convening of the Four Corners Air Quality Task Force. Since the Task Force's work would take 18-24 months to finalize, and during this time oil and gas development could occur at a rapid pace, an Interim Emissions Workgroup made up of state and federal air quality representatives was formed to develop recommendations for emissions control options associated with oil and gas production and transportation. The Task Force includes these recommendations as part of its comprehensive list of mitigation options. Implement an ambient monitoring program for ammonia
A. Assess importance of ammonia to visibility B. Visibility modeling would be more accurate if ammonia data were available C. Ammonia emission impacts from NSCR can be better evaluated D. US EPA Region 6 will assist with this effort
Evaluate data on ammonia emissions from engines less than 300 HP equipped with NSCR
• Testing should be done in the field • Funding would need to be secured • A contractor to make measurements would need to be found
II. Description of how to implement The ambient monitoring program for ammonia would be conducted under the auspices of EPA Region 6. The appropriate agencies to implement this are EPA Region 6 and the New Mexico and Colorado departments of environmental quality. Collecting data on ammonia emissions from engines less than 300 HP would be voluntary and funding would need to be secured. III. Feasibility of the Option The technical feasibility of the ambient monitoring has already demonstrated. Specifically, the technical feasibility of measuring ammonia emissions from engines with NSCR has been demonstrated as part of a research project initially started by Colorado State University. However the exact methodology is not yet chosen. The environmental feasibility is negligible since only samples are collected. The economic feasibility depends on finding someone to pay for the sampling program IV. Background data and assumptions used The ambient monitoring would be conducted either by collecting samples or by real time analysis depending on equipment selected. Approximate measurements can be made using sampling tubes similar to Draeger tubes. The assumption is that a baseline ammonia level should be established and that potential increases may be observed because of the use of large numbers of rich burn engines with NSCR catalysts. This methodology is already being tested in the Colorado State University research project. V. Any uncertainty associated with the option The cost of the ambient monitoring program is not well established because the monitoring technology is not fully specified. Therefore, there is some uncertainty associated with this option. VI. Level of agreement within the work group for this mitigation option To be determined.

Monitoring - Data Analysis and Recommendations 11/01/07
87
VII. Cross-over issues to the other source groups This mitigation option would cross over to the Oil and Gas work group.

Monitoring - Resolutions 11/01/07
88
RESOLUTIONS Introduction In January, 2005 the Cortez/Montezuma League of Women Voters Air Quality Committee began its study of air quality issues in Montezuma County. It became evident that to study air quality we needed facts. To gain facts we needed monitoring. A committee was formed consisting of the following League of Women Voters members: Sylvia Olivia-air quality consultant, Judy Schuenemeyer-lawyer, Eric Janes-water quality expert, Jack Schuenemeyer-statistician, Mary Lou Asbury-spokesperson. The committee met frequently and came up with a plan of action. We invited Mark Larson, our state representative and Jim Isgar, our state senator, to a League of Women Voters meeting. Sylvia showed the plume model (a computer model of the plume movement from the areas existing power plants and the proposed 2 new power plants). We discussed the need for monitoring in the Montezuma Valley. Both agreed to take our concerns to the Colorado Legislature and the Colorado Health Department. The ground work was laid. The committee then met in Durango with the Congressional staff of Senator Ken Salazar and Representative John Salazar. To show governmental and community support for air monitoring we decided we needed to take resolutions to the Montezuma County Commissioners, Cortez City Council, and Mancos and Dolores Town Boards. A power point presentation with facts on ozone and mercury was decided upon. The committee met over a period of 2-3 months to put the finishing touches on the power point, commentary and resolutions. Presentations were scheduled starting in June,2005. Sylvia Olivia, Eric Janes, Judy and Jack Scheunemeyer and Mary Lou Asbury were in attendance for all presentations. Questions were answered to the satisfaction of all. Resolutions were signed in support of getting air monitoring, data collection and analysis from the EPA, BLM-CO, BLM-NM, and USGS. These have been mailed to all interested parties including all the Colorado Congressional Delegation and to our state representative and senator. The need was recognized, but the funding has been problematic. The committee has continued to do presentations to various groups to gain support for the need for air monitoring in the Montezuma Valley. The need becomes more critical as final plans are being made to construct a new power plant. Also, more coal bed methane wells are proposed in the San Juan Basin and throughout the Four Corners Region. There are many health issues and lifestyle concerns which require an air quality monitoring system. The League of Women Voters resolutions help show concern from representative government. The resolutions follow from the Montezuma County Commissioners, Cortez City Council, Mancos Town Board and Dolores Town Board.

Monitoring - Resolutions 11/01/07
89

Monitoring - Resolutions 11/01/07
90

Monitoring - Resolutions 11/01/07
91

Monitoring - Resolutions 11/01/07
92

Monitoring - Resolutions 11/01/07
93

Monitoring - Resolutions 11/01/07
94

Monitoring - Resolutions 11/01/07
95
Monitoring - Resolutions 11/01/07
96

Monitoring - Resolutions 11/01/07
97

Monitoring - Resolutions 11/01/07
98

Monitoring - Resolutions 11/01/07
99

Monitoring - Resolutions 11/01/07
100

Monitoring - Budgets/Funding and Projected Costs 11/01/07
101
BUDGETS / FUNDING AND PROJECTED COSTS Once the task of identifying suitable monitoring site locations has been completed, funding must be obtained to set up and operate the sites. Capital costs and operating costs of a monitoring site will vary according to what parameters the site is measuring. The following spreadsheets show examples of capital and operating costs of two different monitoring sites. The Shamrock site is under the jurisdiction of the IMPROVE (Interagency Monitoring of Protected Visual Environments) federal program and the Deming site is a state-run SLAMS (State/Local Air Monitoring Stations) site. Funding of these types of sites usually comes from the federal government, but as federal budgets are cut, other resources have to be sought out. States have entered into partnerships with industry in order to fund monitoring activities. Various permit fees can be instituted or increased to obtain funds for monitoring. Private organizations can also be possible sources of funding. A spreadsheet of possible funding sources is also shown. This spreadsheet lists organizations that are potential sources of funding, the geographic areas supported, applicant requirements, and the highest recent grants awarded. Most of these private funders require that grant recipients be non-profit, 501 (c) (3) organizations. Many of the funders also like projects that are collaborations and creative efforts capable of replication in other areas. They might support joint non-profit/governmental projects. Shamrock Monitoring Site Capital Costs
Description Qty
Unit Price Total Price NOTES
NOX Analyzer 110,000.0
0 10,000.00 O3 Analyzer 1 0.00 0.00 From other site NOx Calibration Devices 1 8,000.00 8,000.00
IMPROVE Aerosol 4 Modules 116,000.0
0 16,000.00 IMPROVE Housing Installation 1 5,000.00 5,000.00 Climate Controlled Monitoring Shelter 1 9,000.00 9,000.00 Data Logger 1 5,000.00 5,000.00 Installation for Data Logger 1 5,000.00 5,000.00 Laptop Computer 1 2,500.00 2,500.00 Meteorology Station 1 4,000.00 4,000.00
TOTAL
$64,500.00
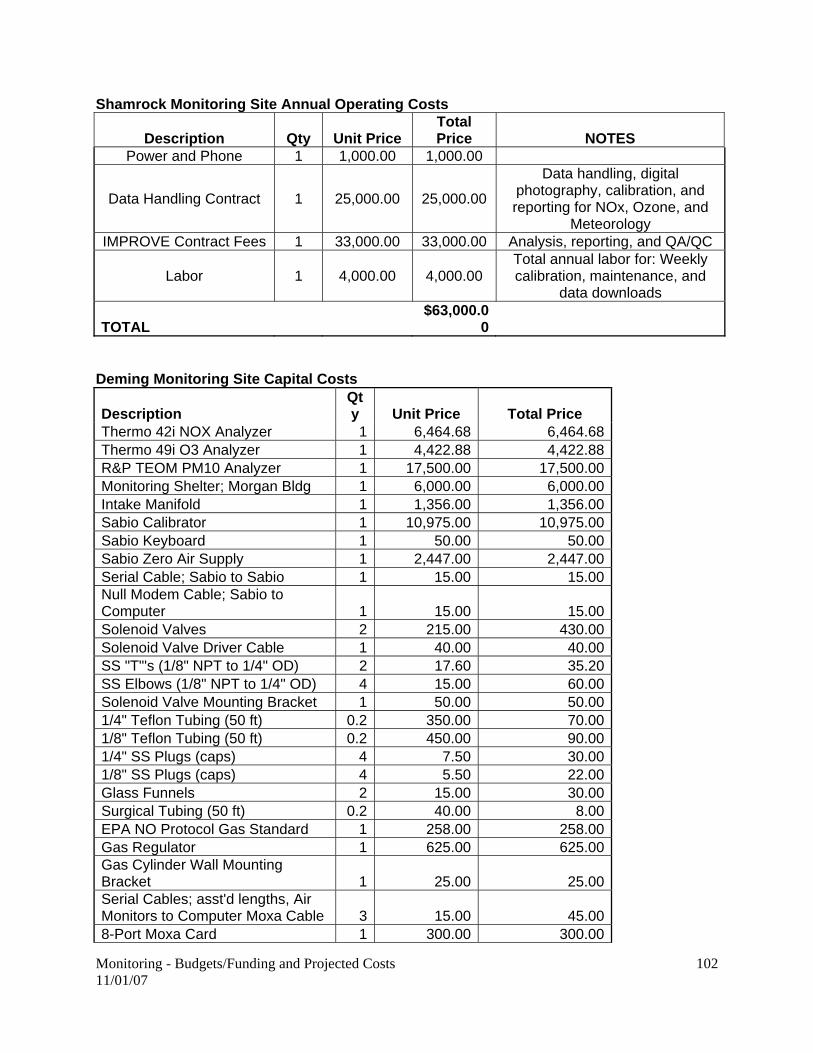
Monitoring - Budgets/Funding and Projected Costs 11/01/07
102
Shamrock Monitoring Site Annual Operating Costs
Description Qty Unit Price Total Price NOTES
Power and Phone 1 1,000.00 1,000.00
Data Handling Contract 1 25,000.00 25,000.00
Data handling, digital photography, calibration, and reporting for NOx, Ozone, and
Meteorology IMPROVE Contract Fees 1 33,000.00 33,000.00 Analysis, reporting, and QA/QC
Labor 1 4,000.00 4,000.00 Total annual labor for: Weekly calibration, maintenance, and
data downloads
TOTAL $63,000.0
0 Deming Monitoring Site Capital Costs
Description Qty Unit Price Total Price
Thermo 42i NOX Analyzer 1 6,464.68 6,464.68 Thermo 49i O3 Analyzer 1 4,422.88 4,422.88 R&P TEOM PM10 Analyzer 1 17,500.00 17,500.00 Monitoring Shelter; Morgan Bldg 1 6,000.00 6,000.00 Intake Manifold 1 1,356.00 1,356.00 Sabio Calibrator 1 10,975.00 10,975.00 Sabio Keyboard 1 50.00 50.00 Sabio Zero Air Supply 1 2,447.00 2,447.00 Serial Cable; Sabio to Sabio 1 15.00 15.00 Null Modem Cable; Sabio to Computer 1 15.00 15.00 Solenoid Valves 2 215.00 430.00 Solenoid Valve Driver Cable 1 40.00 40.00 SS "T"'s (1/8" NPT to 1/4" OD) 2 17.60 35.20 SS Elbows (1/8" NPT to 1/4" OD) 4 15.00 60.00 Solenoid Valve Mounting Bracket 1 50.00 50.00 1/4" Teflon Tubing (50 ft) 0.2 350.00 70.00 1/8" Teflon Tubing (50 ft) 0.2 450.00 90.00 1/4" SS Plugs (caps) 4 7.50 30.00 1/8" SS Plugs (caps) 4 5.50 22.00 Glass Funnels 2 15.00 30.00 Surgical Tubing (50 ft) 0.2 40.00 8.00 EPA NO Protocol Gas Standard 1 258.00 258.00 Gas Regulator 1 625.00 625.00 Gas Cylinder Wall Mounting Bracket 1 25.00 25.00 Serial Cables; asst'd lengths, Air Monitors to Computer Moxa Cable 3 15.00 45.00 8-Port Moxa Card 1 300.00 300.00

Monitoring - Budgets/Funding and Projected Costs 11/01/07
103
Description Qty Unit Price Total Price
Moxa Cable; 8 strand 1 55.00 55.00 Campbell Data Logger (CR10x) 1 1,779.00 1,779.00 12v Battery for Data Logger 1 25.00 25.00 Power Adapter for Data Logger 1 10.00 10.00 SC32B Optically Isolated Interface 1 80.00 80.00 APC UPS 1 200.00 200.00 Wireless Modem 1 500.00 500.00 Computer, monitor, keyboard, mouse 1 3,000.00 3,000.00 MET Tower Base; B-14 1 75.00 75.00 MET Tower 1 511.00 511.00 Lightning Rod 1 15.00 15.00 Grounding Rod 1 25.00 25.00 Rod Clamps 2 15.00 30.00 Tower Mast 1 35.00 35.00 Tower Cross Bar 1 35.00 35.00 Hardware Crosses, standard and offset 1 15.00 15.00 Solar Sensor (Li 200 SA 50)w/ Cable 1 215.00 215.00 Solar Sensor Mv Adapter (2220) 1 27.00 27.00 Solar Sensor Mounting Base 1 44.00 44.00 Solar Sensor Mounting Arm 1 65.00 65.00 Wind Monitor Unit (05305-5 AQ) 1 1,200.00 1,200.00 Wind Monitor Cable (50 ft) 1 50.00 50.00 Temperature Probes w/ Cable 2 425.00 850.00 Temperature Probe Aspirator 2 726.00 1,452.00 Power Installation 1 1,500.00 1,500.00 Security Fencing 1 1,600.00 1,600.00 TOTAL $ 64,756.76
Deming Monitoring Site Annual Operating Costs Description Qty Unit Price Total Price Power: 1 845.00 845.00 Communications: 1 830.00 830.00 Labor: 1 5,285.00 5,285.00 Consumables: 1 1,500.00 1,500.00 TOTAL $ 8,460.00

Monitoring - Budgets/Funding and Projected Costs 11/01/07
104
Possible Funding Sources for Monitoring
Name & contact info Areas Funded Applicant requirements
Highest Recent Grant
PRIVATE SOURCES Ben & Jerry's national 501(c)(3) $15,000 Foundation (802) 846-1500 www.benjerry.com/foundation Patagonia, Inc. Colorado 501(c)(3) $20,000 (805)643-8616 www.patagoniainc.com Coutts & Clark SW CO 501(c)(3) $5,000 Western Foundation multi-state (970) 259-6169 [email protected] William & Flora Hewlett Foundation national 501(c)(3) $2,400,000 (650) 234-4500 www.hewlett.org Microsoft Corp. Rocky Mountain Region (720) 528-1700
[email protected] Rocky Mountain area 501(c)(3) $30,000
local govt. entity?
Anschutz Family Foundation Colorado, especially rural 501(c)(3) $20,000
(303) 293-2338 [email protected] Eastman Kodak Colorado 501(c)(3) $250,000 Charitable Trust

Monitoring - Budgets/Funding and Projected Costs 11/01/07
105
Name & contact info Areas Funded Applicant requirements
Highest Recent Grant
(585)724-2434 www.kodak.com/us/en/corp/community.shtml Greenlee Family Foundation SW CO 501(c)(3) $10,000 (303) 444-0206 [email protected] El Pomar Foundation Colorado 501(c)(3) $1,550,000 800-554-7711 [email protected] Ford Motor Company Fund National 501(c)(3) $265,000 (313) 845-8711 [email protected] ADDITIONAL SOURCES FOR INFORMATION ON PRIVATE FUNDING FOR ENVIRONMENTAL PROJECTS Environmental Grant Makers Association (212 812-4260 [email protected] Community Resource Center, Inc. (303) 623-1540 www.cramerica.org

Monitoring - Summary of Suggestions / Priorities 11/01/07
106
SUMMARY OF SUGGESTIONS / PRIORITIES Introduction Air pollution is defined as a chemical, physical or biological agent that modifies the natural characteristics of the atmosphere.1 Pollutants in the air may be natural in origin, such as blowing dust, forest fire smoke or organic compounds from vegetation. Of greater concern are anthropogenic, or man-made pollutants. These include chemicals and particulates from motor vehicles, smoke stacks, incinerators, refineries, industrial degreasing and pesticides, to name just a few. Pollutants may be classified as primary, where they are directly released form a source, or as secondary, where they are formed from reactions of other pollutants in the atmosphere. The health effects caused by air pollutants may range from subtle biochemical and physiological changes to difficulty breathing, wheezing, coughing and aggravation of existing respiratory and cardiac conditions. These effects can result in increased medication use, increased doctor or emergency room visits, more hospital admissions and premature death.1 Air pollution has been an issue to human health for centuries. One of the most famous episodes was the “Great Smog” that occurred in London, England in December 1952. Lasting for four days, over 12,000 people died either during the episode or in the months following as a result of the health effects.2 While not the first air pollution smog to cause deaths, it was the largest to date and led to some of the first Clean Air Acts and air quality regulations in the world. In the United States, the first Clean Air Act was passed in 1963. However, it was not until the Clean Air Act of 1970 and with the creation of the U.S. Environmental Protection Agency (EPA) in the same year that real air pollution control came into full force.3 This 1970 Clean Air Act was revised and expanded in 1990. The U.S. EPA has set national ambient air quality standards (NAAQS) for six “criteria” pollutants. These are wide-spread pollutants from numerous and diverse sources that are considered harmful to public health and the environment. There are two types of NAAQS. Primary standards set limits to protect public health, including the health of “sensitive” populations such as asthmatics, children, and the elderly. Secondary standards set limits to protect public welfare, including protection against visibility impairment, damage to animals, crops, vegetation, and buildings.4 The “criteria” pollutants are carbon monoxide, ozone, sulfur dioxide, nitrogen dioxide, lead and particulates (PM10 and PM2.5). However, there are many other pollutants that can be found in the ambient air. Air toxics, which includes a variety of organic compounds and metals, is an area of increasing concern to human health. Visibility, while not directly a health-related concern, is an aesthetic concern and can be an indicator of other health-related pollutants. The sources and health/environmental impacts vary from pollutant to pollutant, though many are linked to each other. Carbon monoxide is a colorless and odorless gas formed primarily from incomplete combustion of fuels. It is a product of motor vehicle exhaust, which contributes about 60 percent of all carbon monoxide emissions nationwide. Other sources of carbon monoxide emissions include industrial processes, non-transportation fuel combustion, and natural sources such as wildfires. With increasing emissions controls on motor vehicles and other sources, ambient carbon monoxide levels nationwide have been reduced significantly over the past two decades. Carbon monoxide enters the bloodstream through the lungs and reduces oxygen delivery to the body's organs and tissues. The health threat from carbon monoxide is most serious for those who suffer from cardiovascular disease. Visual impairment, reduced work capacity, reduced manual dexterity, poor learning ability, and difficulty in performing complex tasks are all associated with exposure to elevated carbon monoxide levels.5 Ozone is a highly reactive gas that is a form of oxygen. Though it occurs naturally in the stratosphere to provide a protective layer high above the earth, at ground-level it is the prime ingredient of smog.6 Ozone

Monitoring - Summary of Suggestions / Priorities 11/01/07
107
is a secondary pollutant formed by the action of sunlight on carbon-based chemicals known as hydrocarbons, acting in combination with a group of air pollutants called oxides of nitrogen. As a result, ozone is generally a summer afternoon issue. Ozone reacts chemically with internal body tissues that it comes in contact with, such as those in the lung. It also reacts with other materials such as rubber compounds, breaking them down. Health symptoms include shortness of breath, chest pain when inhaling deeply, wheezing and coughing. Research on the effects of prolonged exposures to relatively low levels of ozone have found reductions in lung function, biological evidence of inflammation of the lung lining and respiratory discomfort.7 Sulfur dioxide is a gas that is formed when fuel containing sulfur (mainly coal and oil) is burned, and during metal smelting and other industrial processes. The major health concerns associated with exposure to high concentrations of sulfur dioxide include effects on breathing, respiratory illness, alterations in the lungs defenses, and aggravation of existing cardiovascular disease. Asthmatics and individuals with cardiovascular disease or chronic lung disease, as well as children and the elderly are particularly susceptible. In addition, sulfur dioxide is a major precursor to PM2.5 particulates and acid rain.8 Nitrogen dioxide is a light brown gas that can become an important component of urban haze. Oxides of nitrogen (which includes nitrogen dioxide) usually enter the air as the result of high-temperature combustion processes, such as those occurring in automobiles and power plants. Nitrogen dioxide plays an important role in the atmospheric reactions that generate ozone. Home heaters and gas stoves also produce substantial amounts of nitrogen dioxide. Nitrogen dioxide can irritate the lungs and lower resistance to respiratory infections. Oxides of nitrogen are an important precursor to ozone, PM2.5 particulates and acid rain.9 Lead is a metal that is used in a wide variety of commercial products. In the past, automotive sources were the major contributor of lead emissions to the atmosphere. As a result of unleaded fuels now being used, ambient lead levels have decreased significantly. Today, metals processing is the major source of lead emissions to the atmosphere. The highest concentrations of lead are found in the vicinity of nonferrous and ferrous smelters, battery manufacturers, and other stationary sources of lead emissions. Exposure to lead occurs mainly through the inhalation of air and the ingestion of lead in food, water, soil, or dust. It accumulates in the blood, bones, and soft tissues. Because it is not readily excreted, lead can also adversely affect the kidneys, liver, nervous system, and other organs. Excessive exposure to lead may cause neurological impairments such as seizures, mental retardation, and/or behavioral disorders. Recent studies also show that lead may be a factor in high blood pressure and subsequent heart disease.10 Particle pollution is a mixture of microscopic solids and liquid droplets suspended in the air. This pollution, also known as particulate matter, is made up of a number of components, including acids (such as nitrates and sulfates), organic chemicals, metals, soil or dust particles, and allergens (such as fragments of pollen or mold spores).11 Particulate pollution comes from such diverse sources as factory and utility smokestacks, vehicle exhaust, wood burning, mining, construction activity, and agriculture.12 The size of particles is directly linked to their potential for causing health problems. Small particles less than 10 micrometers in diameter pose the greatest problems, because they can get deep into your lungs, and some may even get into your bloodstream. Exposure to such particles can affect both your lungs and your heart. Particulate matter air pollution is especially harmful to people with lung disease such as asthma and chronic obstructive pulmonary disease (COPD), which includes chronic bronchitis and emphysema. Exposure to particulate air pollution can trigger asthma attacks and cause wheezing, coughing, and respiratory irritation in individuals with sensitive airways. Larger particles are of less concern, although they can irritate your eyes, nose, and throat. Toxic air pollutants, also known as hazardous air pollutants, are those pollutants that are known or suspected to cause cancer or other serious health effects, such as reproductive effects or birth defects, or

Monitoring - Summary of Suggestions / Priorities 11/01/07
108
adverse environmental effects. Examples of toxic air pollutants include benzene, which is found in gasoline; perchlorethlyene, which is emitted from some dry cleaning facilities; and methylene chloride, which is used as a solvent and paint stripper by a number of industries. Examples of other listed air toxics include dioxin, asbestos, toluene, and metals such as cadmium, mercury, chromium, and lead compounds.13 There are no NAAQS for toxic air pollutants. Instead, they are regulated nationally by requiring the use of pollution controls on sources. Visibility is defined as the greatest distance at which a black object can be seen and recognized when observed against a background fog or sky. From an aesthetic perspective, visibility represents not just visual range, but rather the overall visual experience of a scene.14 Thus, visibility issues are not directly a health impact. However, many of the pollutants that cause visibility degradation may cause health impacts. In addition to primary particulates, secondary particulates are a part of visibility degradation. These secondary particulates can be formed from sulfur dioxide and nitrogen dioxide, both of which are criteria pollutants. Both N and sulfur (S) oxides can form “acid rain” and lead to acidification of surface and groundwater and soils. S oxides primarily are emitted to the atmosphere by burning of fossil fuels. Increased deposition of atmospheric N can result in high levels of nitrate in surface and ground water, shifts in species, decreased plant health, and eutrophication (i.e., fertilization) of otherwise naturally low-productivity ecosystems. Analysis and Interpretation of Existing Data Meteorology Meteorological data are collected at a number of different locations in the Four Corners region. In looking at the annual wind roses, it is evident that some sites are more influenced by local topography than others. An example is the Cortez CoAgMet site, which is located in the valley between Sleeping Ute Mountain and Mesa Verde and is subjected to definite channeling effects. Another example is the U.S. Forest Service Shamrock site, which is located on the side of a hogback ridge. It can also be seen that the strongest winds are generally from a more westerly direction than an easterly one. From the daytime wind roses, there are general westerly or northerly/southerly components to the winds. In comparison, the nighttime wind roses show more of general easterly to northerly components. These trends are expected based on prevailing regional wind patterns as well as more local convection heating and cooling patterns along with topography. These wind roses can be broken down even further, such as only for summer afternoon periods when ozone levels are expected to be highest (see summer afternoon wind rose maps). These wind roses show, in general, a predominant westerly to southwesterly component. As mentioned previously, some sites still exhibit wind patterns that are strongly influenced by local topography rather than more regional winds. However, these types of plots are useful in describing what may happen with air pollution flows during different periods of time. While not performed for this analysis, additional seasonal plots could be dome, such as for winter when inversions are more prevalent. Ozone and Precursor Gases Ground level ozone is currently monitored on a continuous basis at nine locations in the Four Corners region, with seven sites being in a core area. For regulatory comparisons to the NAAQS, continuous

Monitoring - Summary of Suggestions / Priorities 11/01/07
109
analyzers that have been designated as “equivalent’ or “reference” by the U.S. Environmental Protection Agency (EPA) are used. Currently, ambient ozone levels in the Four Corners region are below the level of the current NAAQS (see trends and standards graphs). However, at Mesa Verde and one Southern Ute site there is an increasing trend, and the two newer sites (USFS, Navajo Lake) are recording higher levels. Many of the sites would be above the level of a reduced NAAQS, as proposed by CASAC. With ozone typically having peak concentrations in the summer afternoons when sunlight is strongest, pollutant roses were developed accordingly and were placed on both political boundary and topographic base maps (see pollutant rose maps). As can be seen from these pollutant rose maps, ozone at the three southern core area sites in New Mexico and the Mesa Verde site in Colorado show predominantly westerly wind directions in this summer afternoon timeframe. This generally mirrors the predominant San Juan River drainage. The two Southern Ute Tribe sites and the Forest Service Shamrock site appear to be heavily influenced by local topography. Thus, based on these pollutant roses, it is likely that ozone concentrations could also be high further to the east and north of the New Mexico Navajo Lake site, further up the San Juan River and Piedra River drainages. While no monitoring exists to confirm or deny, winds could also flow up other drainages in summer afternoons, including the Dolores and Animas Rivers. For ozone precursor gases, NOx monitoring currently exists at six sites in the Four Corners region. NO2 levels have been fairly steady over the years at most sites, at a level well below the NAAQS. At two sites in particular, San Juan Substation, NM and Bloomfield, NM, the NO2 levels do appear to be increasing over time. NO, unfortunately, has not been reported consistently as it is not designated a criteria pollutant. However, NO levels do appear to be increasing at both Southern Ute Tribe sites, Ignacio and Bondad. These increases in NO and NO2 are of concern due to the potential for increased ozone formation and also indicates that there are increased combustion sources in the area, possibly due to oil and gas development and increased traffic. VOC baseline monitoring for San Juan County, New Mexico was conducted in 2004 and 2005 at three sites. One site was near Bloomfield, NM near some industrial sources, a second near the San Juan power plant and the third site was near Navajo Lake, in an oil and gas development area. Results showed that alkane concentrations dominated, especially ethane and propane. The biogenic compound isoprene and the highly reactive VOC compounds, ethylene and propylene, were not present in significant quantities. Mercury Total mercury in wet deposition has been monitored at Mesa Verde National Park since 2002 as part of the Mercury Deposition Network. Results show mercury concentrations among the highest in the nation during certain years. Precipitation is relatively low, however, so mercury in wet deposition is moderate. Mercury concentrations have been measured in snowpack at a few sites in the San Juan Mountains by the USGS and moderate concentrations similar to the Colorado Front Range have been recorded. Mercury concentrations in sport fish from several reservoirs have exceeded the 0.5 microg/g action level resulting in mercury fish consumption advisories for water bodies including McPhee, Narraguinnep, Todden, Navajo, Sanchez and Vallecito Reservoirs and segments of the San Juan River. Atmospheric deposition just to the surface of McPhee and Narraguinnep Reservoirs (i.e., not including air deposition to the rest of the watershed) is estimated to contribute 8.2% and 47.1% of total mercury load to these water bodies, respectively.

Monitoring - Summary of Suggestions / Priorities 11/01/07
110
Nitrogen and Sulfur Compounds Currently, monitoring stations for N, S, and H+ in wet deposition exist at Mesa Verde National Park (since 1981), Molas Pass (since 1986), and Wolf Creek Pass (since 1992) as part of the National Atmospheric Deposition Program. Dry deposition of N and S, which is especially important in arid regions (Fenn et al. 2003), has been monitored since 1995 at Mesa Verde NP as part of the Clean Air Status and Trends Network. Trends of sulfate concentrations in wet deposition show either a decrease over time or no change at monitoring stations in the vicinity of the Four Corners region. Conversely, trends of nitrate and ammonium concentrations in wet deposition appear to be stable or increasing. In general, N in wet deposition in the Four Corners and San Juan Mountain region currently is at or above the 1.5 kg/ha/yr ecological critical load discussed above for Rocky Mountain National Park. Dry deposition data from Mesa Verde NP indicate that, for the period 1997-2000, dry deposition contributed about half of the total inorganic nitrogen deposition and about one-third of the total sulfur deposition. The short data record is insufficient to detect trends over time for dry deposition. Model simulations of total wet plus dry deposition of N in the western United States indicate a possible hotspot for N deposition in SW Colorado. Visibility Currently, there are four sites within the Four Corners region that monitor visibility: Mesa Verde National Park, the Weminuche Wilderness (near Purgatory,) the Shamrock Mine (southeast La Plata County,) and Canyonlands National Park. Of these four sites, only the Forest Service monitoring station at the Shamrock Mine records images, and is included in IMPROVE’s optical and scene monitoring network. Additionally, because the Canyonlands site lies on the margin of the Four Corners Region, and it is also located at a comparatively lower elevation north of the Blue Mountains, it may not serve as the best indicator of visibility trends in the Four Corners proper. Preliminary analysis of deciview trends at Mesa Verde, and also of visibility-impairing gasses and particulates as monitored at other sites, does not reveal a clear trend of how visibility might be changing in the Four Corners. This appraisal is not concomitant with the observations of many area residents. It may be indicative of monitoring gaps that exist in the Four Corners, and it has led to the perception by members of the Task Force Monitoring Group that a comprehensive, detailed analysis of all available data regarding visibility is greatly needed. Despite that ambiguity, however, there are a few details worth noting. In September of 2005, the Interim Emissions Workgroup of the Four Corners Air Quality Task Force recommended that an ambient monitoring program for gaseous ammonia be initiated in the Four Corners region. The purpose of this program is to set a current baseline of ambient gaseous ammonia concentrations in the Four Corners, that can be compared to monitored values in approximately 3-5 years after the implementation of NOx controls (e.g. NSCR) on oil and gas equipment. The use of NSCR may increase ammonia emissions in the area, but these emissions have not been quantified and may or may not significantly affect visibility. Ammonia at high enough concentrations can contribute to worsening visibility by forming PM 2.5 ammonium nitrates and ammonium sulfates. Additionally, the implementation of new SO2 controls at the San Juan Generating Station in 1999 has successfully reduced SO2 emissions in the area. Because of the high impact that SO2 can have upon visibility, that reduction has likely made a positive impact upon visibility conditions in the Four Corners. However, changes in monitoring conditions at San Juan Substation have not been limited to a decrease in SO2. Concurrently, it appears that NOx concentrations have risen, and now dominate over SO2.

Monitoring - Summary of Suggestions / Priorities 11/01/07
111
Carbon Monoxide, PM10 and Other Common Pollutants Carbon Monoxide Carbon monoxide in the ambient air is currently monitored on a continuous basis at only one site in the Four Corners region. This is at the Southern Ute Tribe’s Ignacio site in southern Colorado. Monitoring was performed at New Mexico’s Farmington site, but was discontinued in 2000. Ambient carbon monoxide levels in the Four Corners region are well below the level of the current NAAQS. PM10 PM10 in the ambient air is, historically, the most heavily monitored pollutant in the Four Corners region. Most of the monitoring has been performed using filter-based “high-volume” samplers that collect 24-hour samples and most of the data are available on EPA’s Air Quality System. Ambient PM10 levels in the Four Corners region are well below the level of the current and former NAAQS. Others No monitoring for lead exists in the Four Corners region. Due to the introduction of unleaded gasoline in the 1970’s, ambient lead levels have decreased to levels that are near instrument detection levels. Likewise, no monitoring exists for other pollutants such as carbon dioxide, HAPs or pesticides. Suggestions for Future Monitoring Work Meteorology No significant data gaps exist for meteorological monitoring in the Four Corners region, with the exception of southwestern Utah and northeastern Arizona. No suggestions for additional monitoring of meteorological parameters are currently being proposed. Ozone and Precursor Gases While it would appear that there is a sufficient ozone monitoring network in the Four Corners region, some areas are lacking. Pollutant roses were developed to determine the directions from which ozone precursors are most likely to be transported by wind. Ozone monitoring currently exists in the major oil and gas development areas, but little downwind ozone monitoring currently exists. VOCs are also a gap, as the short-term studies in 2004 and 2005 were located toward the southern edge of the oil and gas development area, or not in the development area at all. While emissions inventories can provide an estimate of total VOCs that may be released to the atmosphere, these are primarily based on predicted emissions, not on actual measurements. This is a concern as different VOCs have different ozone formation potentials and the oil and gas development has dramatically increased in the region since these studies. Suggestions for Future Monitoring Work for Ozone: Install and operate two or three long-term continuous monitoring stations for ozone. One station would be located upstream of Navajo Lake, in the San Juan River drainage toward Pagosa Springs, CO, or in the Piedra River drainage, toward Chimney Rock, CO. This area is toward the northeastern portion of the

Monitoring - Summary of Suggestions / Priorities 11/01/07
112
Four Corners region and is downwind of many VOC precursor gas sources from oil and gas development. The second station would be located to the north of Cortez. This area is in the north-central portion of the Four Corners region and is downwind of both an urban area and any precursor gas emissions that would funnel up between Sleeping Ute Mountain and Mesa Verde. If funding exists, a third site in Arizona on Navajo Nation land, in the southwest portion of the Four Corners area, is recommended. This site, possibly at Canyon de Chelly National Monument, would be to the west of a high ozone area as determined in the 2003 passive ozone study and would provide a good representation of regional ozone levels entering the Four Corners area. Each site, including shelter and instrumentation, would cost approximately $15,000 to $20,000 (total = $45,000 to $60,000). Annual operating costs (not including field personnel) would be approximately $1,500 per site (total = $3,000). Perform an ozone saturation study using passive samplers across the entire Four Corners region to determine areas of highest ozone concentration. This would help determine if existing or new continuous monitoring sites are located in appropriate areas or if continuous ozone monitors need to be added or moved. It is expected that at least 20 passive ozone sites over the four-state region would be needed. Running for 30 days during a summer, the approximate cost would be $22,000 (not including field personnel time). Perform monitoring for VOCs (in particular NMOCs) and carbonyls in the oil and gas development areas to determine the actual constituents in the emissions from wellheads, leaks and tanks. This would help in determining the potential for ozone formation from these compounds. This suggestion also includes follow-up monitoring for VOCs, both in and near the oil and gas development area, to compare to the 2004 and 2005 baseline data from San Juan County, New Mexico. A minimum of four to five sites is recommended; two sites in the oil and gas development area, one background site and one or two follow-up sites. For a year of monitoring, every sixth day, the approximate cost (not including field personnel time) would be $45,000 per site (total = $180,000 to $225,000). Mercury Very little data exists for the Four Corners Region with which to assess current risks and trends over time for mercury in air deposition, ecosystems, and sensitive human populations. No data exists for mercury in deposition at high elevations. Wet deposition of mercury at Mesa Verde National Park may not portray the situation in the mountains where mercury may be deposited at higher concentrations and total amounts because of greater rates of precipitation and the process of cold condensation, which causes volatile compounds to migrate towards colder areas at high elevation and latitude7. No information about total mercury deposition from the atmosphere (i.e., including dry deposition) exists for low or high elevations in the Four Corners Region. Furthermore, analysis of sources of air deposition of mercury is lacking. Except for a handful of reservoirs, no information exists for incorporation of mercury into aquatic ecosystems and subsequent effects on food-webs. No systematic effort exists to document mercury impacts in a wide range of water bodies over space and time. Lastly, impacts of mercury exposure to human populations are unknown. Suggestions for Future Monitoring Work for Mercury: 1. Install and operate a long-term monitoring station for mercury in wet deposition for a location at high
elevation where precipitation amounts are greater than the site at Mesa Verde NP. Co-location of the collector with the NADP site at Molas Pass would provide data pertinent to Weminuche Wilderness and the headwaters of Vallecito Reservoir. This monitor would be part of the Mercury Deposition Network (MDN). Upgrading the NADP monitoring equipment at Molas Pass to include the MDN specifications would cost $5,000 to $6,000, while annual monitoring costs are $12,112 plus personnel as of September 2006.

Monitoring - Summary of Suggestions / Priorities 11/01/07
113
2. Install and operate a long-term monitoring station for mercury in total deposition (wet and dry) for at
least one MDN station in the Four Corners Region. Speciated data will be collected and analyzed as is feasible. The MDN is currently developing this program and costs are anticipated at about $50,000 per year.
3. Support multi-year comprehensive mercury source apportionment study to investigate the impact of
local and regional coal combustion sources on atmospheric mercury deposition. This type of study would require additional deposition monitoring (i.e., suggestions 1 & 2 above). Speciated data will be collected and analyzed as is feasible. A mercury monitoring and source apportionment study was recently completed for eastern Ohio. (http://pubs.acs.org/cgi-bin/asap.cgi/esthag/asap/html/es060377q.html9). Costs TBD.
4. Support a study of mercury incorporation and cycling in aquatic ecosystem food-webs, including total
and methyl mercury in the food-webs of lakes and wetlands. This option includes studies that determine which ecosystems currently have high levels of total and methyl mercury in food-web components, how mercury levels in ecosystems change over time, where the mercury is coming from, and what conditions are causing the mercury to become methylated (the toxic form of mercury that bio-accumulates in food-webs). This information would allow tracking of mercury risks over time and space and serves as the basis for predicting future impacts. Existing reservoir studies and the upcoming MSI investigation serve as a starting point to build a collaborative and systematic approach. Costs TBD.
5. Support continued studies of mercury concentrations in sensitive human populations in the region to
understand what exposure factors increase likelihood of unhealthy mercury levels in the body. Dr. Richard Grossman’s study serves as a starting point to continue this effort. Costs TBD.
6. Form a multi-partner Mercury Advisory Committee that would work collaboratively to prioritize
research and monitoring needs, develop funding mechanisms to sustain long-term mercury studies, and work to communicate study findings to decision-makers. The Committee would include technical experts and stakeholder representatives from States, local governments, land management agencies, watershed groups, the energy industry, etc.
Nitrogen and Sulfur Compounds While data for N in wet deposition exist from multiple sites in the region, dry deposition is studied only at Mesa Verde National Park, which does not represent higher-elevations common near the Four corners region. Data concerning ecological effects of N deposition are very sparse for both high and low elevations and the limited data that do exist have not been analyzed adequately. No data exists for N and S deposition in the vicinity of emission sources. For example, no monitoring of N and S in wet or dry deposition occurs in NW New Mexico with the exception of Bandelier National Park. Suggestions for Future Monitoring Work for Nitrogen and Sulfur Compounds: Continue monitoring for N, S and H+ in wet deposition via the NADP at the Molas Pass, Wolfe Creek Pass and Mesa Verde National Park sites. Consider adding a site closer to emissions sources in NW New Mexico. Initiate long-term monitoring / modeling of N and S in dry deposition via the Clean Air Status and Trends Network (CASTNet) at a site such as Molas Pass, which is at higher elevation than the one existing site at Mesa Verde NP. Consider adding an additional site closer to emissions sources in NW New Mexico.

Monitoring - Summary of Suggestions / Priorities 11/01/07
114
Complete a full analysis of existing Wilderness Lakes data, including spatial and temporal trends and correlation of measurements with watershed or lake characteristics. Support a suite of ecological studies in order to measure potential harmful effects of N deposition on natural resources across an elevation gradient. The studies should include an observational component aimed at documenting changing ambient conditions, but experimental manipulations should also be used to understand cause and effect relationships in addition to potential future responses. These studies should be modeled after those conducted in the Colorado Front Range, California, etc. Visibility Most visibility monitoring in the Four Corners is unevenly distributed (or restricted) to Class I areas. Therefore, visibility monitoring within these Class I areas is not conducive of a regional trends assessment, especially because they are based on a very few site-specific particulate measurements. Furthermore, the regional monitoring of visibility is desirable, because it can assist with the protection of Class I areas and EPA’s regional haze rule. Additionally, regional monitoring of visibility will better address the value that citizens place upon the vistas that exist outside of Class I areas, while recognizing how visibility impacts citizens’ perceptions of air quality as a whole. In sum, it is highly desirable that we consider how visibility monitoring in the Four Corners region can be perfected, with the intent of making a strong regional assessment. 1. It is recommended that the monitoring sites at Mesa Verde and in the Weminuche resume
photographic documentation. 2. Many previous studies of visibility in the Four Corners relate only to site-specific locations, and often
conflict in their findings. A comprehensive assessment of historical data is needed, in order to determine regional trends or changes in visibility. Currently, it is very difficult not only to establish regional trend analyses, but also to compare them to historical baseline data.
3. Additional visibility monitoring should be established at locations in the region other than what exists
in Class I areas. This additional monitoring:
A. could be incorporated into existing monitoring sites; B. should include photographic documentation; C. and, it should specifically consider how topographical variations impact the measurement of
visibility. 4. The apparent contribution of NOx emissions to wintertime visibility impairment is recommended for
further study. Carbon Monoxide, PM10 and Other Common Pollutants No suggestions for additional monitoring of carbon monoxide, PM10 and other common pollutants are currently being proposed. Literature Cited: 1. Air pollution. http://en.wikipedia.org/wiki/Air_pollution.

Monitoring - Summary of Suggestions / Priorities 11/01/07
115
2. London Smog. http://www.portfolio.mvm.ed.ac.uk/studentwebs/session4/27/greatsmog52.htm, http://en.wikipedia.org/wiki/Great_Smog_of_1952.
3. U. S. Environmental Protection Agency. “The Plain English Guide to the Clean Air Act”. http://www.epa.gov/air/caa/peg/.
4. U.S. Environmental Protection Agency. http://www.epa.gov/ttn/naaqs/. 5. American Lung Association. “Carbon Monoxide”.
http://www.lungusa.org/site/pp.asp?c=dvLUK9O0E&b=35332. 6. U.S. Environmental Protection Agency. http://www.epa.gov/ttn/oarpg/naaqsfin/o3health.html. 7. 7 American Lung Association. “Ozone”.
http://www.lungusa.org/site/pp.asp?c=dvLUK9O0E&b=35352. 8. American Lung Association. “Sulfur Dioxide”.
http://www.lungusa.org/site/pp.asp?c=dvLUK9O0E&b=35358. 9. American Lung Association. “Nitrogen Dioxide”.
http://www.lungusa.org/site/pp.asp?c=dvLUK9O0E&b=35355. 10. American Lung Association. “Lead”. http://www.lungusa.org/site/pp.asp?c=dvLUK9O0E&b=35333. 11. U.S. Environmental Protection Agency. “Particle Pollution and Your Health”.
http://www.epa.gov/airnow//particle/pm-color.pdf. 12. American Lung Association. “Particulate Matter”.
http://www.lungusa.org/site/pp.asp?c=dvLUK9O0E&b=35356. 13. U.S. Environmental Protection Agency. “About Air Toxics”.
http://www.epa.gov/ttn/atw/allabout.html. 14. Interagency Monitoring of Protected Visual Environments. “Visibility: Existing and Historical
Conditions”. http://vista.cira.colostate.edu/improve/Publications/Principle/NAPAP_SOS/Low%20Res/napap%20(low).htm.

Monitoring: Public Comments 11/01/07
116
RESPONSES TO “MONITORING” COMMENTS (by Gordon Pierce)
1. Kandi & David LeMoine, 7/17/2007 “… I reviewed what the monitoring group put together, and I think they did an excellent work.” The workgroup would like to say thanks! (No changes to the report.) 2. BP, 7/13/2007 “While the Draft Report suggestion for addition of new monitoring sites will provide valuable insight to understanding air quality in the region, a detailed analysis of current monitoring data also needs to be conducted to identify trends in air quality. In addition, analyzing trends in monitoring data in conjunction with changes in emissions will provide an important understanding of atmospheric processes. Also, it may be possible to evaluate monitoring data to assist in understanding source receptor relationships. Confidence limits need to be developed based on monitoring accuracy and precision to determine if observed trends in data are statistically significant or simply random variations in analytic methods. There are also bounding calculations that could be performed that may assist in determining how changes in emissions may change visibility. Such calculations would entail using the IMPROVE data and ratioing the concentrations to calculate the improvement in visibility and establish an upper bound of visibility improvement. It is recommended that the Task Force conduct a detailed analysis of the IMPROVE monitoring data in the region since BP believes that such an analysis would assist in developing meaningful strategies for improving air quality in the region. BP would welcome the opportunity to assist in establishing a scope of work for such an activity.” (Full response to be written by Sylvia Oliva.) The workgroup agrees that it would be nice to do more with trends analyses, confidence limits and IMPROVE data analyses. However, this was much more work than the workgroup had time to do. (No changes to the report.) 3. Jeanne Hoadley, 7/10/2007 “I would find it helpful if the wind roses on the maps were labeled with the station name.” The workgroup debated extensively as to how much information should be included on the wind rose maps. It was felt that adding more information would make the maps too cluttered and that station names should be presented separately. Thus, maps with only the station names and elevations are presented immediately preceding the wind rose maps. (No changes to the report.) 4. Jeanne Hoadley, 7/10/2007 “Under existing ozone data for the four corners region it says a Navajo Nation site is scheduled to begin operating in Shiprock but doesn't say when. If it is scheduled this implies we know when and we should say. If we don't know when we should say it is expected to begin operating soon.” At the time this subsection was written, there was not a specific date as to exactly when the Navajo Nation would be able to get their new air monitoring site fully operational. In further conversations with the Navajo Nation, the date is still uncertain due to electrical power issues. The report will be revised so that the text reads that the site is planned to commence operation by the end of 2007. (See report for revision under OZONE AND PRECURSOR GASES subsection, “Existing Ozone Data for the Four Corners Region”.)

Monitoring: Public Comments 11/01/07
117
5. Jeanne Hoadley, 7/10/2007 “Under existing ozone data for the four corners region it says a Navajo Nation site is scheduled to begin operating in Shiprock but doesn't say when. If it is scheduled this implies we know when and we should say. If we don't know when we should say it is expected to begin operating soon. The next sentence has a typo...the "closest" Arizona site.” Thank you for catching the typo. The word will be revised from “closes” to “closest”. (See report for revision under OZONE AND PRECURSOR GASES subsection, “Existing Ozone Data for the Four Corners Region”.) 6. Mark Jones, 7/10/2007 “Comment on behalf of Roy Paul, "Why is there no ozone monitoring on the Western Slope of Colorado?"” There are questions as to whether this comment is referring to the southwest/Four Corners area of Colorado or further north, such as around Mesa and Garfield counties in Colorado. For the southwest/Four Corners area, which is the focus of this workgroup, ozone monitoring is currently performed at four locations in Colorado. These locations are shown on the map in the “Ozone and Precursor Gases” subsection of the report. In addition, for recommendation #2 in the subsection, a passive ozone study was performed in the area during August 2007 using monies recently appropriated by the Colorado legislature. A revision to address this is made under recommendation #2. (See report for revision under OZONE AND PRECURSOR GASES subsection, recommendation #2.) 7. Jeanne Hoadley, 7/10/2007 “The pollutants in the header seem to be out of place in this table.” This appears to have been an issue with the software and comment version of the report on the website. The tables are correct in the actual report. (No changes to the report.) 8. Jeanne Hoadley, 7/10/2007 “Again the header in this table is messed up, making it impossible to understand.” This appears to have been an issue with the software and comment version of the report on the website. The tables are correct in the actual report. (No changes to the report.) 9. Jeanne Hoadley, 7/10/2007 “Mercury- Rationale and Benefits. It is not clear to me why Weminuche Wilderness is singled out here...there are many other Class 1 areas in or near this region.” (Full response to be written by Koren Nydick.) The commenter is correct in that other Class 1 areas are in the region. Weminuche was simply being used as an example. Mercury will be clarified in the report and other Class 1 areas will also be listed or mapped. (See revisions from Koren Nydick.)
Monitoring: Public Comments 11/01/07
118
Response to BP’s Comments (by Sylvia Oliva) “Detailed analysis [analyses] of current monitoring data” including trends and back trajectories are already available on the Interagency Monitoring for the Projected Visual Environment, IMPROVE, web site (http://vista.cira.colostate.edu/improve/). Mesa Verde National Park data reaches back to the early 1990s. The highest standard possible for “accuracy and precision” of IMPROVE filters is well-established by the monitoring analysis agency: Crocker Nuclear Labs, University of California at Davis. IMPROVE filter analyses include x-ray spectroscopy and related techniques. The filters themselves are of several different materials to best trap different aerosols and particulates. (This is why, unfortunately, data availability is traditionally in arrears for 12 to18 months.) Furthermore, any changes in filter composition or analysis protocol through the years are precisely notated in the preamble for accessing raw data for either single or groups of IMPROVE sites, single or groups of parameters. It indeed would contribute to important understanding of atmospheric processes to take IMPROVE trend data (already available as previously mentioned) with emissions changes to assist in “understanding source-receptor relationship[s].” The caveat, here is that Mesa Verde data is not truly representative of visibility impairment in that the park’s physical location (and therefore its IMPROVE site) is really not within the impairment atmosphere, contrary to other parks, e.g. Grand Canyon NP, Yellowstone, NP, or the Great Smokies NP. Rather, the visitor at Mesa Verde sees visibility impairment from outside. Likely, Mesa Verde IMPROVE data might be matched as background with other IMPROVE station data. So, such a tremendously laudable project correlating trends with emissions sources is not within the present financial means and scope of the current task force. Dramatic improvements in computer processing power the past two years will quite revolutionize modeling techniques. If these techniques are already incorporated into modeling software, establishing “an upper bound of visibility improvement” may well be a more realistic task than heretofore. (See Marufu, L. T. et al, The 2003 North American electrical blackout: An accidental experiment in atmospheric chemistry, Geophys. Res. Lett., 31, L13106, doi:10.1029/2004GL019771. “The dramatic improvement in air quality during the blackout may result from underestimation of emissions from power plants, inaccurate representation of power plant effluent in emission models or unaccounted for atmospheric chemical reaction(s).”)