Embed Size (px)
Citation preview

Foundry Industry 2020: Trends and Challenges
Frankfurt am Main, June 2015

Agenda2
1 Economic environment of the global foundry industry
2 Casting production: Growth in eastern markets
3 Differences in earnings
Appendix

World Economy 2030: China moves ahead, India catches up with EU and US
Source: E.I.U.
Population in million
3
GDP in PPP in prices of 2005 in bn US-$
0 10 20 30 40
Russia
Brazil
USA
EU28
India
China
2014 Forecast 2030
0 500 1000 1500
Russia
Brazil
USA
EU28
India
China
2014 Forecast 2030

Eurozone: Improvement amid positive general conditions
Real GDP growth in %, qoq Real GDP growth in %, qoq
In detail
Sources: Eurostat, IKB research (seasonally adjusted )
4
We see signs of a further stabilization in the eurozone. The growth rate was significantly higher in the fourth quarter of 2014 and GDP improvement could be observed in most countries. Only Italy (0.0 %) and France (0.1 %) lagged behind
Therefore, IKB forecasts GDP growth of 1.3 % for the eurozone in total
The depreciation of the Euro, lower oil prices and low interest rates should stimulate growth in the eurozone going forward
-1,2
-0,8
-0,4
0,0
0,4
0,8
1,2
1,6
2,0
2011Q1 2012Q1 2013Q1 2014Q1
-1,2 -1,0 -0,8 -0,6 -0,4 -0,2 0,0 0,2 0,4 0,6 0,8 1,0 1,2
Cyprus
Finland
Greece
Italy
France
Belgium
Austria
Netherlands
Portugal
Slovakia
Germany
Spain
Estonia
4. Q. 2014 3. Q. 2014
Euro-Zone:Q3: +0.2 %Q4: + 0.3%

Light vehicles: China dominates while production in Japan/ Korea declines
Global light vehicle production (in million)
Source: IHS
5
The German car manufacturers are expected to gain market share during the recovery of the Western European automotive industry
The positive development in North America results from growing production in Mexico and investments of foreign OEMs in the US
South Asia and Japan/ Korea lose production volumes to China
2022
2020
2018
2014
2013
North America EuropeChina
Japan/ Korea
South AsiaMiddle East/ Africa
South America
16.2 17.0 18.6 18.9 19.0 19.5 20.1 22.1 22.5 22.9
21.3 23.0
28.830.8 32.5
13.5 13.7 12.4 12.1 12.2
8.2 7.810.7 12.0 13.21.6 1.9 2.3 2.4 2.5
4.5 3.8 4.4 4.8 5.2

Changing light vehicle material mix6
Increasing requirements for energy efficiency and stronger emission regulations will support the trend towards lightweight production in the upcoming two decades
The biggest loser concerning the change of material application is conventional steel. In the future, only about one fifth of the total materials used will be conventional steel. Another fifth will be accounted for by high-tensile steel
The light metals aluminum and magnesium will significantly gain in importance
Another fifth will be made up by plastics and composites, of which however only a small share is attributable to carbon fibers, mainly used in luxury class
0
10
20
30
40
50
60
70
80
1975 2012 2035
Material split in light vehicles; in % In detail
Source: VDI

Emission regulations stimulate demand for trucks
Global truck production (in thousand)
Source: IHS
7
Regulations of the European Union and the US target reduced fuel consumption and lower emissions
This leads to investments in the modernization of truck fleets
465 542 581 578 602
North America
2021
2018
2016
2014
2013
588 553 624764
863
Europe
1,225 1,167 1,1411,234 1,234
China
388 393 403 395 408
Japan/ Korea
422 439593
718815
South Asia
3 3 4 4 4
Middle East/ Africa
258 195 217 240 271
South America

Mechanical engineering: Recovery in Europe, growth in Asia
Global mechanical engineering revenues (in €bn)
Sources: VDMA, IKB forecast
8
Globally, we expect a strong increase in demand for mechanical engineering products
In 2016, revenues of China will surpass the sum of both North America and rest of Asia taken together
In Europe, Germany and Italy gain market shares to the detriment of other Western European countries
As in the automotive industry, trends towards lightweighting and higher flexibility in robotics & machine tools increase the use of aluminum
352 369 395 413 421
North America
2020
2018
2016
2014
2013
692 699 728 756 773
Europe
766835 860 903 921
China
349439 464 469 479
Rest of Asia
66 68 71 71 72
Rest of the world

9
Construction sector: Improvement in the US, China still strong
Global construction & engineering industry; in US-$ bn
Total construction volume in selected countries; in €m
Boom through urbanization
Sources: ifo; MARKETLINE; Worldbank
The US construction industry is expected to see a strong increase
in construction starts
Today, more than half of the Chinese population lives in rural
areas. Further migratory movements into urban regions are
expected during the next ten years
The construction sector in the European Union is also likely to
revitalize. Eastern European EU members are likely to show
significantly higher growth compared to Western European
countries. Even the Spanish construction industry seems to show a
slight recovery after years of significant decline0
1000
2000
3000
4000
5000
2012 2013 2014 2015 2015 2017
Urban population share; in %
0
20
40
60
80
100
1960 1965 1970 1975 1980 1985 1990 1995 2000 2005 2010
China Japan Korea Germany UK

Agenda10
1 Economic environment of the global foundry industry
2 Casting production: Growth in eastern markets
3 Differences in earnings
Appendix

Iron and steel cast: Asia outgrows general market
Global grey iron, ductile iron and steel cast production (in million tons)
11
Production in Western Europe mostly stable with relative market share gains in Germany
NAFTA states profit from the re-industrialization due to lower energy costs, inducing significant growth especially in Mexico
China´s market share grows further, India catches up, Japan and Korea lose casting production to these countries
1) Includes Australia
Sources: World Census, CAEF, IKB
34.8 37.0 38.0 40.0 42.5 45.0
15.3 15.5 15.8 16.4 16.4 17.1
7.1 7.7 7.9 7.9 8.4 8.2
3.4 3.0 3.0 3.1 3.3 3.6
7.711.7 11.7 12.3 12.6 12.5
9.0 9.1 8.9 9.2 9.6 9.4
NAFTA
Western EuropeEastern Europe
China
Rest of Asia-Pacific1)Rest of the world2020
2018
2015
2013
2012
2010
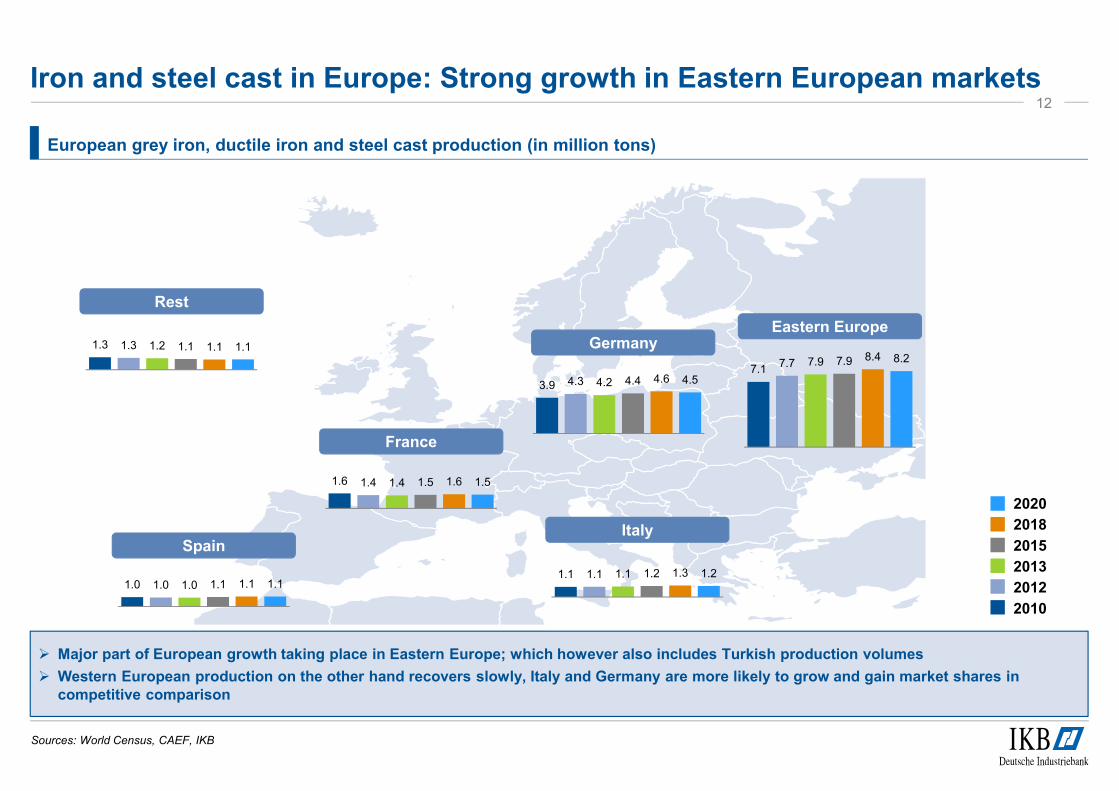
Iron and steel cast in Europe: Strong growth in Eastern European markets
European grey iron, ductile iron and steel cast production (in million tons)
Sources: World Census, CAEF, IKB
12
Afrika
Major part of European growth taking place in Eastern Europe; which however also includes Turkish production volumes
Western European production on the other hand recovers slowly, Italy and Germany are more likely to grow and gain market shares in competitive comparison
1.3 1.3 1.2 1.1 1.1 1.1
1.6 1.4 1.4 1.5 1.6 1.5
3.9 4.3 4.2 4.4 4.6 4.57.1
7.7 7.9 7.9 8.4 8.2
1.1 1.1 1.1 1.2 1.3 1.21.0 1.0 1.0 1.1 1.1 1.1
2020
2018
2015
2013
2012
2010
Rest
Spain
France
Germany
Italy
Eastern Europe

Global aluminum cast production (in million tons)
13
Aluminum cast: China dominates its competitors
Germany gains market shares within Europe at the expense of Western European competitors; catching-up process stronger in Eastern Europe
Most of the growth in NAFTA states due to investments of foreign OEMs
Korea und Japan lose market shares to China
1) Includes Australia
Sources: World Census, CAEF, IKB
3.84.5 4.7 5.0 5.0 5.2
1.0 1.5 1.6 1.6 1.8 1.9
2.2 2.3 2.3 2.4 2.6 2.9
0.3 0.2 0.3 0.3 0.4 0.4
2.02.6 2.7 2.8 3.0 3.1
2020
2018
2015
2013
2012
2010
1.5
3.2 3.2 3.3 3.4 3.4
NAFTA
Western EuropeEastern Europe
China
Rest of Asia-Pacific1)Rest of the world

European aluminum cast production (in million tons)
Sources: World Census, CAEF, IKB
14
Afrika
The leap in Eastern Europe can be associated with the commissioning of a new alloy wheel production in Turkey; furthermore, capacities in Slovakia were expanded
After strong growth in 2014, the German aluminum foundries are approaching the 1 million ton mark of good cast
Aluminum cast in Germany: Approaching 1 million tons
2020
2018
2015
2013
2012
2010
0.1 0.1 0.1 0.1 0.1 0.1
1.0
1.51.6 1.6
1.8 1.9
0.8 0.8 0.91.1 1.0
1.2
0.7 0.7 0.7 0.7 0.8 0.8
0.3 0.3 0.3 0.3 0.3 0.4
0.3 0.3 0.3 0.2 0.4 0.4
Rest
Spain
France
Germany
Italy
Eastern Europe

Copper cast: China significantly ahead of other regions
Global copper cast production (in thousand tons)
15
The global copper cast production increased by 2.7% annually between 2010 and 2013 – until 2020 a significantly lower growth rate of 0.6% is forecasted
While China´s market share remained constant since 2010, particularly the USA was able to gain market share; going forward no major changes of market positions are expected
1) Includes Australia
Sources: World Census, CAEF, IKB
217 207 197 211 217 223
NAFTA
Western EuropeEastern Europe China
Rest of Asia-Pacific1)Rest of the world
418511 477 480 485 493
134 137 144 111 115 127
700 750 750 770 780 780
141 161 182 186 195 19633 29 32 33 34 35
2020
2018
2015
2013
2012
2010
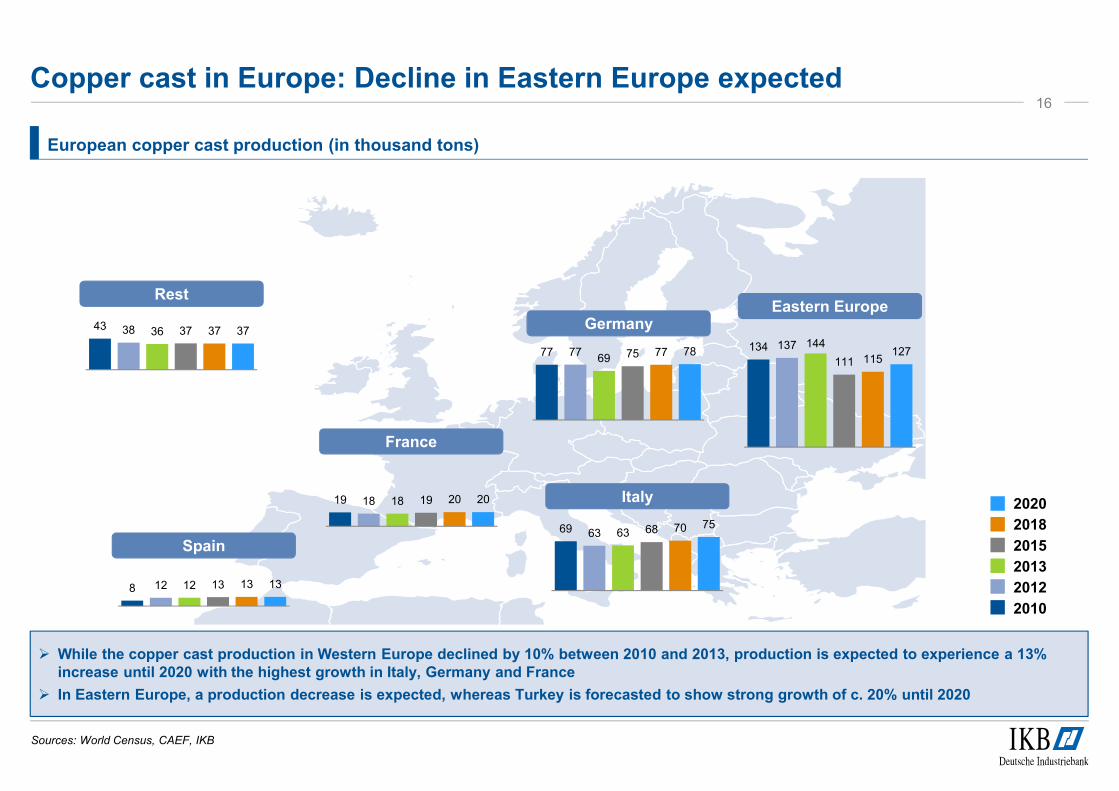
European copper cast production (in thousand tons)
Sources: World Census, CAEF, IKB
16
Afrika
While the copper cast production in Western Europe declined by 10% between 2010 and 2013, production is expected to experience a 13% increase until 2020 with the highest growth in Italy, Germany and France
In Eastern Europe, a production decrease is expected, whereas Turkey is forecasted to show strong growth of c. 20% until 2020
Copper cast in Europe: Decline in Eastern Europe expected
2020
2018
2015
2013
2012
2010
43 38 36 37 37 37
Rest
Spain
France
Germany
Italy
Eastern Europe
8 12 12 13 13 13
19 18 18 19 20 20
69 63 63 68 70 75
77 7769 75 77 78 134 137 144
111 115127

Key developments in the German foundry market
Development of the EST casting production1)
3.56 3.70 3.80 3.75 3.864.09 4.04
4.524.78 4.79
3.21
3.86
4.49 4.28 4.16 4.35 4.55 4.45
0.0
1.0
2.0
3.0
4.0
5.0
6.0
Total Grey cast Spheroidal graphite cast Steel and malleable cast
Development of the number of iron & steel foundries
310
265 258
2003 2008 2013
Iron and steel foundries
Composition of the casting production
60%
34%
6%
In detail
The average output per foundry increased by around 30% between 2003 and 2013, from 12,452 t to 16,124 t
Growing importance of spheroidal graphite cast iron (partly due to vermicular graphite cast)
German foundries with market share gains in Europe strengthen sales volume
Relative performance of foundries with good contacts to German premium OEMs considerably better compared to other foundry companies
1) For 2015, 2018 and 2020: IKB extrapolation
Sources: Modern Casting, IKB research & analysis
17
Cast production in mt
1999
3.56 mt
2006 2013
57%37%
6%
57%37%
6%
4.52 mt 4.16 mt
Grey castSpheroidal graphite cast
Steel and malleable cast
-17%

Key developments in the French foundry market
Development of the EST casting production1)
2.152.29
2.15
2.63
2.13 2.06 1.97 2.06 2.12 2.06
1.491.62 1.68
1.44 1.42 1.48 1.50 1.50
0.0
0.5
1.0
1.5
2.0
2.5
3.0
Total Grey cast Spheroidal graphite cast Steel and malleable cast
Development of the number of iron & steel foundries
Composition of the casting production
48%
45%
7%
In detail
The average output per foundry decreased by nearly 11% between 2003 and 2013, from 12,754 t to 11,360 t
Strong drop caused by decreasing domestic vehicle production
Also weak performance on the part of French mechanical engineering companies
1) For 2015, 2018 and 2020: IKB extrapolation
Sources: Modern Casting, IKB research & analysis
18
Cast production in mt
1999
2.15 mt
2006 2013
42%
52%
6%
45%
50%
6%
2.06 mt 1.42 mt
Grey castSpheroidal graphite cast
Steel and malleable cast
167
147
125
2003 2008 2013
Iron and steel foundries
-25%

Key developments in the Italian foundry market
Development of the EST casting production1)
1.49 1.521.43 1.46 1.44
1.51 1.52 1.561.66 1.66
1.001.10
1.241.12 1.15 1.20 1.25 1.20
0.0
0.2
0.4
0.6
0.8
1.0
1.2
1.4
1.6
1.8
Total Grey cast Spheroidal graphite cast Steel and malleable cast
Development of the number of iron & steel foundries
Composition of the casting production
69%
26%
6%
In detail
The average output per foundry increased by more than 42% between 2003 and 2013, from 4,645 t to 6,609 t
The Italian foundry market has a relatively small-scale organization
The development is negatively influenced by high energy costs as well as a weak Fiat production
Upside potential due to recovery of the Italian mechanical engineering industry
1) For 2015, 2018 and 2020: IKB extrapolation
Sources: Modern Casting, IKB research & analysis
19
Cast production in mt
1999
1.49 mt
2006 2013
60%
35%
5%
60%
34%
6%
1.56 mt 1.15 mt
Grey castSpheroidalgraphite cast
Steel and malleable cast
310
197174
2003 2008 2013
Iron and steel foundries
-44%

Key developments in the Spanish foundry market
Development of the EST casting production1)
1.03 1.03
1.29 1.34
1.00
1.14 1.14 1.171.28 1.22
0.80
1.031.11
0.99 0.981.05 1.10 1.10
0.0
0.2
0.4
0.6
0.8
1.0
1.2
1.4
1.6
Total Grey cast Spheroidal graphite cast Steel and malleable cast
Development of the number of iron & steel foundries
Composition of the casting production
43%
46%
10%
In detail
After the drop of the Spanish economy in 2007, not least because of the plummeting construction industry, the EST casting production decreased as well (particularly in construction-related segments)
Based on the slight recovery in 2013, we are expecting a moderate rise of casting tonnage until 2018
In total, a constant change of the casting production from grey cast to more complex material groups such as spheroidal graphite iron was observed. This is mainly caused by mechanical engineering and vehicle manufacturing
During the past ten years, a strong consolidation wave took place in the Spanish foundry market
Thus the average output per foundry rose; nevertheless reaches only three quarters of the German comparison value
1) For 2015, 2018 and 2020: IKB extrapolation
Sources: Modern Casting, IKB research & analysis
20
Cast production in mt
1999
1.03 mt
2006 2013
38%
53%
9%
33%
59%
8%
1.17 mt 0.98 mt
Grey castSpheroidal graphite cast
Steel and malleable cast
189
9178
2003 2008 2013
Iron and steel foundries
-59%
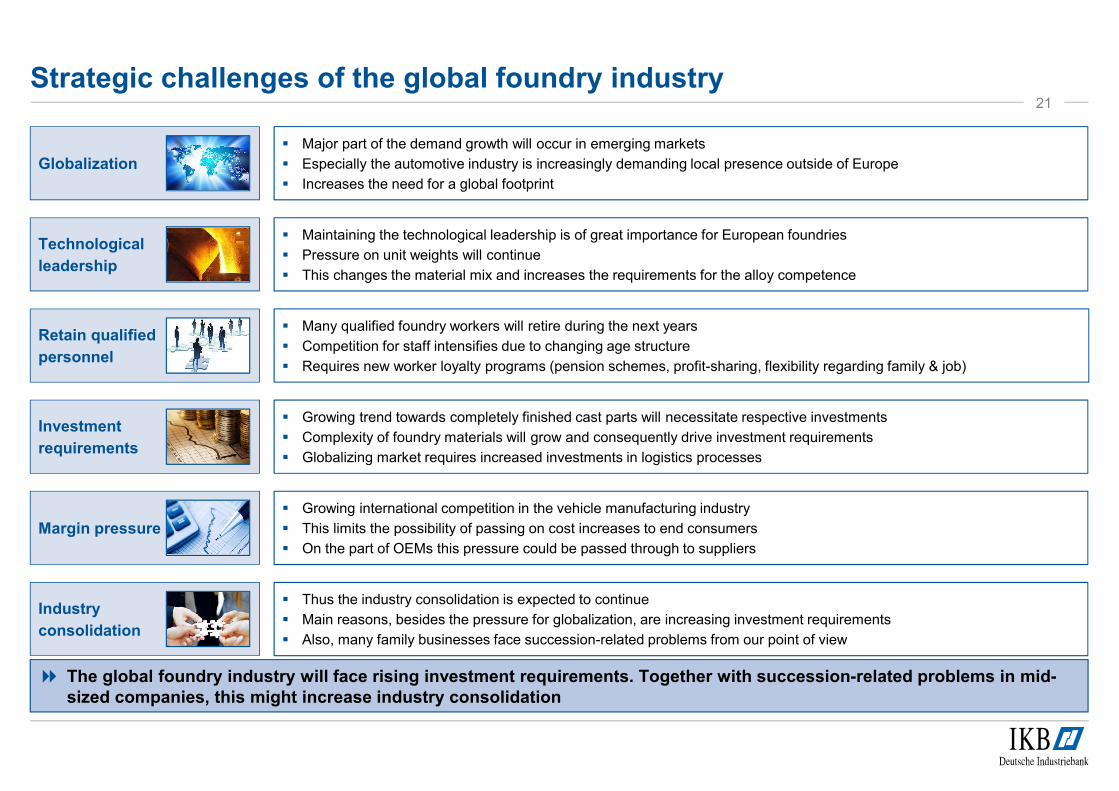
Strategic challenges of the global foundry industry
Globalization
Major part of the demand growth will occur in emerging markets
Especially the automotive industry is increasingly demanding local presence outside of Europe
Increases the need for a global footprint
Technological
leadership
Maintaining the technological leadership is of great importance for European foundries
Pressure on unit weights will continue
This changes the material mix and increases the requirements for the alloy competence
Retain qualified
personnel
Many qualified foundry workers will retire during the next years
Competition for staff intensifies due to changing age structure
Requires new worker loyalty programs (pension schemes, profit-sharing, flexibility regarding family & job)
Investment
requirements
Growing trend towards completely finished cast parts will necessitate respective investments
Complexity of foundry materials will grow and consequently drive investment requirements
Globalizing market requires increased investments in logistics processes
Margin pressure
Growing international competition in the vehicle manufacturing industry
This limits the possibility of passing on cost increases to end consumers
On the part of OEMs this pressure could be passed through to suppliers
Industry
consolidation
Thus the industry consolidation is expected to continue
Main reasons, besides the pressure for globalization, are increasing investment requirements
Also, many family businesses face succession-related problems from our point of view
The global foundry industry will face rising investment requirements. Together with succession-related problems in mid-sized companies, this might increase industry consolidation
21

Agenda22
1 Economic environment of the global foundry industry
2 Casting production: Growth in eastern markets
3 Differences in earnings
Appendix

Sales development influenced by drop of raw material prices
Sales development in an international comparison In detail
The global foundry industry was able to expand its tonnage; however, the drop of raw material prices, given a material use of on average half of total output, prevented a respective sales increase
At the beginning of 2011, the price per ton of aluminum alloy at the LME was 2,275 US$/t, in 2013 it was only 1,790 US$/t
Drop of about 21%
Prices for old steel scrap (type 1) declined from on average 342.50 €/t in January 2011 to 250 €/t in December 2013
Drop of about 27%
Therefore, the sales drop of German and international foundries is relativized
The expansion of casting tonnage was accompanied by a price drop for raw materials, effectively preventing a respective sales increase
Sources: Bureau van Dijk, S&P Capital IQ, IKB research
23
-3.1%
-2.2%
-1.5%
-2.6%
2.1%
-2.3%
2012 2013
Germany Europe International
Weighted average
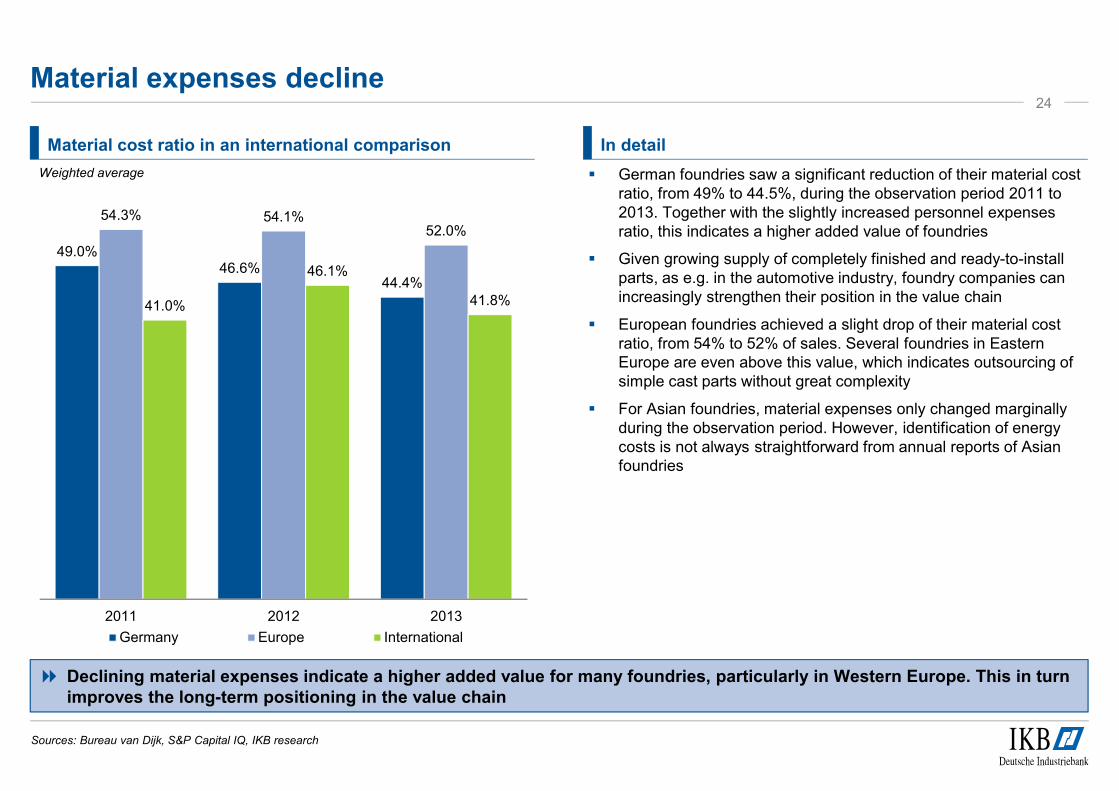
Material expenses decline
Material cost ratio in an international comparison In detail
German foundries saw a significant reduction of their material cost ratio, from 49% to 44.5%, during the observation period 2011 to 2013. Together with the slightly increased personnel expenses ratio, this indicates a higher added value of foundries
Given growing supply of completely finished and ready-to-install parts, as e.g. in the automotive industry, foundry companies can increasingly strengthen their position in the value chain
European foundries achieved a slight drop of their material cost ratio, from 54% to 52% of sales. Several foundries in Eastern Europe are even above this value, which indicates outsourcing of simple cast parts without great complexity
For Asian foundries, material expenses only changed marginally during the observation period. However, identification of energy costs is not always straightforward from annual reports of Asian foundries
Declining material expenses indicate a higher added value for many foundries, particularly in Western Europe. This in turn improves the long-term positioning in the value chain
Sources: Bureau van Dijk, S&P Capital IQ, IKB research
24
Weighted average
49.0%46.6%
44.4%
54.3% 54.1%52.0%
41.0%
46.1%
41.8%
2011 2012 2013
Germany Europe International

Personnel expenses globally increasing
Personnel expenses ratio in an international comparison
21.4%
23.5%
26.1%
17.9%19.1% 19.0%
9.3%10.0%
9.2%
2011 2012 2013
Germany Europe International
In detail
The personnel expenses ratio predominantly increased across all regions, except for Asia, where it rather stagnated
However, personnel expenses are in general significantly lower in Asian countries. Note that our selection comprises primarily Chinese and Indian foundries. In Japan, expenses are comparable to German levels
Further increasing personnel expenses are expected in emerging markets going forward
Despite the crisis in the Euro-zone, rising personnel expenses ratios were observed within Europe. The ratio rose from 18% to 19% between 2011 and 2013. Differences can be seen between Western and Eastern European states. In spite of increasing salaries, personnel expenses ratios in the latter region remained considerably lower
In Germany, personnel expenses rose from c. 21.5% to 26%. The gap between Western and Eastern German foundries reduced
In the medium-term, personnel expenses in Asian emerging markets are forecasted to increase further
Sources: Bureau van Dijk, S&P Capital IQ, IKB research
25
Weighted average

EBITDA: Profitability under pressure
EBITDA margin in an international comparison In detail
Profitability of foundries tended to decrease during the observation period. Despite the reduction of material expenses in all regions, this was not sufficient for a noteworthy improvement of earnings
Asian foundries experienced the largest decline. While their operating profitability, as measured by EBITDA, was considerably higher than the comparison values of German and European foundries in recent years, foundries from all observed regions are now on average on a comparable level
Reasons for the low profitability are on the one hand increasing pricing pressure of the leading customer industry, vehicle manufacturing, and on the other hand overcapacities in individual sub-segments
Sub-segments with particularly high overcapacities were:
a) Construction-related casting applications in Southern European countries
b) Castings for wind turbine components, especially for offshore plants. Here, not only the planned commissioning dates werepushed back, also the overall market expectations were revised downwards relative to previous forecasts
Pricing pressure of customer industries recently increased
Sources: Bureau van Dijk, S&P Capital IQ, IKB research
26
8.3%
7.6%7.9%
8.6%
7.7%
8.4%
10.8%
8.7%
8.0%
2011 2012 2013
Germany Europe International
Weighted average

Divergent capital base
Equity ratio in an international comparison In detail
German foundries experienced a declining capital base primarily caused by increasing investments between 2011 and 2013
European foundries outside of Germany on the other hand were able to stabilize their capital base. However, this was also due to a scaling back of investments, partly caused by limited access to loans in Southern Europe. This in turn could lead to a degradation of the companies’ competitive positions in the medium- to long-term
Asian foundries on the contrary were able to increase their capital base. In this context, relevant companies profited from various subsidies and tax incentives
Asian foundries profit from subsidization and overall good market environment
Sources: Bureau van Dijk, S&P Capital IQ, IKB research
27
36.2%37.2%
34.4%
37.7%38.9%
37.4%37.9%39.1%
41.9%
2011 2012 2013
Germany Europe International
Weighted average

Conclusion 28
The global foundry industry is set to profit from strong growth of key customer industries during the next years
Asia is expected to outgrow the general market even in the medium- to long-term
Competitive pressure from other technologies e.g. forging or sheet metal forming is expected to remain strong; however, especially for structural components in light vehicles we see a trend towards casting technologies
In Europe, we expect higher growth rates for aluminium foundries compared to iron, ductile iron and steel foundries. In Germany, an aluminium casting production of around 1.2 million tons is possible until 2020
The profitability, as measured by EBITDA margin, globally declined during the last years due to increased pressure from customer industries. Asian foundries with higher capital base, not least resulting from various forms of subsidies
During the next years we forecast an ongoing consolidation process in the global foundry industry

Agenda29
1 Economic environment of the global foundry industry
2 Casting production: Growth in eastern markets
3 Differences in earnings
Appendix

Your contact persons at IKB30
Dr. Heinz-Jürgen BüchnerManaging Director, Industrials, Automotive & Services
Phone: +49 (69) 79599-9602
Fax: +49 (69) 79599-8602
Mobile: +49 (171) 2249517
Email: [email protected]
Jonas GloßnerAnalyst, Industrials, Automotive & Services
Phone: +49 (69) 79599-9719
Fax: +49 (69) 79599-8719
Mobile: +49 (170) 9146487
Email: [email protected]
IKB Deutsche Industriebank AG
Eschersheimer Landstraße 121
60322 Frankfurt
Germany
Disclaimer
Copyright: 2015
Published by: IKB Deutsche Industriebank AG, Wilhelm-Bötzkes-Straße 1, 40474 DüsseldorfPublic limited company under German lawRegistered office: Düsseldorf, GermanyRegistered at the Düsseldorf District Court, Commercial Register no. HR B 1130Chairman of the Supervisory Board: Bruno ScherrerChairman of the Board of Managing Directors: Dr. Michael H. WiedmannMembers of the Board of Managing Directors: Dr. Dieter Glüder, Claus Momburg
This document has been prepared for presentational purposes. The information in this presentation (both oral and written) (the “Presentation”) is indicative and is provided for information and discussionpurposes only. The Presentation has been prepared by IKB Deutsche Industriebank AG, Düsseldorf (“IKB”) for IKB’s use only within the Federal Republic of Germany (“Germany”) and the United Kingdom(“UK”). IKB or any of its officers or directors will not accept or assume any responsibility for any distribution or delivery outside Germany and the UK. Neither this Presentation nor any copy of it may be taken,transmitted or distributed, directly or indirectly, in or into any other country by any recipient and this restriction specifically includes Japan, Canada and the United States of America, its territories orpossessions and U.S. persons (as defined in Regulation S under the United States Securities Act) except pursuant to an exemption there from. Neither this Presentation nor any copy hereof may bedistributed in any other jurisdictions where its distribution may be restricted by law and persons into whose possession this Presentation comes should inform themselves about, and observe, any suchrestrictions. Distribution of this Presentation in the United States, Canada, Japan or any such other jurisdictions may constitute a violation of United States, Canadian or Japanese securities laws, or the law ofany such other jurisdictions.
The Presentation is not an offer, or a solicitation to offer, to invest, or to procure an investment in, assets of whatever kind, or to issue or sell or procure the issuance or sale of such assets. This document isexempt from the general restriction on the communication of invitations or inducements to enter into investment activity and therefore its contents have not been approved by an authorized person as wouldotherwise be required by section 21 of the Financial Services and Markets Act 2000. This document is directed exclusively to market counterparties and intermediate customers as defined in FSA rules or topersons who are authorized persons or investment professionals as defined in Article 19 of the FSMA 2000 (Financial Promotion Order) 2001. No other persons should receive any information in thisdocument. It is a condition of your attending this Presentation that you fall within, and you warrant and undertake to IKB that (i) you fall within one of the categories of persons described above, (ii) you haveread, agree to and will comply with the terms of this disclaimer and (iii) you will conduct your own analyses or other verification of the data set out in the Presentation.
The information contained herein does not purport to be complete. No representation or warranty, express or implied, is made by IKB or any of its officers or directors as to the accuracy or completeness ofsuch information, and nothing contained in this Presentation is, or shall be relied upon as, a promise or representation or advice by IKB or any of its officers or employees. IKB does not provide anyinvestment services or ancillary services according to the Directive 2004/39/EC of the European Parliament. Any investment decision you take is in reliance on your own analysis and judgment and/ or that ofyour advisors and not in reliance on us. This Presentation must not be viewed as research and its contents do not constitute advice, including investment advice. The information contained in the Presentationis for background purposes only and is subject to material updating, completion, revision, amendment and verification. Various factors could cause actual future results, performance or events to differmaterially from those described in these statements, including as a result of changes in (among other things) general economic conditions, the conditions of the financial markets in Germany, in WesternEurope and in the United States, the performance of the IKB’s core markets and changes in laws and regulations. Opinions expressed herein are subject to change without notice and may differ from, or becontrary to, the opinions expressed herein. Therefore, prior to entering into any transaction, you should determine, without reliance on IKB, the economic risks or merits, as well as the legal, tax andaccounting characteristics and consequences of the transaction and that your are able to assume these risks. You may use the information in this Presentation for discussion purposes only and not make anoffer to sell or issue or a solicitation of an offer to buy or issue assets. The Presentation is proprietary information of IKB, some of which is also confidential and should not be copied, distributed or passed on,directly or indirectly, to any other persons. The Presentation and any further confidential information made available to you are being supplied to you solely for your information and may not be reproduced,forwarded to any other person or published, in whole or in part, for any other purpose.
This document does not disclose all the risks and other significant issues relating to any investment to which this document may relate. By accepting the Presentation and/ or attending this Presentation youagree to be bound by the above provisions. To the maximum extent permitted by law, IKB (and any of its officers and employees) does not accept any responsibility for or makes any representation, expressor implied, or gives any warranty with respect to the use, the accuracy, correctness or completeness of the information provided during the Presentation and in any written material distributed during thePresentation and does not accept any liability, including, without limitation, any liability arising from fault or negligence, for any loss arising from the use of this Presentation or its contents or otherwise arisingin connection with it. Additionally, IKB will not update such information, in particular any forward-looking statements, or correct any inaccuracies contained herein.