Embed Size (px)
Citation preview

Annual R
eport 200
9
Founded in 1994, Credit Europe
Bank NV has grown towards a solid,
international financial services group,
ranked in the top 10 of Dutch banks
with a total balance sheet of around
€10 billion. With 200 branches and
more than 5,000 employees working
in 11 countries, we serve around three
million customers worldwide. The Bank’s
mission is to offer tailor-made corporate
banking services and easy-to-use and
efficiently delivered retail products.
Annual R
eport 200
9Credit Europe Bank N
V

Annual R
eport 200
9
Founded in 1994, Credit Europe
Bank NV has grown towards a solid,
international financial services group,
ranked in the top 10 of Dutch banks
with a total balance sheet of around
€10 billion. With 200 branches and
more than 5,000 employees working
in 11 countries, we serve around three
million customers worldwide. The Bank’s
mission is to offer tailor-made corporate
banking services and easy-to-use and
efficiently delivered retail products.
Annual R
eport 200
9Credit Europe Bank N
V

Our regulatory framework: legal structure and main regulators
Credit Europe
Bank NV
(Netherlands)
Russia Switzerland
Netherlands
Dut
ch C
entr
al B
ank
Ban
k of
R
ussi
a
Swis
s N
at.
Ban
k &
SFB
C
Nat
iona
l Ban
k of
Rom
ania
Nat
iona
l Ban
k of
Ukr
aine
Dub
ai F
SA
BR
SA
Romania
Germany
Ukraine
Belgium
Istanbul,
Turkey
Dubai Turkey 1
1 Following acquisition of Millennium Bank AS, as announced in early 2010, subject to regulatory approvals.
New corporate website
Credit Europe Bank NV has a new corporate website. For more information, please see www.crediteurope-bank.com or visit one of our local websites. The website addresses of our worldwide network of branches and subsidiaries can be found on page 120 of this report.
Malta
Shanghai,
China
BRANChES BRANChES
SUBSiDiARiES
REpRESENTATiVE oFFiCES

Business segmentsOur regulatory framework: legal structure and main regulators
Corporate banking
Direct retail banking
Commercial and small business banking
Plastic cards
Private banking and portfolio management
Representative office
Netherlands
Germany
BelgiumM
alta
Switzerland
Romania
Russia
UkraineDubai
istanbul,
Turkey
Shanghai,
China
Credit Europe
Bank NV
(Netherlands)
Russia Switzerland
Netherlands
Dut
ch C
entr
al B
ank
Ban
k of
Swis
s N
at.
Nat
iona
l
Nat
iona
l
Dub
ai F
SA
BR
SA
Romania
Germany
Ukraine
Belgium
Istanbul,
Turkey
Dubai Turkey 1
1 Following acquisition of Millennium Bank AS, as announced in early 2010, subject to regulatory approvals.
Following acquisition of Millennium Bank AS, as announced in early 2010, subject to regulatory approvals.
New corporate website
Credit Europe Bank NV has a new corporate website. For more information, please see www.crediteurope-bank.com or visit one of our local websites. The website addresses of our worldwide network of branches and subsidiaries can be found on page 120 of this report.
Malta
Shanghai,
China
BRANChES BRANChES
SUBSiDiARiES
REpRESENTATiVE oFFiCES

Four years’ financial highlights
Loan book
€5.8 billion
Cost/Income ratio
50.1%
Customer deposits
€7.2 billion
Net profit
€50.5 million
€4.0
€6.0€6.3
€5.8
€7.2
2006 20082007 2009
x billion x billion
x million
€3.2
€4.6
€6.8
2006 20082007 2009
52.5% 50.1%53.7%
62.0%
2006 20082007 2009
€38.0
€59.6
€74.5
€50.5
2006 20082007 2009

Four years’ key figures
EUR millions 2009 2008 2007 2006
Assets
Cash and balances at central banks 1,596 1,965 588 448
Financial assets at fair value through profit or loss 996 251 435 129
Financial investments 1,118 387 187 52
Loans and receivables – banks 616 953 1,397 1,040
Loans and receivables – customers 5,219 5,370 4,573 2,988
Other assets 411 615 306 156
Total assets 9,956 9,541 7,486 4,813
Liabilities
Due to banks 1,317 1,229 1,414 685
Due to customers 7,224 6,802 4,650 3,220
Issued debt securities and other borrowed funds 214 136 383 235
Other liabilities 339 472 282 182
Total liabilities (excluding subordinated liabilities) 9,094 8,639 6,729 4,322
Subordinated liabilities 224 231 203 102
Total liabilities 9,318 8,870 6,932 4,424
Total equity 638 671 554 389
Total equity and liabilities 9,956 9,541 7,486 4,813
Commitment and contingencies 739 1,417 828 778
Number of employees (actual) 5,242 6,439 7,748 5,085
All figures have been rounded to the nearest million, and could, therefore, vary from other quoted amounts in this annual report.

Contents
Strategy in action 5
Supervisory Board 6
Report of the Supervisory Board 7
Strategy 7
Supervisory Board structure 7
Supervisory Board committees 7
Net income allocation 8
Cautious optimism for the future 8
Managing Board 10
Report of the Managing Board 11
From the CEO 11
Overview 2009 12
Business lines: performance 12
Corporate banking 12Direct retail banking in Belgium, Germany, Malta and the Netherlands 16Our subsidiaries 17Representative offices 19Centralized functions 20Corporate governance 24
Outlook 2010 28
Consolidated Financial Statements 31
General information 32
Consolidated statement of financial position 33
Consolidated profit and loss statement 34
Consolidated statement of comprehensive income 35
Consolidated statement of changes in equity 36
Consolidated cash flow statement 37
Corporate information 38
Summary of significant accounting policies 39
Notes to Consolidated Financial Statements 52
Parent Company Financial Statements 103
Summary of significant accounting policies of the
Parent Company 104
Statement of financial position of the Parent Company 105
Profit and loss statement of the Parent Company 106
Statement of changes in equity of the Parent Company 107
Notes to Parent Company Financial Statements 108
Other information 117
Proposed profit appropriation 118
Auditor’s report 119
Addresses 120

Supervisory and Managing Boards
Top left to right: A. Hamdi Arman (MB), Yavuz Tayfun (MB), Turhan Cemal Beriker (MB, CEO), Şenol Aloğlu (MB) E. Murat Basbay (prospective CEO), Mehmet Güleşci (SB), Murat Özyeğin (SB), F. Onur Umut (SB), Umut Bayoğlu (MB), Fevzi Bozer (SB)
Seated left to right: Maarten J. Hulshoff (Chairman SB), Ine Bastiaens (corporate secretary) and Hüsnü M. Özyeğin (SB)

5
Credit Europe Bank N
V Annual Report 2009
Strateg
y in action
Strategy in action
Founded in 1994, Credit Europe Bank NV (CEB NV, the Bank) has grown towards a top 10 position among Dutch banks. CEB NV’s businesses currently employ 5,242 professionals in 11 countries, serving almost three million customers worldwide. As a stable financial services group under Dutch Central Bank (De Nederlandsche Bank – DNB) supervision, CEB NV offers tailor-made corporate banking services and easy-to-use and efficiently delivered retail products for the benefit of its clients.
In direct retail banking in Western Europe, the Bank built upon its proven business model, offering standard, simple-to-use and competitive products to our retail clients in the Netherlands, Belgium, Germany and Malta. In addition to savings and deposits, the Bank has recently started focusing on consumer credits. We operate efficiently, with centralized, cross-border operations and contact centers working with high-standard information technology. This low cost structure has enabled the Bank to remain competitive over the years, which has led to steady growth.
In addition to the countries as mentioned above, our goal is to further consolidate our retail position in selected markets, such as Russia, Romania and Ukraine. Although short-term growth prospects may still be limited in some of these markets, we are confident that our longer-term growth and value-creation prospects are positive. As announced in February 2010, the Turkish market will be added to this international network following the acquisition of a 95% stake in Turkey-based Millennium Bank AS, subject to regulatory approvals. In the area of corporate banking, CEB NV focuses on selected markets in international trade and commodity finance, building on its expertise in iron and steel, fertilizers, petrochemicals, oil, coal and soft commodities. The short-term nature and self-liquidating character of commodity-finance transactions provide CEB NV with a level of comfort in this type of lending activity. In the tumultuous year of 2009, when commodity market demand waned into shrinking trade volumes, the Bank focused relentlessly on customer acquisition, managing to enlarge its number of credit clients and thus improving the upside potential once demand picks up.
In all areas of the Bank, we invest in the professionalism, expertise and customer focus of our employees. In order to sustain our long-term growth ambitions, we actively encourage a combination of prudent capital and liquidity management, and strict cost controls with a sound risk-management culture, high level of compliance and transparent corporate governance. We believe that this strategy safeguards the interests of all our stakeholders.
6
Cre
dit E
urop
e Ba
nk N
V A
nnua
l Rep
ort 2
009
Su
per
viso
ry B
oard
Supervisory Board
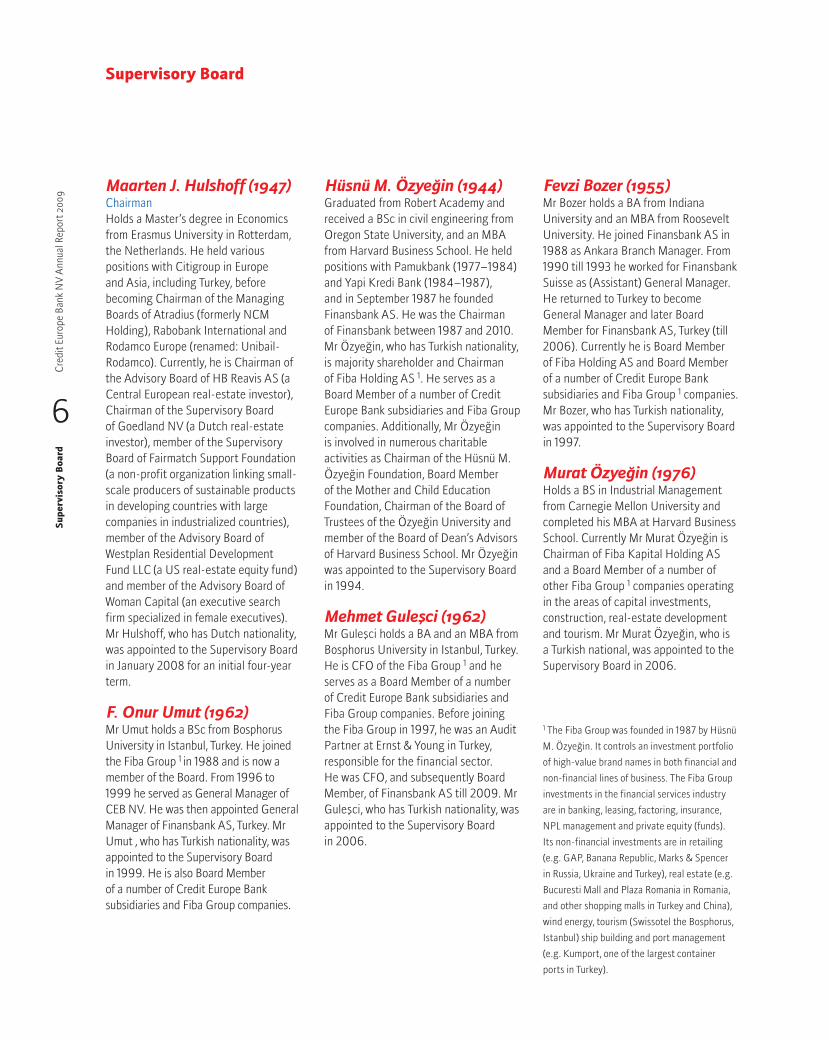
Maarten J. Hulshoff (1947)ChairmanHolds a Master’s degree in Economics from Erasmus University in Rotterdam, the Netherlands. He held various positions with Citigroup in Europe and Asia, including Turkey, before becoming Chairman of the Managing Boards of Atradius (formerly NCM Holding), Rabobank International and Rodamco Europe (renamed: Unibail-Rodamco). Currently, he is Chairman of the Advisory Board of HB Reavis AS (a Central European real-estate investor), Chairman of the Supervisory Board of Goedland NV (a Dutch real-estate investor), member of the Supervisory Board of Fairmatch Support Foundation (a non-profit organization linking small-scale producers of sustainable products in developing countries with large companies in industrialized countries), member of the Advisory Board of Westplan Residential Development Fund LLC (a US real-estate equity fund) and member of the Advisory Board of Woman Capital (an executive search firm specialized in female executives). Mr Hulshoff, who has Dutch nationality, was appointed to the Supervisory Board in January 2008 for an initial four-year term.
F. Onur Umut (1962)Mr Umut holds a BSc from Bosphorus University in Istanbul, Turkey. He joined the Fiba Group 1 in 1988 and is now a member of the Board. From 1996 to 1999 he served as General Manager of CEB NV. He was then appointed General Manager of Finansbank AS, Turkey. Mr Umut , who has Turkish nationality, was appointed to the Supervisory Board in 1999. He is also Board Member of a number of Credit Europe Bank subsidiaries and Fiba Group companies.
Hüsnü M. Özyeğin (1944)Graduated from Robert Academy and received a BSc in civil engineering from Oregon State University, and an MBA from Harvard Business School. He held positions with Pamukbank (1977–1984) and Yapi Kredi Bank (1984–1987), and in September 1987 he founded Finansbank AS. He was the Chairman of Finansbank between 1987 and 2010. Mr Özyeğin, who has Turkish nationality, is majority shareholder and Chairman of Fiba Holding AS 1. He serves as a Board Member of a number of Credit Europe Bank subsidiaries and Fiba Group companies. Additionally, Mr Özyeğin is involved in numerous charitable activities as Chairman of the Hüsnü M. Özyeğin Foundation, Board Member of the Mother and Child Education Foundation, Chairman of the Board of Trustees of the Özyeğin University and member of the Board of Dean’s Advisors of Harvard Business School. Mr Özyeğin was appointed to the Supervisory Board in 1994.
Mehmet Guleşci (1962)Mr Guleşci holds a BA and an MBA from Bosphorus University in Istanbul, Turkey. He is CFO of the Fiba Group 1 and he serves as a Board Member of a number of Credit Europe Bank subsidiaries and Fiba Group companies. Before joining the Fiba Group in 1997, he was an Audit Partner at Ernst & Young in Turkey, responsible for the financial sector. He was CFO, and subsequently Board Member, of Finansbank AS till 2009. Mr Guleşci, who has Turkish nationality, was appointed to the Supervisory Board in 2006.
Fevzi Bozer (1955)Mr Bozer holds a BA from Indiana University and an MBA from Roosevelt University. He joined Finansbank AS in 1988 as Ankara Branch Manager. From 1990 till 1993 he worked for Finansbank Suisse as (Assistant) General Manager. He returned to Turkey to become General Manager and later Board Member for Finansbank AS, Turkey (till 2006). Currently he is Board Member of Fiba Holding AS and Board Member of a number of Credit Europe Bank subsidiaries and Fiba Group 1 companies. Mr Bozer, who has Turkish nationality, was appointed to the Supervisory Board in 1997.
Murat Özyeğin (1976)Holds a BS in Industrial Management from Carnegie Mellon University and completed his MBA at Harvard Business School. Currently Mr Murat Özyeğin is Chairman of Fiba Kapital Holding AS and a Board Member of a number of other Fiba Group 1 companies operating in the areas of capital investments, construction, real-estate development and tourism. Mr Murat Özyeğin, who is a Turkish national, was appointed to the Supervisory Board in 2006.
1 The Fiba Group was founded in 1987 by Hüsnü
M. Özyeğin. It controls an investment portfolio
of high-value brand names in both financial and
non-financial lines of business. The Fiba Group
investments in the financial services industry
are in banking, leasing, factoring, insurance,
NPL management and private equity (funds).
Its non-financial investments are in retailing
(e.g. GAP, Banana Republic, Marks & Spencer
in Russia, Ukraine and Turkey), real estate (e.g.
Bucuresti Mall and Plaza Romania in Romania,
and other shopping malls in Turkey and China),
wind energy, tourism (Swissotel the Bosphorus,
Istanbul) ship building and port management
(e.g. Kumport, one of the largest container
ports in Turkey).

7
Credit Europe Bank N
V Annual Report 2009
Rep
ort of the S
up
ervisory Board
Report of the Supervisory Board
The year under review, 2009, has been another turbulent period. In the wake of the global financial crisis, there are still uncertain-ties. Although capital markets have reopened for business, banks have not followed suit. Caution and prudence continue to prevail, characteristics that are valued highly at CEB NV. In the Bank’s markets, there are signs of promising recovery in Russia and Turkey. Romania, after an unsteady 2008 and 2009, stabilized in the third quarter of 2009 thanks to the EU and IMF financial aid programs and fixed targets. In Ukraine, the formation of the new government after the recent elections brought political unity. This supports positive expectations, as we see the country gradually move towards recovery. In the United Arab Emirates, where activities were launched in 2008, the Bank is tapping the region’s international trade finance business. During the year, the Bank expanded its asset portfolio into developed markets, where, including fixed income, we generated 43% of our total credit exposure, compared with 36% at the end of 2008. The Bank’s business is banking in its purest form: it works with retail and corporate customers, lending through corporate trade finance on short-term, self-liquidating loans. The Bank also has collateralized exposures in real-estate and marine finance. In retail banking, we have almost three million clients. In the current climate, the balance sheet is stable, up 4% to just below EUR 10 billion. Net income is down 32% to EUR 50.5 million, primarily due to the carrying cost of a high liquidity buffer. As part of a prudent and cautious approach to pure banking, the Bank opts to maintain a strong liquidity buffer to sustain its business activities and its commitments to customers. The decrease in net interest income was partly offset by lower operating costs from EUR 284.4 million in 2008 to EUR 238 million in 2009 thanks to right-sizing of the branch network from around 250 branches (2008) to close to 200 (2009) and a reduced head count.
CEB NV’s Core Tier I ratio stands at 9.19% and capital adequacy at 12.57% on a consolidated basis. The Bank is currently working on the conversion of some of its Tier II capital into Tier I capital to provide an even stronger basis for the future.
Strategy
During the reporting year, the Supervisory Board was closely involved in strategic developments. A number of meetings were devoted to shifts in strategy. One clear shift is to raise the Bank’s profile in countries where it has already established strong trade-finance, corporate and retail-banking businesses. This will increase the deposit-collecting franchise and diversity in funding. In turn, the latter will reduce transfer and convertibility risks. Action has already been taken.
The envisaged acquisition of a 95% stake in Turkey-based Millennium Bank AS will raise the Bank’s profile in that country and form a self-funding vehicle for activities there. In Russia, the Bank re-entered capital markets through the issue of bonds denominated in US dollars. At the same time, a step-by-step strategy to move further into G10 economies and other developed markets has been set in motion.
Supervisory Board structure
The Supervisory Board of CEB NV comprises six members: Maarten Hulshoff (Chairman), Hüsnü Özyeğin, Fevzi Bozer, F. Onur Umut, Mehmet Guleşci and Murat Özyeğin – their profiles can be reviewed on page 6.
The full Supervisory Board met five times during the reporting year according to a predetermined schedule; the meeting in June was preceded by a Group Strategy meeting. All Supervisory Board members were present at all meetings. As a rule, the Managing Board is always present at Supervisory Board meetings, with the exception of the ‘executive session’, in which the Supervisory Board discusses its own functioning as a whole, its culture and its relationship with the Managing Board. This self-evaluation is conducted on an annual basis. Recurring topics in all Supervisory Board meetings are risk management and monitoring, developments in the retail and corporate banking business, in treasury and in liquidity management. In view of the introduction of the Dutch ‘Banking Code’ in 2009, special attention was paid to certain corporate governance subjects for which we have sought external advice.
Supervisory Board committees
The Supervisory Board has Audit & Risk, Corporate Governance & Nomination, Remuneration and Compliance Oversight Committees.
As per 2010, Fevzi Bozer joined the Audit & Risk Committee.
Committee Members
Audit & Risk Mehmet Güleşci (Chairman), Maarten Hulshoff,
F. Onur Umut
Corporate Governance Mehmet Güleşci (Chairman), Maarten Hulshoff,
& Nomination F. Onur Umut, Murat Özyeğin
Remuneration Fevzi Bozer (Chairman), F. Onur Umut,
Mehmet Güleşci, Murat Özyeğin
Compliance Oversight Mehmet Güleşci (Chairman), F. Onur Umut,
Fevzi Bozer

8
Cre
dit E
urop
e Ba
nk N
V A
nnua
l Rep
ort 2
009
Rep
ort
of t
he
Su
per
viso
ry B
oard
Report of the Supervisory Board
Audit & Risk Committee This committee met four times during 2009. Representatives of the Bank’s external auditor, KPMG Accountants N.V., Managing Board, Head of Internal Audit and Head of Risk Management were present at all meetings. Key topics were financial performance, risk-management develop-ments and the risk profile of the Bank, group internal audit activities, and reports of the external auditor. Risk management is engrained in the Bank’s culture and is being followed closely at Supervisory Board level. The Committee also paid attention to the developments in the Bank’s loan losses and monitored top 20 aggregate borrower exposure.
Corporate Governance & Nomination CommitteeThis committee met five times during 2009. Regular items were considerations on a different board structure, developments on introducing the ‘Banking Code’ in the Netherlands, the appointment of a new Managing Board member and the revision of the corporate-governance framework. The CEO is present at all committee meetings. In terms of revising the governance structure, and given the Bank’s private ownership and the Supervisory Board’s composition, the Committee discussed the potential addition of another independent member to further strengthen the independence and institutional functioning of the Supervisory Board.
Remuneration CommitteeIn 2009, this committee met five times. Focus during the meetings was on the revision of the share schemes (from local to group level), the amendment of the Remuneration Policy in line with the rules in the ‘Banking Code’ and the ‘Principles for sound compensation’ published by DNB and the Autoriteit Financiële Markten (Financial Markets Authority – AFM), the review and approval of senior employee appraisals and subsequent remuneration adjustments. The CEO participated in all meetings. Compliance Oversight CommitteeThis committee met five times during 2009 and was joined during these meetings by the CEO, the Chief Credit & Risk Officer and the Group Compliance Officer. The discussions and updates of the Compliance Program formed a central point of focus for all the meetings. During the last meetings of 2009, the committee considered and agreed upon setting up a revised policy and procedure on the handling of potential ‘conflicts of interest’ transactions and the monitoring of strict adherence to inter-group lending.
Net income allocation
The Supervisory Board has taken note of the report of the Managing Board and the Consolidated Financial Statements for 2009, comprising the balance sheet and profit and loss accounts. The Consolidated Financial Statements further include explanatory notes and further information, including the report of the external auditor, KPMG Accountants N.V., for the year ending December 31, 2009.
We propose and advise that the General Meeting of Shareholders adopts these Consolidated Financial Statements.Further, we propose to pay an amount of EUR 12.5 million of the net income as dividend to its parent company, Credit Europe Group NV, and to add the remaining balance to the retained earnings, thereby discharging the members of the Managing Board from their liability with respect to their management responsibilities and the members of the Supervisory Board with respect to their supervisory responsibilities.
Cautious optimism for the future
There are clear signs of recovery in many markets. However, those signs are no more than indications. A number of markets are still struggling and the expectation is that more positive signs of recovery will not appear until late 2010, and even 2011. Yet, the stable performance in a very turbulent period is an indication that the Bank is still on the right course.
In January 2010, the Bank obtained its credit rating from Fitch Ratings in addition to the one from Moody’s. Fitch has assigned CEB NV a long-term Issuer Default Rating (IDR) of ‘BB’ with a Stable Outlook. The full rating reports issued by Fitch and Moody’s can be retrieved from CEB NV’s corporate website (www.crediteuropebank.com).
The group organizational integration is almost complete; operations have been right-sized and a new CEO takes the helm in 2010 – subject to DNB approval.
Our appreciation and gratitude go to Turhan Cemal Beriker, the CEO since 2001, who has led the Bank through its evolution from a start-up to a strong player in all its markets and areas of expertise. After a transition period to hand over duties to the new CEO, Turhan Cemal Beriker will assume a senior level position in the financial-services sector of the Fiba Group.

9
Credit Europe Bank N
V Annual Report 2009
Rep
ort of the S
up
ervisory Board
Report of the Supervisory Board
We welcome E. Murat Basbay, who will be working with an excellent team of highly experienced banking personnel around the world. Our gratitude goes to all of them. The same applies to our customers. Their confidence is truly valued by all at Credit Europe Bank.
Amsterdam, March 19, 2010
Maarten J. Hulshoff, ChairmanHüsnü M. ÖzyeğinFevzi BozerF. Onur UmutMehmet Güleşci Murat Özyeğin

10
Cre
dit E
urop
e Ba
nk N
V A
nnua
l Rep
ort 2
009
Man
agin
g B
oard
Turhan Cemal Beriker (1968)Chief Executive Officer
Holds a BSc in Management Science from Bilkent University, Ankara. He began his career in 1990 as an Interbank AS management trainee in Istanbul. After joining Finansbank AS, Turkey, in 1992, he worked successively in corporate credit marketing and retail banking. After his appointment in corporate banking in Finansbank (Suisse) SA, Mr Beriker was a member of the founding team of the Bank in the Netherlands in 1994 and oversaw the setting up of its Germany operations in 1998, with an emphasis on retail banking. He returned to Amsterdam in 2000 to join the Managing Board of the Bank. In July 2001, he was appointed Chief Executive Officer. He is responsible for Corporate Banking, Internal Audit, Treasury and Public Relations.
E. Murat Basbay (1968)Prospective Chief Executive Officer
Holds a BSc in Business Administration from Bosphorus Uni-versity in Istanbul. He began his career in 1992 as an auditor at Arthur Andersen and worked in its Istanbul and Dubai offices until 1997. He was a member of the founding team of Credit Europe Bank in Russia in 1997 where he stayed until 1999 when he became the Head of Financial Control of CEB NV. Mr Murat Basbay later joined the Managing Board of CEB NV as CFO in 2004. In 2005 he returned to Russia to become General Manager of the Bank’s subsidiary in Russia.
Şenol Aloğlu (1965)Deputy Chief Executive Officer
Graduate of Bosphorus University, Istanbul in Business Administration. He started his banking career at Interbank in 1987, joining the Fiba Group in 1991. He held various positions at Finansbank AS and Finans Leasing AS in Istanbul. In November 2000, he was appointed Executive Vice President for Financial Institutions and also the Country Manager for the Netherlands. In November 2005, he was appointed as a Managing Board member. He is responsible for Retail Banking, Bank Relations, Operations (excluding Risk Management), IT and Information Security.
Umut Bayoğlu (1973)Chief Financial Officer
Holds a BSc in Economics from METU in Ankara. He began his career in 1996 as a management trainee with Finansbank AS. He moved to Germany as Head of Financial Control in 2001 and later to Amsterdam. Appointed CFO in 2006, since January 1, 2008, he has been member of the Managing Board and is responsible for Financial Control, Risk Management (Pillar II, excluding concentration risk), Business Development and Strategy, and HR.
Yavuz Tayfun (1966)Chief Credit & Risk Officer
Holds a BSc in Management Engineering from Istanbul Technical University. Joined CEB NV in May 2006. Prior to his appointment to the Managing Board on January 1, 2008, he was Head of the Corporate Credits Division at CEB NV. Before joining CEB NV, he was Head of Risk Management at The Economy Bank NV, where he was responsible for credit and market risk. He worked for 15 years at T. Garanti Bankasi AS and GarantiBank International NV, as Credit Officer and Head of Corporate Credits. He is responsible for Credit and Operational Risk Management (Pillar I, plus concentration risk), Compliance and Legal.
A. Hamdi Arman (1966)Global Head of Trade & Commodity Finance
Graduate of Bentley College in Massachusetts with an MBA and holds an MS in Civil Engineering from Istanbul Technical University. He started his banking career at HSBC and joined the Fiba Group in 1995. He held various positions in the Bank's Swiss subsidiary and, in 2000, he was appointed as the Country Manager for the Bank’s German operations. In 2002, he joined the Bank’s offices in the Netherlands. First as Executive Vice President for Trade and Commodity Finance & Corporate Credits and, in 2005, he took the position of Head of Corporate Banking. He joined the Managing Board in September 2009. He is responsible for the Trade and Commodity Finance activities at head office and at subsidiary level.
Managing Board

11
Credit Europe Bank N
V Annual Report 2009
Rep
ort of the M
anag
ing
Board
From the CEO
Remaining stable and profitable in another challenging year
On behalf of the Managing Board, I am pleased to present the Annual Report 2009, which summarizes our progress during this year. In another challenging year on the financial markets, we managed to further improve CEB NV’s position as a solid international bank ranking in the top 10 of Dutch banks by balance sheet size. Building on our proven strategy of customer focus, sound risk management and strict cost control, the Bank has been able to report positive results since its foundation, while constantly growing its equity and asset size. The reporting year 2009 was no exception and CEB NV recorded a positive figure, reflecting a satisfactory level in the face of slumping demand and uncertain international markets.
During 2009, our balance sheet increased from EUR 9.54 bil-lion to EUR 9.96 billion. On the funding side, worldwide customer deposits went up by 6% to EUR 7.2 billion at the end of the year, meeting our preset targets. In line with the aims of our loyal customers for long-term stability, our direct retail banking division in Western Europe converted a considerable amount of daily deposits successfully into time deposits. At the end of the reporting year, time deposits in Western Europe amounted to EUR 3.82 billion, more than 60% of total retail deposits and savings.
On the assets side, loans to customers remained stable at around EUR 5 billion, despite a sharp decline in worldwide trade finance volumes, our core business area. After 2008’s record results, the Bank proved its stability throughout 2009, and we are pleased to report that we are one of the few larger Dutch banks that did not need to make use of the state guarantee schemes or other forms of financial support made available by the Dutch state.
Also, our capital ratios improved. At consolidated level, the capital-adequacy ratio went up from 12.41% at the end of 2008 to 12.57% at the end of the reporting year.
On the profit and loss account, our net income decreased to EUR 50.5 million from EUR 74.5 million in 2008. Given the worsening market conditions in trade and commodity finance, the amount of fees and commissions earned by our corporate bankers went down, which largely explains the decrease in total net commission income from EUR 71.5 million to EUR 54.9 mil-lion. Net interest income decreased from EUR 454.4 million to EUR 341.4 million, due to a lower level of average loan book size and the liquidity level carried throughout the reporting
year. As part of our prudent provisioning policy, impairment charges went up from EUR 143.8 million in 2008 to EUR 159.8 million in 2009. Add to these the one-time burden of CEB NV’s contribution to the Dutch Deposit Guarantee Scheme, which has withstood two separate bank failures in recent years, costing the Bank a further EUR 11 million in unforeseen costs.
The negative influence of these factors on our net profit was mitigated by an increase of net trading income, from EUR 19.3 million to EUR 69.7 million and by substantial cost reductions. The first is largely a result of exceptional conditions in 2009, when the markets strongly rallied from the historical low seen in the last quarter of 2008. Total operating expenses went down from EUR 284.4 million in 2008 to EUR 238 million in 2009.
I am happy to conclude that our subsidiaries in Russia, Romania, Switzerland, Ukraine and the United Arab Emirates contributed to our long-term strategy, despite challenging economic circumstances in some of these countries. I would like to specifically mention our Russian subsidiary, not only because it contributed substantially to our profit, but because it was also the first privately owned bank in Russia to place a Eurobond issue when the capital markets reopened after the crisis, illustrating our financial stability and appeal for investors.
With my colleagues in the Managing Board, I am looking forward to entering the Turkish market following the acquisition of Millennium Bank AS – subject to regulatory approvals.
After having being part of the founding team of Credit Europe Bank NV in 1994 and working as CEO since 2001, I am happy to hand over my responsibilities as CEO to Mr Murat Basbay in the course of 2010. I wish him success in his new role. I would like to thank the Supervisory Board, the shareholder and my fellow members of the Managing Board for the trust they have put in me over in the last nine years.
Also, I would like to express my gratitude to our clientele and business partners, as well as to the senior management and all our employees who work day in, day out to generate long-term value for our stakeholders.
Amsterdam, March 19, 2010 Turhan Cemal BerikerChief Executive OfficerOn behalf of the Managing Board
Report of the Managing Board

12
Cre
dit E
urop
e Ba
nk N
V A
nnua
l Rep
ort 2
009
Rep
ort
of t
he
Man
agin
g B
oard
Report of the Managing Board
Overview 2009
CEB NV targets different business segments in various countries: In the field of corporate banking, the Bank serves its clients •worldwide through its dedicated teams in Amsterdam, the Netherlands, and in its subsidiaries and branches. While the head office in Amsterdam concentrates on its niche market of international trade and commodity finance, corporate banking set up at the subsidiaries are more geared towards corporate banking services in their local markets.From its branches in the Netherlands, Germany, Belgium and •Malta, the Bank offers direct retail banking products, operating under one Dutch banking license. Retail customers are serviced on the basis of a single, integrated cross-border business model, operationally supported by the office in Frankfurt, Germany.Where the internet alone is not a pervasive medium to •conduct business and where geographical distances impact the distribution of our financial services, the Bank serves its customers through carefully built branch networks. In CEB NV’s subsidiaries in Russia, Ukraine and Romania, the Bank has close to 200 branches and more than 10,000 affiliated points of sale in total. In these subsidiaries, the Bank collects deposits and provides retail finance products, such as car loans and personal loans. It also offers salary accounts and cross-sells plastic cards by way of brand partnerships or with its own brand.In addition, a variety of banking activities are executed •from subsidiaries in Switzerland and the United Arab Emirates. In Switzerland, the Bank offers private banking, trade and commodity finance, corporate banking and asset management services. In the United Arab Emirates, the Bank offers trade and commodity finance, and general corporate banking activities.
All business segments are supported by a number of centralized functions in the fields of asset-liability manage-ment, IT, Information Security, Compliance, Risk Management, Internal Audit and Financial Control, managed from the head office in Amsterdam, the Netherlands.
Business lines: performance
Corporate bankingThe Bank followed different strategies in its three main lines of business in corporate banking in 2009.
Trade and Commodity FinanceIn its traditional corporate business, the Bank, like other financial institutions, experienced a challenging year. The main cause is a sharp decline in trading volumes and prices for the commodities we focus on. These remained depressed for much of the year and world trade volumes contracted, mainly due to weak consumer demand. Given these developments in price and volume, the trade-finance volume of CEB NV’s corporate banking declined considerably compared to the previous year. As a result, our fees and commission income are still below our record year, 2008. Fortunately, we were able to expand our customer base because commodity traders are seeking stable banks with expertise in trade financing. As a result, the increase in the number of clients partly compensated for the decrease in business volumes.
The price of energy – oil in particular – was a crucial factor for trade finance in 2009, as the Bank services ‘C&F invoices’ for a large part. The freight component, which had fallen by almost 70% in 2008, did recover to some extent in certain segments, such as dry bulk, but remained below 2006–2008 levels.
CEB NV continued its strategy of focusing on selected commodities (iron and steel, fertilizers, petrochemicals, oil, coal and soft commodities) and their related geographies. Major developments, including market fluctuations, were monitored carefully to mitigate the Bank’s risks during various stages of trade-finance transactions.

13
Credit Europe Bank N
V Annual Report 2009
Rep
ort of the M
anag
ing
Board
Report of the Managing Board
Working Capital FinancingIn the more conventional corporate banking field, with a view to taking advantage of the previous year’s contraction in financial markets, we continued to strictly apply our prudent approach to corporate balance sheet lending. The expertise that the corporate banking team has built over the years helped us steer carefully through the difficulties in the markets. During the reporting year, corporate activities were not only focused on our existing clients; some new landmark names, especially in Turkey and Russia, chose to start relationship with our Bank, in their search for a stable lender in the unsteady credit markets.
The Bank’s high liquidity and strong funding base, and the windows of opportunity provided by the financial markets, made it possible for us to grow our client portfolio with highly ranked corporate assets with acceptable yields.
Major commodity prices in USD/Ton
Petrochemicals (PVC – FOB Black Sea)
Fertilizers (Urea – FOB Black Sea)
Iron & steel (HRC – FOB Black Sea)
Brent crude oil (USD/BBL)
Soft commodities (wheat – FOB Black Sea)
Coal (FOB Australia)

14
Cre
dit E
urop
e Ba
nk N
V A
nnua
l Rep
ort 2
009
Rep
ort
of t
he
Man
agin
g B
oard
Report of the Managing Board
Marine Finance
No other corporate sector in which CEB NV is active was harder hit than Marine Finance in 2009. The coinciding drop in oil prices with the sharp fall in demand for finished goods and raw materials led to the sharp decline in the value of vessels, both in running and new building projects. The once buoyant second-hand market collapsed. The general decline in the sector was squarely reflected in time-charter rates, which form the backbone of the working capital financing provided to the operating vessels, under now widely varying expected cash flow assumptions. These developments forced the Bank to obtain additional collateral for its existing exposure. The completion of new building projects throughout the reporting year helped strengthen the collateral values of our portfolio. On a positive note, towards the end of the year time-charter rates, specifically for dry bulk cargos, recovered a substantial part of their lost ground resulting from the slump of late 2008
and early 2009. We expect these rates to form stable levels, and even to rise slightly in the coming years.
Owing a significant part of its non-performing loans to the Marine Finance portfolio, the Bank approached Marine Finance with caution and undertook a very limited number of projects during 2009.
2009
Total credit exposure: EUR 10.18 billion
A Developed markets 43%
B Russia 17%
C Romania 19%
D Turkey 17%
E Ukraine 2%
F Other emerging markets 2%
Credit exposure by region
2008
Total credit exposure: EUR 9.89 billion
A Developed markets 36%
B Russia 19%
C Romania 22%
D Turkey 17%
E Ukraine 4%
F Other emerging markets 2%

15
Credit Europe Bank N
V Annual Report 2009
Rep
ort of the M
anag
ing
Board
Other Similarly, our activities were also limited in the project finance and construction market (e.g. infrastructure and commercial real estate). This type of lending, which still played a significant role in our corporate banking activities, slowed down in line with the current investment climate around the world. We continued to closely monitor the financing provided to contractors for important infrastructure projects in various geographies. In
this niche business, we will continue financing new projects, especially those backed by governments or financial institutions. This approach has provided the Bank with a safe way of averting many potential problems from the outset. During the reporting year, we continued our cross-sell activities. The main focus was on currency, interest-rate and commodity-hedging products, which were made available to a wider range of clients. This gave us the opportunity to generate additional non-risk commissions.
Baltic Exchange, clean tanker index
Baltic Exchange, dry index
Report of the Managing Board

16
Cre
dit E
urop
e Ba
nk N
V A
nnua
l Rep
ort 2
009
Rep
ort
of t
he
Man
agin
g B
oard
Report of the Managing Board
Sector breakdown: Corporate banking
Total Corporate banking exposure: EUR 3.79 billion
A Shipping & shipyards 12.3%
B Real estate 12.2%
C Iron & steel 12.1%
D Construction & installation 8.5%
E Tourism 6.8%
F Energy/coal 5.0%
G Petrochemicals 4.5%
H Retail 4.0%
I Other services & distribution 3.4%
J Automotive & derivatives 3.1%
K Holding 3.1%
L Textiles & ready-to-wear 2.9%
M Other 8.8%
N Financial services & investments 3.7%
O Transportation & logistics 2.0%
P Oil & derivatives 2.0%
Q Food, beverage & tobacco 2.0%
R Soft commodities 1.4%
S Paper & pulp 1.1%
T Machinery & equipment 1.0%
Bank RelationsCEB NV’s Bank Relations Division consists of the Financial Institutions and Correspondent Banking Department for primary trading transactions and the Global Forfaiting and Emerging Markets Loan Trading Department for secondary trading transactions. Our experienced Bank Relations team has built up profound know-how over the past years and enjoys close relationships with its worldwide correspondent network in developed and emerging countries.
The Bank Relations team remains committed to addressing its clients’ needs and offering competitive and tailor-made solutions, in addition to conventional trade-finance products.
The reporting year, 2009, was challenging for the Financial Institutions team: it monitored its existing correspondent banks very closely, and brought new countries and names to the portfolio. This was partly accomplished and supported by CEB NV’s participation at various international meetings, including SIBOS in Hong Kong, the World Bank and IMF meetings in Istanbul, and the International Forfaiting Association in Rome.
In 2009, the Bank also developed new products and made new partnerships. For example, we signed the General Trade-Finance Programs with the European Bank for Reconstruction and Development and the International Finance Corporation. We extended our products and services to 300 banks in 60 countries. CEB NV’s Global Forfaiting and Emerging Markets Loan Trading Department, an active member of the International Forfaiting Association since 1998, trades in a wide range of instruments, such as syndicated loans, promissory notes, bills of exchange, letters of credit and silent-risk confirmations. During 2009, the department had a total trading volume of EUR 1.2 billion with 50 different counterparties, compared to a total trading size of EUR 410 million in 2008.
In 2010, CEB NV’s Bank Relations team aims to further explore new markets and stimulate its advanced trade-finance products.
Direct retail banking in Belgium, Germany, Malta and the NetherlandsIn the field of direct retail banking in the Bank’s branches in Western Europe, CEB NV continued its long-term strategy. Following substantial growth in 2008, we maintained our loyal client base in the reporting year, while converting daily savings to time deposits. In the second half of the year, we achieved

17
Credit Europe Bank N
V Annual Report 2009
Rep
ort of the M
anag
ing
Board
Report of the Managing Board
our target of increasing time deposits to more than 60% of total savings and deposits.
CEB NV serves retail customers in the Netherlands, Germany, Belgium and Malta from its Direct Retail Banking Division in Frankfurt, Germany. In 2009, the Bank maintained its strong position in the market, while successfully achieving its key objectives. The Bank accomplished scale benefits through prioritizing the execution of its customer-focused strategy, enhancing key IT solutions and optimizing internal work- flow processes.
We continued to invest in providing better access to our services and to our improved products by means of easy-to-use online application processes. We also strengthened our online cooperation with selected partners to seek new opportunities, and we further promoted our savings and loans portfolio via direct channels. These measures will enable us to compete more effectively and position the business for long-term sustainable growth.
As anticipated, the savings portfolio increased moderately, reaching a total deposit size of EUR 5.6 billion at year-end, compared to EUR 5.3 billion at the end of 2008.
The retail-lending business, comprising installment and revolving loans, and loan-related insurance products, stabilized during the reporting year, with volumes reaching EUR 343 million at year-end, compared to EUR 322 million at the end of 2008.
Moreover, during 2009 we laid the groundwork for future growth and expansion in the retail-lending business by enhancing the IT infrastructure and our distribution channels.
Our subsidiaries
RussiaCredit Europe Bank Ltd (CEB Ltd) is ranked top 50 in terms of total assets among Russian banks 1 and top 25 based on its retail loan portfolio 2. The Bank was especially successful in the market for car loans and consumer loans, measured by lending volumes, holding 6th and 14th positions, respectively, among Russian banks, as of June 2009.
1 According to information services group, Interfax
(December 2009).2 According to Russian information agency,
RosBusinessConsulting (October 2009).
As the global recession hit the markets in the fourth quarter of 2008, the Russian economy suffered a substantial decline in oil prices, currency depreciation and a decrease in international reserves. However, by the end of 2009, the economy demonstrated better-than-expected results, gaining positive momentum in the second half of the year.
The Russian banking sector stabilized in 2009, thanks to support given by the Central Bank of Russia and the Russian Government. Systemic concerns that remain include the slow deterioration of asset quality, overall reduction in lending activity (mainly due to the revision of lending policies) and strains on funding, especially for smaller players. The Russian banking services market is still not saturated, while net interest margins remain among the highest in Central and Eastern Europe. The prospects for customer base growth are inspiring, especially in the more developed regions.
Within this challenging business environment, CEB Ltd demonstrated resilient profit performance, asset quality above the sector average and a stable asset size. In October 2009, CEB Ltd was the first private Russian bank to place a Eurobond issue (in US dollars) after the capital markets reopened following the crisis.
Effective in 2009, CEB Ltd entered into a partnership agreement with the IKEA Group, launched a gift card with the family shopping mall, MEGA, and extended its partnership agreements with the retail chains Auchan Group and Metro Cash & Carry in Russia. In addition, the bank successfully launched a government-subsidized SME and retail car loan program.
Although asset size went up slightly in the local currency, it decreased slightly in euros, from EUR 1.64 billion to EUR 1.61 billion in 2009. CEB Ltd relied on its sound risk-management expertise to shift focus to low-risk products and deliberately downsized its total loan portfolio, which decreased 15% from EUR 1.3 billion at the end of 2008 to EUR 1.1 billion at the end of 2009. Gross profit stabilized at EUR 43.4 million (2008: EUR 43.3 million).
In 2009, the retail, corporate and SME business lines contributed 49%, 45% and 6%, respectively, to the total loan book. Given the strict credit policy, retail loans decreased by 20% in 2009, mainly due to the reduction in cash and personal loans. Our tailored approach to clients helped CEB Ltd to maintain its corporate loan book at about the same level as in 2008. Although SME lending was partly supported by the bank’s participation in the special government programs, in total, CEB Ltd’s SME loan book decreased by 20%.

18
Cre
dit E
urop
e Ba
nk N
V A
nnua
l Rep
ort 2
009 Non-performing loans accounted for 7% of the gross loan book
and were fully provisioned.
Despite temporary rigid control of the loan book, CEB Ltd enjoys a customer base of more than 2.2 million loyal corporate, retail and SME clients. CEB Ltd is ready to resume its credit expansion activities, leveraging its wide network of 92 offices and 3,640 points of sale in 22 regions, if the economy shows signs of steady revival.
Credit Europe Life (CELI), operational since the beginning of 2008, provides innovative insurance products, including accident, sickness, life and health insurance. The company is a wholly owned subsidiary of CEB Ltd. It distributes insurance products throughout the Russian territories, mainly through its parent company’s network of branches and points of sale. CELI had assets of EUR 3.76 million and a gross profit of EUR 0.6 million, as of December 31, 2009.
In January 2009, CEB NV took over almost all the issued shares in Credit Europe Leasing LLC (CE Leasing), established in Russia, from its parent company (Credit Europe Group NV). CE Leasing provides financial leasing services for the hire of equipment (including vehicles) for the manufacturing, construction and transportation sectors in Russia. Its clients are SMEs and larger corporates. Gross profit for the reporting year amounted to EUR 3.2 million.
Romania The reporting year, 2009, marked the peak of the global economic crisis in Romania. Although the economy shrank by 7% during the year, the banking system, which is mainly controlled by foreign capital, presented solid figures, thanks to the National Bank of Romania’s prudent supervision.
A stabilization program led by the IMF and EU increased confidence in the strength of the local currency and this, together with relatively cheaper labor, attracted further foreign direct investment, mainly in the manufacturing and financial sector, reaching almost EUR 6 billion in 2009.Credit Europe Bank (Romania) SA (CEB Romania) focused on consolidating its client and risk portfolios in 2009, while maintaining high liquidity ratios.
Due to the economic environment and short-term forecasts, management focused on efficiency and cost-reduction measures. On average, the bank’s operating expenses decreased by 21%. By means of restructuring sales channels and processing lines, personnel numbers were cut from 2,008
(end 2008) to 1,300 (end 2009). For the reporting year, CEB Romania recorded a gross loss of EUR 2 million.
CEB Romania paid extra attention to applying CEB NV’s Risk Management and Corporate Governance Principles, particularly in the field of transparency and accountability. The Risk Management function was further extended with advanced tools and reporting techniques developed especially for credit and operational risk.
CardAvantaj, CEB Romania’s installment credit card, has strengthened its market-leading position with a portfolio of 320,000 cards. CardAvantaj’s transaction volumes and net receivables increased by more than 15% during the reporting year, despite the economic downturn in national consumption and retail figures.
Paying utmost attention to its funding and liquidity position, the bank opted for a promotion strategy in collecting deposits where the advantages of its accounts and related facilities were put to the forefront, rather than just attractive interest rates.
UkraineUkraine probably offered the most challenging economic environment for the Bank. CJSC Credit Europe Bank Ukraine (CEB UA) was one of the most stable banks in Ukraine in 2009, outperforming most of its competitors and closing 2009 with a gross profit of EUR 1.8 million (EUR 2.5 million in 2008).
Ukraine’s economy was adversely affected by the economic turmoil. Domestic output contracted 15% in 2009, largely due to weak demand for Ukraine’s main export products, iron and steel. In addition, the credit crunch and instability in the financial sector led to a significant decrease in foreign capital and direct investments.
As soon as the effect of the crisis became apparent, CEB UA rapidly formulated and implemented a crisis-management strategy, aimed at decreasing risk exposure, managing existing risks and significantly lowering operating expenses. Total assets were lowered by almost 40% from EUR 245 million to EUR 150 million. In particular, we radically reduced our risks in the money markets and bank placements to EUR 45 million (2008: EUR 109 million). Our exposure in corporate loans was cut to EUR 48 million (2008: EUR 58 million) and in retail and SME loans to EUR 21 million (2008: EUR 38 million).
This swift decrease in assets also contributed to CEB UA’s success in bringing down total operating expenses. Seven of our 14 branches (2008) including the regional office in
Rep
ort
of t
he
Man
agin
g B
oard
Report of the Managing Board

19
Dnepropetrovsk were closed. Personnel halved from 334 to 167 and all non-income generating projects were frozen.
The strength of CEB UA’s credit culture, together with the principle of tailor-made corporate banking, an effective organization and the prudent credit policy in retail banking, has been instrumental in this difficult economic environment.
New provisions of EUR 6 million were booked in 2009, which corresponds to 5% of the outstanding risk-bearing assets. This represents one of the best performances in the banking sector in Ukraine and ensures that the bank is financially and operationally well prepared to regain its pre-crisis size as soon as Ukraine’s economy recovers.
Also in Ukraine, the financial leasing company Credit Europe Leasing LLC, directly owned by CEB NV, has been active since 2007. It provides financial leasing services for vehicles and agricultural, metalworking and construction equipment. The number of leasing contacts at the end of the reporting year amounted to 173, with a total value of EUR 19.2 million. Currently, the leasing company is listed in the top five leasing companies in Ukraine by asset size.
Switzerland In 2009 – the year in which the global financial sector learned to adapt to the conditions of the aftermath of the crisis – Credit Europe Bank (Suisse) SA (CEB (Suisse)) steered its trade finance portfolio well, achieving its preset goals and showing a remarkable increase of 45% in the loan book. However, the financial crisis and pressure from the regulatory environment posed significant obstacles for performance in the banking sector. Despite these factors, CEB (Suisse) successfully managed the negative aspects in the private-banking sector and was able to maintain an equal level of total assets under custody and management.
In late 2008, CEB (Suisse) implemented a conservative plan to be highly selective in its lending activities and it largely maintained this policy in 2009. As a result, the balance sheet was 20% lower at the end of 2009 compared to end-2008.
During the reporting year, CEB (Suisse) managed to retain the major part of its client portfolio. Total assets under custody and management reached EUR 1,547 million at the end of the year.
CEB (Suisse)’s contribution to the consolidated gross profit for 2009 amounted to EUR 10.4 million (EUR 12.6 million in 2008).
United Arab EmiratesThe United Arab Emirates attracted world attention with its USD 80 billion short-term debt, most of it linked to real-estate investment. The Abu Dhabi Government and United Arab Emirates Central Bank have given their continuous support to UAE banks and the Dubai Government to overcome its short-term liquidity gap and restore investor confidence.
Credit Europe Bank (Dubai) Ltd (CEB (Dubai)), established in late 2008, is regulated by the Dubai Financial Services Authority and operates within and from the Dubai International Financial Center with a Category 1 license. In 2009, CEB (Dubai) continued its expansion into short-term and self-liquidating trade finance activities in selected commodities in the Gulf region as an extension of CEB NV’s main activities. It must be noted – explicitly – that real estate and related businesses in the region were never a part of CEB (Dubai)’s business plan.
The turmoil in the financial sector and the markets in general enabled the bank to gain a start-up foothold in the region’s trade activities as a result of increased demand for commercial limits from major trading houses.
With a staff size of 14, the balance sheet grew to EUR 237.7 million as of December 31, 2009 from EUR 149.6 million at the end of 2008. CEB (Dubai) contributed EUR 9.5 million to CEB NV’s gross profit in the reporting year.
Representative officesIn the reporting year, CEB NV’s representative offices in Istanbul, Turkey, and Shanghai, China, conducted market research, liaised with local and foreign contacts and represented CEB NV at public events.
Credit Europe Bank N
V Annual Report 2009
Rep
ort of the M
anag
ing
Board
Report of the Managing Board

20
Cre
dit E
urop
e Ba
nk N
V A
nnua
l Rep
ort 2
009
Rep
ort
of t
he
Man
agin
g B
oard
Report of the Managing Board
Centralized functions
Capital and liquidity managementThe financial performance of CEB NV in 2009 shows that the Bank – by taking a different path – managed to insulate itself from the financial crisis to a great extent. CEB NV has traditionally operated with low leverage ratios (even after appropriately considering the off-balance sheet exposures) accompanied by Core Tier I ratios in line with the market.
Despite avoiding a de-leveraging process, and without resorting to the liquidity support provided by central banks, CEB NV preserved its liquidity comfortably throughout the financial turmoil. CEB NV has never had an appetite for liquidity risk, and its existing internal standards and guidelines provide strong safeguards at two different levels. The first measure is designed to ensure short-term (with one-week and one-month horizons) resilience to liquidity disruptions, while the second aims to address longer-term structural funding mismatches and promote the use of stable funding resources.
CEB NV holds significant levels of liquidity, enabling the Bank to withstand both institution-specific and systemic shocks entailing a material loss of deposits, total loss of unsecured wholesale funding, substantial increase in secured funding haircuts and widespread margin calls on derivative contracts.
Overall, 2009 was a positive year for Treasury where we increased our servicing capability for our clients and actively and prudently managed the bank’s balance sheet risks.
Risk managementCEB NV aligns its risk-management practices and capital management process to the guidelines of the Dutch Central Bank (De Nederlandsche Bank – DNB) and the resulting philosophy this incorporates, including:
A well defined risk appetite and strategy•Clarity and centralized oversight•A healthy risk-return balance•Capital management •Compliance with capital adequacy regulations•
Defined risk appetite and strategyRisk appetite is the amount of risk exposure or potential adverse impact from an event that the Bank is willing to accept in pursuit of its objectives. It is defined at CEB NV on a consolidated level. The main principles are set by the Managing Board and subsequently approved by the Supervisory Board.
There were no material changes in the Bank’s risk strategy in 2009, apart from the calculated increase in risk appetite towards the trading book. CEB NV continued to extend its profound expertise in cross-border banking with a special emphasis on diversified local operations and centralized oversight.
Clarity and centralized oversightCEB NV’s risk management philosophy demands direct reporting lines and a clear division of tasks and responsibilities while ensuring that bank-wide criteria for acceptance, monitoring, control and management of risks are deeply rooted. Limits by specific name, sector or country are set to manage concentration risk.
Risk-return balanceCEB NV performs asset allocation with respect to the risk-return thresholds defined in its risk appetite statement. Business units are required to fully understand the inherent risk-reward profile of their business and generate a certain level of returns on regulatory/internal capital requirements. CEB NV’s risk strategy not only proved itself by providing consistently strong financial results, but also by yielding consistently firm returns on equity.
Centralized capital management modelIn its pursuit to maximize shareholder value, the Bank operates with an optimum level and mix of capital resources, and adopts a centralized regulatory/internal capital management model. This framework is designed to ensure CEB NV has sufficient capital resources to meet the DNB’s, as well local regulators’, capital requirements, and that it has available capital in line with its own risk appetite and internal guidelines. CEB NV also puts great emphasis on the strength of its capital base to maintain investor, creditor and market confidence and to sustain future business development.
Compliance with capital adequacy regulationsThe principles of Basel II solvency regulation in the Netherlands are laid down in the Financial Supervision Act, which is an extension of the EU’s Capital Requirements Directive. Basel II is based on three pillars:
Pillar 1 sets out the minimum regulatory capital require-•ments; i.e., the minimum capital banks must hold against credit, operation and market risks.Pillar 2 sets out the key principles for supervisory review of a •bank’s risk-management framework and its capital adequacy. It clarifies specific oversight responsibilities for the board and senior management, thus reinforcing principles of internal control and other corporate-governance practices.

21
Credit Europe Bank N
V Annual Report 2009
Rep
ort of the M
anag
ing
Board
Report of the Managing Board
Pillar 3 aims to bolster market discipline through enhanced •disclosure by banks.
CEB NV and its individually supervised subsidiaries have complied with all externally imposed capital requirements throughout the reporting period.
Audit & Risk CommitteeThe Audit & Risk Committee is a Supervisory Board committee whose function is to advise the Supervisory Board. (See page 25) .
Risk Management CommitteeThe Risk Management Committee consists of the members of the Managing Board and the Risk Director. It identifies, measures, monitors and controls the Bank’s key risks at a consolidated level. It also reviews the current practices employed in the Risk Management department and the overall risk-management structure within the business lines. The Risk Management Committee’s responsibilities extend to supervising regulatory capital management and risk-based performance measurement. This Committee also ensures that the Bank’s exposures are in line with the risk appetite approved by the Supervisory Board on an annual basis.
Asset & Liability Management CommitteeThe Bank operates a comprehensive asset and liability management (ALM) process. It includes supervision of local ALM committees responsible for setting limits on interest-rate, liquidity, currency and trading risks. It further oversees management of consolidated liquidity and interest-rate positions and capital structure. Policy and standard setting for transfer pricing are also covered by ALM. Thanks to its sound and proactive asset-liability management principles, CEB NV operated with high liquidity levels during 2009.
Local Credit CommitteesThe Local Credit Committees reside at CEB NV’s head office in Amsterdam, in its branches and in its subsidiaries in Russia, Romania, Switzerland, United Arab Emirates and Ukraine. All credit proposals for establishing, renewing, increasing, decreasing and canceling credit lines are presented to its members. They can decide independently to decrease or cancel existing credit lines and can establish new credit lines or renew them within the limits set by the Credit Policy. No credit proposal can be presented to the International Credit Committee (Tier I) or the International Credit Committee (Tier II) without the prior approval of a Local Credit Committee.
International Credit Committee (Tier I)This committee approves credit proposals for establishing and renewing credit lines that exceed the approval authority of a Local Credit Committee. Permanent members of the International Credit Committee (Tier I) are the Chief Executive Officer (CEO) of CEB NV and/or the Deputy Chief Executive Officer (Deputy CEO) and the Chief Credit and Risk Officer (CCRO) of the Bank. Each member has its own separate approval authority for corporates, financial institutions, sovereigns, retail and SMEs. For credit limits exceeding the authority level of the CCRO, the approval of the CEO and/or Deputy CEO and CCRO is required.
International Credit Committee (Tier II)This committee consists of the CEO of the Bank and three Supervisory Board members of CEB NV, namely Hüsnü M. Özyeğin, Fevzi Bozer and F. Onur Umut. The committee is the sole body to approve credit proposals for establishing and renewing credit lines exceeding the approval authority of the International Credit Committee (Tier I).
Operational Risk Management CommitteeThe main function of the Operational Risk Management Committee (ORMC) is to assist the Managing Board in identifying, measuring and monitoring the operational risk profile of the Bank and to ensure that our exposures are in line with the risk appetite approved by the Supervisory Board on an annual basis. In addition, ORMC ensures that operational risk management and incident reporting is promoted within CEB NV and operational risk management is embedded in day-to-day operations.
The Bank’s Internal Control framework is part of the Operational Risk Management framework, with a focus on controls and sound risk-management practices positioned as the second level of defense. CEB NV’s Internal Control framework uses the principles of the Enterprise Risk Management Framework (COSO) to define its Internal Control framework. In addition, the Internal Control framework is used as a loss-data-collection tool and a quality-assurance instrument for CEB NV’s operational-risk-management framework. The related controls are formulated based on the Bank’s risk assessment and risk appetite. The finding event types are mapped and integrated with the Basel II event types.
Compliance and Reputation Management Compliance risk is the risk of potential loss of and/or damage to the reputation of CEB NV arising from violation of, or non-compliance with, legal, regulatory and supervisory

22
Cre
dit E
urop
e Ba
nk N
V A
nnua
l Rep
ort 2
009
Rep
ort
of t
he
Man
agin
g B
oard
Report of the Managing Board
requirements. It could be in both financial and reputational terms and, at the extreme, could translate into loss of business. We therefore constantly seek to bring the highest standard of compliance best practice to all jurisdictions in which CEB NV directly, or indirectly through its banking and non-banking subsidiaries, does business. In keeping with our core values, we also endeavor to comply with the highest professional standards of integrity and behavior, which also builds trust. Therefore, it is the obligation of all staff working for CEB NV, as well as its banking and non-banking subsidiaries, whether employed directly or indirectly, to support and advance this philosophy.
In 2009, we further strengthened the compliance structure across the group. A new group-wide compliance charter was approved which, among others, clearly defines the group’s compliance objectives, roles and responsibilities. In CEB NV, as well as in our banking and non-banking subsidiaries, we have appointed competent compliance officers and local compliance representatives to assess progress in compliance-related matters, and to organize training and awareness-raising activities. CEB NV continued to be a core element of the group compliance structure and its key driver in elaborating and introducing group-wide standards for the most important compliance areas, such as anti-money laundering, terrorist financing and transactions with countries subject to sanctions. For instance, in 2009 CEB NV intensified and improved its structure of sanction controls, introducing additional and specific layers of control and new responsibilities for decision makers in relation to transactions with different risk types.
The Managing Board also supported important compliance initiatives and continued to emphasize the importance of embedding high standards of compliance in our organizational culture in 2009. Compliance ownership remained a key target for all senior managers and further development of compliance arrangements in procedures and processes was given high priority as part of CEB NV’s compliance-risk-management process. In 2009, the Bank initiated a proactive internal and external communications program. The aim is to affirm that CEB NV is a stable and competitive international bank with a stable track record while raising brand awareness in its markets. The communications program also aims to further improve the consistency of CEB NV’s messaging, both externally and internally.
In order to achieve these goals, the Bank launched a new corporate website (www.crediteuropebank.com) in early 2010.
This functions as an umbrella site for the local websites. While the local websites are designed to serve local customers, the corporate website is aimed at our international corporate clients and other corporate stakeholders.
Internal AuditCEB NV’s Internal Audit Department (IAD) plays an important role in ensuring ever-better governance at the Bank level. It represents an independent and objective assurance and consulting function as a third line of defense. IAD successfully met many challenges in 2009. After the approval of the annual audit plan by the Audit & Risk Committee, IAD assessed and examined the important areas of the Bank. Risk-based audits were conducted that covered the Bank’s core business activities and staff organization. IAD provided added value through its involvement in projects such as the conversion of our core banking application.
In addition, on a group-wide basis, IAD focused on standardizing reporting and thematic audits, such as the review of the ICAAP process within the Basel II framework. Communication with supervisory authorities, as well as improving work programs, assessments and administration, were equally important.
Information TechnologyThe strategy of CEB NV’s IT Division is to continuously modernize its banking technologies while ensuring the ongoing successful delivery of IT services. IT strategy and activities are continuously governed, steered and monitored by higher management, with the assistance of several committees. In line with this strategy, the IT division has undertaken numerous successful projects throughout 2009.
The Bank has been successful in implementing a new in-house and core banking system in the Dutch business’s four branches in Belgium, Germany, Malta and the Netherlands. This system had already been implemented, and tested, in Russia and Ukraine. This system reduces manual work and incorporates state-of-the-art banking know-how and experience, in line with the IT Division’s mission: modernization, centralization and unification. Following preparations made during 2009, the project was finalized in early 2010, providing a brand-new platform on which our banking activities run more effectively.
This must be perceived as a turning point in the Bank’s history, as CEB NV had been making use of external software since 1995.

Rep
ort of the M
anag
ing
Board
Report of the Managing Board
23
Credit Europe Bank N
V Annual Report 2009
In general, the IT Division follows a control-focused approach, reviewed and supervised by internal and external parties. In 2009, improvements were made in the areas of IT policy, strategy, committee structures, enterprise governance, management reporting, project management and other processes at the operational level. Global coordination and synchronization between different CEB NV entities is the primary area of concern for better governance.
Information Security Management ensures that company and customer information is protected in an integrated and dynamic business environment as a smooth continuation of business processes. CEB NV’s Information Security Policy and its related controls are based on the Bank’s risk assessment and risk appetite. The threat types used in the risk assessment are mapped and intergraded with the Basel II event types.
Human resources As an international bank serving customers worldwide, CEB NV has a multinational workforce. Due to the economic situation, the Bank scaled down its number personnel during 2009, mainly by not extending temporary contracts.
Employees at the year-end
Country 2009 2008 2007
Netherlands 340 330 271
Germany 214 235 142
Belgium 21 21 9
Malta 22 27 21
China 4 4 3
Russia 3,116 3,412 4,721
Romania 1,300 2,008 2,313
Switzerland 44 52 57
Ukraine 167 341 211
United Arab Emirates 14 9 –
Total 5,242 6,439 7,748 The Bank introduced an online employee appraisal system in 2009 and will further rely on continual feedback on targets and achievements recorded and evaluated in this platform.
The Bank took a modern and transparent approach towards developing a Remuneration Policy. The Bank will start introducing the policy into its current procedures and will make the policy effective at a consolidated level in 2010.

24
Cre
dit E
urop
e Ba
nk N
V A
nnua
l Rep
ort 2
009
Cor
por
ate
gov
ern
ance
Corporate governance
Corporate governance
A. GeneralCEB NV was established as a public limited company (naamloze vennootschap) in Amsterdam on 24 February, 1994. The company has registered shares and is not listed on any stock exchange. The total issued and fully paid-up share capital of CEB NV at the end of 2009 amounted to EUR 399.5 million (equal to 2008).
Share capitalThe shares of CEB NV are almost fully owned by CEG NV, a holding company established in the Netherlands. Ultimately, CEG NV’s shares are owned by Hüsnü M. Özyeğin. In addition to CEG NV as main shareholder, 15 individuals hold a minority stake in CEB NV. These individuals are either Managing Board members, senior management or Supervisory Board members of CEB NV. The shares were acquired in 2008 as part of a long-term incentive plan.
Banking supervisionCEB NV has had a full banking license in the Netherlands since 1994. The Dutch Central Bank (De Nederlandsche Bank NV – DNB) is the main prudential supervisor, for the NV as well as for the financial institutions owned by it.
Furthermore, CEB NV is registered as financial services provider with the Authority for Financial Markets (Autoriteit Financiële Markten) in the Netherlands.
RegulationsAlthough CEB NV is not listed, taking into consideration its role as a financial institution in the Netherlands, it voluntarily supports and applies, to a large extent, the best practices of the Dutch Corporate Governance Code (Code Tabaksblat). By doing so, the Bank follows the recommendation of the DNB to apply the best practices of the Code Tabaksblat.
Subsequently, the Bank is subject to the provisions of the ‘Banking Code’ (Code Banken) ; the sector-wide principles announced by the Dutch Bankers’ Association (Nederlandse Vereniging van Banken) in September 2009 and effective per January 1, 2010. For more information on CEB NV’s compliance and its preparations to implement the principles of the ‘Banking Code’, please see section D, below. The statutory corporate rules in the Netherlands are laid down in CEB NV’s articles of association (statuten). Further, its Managing Board, Supervisory Board and each subcommittee has its own charter (reglementen). Those of the Managing
Board and Supervisory Board are published on the Bank’s corporate website. For all the employees and others working with the Bank, a Code of Conduct has been established to set standards for professional conduct.
CEB NV as a parent bankAs a result of organizational restructurings and organic growth, CEB NV directly owns five banking subsidiaries in Russia, Switzerland, Romania, Ukraine and the United Arab Emirates, and two leasing companies in Ukraine and Russia. In February 2010, CEB NV signed an agreement to acquire 95% of the outstanding shares in Millennium Bank AS from Banco Comercial Portugues, subject to the approval of the Dutch and Turkish financial authorities. As a result, a sixth banking subsidiary, located in Turkey, will be added to the CEB NV network of banks.
To underpin its holding function, some departments in the head office in Amsterdam have group responsibility. This means that local managers in the subsidiaries have a direct reporting line to the head of the respective department in Amsterdam. The departments concerned are: Internal Audit, Compliance, Treasury (asset-liability management), Risk Management, IT, Information Security and Financial Control. Moreover, as part of the new management structure for the integrated organization, all general (country) managers of the respective subsidiaries will report to the new CEO of CEB NV.
Finally, to support and align the group (business) policy, some Supervisory and Managing Board members of CEB NV have a seat in the Supervisory Board or similar supervisory body of a banking subsidiary of CEB NV.
B. BoardsCEB NV applies a two-tier board structure with a Managing Board and a Supervisory Board. Managing BoardThe members of the Managing Board of CEB NV and their respective functions are:
Turhan Cemal Beriker, CEOŞenol Aloğlu, Deputy CEOYavuz Tayfun, CCROUmut Bayoğlu, CFOA. Hamdi Arman, Global Head TCF

25
Credit Europe Bank N
V Annual Report 2009
Corp
orate govern
ance
Corporate governance
A. Hamdi Arman was appointed to the Managing Board effective September 1, 2009, following receipt of approval from the DNB.
For the profiles of each Managing Board member, please see page 10.
At the beginning of 2010, the appointment of Murat Basbay as CEO was announced internally. Subject to DNB approval, he will take office from Turhan Cemal Beriker in spring 2010. During a transition period, Mr Beriker will stay in the Managing Board to hand over duties to his successor, after which he will assume a senior position in the financial services sector of the Fiba Group.
The Managing Board of CEB NV is jointly responsible for the management of the Bank, which includes realizing the Bank’s goals and strategy, and the policy and results arising thereof. The Managing Board is also responsible for compliance with all relevant laws and regulations, management of the risks at-tached to our banking activities and for the funding of the Bank. Without detriment to this collective and joint responsibility, between the members of the Managing Board the following allocation of tasks is agreed:
Managing Board accountabilities
Turhan Cemal Beriker Corporate Banking, PR, Treasury, Internal
Audit
Şenol Aloğlu Retail Banking, Information Security, IT,
Operations (excl. risk), Bank Relations, Leasing
and Insurance
Yavuz Tayfun Credit, Risk Management (Pillar I and
concentration risk), Compliance and Legal
Umut Bayoğlu Financial Control, Risk Management (Pillar II
excluding concentration risk), HR, and
Business Development and Strategy
A. Hamdi Arman Trade and Commodity Finance, group-wide
A copy of the Managing Board Charter can be retrieved from CEB NV’s corporate website.
Supervisory BoardAll members of the Supervisory Board have a banking or finan-cial background and experience. Mehmet Güleşci qualifies as financial expert as per III.3.2 of the Code Tabaksblat.
In line with corporate rules in the Netherlands, and as set forth in CEB NV’s Articles of Association and in the Charter of the Supervisory Board, the Supervisory Board’s task is to supervise
the policy of the Managing Board and the general affairs of the Bank, and to support the Managing Board with advice. It should be noted, however, that in addition to their supervisory role, the following Supervisory Board members also have a more executive role at the consolidated level in the sense that they contribute to high-level business decisions for certain disciplines. These are Fevzi Bozer for Corporate Banking and F. Onur Umut for Retail Banking and IT. For 2010, it is envis-aged that the active contributions of these Supervisory Board members (as described above) will be reduced and taken over by the CEO and/or Managing Board.
The Charter of the Supervisory Board is published on the Bank’s corporate website.
CommitteesThe Supervisory Board is supported by four committees: Audit & Risk, Corporate Governance & Nomination, Remuneration and Compliance Oversight.
The main objective of each committee is as follows:Audit & Risk: • advises the Supervisory Board on, and super-vises the status of and developments in, the Bank’s risk- management system, internal control systems and compli-ance-related issues. It also performs a review of CEB NV’s financial statements and the reports of the external auditor. Corporate Governance & Nomination:• advises the Super-visory Board on corporate governance developments, reviews the implementation of corporate governance principles and practices within CEB NV and advises on adjustments. It is also responsible for nominations, which involves establishing and advising on the selection criteria, profile and nomination process for new Supervisory and Managing Board members. Remuneration:• proposes a policy and a structure relating to performance evaluation and target setting for a certain level of senior employees of CEB NV and its subsidiaries, and imple-ments the policy and framework for the Supervisory Board. Compliance Oversight:• keeps the Supervisory and Managing Board informed and updated on developments and/or best practices in compliance and reviews these developments and/or best practices for applicability to CEB NV. It further reviews the implementation of CEB NV’s compliance principles and compliance program and advises on adjustments.
Each committee has its own charter, approved by the Supervisory Board.
For more information on the members of the committees, the number of meetings in 2009 of the Supervisory Board, of its committees and regular subjects discussed, please see page 7.

26
Cre
dit E
urop
e Ba
nk N
V A
nnua
l Rep
ort 2
009
Cor
por
ate
gov
ern
ance
Corporate governance
C. CEB NV and the observance of the Code TabaksblatThis section contains a brief overview of CEB NV’s current compliance with the best-practice rules of the Code Tabaks-blat. It should be noted that because of its private ownership structure, the Code Tabaksblat provisions on shareholders (rights, meetings, obligations, protective measures – see Chap-ter IV of the Code Tabaksblat ) are not applicable to CEB NV.
On the basis of a gap analysis of the Dutch corporate governance provisions and the Bank’s current practice and structure, the following main deviations for CEB NV in terms of compliance with the relevant best practices of the Code Tabaksblat 1 are given:• Transparency on remuneration of the Managing Board and
Supervisory Board (best-practice provisions II.2 and III.7) No information is given on remuneration of individual mem-
bers of the Managing Board or the Supervisory Board of CEB NV, given the private ownership of the Bank. It is the view of the Managing Board that the figures provided must give a sufficient level of transparency to stakeholders. The total and limited breakdown of remuneration figures show that, given the Bank’s revenue and income levels, remuneration of the Managing Board and Supervisory Board do not adversely burden the bank’s income statement and are generally lower than observed levels in the Netherlands. The latter statement is supported by a benchmark study, executed at the order of CEB NV’s Remuneration Commit-tee by a reputable external bureau at the beginning of 2010. The aggregate remuneration and compensation amounts for each of the boards are disclosed separately in section E.
•The independence of the Supervisory Board members (best-practice provisions III.2)
Taking into account the requirements for Supervisory Board members’ independence, the following statement applies to the Bank: all but one member of the Supervisory Board qualifies as ‘dependant’ in the definition of the Code Tabaksblat .
The search for and appointment of a second independent Supervisory Board member is high on the priority list for 2010.
1 The Code Tabaksblat in effect per 2008.
D. ‘Banking Code’ Soon after the publication of the ‘Banking Code’ in September 2009, the Bank started analyzing its principles and guidelines. Although in large measure CEB NV already complies with the principles, the Bank created a ‘road map’ with a list of actions on the basis of a gap analysis. These actions lie in the area of setting up a program for lifelong learning for both Supervisory
and Managing Board members, adapting and implementing a Remuneration Policy – also in line with the ‘Principles for sound compensation’ published by the DNB and the AFM, introducing the moral statement and revising internal regula-tions to comply with the principles of the ‘Banking Code’.
By mid-2010, supported by the Managing Board, the Bank aims to have completed the actions required to comply with the ‘Banking Code’ and related rules in the Netherlands. In the second half of the year, these guidelines and best practices will be rolled out to all the Bank’s subsidiaries and branches.
More information on the Bank’s compliance to the ‘Banking Code’ and on the progress in implementing the guidelines, can be found on the Bank’s corporate website (www.crediteuropebank.com).
E. Remuneration PolicyAs announced above, the Bank’s Remuneration Policy was re-vised in late 2009 and early 2010 to comply with the rules and guidelines in the ‘Banking Code’ and the ‘Principles for sound compensation’ published by the DNB and the AFM in 2009. In the Remuneration Committee/Supervisory Board meeting held in March 2010, the revised Remuneration Policy was adopted.
The key elements of this Policy, effective per January 1, 2010, are as follows:
the rules of the Policy apply to the Managing Board and •senior executives directly reporting to the Managing Board (including but not limited to the general managers of the subsidiaries). The senior executives in the subsidiaries (directly reporting to the general managers) are subject to the rules of a local Remuneration Policy which is (to be) built on the CEB NV Policy; the CEB NV Supervisory Board is responsible for establish-•ing, executing and evaluating the Policy and for approving the remuneration package for the Managing Board. Further, the Supervisory Board reviews the Managing Board’s imple-mentation of the rules of the Policy and approves the general principles of remuneration for other bank employees; the Supervisory Board has the right to delegate any of its •duties under the Remuneration Policy to the CEB NV Remuneration Committee;at the discretion of the Supervisory Board, in certain events, •remuneration may be adjusted or the variable part of the remuneration may be reclaimed;in principle, there are no entry or retention awards, unless •the Supervisory Board decides otherwise in an individual case. In the event of dismissal of an executive, severance payment may not exceed one year’s fixed salary;

27
Credit Europe Bank N
V Annual Report 2009
Corp
orate govern
ance
Corporate governance
annual appraisal of executives is based on previously agreed •targets (financial and non-financial); and,the remuneration can be composed of a fixed and variable •element whereby the variable part shall not exceed the fixed component of the remuneration. For the Managing Board, the variable part is paid over a period of three years and a material part is only payable in the second and third years.
The total remuneration of EUR 2.91 million for the Bank’s Supervisory and Managing Boards in 2009 (2008: EUR 2.6 million), can be broken down as follows:
(in EUR million)
Total amount of compensation for the Supervisory Board 1.17
Total amount of remuneration for the Managing Board 1.74
Which is broken down into:
– fixed remuneration 1.43
– variable remuneration 0.31
F. Conflict of Interest PolicyIn 2009, the Conflict of Interest Policy was adjusted in line with the relevant rules of the Act on Financial Supervision (Wet op the financieel toezicht) and the Code Tabaksblat .
Transactions in which the interests of the Bank and that of a board member or related party appear to be conflicted are to be reported to the Chairman of the Supervisory Board. Subsequently, the potentially conflicted transaction needs to be approved by either a subcommittee of the Supervisory Board (for credit-related transactions) or the Supervisory Board itself (for non-credit transactions). If a member of the Supervisory Board himself is conflicted, he is excluded from deliberations and voting on the transaction. Approval requires firstly that the potential conflict of interest transaction is undertaken upon market prevailing conditions and is against usual collateral. See note 36 on page 77 for a list of aggregate numbers of transactions with related parties.

28
Cre
dit E
urop
e Ba
nk N
V A
nnua
l Rep
ort 2
009
Ou
tloo
k 2
010
Outlook 2010
Our outlook for 2010 is a moderate global economic recovery where, relatively speaking, the US will outperform the EU and most emerging markets will outperform the G10 and other developed countries. By historic standards, the expected growth rates for the developed economies are low, suggesting a con-tinuation of low inflation and interest rates for a relatively long period of time, and at least until the last quarter of 2010. We see some central banks and governments shifting towards more stringent monetary and fiscal policy positions and we expect the FED and ECB to be cautious in their exit strategies, preferring to err on the inflationary side rather than risk deflation.
Looking at some general market developments in markets or regions where we are active, we foresee growth picking up in Russia. Domestic demand is the key factor, but the economy is still very dependent on commodity exports. The Central Bank of Russia is pursuing a more flexible exchange-rate policy by allowing the ruble to strengthen against the basket since the beginning of the year. The Central Bank of Russia is also expected to continue monetary easing.
Romania has enjoyed more favorable views from rating agen-cies since the IMF support resumed. This had been suspended in November 2009, due to political turmoil in the country. Growth is projected to be in positive territory for this year and the National Bank of Romania has more room for additional rate cuts.
Ukraine’s political outlook has recently improved, which is an indicator that the country will slowly recover from the crisis. Ukraine is now closer to loosening up its relationship with the IMF, and the next tranche of the standby loan arrangement arranged in late 2008 is expected to be released this year, if there is no further political upheaval.
We expect Turkey's economic recovery to gain further strength throughout 2010. The country has fared well in the recent crises, underpinned by a solid and well capitalized banking system that has not been exposed to the toxic assets that the global banking system suffered from. In addition, the adjust-ment and contraction in Turkey has been very quick and deep, and Turkey is well positioned to rebound.
In the beginning of 2010, inflation figures are higher, and we expect that the Central Bank of Turkey will tighten its policy some time this year. However, against the relatively strong recovery, we still expect volatility in the Turkish market due to exogenous factors linked to global macroeconomic develop-
ments. Internal demand and confidence indicators are still fragile, and unemployment remains high at 13.5%.
Although Abu Dhabi’s last-minute rescue package last December and the Dubai Government’s recent announcement that it will honor the debt obligations of its related entities caused some relief, the problem is still there. Even after the critical issues of debt restructuring have been solved, risk premiums in the region may stay at elevated levels throughout the year and the overall growth prospects are likely to show limited improvement, if any. As CEB NV has no real-estate exposure in the region, and because we think trade activity in the Gulf region will benefit from increased commodity flows linked to the global recovery, we are optimistic about developments in that region for the year 2010.
With the rebound in global trade, the Netherlands, whose economy depends heavily on exports, increased its prospects with a positive growth rate in 2010. So far, government spend-ing is the main economic driver, without much contribution from private consumption or investment. Inflation is expected to remain moderate and the deterioration in the labor market is not set to improve soon.
The banking sector stabilized in 2009, regaining some of the confidence lost during the crisis. Still, there are uncertain-ties linked to the projection of economies and developments of non-performing loans, due to high unemployment and depressed house prices. In addition, new regulations coming into effect in the years ahead will have profound effects on the sector, where increased capital requirements will require banks to adjust their business activities and will have a dampening effect on overall lending activity. This supports our view of moderate rather than strong recovery, and could also put pres-sure on spreads and yields in general once central banks start draining the excessive liquidity in the system.
The credit crisis heavily impacted the Dutch banking landscape. A majority of the Dutch top-10 banks is currently under govern-ment influence: through nationalization, capital injection and/or state guarantees granted for issuing bonds. CEB NV has main-tained sufficient levels of solvency and liquidity, and it did not need to make use of any state support, nor does it expect to do so in the near future. For the Dutch Deposit Guarantee Scheme, change is projected in such a way that banks will be asked to pay a guarantee premium in advance, based on their risk profile. We welcome this idea, provided that objective performance indicators of the Dutch banks, such as profitability and solvency over the last years, are taken into account.

Despite the uncertainty, we have confidence in our prospects for 2010. We have a diversified portfolio of activities, including retail, SME and corporate banking in a wide range of geographies. In 2010, we expect growth in a number of our subsidiaries, specifically in Russia and in the United Arab Emirates, which have already proved their potential during the unstable years of 2008 and 2009. Also, we expect our corporate banking activities to grow, particularly in the G10 and other developed countries, provided that market volumes in worldwide commodity trade pick up, independent of com-modity price increases. In retail banking in Western Europe, we expect to increase our activities in the field of consumer finance.
In early 2010, the Bank announced its acquisition of a 95% stake in Turkey-based Millennium Bank AS, subject to the approval of the Dutch and Turkish authorities. At the end of 2009, Millennium Bank AS had 18 branches and it reported a total balance sheet of EUR 495 million. If and when approval is granted, the acquisition can be perceived as significant, as Turkey has been an important market for CEB NV since its inception. In retail banking, this acquisition will strengthen our capability to raise deposits outside the EU, while in corporate banking, it will help us gain a foothold in an important growth market.
We maintain, as such, a positive view of the period ahead, despite the vestige of uncertainty in some of the markets. While the downside of expectations has been curbed, the Bank is well positioned to take advantage of the economic environment and will prudently keep on creating value for its customers, its shareholders, in a balanced manner in the G10 and other developed markets.
Amsterdam, March 19, 2010
Turhan Cemal BerikerŞenol AloğluYavuz TayfunUmut BayoğluA. Hamdi Arman
29
Credit Europe Bank N
V Annual Report 2009
Ou
tlook 20
10
Outlook 2010


Consolidated Financial Statements 2009As of and for the year ended December 31, 2009
(Unless otherwise stated, all amounts are in thousands of euros)

32
Cre
dit E
urop
e Ba
nk N
V A
nnua
l Rep
ort 2
009
Gen
eral
in
form
atio
n
General information
Supervisory BoardChairman: Maarten HulshoffMember: Hüsnü ÖzyeğinMember: Fevzi BozerMember: Mehmet GuleşciMember: F. Onur UmutMember: Murat Özyeğin
Managing BoardChief Executive Officer: Turhan Cemal BerikerDeputy Chief Executive Officer: Şenol AloğluChief Financial Officer: Umut BayoğluChief Credit Risk Officer: Yavuz TayfunGlobal Head TCF: A. Hamdi Arman
Registered officeKarspeldreef 6A1101 CJ AmsterdamThe NetherlandsPhone: +31 (0)20 357 63 00Fax: +31 (0)20 357 63 01
AuditorKPMG Accountants N.V.

33
Credit Europe Bank N
V Annual Report 2009
Con
solidated
statemen
t of fin
ancial p
ositio
n
Consolidated statement of financial position
Notes Page 2009 2008
Assets
Cash and balances at central banks 5 55 1,596,422 1,964,800
Financial assets at fair value through profit or loss 6 55 995,730 251,608
Financial investments 7 56 1,117,840 386,720
Loans and receivables – banks 8 57 615,514 952,932
Loans and receivables – customers 9 58 5,218,687 5,369,721
Derivative financial instruments 11 61 202,266 425,074
Equity accounted investment 12 62 125 125
Property and equipment 13 63 82,502 91,711
Intangible assets 14 64 22,369 15,696
Deferred tax assets 32 71 8,189 12,591
Current tax assets 18,851 6,682
Other assets 15 65 77,116 63,117
Total assets 9,955,611 9,540,777
Liabilities
Due to banks 16 65 1,317,185 1,229,425
Due to customers 17 65 7,223,360 6,801,952
Derivative financial instruments 11 61 198,625 334,475
Issued debt securities and other borrowed funds 18 66 214,338 135,569
Deferred tax liabilities 32 71 29,472 28,947
Current tax liabilities 1,929 10,611
Other liabilities 19 66 109,126 97,710
Total liabilities (excluding subordinated liabilities) 9,094,035 8,638,689
Subordinated liabilities 20 67 223,490 231,079
Total liabilities 9,317,525 8,869,768
Equity
Share capital 21 67 399,500 399,500
Share premium 21 67 163,748 162,321
Retained earnings 184,759 141,764
Fair value reserve (2,321) (10,205)
Translation reserve (107,245) (84,915)
Hedge reserve (17,963) 39,561
Equity attributable to shareholders of the Parent Company 620,478 648,026
Equity attributable to minority interests 17,608 22,983
Total equity 638,086 671,009
Total equity and liabilities 9,955,611 9,540,777
Commitment and contingencies 35 76 738,787 1,417,102

34
Cre
dit E
urop
e Ba
nk N
V A
nnua
l Rep
ort 2
009
Con
soli
dat
ed p
rofi
t an
d l
oss
stat
emen
t
Consolidated profit and loss statement
Notes Page 2009 2008
Interest and similar income 1,103,449 1,105,344
Interest expense and similar charges (762,061) (650,985)
Net interest income 23 68 341,388 454,359
Fees and commissions income 78,624 98,217
Fees and commissions expense (23,700) (26,725)
Net fee and commission income 24 69 54,924 71,492
Net trading income/(expense) 25 70 69,717 19,307
Results from financial transactions 26 70 5,595 (18,814)
Other operating income 27 70 3,788 3,117
Operating income 79,100 3,610
Credit loss charges 10 59 (159,801) (143,844)
Net operating income 315,611 385,617
Personnel expenses 28 70 (126,342) (157,803)
General and administrative expenses 29 71 (90,533) (104,213)
Depreciation and amortization 13, 14 63, 64 (15,552) (16,055)
Other operating expenses 30 71 (3,608) (1,932)
Other impairment loss 31 71 (1,939) (4,385)
Total operating expenses (237,974) (284,388)
Operating profit before tax 77,637 101,229
Income tax expense 32 71 (27,106) (26,683)
Profit for the year 50,531 74,546
Attributable to:
Equity holders of the Parent Company 49,277 72,173
Minority interests 1,254 2,373
Earnings per share attributable to equity holders
of the Parent Company (in euros) 33 75
Basic 0.1233 0.1958
Diluted 0.1233 0.1958

35
Credit Europe Bank N
V Annual Report 2009
Con
solidated
statemen
t of comp
rehen
sive incom
e
Consolidated statement of comprehensive income
2009 2008
Profit for the period 50,531 74,546
Foreign currency translation differences for foreign operations (22,330) (64,699)
Net change in fair value of available-for-sale assets 7,884 (9,043)
Net loss on hedges of net investments in foreign operations (47,028) 29,065
Revaluation of property, plant and equipment 523 (107)
Cash flow hedges:
– effective portion of changes in fair value (10,496) 10,496
Net change in fair value of available-for-sale transferred to profit and loss (5,595) 18,814
Other comprehensive income for the period (77,042) (15,474)
Total comprehensive income for the period (26,511) 59,072
Attributable to:
– owners of the company (27,765) 56,699
– non-controlling interest 1,254 2,373
Total comprehensive income for the period (26,511) 59,072

36
Cre
dit E
urop
e Ba
nk N
V A
nnua
l Rep
ort 2
009
Con
soli
dat
ed s
tate
men
t of
ch
ang
es in
equ
ity
Consolidated statement of changes in equity
Attributable to equity holders of the Parent Company
Net
invest- Cash
Fair ment flow Issued Share Retained value hedge hedge Translation Minority Total
capital premium earnings reserve reserve reserve reserve Total interest equity
At January 1, 2009 399,500 162,321 141,764 (10,205) 29,065 10,496 (84,915) 648,026 22,983 671,009
Net gains on available-
for-sale financial assets – – – 7,884 – – – 7,884 24 7,908
Foreign-currency
translation – – – – – – (22,330) (22,330) 274 (22,056)
Net gain on net
investment hedge – – – – (47,028) – – (47,028) – (47,028)
Net gain on cash
flow hedge – – – – – (10,496) – (10,496) (442) (10,938)
Profit for the year – – 49,277 – – – – 49,277 1,254 50,531
Total income and expense for the year recognized directly in equity – – 49,277 7,884 (47,028) (10,496) (22,330) (22,693) 1,110 (21,583)
Dividends paid – – (6,805) – – – – (6,805) – (6,805)
Share capital – – – – – – – – (5,259) (5,259)
Retained earning – – – – – – – – (1,153) (1,153)
Transfer to/from share premium – 1,427 – – – – – 1,427 (18) 1,409
Addition to reserve on tangibles – – 523 – – – – 523 (55) 468
At December 31, 2009 399,500 163,748 184,759 (2,321) (17,963) – (107,245) 620,478 17,608 638,086
At January 1, 2008 324,500 162,321 69,698 (1,162) – – (20,217) 535,140 18,944 554,084
Net gains on available-
for-sale financial assets – – – (9,043) – – – (9,043) – (9,043)
Foreign-currency
translation – – – – – – (64,698) (64,698) (222) (64,920)
Net gain on hedge of net
investment – – – – 29,065 – – 29,065 – 29,065
Net gain on cash flow hedge – – – – – 10,496 – 10,496 – 10,496
Profit for the year – – 72,173 – – – – 72,173 2,373 74,546
Total income and expense for the year recognized directly in equity – – 72,173 (9,043) 29,065 10,496 (64,698) 37,993 2,151 40,144
Transfer from retained
earnings – – – – – – – – (1,185) (1,185)
Addition to reserve
on tangibles – – (107) – – – – (107) – (107)
Issue of share capital 75,000 – – – – – – 75,000 2,631 77,631
Additions to minority
interest – – – – – – – – 442 442
At December 31, 2008 399,500 162,321 141,764 (10,205) 29,065 10,496 (84,915) 648,026 22,983 671,009

37
Credit Europe Bank N
V Annual Report 2009
Con
solidated
cash flow
statemen
t
Consolidated cash flow statement
Notes Page 2009 2008
Operating activities
Profit for the period 50,531 74,546
Adjustments for significant non-cash items included in income
Depreciation, amortization and impairment of fixed assets 13, 14, 31 63, 64, 71 15,683 20,208
Credit loss charges 10 59 159,801 143,844
Other impairment loss 31 71 1,808 232
Movements in operating assets and liabilities
Net change in financial assets at fair value through profit or loss (744,122) 183,568
Net change in loans and receivables – banks 318,714 449,899
Net change in loans and receivables – customers (105,678) (872,012)
Net change in other assets 63,389 (64,462)
Total movements in operating assets (467,697) (303,007)
Net change in due to banks 105,711 (179,009)
Net change in due to customers 573,610 2,186,717
Net change in other liabilities (53,540) (29,585)
Total movements in operating liabilities 625,781 1,978,123
Net interest income (341,388) (454,359)
Interest and dividends received 1,224,725 1,032,116
Interest paid (932,581) (691,557)
Taxes paid (29,999) (16,308)
Cash flow from operating activities 306,664 1,783,838
Investing activities
Purchases of financial investments 7 56 (1,255,219) (384,277)
Sales and redemption of financial investments 7 56 522,849 169,242
Acquisition of property and equipment 13 63 (10,267) (65,690)
Sale of property and equipment 13 63 5,555 25,598
Acquisition of intangibles 14 64 (12,443) (13,200)
Sale of intangibles 14 64 2,727 211
Cash flows from investing activities (746,798) (268,116)
Financing activities
Issuance of subordinated liabilities – 27,871
Issuance of other long-term funding 78,769 –
Repayment of other long-term funding – (247,605)
Proceeds from the issue of shares – 75,000
Dividends paid (6,805) –
Cash flow from financing activities 71,964 (144,734)
Movement in cash and cash equivalents (368,170) 1,370,988
Cash and cash equivalents at January 1 1,964,800 588,228
Net foreign exchange difference (208) 5,584
Cash and cash equivalents at December 31 5 55 1,596,422 1,964,800

38
Cre
dit E
urop
e Ba
nk N
V A
nnua
l Rep
ort 2
009
Cor
por
ate
info
rmat
ion
Corporate information
1. Corporate information
GeneralCredit Europe Bank NV (CEB NV), which was established in 1994 as Finansbank (Holland) N.V., is the Parent Company of Credit Europe Bank NV consolidated group of companies (the Bank) and is domiciled in Amsterdam, the Netherlands. The Consolidated Financial Statements of the Bank for the year ended December 31, 2009, incorporate figures of the Parent Company and its controlled entities.
The Bank was founded as a specialized trade-finance bank, which aimed to actively participate in the wholesale financing of international trade. In later years, the Bank started retail-banking activities, including savings accounts, mortgage loans, consumer loans and credit cards.
As of January 30, 2009, 98% of the outstanding shares of Credit Europe Leasing LLC have been transferred to the Bank, as a capital contribution by the Group.
The accounting policies set out below have been applied consistently to all periods presented in these Consolidated Financial Statements and in preparing an opening International Financial Reporting Standards (IFRS) balance sheet at January 1, 2005, for the transition to IFRS, as adopted by the European Union (EU).
The Consolidated Financial Statements of CEB NV as at and for the year ended December 31, 2009, are available upon request from the Company’s registered office at Karspeldreef 6A, 1101 CJ Amsterdam, or at www.crediteuropebank.com.

39
Credit Europe Bank N
V Annual Report 2009
Su
mm
ary of sign
ificant accou
ntin
g p
olicies
Summary of significant accounting policies
2. Basis of preparation
a) Statement of complianceThe Consolidated Financial Statements of Credit Europe Bank NV and all its subsidiaries (CEB NV, the Bank) are prepared in accordance with International Financial Reporting Standards (IFRS), as adopted by the European Union (EU), and have been approved by the Board of Directors per March 19, 2010.
b) Basis of measurementThe Consolidated Financial Statements are prepared on a historical-cost basis, except for ‘available-for-sale investments’, ‘derivative financial instruments’ and ‘financial assets (and liabilities) designated at fair value through profit or loss’, which have been measured at fair value.
c) Functional and presentation currencyThese Consolidated Financial Statements are presented in euros, which is the Bank’s functional currency. Financial infor-mation presented in euros has been rounded to the nearest thousand, except where indicated.
d) Significant accounting judgments and estimatesThe preparation of Consolidated Financial Statements in conformity with IFRS requires the Bank’s management to make judgments, estimates and assumptions that affect the application of policies, and the reported amounts of assets and liabilities, income and expenses. The estimates and associated assumptions are based on historical experience and various other factors that are believed to be reasonable under the circumstances, the results of which form the basis of judgments about the carrying values of assets and liabilities that are not readily apparent from other sources. Actual results may differ from these estimates.
The estimates and underlying assumptions are reviewed on an ongoing basis. Revisions to accounting estimates are recognized in the period in which the estimate is revised if the revision affects only that period, or in the period of the revision and future periods if the revision affects both current and future periods.
The most significant use of judgments and estimates are as follows:
(i) Fair value of financial instrumentsWhere the fair values of financial assets and financial liabilities recorded on the balance sheet cannot be derived from active markets, they are determined using a variety of valuation techniques that include the use of mathematical models. The input to these models is taken from observable markets where
possible, but where this is not feasible, a degree of judgment is required in establishing fair values. The judgments include considerations of liquidity and model inputs, such as correlation and volatility for longer-dated derivatives.
(ii) Impairment losses on loans and receivables and finan-cial investment securitiesThe Bank reviews its problem loans and receivables and held-to-maturity investment securities at each reporting date to assess whether an allowance for impairment should be recorded in the profit and loss statement. In particular, judgment by the management is required on the amount and timing of future cash flows when determining the level of allowance required. Such estimates are based on assumptions about a number of factors and actual results may differ, resulting in future changes to the allowance.
In addition to specific allowances against individually signifi-cant losses and receivables, the Bank also makes a collective impairment allowance against the remaining exposures, which, although not specifically identified as requiring a specific allowance, have a greater risk of default than when originally granted. This takes such factors as any deterioration in country risk or the industry, as well as any identified structural weaknesses or deterioration in cash flows, into consideration.
(iii) Deferred tax assetsDeferred tax assets are recognized for all unusual tax losses to the extent that is probable that taxable profit will be available against which the losses can be utilized. Significant manage-ment judgment is required to determine the amount of deferred tax assets that can be recognized, based on the likely timing and level of future taxable profits together with future tax-planning strategies.
3. Summary of significant accounting policies
The accounting policies set out below have been applied consistently to all periods presented in these Consolidated Financial Statements, and have been applied consistently by group entities, except as explained in note 3 ( c).
a) Basis of consolidation
SubsidiariesSubsidiaries are those enterprises controlled by the Bank. Control exists when the Bank has the power, directly or indirectly, to govern the financial and operating policies of an

40
Cre
dit E
urop
e Ba
nk N
V A
nnua
l Rep
ort 2
009
Su
mm
ary
of s
ign
ific
ant
acco
un
tin
g p
olic
ies
Summary of significant accounting policies
enterprise to obtain benefits from its activities. In assessing control, potential voting rights that are currently exercisable or convertible are taken into account. The Consolidated Financial Statements of subsidiaries (including a special-purpose entity that the Bank controls) are included in the Consolidated Financial Statements from the date on which control commences until the date on which control ceases.
All intra-group balances and transactions, including income, expenses and dividends and unrealized gains on intra-group transactions, are eliminated in full. Unrealized losses are also eliminated, unless the transaction provides evidence of an impairment of the asset transferred.
Minority interests represent the portion of profit and loss and net assets not owned, directly or indirectly, by the Bank and are presented separately in the profit and loss statement and in ‘equity’ in the consolidated balance sheet, separately from the ‘Parent Company shareholders’ equity’.
In applying its policies on securitized financial assets, the Bank considers both the degree of risk and reward on assets transferred to another entity and the degree of control exercized by the Bank over the other entity. When the Bank, in substance, controls the entity to which financial assets have been transferred, the entity is included in these Consolidated Financial Statements and the transferred assets are recognized in the Bank’s balance sheet.
Details of the Bank’s securitization activities are given in note 22.
Special-purpose entities Special-purpose entities (SPEs) are created to accomplish a narrow and well-defined objective, such as the securitization of particular assets or the execution of a specific borrowing or lending transaction. An SPE is consolidated if, based on an evaluation of the substance of its relationship with the Bank and the SPE’s risks and rewards, the Bank concludes that it controls the SPE. The following circumstances may indicate a relationship in which, in substance, the Bank controls and consequently consolidates an SPE:
The SPE’s activities are being conducted on behalf of the •group according to its specific business needs so that the group obtains benefits from the SPE’s operation.The group has the decision-making powers to obtain the •majority of the benefits of the activities of the SPE or, by setting up an ‘autopilot’ mechanism, the group has delegated these decision-making powers.
The group has rights to obtain the majority of the benefits •of the SPE and therefore may be exposed to risks incident to the activities of the SPE.The group retains the majority of the residual or ownership •risks related to the SPE or its assets to obtain benefits from its activities.
b) Foreign currency translation
Transactions and balancesThe Consolidated Financial Statements are presented in euros, which is the Bank’s functional and presentation currency. Each entity of the Bank determines its own functional currency, and items included in the Consolidated Financial Statements of each entity are measured using that functional currency.
Transactions in foreign currencies are initially recorded in the functional currency rate ruling at the date of the transaction. Monetary assets and liabilities denominated in foreign currencies are re-translated at the functional currency rate of exchange ruling at the balance sheet date. All differences are taken to the profit and loss statement. Non-monetary items that are measured in terms of historical cost in a foreign currency are translated using the exchange rates as of the date of the initial transactions. Non-monetary items measured at fair value in a foreign currency are translated using the exchange rates at the date when the fair value was determined. All differences are taken into a separate component of equity. On disposal of this non-monetary item measured at fair value, the deferred cumulative amount recognized in equity relating to that particular non-monetary item is recognized in the profit and loss statement.
Translation differences in the profit and loss accounts are generally included in ‘net trading income’. Translation differences related to the disposal of available-for-sale securities are considered an inherent part of the capital gains or loses recognized in results from financial transactions.
Foreign operationsThe assets and liabilities of foreign operations (including goodwill and fair-value adjustments arising on acquisition) are translated into the Bank’s functional currency, the euro, at the rate of exchange ruling at the balance sheet date. The profit and loss statements of foreign subsidiaries are translated at the weighted average exchange rates for the year. Exchange differences arising on translation are taken directly to a separate component of equity. On disposal of a foreign entity, the deferred cumulative amount recognized in equity relating to that particular foreign operation is recognized in the profit and loss statement.

41
Credit Europe Bank N
V Annual Report 2009
Su
mm
ary of sign
ificant accou
ntin
g p
olicies
Summary of significant accounting policies
Hedges of net investments in foreign operationsFor accounting policy, see note 3 (c – ix)
c) Financial instruments – initial recognition and subsequent measurement
Date of recognitionFinancial assets and liabilities are recognized in the balance sheet when the Bank becomes a party to the contractual provisions of the instrument. Regular purchases or sales of financial assets that require delivery of assets within the timeframe generally established by regulation or convention in the marketplace are recognized on the trade date; i.e., the date that the Bank commits to purchase or sell the asset. Derivatives are recognized on a trade-date basis. Forward pur-chases and sales other than those requiring delivery within the timeframe established by regulation or market convention are recognized as derivative forward transactions until settlement.
Initial recognition of financial instrumentsThe classification of financial instruments at initial recognition depends on the purpose for which the financial instruments were acquired and their characteristics. All financial instru-ments are measured initially at their fair value plus, in case of financial assets and financial liabilities not classified at ‘fair value through profit or loss’, any directly attributable incremen-tal costs of acquisition or issue.
Measurement classificationsThe Bank classifies its financial assets and liabilities into the following measurement (valuation) categories:
(i) Derivatives recorded at fair value through profit or lossA derivative financial instrument is a financial contract be-tween two parties where payments are dependent on move-ments in price of one or more underlying financial instruments, references, rates or indices. Derivatives include currency and cross-currency swaps, forward foreign-exchange contracts, interest-rate swaps, currency options, equity options, bonds options and credit-default swaps. Derivatives are recorded at fair value and carried as assets when their fair value is positive and as liabilities when their fair value is negative. Derivative financial instruments are subsequently re-measured at fair value. Changes in the fair value of derivatives are included in ‘net trading income’. Gains and loses generated with derivative financial instruments used for asset-liability management is recorded in ‘interest income and interest expense’.
Derivatives embedded in other financial instruments are treated as separate derivatives and recorded at fair value if
their economic characteristics and risks are not closely related to those of the host contract, and the host contract is not itself held for trading or designated at fair value through profit or loss. The embedded derivatives separated from the host are carried at fair value in the trading portfolio with changes in fair value recognized in the profit and loss statement under ‘net trading income’.
(ii) Financial assets or liabilities held for tradingTrading assets and liabilities are those assets and liabilities that the Bank acquires or incurs principally for the purpose of selling or repurchasing in the near future, or holds as part of the port-folio that is managed together for short-term profit or position taking. Trading assets and liabilities are initially recognized and subsequently measured at fair value in the balance sheet with transaction costs taken directly to profit and loss. Interest income or expense is recorded in ‘net interest income’ according to the terms of the contract. All changes in fair value, except for the interest accruals, are recognized as part of ‘net trading income’ in profit and loss. Trading assets and liabilities are not reclassified subsequent to their initial recognition, except as described below.
Change in accounting policyIn October 2008, the IASB issued Reclassification of Finan-cial Assets (Amendments to IAS 39 Financial Instruments: Recognition and Measurement and IFRS 7 Financial Instru-ments: Disclosures). The amendment to IAS 39 permits an entity to reclassify non-derivative financial assets, other than those designated at fair value through profit or loss upon initial recognition, out of the ‘fair value through profit or loss’ (i.e. trading) category if they are no longer held for the purpose of being sold or repurchased in the near term, as follows:
If the financial asset would have met the definition of ‘loans •and receivables’ if it had not been required to be classified as ‘held for trading at initial recognition’, then it may be reclas-sified if the entity has the intention and ability to hold the financial asset for the foreseeable future or until maturity.If the financial asset would not have met the definition of •‘loans and receivables’, then it may be reclassified out of the trading category only in ‘rare circumstances’.
The amendment to IFRS 7 introduces additional disclosure requirements if an entity has reclassified financial assets in ac-cordance with the amendment to IAS 39. The amendments are effective retrospectively from 1 July 2008.
Pursuant to these amendments, the group reclassified certain non-derivative financial assets out of ‘trading and available-for-sale assets’ and into ‘held-to-maturity

42
Cre
dit E
urop
e Ba
nk N
V A
nnua
l Rep
ort 2
009
Su
mm
ary
of s
ign
ific
ant
acco
un
tin
g p
olic
ies
Summary of significant accounting policies
investment securities’. For details on the impact of these reclassifications, see notes 6 and 7.
(iii) ‘Day 1’ profitWhere the transaction price in a non-active market is different to the fair value from other observable current market transac-tions in the same instrument or based on a valuation technique whose variable includes only data from observable markets, the Bank immediately recognizes the difference between transaction price and fair value (a ‘Day 1’ profit) in the profit and loss statement under ‘net trading income’. In cases where use is made of unobservable data, the difference between the transaction price and model value is only recognized in the profit and loss statement when the inputs become observable or when the instrument is derecognized.
(iv) Held-to-maturity investmentsHeld-to-maturity investments are those which carry fixed or determinable payments and which the Bank has the intention and ability to hold to maturity and which are not designated at ‘fair value through profit or loss’ or as ‘available for sale’. After initial measurement, held-to-maturity investments are subsequently measured at amortized cost using the effective-interest-rate method, less provision for impairment. Amor-tized cost is calculated by taking into account any discount or premium on acquisition and fees that are an integral part of the effective interest rate. The amortization is included in ‘interest income’. The losses arising from impairment of such invest-ments are recognized in the profit and loss statement as ‘credit loss charges’.
(v) Loans and receivables from banks and customersLoans and receivables due from banks (excluding the trading loans) are non-derivative financial assets with fixed or deter-minable payments and fixed maturities that are not quoted in an active market. They are not entered into with the intention of immediate or short-term resale and are not classified as ‘financial assets held for trading’, ‘financial investments – available for sale’ or ‘financial assets designated at fair value through profit or loss’. After initial measurement, the amounts from loans and receivables from banks and customers are subsequently measured at amortized cost using the effective-interest method, less an allowance for impairment. Amortized cost is calculated by taking into account any discount or premium on acquisition and fees and costs that are an integral part of the effective interest rate. The amortization is included under ‘interest income’ in the profit and loss statement. The losses arising from impairment are recognized in the profit and loss statement as ‘credit loss charges’.
(vi) Available-for-sale financial assetsAvailable-for-sale financial assets are designated as such or do not qualify to be recorded at ‘fair value through profit or loss’ or ‘held-to-maturity’. They may be sold in response to liquidity needs or changes in market conditions.
After initial measurement, available-for-sale financial assets are subsequently measured at fair value. Unrealized gains and losses are recognized directly in equity in the ‘fair value reserve’. When the security is disposed of, or is determined to be impaired, the cumulative gain or loss previously recognized in equity is recognized in the profit and loss statement in ‘re-sults from financial transactions’. Interest earned while holding available-for-sale investment securities is reported as interest income using the effective interest rate. The losses arising from impairment of such investments are recognized in the profit and loss statement as ‘credit loss charges’.
(vii) Repo contractsTransactions where financial instruments, such as loans, are sold under a commitment to repurchase (repos) at a predeter-mined price or are purchased under a commitment to resell (re-verse repo) are treated as collateralized borrowing and lending transactions. The legal title of the financial instrument subject to resale or repurchase commitments is transferred to the lender. Financial instruments transferred under a repurchase commitment are henceforth included in the relevant items of the Bank’s balance sheet, such as ‘loans and receivables – customers’, while the borrowing is recorded in ‘due to banks’. Financial instruments received under a resale commitment are recorded in the off-balance sheet accounts, unless sold.
Income and expenses arising from repurchase and resale com-mitments, being the difference between the selling and the purchase price, are accrued over the period of the transaction and recorded in the profit and loss statement as ‘interest and similar income’ or ‘interest expense and similar charges’.
(viii) Deposits, issued debt securities and subordinated liabilitiesIssued financial instruments or their components that are not designated at ‘fair value through profit or loss’, are classified as liabilities under ‘issued debt securities’ or ‘funds borrowed’ where the substance of the contractual arrangement results in the Bank having an obligation to either deliver cash or another financial asset to the holder, or to satisfy the obligation other than by exchange of a fixed amount of cash.
Deposits, debt securities issued and subordinated liabilities are initially measured at fair value, plus directly attributable

43
Credit Europe Bank N
V Annual Report 2009
Su
mm
ary of sign
ificant accou
ntin
g p
olicies
Summary of significant accounting policies
transaction costs, and are subsequently measured at amortized cost using the effective-interest-rate method. Amortized cost is calculated by taking into account any discount or premium on the issue and fees that is an integral part of the effective interest rate.
(ix) Derivatives held for risk-management purposes and hedge accountingDerivatives held for asset-liability risk-management purposes (i.e. asset and liability management) include all derivative as-sets and liabilities that are not classified as ‘trading assets and liabilities’. Derivatives held for risk-management purposes are measured at fair value in the balance sheet.
The Bank designates certain derivatives held for risk-manage-ment purposes and certain non-derivative financial instruments as hedging instruments in qualifying hedging relationships. On initial designation of the hedge, the Bank formally documents the relationship between the hedging instrument(s) and hedged item(s), including the risk-manage-ment objective and strategy in undertaking the hedge trans-action, together with the method that will be used to assess the effectiveness of the hedging relationship. The Bank makes an assessment, both at the inception of the hedge relationship as well as an ongoing basis, whether the hedging instrument(s) is (are) expected to be ‘highly effective’ in offsetting in the changes in the fair value or cash flows of the respective hedged item(s) during the period for which the hedge is designated, and whether the actual results of each hedge are within a range of 80–125%.
Net investment hedgesWhen a derivative (or a non-derivative financial liability) is designated as the hedging instrument in a hedge of a net investment in a foreign operation, the effective portion of changes in the fair value of the hedging instrument is recog-nized directly in equity, in the ‘foreign-currency-translation reserve’ (or in our case ‘revaluation reserves hedging’). Any ineffective portion of changes in the fair value of the derivative is recognized immediately in profit and loss. The amount recognized in equity is removed and included in profit and loss on disposal of the foreign operations.
Cash-flow hedgesWhen a derivative is designated as the hedging instrument to hedge variability in cash flows that can be attributed to a particular risk associated with a recognized asset or liability or to hedge a highly probable forecast transaction that could affect profit and loss, the effective changes in the fair value of the derivative are recognized directly in equity, in the
hedging reserve. The amount recognized in equity is removed and included in profit and loss in the same period as the hedged cash flows affect profit and loss under the same profit and loss statement line item as the hedged item. Any inef-fective portion of changes in the fair value of the derivative is recognized immediately in profit and loss.
If the derivative expires; is sold, terminated or exercised; no longer meets the criteria for cash flow-hedge accounting; or its designation is revoked, then the hedge accounting is prospectively discontinued and the amount recognized in equity remains in equity until the forecast transaction affects profit and loss. If the forecast transaction is no longer expected to occur, then the balance in equity is recognized immediately in profit and loss.
d) Derecognition of financial assets and liabilities
Financial assetsThe Bank derecognizes a financial asset (or, where applicable, a part of a financial asset or part of a group of similar financial assets) when:
the rights to receive cash flows from the asset have expired;•the Bank retains the right to receive cash flows from the •
asset, but has assumed an obligation to pay them in full without material delay to a third party under a ‘pass- through’ arrangement and transferred substantially all risks and rewards;
the Bank has transferred its rights to receive cash flows from • the asset and either has transferred substantially all the risks and rewards of the asset, or has transferred control of the asset and not retained substantially all risks and rewards.
The Bank enters into transactions whereby it transfers assets recognized on its balance sheet, but retains either all, or sub-stantially all, of the risks and rewards of the transferred asset, or a portion of them. If all, or substantially all, risks and rewards are retained, then the transferred assets are not derecognized from the balance sheet. Transfers of assets with retention of all risks and rewards include, for example, securities lending and repurchase transactions.
Where the Bank has transferred its rights to receive cash flows from an asset and has not transferred or substantially retained all the risks and rewards of the asset, or transferred control of the asset, the asset is recognized to the extent of the Bank’s continuing involvement in the asset, determined by the extent to which it is exposed to changes in the value of the transferred asset. Continuing involvement that takes the form of a guaran-tee over the transferred asset is measured at the lower of the

44
Cre
dit E
urop
e Ba
nk N
V A
nnua
l Rep
ort 2
009
Su
mm
ary
of s
ign
ific
ant
acco
un
tin
g p
olic
ies
Summary of significant accounting policies
original carrying amount of the asset and the maximum amount of the consideration that the Bank could be required to repay.
Where continuing involvement takes the form of a written and/or purchased option (including a cash-settled option or similar provision) on the transferred asset, the extent of the Bank’s continuing involvement is the amount of the transferred asset that the Bank may repurchase, except that in the case of a written put option (including a cash-settled option or similar provision) on an asset measured at fair value, the extent of the Bank’s continuing involvement is limited to the lower of the fair value of the transferred asset and the option exercise price.
Financial liabilitiesA financial liability is derecognized when the obligation under the liability is discharged, cancelled or expires. Where an existing financial liability is replaced by another from the same lender on substantially different terms, or the terms of an existing liability are substantially modified, such an exchange or modification is treated as a derecognition of the original li-ability and the recognition of a new liability, and the difference in the respective carrying amounts is recognized in profit and loss.
e) Determination of fair valueFair value is the amount for which an asset could be exchanged, or a liability settled, between knowledgeable, willing parties in an arm’s-length transaction on the measurement date.
When available, the Bank measures the fair value of an instrument using quoted prices in an active market for that instrument. A market is regarded as active if quoted prices are readily and regularly available and represent actual and regu-larly occurring market transactions on an arm’s-length basis.
If a market for a financial instrument is not active, the Bank establishes fair value using a valuation technique. Valuation techniques include using recent arm’s-length transactions be-tween knowledgeable, willing parties (if available), reference to the current fair value of other instruments that are substantially the same, discounted cash-flow analyses and option-pricing models. The chosen valuation technique makes maximum use of market inputs, relies as little as possible on estimates specific to the Bank, incorporates all factors that market participants would consider in setting a price, and is consistent with accepted economic methodologies for pricing financial in-struments. Inputs to valuation techniques reasonably represent market expectations and measures of the risk-return factors inherent in the financial instrument. The Bank calibrates valuation techniques and tests them for validity using prices
from observable current market transactions in the same in-strument or based on other available observable market data.
The best evidence of the fair value of a financial instrument at initial recognition is the transaction price (i.e., the fair value of the consideration given or received), unless the fair value of that instrument is evidenced by comparison with other current and observable market transactions in the same instrument (i.e., without modification or repackaging) or based on a valuation technique whose variables only include data from observable markets. When transaction prices provide the best evidence of fair value at initial recognition, the financial instrument is ini-tially measured at the transaction price, and any difference be-tween this price and the value initially obtained from a valuation model is subsequently recognized in profit and loss depending on the individual facts and circumstances of the transaction but not later than when the valuation is supported wholly by observable market data or the transaction is closed out.
The principal methods and assumptions used by the Bank in determining the fair value of financial instruments are:
Fair values for trading and investment securities are deter-•mined using market prices from active markets. If no quoted prices are available from an active market, the fair value is determined using discounted cash-flow models. Discount factors are based on the swap curve, plus a spread reflecting the characteristics of the instrument.Fair values for derivative financial instruments are obtained •from active markets or determined using, as appropriate, discounted cash-flow models. Discount factors are based on the swap curve, plus a spread reflecting the characteristics of the instrument.Fair values for loans and deposits are determined using •discounted cash-flow models based on the Bank’s current incremental lending rates for similar types of loans. For variable-rate loans that re-price frequently and have no significant change in credit risk, fair values are approximated by the carrying amount.The carrying amounts are considered to approximate fair •values for other financial assets and liabilities, such as short-term payables and receivables.
f) Impairment of financial assets At each balance sheet date, the Bank assesses whether there is any objective evidence that a financial asset or group of finan-cial assets is impaired. A financial asset or a group of financial assets is deemed to be impaired if, and only if, there is objective evidence of impairment as a result of one or more events that occurred after the initial recognition of the asset (an incurred ‘loss event’) and that loss event (or events) has an impact on

45
Credit Europe Bank N
V Annual Report 2009
Su
mm
ary of sign
ificant accou
ntin
g p
olicies
Summary of significant accounting policies
the estimated future cash flows of the financial asset or group of financial assets that can be reliably estimated.
Objective evidence of impairment may include indications that the borrower or group of borrowers are experiencing signifi-cant financial difficulty, default or delinquency in interest or principal payments, restructuring of loans or advances by the Bank on terms that the Bank would not otherwise consider, the disappearance of an active market for a security, deterioration in the value of collateral, or other observable data relating to a group of assets, such as adverse changes in the payment status of borrowers or issuers in the group, or economic conditions that correlate with defaults in the group.
(i) Loans and receivables from customer and banksFor loans and receivables from customers and banks carried at amortized cost, the Bank first assesses whether objective evi-dence of impairment exists individually for significant financial assets or collectively for non-significant financial assets. If the Bank determines that no objective evidence of impairment ex-ists for an individually assessed financial asset, whether signifi-cant or not, it includes the asset in a group of financial assets with similar credit-risk characteristics and collectively assesses them for impairment. Assets that are individually assessed for impairment and for which an impairment loss is, or continues to be, recognized are not included in a collective assessment of impairment.
If there is objective evidence that an impairment loss has been incurred, the loss is measured as the difference between the asset’s carrying amount and the present value of estimated future cash flows (excluding future expected credit losses that have not yet been incurred). The carrying amount of the asset is reduced through an allowance account and the loss is recog-nized in the profit and loss statement. Interest continues to be accrued on the reduced carrying amount based on the original effective interest rate of the asset. Loans, together with the associated allowance accounts, are written off when there is no realistic prospect of future recovery and all collateral has been realized or has been transferred to the Bank. If, in a subsequent year, the estimated impairment loss increases or decreases due to an event occurring after the impairment was recognized, the previously recognized impairment loss is increased or reduced by adjusting the allowance account. When any part of a claim is deemed uncollectible or forgiven, a write-off is charged to the allowance account. If a future write-off is later recovered, the recovery is credited to the ‘credit loss charges’.
The present value of estimated future cash flows is discounted at the financial asset’s original effective interest rate. If a loan
has a variable interest rate, the discount rate for measuring any impairment loss is the current effective interest rate. The cal-culation of the present value of the estimated future cash flows of a collateralized financial asset reflects the cash flows that may result from foreclosure, less costs for obtaining and selling the collateral, whether or not foreclosure is probable.
Collective evaluation of impairment aims to establish portfolio provisions for losses incurred but not yet identified. By definition, these are losses that cannot yet be attributed to particular transactions. Therefore, this provision is derived from the portfolio analysis, which is based on the homogenous exposure structures of the financial assets being analyzed. Financial assets are grouped on the basis of their credit-risk characteristics, such as type, geographical location, past-due status and other relevant factors.
Future cash flows on a group of financial assets that are col-lectively evaluated for impairment are estimated on the basis of historical loss experiences for assets with credit-risk character-istics similar to those in the group. Historical loss experiences are adjusted on the basis of current and observable data to reflect the effects of current conditions that did not affect the year on which the historical loss experience is based and to remove the effects of conditions in the historical period that do not exist currently. The methodology and assumptions used for estimating future cash flows are reviewed regularly by means of back testing to reduce any differences between loss estimates and actual loss experience.
(ii) Held-to-maturity financial investmentsFor held-to-maturity investments, the Bank assesses indi-vidually whether there is objective evidence of impairment. If there is objective evidence that an impairment loss has been incurred, the loss is measured as the difference between the asset’s carrying amount and the present value of estimated future cash flows. The carrying amount of the asset is reduced and the amount of the loss is recognized in the profit and loss statement.
If, in a subsequent year, the estimated impairment loss decreases because of an event occurring after the impairment was recognized, any amounts formerly charged are reversed to the ‘credit loss charges’.
(iii) Available-for-sale financial assetsFor available-for-sale financial assets, the Bank assesses whether there is objective evidence that a financial asset or a group of financial assets is impaired at each balance sheet date.

46
Cre
dit E
urop
e Ba
nk N
V A
nnua
l Rep
ort 2
009
Su
mm
ary
of s
ign
ific
ant
acco
un
tin
g p
olic
ies
Summary of significant accounting policies
In the case of equity investments classified as AFS, objective evidence would include a significant or prolonged decline in the fair value of the investment below cost.
Where there is evidence of impairment, impairment losses on available-for-sale investment securities are recognized by transferring the cumulative loss directly in equity to profit and loss. The cumulative loss that is removed from equity and recognized in profit and loss is the difference between the acquisition cost, net of any principal repayment and amortiza-tion, and the current fair value, less any impairment loss previ-ously recognized in profit and loss.
In the case of unquoted debt instruments classified as ‘available-for-sale’, the impairment loss is calculated as the difference between the carrying amount of the investment and the present value of estimated future cash flows, discounted at the current market rate of return for similar financial assets.
Interest based on market rates is accrued at the effective inter-est rate on the reduced carrying amount of the asset, and is recorded as part of ‘interest and similar income’.
If, in a subsequent year, the fair value of a debt instrument in-creases and the increase can be objectively related to an event occurring after the impairment loss was recognized in the profit and loss statement, the impairment loss is reversed through the profit and loss statement. However, any subsequent recovery in the fair value of an impaired available-for-sale equity security is recognized directly in equity.
(iv) Renegotiated loansWhere possible, the Bank seeks to restructure loans rather than take possession of collateral. This may involve extending the payment arrangements and negotiating new loan conditions. If the conditions change significantly, the old loan is replaced by a new loan. Once the terms have been renegotiated, the loan is no longer considered past due. Management continuously reviews renegotiated loans to ensure that all criteria are met and that future payments are likely to occur. The loans continue to be subject to an individual or collective impairment assessment.
g) Netting and collateralThe Bank enters into master netting arrangements with coun-terparties wherever possible, and when appropriate, obtains collateral. If the Bank has the right on the grounds of either legal or contractual provisions and the intention to settle finan-cial assets and liabilities net or simultaneously these are offset and the net amount is reported in the balance sheet. Due to
differences in the timing of actual cash flows, derivatives with positive and negative fair values are generally not netted, even if they are held with the same counterparty.
h) Leasing Determining whether an arrangement is, or contains, a lease is based on the substance of the arrangement and requires an assessment of whether the fulfillment of the arrangement de-pends on using a specific asset or assets and the arrangement conveys a right to use the asset.
(i) Bank as a lesseeFinance leases, which substantially transfer all the risks and benefits incidental to ownership of the leased item to the Bank, are capitalized at the inception of the lease at the fair value of the leased property or, if lower, at the present value of the minimum lease payments, and are included in ‘property and equipment’ with the corresponding liability to the lessor included in ‘other liabilities’. Lease payments are apportioned between the finance charges and reduction of the lease liability to achieve a constant rate of interest on the remaining balance of the liability. Finance charges are charged directly to the profit and loss statement as ‘interest and similar expenses.’
Capitalized leased assets are depreciated over the shorter of the estimated useful life of the asset and the lease term if there is no reasonable certainty that the Bank will obtain ownership by the end of the lease term.
Operating lease payments are not recognized on the balance sheet. Any rentals payable are accounted for on a straight-line ba-sis over the lease term and included in ‘other operating expenses’.
(ii) Bank as a lessorFinance leases, where the Bank substantially transfers all the risks and benefits incidental to ownership of the leased item to the lessee, are included on the balance sheet as ‘loans and receivables – customers’. A receivable is recognized over the leasing period at an amount equal to the present value of the lease payments using the implicit rate of interest and including any guaranteed residual value. All income resulting from the receivable is included under ‘interest and similar income’ in the profit and loss statement.

47
Credit Europe Bank N
V Annual Report 2009
Su
mm
ary of sign
ificant accou
ntin
g p
olicies
Summary of significant accounting policies
i) Cash and cash equivalents‘Cash and cash equivalents’, as referred to in the cash flow statement, comprises cash on hand, current assets with central banks and amounts due from banks on demand with an insig-nificant risk of a change in value. Cash and cash equivalents are carried at amortized costs in the balance sheet.
The cash flow statement, based on the indirect method of calculation, gives details of the source of cash and cash equiva-lents that became available during the year, and the application of these cash and cash equivalents over the course of the year. The cash flows are analyzed into cash flows from opera-tions, including banking, investment and financing activities. Movements in loans and receivables and inter-bank deposits are included in cash flows from operating activities. Invest-ment activities comprise sales and redemptions in respect of financial investments, and property and equipment. The issuing of shares, and the borrowing and repayment of long-term funds are treated as financing activities. Movements due to currency-translation differences and the effects of the consolidation of business acquisitions, where of material significance, are eliminated from the cash flow figures.
j) Property and equipmentProperty and equipment is stated at cost, excluding the costs of day-to-day servicing, less accumulated depreciation and accu-mulated impairment in value. Borrowing costs are not included in the cost of property, plant and equipment, but recognized as an expense. Changes in the expected useful life are accounted for by changing the amortization period or method, as appro-priate, and treated as changes in accounting estimates.
Depreciation is calculated on other assets using the straight-line method to allocate their cost to their residual values over their estimated useful lives as follows:
Buildings 30–40 years
Furniture and fixtures 5–20 years
Machinery and equipment 3–20 years
Vehicles 2–5 years
Leasehold improvements Over the term of respective
leases or 3–5 years
An item of property and equipment is derecognized upon disposal or when no future economic benefits are expected from its use or disposal. Any gain or loss arising on derecogni-tion of the asset (calculated as the difference between the net disposal proceeds and the carrying amount of the asset) is recognized in ‘other operating income’ in the profit and loss in the year the asset is derecognized.
k) Intangible assets
(i) SoftwareIntangible assets mainly include the value of computer software. Intangible assets acquired separately are measured on initial recognition at cost. Following initial recognition, intangible assets are carried at cost less any accumulated am-ortization and any accumulated impairment losses. Intangible assets are amortized over the useful economic life and are assessed for impairment whenever there is an indication that the intangible asset may be impaired. The amortization period and the amortization method for an intangible asset are reviewed at least at each financial year-end. Changes in the expected useful life or the expected pattern of consumption of future economic benefits embodied in the asset is accounted for by changing the amortization period or method, as appropriate, and treated as changes in accounting estimates. The amortization expense on intangible assets is recognized in the profit and loss statement in the expense category consistent with the function of the intangible asset.
Expenditure on internally developed software is recognized as asset when the Bank is able to demonstrate its intention and ability to complete the development and use the software in a manner that will generate future economic benefits and can reliably measure the costs to complete development. The capitalized costs of internally developed software include all costs directly attributable to developing the software, and are amortized over its useful life. Internally developed software is stated at capitalized cost, less accumulated amortization and any accumulated impairment losses.
Amortization is calculated using the straight-line method over their estimated useful life of software, from the date it is available to use. The estimated useful life of software is three to ten years.
(ii) GoodwillGoodwill (negative goodwill) arises on the acquisition of subsidiaries.
Goodwill arising on the acquisition of a minority interest in a subsidiary represents the excess of the cost of the additional investment over the carrying amount of the interest in the net assets acquired at the date of exchange.
Subsequent to recognition, goodwill is measured at cost, less accumulated impairment losses.

48
Cre
dit E
urop
e Ba
nk N
V A
nnua
l Rep
ort 2
009
Su
mm
ary
of s
ign
ific
ant
acco
un
tin
g p
olic
ies
Summary of significant accounting policies
l) Business combinationsThe pooling-of-interest accounting method is used for businesses acquired or contributed under common control. This method requires that the financial statement items of the combining entities for the period in which the combination occurred, and for any comparative periods presented, were to be included as if they had been combined from the beginning of the earliest period presented.
m) Impairment of non-financial assetsAt each reporting date, or more frequently if events or changes in circumstances indicate that the carrying value may be impaired, the Bank assesses whether there is an indication that a non-financial asset may be impaired. If any such indica-tion exists, or when annual impairment testing for an asset is required, the Bank makes an estimate of the asset’s recoverable amount. Where the carrying amount of an asset (or cash-generating unit) exceeds its recoverable amount, the asset (or cash-generating unit) is considered impaired and is written down to its recoverable amount. The recoverable amount of an asset (or cash-generating unit) is the greater of its value in use and its fair value, less costs to sell. In assessing value in use, the estimated future cash flows are discounted to their present value using a pre-tax discount rate that reflects current market assessments of the time value of money and the risks specific to the asset.
For assets excluding goodwill, an assessment is made at each reporting date as to whether there is any indication that previously recognized impairment losses may no longer exist or may have decreased. If such indication exists, the recoverable amount is estimated. A previously recognized impairment loss is reversed only if there has been a change in the estimates used to determine the asset’s recoverable amount since the last impairment loss was recognized. If that is the case, the carrying amount of the asset is increased to its recoverable amount. Impairment losses for goodwill cannot be reversed for subse-quent increases in its recoverable amount in future periods.
n) Assets held for saleThe Bank takes possession of collateral it holds as security. The Bank books these assets as ‘held for sale’ under other assets. These assets are not used for the daily banking transactions.
o) Deposits, debt securities issued and subordinated liabilitiesDeposits, debt securities issued and subordinated liabilities are the Bank’s sources of debt funding.
Deposits, debt securities issued and subordinated liabilities are initially measured at fair value, plus directly attributable trans-action costs, and subsequently measured at amortized cost using the effective-interest method. Amortized cost is calculated by taking into account any discount or premium on the issue and fees that are an integral part of the effective interest rate.
p) Financial guaranteesIn the ordinary course of business, the Bank gives financial guarantees consisting of letters of credit, letters of guarantee, and acceptances. Financial guarantees are initially recognized in the Consolidated Financial Statements at fair value, in ‘other liabilities’, being the premium received. Subsequent to initial recognition, the Bank’s liability under each guarantee is measured at the higher of the amortized premium and the best estimate of expenditure required to settle any financial obliga-tion arising as a result of the guarantee.
Any increase in the liability relating to financial guarantees is taken to the profit and loss statement as ‘credit loss charges’. The premium received is recognized in the profit and loss statement under ‘fees and commission income’ on a straight-line basis over the life of the guarantee.
q) ProvisionsProvisions are recognized when the Bank has a present obliga-tion (legal or constructive) as a result of a past event, and it is probable that an outflow of resources embodying economic benefits will be required to settle the obligation and a reliable estimate can be made of the amount of the obligation. If the effect is material, provisions are determined by discounting the expected future cash flows at a pre-tax rate that reflects cur-rent market assessments of the time value of money and, where appropriate, the risks specific to the liability.
r) Income taxes
(i) Current taxCurrent tax assets and liabilities for current and prior years are measured at the amount expected to be recovered from, or paid to, the tax authorities. The tax rates and tax laws used to compute the amount are those that are enacted, or substan-tively enacted, by the balance sheet date.
(ii) Deferred income taxDeferred income tax is provided, using the liability method, on all taxable temporary differences arising between the car-rying amounts of assets and liabilities for financial reporting purposes and the amounts used for taxation purposes, except

49
Credit Europe Bank N
V Annual Report 2009
Su
mm
ary of sign
ificant accou
ntin
g p
olicies
Summary of significant accounting policies
for differences not deductible for tax purposes and initial recognition of assets and liabilities that affect neither account-ing nor taxable profit.
Deferred tax liabilities and assets are recognized when it is probable that the future economic benefits resulting from the reversal of taxable temporary differences will flow to or from the Bank. Deferred tax assets are recognized only to the extent that it is probable that future taxable profit will be available against which the deferred tax asset can be utilized. The car-rying value of deferred tax assets is reviewed at each balance sheet date and reduced to the extent that it is no longer prob-able that sufficient taxable profit will be available to allow all or part of the deferred tax asset to be utilized. Unrecognized deferred tax assets are reassessed at each balance sheet date and are recognized to the extent that it has become probable that future taxable profit will allow the deferred tax asset to be recovered.
Deferred tax assets and liabilities are measured at the tax rates that are expected to apply in the year when the asset is realized or the liability is settled, based on tax rates (and tax laws) that have been enacted or substantively enacted at the balance sheet date.
Current tax and deferred tax relating to items recognized directly in equity are also recognized in equity and not in the profit and loss statement.
Deferred tax assets and deferred tax liabilities are offset if a legally enforceable right exists to offset current tax assets against current tax liabilities, and the deferred taxes relate to the same taxable entity and the same taxation authority.
s) Recognition of income and expensesRevenue is recognized to the extent that it is probable that the economic benefits will flow to the Bank and the revenue can be reliably measured. The following specific recognition criteria must also be met before revenue is recognized:
(i) Interest income and expensesFor all financial instruments measured at amortized cost and interest-bearing financial instruments classified as ‘available-for-sale financial investments’, interest income or expense is recorded at the effective interest rate, which is the rate that exactly discounts estimated future cash payments or receipts through the expected life of the financial instrument or a shorter period, where appropriate, to the net carrying amount of the financial assets or financial liability. The calculation takes into account all contractual terms of the financial instrument,
which includes any fees or incremental costs directly attribut-able to the instrument, but not future credit losses.
Interest income or expenses on trading assets and derivative financial instruments are included within interest income and expense.
(ii) Fees and commissions incomeThe Bank earns fee and commission income from a diverse range of services it provides to its customers. Fees and com-missions for the provision of services over a period of time are generally recognized on an accrual basis. Loan-commitment fees for loans that are likely to be drawn down and other credit related fees are deferred (together with any incremental costs), and are recognized as an adjustment to the effective interest rate of the loan.
Commission and fees arising from negotiating or participating in the negotiation of a transaction for a third party are recog-nized on completion of the underlying transaction. Manage-ment and service fees are recognized based on the applicable service contracts. Fees for bank transfers and other banking-transaction services are recorded as income when collected.
(iii) Net trading incomeNet trading income includes gains and losses arising from changes in the fair value and disposal of financial assets and liabilities held for trading, and includes dividends received from trading instruments.
(iv) Results from financial transactionsResults from financial transactions include gains and losses on the sale of non-trading financial assets and liabilities. Dividend income from non-trading equity investments is recognized when entitlement is established.
t) Fiduciary activitiesAssets held in fiduciary capacity, if any, are not reported in the Consolidated Financial Statements, as they are not the assets of the Bank.
u) Dividends on ordinary sharesDividends on ordinary shares of the Bank are recognized as a liability and they are deducted from equity when they are approved by the Bank’s shareholders. Interim dividends are deducted from equity when they are paid.
Dividends for the year that are approved after the balance sheet date are dealt with in the ‘subsequent events’ note.

50
Cre
dit E
urop
e Ba
nk N
V A
nnua
l Rep
ort 2
009 v) Equity components
Currency-translation accountThe currency-translation account comprises all currency dif-ferences arising from translating the Consolidated Financial Statements of foreign operations, net of the translation impact on foreign-currency liabilities. These currency differences are in-cluded in income on disposal or partial disposal of the operation.
Hedge reserveThe Bank uses a mixture of forward foreign-exchange con-tracts to hedge the foreign-currency-translation risk on its net investments in foreign subsidiaries and cross-currency swaps and forwards to hedge the foreign-currency risk arising from its issuance of debt securities in foreign currencies.
When a derivative is designated as the hedging instrument to hedge a net investment in a foreign operation or hedge the foreign-currency risk of issued debt securities, the effective portion of changes in the fair value of the hedging instrument is recognized directly in equity, in the ‘hedge reserve’. Any ineffective portion of changes in the fair value of the deriva-tive is recognized immediately in profit and loss. The amount recognized in equity is removed and included in profit and loss on disposal of the foreign operation.
The cumulative gain or loss recognized in equity is transferred to profit and loss in the same period that the hedge item (issued debt security) affects profit and loss.
Fair value reserveIn this component, gains and losses arising from a change in the fair value of available-for-sale assets are recognized, net of taxes. When the relevant assets are sold, impaired or otherwise disposed of, the related cumulative gain or loss recognized in equity is transferred to the profit and loss statement.
w) Earnings per shareThe Bank presents basic and diluted earnings-per-share (EPS) data for its ordinary shares. Basic EPS is calculated by dividing the profit and loss attributable to ordinary shareholders of the Bank by the weighted average number of ordinary shares outstanding during the period. Diluted EPS is determined by adjusting the profit and loss attributable to ordinary sharehold-ers and weighted average number of ordinary shares outstand-ing for the effects of any potentially diluting ordinary shares.
x) Segment reportingSegment information is presented in respect of the Bank’s operating segments, where the Bank assesses performance and accordingly makes resource allocations.
y) New standards and interpretations not yet adoptedA number of new standards, amendments to standards and interpretations are not yet effective for the year ended December 31, 2009, and have not been applied in preparing these Consolidated Financial Statements. None of these will have an effect on the Consolidated Financial Statements of the Bank, with the exception of:
IFRS 9, • Financial Instruments, published on November 12 as part of phase 1 of the IASB’s comprehensive project to replace IAS 39, deals with classification and measurement of financial assets. The requirements of this standard represent a significant change from the existing requirements in IAS 39 in respect of financial assets. The standard contains two primary measurement categories for financial assets: amortized cost and fair value. A financial asset is measured at amortized cost if it is held within a business model whose objective is to hold assets in order to collect contractual cash flows that are solely the payments of principal and interest on principal outstanding. All other financial assets are measured at fair value. The standard eliminates the existing IAS 39 categories of held to maturity , available for sale, and loans and receivables. For an investment in an equity instrument which is not held for trading, the standard permits an irrevocable election on initial recognition, on an individual share-by-share basis, to present all fair value changes from the investment in other comprehensive income. No amount recognized in other comprehensive income would ever be classified to profit or loss at a later date. However, dividends on such investments are recognized in profit or loss, rather than other comprehensive income, unless they clearly represent a partial recovery of the cost of the investment. Investments in equity instru- ments in respect of any entity that does not elect to present fair value changes in other comprehensive income would be measured at fair value, with changes in fair value recognized in profit or loss. The standard requires that derivatives embedded in contracts with a host that is a financial asset within the scope of the standard are not separated. Instead, the hybrid financial instrument is assessed in its entirety to determine whether it should be measured at amortized cost or fair value.
Su
mm
ary
of s
ign
ific
ant
acco
un
tin
g p
olic
ies
Summary of significant accounting policies

51
Credit Europe Bank N
V Annual Report 2009
The standard is effective for annual periods beginning on or after January 1, 2013. Earlier application is permitted.
Amendments to IAS 39 Financial Instruments: Recognition and Measurement – Eligible Hedged Items clarifies the ap-plication of existing principles that determine whetherspecific risks or portions of cash flows are eligible for designation in a hedging relationship. The amendments will become manda-tory for the Bank’s 2010 Consolidated Financial Statements, with retrospective application required. The amendments are not expected to have a significant impact on the Consolidated Financial Statements. z) ReclassificationsThe Bank made some reclassifications in the Consolidated Financial Statements as of December 31, 2008, to present comparable results. In this regard:
The impairment charge for ‘impaired available-for-sale •assets’, amounting to EUR 1,013, has been reclassified from ‘other impairment loss’ to ‘credit-loss charges’ for the year ended December 31, 2008.The fees paid to intermediaries, amounting to EUR 5,887, •have been reclassified from ‘commission expense’ to ‘inter-est expense’ for the year ended December 31, 2008.Cost related to collecting saving deposits, amounting to •EUR 600, have been reclassified from ‘other impairment loss’ to ‘interest expense’ for the year ended December 31, 2008.Collection from written off loans, amounting to EUR 5,124, •has been reclassified from ‘other operating income’ to ‘credit loss charges’.
Su
mm
ary of sign
ificant accou
ntin
g p
olicies
Summary of significant accounting policies

52
Cre
dit E
urop
e Ba
nk N
V A
nnua
l Rep
ort 2
009
No
tes
to C
onso
lid
ated
Fin
anci
al S
tate
men
ts
4. Segment information
Segment information is presented in respect of the Bank’s operating segments, for which the Bank assesses performance and accordingly makes resource allocations.
The Bank has eight reportable segments (described below), which are the group’s strategic areas of operation. The strategic areas offer banking and banking-related products, and are managed separately to take account of local economic environments, which require different risk-management and pricing strategies. For each of the strategic areas, the CFO reviews internal management reports on at least a monthly basis. The following summary describes the operation of each of the Bank’s reportable segments:
Western Europe, retail:• Includes retail loans, such as consumer loans and funds entrusted by retail customers in Western Europe, including Germany, the Netherlands and Belgium.Western Europe, wholesale:• Includes loans to non-retail customers and those above the SME loan limits in the Netherlands, Germany, Belgium, Malta and Switzerland. Eastern Europe, retail:• Includes retail loans, including consumer loans and funds entrusted from retail customers in Eastern Europe: Russia, Romania and Ukraine.Eastern Europe, wholesale:• Includes loans to non-retail customers and those above the SME loan limits in Russia, Romania and Ukraine.Eastern Europe, leasing:• Includes leasing activities in Russia, Romania and Ukraine.Eastern Europe, SME:• Includes loans to small-and medium-sized business sector in Russia, Romania and Ukraine.Dubai, Wholesale:• Includes loans to corporate clients.
Measurement of segment assets and liabilities, and segment income and results is based on the Bank’s accounting policies. Inter-segment pricing is determined on an arm’s-length basis. Segment results, assets and liabilities include items directly attributable to a segment as well as those that can be allocated on a reasonable basis.
There have been no changes to the basis of segmentation or the measurement basis for the segment profit and loss since January 1, 2009.
Notes to Consolidated Financial Statements

53
Credit Europe Bank N
V Annual Report 2009
No
tes to Con
solidated
Finan
cial Statem
ents
Western Eastern
Western Europe, Eastern Europe, Eastern Eastern Dubai,
Europe, whole- Europe, whole- Europe, Europe, whole-
2009 retail sale retail sale leasing SME sale Other Group
Interest income –
external 51,627 629,123 214,659 138,474 24,005 26,620 18,941 – 1,103,449
Interest income –
other segments – 198,940 – 21,609 598 – – – 221,147
Interest revenue 51,627 828,063 214,659 160,083 24,603 26,620 18,941 – 1,324,596
Interest expense –
external (17,565) (648,726) (45,081) (45,525) (508) (4,315) (341) – (762,061)
Interest expense –
other segments (19,177) (100,272) (6,641) (72,774) (14,686) – (7,597) – (221,147)
Interest expense (36,742) (748,998) (51,722) (118,299) (15,194) (4,315) (7,938) – (983,208)
Net commission
income – external 834 32,845 31,351 10,991 80 5,071 103 – 81,275
Net commission
income – other segments (3,939) (7,899) (11,632) (2,471) (34) (360) (16) – (26,351)
Trading and other income (3,199) 37,965 9,750 32,718 (1,099) 1,613 1,352 – 79,100
Credit-loss charges (10,369) (38,721) (73,277) (17,494) (7,655) (12,285) – – (159,801)
Depreciation and
amortization expense (442) (2,766) (7,356) (3,029) (193) (1,569) (197) – (15,552)
Other material
non-cash items – – (593) (1,595) – – – – (2,188)
Other operating
expenses (5,325) (65,148) (94,808) (33,669) (4,239) (14,280) (2,765) – (220,234)
Operating profit before tax (7,555) 35,341 16,372 27,235 (3,731) 495 9,480 – 77,637
Income tax expense (878) (15,763) (131) (9,696) (638) – – – (27,106)
Profit for the year (8,433) 19,578 16,241 17,539 (4,369) 495 9,480 – 50,531
Other information
as at 2009
Total assets 867,396 5,879,156 1,044,321 1,563,917 196,830 192,024 211,967 – 9,955,611
Total liabilities 1,809,523 5,806,486 697,053 882,252 7,506 100,244 14,461 – 9,317,525
Equity accounted investees – – – – – – – 125 125
Addition to non-current
assets other than financial
instruments, deferred tax
assets, post-employment
benefit assets and rights
under insurance contracts – – 18 3,038 22 – – – 3,078
Notes to Consolidated Financial Statements

54
Cre
dit E
urop
e Ba
nk N
V A
nnua
l Rep
ort 2
009
No
tes
to C
onso
lid
ated
Fin
anci
al S
tate
men
ts
Notes to Consolidated Financial Statements
Western Eastern
Western Europe, Eastern Europe, Eastern Eastern Dubai,
Europe, whole- Europe, whole- Europe, Europe, whole-
2008 retail sale retail sale leasing SME sale Other Group
Interest income –
external 42,079 546,838 278,341 177,548 24,995 33,686 1,857 – 1,105,344
Interest income –
other segments – 141,100 – 2,369 444 – – – 143,913
Interest revenue 42,079 687,938 278,341 179,917 25,439 33,686 1,857 – 1,249,257
Interest expense –
external (28,250) (518,191) (64,322) (33,682) – (6,540) – – (650,985)
Interest expense –
other segments (90) (32,731) (18,705) (75,665) (15,527) – (1,195) – (143,913)
Interest expense (28,340) (550,922) (83,027) (109,347) (15,527) (6,540) (1,195) – (794,898)
Net commission income –
external 5,494 35,272 35,341 17,800 276 4,869 – – 99,052
Net commission income –
other segments (3,788) (5,266) (14,355) (3,721) (84) (346) – – (27,560)
Trading and other income (83) (6,140) 7,317 8,541 (8,471) 2,424 22 – 3,610
Credit-loss charges (12,420) (30,870) (74,437) (18,016) (986) (7,115) – – (143,844)
Depreciation and
amortization expense – (2,562) (8,617) (2,880) (169) (1,818) (9) – (16,055)
Other operating expenses (5,005) (70,961) (122,354) (46,298) (4,084) (19,041) (590) – (268,333)
Operating profit before taxes (2,063) 56,489 18,209 25,996 (3,606) 6,119 85 – 101,229Income tax expense (182) (10,771) (1,021) (13,573) (1,136) – – – (26,683)
Profit for the year (2,245) 45,718 17,188 12,423 (4,742) 6,119 85 – 74,546
Other information
as at 2008
Total assets 329,462 5,055,803 1,799,657 1,740,386 235,925 252,897 126,647 – 9,540,777
Total liabilities 1,801,503 5,437,345 1,395,561 108,527 3,616 118,751 4,465 – 8,869,768
Equity accounted investees – – – – – – – 125 125
Addition to non-current
assets other than financial
instruments, deferred tax
assets, post-employment
benefit assets and rights
under insurance contracts – – 43 18,088 125 – – – 18,256

55
Credit Europe Bank N
V Annual Report 2009
No
tes to Con
solidated
Finan
cial Statem
ents
Notes to Consolidated Financial Statements
5. Cash and balances at central banks
This item includes cash on hand and deposits with central banks in countries in which the Bank has a presence:
2009 2008
Balances at central bank 1,558,207 1,915,832
Cash on hand 38,215 48,968
Total 1,596,422 1,964,800
Deposits at central banks include reserve deposits amounting to EUR 211,201 (2008: EUR 296,381), which represents the mandatory deposit and is not available in the Bank’s day-to-day operations.
6. Financial assets at fair value through profit or loss
As of December 31, 2009 and 2008, financial assets at fair value through profit or loss comprised the following:
Financial assets held for trading 2009 2008
Government bonds and T-Bills 690,619 129,416
Bank bonds 298,470 53,904
Corporate bonds 6,113 19,118
Equity instruments – listed 528 369
Trading loans – 48,801
Total 1 995,730 251,608
1 EUR 925,901 (2008: EUR 189,713) of the total is listed securities and EUR 69,829 (2008: EUR 61,895) is non-listed securities.
The financial assets that the Bank has pledged as collateral for liabilities or contingent liabilities amounts to EUR 749,048 (2008: None).
These transactions are conducted under terms that are normal and customary to standard lending, and securities borrowing and lending activities, as well as requirements determined by exchanges where the Bank acts as an intermediary.
Gains and losses on changes in fair value of trading instruments are recognized in ‘net trading income’.
Reclassification out of trading assets Pursuant to the amendments to IAS 39 and IFRS 7 (described in note 3 ( c)), the Bank reclassified certain trading assets to held-to-maturity and available-for-sale securities. The Bank identified financial assets eligible under amendments, for which it had changed its intent such that it no longer held these financial assets for the purpose of selling in the short term. For trading assets identified for reclassification, the Bank determined that deterioration of financial markets during the third quarter constituted rare circum-stances that permit reclassification out of the trading category.

56
Cre
dit E
urop
e Ba
nk N
V A
nnua
l Rep
ort 2
009 Under IAS 39 amended, the reclassifications were made with effect from October 21, 2008 at fair value at July 1, 2008.
The tables below sets out the financial assets reclassified and their carrying and fair values:
2009 2008
Carrying value Fair value Carrying value Fair value
Trading assets reclassified to held-to-maturity securities 13,358 14,298 44,371 26,808
Trading assets reclassified to available for sale 4,045 4,324 3,833 2,900
7. Financial investments
2009 2008
Available-for-sale financial investments 651,688 103,881
Held-to-maturity financial investments 466,152 282,839
Total 1,117,840 386,720
Available-for-sale portfolio 2009 2008
Government bonds and T-Bills 428,017 2,228
Bank bonds 133,590 25,685
Corporate bonds 53,131 18,090
Loans 36,942 57,870
Equities-listed bonds 8 8
Total 1 651,688 103,881
1 EUR 468,266 (2008: 35,394) of the total is listed securities and EUR 183,422 (2008: EUR 68,487) is non-listed loans.
Held-to-maturity portfolio 2009 2008
Bank bonds 270,362 196,868
Government bonds and T-Bills 114,152 37,613
Corporate bonds 81,638 48,358
Total 466,152 282,839
As of December 31, 2009, EUR 240,050 of the financial investments that have been pledged or resold (2008: None).
No
tes
to C
onso
lid
ated
Fin
anci
al S
tate
men
ts
Notes to Consolidated Financial Statements

57
Credit Europe Bank N
V Annual Report 2009
The movement in investment securities may be summarized for 2009 and 2008 as follows:
2009 2008
Available- Available- for-sale Held-to-maturity for-sale Held-to-maturity
At January 1 103,881 282,839 183,109 3,573
Exchange differences and monetary loss on monetary assets (1,079) (2,328) (9,673) (198)
Additions 890,506 364,713 94,951 289,325
Disposals (sale and redemption) (348,785) (174,064) (103,827) (9,861)
Reclassification to held to maturity portfolio – – (55,554) –
Impairment losses (653) (5,008) (1,013) –
Gains/(losses) from changes in fair value 7,818 – (4,112) –
At December 31 651,688 466,152 103,881 282,839
Reclassification out of available-for-sale investment securitiesPursuant to the amendments to IAS 39 and IFRS 7 (described in note 3 (c)), the Bank reclassified, at July 1, 2008, certain available-for-sale investment securities as held-to-maturity investment securities. The Bank identified financial assets for which, at October 21, 2008, it had intention and ability to hold for the foreseeable future or until maturity.
The table below sets out the financial assets reclassified and their carrying and fair values:
2009 2008
Carrying value Fair value Carrying value Fair value
Available-for-sale investment securities
reclassified to held-to-maturity securities – – 55,354 34,307
8. Loans and receivables – banks
2009 2008
Placement with other banks 500,875 810,371
Loans and advances 109,733 119,424
Other 20,472 28,138
Subtotal 631,080 957,933Allowances for impairment (15,566) (5,001)
Total 615,514 952,932
‘Placement with other banks’ includes EUR 128,321 related to receivables with regard to securities that have been acquired in reverse repo transactions (2008: None).
Margin accounts that are not available in the Bank’s day-to-day operations amount to EUR 110,962 (2008: EUR 145,745).
For details on significant concentration, see risk management section, note 38.
No
tes to Con
solidated
Finan
cial Statem
ents
Notes to Consolidated Financial Statements

58
Cre
dit E
urop
e Ba
nk N
V A
nnua
l Rep
ort 2
009
9. Loans and receivables – customers
2009 2008
Commercial 3,355,134 3,277,021
Consumer 1,644,029 1,806,312
Finance lease receivables, net 173,000 226,868
Credit cards 183,834 169,732
Private customers 52,459 48,891
Public sector – 659
Subtotal 5,408,456 5,529,483
Allowances for impairment (189,769) (159,762)
Total 1 5,218,687 5,369,721
1 None of these loans are subordinated.
No individual loan or receivable has terms and conditions that materially affect the amount, timing or certainty of the consolidated cash flow of the Bank. For details on significant concentration, see the risk management section, note 38.
Loans to customers do not include any amount related to the receivables with regard to securities that have been acquired in reverse repo transactions (December 31, 2008: None).
Details of finance lease receivables are summarized below:
2009 2008
Not later than 1 year 29,914 17,848
Later than 1 year and not later than 5 years 132,429 196,143
Later than 5 years 35,544 51,627
Gross lease receivables 197,887 265,618
Not later than 1 year (610) (440)
Later than 1 year and not later than 5 years (14,481) (23,231)
Later than 5 years (9,796) (15,079)
Unearned interest income (24,887) (38,750)
Finance receivables, net 173,000 226,868
No
tes
to C
onso
lid
ated
Fin
anci
al S
tate
men
ts
Notes to Consolidated Financial Statements

59
Credit Europe Bank N
V Annual Report 2009
10. Loan impairment charges and allowances
2009 2008
Balance at January 1 164,763 76,844
New impairment allowances 188,727 161,484
Reversal of impairment allowances no longer required (31,603) (13,408)
Currency translation differences (4,576) (19,052)
Amounts written off (108,992) (35,860)
Recoveries of amounts previously written off (-) (2,984) (5,245)
Balance at December 31 205,335 164,763
Consumer loans 78,810 83,275
Commercial loans 84,024 59,063
Credit cards 17,883 12,383
Loans to banks 15,566 5,001
Private customers 176 3,517
Finance lease receivables 8,876 1,524
Total 205,335 164,763
Credit loss charges in profit and loss statements 2009 2008
New impairment allowances 188,727 161,484
Reversal of impairment allowances no longer required (31,603) (13,408)
Recoveries of amounts previously written off (-) (2,984) (5,245)
Credit loss charge 1 154,140 142,831
1 EUR 653 (2008: EUR 1,013) of the credit loss charges in the profit and loss statement is related to the financial investments in available for sale and
EUR 5,008 (2008: None) of the credit loss charges in the profit and loss statement is related to the financial investments held to maturity.
No
tes to Con
solidated
Finan
cial Statem
ents
Notes to Consolidated Financial Statements

60
Cre
dit E
urop
e Ba
nk N
V A
nnua
l Rep
ort 2
009 Individually assessed allowances for impairment 2009 2008
Balance at January 1 59,723 17,777
New impairment allowances 69,712 64,210
Reversal of impairment allowances no longer required (23,439) (7,398)
Currency translation differences (2,261) (3,332)
Amounts written off (27,479) (6,410)
Recoveries of amounts previously written off (-) (2,850) (5,124)
Balance at December 31 73,406 59,723
Collectively assessed allowances for impairment 2009 2008
Balance at January 1 105,040 59,067
New impairment allowances 119,015 97,274
Reversal of impairment allowances no longer required (8,164) (6,010)
Currency translation differences (2,315) (15,720)
Amounts written off (81,513) (29,450)
Recoveries of amounts previously written off (-) (134) (121)
Balance at December 31 131,929 105,040
No
tes
to C
onso
lid
ated
Fin
anci
al S
tate
men
ts
Notes to Consolidated Financial Statements

61
Credit Europe Bank N
V Annual Report 2009
11. Derivative financial instruments
In the ordinary course of business, the Bank enters into various types of transactions that involve derivative financial instruments. A derivative financial instrument is a financial contract between two parties where payments depend on movements in price in one or more underlying financial instruments, reference rates or indices. Derivative financial instruments include forwards, swaps, futures, credit default swaps and options.
The table below shows the fair values of derivative financial instruments, recorded as assets and liabilities, together with their notional amounts. The notional amount, recorded gross, is the amount of a derivative’s underlying asset, reference rate or index, and is the basis on which changes in the value of derivatives are measured. The notional amounts indicate the volume of transac-tions outstanding at the year-end and are indicative of neither the market nor the credit risk.
Trading portfolio derivative financial instruments 2009 2008
Notional Fair values Fair values Notional Fair values Fair values amounts – assets – liabilities amounts – assets – liabilities
Derivatives held for trading:
Interest rate derivatives – OTC
Swaps 1,267,739 384 – 514,976 – 13,674
Credit default swaps (protection purchased) 224,471 – 2,613 7,185 – 54
Credit default swaps (protection sold) (90,240) 144 – (113,889) 2,476 4,164
Futures (556,800) 2,775 – – – –
Subtotal 845,170 3,303 2,613 408,272 2,476 17,892
Currency derivatives – OTC
Swaps 8,153,321 161,032 147,524 4,626,727 232,314 151,969
Forwards 744,804 523 588 1,554,541 20,400 23,779
Futures – – – 62,175 992 1,072
Options (purchased) 3,002,151 25,020 – 6,347,532 114,598 –
Options (sold) (3,084,420) – 24,526 (6,363,938) – 114,535
Subtotal 8,815,856 186,575 172,638 6,227,037 368,304 291,355
Other derivatives
Equity options (purchased) 479,509 12,336 – 1,474,239 25,228 –
Equity options (sold) (479,509) – 12,336 (1,474,239) – 25,228
Subtotal – 12,336 12,336 – 25,228 25,228
Total derivatives 9,661,026 202,214 187,587 6,635,309 396,008 334,475
Derivative financial instruments held or issued for trading purposes: Most of the Bank’s derivative trading activities relate to as-set and liability management of the Bank and deal with customers who are normally laid off with counterparties. The Bank may also take positions with the expectation of profiting from favorable movements in prices, rates or indices.
Forwards and futures: Forwards and futures contracts are contractual agreements to buy or sell a specified financial instrument at a specific price and date in the future. Forwards are customized contracts transacted in the over-the-counter market. Future contracts are transacted in standardized amounts on regulated exchanges and are subject to daily cash-margin requirements.
Swaps: Swaps are contractual agreements between two parties to exchange movements in interest or foreign-currency rates or equity indices based on specified notional amounts.
No
tes to Con
solidated
Finan
cial Statem
ents
Notes to Consolidated Financial Statements

62
Cre
dit E
urop
e Ba
nk N
V A
nnua
l Rep
ort 2
009
No
tes
to C
onso
lid
ated
Fin
anci
al S
tate
men
ts
Notes to Consolidated Financial Statements
Credit-default swap: A credit-default swap (CDS) is a swap designed to transfer the credit risk of fixed-income products from one party to the other. It is an agreement between a protection buyer and a protection seller whereby the buyer pays a periodic fee in return for a contingent payment by the seller upon a credit event (such as a certain default) happening in the reference entity.
Options: Options are contractual agreements that convey the right, but not the obligation for the purchaser, either to buy or sell a specific amount of a financial instrument at a fixed price, either at a fixed future date or at any time within a specified period.
Derivatives held for risk management
Net investment hedgesThe Bank uses forwards and swaps to hedge the foreign-currency-translation risk on its net investment in foreign subsidiaries.
The fair value of derivatives designated as net investment hedges are as follows:
2009 2008
Assets Liabilities Assets Liabilities
Instrument type:
Foreign-exchange forwards and swaps 52 11,038 29,066 –
During 2009 and 2008, no losses relating to the ineffective portion of net investment hedges were recognized in profit and loss.
12. Equity-accounted investments
For 2009 and 2008, the movements of participating interests of the Bank companies are as follows:
Balance at Dividend Result for Balance at 2009 January 1 Additions Disposals received the year December 31
Stichting Credit Europe
Custodian Services 125 – – – – 125
Total 125 – – – – 125
Balance at Dividend Result for Balance at 2008 January 1 Additions Disposals received the year December 31
Stichting Credit Europe
Custodian Services 125 – – – – 125
Total 125 – – – – 125
Stichting Credit Europe Custodian Services is an entity that holds securities with custodian companies on behalf of clients of the Bank. The Bank owns a participation of 100%. From a legal point of view, ‘control’ of a stichting is exercised by its sole organ, being the management/board of directors. Control is not in the hand of shareholders because there are no shares or similar instruments.

63
Credit Europe Bank N
V Annual Report 2009
No
tes to Con
solidated
Finan
cial Statem
ents
Notes to Consolidated Financial Statements
13. Property and equipment
The book value of property and equipment in 2009 and 2008 changed as follows:
Furniture Leasehold Buildings and fixtures Vehicles improvements Total
Balance at January 1, 2009 47,469 37,334 1,008 5,900 91,711
Additions 1,887 7,369 542 469 10,267
Disposals (1,426) (2,642) (310) (1,177) (5,555)
Depreciation (2,148) (8,199) (463) (1,900) (12,710)
Currency translation differences (1,046) (2,256) (96) 738 (2,660)
Revaluation/impairment 1,449 – – – 1,449
Balance at December 31, 2009 46,185 31,606 681 4,030 82,502
Cost 65,725 72,354 3,709 11,436 153,224
Cumulative depreciation and impairment (19,540) (40,748) (3,028) (7,406) (70,722)
Balance at December 31, 2009 46,185 31,606 681 4,030 82,502
Furniture Leasehold Buildings and fixtures Vehicles improvements Total
Balance at January 1, 2008 36,449 33,325 1,743 4,651 76,168
Additions 20,691 39,925 778 4,296 65,690
Disposals (2,066) (22,750) (547) (235) (25,598)
Depreciation (2,222) (7,893) (752) (2,509) (13,376)
Currency translation differences (2,196) (5,273) (214) (303) (7,986)
Revaluation/impairment (3,187) – – – (3,187)
Balance at December 31, 2008 47,469 37,334 1,008 5,900 91,711
Cost 64,731 69,883 3,573 11,406 149,593
Cumulative depreciation and impairment (17,262) (32,549) (2,565) (5,506) (57,882)
Balance at December 31, 2008 47,469 37,334 1,008 5,900 91,711
During 2009, the Bank identified no events or circumstances that would indicate that the Bank’s property and equipment may be impaired.
The Bank does not have any restrictions on title, and property, plant and equipment pledged as security for liabilities (2008: None).
During 2009, expenditures recognized in the carrying amount of an item of property, plant and equipment in the course of construction was EUR 545 (2008: None).
The Bank does not have any contractual commitments for the acquisition of property, plant and equipment.

64
Cre
dit E
urop
e Ba
nk N
V A
nnua
l Rep
ort 2
009
No
tes
to C
onso
lid
ated
Fin
anci
al S
tate
men
ts
Notes to Consolidated Financial Statements
14. Intangible assets
The book value of intangibles is as follows:
Patents Other Goodwill and licenses intangibles Total
Balance at January 1, 2009 7,481 6,169 2,046 15,696
Other additions 4,238 7,197 1,008 12,443
Disposals – (2,727) – (2,727)
Amortization – (2,200) (642) (2,842)
Currency translation differences – (114) (87) (201)
Balance at December 31, 2009 11,719 8,325 2,325 22,369
Cost 11,719 17,531 4,035 33,285
Cumulative amortization – (9,206) (1,710) (10,916)
Balance at December 31, 2009 11,7191 8,325 2,325 22,369
Balance at January 1, 2008 – 4,419 1,618 6,037
Other additions 7,481 4,279 1,440 13,200
Disposals – (180) (31) (211)
Amortization – (2,140) (539) (2,679)
Currency translation differences – (209) (442) (651)
Balance at December 31, 2008 7,481 6,169 2,046 15,696
Cost 7,481 13,172 3,113 23,766
Cumulative amortization – (7,003) (1,067) (8,070)
Balance at December 31, 2008 7,4811 6,169 2,046 15,696
1 Based on the yearly assessment, no impairment is identified on goodwill.
The Bank does not have any intangible assets whose title is restricted (2008: None).
There are no intangible assets pledged as security for liabilities (2008: None). During 2009 and 2008, there were no contractual commitments for the acquisition of intangible assets.

65
Credit Europe Bank N
V Annual Report 2009
No
tes to Con
solidated
Finan
cial Statem
ents
Notes to Consolidated Financial Statements
15. Other assets
2009 2008
Assets held for sale 1 37,142 637
Prepayments and advance payments to suppliers 15,448 38,260
Various receivables 8,821 8,870
ATM settlements 2,466 1,501
Amounts received for collection 2,436 2,178
Tax related receivables 2,416 530
Amounts held as guarantee 1,395 1,827
POS, debit card and credit card related receivables 1,089 560
Stationary and office supplies 995 2,640
Deferred merchant fees paid 510 1,382
Other assets 4,398 4,732
Total 77,116 63,117
1 ‘Assets held for sale’ represents ships and residential real estate held as collateral.
16. Due to banks
This item comprises amounts due to banking institutions:
2009 2008
Time deposits 938,752 570,935
Syndication loan 210,982 454,353
Current accounts 142,685 172,001
Other 24,766 32,136
Total 1,317,185 1,229,425
The amount of repo transactions in time deposits is EUR 122,323 (2008: None).
17. Due to customers
This item comprises amounts due to non-banking customers:
2009 2008
Consumer deposits 3,824,611 3,344,038
Saving accounts 2,388,880 2,383,992
Corporate deposits 727,627 462,014
Current accounts 282,242 611,908
Total 7,223,360 6,801,952
As of December 31, 2009, the Bank maintained customer deposit balances of EUR 152,913 (2008: EUR 276,691), which were blocked by the Bank as collateral for loans and off-balance sheet credit instruments granted by the Bank.
As of December 31, 2009, EUR 2,270,206 (2008: EUR 1,014,699) of deposits from customers are expected to be settled more than 12 months after the balance sheet date.

66
Cre
dit E
urop
e Ba
nk N
V A
nnua
l Rep
ort 2
009
18. Debt securities issued and other borrowed funds
Issued debt securities and other borrowed funds as of December 31, 2009
Principal Original Interest Opening Maturity Effective amount currency rate date date interest rate Amount
104,123 1 USD 9.00% October 21, 2009 October 25, 2012 9.15% 107,477
81,105 2 RUB 10.00% February 7, 2007 February 3, 2010 10.05% 84,212
173,539 3 USD 7.50% April 13, 2007 April 13, 2010 7.58% 20,579
92,691 4 RUB 9.00% June 24, 2008 June 28, 2011 9.23% 2,070
214,338
Issued debt securities and other borrowed funds as of December 31, 2008
Principal Original Interest Opening Maturity Effective amount currency rate date date interest rate Amount
180,884 3 USD 7.50% April 13, 2007 April 13, 2010 7.80% 132,864
114,293 4 RUB 9.00% June 24, 2008 June 28, 2011 8.90% 2,656
147 RON 8.24% Up to one year 8.24% 37
19 USD 6.00% Up to one year 6.00% 12
135,569
1 Amounting to USD 150 million participation notes listed on the London Stock Exchange. 2 Amounting to RUB 3,500 million participation notes listed on the Micex (Moscow Interbank Currency Stock Exchange).3 Amounting to USD 230 million (2008: EUR 250 million) participation notes listed on the London Stock Exchange. 4 Amounting to RUB 4,000 million participation notes listed on the Micex (Moscow Interbank Currency Stock Exchange).
The Bank did not have any defaults on principal, interest or other breaches with respect to its debt securities during 2009 and 2008.
19. Other liabilities
2009 2008
Deferred payment liability under letters of credit 1 38,604 24,887
Payables 35,915 14,085
Accrued expenses 23,223 19,537
Advances from customers 6 29,968
Other liabilities 11,378 9,233
Total 109,126 97,710
1 This liability relates to deferred payments in relation to contractual agreements as set in letters of credit provided to or received from customers.
No
tes
to C
onso
lid
ated
Fin
anci
al S
tate
men
ts
Notes to Consolidated Financial Statements

67
Credit Europe Bank N
V Annual Report 2009
20. Subordinated liabilities
Issued liabilities qualify as subordinated debt if claims by the holders are subordinated to all other current and future liabilities of, respectively, the Bank and other group companies. These liabilities qualify as capital, taking into account remaining maturities, for the purpose of determining the consolidated capital adequacy ratio for the Dutch Central Bank (De Nederlandsche Bank – DNB).
The following table analyzes the subordinated liabilities:
2009 2008
Principal Original Opening Maturity amount (millions) currency date date Amount Amount
125.8 1, 2 USD April 26, 2007 October 26, 2017 87,714 90,947
60 3 EUR September 1, 2005 September 1, 2015 60,018 60,168
21 USD September 28, 2007 September 28, 2017 14,582 14,631
20 4 USD October 30, 2008 October 30, 2018 14,011 14,609
33.7 5 USD September 30, 2008 September 30, 2018 23,429 25,193
33.7 5 USD October 2, 2008 October 2, 2018 23,736 25,531
223,490 231,079
1 The loan was converted from EUR 100 million to USD 125.8 million as of November 12, 2008.2 The interest rate is Libor plus 2.50% per annum until October 2012 and Libor plus 3.00% per annum thereafter. Early redemption is allowed in
October 2012.3 The subordinated bond is listed on the Luxembourg stock exchange. Interest will be payable quarterly in arrears. The interest rate is Euribor plus 3.00%
per annum until September 2010 and Euribor plus 3.50% per annum thereafter. Early redemption is allowed in September 2010. 4 Interest rate is Libor plus 5% per annum until October 2013 and Libor plus 5.5% per annum thereafter.5 Interest rate is Libor plus 5% per annum until October 2013 and Libor plus 5.5% per annum thereafter. The decision to convert the loans of EUR 25 million
each to USD 33.7 million was agreed as of April 2, 2009.
The Bank has not had any defaults on principal, interest or other breaches with respect to its subordinated liabilities during 2009 and 2008.
21. Capital and reserves
As of December 31, 2009, the authorized share capital is EUR 1,000 million (2008: EUR 1,000 million) and consists of EUR 1,000 million (2008: EUR 1,000 million) ordinary shares with a face value of EUR 1. The called-up and paid-in capital consists of 399.5 million (2008: 399.5 million) ordinary shares with a face value of EUR 1.
Translation reserveThe translation reserve comprises all foreign-exchange differences arising from the translation of the financial statements of foreign operations.
Hedging reserveThe hedging reserve comprises the effective portion of the cumulative net change in the fair value of the Bank’s net investments in foreign operations hedges and cash flow hedges.
Fair value reservesThe fair value reserve includes the cumulative net change in the fair value of available-for-sale investments, excluding impairment losses, until the investment is derecognized or impaired.
No
tes to Con
solidated
Finan
cial Statem
ents
Notes to Consolidated Financial Statements

68
Cre
dit E
urop
e Ba
nk N
V A
nnua
l Rep
ort 2
009
22. Securitizations
In the ordinary course of business, the Bank enters into transactions that result in the transfer of financial assets to third parties or special-purpose entities. The information below sets out the extent of such transfers to the Bank’s retained interest in transferred assets.
2009 2008
Transferred assets
Credit Europe Bank Consumer Finance SA 151,888 202,399
Total 151,888 202,399
Credit Europe Bank Consumer Finance SAThe Bank has transferred part of its Germany- and Belgium-generated retail loans and advances to Credit Europe Bank Consumer Finance SA. The Bank has retained substantially all of the credit risk associated with the transferred assets, and for that purpose, the bank consolidated Credit Europe Bank Consumer Finance SA. Transferred assets are classified under ‘loans and receivables – customers’ in the Consolidated Financial Statements.
23. Net interest income
2009 2008
Interest income from:
Loans and receivables – customers 613,629 722,456
Derivative financial instruments 307,443 268,742
Loans and receivables – banks 80,384 63,219
Financial investments 60,345 19,946
Financial assets held for trading 33,781 19,582
Cash and balances at central banks 7,867 11,399
Subtotal 1,103,449 1,105,344
Interest expense from:
Due to customers 374,626 314,105
Derivative financial instruments 316,970 225,751
Due to banks 50,741 68,489
Subordinated liabilities 10,557 14,627
Issued debt securities 9,167 28,013
Subtotal 762,061 650,985
Total 341,388 454,359
2009 2008
Net interest income from:
Loans and receivables/amortized-cost liabilities 257,057 373,527
Held-for-maturity investments 39,679 6,633
Financial assets or liabilities at fair value through profit or loss 24,222 62,002
Available-for-sale financial assets 20,430 12,197
Total 341,388 454,359
No
tes
to C
onso
lid
ated
Fin
anci
al S
tate
men
ts
Notes to Consolidated Financial Statements

69
Credit Europe Bank N
V Annual Report 2009
24. Net fee and commission income
2009 2008
Fee and commission income
Cash loans 13,616 8,751
Credit cards 10,452 9,711
Payment and transaction services fees 9,973 17,971
Letters of credit 6,394 11,622
Commission on account maintenance 7,785 8,131
Insurance-related commissions 5,044 8,350
Letters of guarantee 4,650 4,259
Foreign-exchange transactions 4,156 7,070
Cash-withdrawal fees 2,930 4,210
Commissions for fiduciary transactions 2,493 2,796
Early-redemption fees 1,855 2,121
Commission for fund transfer 1,335 1,470
Cash-depositing fees 987 1,430
Portfolio and other management fees 670 1,245
Fees from retailers 288 1,647
Other fees and commissions 5,996 7,433
Subtotal 78,624 98,217
Fee and commission expense
Commission paid to intermediaries/retailers 8,561 9,677
Credit-card fees 4,255 4,369
Payment and transaction-service expense 3,345 4,488
Insurance-related fees 3,146 4,173
Collection-operation fees 2,152 2,089
Account-maintenance fees 338 167
Documentary-service fees 310 250
Other fees and commission expenses 1,593 1,512
Subtotal 23,700 26,725
Total 54,924 71,492
No
tes to Con
solidated
Finan
cial Statem
ents
Notes to Consolidated Financial Statements

70
Cre
dit E
urop
e Ba
nk N
V A
nnua
l Rep
ort 2
009
25. Net trading income/(expense)
2009 2008
Foreign-exchange gain 2,306 34,965
Derivatives (3,942) 13,767
Securities 60,688 (31,307)
Trading loans 10,665 1,882
Total 69,717 19,307
2009 2008
Financial assets (or liabilities) at fair value through profit or loss
Held for trading 69,717 19,307
Total 69,717 19,307
26. Results from financial transactions
2009 2008
Net gain/(loss) from the disposal of available-for-sale investments 8,295 (18,814)
Net gain from the disposal of HTM (2,700) –
Total 5,595 (18,814)
Included within this line are the amounts transferred from equity to the profit and loss statement on the derecognizing of available-for-sale investments.
27. Other operating income
2009 2008
Fixed-asset valuation 1,965 93
Income related to previous year 1,091 –
Dividend received 118 177
Other income 614 2,847
Total 3,788 3,117
28. Personnel expenses
2009 2008
Wages and salaries 97,742 121,580
Social security and federal budget payments 13,969 19,923
Retirement benefit costs 4,128 7,127
Other employee costs 10,503 9,173
Total 126,342 157,803
Average number of employees
Banking activities – Netherlands 312 302
Banking activities – foreign countries 5,086 7,390
No
tes
to C
onso
lid
ated
Fin
anci
al S
tate
men
ts
Notes to Consolidated Financial Statements

71
Credit Europe Bank N
V Annual Report 2009
The retirement-benefit costs relate to EUR 4,128 (2008: EUR 7,127) for a defined-benefit plan. The bank does not have a defined-contribution program.
The assets of the schemes are held separately from those of the Bank in funds under the control of insurance companies.
29. General and administrative expenses
2009 2008
Rent and maintenance expenses 38,070 37,755
Communication and information expenses 11,305 12,174
Taxes other than income 7,789 8,540
Consultancy expenses 7,316 9,060
Stationary, office supplies and printing expenses 4,192 4,143
Information technology expenses 3,190 4,562
Advertising and marketing expenses 3,113 8,836
Travel and transport expenses 3,044 5,025
Security expenses 2,788 3,155
Insurance premiums 1,175 1,141
Other expenses 8,551 9,822
Total 90,533 104,213
30. Other operating expenses
2009 2008
Unamortized part of fixed assets taken out of use 1,464 –
Expenses related with previous financial exercises 857 700
Loss from debtors/litigation 681 –
Collection expenses 213 214
Operational lease expenses 40 40
Protocol expenses 7 211
Other 346 767
Total 3,608 1,932
31. Other impairment loss
2009 2008
Property, plant and equipment 131 4,153
Other 1,808 232
Total 1,939 4,385
32. Taxation
The NetherlandsCorporate income tax is levied at the rate of 25.5% (2008: 25.5%) on the worldwide income of resident companies, which is determined by modifying accounting income for certain exclusions and allowances for tax purposes for the year 2009. A unilateral decree for the avoidance of double taxation provides relief for resident companies from Dutch tax on income, such as foreign busi-ness profits derived through a permanent establishment abroad, if no tax treaty applies. There is an additional dividend tax of 5% computed only on the amounts of dividend distribution at the time of such payments. Under the Dutch taxation system, tax losses can be carried forward to be offset against future taxable income for nine years. Tax losses can be carried back to offset profits for up to one year. Companies must file their tax returns within six months following the close of the tax year to which they relate,
No
tes to Con
solidated
Finan
cial Statem
ents
Notes to Consolidated Financial Statements

72
Cre
dit E
urop
e Ba
nk N
V A
nnua
l Rep
ort 2
009 unless the company applies for an extension (normally an additional nine months). Tax returns are open for five years from the date
of final assessment of the tax return, during which time the tax authorities have the right to audit tax returns, and the related ac-counting records on which they are based, and may issue re-assessments based on their findings. Beginning from January 1, 2007, the Bank formed a ‘fiscal unity’ with the Group. As a result of the fiscal unity, all profits and losses of the fiscal unity members are ‘consolidated’ for tax purposes. The main advantages of a fiscal unity are that tax losses of one company can be offset against prof-its of another company and assets can be transferred to another company without recognizing income at the moment of transfer.
Russian Federation The taxation system in the Russian Federation is relatively new and is characterized by frequent changes in legislation, official pronouncements and court decisions. The applicable tax rate for current tax is 20% (2008: 24%) and deferred tax is 20% (2008: 20%). Taxes are subject to review and investigation by a number of authorities, which have the authority to impose severe fines, penalties and interest charges. A tax year remains open for review by the tax authorities during the three subsequent calendar years; however, under certain circumstances, a tax year may remain open longer. Recent events within the Russian Federation suggest that the tax authorities are taking a more assertive position in their interpretation and enforcement of tax legislation.
These circumstances may create tax risks in the Russian Federation that are substantially more significant than in other countries. Management believes that it has provided adequately for tax liabilities based on its interpretations of applicable Russian tax legisla-tion, official pronouncements and court decisions. However, the interpretations of the relevant authorities could differ and the effect on the financial position of the Bank, if the authorities were successful in enforcing their interpretations, could be significant.
Romania The applicable tax rate for current and deferred tax is 16% (2008: 16%). The Romanian Government has a number of agencies that are authorized to conduct audits (controls) of Romanian companies, as well as foreign companies doing business in Romania. These controls are similar in nature to tax audits performed by tax authorities in many countries, but may extend not only to tax matters, but to other legal and regulatory matters in which the applicable agency may be interested. When management is aware of specific circumstances where there is the probability of fine, appropriate reserves are established for such contingencies. It is likely that the Bank’s consolidated subsidiaries in Romania will continue to be subject to controls from time to time for violations and alleged violations of existing and new laws and regulations. Although the Bank’s consolidated subsidiaries in Romania can contest the allegations of violations and resulting penalties when management believes there is cause to do so, the adoption or implementation of laws or regulations in Romania could have a material effect on the Bank’s consolidated subsidiaries in Romania.
Switzerland Corporate tax in Switzerland is a combination of Canton and Federal tax. Cantonal tax is levied at the effective rate of 23.49% on the net profit of the related period and at the effective rate of 0.40302 % on the shareholders’ equity of the related period. Federal tax is levied at the rate of 8.50% on the net profit of the related period.
In addition to the cantonal and federal taxes, another ‘professional’ tax is levied at various effective rates on the average of the last two years’ gross revenue figures, rent expenses and number of employees.
Under the Swiss taxation system, tax losses can be carried forward to be offset against future taxable income for seven years. Com-panies must file their tax returns within four months following the close of the tax year to which they relate, unless the company applies for an extension. Tax returns are open for five years from the date of final assessment of the tax return, during which time the tax authorities have the right to audit tax returns, and the related accounting records on which they are based, and may issue re-assessments based on their findings.
No
tes
to C
onso
lid
ated
Fin
anci
al S
tate
men
ts
Notes to Consolidated Financial Statements

73
Credit Europe Bank N
V Annual Report 2009
Ukraine The applicable tax rate for corporate profit is 25% (2008: 25%). The tax amount defined by the company could be re-assessed by the tax authorities during the three subsequent calendar years after the date of submitting the respective tax return; however, under certain circumstances this period could be longer. Therefore, the company should keep its primary documents related to tax returns until the beginning of the tax audit, but for no less than three years.
Tax losses can be carried forward to be offset against future taxable income for the next four taxable years after the year when this loss appeared.
2009 2008
Effective tax rate of the country 25.5% 25.5%
The amount of tax losses that are available for five years for offset – –
Income tax expense recognized in the profit and loss statement
Current income tax (22,763) (25,534)
Current income tax charge (20,170) (25,650)
Adjustment in respect of current income tax of previous year (2,593) 116
Deferred income tax (4,343) (1,149)Relating to origination and reversal of temporary differences (4,343) (1,149)
The effect of change in tax rate – –
Income tax reported in profit and loss statement (27,106) (26,683)
2009 2008
Income tax expense recognized in equity
Deferred income tax (634) (2,800)
Unrealized gains on available-for-sale financial assets (1,208) (2,649)Revaluation surplus 574 (151)
Income tax reported in equity (634) (2,800)
Reconciliation of income tax
Operating profit before tax (77,637) (101,230)
Statutory tax rate 25.5% 25.5%
At statutory income tax rate of 25.5% (19,797) (25,814)
Effect of different income tax rates in other countries 853 4,279
Income not subject to tax 360 (1,497)
Expenditure not allowable for income tax purposes (9,040) (4,552)
The effect of change in tax rate – 339
Utilization of previously recognized tax losses – 684
Other 518 (122)
Income tax (27,106) (26,683)
No
tes to Con
solidated
Finan
cial Statem
ents
Notes to Consolidated Financial Statements

74
Cre
dit E
urop
e Ba
nk N
V A
nnua
l Rep
ort 2
009 Deferred income tax 2009 2008
Deferred income tax assets
Post-employment benefits – 159
Vacation pay liability and bonus accrual 21 560
Revaluation of interest-rate swap (fair value hedge) to fair value – 3,487
Provision for loan impairment 4,257 3,834
Revaluations of available-for-sale financial assets to fair value – 57
Adjustment to commission income – 2,485
Tax loss carried forward 3,503 –
Other temporary differences 170 777
Others 238 1,232
Gross deferred income tax assets 8,189 12,591
Deferred income tax liabilities
Difference between tax and reporting bases of premises and equipment and intangible assets (2,126) (3,022)
Revaluations of available-for-sale financial assets to fair value (1,023) –
Revaluations of foreign exchange contracts to fair value (51) (3,676)
Deferred gains and losses on foreign exchange contracts (36) (5,219)
General risk provision (12,283) (10,423)
Deferred commission income – (408)
Securities (4,316) –
Other (9,637) (6,199)
Gross deferred income tax liabilities (29,472) (28,947)
Net deferred income tax liability (21,283) (16,356)
Deferred tax changes recorded in the income tax expense 2009 2008
Transaction cost to be amortized – 632
Revaluations of foreign exchange contracts to fair value 3,875 (2,335)
Revaluations of financial assets to fair value (1,717) (6)
Difference in changes in depreciation rates 240 35
Employee benefits (137) 457
Commissions to be amortized (2,293) (1,243)
Loan impairment provision (7,933) (377)
Deferred tax of fiscal loss 2,730 –
Other 892 1,688
(4,343) (1,149)
As of December 31, 2009 there are no unrecognized deferred tax assets or liabilities in the profit and loss statement.
No
tes
to C
onso
lid
ated
Fin
anci
al S
tate
men
ts
Notes to Consolidated Financial Statements

75
Credit Europe Bank N
V Annual Report 2009
33. Earnings per share
The calculations for basic and diluted earnings per share are presented in the following table:
2009 2008
Profit for the year attributable to shareholders of the Parent Company 49,277 72,173
Weighted average number of ordinary shares outstanding 399,500 368,610
Diluted number of ordinary shares 399,500 368,610
Basic earnings per ordinary share 0.1233 0.1958
Fully diluted earnings per ordinary share from continuing operations 0.1233 0.1958
34. Fair value information
The Bank’s accounting policy on fair value measurements is discussed under note 3 (e).
Fair value is the amount at which a financial instrument could be exchanged in a current transaction between willing parties, other than in a forced sale or liquidation, and is best evidenced by a quoted market price.
The estimated fair values of financial instruments have been determined using available market information by the Bank, and where it exists, appropriate valuation methodologies. However, judgment is necessarily required to interpret market data and determine the estimated fair value.
The Bank measures fair values using the following hierarchy of method:Level 1:• Quoted market price in an active market for an identical instrument.Level 2:• Valuation techniques based on observable inputs. This category includes instruments valued using quoted market prices in active markets for similar instruments, quoted prices for similar instruments in markets that are considered less than active or other valuation techniques where all significant inputs are directly or indirectly observable from market data.Level 3:• Valuation techniques using significant unobservable inputs. This category includes all instruments where the valuation technique uses inputs based on unobservable data, which could have a significant effect on the instrument’s valuation. This category includes instruments that are valued based on quoted prices for similar instruments where significant, unobservable adjustments or assumptions are required to reflect differences between instruments.
No
tes to Con
solidated
Finan
cial Statem
ents
Notes to Consolidated Financial Statements

76
Cre
dit E
urop
e Ba
nk N
V A
nnua
l Rep
ort 2
009 The following table compares the carrying amount of financial assets and liabilities measured at cost to estimated fair values:
2009
Note Pages Level 1 Level 2 Level 3 Total
Financial assets
Trading assets 6 55 995,730 – – 995,730
Derivative assets held for risk management 11 61 14,636 187,630 – 202,266
Investment securities 7 56 607,294 44,394 – 651,688
Total 1,617,660 232,024 – 1,849,684
Financial liabilities
Derivative assets held for risk management 11 61 15,270 183,355 – 198,625
Issued debt securities and other funds borrowed 18 66 – 214,338 – 214,338
Total 15,270 397,693 – 412,963
No securities were transferred from Level 1 to Level 2 of the fair-value hierarchy in 2009.
35. Commitments and contingencies
To meet the financial needs of customers, the Bank issues various irrevocable commitments and contingent liabilities. Even though these obligations may not be recognized on the balance sheet, they do contain credit risk and are, therefore, part of the overall risk of the Bank. In many instances, the amount recognized on the balance sheet for incurred obligations does not represent the loss potential of the arrangement in full.
Letters of credit, guarantees and acceptances commit the Bank to make payments on behalf of customers, contingent on the failure of the customer to perform under the terms of the contract. Guarantees carry the same credit risk as loans. Credit guarantees can be in the form of bills of exchange, irrevocable letters of credit, advance payment guarantees, or endorsement liabilities from bills rediscounted.
Commitments to extend credit represent contractual commitments to make loans and revolving credits. Commitments gener-ally have fixed expiration dates, or other termination clauses. Since commitments may expire without being drawn upon, the total contract amounts do not necessarily represent future cash requirements. With respect to credit risk on commitments to extend the credit, the Bank is potentially exposed to loss in an amount equal to the total unused commitments.
However, the likely amount of loss is less than the total unused commitments since most commitments to extend credit are con-tingent upon customers maintaining specific standards. The Bank monitors the term to maturity of credit commitments because longer-term commitments generally have a greater degree of credit risk than shorter-term commitments.
No
tes
to C
onso
lid
ated
Fin
anci
al S
tate
men
ts
Notes to Consolidated Financial Statements

77
Credit Europe Bank N
V Annual Report 2009
2009 2008
Contingent liabilities with respect to letters of guarantee granted – non-banks 191,105 248,833
Contingent liabilities with respect to irrevocable letters of credit – import 118,481 162,978
Contingent liabilities with respect to letters of guarantee granted – banks 25,693 21,830
Contingent liabilities with respect to irrevocable letters of credit – export 35,378 28,580
Contingent liabilities with respect to acceptance credits 1,847 12,713
Contingent liabilities with respect other guarantees 1,188 1,550
Total non-cash loans 373,692 476,484
Credit-card limits 98,259 112,192
Credit-line commitments 266,836 828,426
Total 738,787 1,417,102
Litigation claimsLitigation is a common occurrence in the banking industry due to the nature of the business. The Bank has an established protocol for dealing with such legal claims. Once professional advice has been obtained and the amount of damages reasonably estimated, the Bank makes adjustments to account for any adverse effects the claims might have on its financial standing. At year-end, the Bank’s management is unaware of any significant actual, pending or threatened claims against the Bank.
Lease commitmentsThe group leases a number of buildings and cars under operating leases. Non-cancelable operating lease rentals are payable as follows:
Operating lease commitment – bank as lessee and rent commitments 2009 2008
Not later than 1 year 11,679 15,450
Later than 1 year and not later than 5 years 24,403 29,890
Later than 5 years 3,232 5,070
Total 39,314 50,410
36. Related parties
The Bank’s ultimate parent company is Fiba Holding AS, a Turkish joint-stock company ultimately controlled by a single individual, Mr Hüsnü Özyeğin. All amounts stated in the table below relate to Group companies controlled by Mr Hüsnü Özyeğin.
Parties are considered related if one party has the ability to control the other party or exercise significant influence over the other party in financial and operating decisions. The Bank enters into transactions with its parent company and other subsidiaries of the Bank’s ultimate parent company, directors and senior management in the ordinary course of business at commercial interest and commission rates. All loans and advances to related parties are performing advances, and are free of any provision for possible credit losses.
No
tes to Con
solidated
Finan
cial Statem
ents
Notes to Consolidated Financial Statements

78
Cre
dit E
urop
e Ba
nk N
V A
nnua
l Rep
ort 2
009 The year-end balances in respect of related parties included in the Consolidated Financial Statements are as follows:
2009 2008
Parent Other related Parent Other related
Company parties 1 Company parties 1
Assets
Loans and receivables – customers 4,011 120,757 7,116 200,228
Derivative financial instruments – 160 – 16
Liabilities
Due to customers 5,852 170,008 149 267,340
Derivative financial instruments – 3,204 – –
Other liabilities – 74 – 7,588
Subordinated liabilities 87,715 75,758 90,947 39,938
Commitment and contingencies – 3,240 – 5,288
1 Related parties that are not consolidated in the financial statements.
The Bank does not have any provisions regarding related party balances as of December 31, 2009 (2008: None)
The income and expenses in respect of related parties included in the Consolidated Financial Statements are as follows:
2009 2008
Parent Other related Parent Other related
Company parties 1 Company parties 1
Interest income 256 87,777 – 28,811
Interest expense (3,189) (87,994) (1,086) (68,809)
Commission income 261 2,129 369 6,848
Commission expense – – – (312)
Net trading income (1,802) (21,456) – 381
Other operating income – – – (432)
General and administrative expenses – – – (369)
Other operating expenses – – – (4)
1 Related parties that are not consolidated in the financial statements.
Key management personnel and their immediate relatives have transacted with the Bank during the period, as follows:
2009 2008
Mortgage lending and other secured loans 1,189 827
Credit cards 731 42
Other loans 17,039 11,220
No
tes
to C
onso
lid
ated
Fin
anci
al S
tate
men
ts
Notes to Consolidated Financial Statements

79
Credit Europe Bank N
V Annual Report 2009
The Bank does not have any provisions regarding the balances with key management personnel as of December 31, 2009 (2008: None).
Key management costs, including remuneration and fees for the year ended December 31, 2009, amounted to EUR 2,914 (2008: EUR 2,525). Pension plan contributions amounted to EUR 117 (2008: EUR 88). Key management is defined as those persons in the consolidated Supervisory and Managing Boards.
The number of key management personnel is 12 (2008: 11).
37. Intra-group balances
Intra-group balances that are eliminated during consolidation process:
2009 2008
Assets
Financial assets designated at fair value through profit or loss 94,140 42,717
Financial investments 138,736 99,160
Loans and receivables – banks 1,412,557 1,718,450
Loans and receivables – customers 357,169 850,989
Derivative financial instruments 21,803 61,778
Other assets 23,325 20,711
Liabilities
Due to banks 1,587,337 2,345,181
Due to customers 37,539 24,821
Derivative financial instruments 21,803 61,778
Issued debt securities 377,727 349,966
Other liabilities 23,325 12,059
Commitments and contingencies 54,909 2,184
Interest income 221,147 134,114
Interest expense (221,147) (134,114)
Commission income 2,651 835
Commission expense (2,651) (835)
38. Risk management
In 2009, the Bank further strengthened its group risk-management function with additional expertise and clearer reporting lines, which have enabled centralized measuring, monitoring and controlling of risks at the Bank and at other organizational levels. The division has sub-functions, including Credit Risk and Capital Management, and Market Risk and Treasury Risk Control. Operational Risk Management is handled by the Corporate Information Security Division.
Risk consolidation is conducted by the Group Risk Management Division (GRMD), which is responsible for measuring and monitoring risks at the consolidated level. GRMD operates under the supervision of the Chief Credit and Risk Officer (CCRO) and the CFO, who are members of the Group Risk Management Committee (GRMC). The CCRO is responsible for handling the credit-, operational- and legal-risk framework. This includes approving and implementing related policies and procedures at Bank level, controlling the credit-decision process and monitoring rating models. Market and liquidity risks and capital-planning processes, including capital-adequacy reporting, are the responsibilities of the CFO.
No
tes to Con
solidated
Finan
cial Statem
ents
Notes to Consolidated Financial Statements

80
Cre
dit E
urop
e Ba
nk N
V A
nnua
l Rep
ort 2
009 Consolidated credit-risk reports are conducted on a monthly basis and contain detailed analyses of the portfolio structure, asset
impairments and concentration risks. Consolidated market-risk and liquidity-gap reports are prepared on a monthly basis. VaR and liquidity positions are reported to the Managing Board daily.
Risk strategyDuring its 15 years of operations, the Bank has created an important and valuable franchise with sustainable growth, low leverage and a strict adherence to pure lending activities. Currently, the Bank has a presence in 11 countries, with over 200 branches and three million customers. With the Dutch Central Bank (De Nederlandsche Bank – DNB) as consolidating supervisor, the Bank has established a sound risk-management and compliance framework in accordance with DNB supervision guidelines not only in the Netherlands, but also in all countries where the Bank is present.
The Bank annually rolls over its business plan and risk strategy for the next three years, albeit with a far longer-term vision in mind. However, there have been no material changes in the Bank’s risk strategy in 2009, apart from the calculated increase in risk appe-tite towards trading income. The Bank continued to extend its profound expertise in cross-border banking, with a special emphasis on diversified local operations and centralized oversight. This risk strategy proved itself by providing consistently strong financial results and yielding firm returns on equity.
Capital managementIn its pursuit to maximize shareholder value, the Bank operates with an optimum level, and mix, of capital resources, and adopts a centralized regulatory/internal capital-management model. Decisions on the allocation of capital resources, conducted as part of the risk-strategy review, are based on returns on regulatory capital and a number of other factors.
The Bank’s capital-management objectives are to:Maintain sufficient capital resources to meet the DNB’s minimum regulatory capital requirements.•Ensure that locally regulated subsidiaries can meet their minimum capital requirements.•Achieve adequate capital levels to support the Bank’s risk appetite and internal capital requirements.•Maintain a strong capital base to reassure investors, creditors and markets, and to sustain future business development. •
To support its capital-management objectives, the Bank takes into account:Possible volatility in anticipated demand for capital caused by new business opportunities, including acquisitions, or by deteriora-•tion in the credit quality of the Bank’s assets.Possible volatility of reported profits and other capital resources compared with forecast.•Capital ratio sensitivity to foreign-exchange-rate movements.•
Solvency supervisionThe Bank and all its subsidiaries are regulated by DNB, which consequently acts as the home regulator for Basel II compliance.
BIS has improved and modified the set of rules regarding solvency requirements, set out in the 1988 Basel Capital Accord, aiming to promote a more forward-looking approach to capital management.
The Basel II framework provides more sophisticated and risk-sensitive approaches for assessing the risks. In addition, capital requirements for operational risks are being introduced for the first time.
No
tes
to C
onso
lid
ated
Fin
anci
al S
tate
men
ts
Notes to Consolidated Financial Statements

81
Credit Europe Bank N
V Annual Report 2009
Overview of approaches proposed by Basel II Accord for Capital Calculation:
Credit risk Market risk Operational risk
Standardized approach Standardized approach Basic-indicator approach
Foundation internal-rating-based approach Internal-models approach Standardized approach
Advanced internal-rating-based approach – Advanced measurement approach
Per January 1, 2008, the Bank applies the standardized approach for credit and market risks, and the basic-indicator approach for operational risk. Banks are expected to meet the capital-requirements constraints imposed by the Basel II accord. These are a minimum capital ratio of 8%, which is a ratio of total own funds to total risk-weighted assets (RWA), and minimum Tier I ratio of 4% (a ratio of Tier I capital to total RWA).
The Bank’s total own funds consist of Tier I capital (also referred as ‘core capital’) and Tier II capital (or ‘supplementary capital’). The various elements making up both components are presented in the table below: Composition of total own funds 2009 2008
Tier I capital
– paid-up share capital 399,500 399,500
– share premium 163,748 162,321
– eligible reserves (including retained earnings) 5,546 20,030
– fair value reserves 1 (219) (2,352)
– minority interests 17,608 22,983
– income from current year 49,277 72,173
Deductions from Tier I capital 2 (12,975) (8,543)
Total Tier I capital 622,485 666,112
Tier II capital
– subordinated capital 223,490 231,079
– revaluation reserves 4,728 4,207
Deductions from Tier II capital 2 (1,246) (1,050)
Total Tier II capital 226,972 234,236
Total own funds 849,457 900,348
1 Fair value reserves have been adjusted for the fair value of interest-bearing instruments that should not be included in total own funds in any manner, as
laid down in the Dutch ‘Financial Supervision Act’.2 Deductions from total own funds includes goodwill and other solvency-deductible intangible assets, as well as participations held in insurance and other
entities, which are not subject to banking supervision.
The terms and conditions of the main features included in the Bank’s total own funds can be found in notes 20 and 21.
The Bank and its individually supervised subsidiaries have complied with all externally imposed capital requirements throughout the reporting period and maintained their capital ratios well above the regulatory minimum ratios.
No
tes to Con
solidated
Finan
cial Statem
ents
Notes to Consolidated Financial Statements

82
Cre
dit E
urop
e Ba
nk N
V A
nnua
l Rep
ort 2
009 Solvency ratio 2009 2008
Capital ratio 12.57% 12.41%
Tier I ratio 9.21% 9.18%
The DNB also sets capital requirements in excess of the minimum Basel II requirements (measured as 8.00% of total risk-weighted assets). A key input to this process is the Bank’s Internal Capital Adequacy Assessment Process (ICAAP). The Bank submitted its ICAAP document to the DNB in January 2009.
Credit riskCredit risk is defined as the current or prospective threat to the Bank’s earnings and capital as a result of a counterparty’s failure to comply with financial or other contractual obligations.
Credit risk constitutes the most significant risk of the Bank and arises mainly from its trade-finance, lending, treasury, mortgage and leasing businesses.
Credit risk is managed by following tools and principles:
Risk mitigationCorporate credit risk is subject to capital allocation and risk limits for mitigation purposes. These limits start at the borrower limit and evolve into portfolio-level concentration limits. The Bank actively uses collateral management as a risk-management and mitigation tool. Credit limits are extended as secured and unsecured. Secured lines are against cash and equivalent types of collateral while unsecured lines are against all other types of collateral, including all mortgages, equipment, personal guarantees and leased assets that are specifically stated on the credit-approval form. Secured collaterals are managed and followed up in processes fully supported by the Bank’s corporate system by means of collateral-transaction linkages, blocked accounts and system checking of collateralization. The Transactions and Collateral Management Department is organized as a separate department for collateral management for all types of lending. Transactional lending is especially run through on collaterals and documentation. Valuation reports, survey report updates and insurance-policy management are followed up systematically. Mainly related to trade finance, outsourcing is also utilized by Collateral Management Agreements and Collateral Monitoring Agreements with expert collateral-management agents who have the management and reporting capabilities on the site of the collateral. As a principle, the value of the collateral should not have a material positive correlation with the credit quality of the provider for the risk-mitigation effect to be considered.
Concentration limitsThe Bank has established maximum concentration limits covering country and single-name concentration to manage concentration risk in its loan portfolio. In addition, the Bank ensures that single-name concentrations (including top 10 and 20) are under certain thresholds with respect to Tier 1 equity.
Credit ratingsIn 2009, the Bank introduced its new 12-grade corporate rating scale across the Bank. Enhancements made in 2009 regarding the internal rating systems can be seen as a milestone in the Bank’s ongoing improvements to its credit-risk-management capabilities. However, a limited credit history imposed a big challenge for quantification and validation of risk parameters to date; continuing efforts and dedication in 2010 will enable the Bank to make more robust estimations of the risk parameters and to take a big step towards its destination of a full economic-capital model. During this journey, transition to the Internal Ratings-Based Approach will likely be a natural place for regulatory and economic-capital requirements to converge.
Stress testingThe Bank puts stress testing and capital planning at the centre of its internal capital-assessment process. These tools help the Bank identify potential threats to its business plan and capital adequacy. The Bank’s stress-testing methodology discourages both under-and over-reliance on internal data. Creating scenarios based on hypothetical assumptions are more appropriate because scenarios based solely on internal data may fail to capture tail-loss events and systematic-risk factors. The fact that Bank has a limited credit-data history supports this approach. Internal data is used to define the current risk characteristics of the portfolio.
No
tes
to C
onso
lid
ated
Fin
anci
al S
tate
men
ts
Notes to Consolidated Financial Statements

83
Credit Europe Bank N
V Annual Report 2009
The Bank’s credit-risk stress tests shock both default-and recovery-related risk parameters. Moreover, risk concentrations in the portfolio are more harshly shocked, even without a relevant negative outlook. The Bank’s stress-testing methodology does not aim to make accurate forecasts of the downturns, but instead aims to capture the tail loss by simulating the unexpected and the unde-sirable. From this point of view, the Bank’s stress-testing approach is more closely aligned with hypothetical than historical data.
38.a. Credit exposure
Maximum credit-risk exposure The Bank identifies its maximum credit exposure as the sum of all transactions that may potentially expose the Bank to credit losses, should the counterparty not fulfill its contractual obligations. The maximum credit exposure presented in the table below comprises on- and off-balance sheet items. Credit exposure is measured without taking account of any collateral held or other credit enhancements.
Maximum credit-risk exposure, net of impairment allowancesOn-balance sheet items are presented at their carrying amount, net of impairment allowances. Derivative financial instruments are assessed at fair value of future cash flows.
The off-balance credit risk exposure comprises:letters of guarantee granted and letters of credit issued or confirmed, shown at the maximum amount that the Bank would have •to pay if the guarantees or letters of credit are called upon; and,undrawn credit-card limits and other credit commitments and contingent liability. The maximum exposure for these items is the •full unused portion of the committed facilities.
2009 2008
Balance sheet items
Balances with central banks 1,558,207 1,915,832
Financial assets designated at fair value through profit or loss 995,730 251,608
Financial investments 1,117,840 386,720
Loans and receivables – banks 615,514 952,932
Loans and receivables – customers 5,218,687 5,369,721
Derivative financial instruments 202,266 425,074
Total balance sheet 9,708,244 9,301,887
Off-balance sheet items
Issued letters of guarantee 217,986 272,213
Issued irrevocable letters of credit 155,706 204,271
Undrawn credit-card limits 98,259 112,192
Other credit commitments and contingent liabilities 266,836 828,426
Total off-balance sheet 738,787 1,417,102
Maximum credit risk exposure 10,447,031 10,718,989
The Bank considers items such as ‘other credit commitments and contingent liabilities’ as a part of its maximum credit risk expo-sure. However, these are not included in tables below since they are composed of credit facilities that are either revocable or can be cancelled unconditionally by the Bank, and therefore bear insignificant credit risk.
No
tes to Con
solidated
Finan
cial Statem
ents
Notes to Consolidated Financial Statements

84
Cre
dit E
urop
e Ba
nk N
V A
nnua
l Rep
ort 2
009 Concentration of credit exposure
Concentration risk normally arises when a number of counterparties operates in the same geographical region or within the same economic sector, and thus are affected by the same economic, political and other conditions.
38.b. Sector concentrationThe Bank monitors its credit exposure within the following counterparty groups: corporate customers, banks and central govern-ments, retail customers, SME customers, and residential mortgage loans. Exposure to corporate customers is presented, broken down by industry, according to the internal sector definitions.
2009 2008
On-balance Off-balance Total % of total Total % of total sheet sheet 1 exposure exposure exposure 1 exposure
Exposure to central governments
and financial institutions
Exposure to central governments
and central banks 2,805,863 – 2,805,863 65.39% 2,084,881 54.99%
Exposure to financial institutions 1,435,428 49,351 1,484,779 34.61% 1,706,331 45.01%
Total exposure to central govern-
ments and financial institutions 4,241,291 49,351 4,290,642 100.00% 3,791,212 100.00%
Corporate exposure
Shipping & shipyards 438,020 29,975 467,995 12.34% 483,569 12.87%
Real estate 445,132 17,591 462,723 12.20% 422,215 11.23%
Iron & steel 408,723 51,453 460,176 12.13% 388,400 10.33%
Construction & installation 248,966 75,106 324,072 8.54% 460,380 12.25%
Tourism 250,467 8,884 259,351 6.84% 220,416 5.86%
Energy/coal 158,752 29,835 188,587 4.97% 93,781 2.50%
Petrochemical, plasticizers & derivatives 138,825 33,625 172,450 4.55% 204,152 5.43%
Retail 138,429 14,104 152,533 4.02% 204,041 5.43%
Services 130,053 473 130,526 3.44% 42,761 1.14%
Automotive & derivatives 113,787 4,927 118,714 3.13% 111,565 2.97%
Holding 115,699 – 115,699 3.05% 48,893 1.30%
Textiles, clothing & ready-to-wear 103,814 5,921 109,735 2.89% 67,850 1.81%
Financial services & investments 83,564 3,688 87,252 2.30% 139,914 3.72%
Transportation & logistics 73,674 2,057 75,731 2.00% 94,944 2.53%
Oil & derivatives 54,942 19,559 74,501 1.96% 27,766 0.74%
Food, beverage & tobacco 71,771 2,386 74,157 1.96% 104,030 2.77%
Soft commodities & agricultural products 51,193 1,371 52,564 1.39% 29,422 0.78%
Paper & pulp 39,312 2,586 41,898 1.10% 23,011 0.61%
Machinery – office & optical equipment 39,192 408 39,600 1.04% 28,205 0.75%
Leasing 37,354 – 37,354 0.98% 132,407 3.52%
Electronic equipment 26,887 – 26,887 0.71% 27,459 0.73%
Telecommunications 23,833 448 24,281 0.64% 22,560 0.60%
Media & publishing 23,854 262 24,116 0.64% 40,071 1.07%
Factoring 14,157 – 14,157 0.37% 43,568 1.16%
International trade 9,309 3,013 12,322 0.32% 20,297 0.54%
Fertilizers 5,170 1,812 6,982 0.18% 24,406 0.65%
Other 227,501 11,302 238,803 6.31% 252,232 6.71%
Total exposure to corporate
clients and private banking 3,472,380 320,786 3,793,166 100.00% 3,758,315 100.00%
No
tes
to C
onso
lid
ated
Fin
anci
al S
tate
men
ts
Notes to Consolidated Financial Statements

85
Credit Europe Bank N
V Annual Report 2009
Exposure to retail customers
and SMEs
Exposure to retail customers 1,090,490 98,259 1,188,749 56.70% 1,358,541 58.03%
Exposure secured by residential
real estate 636,025 – 636,025 30.34% 640,047 27.34%
Exposure to SME 268,058 3,555 271,613 12.96% 342,448 14.63%
Total exposure to retail customers
and SMEs 1,994,573 101,814 2,096,387 100.00% 2,341,036 100.00%
Total credit risk exposure 9,708,244 471,951 10,180,195 100.00% 9,890,563 100.00%
1 Excluding other credit commitments and contingent liabilities.
93.45% (2008: 94.50%) of corporate exposure is composed of loans and receivables to corporate customers. The rest is distri buted between debt instruments issued by corporate clients and derivative instruments held for trading. The top five industries account for 52.05% (2008: 52.54%) of the total corporate portfolio, reflecting the traditional business areas of the Bank where it possesses strong expertise and profound industry practice.
No
tes to Con
solidated
Finan
cial Statem
ents
Notes to Consolidated Financial Statements

86
Cre
dit E
urop
e Ba
nk N
V A
nnua
l Rep
ort 2
009 38.c. Geographical concentration
The following table provides the distribution of the Bank’s credit exposure by risk country, as of December 31, 2009:
2009
Other
emerging Developed
Russia Romania Turkey Ukranie markets markets Total
Balance sheet items
Demand deposits with central banks 13,448 126,103 – 5,136 – 1,413,520 1,558,207
Financial assets designated at fair
value through profit or loss 11,983 528 9,484 – 10,307 963,428 995,730
Financial investments 392,640 188,342 87,833 34,438 92,580 322,007 1,117,840
Loans and receivables – banks 24,804 48,335 82,157 13,203 12,152 434,863 615,514
Loans and receivables – customers 1,238,842 1,507,659 1,371,863 101,719 85,447 913,157 5,218,687
Derivative financial instruments 256 1,357 65,187 – 24 135,442 202,266
Total balance sheet 1,681,973 1,872,324 1,616,524 154,496 200,510 4,182,417 9,708,244
Off-balance sheet items 1 71,578 108,176 110,479 7,566 27,567 146,585 471,951
Total credit-risk exposure 1,753,551 1,980,500 1,727,003 162,062 228,077 4,329,002 10,180,195
1 Excluding other credit commitments and contingent liabilities.
The following table provides the distribution of the Bank’s credit exposure by risk country as of December 31, 2008: 2008
Other
emerging Developed Total
Russia Romania Turkey Ukraine markets markets exposure
Balance sheet items
Demand deposits with central banks 157,227 221,958 – 7,304 – 1,529,343 1,915,832
Financial assets designated at
fair value through profit or loss 26,796 5,188 34,858 4,691 16,448 163,627 251,608
Financial investments 179,759 26,084 92,383 43,885 6,427 38,182 386,720
Loans and receivables – banks 86,820 11,309 104,733 95,144 69,719 585,207 952,932
Loans and receivables – customers 1,339,975 1,748,876 1,137,212 140,275 106,291 897,092 5,369,721
Derivative financial instruments 30,395 17,453 72,735 – 4,706 299,785 425,074
Total balance sheet 1,820,972 2,030,868 1,441,921 291,299 203,591 3,513,236 9,301,887
Off-balance sheet items 1 92,780 165,723 208,454 54,065 24,242 43,412 588,676
Total credit-risk exposure 1,913,752 2,196,591 1,650,375 345,364 227,833 3,556,648 9,890,563
1 Excluding other credit commitments and contingent liabilities.
38.d. Collaterals and other credit enhancements obtainedThe Bank’s credit policy requires that the loan-extension process is conducted with strong evidence of the customer’s ability to repay the loan. Collaterals are also actively used for the purposes of credit-risk mitigation.
No
tes
to C
onso
lid
ated
Fin
anci
al S
tate
men
ts
Notes to Consolidated Financial Statements

87
Credit Europe Bank N
V Annual Report 2009
In the tables below, collaterals are aggregated into two groups:Financial collaterals, which includes any kind of documentary collateral, such as bills of exchange or trade-related promissory •
notes. Cash collaterals, credit derivatives and other guarantees are also part of this group.Physical collaterals comprise other collaterals not mentioned under ‘financial collaterals’.•
Although the Bank accepts personal and corporate guarantees as collateral, they are not included in the tables below, due to their limited credit-risk-mitigation ability.
Breakdown of collateralized exposure by collateral type 2009 Total Fair value of Fair value of Total Collaterals to exposure, financial of physical collaterals total net net collaterals collaterals obtained exposure
Balance sheet
Demand deposits with central banks 1,558,207 – – – 0%
Financial assets designated at fair value through profit or loss 995,730 – – – 0%
Financial investments 1,117,840 – – – 0%
Loans and receivables – banks 615,514 128,349 – 128,349 21%
Loans and receivables – customers 5,218,687 1,045,600 2,676,806 3,722,406 71%
Derivative financial instruments 202,266 23,356 – 23,356 12%
Total balance sheet 9,708,244 1,197,305 2,676,806 3,874,111 40%
Off-balance sheet 1 471,951 109,864 111,430 221,294 47%
Total credit risk exposure 10,180,195 1,307,169 2,788,236 4,095,405 40%
1 Excluding other credit commitments and contingent liabilities.
Breakdown of collateralized exposure by collateral type 2008 Total Fair value of Fair value of Total Collaterals to exposure, financial of physical collaterals total net net collaterals collaterals obtained exposure
Balance sheet
Demand deposits with central banks 1,915,832 – – – 0%
Financial assets designated at fair value through profit or loss 251,608 – – – 0%
Financial investments 386,720 – – – 0%
Loans and receivables – banks 952,932 – – – 0%
Loans and receivables – customers 5,369,721 1,189,163 2,832,473 4,021,636 75%
Derivative financial instruments 425,074 46,201 – 46,201 11%
Total balance sheet 9,301,887 1,235,364 2,832,473 4,067,837 44%
Off-balance sheet 1 588,676 82,740 118,051 200,791 34%
Total credit risk exposure 9,890,563 1,318,104 2,950,524 4,268,628 43%
1 Excluding other credit commitments and contingent liabilities.
In general, the Bank obtains collaterals to secure its loan portfolio. Collaterals for derivative financial instruments consist mostly of the margin called by the Bank for its OTC-derivative assets.
As of December 31, 2009, the Bank did not hold any assets that it is permitted to sell or re-pledge in the absence of default by the owner of the collateral (2008: None).
No
tes to Con
solidated
Finan
cial Statem
ents
Notes to Consolidated Financial Statements

88
Cre
dit E
urop
e Ba
nk N
V A
nnua
l Rep
ort 2
009 38.e. Credit quality of financial assets
The following table presents the credit quality of the Bank’s financial assets, as of December 31, 2009. In assessing the credit quality of its financial assets, the Bank obtains ratings from eligible credit assessment institutions, namely Fitch, Standard & Poor’s (S&P) and Moody’s. In order to compare assets, the ratings below were mapped to Fitch’s rating scale.
2009
External rating class
AAA/AA- A+/A- BBB+/BBB- BB+/B- Below B- No rating Total
Demand deposits with central banks 1,413,520 – 13,447 131,240 – – 1,558,207
Financial assets designated at fair
value through profit or loss 920,390 45,167 19,085 10,522 38 528 995,730
Financial investments 147,378 188,424 398,834 189,532 2,353 191,319 1,117,840
Loans and receivables – banks 146,188 239,297 61,810 96,200 15,942 56,077 615,514
Derivative financial instruments 72,611 47,138 164 30,570 – 51,783 202,266
Off-balance sheet 1 5,738 4,508 12,759 22,578 – 426,368 471,951
Total 2,705,825 524,534 506,099 480,642 18,333 726,075 4,961,508
1 Excluding other credit commitments and contingent liabilities.
The following table presents the credit quality of the Bank’s financial assets, as of December 2008.
2008
External rating class
AAA/AA- A+/A- BBB+/BBB- BB+/B- Below B- No rating Total
Demand deposits with central banks 1,523,166 6,177 157,227 7,304 – 221,958 1,915,832
Financial assets designated at fair
value through profit or loss 90,038 78,030 8,741 61,746 152 12,901 251,608
Financial investments 6,053 13,367 115,273 152,374 2,280 97,373 386,720
Loans and receivables – banks 490,369 74,582 57,372 267,485 – 63,124 952,932
Derivative financial instruments 98,965 158,117 38,905 711 – 128,376 425,074
Off-balance sheet 1 1,100 22,922 16,142 15,264 1,796 531,452 588,676
Total 2,209,691 353,195 393,660 504,884 4,228 1,055,184 4,520,842 1 Excluding other credit commitments and contingent liabilities.
The assets in the tables above are allocated through the rating bucket following the principles imposed by the Basel II accord. Where multiple credit assessments are available, a ‘second worst’ is taken into account.
As follows from the tables above, 75.31% (2008: 65.40%) of the Bank’s financial assets falls in the investment-grade category. The Bank includes assets with a credit assessment equal to BBB- or above in terms of Fitch rating scale in the investment-grade category.
The total amount of impaired assets included in the tables above is EUR 40,712 (2008: EUR 6,014). The total amount of provisions allocated for these assets is EUR 18,803 (2008: EUR 6,014), while EUR 15,566 is allocated for loans to banks (2008: EUR 5,001) and EUR 3,237 for securities (2008: EUR 1,013). Impaired assets are concentrated in the categories ‘Below B-’ and ‘No rating’.
No
tes
to C
onso
lid
ated
Fin
anci
al S
tate
men
ts
Notes to Consolidated Financial Statements

89
Credit Europe Bank N
V Annual Report 2009
Loans and receivables – customersThe next section provides a detailed overview of the credit quality of the Bank’s loans and advances portfolio. In 2009, the Bank adjusted its Loan Assessment and Impairment Policy to align its definitions to the industry practices and regulatory requirements. The Bank believes that the new classification of ‘loan portfolio’, which is based on the respective recovery capabilities and debtors’ creditworthiness levels, provides a more detailed and transparent overview of the portfolio’s credit quality.
According to the new policy, the bank differentiates between the following categories of assets in the loan portfolio:Standard (performing) loans covers corporate (retail/SME) loans on which payments are made according to the contractual •terms, repayment problems are not expected in the future and which are totally recoverable (collectable).Watch List (sub-standard loans) is for corporate loans where problems with principal or interest payments are not necessarily •present yet, but which require close monitoring due to negative trends in the debtors’ payment capability or cash-flow positions, for instance. Corporate loans experiencing delays of contractual payments of less than 90 days or credit-quality deterioration in terms of internal rating. Non-Performing Loans (NPL) includes loans and receivables with limited (doubtful) recovery prospects. These clients:•
– have limited means for total recovery because their repayment capacity is inadequate to cover payments on respective terms; they are likely to lead to losses if these problems are not solved; or,– are in a situation where full or partial recovery prospects are fully dependent on the outcome of the liquidation of the underlying assets or recourse to the guarantor; or,– have suffered significant credit quality deterioration; or,– have delayed the capital and/or interest payments for more than 90 days as of the day of their payment date.
Delinquent Loans are retail loans (including SME loans and the residential-mortgage portfolio) with a delay in contractual •payment of no more than 90 days (also shown on Watch List).
Impairment allowancesThe Bank aims to maintain sufficient reserves to cover its incurred losses. According to its policy, the Bank differentiates between:
Provisions for individually assessed assets.•Provisions for collectively assessed assets.•
All Watch List and NPL customers are analyzed individually, regardless of size. Standard (performing) loans are subject to individual assessment only if they are deemed ‘significant’. The ‘significance criterion’ is established at group level, and amounts to EUR 1 million. In terms of individual assessment, the trigger point for impairment is formal classification of an account as exhibiting serious financial problems and where any further deterioration is likely to lead to failure. Two key inputs to the cash-flow calculation are the valuation of all security and collateral and the timing of all asset realizations.
Retail exposure is solely subject to collective assessment, regardless of exposure size.
The Bank calculates collective impairment allowances for retail portfolios using the dynamic statistical model, based on analysis of the portfolio’s default and recovery rates according to historical data. The same approach is implemented across the Bank’s entities, with adjustment for specific local conditions. The methodology was first implemented in 2008 and remained unchanged in 2009.
No
tes to Con
solidated
Finan
cial Statem
ents
Notes to Consolidated Financial Statements

90
Cre
dit E
urop
e Ba
nk N
V A
nnua
l Rep
ort 2
009 38.f. Credit quality of loans and advances to customers
The following tables provide a breakdown of the Bank’s loans and advances to customers per credit-quality group defined above. It also shows the allocation of provisions and collaterals obtained per group.
2009
Provisions Provisions
for for
individually collectively Collateral
Gross assesed assesed Net Financial Physical Total to total
loans assets (-) assets (-) loans collateral collateral collateral loans
Corporate loans 3,291,631 (43,542) (23,975) 3,224,114 730,905 1,554,262 2,285,167 71%
Standard loans 3,092,338 (562) (12,620) 3,079,156 728,623 1,455,695 2,184,318 71%
Watch List 121,507 (19,091) (11,355) 91,061 1,147 66,599 67,746 74%
NPL 77,786 (23,889) – 53,897 1,135 31,968 33,103 61%
Retail loans (incl. mortgages) 1,822,456 (901) (95,040) 1,726,515 313,013 905,193 1,218,206 71%
Performing loans 1,532,296 – (7,761) 1,524,535 265,157 772,831 1,037,988 68%
Watch List 157,342 – (12,101) 145,241 29,427 74,529 103,956 72%
NPL 132,818 (901) (75,178) 56,739 18,429 57,833 76,262 134%
SME loans 294,369 (13,397) (12,914) 268,058 1,682 217,351 219,033 82%
Performing loans 189,316 – (795) 188,521 1,387 134,361 135,748 72%
Watch List 64,664 (432) (1,883) 62,349 295 58,820 59,115 95%
NPL 40,389 (12,965) (10,236) 17,188 – 24,170 24,170 141%
Total exposure 5,408,456 (57,840) (131,929) 5,218,687 1,045,600 2,676,806 3,722,406 71%
Total NPL 250,993 (37,755) (85,414) 127,824 19,564 113,971 133,535 104%
2008
Provisions Provisions
for for
individually collectively Collateral
Gross assesed assesed Net Financial Physical Total to total
loans assets (-) assets (-) loans collateral collateral collateral loans
Corporate loans 3,195,503 (49,228) (2,352) 3,143,923 996,210 1,591,952 2,588,162 82%
Standard loans 3,025,016 (5,831) (2,125) 3,017,060 992,253 1,473,420 2,465,673 82%
Watch List 102,863 (1,639) (25) 101,199 1,744 97,721 99,465 98%
NPL 67,624 (41,758) (202) 25,664 2,213 20,811 23,024 90%
Retail loans (incl. mortgages) 1,981,975 (1,230) (94,514) 1,886,231 190,324 970,846 1,161,170 62%
Performing loans 1,736,451 – (10,087) 1,726,364 156,649 877,316 1,033,965 60%
Watch List 147,675 – (16,751) 130,924 23,403 61,144 84,547 65%
NPL 97,849 (1,230) (67,676) 28,943 10,272 32,386 42,658 147%
SME loans 352,005 (4,264) (8,174) 339,567 2,629 269,675 272,304 80%
Performing loans 275,168 – (1,513) 273,655 2,435 209,597 212,032 77%
Watch List 65,157 – (1,699) 63,458 194 55,850 56,044 88%
NPL 11,680 (4,264) (4,962) 2,454 – 4,228 4,228 172%
Total exposure 5,529,483 (54,722) (105,040) 5,369,721 1,189,163 2,832,473 4,021,636 75%
Total NPL 177,153 (47,252) (72,840) 57,061 12,485 57,425 69,910 123% In the table above, the fair value of collaterals is capped at transactional outstanding. In general, the Bank attracts collaterals at a value exceeding the risk amount to secure itself against possible drops in collateral value due to market fluctuations.
No
tes
to C
onso
lid
ated
Fin
anci
al S
tate
men
ts
Notes to Consolidated Financial Statements

91
Credit Europe Bank N
V Annual Report 2009
The total amount of NPL as of December 31, 2009 is EUR 250,993 (2008: 177,153). The total NPL ratio as of December 31, 2009, is 4.64% (2008: 3.20%). Total impaired assets under loans and advance customers is EUR 304,625 (2008: EUR 177,153). The Bank ensures that it allocates sufficient reserves to maintain a high level of provisioning coverage for its non-performing loans (NPL) after taking into account the fair value of collaterals obtained. Thus the total coverage for Bank’s NPL in December 31, 2009 is 104.73% (2008: 122.5%).
As of December 31, 2009, the total net amount of restructured loans comprises EUR 262,932 (2008: EUR 87,904).
38.g. Aging of loans and advances to customersThe following tables present the Bank’s portfolio of loans and advances to customers, broken down by delinquency bucket, as of December 31, 2009 and December 31, 2008:
2009
Loans 30 Loans 60
Loans or more or more
Loans less but less but less Loans 90
that are than 30 than 60 than 90 days or Total
not past days days past days past more past loans to
Net exposure due past due due due due customers
Corporate loans 3,009,078 64,346 55,497 39,885 55,308 3,224,114
Retail loans and residential
mortgage loans 1,524,075 95,777 34,855 15,069 56,739 1,726,515
SME loans 186,174 44,310 8,907 11,479 17,188 268,058
Total loans and advances
to customers 4,719,327 204,433 99,259 66,433 129,235 5,218,687
2008
Loans 30 Loans 60
Loans or more or more
Loans less but less but less Loans 90
that are than 30 than 60 than 90 days or Total
not past days days past days past more past loans to
Net exposure due past due due due due customers
Corporate loans 3,043,958 62,389 7,741 11,930 17,905 3,143,923
Retail loans and residential
mortgage loans 1,726,364 97,768 21,542 11,614 28,943 1,886,231
SME loans 273,655 53,748 5,940 3,770 2,454 339,567
Total loans and advances
to customers 5,043,977 213,905 35,223 27,314 49,302 5,369,721
No
tes to Con
solidated
Finan
cial Statem
ents
Notes to Consolidated Financial Statements

92
Cre
dit E
urop
e Ba
nk N
V A
nnua
l Rep
ort 2
009 38.h. Geographical concentration of loans advanced to customers, broken down by counterparty type
The following tables breaks down customers’ loans and advances by risk country:
2009
Other
emerging Developed Total
Net exposure Russia Romania Turkey Ukraine markets markets exposure
Corporate loans 610,394 502,383 1,371,863 80,094 85,447 573,933 3,224,114
Standard loans 599,798 428,525 1,350,530 66,414 71,426 562,463 3,079,156
Watch List 10,596 44,657 10,268 6,678 8,895 9,967 91,061
NPL – 29,201 11,065 7,002 5,126 1,503 53,897
Retail loans (incl. mortgages) 546,183 828,105 – 13,003 – 339,224 1,726,515
Performing loans 499,564 696,862 – 11,199 – 316,910 1,524,535
Watch List loans 33,613 92,320 – 803 – 18,505 145,241
NPL 13,006 38,923 – 1,001 – 3,809 56,739
SME loans 82,265 177,171 – 8,622 – – 268,058
Performing loans 77,774 103,625 – 7,122 – – 188,521
Watch List loans 3,387 58,810 – 152 – – 62,349
NPL 1,104 14,736 – 1,348 – – 17,188
Total exposure 1,238,842 1,507,659 1,371,863 101,719 85,447 913,157 5,218,687
2008
Other
emerging Developed Total
Net exposure Russia Romania Turkey Ukraine markets markets exposure
Corporate loans 570,724 634,091 1,137,212 110,633 106,291 584,972 3,143,923
Standard loans 570,002 531,703 1,129,610 103,034 98,463 584,248 3,017,060
Watch List 687 92,070 – 7,599 255 588 101,199
NPL 35 10,318 7,602 – 7,573 136 25,664
Retail loans (incl. mortgages) 687,557 869,943 – 16,611 – 312,120 1,886,231
Performing loans 618,086 793,171 – 14,641 – 300,466 1,726,364
Watch List loans 53,486 64,868 – 1,446 – 11,124 130,924
NPL 15,985 11,904 – 524 – 530 28,943
SME loans 81,694 244,842 – 13,031 – – 339,567
Performing loans 76,865 185,615 – 11,175 – – 273,655
Watch List loans 4,459 57,518 – 1,481 – – 63,458
NPL 370 1,709 – 375 – – 2,454
Total exposure 1,339,975 1,748,876 1,137,212 140,275 106,291 897,092 5,369,721
No
tes
to C
onso
lid
ated
Fin
anci
al S
tate
men
ts
Notes to Consolidated Financial Statements

93
Credit Europe Bank N
V Annual Report 2009
38.i. Liquidity risk The Bank defines liquidity risk as the current or prospective risk to earnings and capital arising from an institution’s inability to meet its liabilities when they come due. Liquidity risk arises from inability to manage unplanned decreases or changes in funding sources and the failure to recognize or address changes in market conditions that affect the ability to liquidate assets quickly and with minimal loss in value.
The Bank monitors its liquidity position on a daily basis and conducts regular liquidity stress testing. The Bank identifies the follow-ing items as the key liquidity-risk drivers:
Withdrawal of deposits:• The Bank should withstand a severe meltdown in its non-maturity deposits through deploying its available liquid assets. The severity is defined as a 40% loss in the saving-account balance in a period of one month.
Erosion in value of liquid assets:• The Bank applies a 75% haircut for the securities that are not eligible for re-financing through the European Central Bank (ECB). The remaining qualifying securities are taken into account after adding nominal 5% on top of the existing haircuts applied by the ECB. The policy also incorporates a scenario of material price drops, which in return further decrease the re-financing capacity.
Erosion in value of liquid assets:• The Bank applies a 75% haircut for the securities that are not eligible for re-financing through the European Central Bank (ECB). The remaining qualifying securities are considered after applying certain haircuts according to their external ratings.
Additional collateral requirements:• The Bank has sensitivity to certain FX parities due to its involvement in swap markets. The Bank might face intensive margin calls from the counterparties if certain FX rates move in the adverse direction. The Bank measures the required liquidity under worse-than-expected FX market conditions.
The Board and senior management ensure that the Bank's funding strategy and its implementation are consistent with their ex-pressed risk tolerance. The board delegates responsibility for establishing specific liquidity-risk policies and practices to the Asset/Liability Committee (ALCO). ALCO is responsible for ensuring that measurement systems adequately identify and quantify the Bank’s liquidity exposure and that reporting systems communicate accurate and relevant information about the level and sources of that exposure.
Any violation of the liquidity policy and predefined limits is reported to ALCO. In the case of limit excess during a market turmoil, ALCO calls an immediate meeting to discuss options to bring the liquidity to its desired levels. This can include slowing down and/or ceasing to enter into new commitments, selling assets from trading and AFS portfolios, and increasing spreads to attract new long-term funds on the consumer and corporate sides, as defined in the Bank’s contingency-funding plan. To mitigate liquidity risk, the Bank diversifies funding sources as customer deposits and funds borrowed from abroad and it keeps certain level of assets as cash and cash equivalents.
Liquidity gaps as a result of size and maturity mismatches in assets and liabilities also generate liquidity risk. Liquidity-gap analysis is done on a monthly basis, to be submitted to ALCO, or more frequently when required. It distributes all on-balance sheet assets’ and liabilities’ expected cash flows in predefined maturity bands according to remaining contractual maturity.
In its second consultation paper, ‘International Framework for Liquidity Risk Measurement, Standards and Monitoring’, the Basel Committee proposes a strengthened liquidity framework which introduces quantitative standards for funding and liquidity. The two proposed measures are a 30-day liquidity coverage ratio designed to ensure short-term resilience to liquidity disruptions and a longer-term structural liquidity ratio to address liquidity mismatches and promote the use of stable funding sources. Our interim impact study found that CEB NV is well above the proposed thresholds, verifying CEB NV’s strong liquidity position.
No
tes to Con
solidated
Finan
cial Statem
ents
Notes to Consolidated Financial Statements

94
Cre
dit E
urop
e Ba
nk N
V A
nnua
l Rep
ort 2
009 2009
Based on remaining maturity Up to 1 month 1–3 months 3–6 months 6–12 months Over 1 year Total
Assets
Cash and balances at central banks 1,596,422 – – – – 1,596,422
Financial assets designated at fair
value through profit or loss 245,166 287 500,000 200,000 50,277 995,730
Financial investments 340,941 70,278 86,791 53,363 566,467 1,117,840
Loans and receivables – banks 491,058 45,039 42,651 4,685 32,081 615,514
Loans and receivables – customers 1,066,008 753,838 480,301 572,082 2,346,458 5,218,687
Tangible and intangible assets – – – – 104,871 104,871
Other assets 95,208 101,603 32,043 18,005 59,688 306,547
Total assets 3,834,803 971,045 1,141,786 848,135 3,159,842 9,955,611
Liabilities
Due to banks 301,572 15,842 690,420 282,129 27,222 1,317,185
Due to customers 1,765,054 888,133 1,149,719 1,150,248 2,270,206 7,223,360
Issued debt securities – 84,212 20,579 – 109,547 214,338
Other liabilities 148,120 79,640 46,074 20,474 44,844 339,152
Total liabilities (excluding subordinated liabilities) 2,214,746 1,067,827 1,906,792 1,452,851 2,451,819 9,094,035
Subordinated liabilities 865 30 – – 222,595 223,490
Total liabilities 2,215,611 1,067,857 1,906,792 1,452,851 2,674,414 9,317,525
Cumulative liquidity gap 1,619,192 1,522,380 757,374 152,658 638,086 638,086
2008
Based on remaining maturity Up to 1 month 1–3 months 3–6 months 6–12 months Over 1 year Total
Assets
Cash and balances at central banks 1,964,800 – – – – 1,964,800
Financial assets designated at
fair value through profit or loss 188,765 – 19,664 1,902 41,277 251,608
Financial investments 73,103 3,652 28,970 72,049 208,946 386,720
Loans and receivables – banks 810,181 37,161 51,021 35,696 18,873 952,932
Loans and receivables – customers 613,002 478,949 473,392 697,750 3,106,628 5,369,721
Tangible and intangible assets – – – – 107,407 107,407
Other assets – – – – 507,589 507,589
Total assets 3,649,851 519,762 573,047 807,397 3,990,720 9,540,777
Liabilities
Due to banks 358,973 241,968 211,557 142,020 274,907 1,229,425
Due to customers 1,638,020 1,097,260 1,273,625 1,778,348 1,014,699 6,801,952
Issued debt securities – – 135,569 135,569
Other liabilities – – – – 471,743 471,743
Total liabilities (excluding subordinated liabilities) 1,996,993 1,339,228 1,485,182 1,920,368 1,896,918 8,638,689
Subordinated liabilities – – 1,036 – 230,043 231,079
Total liabilities 1,996,993 1,339,228 1,486,218 1,920,368 2,126,961 8,869,768
Cumulative liquidity gap 1,652,858 833,392 (79,779) (1,192,750) 671,009 671,009
No
tes
to C
onso
lid
ated
Fin
anci
al S
tate
men
ts
Notes to Consolidated Financial Statements

95
Credit Europe Bank N
V Annual Report 2009
38.j. Market riskMarket risk is defined as the current or prospective threat to the Bank’s earnings and capital as a result of adverse market move-ments in market prices (security and derivative prices, as well as interest rates and foreign-exchange rates) or in parameters such as volatility and correlations. The trading portfolio includes financial instruments, such as securities, derivatives and FI loans, which are exposed to short-term price/interest-rate fluctuations. Eligible positions should be in line with the guidelines and principles set out in the market-risk policy. No eligible positions and financial instruments approved by ALCO are monitored within the scope of the banking book. In line with its business plan, the Bank has a ‘fair’ risk appetite in market risk. The Bank aims to regularly measure and monitor its market risk associated with adverse market movements affecting the trading components of its Treasury and FI portfolio. It measures its market risk using different approaches – standard and internal models.
Bank risk tolerance in the form of limits is determined to manage market risk efficiently and keep it within these limits. Risk limits, such as the Value-at-Risk (VaR) limit, notional limits and sensitivity limits, are set by considering the primary risk factors. In case of a limit breach, ALCO is convened to determine strategy and take necessary actions to restore the outstanding exposure within limits in a certain period of time.
The Bank measures the market risk of its trading book and the foreign-exchange risk of its banking book by using an internal model, based on VaR methodology. VaR defines the maximum loss not exceeded with a given probability over a given period of time under normal market conditions. However, this approach fails to capture exceptional losses under extreme market conditions; that is why market risk measurement is complemented by periodic stress-testing analysis.
The internal VaR model is used only for risk-monitoring purposes and not for regulatory capital purposes. Regulatory capital for mar-ket risk is calculated and reported quarterly according to the Standard Approach, as specified in the DNB’s market-risk regulations.
The Historical Approach calculation method is used. The last 250 historical daily returns of market risk factors are used to stress the current trading positions to estimate possible fluctuations caused by market movements while keeping the portfolio fixed.
The internal limit for the 10-day trading portfolio, with VaR at 99%-confidence interval, is EUR 12.5 million. This implies that the diversified VaR from foreign-exchange risk and interest-rate risk in the trading book should not exceed this level.
Other market risks, such as liquidity, re-pricing and interest-rate risk, on the banking book are measured and monitored through sensitivity and gap analyses, detailed in subsequent sections.
Value-at-risk of trading units Total Diversification effect Interest-rate risk Foreign-exchange risk
Average 8,807 28.35% 8,812 685
Maximum 12,325 2.19% 12,207 394
Minimum 3,890 48.14% 7,356 144
Period-end 5,854 0.88% 5,848 58
Stressed Value-at-Risk, a measure proposed by BIS in ‘Revisions to the Basel II market risk framework’ (BIS, July 2009), is a replication of the usual VaR, with the only difference being the market-data window. The Bank has chosen a period of high financial stress for its incremental market-risk measure: August 2008 – August 2009. The other parameters are identical to those used for regular VaR reporting: Historical Simulation method, 99% confidence interval, daily returns and also the portfolio. As of December 31, 2009, the 10-days stressed VaR is EUR 6.23 million.
No
tes to Con
solidated
Finan
cial Statem
ents
Notes to Consolidated Financial Statements

96
Cre
dit E
urop
e Ba
nk N
V A
nnua
l Rep
ort 2
009 38.k. Interest-rate risk in the banking book
One of the Bank’s major risks under Pillar II is the interest-rate risk on the banking book. The Bank defines interest-rate risk as the current or prospective risk to earnings and capital arising from adverse movements in interest rates. The trading book is also subject to interest-rate risk, but this type of risk is dealt with under the Market Risk: Value-at-Risk section. Subsidiaries are not allowed to carry interest-rate positions and are expected to transfer their positions to the parent Bank, where centralized ALM and funding principles are in place. The Bank has a ‘minor’ risk tolerance towards interest-rate risk in its banking book.
The Bank’s interest-rate risk is monitored for the banking book by means of static-re-pricing-gap and interest-rate-sensitivity analyses once a month at all levels and for each major currency in use. Interest-rate sensitivity on the banking book is calculated according to the economic-value approach, and is reported on a monthly basis at Bank and Group levels to the Risk Management Committee and the Treasury Department.
For the re-pricing gap, any mismatch exceeding 15% of equity for maturities longer than six months is hedged, unless otherwise approved by ALCO. For the maturity gap, the consolidated gap should not be negative for the first six months, unless otherwise approved by ALCO.
Interest-rate sensitivity in the banking book is calculated according to the economic-value approach. All future cash flows, arising solely from on-and off-balance sheet assets and liabilities are discounted back to their present values with zero-coupon yield curves to see the impact of interest-rate changes on the economic value of the Bank. The impact of the curve with the maximum net gain or loss compared to a benchmark curve is analyzed.
Interest-rate sensitivity in the banking book is measured by means of PV01 method. The PV01 method is based on flat upward shifts of each currency’s yield curve in magnitudes of one basis point. The economic value impact of these shifts on the banking book is then analyzed. PV01 analysis is complemented with 200-basis-points (bps) scenarios, which consist of the parallel shifts of the yield curves by shifting short-term rates and long-term rates for each individual currency. The impact of the curve with the maximal net gain or loss compared to a benchmark curve is then analyzed.
The calculated negative effect on the net present economic value is reported as ICAAP-capital buffer for the Bank’s interest-rate risk. As of December 31, 2009, this amount is EUR 28.04 million.
In 2010 the Bank is considering automating its reporting and increasing the depth of its analysis by efficiently capturing all of the major sources of interest-rate risk, such as basis risk (arising from different interest-rate benchmarks), interest-rate-re-pricing risk, yield-curve risk (risk related to the changes in the shape and the slope of the yield curve) and embedded options.
Determination of economic internal capital to be set aside to cover potential interest-rate risk in the banking book is based on a Historical Simulation method. Historical economic values of the current banking book are calculated by discounting the re-pricing gaps in each of the major currencies with historical month-end zero-coupon swap curves in predefined maturity buckets. Once historical economic values are obtained, an economic value change distribution is created using a rolling window of one year.
No
tes
to C
onso
lid
ated
Fin
anci
al S
tate
men
ts
Notes to Consolidated Financial Statements

97
Credit Europe Bank N
V Annual Report 2009
No
tes to Con
solidated
Finan
cial Statem
ents
Notes to Consolidated Financial Statements
2009
Non-interest-
bearing
Up to 1 month 1–3 months 3–6 months 6–12 months Over 1 year items 1 Total
Assets
Cash and balances at central banks 1,596,422 – – – – – 1,596,422
Financial assets designated at fair
value through profit or loss 20,038 33,396 6,365 238,203 697,200 528 995,730
Financial investments 81,559 117,969 118,006 57,437 732,538 10,331 1,117,840
Loans and receivables – banks 374,577 58,374 14,710 4,984 15,225 147,644 615,514
Loans and receivables – customers 1,387,383 908,556 693,587 552,431 1,388,986 287,744 5,218,687
Tangible and intangible assets – – – – – 104,871 104,871
Other assets 163,970 206 – 1,111 329 140,931 306,547
Total assets 3,623,949 1,118,501 832,668 854,166 2,834,278 692,049 9,955,611
Liabilities
Due to banks 290,849 115,543 50,187 781,832 2,457 76,317 1,317,185
Due to customers 3,251,026 587,537 490,285 381,691 2,299,904 212,917 7,223,360
Issued debt securities and
other borrowed funds – 84,212 20,579 – 109,547 – 214,338
Other liabilities 709 – – – 4,141 334,302 339,152
Total liabilities (excluding subordinated liabilities) 3,542,584 787,292 561,051 1,163,523 2,416,049 623,536 9,094,035
Subordinated liabilities 125,451 98,039 – – – – 223,490
Total liabilities 3,668,035 885,331 561,051 1,163,523 2,416,049 623,536 9,317,525
Off-balance interest-sensitivity gap 165,590 (14,557) (367,847) 187,558 – – (29,256)
Net gap 121,504 218,613 (96,230) (121,799) 418,229 68,513 540,317
1 Non-interest-bearing items are not taken into account in the net gap.

98
Cre
dit E
urop
e Ba
nk N
V A
nnua
l Rep
ort 2
009 2008
Non-interest-
bearing
Up to 1 month 1–3 months 3–6 months 6–12 months Over 1 year items 1 Total
Assets
Cash and balances at central banks 1,964,800 – – – – – 1,964,800
Financial assets designated at fair
value through profit or loss 86,334 13,608 80,366 28,655 41,328 1,317 251,608
Financial investments 127,130 25,157 31,717 36,554 165,719 443 386,720
Loans and receivables – banks 241,608 29,779 54,976 28,089 3,537 594,943 952,932
Loans and receivables – customers 1,332,125 915,550 788,801 735,546 1,593,114 4,585 5,369,721
Tangible and intangible assets – – – – – 107,407 107,407
Other assets – – – – – 507,589 507,589
Total assets 3,751,997 984,094 955,860 828,844 1,803,698 1,216,284 9,540,777
Liabilities
Due to banks 172,344 473,395 248,400 105,474 17,473 212,339 1,229,425
Due to customers 3,176,722 541,960 607,892 993,205 1,017,022 465,151 6,801,952
Issued debt securities
and other borrowed funds – – – 2,656 132,913 – 135,569
Other liabilities – – – – – 471,743 471,743
Total liabilities (excluding subordinated liabilities) 3,349,066 1,015,355 856,292 1,101,335 1,167,408 1,149,233 8,638,689
Subordinated liabilities 39,514 190,671 894 – – – 231,079
Total liabilities 3,388,580 1,206,026 857,186 1,101,335 1,167,408 1,149,233 8,869,768
Off-balance interest-sensitivity gap 21,501 5,601 45,838 108,668 (184,317) – (2,709)
Net gap 384,918 (216,331) 144,512 (163,823) 451,973 67,051 601,249 1 Non-interest-bearing items are not taken into account in the net gap.
No
tes
to C
onso
lid
ated
Fin
anci
al S
tate
men
ts
Notes to Consolidated Financial Statements

99
Credit Europe Bank N
V Annual Report 2009
No
tes to Con
solidated
Finan
cial Statem
ents
Notes to Consolidated Financial Statements
38.l. Currency risk The Bank takes on exposure to effects of fluctuations in the prevailing foreign-currency-exchange rates on its financial position and cash flows.
The Bank enters into foreign-currency forward transactions and swap transactions to decrease foreign-currency-position risk.
The Bank’s position limits on currency risk are determined according to the foreign-currency net-position standard ratio determined by the DNB.
The Bank has control limits for the positions of forward transactions, options and other similar agreements. The credit risk arising from these instruments is managed together with the risks resulting from market fluctuations. The Bank monitors the risks of for-ward transactions, options and other similar agreements, reviews open positions with the ALCO and takes appropriate action where deemed necessary.
Consolidated subsidiaries and associates determine position limits related to currency risk as determined by local regulatory bodies. Subsidiaries established abroad conduct their operations in the currencies of the countries they are incorporated in.
The result of structural foreign-exchange positions on the Bank’s net investments in foreign subsidiaries and branches, together with any related net investment hedges (see note 11), is recognized in equity.
Foreign-exchange risk of the position held is calculated with VaR methodology and reported daily for the Bank level and monthly on a consolidated level. The VaR limits and other market risks related issues are monitored by the Risk Management Department and discussed in weekly ALCO meetings.
The currency position, taking off-balance sheet derivative transactions into account, is at insignificant levels as of December 31, 2009 and December 31, 2008. The positions are taken inline with the Bank’s risk-management policies.

100
Cre
dit E
urop
e Ba
nk N
V A
nnua
l Rep
ort 2
009
No
tes
to C
onso
lid
ated
Fin
anci
al S
tate
men
ts
Notes to Consolidated Financial Statements
Currency analysis for the year ended December 31, 2009:
EUR USD CHF RON RUB UAH TRY Others Total
Cash and balances with central banks 1,431,189 3,604 329 124,024 31,764 5,407 – 105 1,596,422
Financial assets designated at fair
value through profit or loss 964,139 24,515 – 528 6,515 – 33 – 995,730
Financial investments 332,738 407,650 – 178,339 169,836 25,873 – 3,404 1,117,840
Loans and receivables – banks 427,353 161,036 2,260 3,027 12,280 2,645 2,040 4,873 615,514
Loans and receivables – customers 2,373,017 1,698,957 184,935 264,436 627,377 12,723 37,751 19,491 5,218,687
Derivative financial instruments 326,248 (142,965) 27,770 (12,871) 306 – 3,603 175 202,266
Equity-accounted investments 125 – – – – – – – 125
Property and equipment 40,828 580 1,188 26,035 11,719 2,152 – – 82,502
Goodwill and other intangible assets 6,298 98 – 8,370 7,182 421 – – 22,369
Other assets 12,228 34,753 233 36,255 18,147 2,504 34 2 104,156
Total assets 5,914,163 2,188,228 216,715 628,143 885,126 51,725 43,461 28,050 9,955,611
Due to banks 1,011,321 10,141 240 63,886 231,193 – 47 357 1,317,185
Due to customers 5,955,719 803,412 4,254 270,041 161,865 4,349 17,371 6,349 7,223,360
Derivative financial instruments (334,532) 355,276 174,824 (10,222) 8,929 – 4,343 7 198,625
Issued debt securities – 211,373 – – 2,965 – – – 214,338
Other liabilities 58,707 39,328 15,386 16,057 9,627 1,274 38 110 140,527
Subordinated liabilities 60,895 162,595 – – – – – – 223,490
Total liabilities 6,752,110 1,582,125 194,704 339,762 414,579 5,623 21,799 6,823 9,317,525
Net on-balance sheet position – 606,103 22,011 288,381 470,547 46,102 21,662 21,227 1,476,033
Off-balance sheet net position – (643,073) (31,116) (285,387) (433,083) (36,814) (19,142) (24,218) (1,472,833)
Net open position – (36,970) (9,105) 2,994 37,464 9,288 2,520 (2,991) 3,200
1 Euros are not included in the total net position, since it is the Bank’s functional currency.
1

101
Credit Europe Bank N
V Annual Report 2009
No
tes to Con
solidated
Finan
cial Statem
ents
Notes to Consolidated Financial Statements
Currency analysis for the year ended December 31, 2008:
EUR USD CHF RON RUB UAH TRY Others Total
Cash and balances with central banks 1,671,145 124,729 701 107,961 57,760 2,448 – 56 1,964,800
Financial assets designated at fair
value through profit or loss 224,941 26,264 – 369 – – 34 – 251,608
Financial investments 78,918 233,581 – 26,084 21,785 26,352 – – 386,720
Loans and receivables – banks 233,103 680,316 7,083 146 11,607 7,021 3,998 9,658 952,932
Loans and receivables – customers 2,160,539 1,821,372 195,013 360,468 749,130 9,359 72,713 1,127 5,369,721
Derivative financial instruments 306,561 55,085 63,428 – – – – – 425,074
Equity-accounted investments 125 – – – – – – – 125
Property and equipment 35,250 633 1,420 33,352 16,533 4,523 – – 91,711
Goodwill and other intangible assets 2,116 – – 7,607 5,531 442 – – 15,696
Other assets 306,984 (244,281) 479 2,944 10,007 6,214 42 1 82,390
Total assets 5,019,682 2,697,699 268,124 538,931 872,353 56,359 76,787 10,842 9,540,777
Due to banks 273,909 578,842 1,007 14,203 325,454 732 34,748 530 1,229,425
Due to customers 5,713,434 416,983 5,486 350,351 118,122 2,165 173,395 22,016 6,801,952
Derivative financial instruments 253,072 269 73,740 197 7,192 – – 5 334,475
Issued debt securities – 132,338 – 37 3,194 – – – 135,569
Other liabilities (47,005) 137,083 15,866 15,000 15,503 780 17 24 137,268
Subordinated liabilities 110,678 120,401 – – – – – – 231,079
Total liabilities 6,304,088 1,385,916 96,099 379,788 469,465 3,677 208,160 22,575 8,869,768
Net on-balance sheet position – 1,311,783 172,025 159,143 402,888 52,682 (131,373) (11,733) 1,955,415
Off-balance sheet net position – (1,265,023) (168,981) (158,152) (431,957) (47,733) 126,999 2,978 (1,941,869)
Net open position – 46,760 3,044 991 (29,069) 4,949 (4,374) (8,755) 13,546
1 Euros are not included in the total net position, since it is the Bank’s functional currency.
1

102
Cre
dit E
urop
e Ba
nk N
V A
nnua
l Rep
ort 2
009 38.m. Operational risk
Operational risk is the risk of loss resulting from inadequate or failed internal processes, people and systems or from external events, including legal and outsourcing risk but excluding business, strategy, and reputational risk.
During the last quarter of 2008, the Bank established a group-level Operational Risk Management (ORM) Department whose goal is to consolidate already-existing ORM activities and coordinate implementation of the framework at locations where there was no prior ORM activity. The framework uses the Risk Control Self-Assessment and Operational Loss database to identify risks and establish risk-mitigating action points. There are ORM officers at each department ensuring that operational-risk management is embedded in day-to-day operations. A new-product-approval process has also been introduced to ensure new products and processes are introduced in a well-prepared manner by all parties involved.
39. Subsequent event
The Bank has signed a agreement for the acquisition of 95% of shares in Millennium Bank AS in Turkey. The purchase is subject to the approval of the Dutch Central Bank (De Nederlandsche Bank – DNB) and the Turkish Banking Supervisory Regularity Agency. Acquisition is expected to be finalized at the end of June 2010.
40. List of subsidiaries
There are no significant restrictions on the ability of subsidiaries to transfer funds to the Parent Company in the form of cash dividends or to repay loans or advances.
Name Place Country Interest
2009 2008
Credit Europe Bank Ltd Moscow Russia 96.28% 95.96%
Credit Europe Bank (Romania) SA Bucharest Romania 96.39% 94.05%
Credit Europe Leasing LLC Kiev Ukraine 100.00% 100.00%
CSJC Credit Europe Bank Kiev Ukraine 99.99% 99.99%
Stitching Credit Europe Custodian Services Amsterdam The Netherlands 100.00% 100.00%
Credit Europe Bank (Suisse) SA Geneva Switzerland 100.00% 100.00%
Credit Europe Bank (Dubai) Ltd Dubai United Arab Emirates 100.00% 100.00%
Credit Europe Leasing LC Russia Moscow Russia 98.04% –
Credit Europe Bank Consumer Finance SA Brussels Belgium 100.00% 100.00%
No
tes
to C
onso
lid
ated
Fin
anci
al S
tate
men
ts
Notes to Consolidated Financial Statements

Parent Company Financial StatementsAs of and for the year ended December 31, 2009
(Unless otherwise stated, all amounts are in thousands of euros)

104
Cre
dit E
urop
e Ba
nk N
V A
nnua
l Rep
ort 2
009
Su
mm
ary
of s
ign
ific
ant
acco
un
tin
g p
olic
ies
of t
he
Par
ent
Com
pan
y
Summary of significant accounting policies of the Parent Company
Basis of preparation
The Parent Company Financial Statements of Credit Europe Bank NV (CEB NV) have been prepared in accordance with accounting principles in the Netherlands as embodied in Part 9 of Book 2 of the Netherlands Civil Code. Based on article 2:362.8 of the Netherlands Civil Code, the valuation principles applied are based on International Financial Reporting Standards (IFRS), as used for the preparation of the Consolidated Financial Statements of the Bank.
The accounting policies that are used in the preparation of these separate financial statements are consistent with the accounting policies used in preparation of the Consolidated Financial Statements of the Bank, as set out in those financial statements.
The additional accounting policies that are specific to the Parent Company Financial Statements of CEB NV are set out below.
Based on article 402 of Book 2 of the Netherlands Civil Code, the Company’s notes are simplified.
Investment in subsidiariesThe group companies are stated at their net asset value, determined on the basis of IFRS, as applied in the Consolidated Financial Statements of the Bank. For details on the accounting policies applied for the group companies, refer to the Summary of significant accounting policies to the Consolidated Financial Statements on pages 39–51.
Dividend incomeDividend income from investments in subsidiaries is recognized when the right to receive payment is established.

105
Credit Europe Bank N
V Annual Report 2009
Statem
ent of fin
ancial p
osition of th
e Paren
t Com
pan
y
Statement of financial position of the Parent Company
Notes Page 2009 2008
Assets
Cash and balances with central banks a 108 1,413,527 1,529,085
Amount due from banks b 108 1,409,383 2,165,758
Loans and advances to customers c 108 2,665,900 2,556,207
Debt securities d 109 1,930,684 576,857
– Trading 1,073,409 241,744
– Available for sale 415,117 49,329
– Held to maturity 442,158 285,784
Derivatives e 109 178,256 350,332
Investments in Group companies f 111 625,603 597,807
Intangible assets g 112 18,017 11,166
Property and equipment h 113 40,828 35,250
Other assets i 113 48,296 57,723
Total assets 8,330,494 7,880,185
Liabilities
Amounts due to banks j 113 1,206,709 742,978
Customer deposits and other funds on deposits k 114 6,002,706 5,906,865
Derivatives e 109 184,642 291,289
Other liabilities l 114 91,831 58,412
General provisions 638 1,536
Subordinated loans m 115 223,490 231,079
Total liabilities 7,710,016 7,232,159
Equity
Share capital n 115 399,500 399,500
Share premium 163,748 162,321
Legal reserves o 115 (1,449) 29,370
Other reserves 50,030 33,868
Inappropriated result 8,649 22,967
Total equity 620,478 648,026
Total equity and liabilities 8,330,494 7,880,185
Commitment and contingencies p 116 409,855 885,664

106
Cre
dit E
urop
e Ba
nk N
V A
nnua
l Rep
ort 2
009
Pro
fit
and
loss
sta
tem
ent
of t
he
Par
ent
Com
pan
y
Profit and loss statement of the Parent Company
2009 2008
Profit for the year of the Parent Company after taxes 8,649 20,356
Profit for the year participating interests after taxes 40,628 51,817
Profit for the year 49,277 72,173

107
Credit Europe Bank N
V Annual Report 2009
Statem
ents of ch
ang
es in equ
ity of the P
arent C
omp
any
Statements of changes in equity of the Parent Company
Attributable to equity holders of the Parent Company
Issued Share Legal Others Inappropriate capital premium reserves reserves results Total
At January 1, 2009 399,500 162,321 29,370 33,868 22,967 648,026
Net gains on available-for-sale financial assets – – 7,884 – – 7,884
Foreign-currency translation – – (22,838) – – (22,838)
Net gain on hedge of net investment – – (57,014) – – (57,014)
Total income and expense for the year recognized directly in equity – – (71,968) – – (71,968)
Profit for the year – – 40,628 – 8,649 49,277
Addition to reserve on tangibles – – 521 – – 521
Transfer from retained earnings – – – 22,967 (22,967) –
Transfer from share premium 1,427 – – – 1,427
Dividends – – – (6,805) – (6,805)
At December 31, 2009 399,500 163,748 (1,449) 50,030 8,649 620,478
At January 1, 2008 324,500 162,321 14,181 (3,071) 36,939 534,870
Net gains on available-for-sale financial assets – – (9,043) – – (9,043)
Foreign-currency translation – – (64,428) – – (64,428)
Merger effect – – 39,561 – – 39,561
Total income and expense for the year recognized directly in equity – – (33,910) – – (33,910)
Profit for the year – – 49,206 – 22,967 72,173
Issue of share capital 75,000 – – – – 75,000
Addition to reserve on tangibles – – (107) – – (107)
Transfer from retained earnings – – – 36,939 (36,939) –
At December 31, 2008 399,500 162,321 29,370 33,868 22,967 648,026

108
Cre
dit E
urop
e Ba
nk N
V A
nnua
l Rep
ort 2
009
No
tes
to P
aren
t C
omp
any
Fin
anci
al S
tate
men
ts
A. Cash and balances at central banks
This item includes cash on hand and deposits with central banks in countries in which the CEB NV has a presence.
2009 2008
Cash on hand 10 16
Balances at central bank 1,413,517 1,529,069
Total 1,413,527 1,529,085
Deposits at central banks include reserve deposits amounting to EUR 74,894 (2008: EUR 59,069) that represent the mandatory deposits and are not available in the CEB NV’s day-to-day operations.
B. Amounts due from banks
2009 2008
Loans and advances 600,891 1,205,778
Placement with other banks 801,388 870,485
Trading loans 18,433 94,496
Subtotal 1,420,712 2,170,759
Allowances for impairment (11,329) (5,001)
Total 1,409,383 2,165,758
Loans to and receivables from related companies amount to EUR 1,112,594 (2008: EUR 1,575,340). The amount will not mature within one year is EUR 522,072 (2008: EUR 237,946).
C. Loans and advances to customers
2009 2008
Commercial 2,011,123 2,482,621
Consumer 705,197 124,799
Credit cards 2,164 1,920
Subtotal 2,718,484 2,609,339
Allowances for impairment (52,584) (53,132)
Total 2,665,900 1 2,556,207 1
1 None of these loans is subordinated.
Loans to and receivables from related companies amount to EUR 441,883 (2008: EUR 643,049).
No individual loan or receivable has terms and conditions that materially affect the amount, timing or certainty of the consolidated cash flows of CEB NV.
Loans to customers do not include any amount related to receivables regarding securities that have been acquired in reverse repo transactions.
As of December 31, 2009, EUR 1,222,055 (2008: EUR 1,025,406) of loans and advances to customers are not expected to mature within one year.
Notes to Parent Company Financial Statements

109
Credit Europe Bank N
V Annual Report 2009
No
tes to Paren
t Com
pan
y Finan
cial Statem
ents
Notes to Parent Company Financial Statements
D. Debt securities
2009
Financial
assets held for Available for Held-to-maturity
trading 1 sale 2 portfolio 3 Total
Government bonds and T-Bills 688,531 248,912 74,028 1,011,471
Bank bonds 384,878 162,785 295,473 843,136
Corporate bonds – 3,420 72,657 76,077
1,073,409 415,117 442,158 1,930,684
2008
Financial
assets held for Available for Held-to-maturity
trading 1 sale 2 portfolio 3 Total
Government bonds and T-Bills 128,378 – – 128,378
Bank bonds 95,032 49,329 237,426 381,787
Corporate bonds 18,334 – 48,358 66,692
241,744 49,329 285,784 576,857
1 EUR 1,003,581 of the total is listed securities (2008: EUR 241,744) and EUR 69,828 is non-listed securities (2008: None). Gains and losses on changes
in the fair value of trading instruments are recognized in ‘net trading income’. Bank bonds issued by related companies amount to EUR 10,332
(2008: EUR 42,717). 2 EUR 273,243 of the total is listed securities (2008: EUR 49,329) and bank bonds issued by related companies amounting to EUR 88,191
(2008: EUR 48,517). 3 Bank bonds issued by related companies amount to EUR 50,545 (2008: EUR 50,643).
E. Derivative financial instruments
In the ordinary course of business, CEB NV enters into various types of transactions that involve derivative financial instruments. A derivative financial instrument is a financial contract between two parties where payments are dependent upon movements in price in one or more underlying financial instruments, reference rates or indices. Derivative financial instruments include forwards, swaps, futures, credit default swaps and options.
The table below shows the fair values of derivative financial instruments, recorded as assets and liabilities, together with their notional amounts. The notional amount, recorded gross, is the amount of a derivative’s underlying asset, reference rate or index, and is the basis on which changes in the value of derivatives are measured. The notional amounts indicate the volume of transactions outstanding at the year-end and are indicative of neither the market risk nor the credit risk.

110
Cre
dit E
urop
e Ba
nk N
V A
nnua
l Rep
ort 2
009
No
tes
to P
aren
t C
omp
any
Fin
anci
al S
tate
men
ts
Notes to Parent Company Financial Statements
Trading and hedging portfolio derivative financial instruments:
Derivatives held for trading 2009 2008
Notional Fair values Fair values Notional Fair values Fair values amounts – assets – liabilities amounts – assets – liabilities
Interest rate derivatives – OTC
Swaps 1,267,739 384 – 514,976 – 13,674
Credit-default swaps
(protection purchased) 224,471 – 2,613 7,185 – 54
Credit-default swaps
(protection sold) 90,240 144 – (113,889) 2,476 4,164
Futures (556,800) 2,775 – – – –
Subtotal 1,025,650 3,303 2,613 408,272 2,476 17,892
Currency derivatives – OTC
Swaps 7,115,605 156,291 153,916 4,408,085 212,819 168,260
Forwards 679,652 7,174 6,192 1,427,936 25,962 24,904
Options (purchased) 1,158,553 462 – 4,724,314 62,169 –
Options (sold) (1,238,723) – (91) (4,744,314) – 62,392
Subtotal 7,715,087 163,927 160,017 5,816,021 300,950 255,556
Other derivatives
Equity options (purchased) 470,839 10,974 – 1,390,256 17,841 –
Equity options (sold) (470,839) – 10,974 (1,390,256) – 17,841
Subtotal – 10,974 10,974 – 17,841 17,841
Total derivatives 8,740,737 178,204 173,604 6,224,293 321,267 291,289
Derivative financial instruments held or issued for trading purposes: Most of the Bank’s derivatives-trading activities relate to asset and liability management for the Bank and deals with customers who are normally laid off with counterparties. The Bank may also take positions with the expectation of profiting from favorable movements in prices or rates on indices. No hedge accounting has been applied.
Forwards and futures: Forwards and futures contracts are contractual agreements to buy or sell a specified financial instrument at a specific price and date in the future. Forwards are customized contracts transacted in the over-the-counter market. Future contracts are transacted in standardized amounts on regulated exchanges and are subject to daily cash-margin requirements.
Swaps: Swaps are contractual agreements between two parties to exchange movements in interest or foreign-currency rates and equity indices based on specified notional amounts.
Credit-default swap: A credit-default swap (CDS) is a swap designed to transfer the credit risk of fixed income products from one party to the other. It is an agreement between a protection buyer and a protection seller, whereby the buyer pays a periodic fee in return for a contingent payment by the seller upon a credit event (such as a certain default) happening in the reference entity.
Options: Options are contractual agreements that convey the right, but not the obligation for the purchaser, either to buy or sell a specific amount of a financial instrument at a fixed price, either at a fixed future date or at any time within a specified period.

111
Credit Europe Bank N
V Annual Report 2009
No
tes to Paren
t Com
pan
y Finan
cial Statem
ents
Notes to Parent Company Financial Statements
Derivatives held for risk management Net investment hedgesThe Bank uses forward foreign-exchange contracts to hedge the foreign-currency-translation risk on its net investment in foreign subsidiaries.
The fair value of derivatives designated as net investment hedges are as follows:
2009 2008
Assets Liabilities Assets Liabilities
Instrument type:
Foreign exchange forwards and swaps 52 11,038 29,065 –
F. Investments in Group companies
For 2009, the movement of participating interests in Group companies is as follows:
Balance at Results for Translation Balance at January 1 Additions Disposals the year difference Goodwill December 31
Credit Europe Bank Ltd 267,677 (7,484) – 33,347 (10,818) (1,282) 281,440
Stichting Credit Europe Custodian Services 125 – – – – – 125
CSJC Credit Europe Bank 47,796 (386) – 942 (2,409) – 45,943
Credit Europe Leasing LLC (Ukraine) (6,753) – – (5,109) 473 – (11,389)
Credit Europe (Romania) Bank SA 185,116 6,880 – (2,254) (9,213) (2,956) 177,573
Credit Europe (Suisse) Bank SA 80,381 9,414 – 7,750 213 – 97,758
Credit Europe (Dubai) Ltd 21,648 – – 9,481 (1,063) – 30,066
Credit Europe Bank Consumer Finance SA 1,817 – – 2,554 – – 4,371
Credit Europe Leasing LLC (Russia) – 1,470 – 2,475 99 – 4,044
Herald Maritime Corporation – 1 – (2,287) – – (2,286)
Cavendish Shipping SA – 1 – (559) – – (558)
Gosport Marine Inc. – 1 – (560) – – (559)
Walton Maritime SA – 1 – (926) – – (925)
597,807 9,898 – 44,854 (22,718) (4,238) 625,603

112
No
tes
to P
aren
t C
omp
any
Fin
anci
al S
tate
men
tsC
redi
t Eur
ope
Bank
NV
Ann
ual R
epor
t 200
9
Notes to Parent Company Financial Statements
For 2008, the movement of participating interests in Group companies is as follows:
Balance at Results for Translation Balance at January 1 Additions Disposals the year difference Goodwill December 31
Credit Europe Bank Ltd 189,963 86,278 – 31,533 (36,431) (3,666) 267,677
Credit Europe Ipotecar IFN SA 2,432 14,480 (16,912) – – – –
Stichting Credit Europe Custodian Services 125 – – – – – 125
SC Credit Europe Leasing IFN SA 11,322 10,107 (21,038) – (391) – –
CSJC Credit Europe Bank 44,643 24,367 (427) 1,987 (22,774) – 47,796
Credit Europe Leasing LLC 23 – – (9,643) 2,867 – (6,753)
Credit Europe (Romania) Bank SA 91,026 101,926 (3,678) 16,527 (16,871) (3,815) 185,115
Credit Europe (Suisse) Bank SA 69,597 – (7,033) 9,571 8,247 – 80,382
Credit Europe (Dubai) Ltd – 20,906 – 87 655 – 21,648
Credit Europe Bank Consumer Finance SA – 62 – 1,755 – – 1,817
409,131 258,126 (49,088) 51,817 (64,698) (7,481) 597,807
As at 31 December 2009, participating interest in Group companies included credit institutions of EUR 637,151 (2008: EUR 604,435).
G. Intangible assets
The book value of intangibles is as follows:
Patents and Goodwill licenses Total
Balance at January 1, 2009 7,481 3,685 11,166
Other additions 4,238 6,532 10,770
Disposals – (3,919) (3,919)
Balance at December 31, 2009 11,719 6,298 18,017
Balance at January 1, 2008 – 1,628 1,628
Other additions 7,481 3,109 10,590
Disposals – (1,052) (1,052)
Balance at December 31, 2008 7,481 3,685 11,166

113
No
tes to Paren
t Com
pan
y Finan
cial Statem
ents
Credit Europe Bank N
V Annual Report 2009
Notes to Parent Company Financial Statements
H. Property and equipmentThe book value of property and equipment in 2009 and 2008 changed as follows:
Furniture Leasehold
Buildings and fixtures Vehicles improvements Total
Balance at January 1, 2009 30,977 3,936 64 273 35,250
Additions 5,738 1,489 39 128 7,394
Disposals (114) (51) (10) (19) (194)
Depreciation (523) (987) (28) (84) (1,622)
Balance at December 31, 2009 36,078 4,387 65 298 40,828
Furniture Leasehold
Buildings and fixtures Vehicles improvements Total
Balance at January 1, 2008 26,098 2,301 84 355 28,838
Additions 5,198 2,210 – 148 7,556
Disposals – 8 – (147) (139)
Depreciation (319) (583) (20) (83) (1,005)
Balance at December 31, 2008 30,977 3,936 64 273 35,250
I. Other assets 2009 2008
Prepayments and advance payments to suppliers 4,009 22,905
Other receivables 27,671 19,129
Deferred tax assets 4,046 7,171
Current tax assets 9,683 5,997
Other assets 2,887 2,521
Total 48,296 57,723
J. Amounts due to banks This item comprises amounts due to banking institutions:
2009 2008
Time deposits 959,524 352,086
Syndication loan 186,855 190,052
Current accounts 60,330 200,840
Total 1,206,709 742,978
Deposits and current accounts of related companies amount to EUR 316,593 (2008:EUR 155,570)

114
No
tes
to P
aren
t C
omp
any
Fin
anci
al S
tate
men
tsC
redi
t Eur
ope
Bank
NV
Ann
ual R
epor
t 200
9
Notes to Parent Company Financial Statements
K. Customer deposits and other funds on deposits
This item comprises amounts due to non-banking customers:
2009 2008
Saving accounts 2,196,747 2,256,865
Consumer deposits 3,414,603 3,036,512
Corporate deposits 257,323 333,003
Current accounts 134,033 280,485
Total 6,002,706 5,906,865
As of December 31, 2009, EUR 2,012,822 (2008: EUR 1,008,822) of deposits from customers are expected to be settled more than 12 months after the balance sheet date.
As of December 31, 2009, the Parent Company maintained customer deposit balances of EUR 139,713 (2008: EUR 255,974), which were blocked as collateral for loans and off-balance sheet credit instruments granted by the Parent Company.
Deposits and current accounts of related companies amount to EUR 267 (2008: EUR 63).
L. Other liabilities
2009 2008
Deferred payment liability under letters of credit 1 38,604 24,887
Accrued expenses 14,639 12,827
Current tax liabilities – 4,280
Deferred tax liabilities 6,150 6,860
Payables to suppliers 2,388 856
Other payables 2 30,050 8,702
Total 91,831 58,412
1 Relates to deferred payments in relation to contractual agreements as set in letters of credit provided to or received from customers.2 Includes financial lease liability amounting EUR 841 (2008: EUR 1,165).

115
No
tes to Paren
t Com
pan
y Finan
cial Statem
ents
Credit Europe Bank N
V Annual Report 2009
Notes to Parent Company Financial Statements
M. Subordinated liabilities
Issued liabilities qualify as subordinated debt if claims by the holders are subordinated to all other current and future liabilities of CEB NV. This liability qualifies as capital, taking into account remaining maturities, for the purpose of determining the consolidated capital adequacy ratio for the DNB. The following table analyzes the subordinated liabilities:
2009 2008
Effective Effective
Principal Original Interest Opening Maturity interest interest
amount currency rate date date rate Amount rate Amount
125,750,000 1 USD Libor +2.5% 2 April 26, 2007 October 26, 2017 2.85% 87,714 5.62 % 90,948
60,000,000 EUR Euribor +3% 3 September 01, 2005 September 01, 2015 3.81% 60,018 6.95 % 60,167
21,000,000 USD Libor +2.5% September 28, 2007 September 28, 2017 2.82% 14,582 5.78 % 14,631
20,000,000 USD Libor +5% 4 October 30, 2008 October 30, 2018 5.46% 14,011 8.27 % 14,609
33,742,500 USD Libor +5% 5 October 02, 2008 October 02, 2018 5.47% 23,736 8.71 % 25,531
33,742,500 USD Libor +5% 5 September 30, 2008 September 30, 2018 5.43% 23,429 8.71 % 25,193
223,490 231,079
(1) The loan was converted from EUR 100,000,000 to USD 125,750,000 as of November 12, 2008.(2) Interest rate is Libor plus 2.50% per annum until October 2012 and Libor plus 3.00% per annum thereafter. Early redemption is allowed in October 2012.(3) The subordinated bond is listed on the Luxembourg stock exchange. Interest will be payable quarterly in arrears. Interest rate is Euribor plus 3.00% per
annum until September 2010 and Euribor plus 3.50% per annum thereafter. Early redemption is allowed in September 2010. (4) Interest rate is Libor plus 5% per annum until October 2013 and Libor plus 5.5% per annum thereafter.(5) Interest rate is Libor plus 5% per annum until October 2013 and Libor plus 5.5% per annum thereafter. The decision to convert the loans of
EUR 25 mil lion each to USD 33.7 million was agreed as of April 2, 2009.
The Bank has not had any defaults of principal, interest or other breaches with respect to its subordinated liabilities during 2009 and 2008.
N. Share capital
The authorized share capital is EUR 399,500 (2008: EUR 399,500) and comprises 399,500 (2008: 399,500) ordinary shares with a face value of EUR 1.
The called-up and paid-in capital consists of 399.5 million (2008: 399.5 million) ordinary shares with a face value of EUR 1.
O. Legal reserves
Under Dutch GAAP, legal reserves are required in certain circumstance. The objective of these legal reserves is to protect the credi-tors (i.e. the Parent Company is only allowed to pay out profits to its shareholders that it has realized or can realize when the Parent Company wants to). Legal reserves only relate to the Parent Company Financial Statements and are not applicable to the Consoli-dated Financial Statements. Profits of participations cannot be paid out to the Parent Company due to local legal requirements.
For the Parent Company, the following legal reserves are important: Legal participations reserve •Legal currency translation differences reserve •Legal revaluation for AFS instruments reserve •Legal hedge accounting reserve •

116
No
tes
to P
aren
t C
omp
any
Fin
anci
al S
tate
men
tsC
redi
t Eur
ope
Bank
NV
Ann
ual R
epor
t 200
9
Notes to Parent Company Financial Statements
P. Commitments and contingencies
To meet the financial needs of customers, the Bank issues various irrevocable commitments and contingent liabilities. Even though these obligations may not be recognized on the balance sheet, they do contain credit risk and are, therefore, part of the overall risk of the Bank. In many instances, the amount recognized on the balance sheet for incurred obligations does not represent the loss potential of the arrangement in full.
Letters of credit, guarantees and acceptances commit the Bank to make payments on behalf of customers, contingent on the failure of the customer to perform under the terms of the contract. Guarantees carry the same credit risk as loans. Credit guarantees can be in the form of bills of exchange, irrevocable letters of credit, advance payment guarantees and endorsement liabilities from bills rediscounted.
Commitments to extend credit represent contractual commitments to make loans and revolving credits. Commitments generally have fixed expiration dates, or other termination clauses. Since commitments may expire without being drawn upon, the total con-tract amounts do not necessarily represent future cash requirements. With respect to credit risk on commitments to extend credit, the Bank is potentially exposed to loss equal to the total unused commitments.
However, the likely amount of loss is less than the total unused commitments since most commitments to extend credit are con-tingent upon customers maintaining specific standards. The Bank monitors the term-to-maturity of credit commitments because longer-term commitments generally have a greater degree of credit risk than shorter-term commitments.
2009 2008
Contingent liabilities with respect to letters of guarantee granted – banks 1,025 265
Contingent liabilities with respect to letters of guarantee granted – others 108,433 116,298
Contingent liabilities with respect to irrevocable letters of credit – import 105,190 83,816
Contingent liabilities with respect to irrevocable letters of credit – export 24,647 25,436
Contingent liabilities with respect to acceptance credits 1,847 14,273
Total non-cash loans 241,142 240,088Credit-card limits 4,677 4,449
Credit-line commitments 164,036 641,127
Total 409,855 885,664
Q. Litigation claims
Litigation is a common occurrence in the Banking industry due to the nature of the business. The Parent Company has an estab-lished protocol for dealing with such legal claims. Once professional advice has been obtained and the amount of damages reason-ably estimated, the Parent Company makes adjustments to account for any adverse effects the claims may have on its financial standing. At year-end, the Parent Company’s management is unaware of any significant actual, pending or threatened claims against the Bank.
R. Rental and lease contracts
In addition, the Parent Company entered into rental and lease contracts. The amounts can be specified as follows:
2009 2008
Operating lease commitment – bank as lessee and rent commitments
Not later than 1 year 897 1,071
Later than 1 year and not later than 5 years 438 1,084
Total 1,335 2,155

117
Oth
er inform
ationC
redit Europe Bank NV A
nnual Report 2009
Other information
S. Remuneration
Key management costs, including remuneration and fees, for the year ended December 31, 2009 amounted to EUR 2,914 (2008: EUR 2,525). The pension plan contribution amount is EUR 117 (2008: EUR 88).
Amsterdam, March 19, 2010
Supervisory Board:Maarten J. HulshoffHüsnü M. ÖzyeğinFevzi BozerMehmet GuleşciF. Onur UmutMurat Özyeğin
Managing Board:Turhan Cemal BerikerŞenol AloğluUmut BayoğluYavuz Tayfun A. Hamdi Arman

118
Au
dit
or's
rep
ort
Cre
dit E
urop
e Ba
nk N
V A
nnua
l Rep
ort 2
009
Proposed profit appropriation
Proposed profit appropriation
The profit is appropriated pursuant to Article 31 of the Articles of Association of CEB NV; the relevant stipulations are as follows:The profits shall be at the disposal of the General Meeting of Shareholders.•Dividends may be paid only up to an amount that does not exceed the distributable part of net assets.•Dividends shall be paid after adoption of the annual accounts from which it appears that payment of dividends is permissible.•
It is proposed to appropriate net profit pursuant to the Articles of Association, as follows:
Proposed profit appropriation
Net profit 49,277
Dividend 12,500
Addition to retained earnings pursuant to Article 31 of the Articles of Association 36,777

119
Au
ditor's rep
ortC
redit Europe Bank NV A
nnual Report 2009
Auditor’s report
To: the General Meeting of Shareholders of Credit Europe Bank NV
Report on the financial statementsWe have audited the accompanying financial statements 2009 of Credit Europe Bank NV, Amsterdam. The financial statements consist of the Consolidated Financial Statements and the Company Financial Statements. The Consolidated Financial Statements comprise the consolidated statement of financial position as at December 31, 2009, the consolidated statements of comprehensive income, changes in equity and cash flow for the year then ended, and the notes, comprising a summary of significant accounting policies and other explanatory information. The Company Financial Statements comprise the company balance sheet as at Decem-ber 31, 2009, the company profit and loss account for the year then ended and the notes.
Management’s responsibility Management is responsible for the preparation and fair presentation of the financial statements in accordance with International Financial Reporting Standards as adopted by the European Union and with Part 9 of Book 2 of the Netherlands Civil Code, and for the preparation of the Managing Board report in accordance with Part 9 of Book 2 of the Netherlands Civil Code. This responsibility includes: designing, implementing and maintaining internal control relevant to the preparation and fair presentation of the financial statements that are free from material misstatement, whether due to fraud or error; selecting and applying appropriate accounting policies; and making accounting estimates that are reasonable in the circumstances.
Auditor’s responsibility Our responsibility is to express an opinion on the financial statements based on our audit. We conducted our audit in accordance with Dutch law. This law requires that we comply with ethical requirements, and plan and perform the audit to obtain reasonable assurance whether the financial statements are free from material misstatement.
An audit involves performing procedures to obtain audit evidence about the amounts and disclosures in the financial statements. The procedures selected depend on the auditor’s judgment, including the assessment of the risks of material misstatement of the financial statements, whether due to fraud or error. In making those risk assessments, the auditor considers internal control relevant to the entity’s preparation and fair presentation of the financial statements in order to design audit procedures that are appropriate in the circumstances, but not for the purpose of expressing an opinion on the effectiveness of the entity’s internal control. An audit also includes evaluating the appropriateness of accounting policies used and the reasonableness of accounting estimates made by management, as well as evaluating the overall presentation of the financial statements.
We believe that the audit evidence we have obtained is sufficient and appropriate to provide a basis for our audit opinion.
Opinion with respect to the Consolidated Financial Statements In our opinion, the Consolidated Financial Statements give a true and fair view of the financial position of Credit Europe Bank NV as at December 31, 2009, and of its result and its cash flow for the year then ended in accordance with International Financial Report-ing Standards as adopted by the European Union and with Part 9 of Book 2 of the Netherlands Civil Code.
Opinion with respect to the Company Financial Statements In our opinion, the Company Financial Statements give a true and fair view of the financial position of Credit Europe Bank NV as at December 31, 2009, and of its result for the year then ended in accordance with Part 9 of Book 2 of the Netherlands Civil Code.
Report on other legal and regulatory requirements Pursuant to the legal requirement under 2:393 sub 5 part f of the Netherlands Civil Code, we report, to the extent of our competence, that the Managing Board report is consistent with the financial statements as required by 2:391 sub 4 of the Netherlands Civil Code.
Amstelveen, March 19, 2010
W.G. Bakker RAKPMG Accountants N.V.

120
Cre
dit E
urop
e Ba
nk N
V A
nnua
l Rep
ort 2
009
Ad
dre
sses
Head office
Credit Europe Bank NVKarspeldreef 6a1101 CJ AmsterdamThe Netherlandst +31 (0)20 35 76 300f +31 (0)20 35 76 301www.crediteuropebank.com www.crediteurope.nl
Branches
Credit Europe Bank NV Niederlassung DeutschlandIm Galluspark 2560326 Frankfurt am MainGermanyt +49 (0)69 256 260 0f +49 (0)69 256 260 33www.crediteurope.de
Credit Europe Bank NVBijkantoor BelgiëMechelsesteenweg 662018 AntwerpBelgiumt +32 (0)3 206 56 71 f +32 (0)3 206 56 11www.crediteurope.be
Credit Europe Bank NVMalta BranchTower Road 143/2Sliema SLM 1604Maltat +356 (0)22 60 21 00f +356 (0)22 60 21 90www.crediteurope.com.mt
Direct subsidiaries
Credit Europe Bank (Romania) SAAnchor Plaza Building, B section26Z Timisoara Blvd., 6th districtBucharestRomaniat +40 (0)21 406 40 00f +40 (0)21 317 20 66www.crediteurope.ro
Credit Europe Bank (Suisse) SA12, Rue du Mt. Blanc1211 GenevaSwitzerlandt +41 (0)22 839 19 19f +41 (0)22 839 19 00www.crediteurope.ch
CJSC Credit Europe Bank (Ukraine)2, Mechnikova Str.9th Floor ‘Parus’ Business Center01601, KievUkrainet +380 (0)44 390 67 33f +380 (0)44 390 67 17www.crediteurope.com.ua
Credit Europe Leasing LLC2, Mechnikova Str.9th Floor ‘Parus’ Business Center01601, KievUkrainet +380 (0)44 390 67 33f +380 (0)44 390 67 17www.crediteurope.com.ua
Credit Europe Bank LtdPaveletskaya Plaza,Paveletskaya Square 2/2 Moscow 115054Russiat +7 (0)495 725 40 40f +7 (0)495 725 40 41www.crediteurope.ru
Credit Europe Leasing LLCLeningradskiy Prospect 74A Moscow 125315 Russiat +7 (0)495 725 5656f +7 (0)495 725 5444www.crediteuropeleasing.ru
Credit Europe Bank (Dubai) LtdCurrency House Office Building 1Level 7, Unit 7Al Fattan Area, DIFCDubaiUnited Arab Emiratest + 971 4438 7100f + 971 4438 7175
Representative offices
Credit Europe Bank NVIstanbul Temsilcilik OfisiEski Büyükdere Caddesi No: 22Park Plaza Kat 10Maslak 34398 IstanbulTurkeyt +90(0)212 366 01 01f +90(0)212 366 01 05
Credit Europe Bank NVUnit 2812, Plaza 66,1266 Nanjing West RoadShanghai 200040, Chinat +86 (0)21 61 36 18 18f +86 (0)21 62 88 53 65
Addresses

Annual R
eport 200
9
Founded in 1994, Credit Europe
Bank NV has grown towards a solid,
international financial services group,
ranked in the top 10 of Dutch banks
with a total balance sheet of around
€10 billion. With 200 branches and
more than 5,000 employees working
in 11 countries, we serve around three
million customers worldwide. The Bank’s
mission is to offer tailor-made corporate
banking services and easy-to-use and
efficiently delivered retail products.
Annual R
eport 200
9Credit Europe Bank N
V